Siltronic AG Q3/2017 Results · Siltronic AG does not undertake and does not intent to undertake...
19
© Siltronic AG 2017 Siltronic AG Q3/2017 Results October 26, 2017
Transcript of Siltronic AG Q3/2017 Results · Siltronic AG does not undertake and does not intent to undertake...

© Siltronic AG 2017
Siltronic AG
Q3/2017 Results
October 26, 2017

© Siltronic AG 2017
MARKET OVERVIEW &
CAPEX STRATEGY
……Capabilities, automation
and incremental invest to
keep stable market share
without providing excess
capacity to the market …..

Siltronic AG – Q3/2017 Results
October 26, 2017 3 of 19 Company Confidential
Highlights Q3/2017: Financials
Net Financial Assets EUR 294.8m (December 31, 2016: EUR 175.0m)
Margin EBITDA margin of 34.6% (Q2/2017: 25.7%)
EBIT & ROCE EUR 77.8m (Q2/2017: EUR 43.4m)
ROCE 43.4% (Q2/2017: 24.0%)
CapEx EUR 16.9m (Q2/2017: EUR 25.5m)
Free Cash Flow EUR 58.2m (Q2/2017: EUR 41.8m)
Sales Sales of EUR 308.1m (Q2/2017: EUR 283.1m)
EBITDA EUR 106.5m (Q2/2017: EUR 72.7m)

Siltronic AG – Q3/2017 Results
October 26, 2017 4 of 19 Company Confidential
Semiconductors
Semiconductor market continued its strong growth in August
Units grew +14.8% y-o-y (3MMA)
Silicon wafer demand
Silicon shipment volumes forecast to be 11,448 million square inches in 2017, 8.2% up y-o-y
Price increases
Price increases for 300 mm wafers continued
Substantial price increase for 200 mm wafers reached
Siltronic negotiated additional price increases for Q4
Competition
Wafer suppliers continue to report strong demand for all diameters, with fully utilized 200 mm and 300
mm lines
Market highlights
Source: WSTS up to August 2017, SEMI press release October 16, 2017

Siltronic AG – Q3/2017 Results
October 26, 2017 5 of 19 Company Confidential
2017/18 only debottlenecking / OEE improvement possible
Decision taken to add ~70kWfr/month by mid-2019: around 15-18 months lead-time
Capacity extension supported by LTAs & customer prepayments
Keep 300mm market share of ~ 15%
Invest of EUR ~2m need per 1kWfr/month
Capable cleanroom space and facilities available
Siltronic will continuously invest to support the market growth and to keep stable market share and to
ensure long term prices stay on reinvest level
Siltronic will incrementally add 70kWfr/month by mid-2019

© Siltronic AG 2017
FINANCIALS Q3/2017
…price increases
accelerate continuous
improvement …….

Siltronic AG – Q3/2017 Results
October 26, 2017 7 of 19 Company Confidential
237.0 246.3
258.0
283.1
308.1
Q3 2016 Q4 2016 Q1 2017 Q2 2017 Q3 2017
Q3 sales development driven by increased prices
Sales, in EUR million +8.8%
Comments
Positive
Slight volume growth q-o-q,
especially in smaller
diameters
Higher wafer prices for
300mm and 200mm in Q3
ASP up y-o-y and q-o-q
Further price increases
negotiated for Q4
Negative
Some headwind from USD
q-on-q

Siltronic AG – Q3/2017 Results
October 26, 2017 8 of 19 Company Confidential
36.9 50.5 53.0
72.7
106.5
15.6
20.5 20.5
25.7
34.6
Q3 2016 Q4 2016 Q1 2017 Q2 2017 Q3 2017
EBITDA margin in %; EBITDA in EUR million Comments
Positive
Higher ASP y-o-y and
q-o-q
Successful cost reduction
program continued – cost
of sales per wafer area
decreased
Positive development of EBITDA and EBITDA margin mainly due
to higher ASP

Siltronic AG – Q3/2017 Results
October 26, 2017 9 of 19 Company Confidential
41.2 35.2
75.8
66.0
-6.0
-9.8
Result before income tax Income tax Result for the period
Positive development of net result due to price increases
Q2/2017 Q3/2017
Result and income tax, in EUR million
Comments
Net profit of EUR 66.0m in
Q3/2017
Price increases and lower
cost of sales per wafer area
had positive effects
EUR 9.8m effective taxes
Potential future tax
advantages based on tax
losses carried forward not
capitalized (accounting
policies)
Siltronic AG – Q3/2017 Results
October 26, 2017 10 of 19 Company Confidential
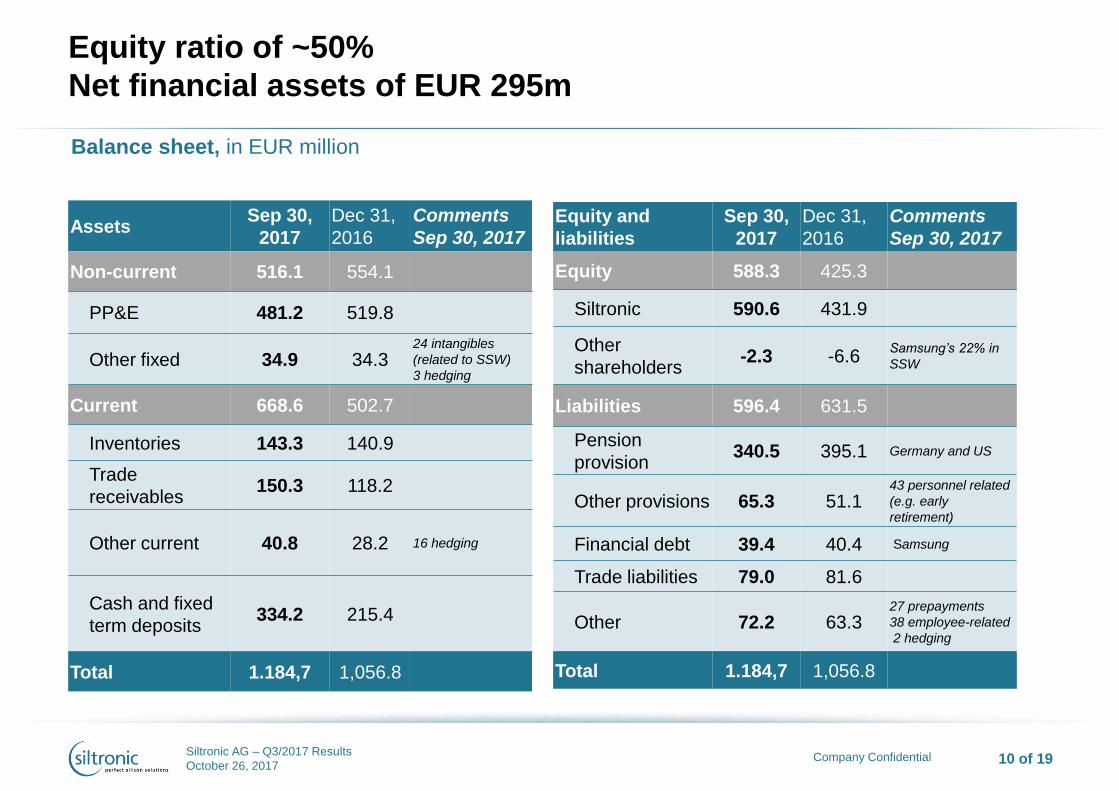
Equity ratio of ~50%
Net financial assets of EUR 295m
Assets Sep 30,
2017
Dec 31,
2016
Comments
Sep 30, 2017
Non-current 516.1 554.1
PP&E 481.2 519.8
Other fixed 34.9 34.3 24 intangibles
(related to SSW)
3 hedging
Current 668.6 502.7
Inventories 143.3 140.9
Trade
receivables 150.3 118.2
Other current 40.8 28.2
16 hedging
Cash and fixed
term deposits 334.2 215.4
Total 1.184,7 1,056.8
Equity and
liabilities
Sep 30,
2017
Dec 31,
2016
Comments
Sep 30, 2017
Equity 588.3 425.3
Siltronic 590.6 431.9
Other
shareholders -2.3 -6.6
Samsung’s 22% in
SSW
Liabilities 596.4 631.5
Pension
provision 340.5 395.1 Germany and US
Other provisions 65.3 51.1 43 personnel related
(e.g. early
retirement)
Financial debt 39.4 40.4 Samsung
Trade liabilities 79.0 81.6
Other 72.2 63.3 27 prepayments
38 employee-related
2 hedging
Total 1.184,7 1,056.8
Balance sheet, in EUR million
Siltronic AG – Q3/2017 Results
October 26, 2017 11 of 19 Company Confidential
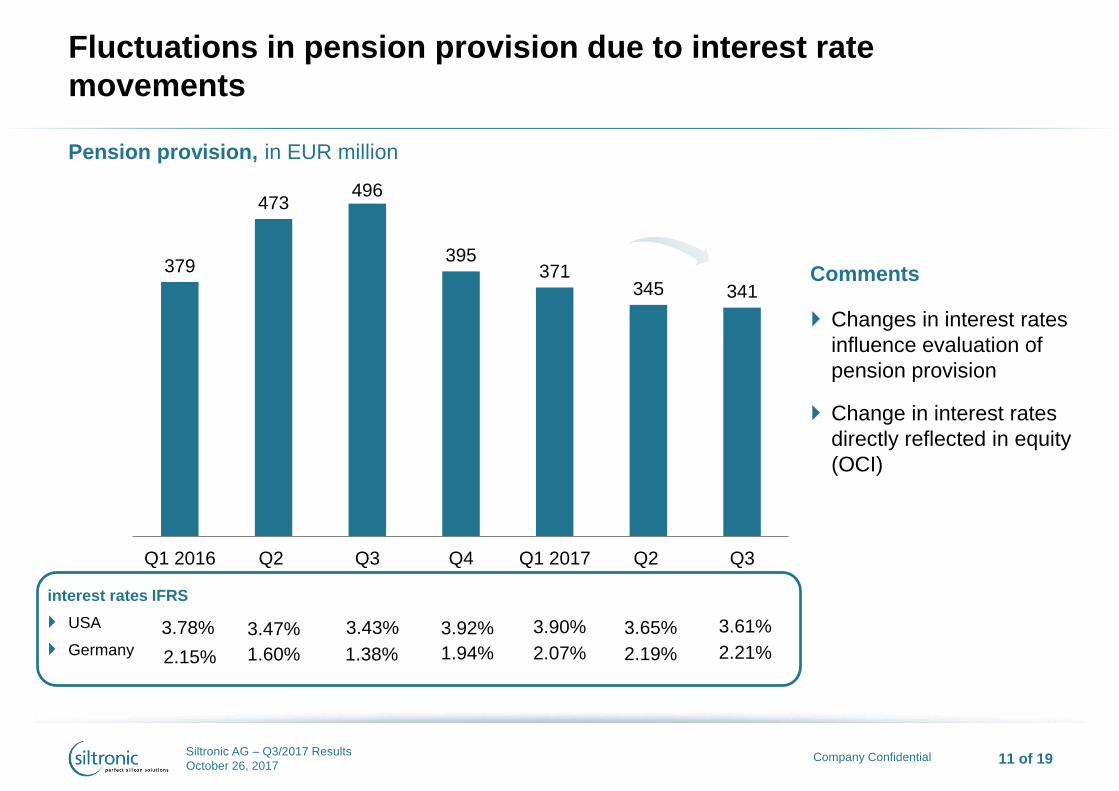
379
473 496
395 371
345 341
Q1 2016 Q2 Q3 Q4 Q1 2017 Q2 Q3
Fluctuations in pension provision due to interest rate
movements
interest rates IFRS
USA
Germany
Pension provision, in EUR million
Comments
Changes in interest rates
influence evaluation of
pension provision
Change in interest rates
directly reflected in equity
(OCI)
3.78%
2.15%
3.47%
1.60%
3.43%
1.38%
3.92%
1.94% 2.07%
3.90%
2.19%
3.65%
2.21%
3.61%
Siltronic AG – Q3/2017 Results
October 26, 2017 12 of 19 Company Confidential
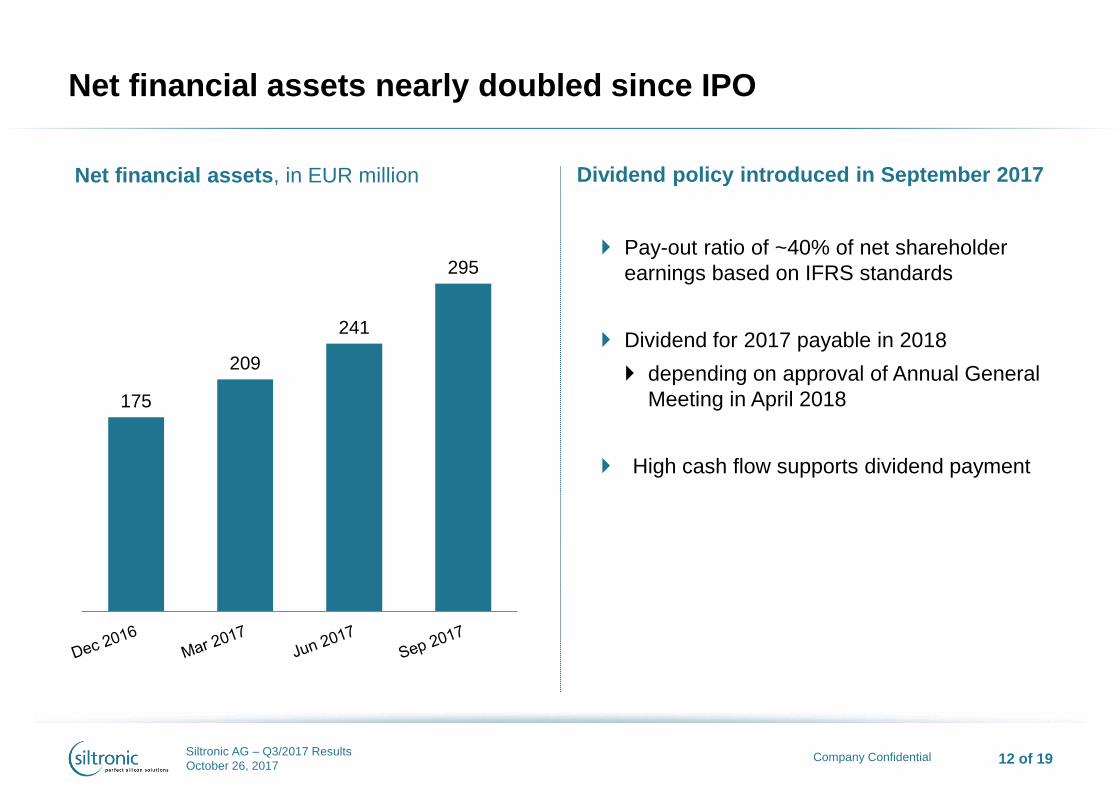
175
209
241
295
Net financial assets nearly doubled since IPO
Dividend policy introduced in September 2017
Pay-out ratio of ~40% of net shareholder
earnings based on IFRS standards
Dividend for 2017 payable in 2018
depending on approval of Annual General
Meeting in April 2018
High cash flow supports dividend payment
Net financial assets, in EUR million

Siltronic AG – Q3/2017 Results
October 26, 2017 13 of 19 Company Confidential
54
~100 ~80
~20
~120
Ø 2014-2016 2017e 2018e
Base Capex Capex for brownfield extentions
~120
Capex will rise to EUR ~200m in 2018
Comments
Capex of EUR ~140m for 70k wafers/month
over 2 years
Exchange of ingot pullers (capability
improvement) in Freiberg to be completed in
2017
First preparations already needed in 2017 to
incrementally increase capacities in following
years
Capex base level to sustain business:
MOB (maintenance of business)
Capabilities
Cost reductions
Automation
Investment, in EUR million
~200
Siltronic AG – Q3/2017 Results
October 26, 2017 14 of 19 Company Confidential
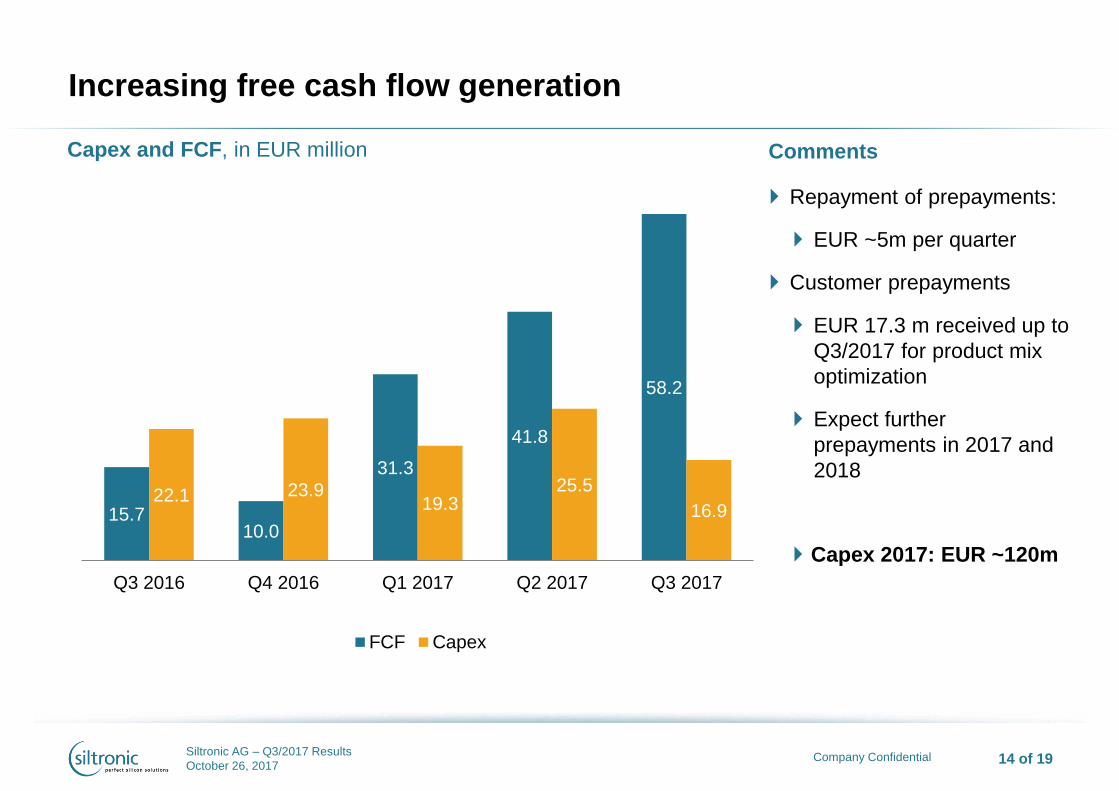
15.7 10.0
31.3
41.8
58.2
22.1 23.9 19.3
25.5
16.9
Q3 2016 Q4 2016 Q1 2017 Q2 2017 Q3 2017
FCF Capex
Capex and FCF, in EUR million Comments
Repayment of prepayments:
EUR ~5m per quarter
Customer prepayments
EUR 17.3 m received up to
Q3/2017 for product mix
optimization
Expect further
prepayments in 2017 and
2018
Capex 2017: EUR ~120m
Increasing free cash flow generation

© Siltronic AG 2017
OUTLOOK
……a positive outlook in
Q4/2017 and beyond…..
Siltronic AG – Q3/2017 Results
October 26, 2017 16 of 19 Company Confidential
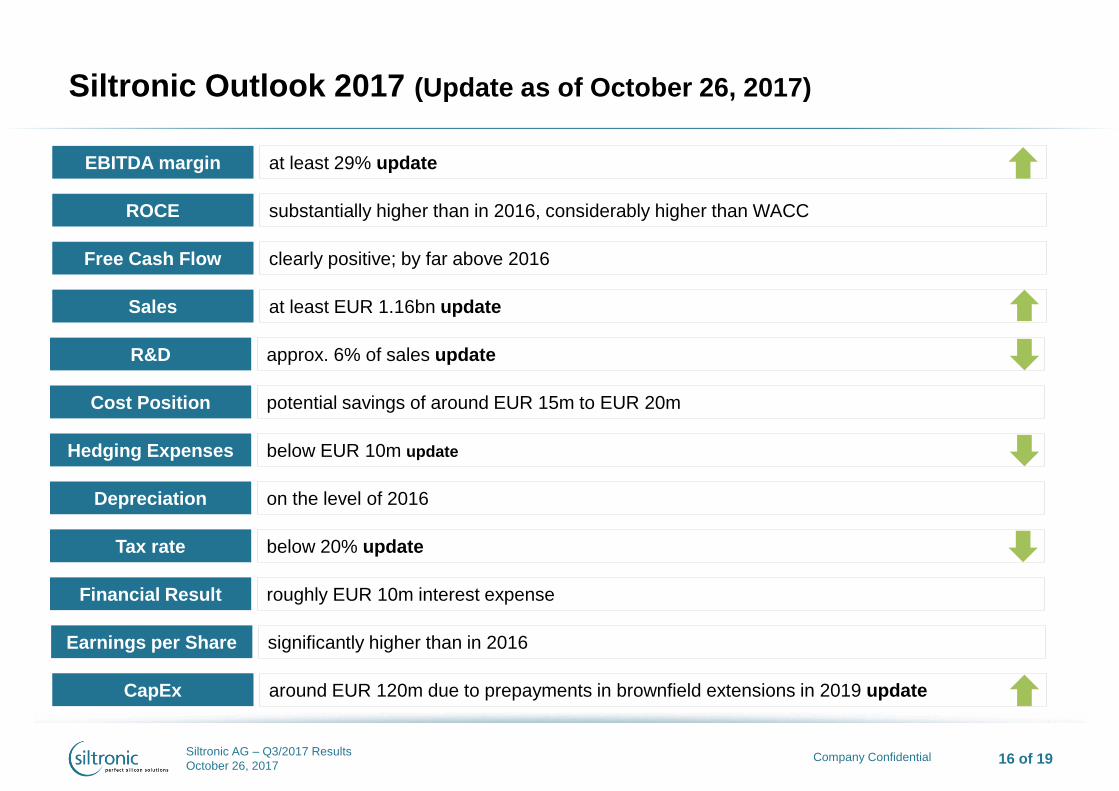
Siltronic Outlook 2017 (Update as of October 26, 2017)
Depreciation on the level of 2016
Free Cash Flow clearly positive; by far above 2016
Sales at least EUR 1.16bn update
R&D approx. 6% of sales update
Cost Position potential savings of around EUR 15m to EUR 20m
Hedging Expenses below EUR 10m update
EBITDA margin at least 29% update
ROCE substantially higher than in 2016, considerably higher than WACC
Tax rate below 20% update
Financial Result roughly EUR 10m interest expense
Earnings per Share significantly higher than in 2016
CapEx around EUR 120m due to prepayments in brownfield extensions in 2019 update
Siltronic AG – Q3/2017 Results
October 26, 2017 17 of 19 Company Confidential
Contact and Additional Information
Issuer and Contact
Siltronic AG
Hanns-Seidel-Platz 4
D-81737 München
Investor Relations:
Petra Mueller
email: [email protected]
Tel. +49 89 8564-3133
Additional Information
ISIN: DE000WAF3001
WKN: WAF300
Deutsche Börse: WAF
Listing: Frankfurt Stock Exchange
Prime Standard
Financial Calendar
Full Year 2017 Results March 5, 2018
Annual General Meeting April 19, 2018
Q1 2018 Results April 25, 2018
Q2 2018 Results July 25, 2018
Q3 2018 Results October 25, 2018

Siltronic AG – Q3/2017 Results
October 26, 2017 18 of 19 Company Confidential
Disclaimer
The information contained in this presentation is for background purposes only and is subject to
amendment, revision and updating. Certain statements contained in this presentation may be
statements of future expectations, future financial performance and other forward-looking statements
that are based on management's current views and assumptions and involve known and unknown risks
and uncertainties. In addition to statements which are forward-looking by reason of context, including
without limitation, statements referring to risk limitations, operational profitability, financial strength,
performance targets, profitable growth opportunities and risk adequate pricing, words such as "may”,
“will”, “should”, “expects”, “plans”, “intends”, “anticipates”, “believes”, “estimates”, “predicts”, “continue”,
“projects” or “seeks”, “potential”, “future”, or “further” and similar expressions may identify forward-
looking statements. By their nature, forward-looking statements involve a number of risks, uncertainties
and assumptions which could cause actual results or events to differ materially from those expressed or
implied by the forward-looking statements. These include, among other factors, changing business or
other market conditions, currency and interest fluctuations, introduction of competitive products, poor
acceptance of new products and services, change of the corporate strategy and the prospects for
growth anticipated by the management. These and other factors could adversely affect the outcome and
financial effects of the plans and events described herein. Statements contained in this presentation
regarding past trends or activities should not be taken as a representation that such trends or activities
will continue in the future. Siltronic AG does not undertake and does not intent to undertake any
obligation to update or revise any statements contained in this presentation, whether as a result of new
information, future events or otherwise. In particular, you should not place any reliance on forward-
looking statements which speak only as of the date of this presentation.

© Siltronic AG 2017
SILTRONIC AG | Hanns-Seidel-Platz 4
81737 Munich
Germany