Siloxanes in freshwater food webs a study of three lakes ... · Resultatene er sammenliknet med en...
70
Siloxanes in freshwater food webs - a study of three lakes in Norway. Norwegian screening program RAPPORT M-81/2013
-
Upload
nguyennhan -
Category
Documents
-
view
235 -
download
1
Transcript of Siloxanes in freshwater food webs a study of three lakes ... · Resultatene er sammenliknet med en...

Siloxanes in freshwater food webs - a study of three lakes in Norway. Norwegian screening program
RAPPORT
M-81/2013

1

Siloxanes in freshwater food webs – a study of three lakes in Norway | M-81/2013
1
Forord På oppdrag av Klima og forurensningsdirektoratet (Klif) har Norsk institutt for vannforskning
(NIVA) og Department of Applied Environmental Science, Stockholm Universitet (ITM) i 2012
undersøkt forekomst av flyktige sykliske metylerte siloksaner (cyclic volatile methyl siloxanes
cVMS) i tre norske innsjøer (Mjøsa, Randsfjorden, Femunden). Biomagnifisering av sykliske
siloksaner i det pelagiske næringsnettet med ørret som predator ble beregnet og
sammenliknet med velkjente miljøgifter som PCB og DDE, og kilder av sykliske siloksaner til
innsjøene ble vurdert.
Resultatene er sammenliknet med en tidligere studie om siloksaner i Mjøsa, samt data fra
andre forskningsprosjekter og rapporter der dette var relevant. Dette inkluderer resultater
fra NIVAs Strategiske Institutt Satsning for 2012, der bromerte flammehemmere (PBDE) ble
analysert i alle prøvene fra Mjøsa.
Feltarbeidet og prøvetakning av invertebrater, fisk, sedimenter, og vann fra 2012 har vært
gjort av personell fra NIVA (Jarl Eivind Løvik, Sigurd Rognerud, Eirik Fjeld, Katrine Borgå),
samt feltassistent Eilif Fjeld, og lokale fiskere. Personell fra de ulike renseanleggene var
behjelpelige med å prøveta renset avløpsvann.
Ved ITM har Michael McLachlan og Amelie Kierkegaard vært ansvarlig for de kjemiske
analysene. Ulrika Nordlöf har hjulpet til med utvikling av metoden for siloksananalyse, og
Dimitrios Panagopoulos har assistert ved siloksananalysene av prøvematerialet.
Ved NIVA har Andreas Sven Høgfeldt og Kine Bæk vært ansvarlige for de kjemiske analysene.
Hovedansvarlig for rapporteringen av prosjektet har vært Katrine Borgå. Rapporten er
utformet som et manuskript for internasjonal publisering som vil bli publisert parallelt med
rapporten. Erik Fjeld har tatt forsidebildet.
For oppdragsgiver har ansvarlig saksbehandler vært senioringeniør Bård Nordbø.
En stor takk rettes til alle medarbeidere og involverte for et godt samarbeid.
Oslo, 21. november 2013
Katrine Borgå

Siloxanes in freshwater food webs – a study of three lakes in Norway | M-81/2013
2
Innhold
Forord ............................................................................................................ 1
Innhold ........................................................................................................... 2
1. Extended abstract .......................................................................................... 3
2. Sammendrag ................................................................................................. 5
3. Introduction ................................................................................................. 7
4. Materials and methods ................................................................................... 10
4.1 Selected lakes and sampling description ....................................................... 10
4.2 Chemical analysis of cVMS ........................................................................ 12
4.3 Chemical analysis of halogenated POPs ........................................................ 12
4.4 Analysis of trophic descriptors ................................................................... 13
4.5 Data treatment ..................................................................................... 13
5. Results and Discussion ................................................................................... 15
5.1 cVMS QA/QC results ................................................................................ 15
5.1.1 Control samples and repeatability of analysis......................................... 15
5.1.2 Limit of Quantification and comparison to blank ..................................... 15
5.2 General trends in cVMS concentrations 2012 .................................................. 21
5.3 Sources of cVMS..................................................................................... 22
5.4 Dietary relationships ............................................................................... 23
5.5 Food web biomagnification of cVMS ............................................................ 27
6. Conclusions ................................................................................................ 31
7. References ................................................................................................. 32
8. Supporting information .................................................................................. 35

Siloxanes in freshwater food webs – a study of three lakes in Norway | M-81/2013
3
1. Extended abstract
Title: Siloxanes in freshwater food webs – a study of three lakes in Norway
Year: 2013
Authors: Katrine Borgå (NIVA), Eirik Fjeld (NIVA), Amelie Kierkegaard (ITM), Jarl Eivind Løvik
(NIVA), Sigurd Rognerud (NIVA), Andreas S. Høgfeldt (NIVA), Kine Bæk (NIVA), Michael S.
McLachlan (ITM)
Source: Miljødirektoratetrapport M-81/2013
ISBN NO: 978-82-577-6255-1 As part of Climate and Pollution Agency’s (Klif) screening of emerging contaminants NIVA collected various members of the pelagic food web in the three Norwegian lakes Mjøsa, Randsfjorden and Femunden, from July to September 2012. The aim was to assess sources of cyclic volatile methyl siloxanes (cVMS) to these lakes, their contamination level and biomagnification in the food web leading to brown trout as top predator. In addition to fish and invertebrates from the pelagic zone, benthic fish were collected in Mjøsa, effluent water from waste water treatment plants (WWTP) from Randsfjorden and Mjøsa, water samples from Mjøsa, and surface sediments from all three lakes. The material was analysed for the three cVMS octamethylcyclotetrasiloxane (D4), decamethylcyclopentasiloxane (D5), and dodecamethylcyclohexasiloxane (D6) by the Department of Applied Environmental Science, Stockholm Universitet (ITM). In addition, lipid or organic carbon content in biota or sediments, respectively, and chlorinated organic contaminants (PCBs and DDT) in Mjøsa and Randsfjorden, and brominated flameretardants (PBDE) in Mjøsa, were analysed by the Norwegian Institute for Water Research (NIVA), to enable comparison of the food web biomagnification across chemicals. Dietary descriptors (stabile nitrogen (δ15N) and carbon (δ13C) isotopes) were analysed at the Institute for Energy Technology (IFE) for evaluation of relative trophic position in the food web and carbon source. The previously reported high D5 levels and food web biomagnification in Mjøsa from 2010 were confirmed by the 2012 samples. The lakes that receive discharge from WWTPs had higher cVMS concentrations in both animals and sediments compared to the remote reference lake, Femunden, a lake with minor human impact in which most cVMS levels were below the limit of quantification in the analysed samples. cVMS were found in grab samples of effluent water from WWTPs, while D5 and D6 were quantified in surface sediments from Mjøsa and Randsfjorden. D4 was below the limit of quantification (LOQ) in all sediment samples, and D6 was below the LOQ in some sediment samples. Surface sediments of Randsfjorden and Mjøsa show high spatial variation in cVMS concentrations, with highest concentrations near Brandbu and Gjøvik, respectively. Due to the large difference in cVMS levels between the lakes, the presence of cVMS in effluent water, and the large spatial variation within the lakes with waste water treatment plants, local sources are the likely major input to the lakes, rather than long range transport. Whereas D5 and D6 concentrations within the pelagic food web were significantly correlated with biomagnifying legacy contaminants (e.g. PCB-153, p,p’-DDE), D4 did not correlate with either D5 or D6 nor with PCB-153 or p,p’-DDE. Benthic feeding fish (perch, whitefish, burbot) had lower cVMS concentrations than pelagic fish at comparable trophic levels.
D5 and D6 biomagnified in the pelagic food web of Mjøsa and Randsfjorden with trophic
magnification factors (TMF) for D5 of 2.9 (95% Confidence Interval (CI): 2.1-4.0) and D6 TMF
2.3 (CI: 1.8-3.0). D4 was below the LOQ in the majority of samples, and had substantially
lower biomagnification than for D5 and D6. The cVMS TMFs did not differ between the lakes,
whereas the legacy POP TMFs were higher in Mjøsa than Randsfjorden. Whitefish had lower
cVMS bioaccumulation compared to legacy POPs, and affected the TMF significance for cVMS,

Siloxanes in freshwater food webs – a study of three lakes in Norway | M-81/2013
4
but not for POPs. TMFs of D5 and legacy contaminants in Lake Mjøsa were consistent with
those previously measured in Mjøsa. The present study has documented the potential of D5 and D6 to biomagnify in pelagic food webs, whereas D4 seems to be subject to trophic dilution.

Siloxanes in freshwater food webs – a study of three lakes in Norway | M-81/2013
5
2. Sammendrag
Tittel: Siloksaner i ferskvanns næringsnett – et studium av tre innsjøer i Norge
År: 2013
Bidragsytere: Katrine Borgå (NIVA), Eirik Fjeld (NIVA), Amelie Kierkegaard (ITM), Jarl Eivind
Løvik (NIVA), Sigurd Rognerud (NIVA), Andreas S. Høgfeldt (NIVA), Kine Bæk (NIVA), Michael S.
McLachlan (ITM)
Kilde: Miljødirektoratetrapport M-81/2013
ISBN NO: 978-82-577-6255-1 Som et ledd i Klifs screening av nye miljøgifter, har NIVA sommeren og høsten 2012 samlet inn prøvemateriale av det pelagiske næringsnettet i Mjøsa, Randsfjorden og Femunden. Formålet var å vurdere kilder av volatile (flyktige) sykliske metyl siloksaner (cVMS) i disse innsjøene, deres nivåer og biomagnifisering i næringsnettet med ørret som topp-predator. I tillegg til fisk og dyreplankton fra de frie vannmassene, ble det samlet inn bunnfisk fra Mjøsa, renset avløpsvann fra renseanlegg ved Mjøsa og Randsfjorden, vannprøver fra Mjøsa, samt overflatesediment fra alle tre innsjøer. Materialet ble analysert for de tre sykliske siloksanene oktametylsyklotetrasiloksan (D4), dekametylsyklopentasiloksan (D5), og dodekametylsykloheksasiloksan (D6) av Department of Applied Environmental Science, Stockholms Universitet (ITM). Innhold av lipider i biota og organisk karbon i sedimenter, og konsentrasjoner av klorerte organiske miljøgifter (PCB og DDT) i prøver fra Mjøsa og Randsfjorden, samt bromerte flammehemmere (PBDE) i Mjøsa, ble analysert av NIVA for å kunne sammenlikne biomagnifisering i næringsnettet mellom kjemikalier. Stabile nitrogen (δ15N) og karbon (δ13C) isotoper ble analysert av Institutt for Energiteknikk (IFE) for bestemmelse av karbonkilde og plassering i næringsnettet. Dette studiet fra 2012 bekreftet de høye D5 nivåene og biomagnifisering i næringsnettet funnet i Mjøsa i 2010. Innsjøene som mottar avløpsvann fra renseanlegg hadde høyere cVMS nivå i både dyr og sedimenter sammenliknet med referanseinnsjøen, Femunden, som har lav menneskelig påvirkning og hvor de fleste cVMS var under kvantifikasjonsgrensen i de analyserte prøvene. cVMS ble funnet i stikkprøver av renset avløpsvann fra renseanlegg, og D5 og D6 ble funnet i overflatesediment fra Mjøsa og Randsfjorden. D4 var under kvantifikasjonsgrensen i alle sedimentprøvene, og D6 var under i noen sedimentprøver. D5 og D6 konsentrasjoner i overflatesediment fra Randsfjorden og Mjøsa viste høy geografisk variasjon, med høyeste konsentrasjoner i nærheten av henholdsvis Brandbu og Gjøvik. Gitt den store forskjellen i cVMS mellom innsjøer med og uten menneskelig påvirkning, forekomsten av cVMS i renset avløpsvann, og den store geografiske variasjonen cVMS nivåer innen innsjøer med renseanlegg, antas lokale kilder å være hovedopphav til cVMS i innsjøene, og ikke langtransporterte prosesser. Mens D5 og D6 nivåene i det pelagiske næringsnettet korrelerte signifikant med kjente biomagnifiserende miljøgifter (f.eks. PCB-153, p,p’-DDE), korrelerte D4 hverken med D5, D6, PCB-153, eller p,p’-DDE. Bunnfisk (abbor, sik og lake) hadde lavere cVMS konsentrasjoner enn pelagisk fisk på tilsvarende trofiske plassering i næringsnettet. D5 og D6 biomagnifiserte i det pelagiske næringsnettet i Mjøsa og Randsfjorden med trofisk magnifikasjonsfaktor (TMF) for D5 på 2,9 (95 % konfidenseintervall KI: 2,1-4,0), og D6 TMF på 2,3 (KI: 1,8-3,0). D4 hadde flertallet av prøvene under kvantifikasjonsgrensen i både Mjøsa og Randsfjorden, og hadde lavere biomagnifisering enn D5 og D6. Trofisk magnifikasjonsfaktor for cVMS var lik mellom innsjøene, mens den for klorerte organiske miljøgifter var høyere i Mjøsa enn i Randsfjorden. Sik hadde lavere bioakkumulering av cVMS sammenliknet med klorerte og brommerte organiske miljøgifter. Dette innvirket på signifikansen av TMF for cVMS, men ikke for persistente organiske miljøgifter. TMF for D5 og POPs I Mjøsa var konsistente med de som tidligere er dokumentert fra Mjøsa.

Siloxanes in freshwater food webs – a study of three lakes in Norway | M-81/2013
6
Screeningen av siloksaner i norske innsjøer i 2012 har dokumentert at D5 og D6 kan biomagnifisere i pelagiske næringsnett, mens D4 antagelig er utsatt for trofisk fortynning.
Siloxanes in freshwater food webs – a study of three lakes in Norway | M-81/2013
7
3. Introduction
Cyclic volatile methylsiloxanes (cVMS) have been identified as emerging contaminants of
concern due to their predicted persistence and bioaccumulative characteristics1. Siloxanes
are produced in high volumes, and have several uses such as in personal care and biomedical
products, consumer products such as car polish and waxes, and as additives in fuel2. The
three cVMS octamethylcyclotetrasiloxane (D4 CAS no. 556-67-2),
decamethylcyclopentasiloxane (D5 CAS no. 541-02-6), and dodecamethylcyclohexasiloxane
(D6 CAS no. 540-97-6) (Figure 1) have been found to accumulate in biota3-5 , but to a varying
degree dependent on chemical, organism, and with large variation between studies. Based on
the REACH criteria, D4, D5 and D6 are classified as very bioaccumulative (vB)6-8. Recent
development and improvement of analytical quantification methods has resulted in increasing
measurement in environmental matrices, including biota9,10. Thus, whereas previous
assessment of cVMS behavior in the environment was based on model predictions1,11 and
laboratory tests6,7, recent studies allow an interpretation of the persistence and
bioaccumulation from environmental samples3,12.
Figure 1. Molecular structure of D4, D5, and D6, the cyclic volatile methylsiloxanes
included in the present study.
The bioaccumulation of chemicals in an organism from, and relative to, the diet is currently
assessed by biomagnification factors (BMF) or trophic magnification factors (TMF)13,14.
Whereas the BMF considers specific predator-prey relationships, the TMF is an estimation of
the average change in contaminant concentrations, normalized for fugacity capacity,when
moving one trophic level up the food web15. For contaminants with high octanol-water
partitioning coefficient (KOW), such as cVMS (log Kow 6.98 for D4, 8.07 for D5, and 8.87 for
D616), lipid normalization reflect the fugacity capacity normalized concentrations. TMF was
suggested as the most conclusive measure of bioaccumulation of chemicals in biota that have
a multitude of food choices and thus exposures to contaminants13. TMF is currently estimated
from empirical data15, but there is still need for improvement of the scientific understanding
of TMF, how to best estimate and interpret it 15,17 18. The European Community Regulation
on chemicals and their safe use (REACH) recently added BMF and TMF to Annex XIII as metrics
that can be used in a weight of evidence assessment of bioaccumulation19.
There are presently few studies of empirical food web magnification (TMF) of cVMS. There is
currently only one study published in the peer review literature20. This study reported D5 TMF
greater than 1 in the pelagic food web of Lake Mjøsa, Norway, indicating food web
biomagnification20. This is in line with previous studies of D5 biomagnification3, but in
contrast with the silicon producing industry’s own reports on other food webs and
ecosystems, which report TMFs less than 1 for all cVMS21,22. The Lake Mjøsa study reported
Siloxanes in freshwater food webs – a study of three lakes in Norway | M-81/2013
8
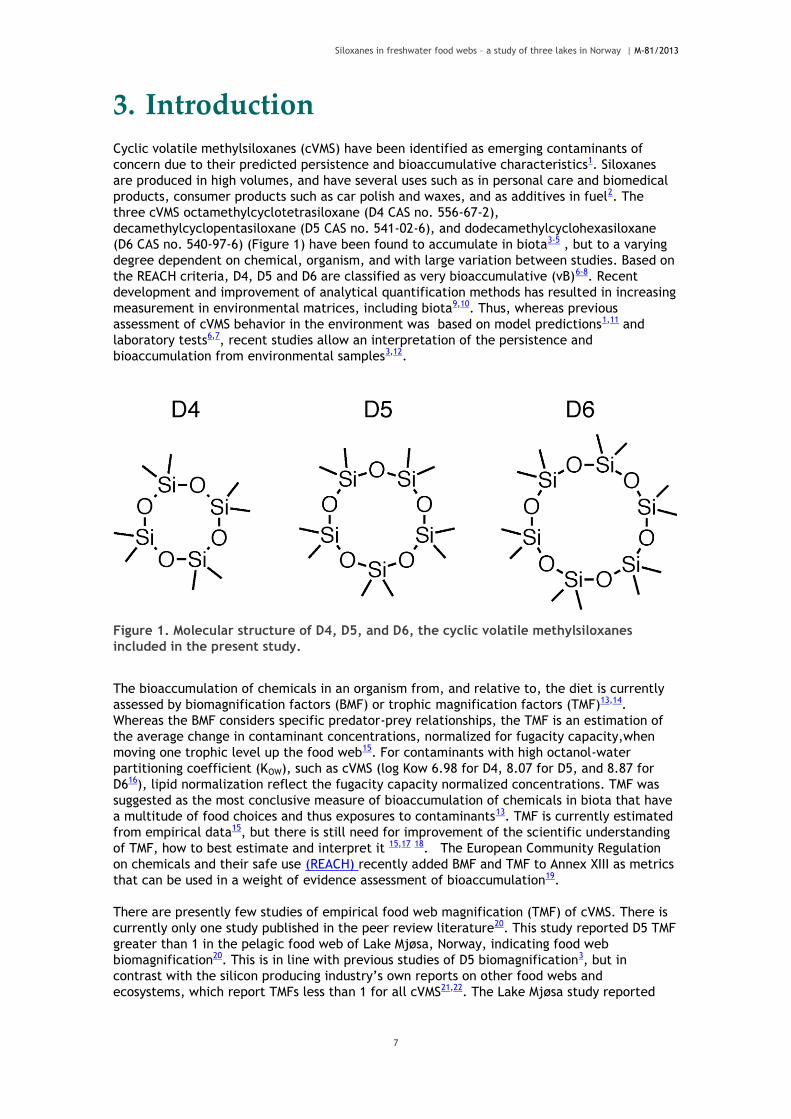
surprisingly high cVMS levels20, with concentrations comparable to levels reported from the
inner Oslofjord of Norway2,23, a highly populated area close to the capital of Norway. A study
from Swedish lakes suggest that the sediment and fish contamination of cVMS is correlated to
the wastewater treatment plant (WWTP) effluent load in the respective lakes24. The inner
Oslofjord is the recipient for WWTP effluent from approximately 10 times greater person
equivalents than Lake Mjøsa. As the Mjøsa study20 is presently the sole study reporting
significant food web biomagnification of cVMS, and because it reports surprisingly high cVMS
concentrations relative to the WWTP effluent load, a closer investigation is needed to assess
if this result is representative or atypical for Norwegian lake ecosystems with food webs
leading to brown trout (Salmo trutta) as a top predator.
The present study repeated the study of the pelagic food web in Lake Mjøsa from 2010, in
addition to including a comparable lake in the vicinity (Lake Randsfjorden) and a reference
remote lake (Lake Femunden) far from any known sources of contaminants (Table 1. Figure
2). The aims of the present study were to increase our understanding of the food web
biomagnification of cVMS, to obtain information on the potential sources of cVMS to the
investigated lakes, and to identify differences in cVMS levels, biomagnification and sources
between lakes. In addition to samples from the pelagic food web, samples of benthic fish,
WWTP effluent, surface sediment and lake water were collected. The food web
bioaccumulation behavior of cVMS was compared to that of the legacy persistent organic
pollutants (POPs) dichlorodiphenyldichloroethylene (p,p’-DDE), polychlorinated biphenyls
(PCB) and polybrominated diphenyl ethers (PBDE).

Siloxanes in freshwater food webs – a study of three lakes in Norway | M-81/2013
9
Figure 2. Map of a) Lake Mjøsa, b) Lake Randsfjorden, and c) Lake Femunden with
sampling sites, major urban areas and waste water treatment plants (WWTP).

Siloxanes in freshwater food webs – a study of three lakes in Norway | M-81/2013
10
4. Materials and methods
4.1 Selected lakes and sampling description
The samples were collected in Lake Mjøsa, Lake Randsfjorden, and Lake Femunden during
July-September 2012 (Figure 2, Table S 1). Based on person equivalents (Table 1), Mjøsa is
subject to high to moderate human impact, Randfjorden to moderate human impact, whereas
Femunden is remote from human activity. All three study lakes are deep and contain well-
defined pelagic food webs including zooplankton, planktivorous fish and brown trout as top
predator. The main food web difference between the lakes is that Lake Mjøsa includes Mysis
relicta in the invertebrate community, vendace among the planktivorous fish, and exclcudes
Arctic char as top predator. Whitefish is assumed to replace vendace in the pelgaic food web
of Randsfjorden and Femunden, whereas it is benthic feeding in Mjøsa.
Table 1. Information on lakes included in the study
Lake Mjøsa Randsfjorden Femunden
Position 60°53′N 10°41E 60°23′N 10°23′E 62°21′N 11°57′E
Length (km) 117 75 60
Volume (km3) 65 7,3 6
Area (km2) 362 134 203
Maximum depth (m) 453 120 153
Person equivalentsa 206000 28500 200
a. Estimated from maps with discharge and wastewater treatment plants for the
different regions
Representatives of the food webs of the respective lakes were collected according to protocols as described in Borgå et al.201220. Sediment, effluent water from WWTPs, water and benthic fish (whitefish Coregonus lavaretus, perch Perca fluviatilis, burbot Lota lota) samples were collected as described in brief below.
In Mjøsa, zooplankton from the epilimnion (Cladocerans Daphnia galeata, Bosmina longispina) and hypolimnion (Copepods Limnocalanus macrurus), Mysis relicta, vendace, and smelt (Osmerus eperlanus) were collected mid-lake south of Helgøya, and trout close to Gjøvik. Although the trout in Mjøsa were sampled close to the Gjøvik area (Figure 2), the trout represent a larger geographic area as it uses the entire of Mjøsa in its search for food25. In Randsfjorden zooplankton from the epilimnion (D. galeata, Copepods Eudiaptomus gracilis) and hypolimnion (D. galeata and Copepods L. macrurus, Heterocope appendiculata), whitefish, smelt and trout were collected mid-lake, south of Brandbu. In Femunden, zooplankton from the epilimnion (Cladocerans D. galeata, B. longispina), whitefish, Arctic char and trout were collected in the southern basin (Figure 2). Zooplankton (epilimnic and hypolimnic) and Mysis were collected with vertical net hauls, and fish were caught using surface and bottom gill nets, traps, and angling. Each sample of fish consisted of skinless filets from one individual fish, with the exception of small smelt from Mjøsa and Randsfjorden, where 5-6 skinless filets were pooled, and with the exception of burbot where liver was analysed in addition to filets. Brown trout from Mjøsa

Siloxanes in freshwater food webs – a study of three lakes in Norway | M-81/2013
11
was stored frozen whole until sample preparation (dissection of skinless filet) at NIVA, whereas fish from Femunden and Randsfjorden were dissected fresh. The dissected samples were stored frozen in preheated glass jars.
Precleaned field blanks (passive samplers: polyester pouches containing 60 mg ENV+) were exposed to air and handled in the same manner as the biotic samples, as described previously20. After exposure the field blanks were wrapped in aluminum foil and kept frozen in sealed PE bags until analysis.
Sediment samples from the surface layer (upper 0-1 cm) were collected in stainless steel
tubes (inner diameter 85 mm) using a gravity corer equipped with a core catcher. The
sampling was performed according to established protocols26. Sediments were collected in
areas with stable accumulation sediments, if possible close to the WWTP discharge area
(Figure 2). Each sample consisted of three pooled cores from each station. Deeper pre-
industrial sediments were collected from Mjøsa (40-42 cm) and Randsfjorden (30-32 cm
Jevnaker, 40-42 cm Fluberg) to serve as reference to the surface sediments (Table 3).
In Mjøsa, high volume water samples were collected using a pre-programmed in situ water
sampler at ca 15 m depth (Table 3). The in situ water sampler was custom made for NIVA,
and includes a filter holder in stainless steel for collection of the particulate phase (for
analysis of cVMS in the present study) and a separate chamber for polyurethan foam (PUFs)
for collection of the water dissolved fraction (for analysis of PCBs in the present study).
Filters for sampling were pre-heated, and the PUFs were cleaned with solvents and stored in
aluminum foil prior to sampling.
Grab samples of effluent were collected directly from the outlet drain of 3 WWTPs in Mjøsa
and 3 in Randsfjorden (Table 3).All of the samples were collected on the same day. As far as
possible, the bottle (2.5 L) was topped to avoid air space below the cap. Aluminum foil sealed
the bottle under the cap.
To reduce the risk of contamination during sampling, all sample preparation was conducted outdoors, i.e., the material was outdoors from the time of sampling until it was freezer-ready for storage until shipment to the Department of Applied Environmental Science (ITM, Stockholm University, Sweden) for analysis of cVMS in October-November 2012. All personell involved in the sampling (NIVA personnel, WWTP personell, and local fishermen) avoided personal care products at least 24 h prior to field work. All large surfaces (e.g. tubs for gill nets, gill nets after retrieval before the fish were collected, the chopping board for sample preparation and fish dissection) were covered in aluminum foil. All utensils (tweezers, knife, scalpel) were made of strnaless steel. All sampling equipment in contact with any sampling matrix was cleaned with solvents (acetone/methanol) between samples. Contact with plastics was avoided. The samples were stored in pre-heated glass jars sealed with aluminum foil under the lid. All biota samples and water samples (GFF and PUF) were stored frozen until chemical analysis. Sediment samples from Lake Femunden were stored frozen (-20°C), while sediment samples from Randsfjorden and Mjøsa were stored cooled (4ºC) until analysis. Effluent water samples were stored cooled until analysis. More details on sampling procedures can be found in the Supporting Information.
Immediately after collection, the material was divided into sub-samples for analysis of cVMS, legacy contaminants (halogenated POPs), and stable isotopes of nitrogen (δ15N) and carbon (δ13C). Biota and sediment samples were analysed for cVMS, PCBs, PBDEs, stable isotopes, and lipid content or organic carbon, respectively. Effluent and suspended particulate matter (filter) samples were analysed for cVMS, whereas the dissolved water samples (PUF) were only analysed for PCBs.

Siloxanes in freshwater food webs – a study of three lakes in Norway | M-81/2013
12
4.2 Chemical analysis of cVMS The samples were analysed for cVMS (D4, D5 and D6) at Stockholm University using a modified version of a published purge and trap method9. To improve the repeatability and analyte recovery of that method, the samples were extracted using an organic solvent containing the surrogate standards13C-D4, 13C-D5 and 13C-D6. Fish tissue, zooplankton, GFF filters, and effluent water were extracted with dichloromethan (DCM), while sediment was extracted with a mixture of DCM and acetone. The extracts were transferred to a flask containing glass beads (4 mm) and a stir bar. Purified nitrogen was led into the flask and exited via a cartridge containing 10-15 mg of Isolute ENV+ (Biotage AB, Sweden). The flask was purged with nitrogen while stirring for 2.5-3 h until all solvent had evaporated. The purging was continued for another 2 h with the heating turned on giving a temperature of ~ 72°C. Then the ENV+ cartridge was removed and eluted with 0.8 mL n-hexane. Tetrakis(trimethylsiloxy)silane, M4Q, was used as the volumetric standard. The purified extract was analysed using GC/MS as described in Kierkegaard et al.9. Extraction and sample preparation were performed in a clean air cabinet under a laminar flow of filtered air. A detailed description of the method is provided in the Supporting Information (text and Table S 3 - Table S 7).
In addition to procedural blanks and field blanks, an internal matrix control (homogenate of
herring from the Baltic Sea for biota samples and a sediment sample from Lake Mjøsa for
abiotic samples) was analyzed with each round of 8 samples. The limit of quantification (LOQ)
for biota samples was set to the mean plus 10 times the standard deviation of the procedural
blanks (Table S 8). For sediment the LOQs were based on the reference sediments (three
times the maximum quantity measured in the reference sediments from Randsfjorden, n=2)
because there were too few sediment blanks (Table S 8). The cVMS results were not blank
corrected.
4.3 Chemical analysis of halogenated POPs
The biota samples from Lake Mjøsa and Lake Randsfjorden were analysed for PCBs and
chlorinated pesticides. The Lake Mjøsa samples were also analysed for PBDE. The analysis
were conducted at NIVA based on established methods for extraction27 using cyclohexane and
isopropanol. Extracts were analyzed on GC-EI-MS operating in single ion monitoring (SIM).
Quantification of individual compounds was done using the relative response of surrogate
internal standard and comparing that to a calibration curve28. More detailed description is
found in the Supporting Information (tekst and Table S 9).
The sediment and PUF samples were spiked with the same internal standards as the biota
samples, and then extracted twice by shaking with DCM and then centrifuged (sediments), or
by soxhlet using 5% ether in n-hexane (PUFs).29 The organic phase was then dried using
sodium sulphate (Na2SO4), transferred to a new vial and solvent exchanged with isohexane.
The cleanup procedure was the same procedure as for the biota samples.
The extraction of total lipids by cyclohexane and isopropanol followed the recommended method for the revised OECD 305 guideline for determination of bioconcentration factor in fish30, with results well within the acceptable criteria for the Quasimeme ringtest for lipid determination (Table S 10).

Siloxanes in freshwater food webs – a study of three lakes in Norway | M-81/2013
13
4.4 Analysis of trophic descriptors
Stable isotopes of nitrogen (δ15N)and carbon (δ13C) were analysed to assess the relative
trophic position and the dominant carbon source of the organisms, respectively19. All biota
and sediment samples analysed for cVMS were also analysed for δ15N and (δ13C) at the
Institute for Energy Technology (IFE-Kjeller) according to standard protocols31. Lipids and
carbonate were not removed or extracted from samples prior to analysis of the isotopic
signature.
4.5 Data treatment
The co-occurrenceof chemicals in the various samples was investigated by pairwise
correlation (in which n may vary depending on chemical). As more Mjøsa zooplankton sub-
samples were analysed for cVMS than for PCB, the cVMS data were averaged to obtain a
similar n to legacy POPs. As the PBDE analysis in one hypolimnion zooplankton was considered
uncertain (irregular chromatogram), this sample was excluded in he correlations and further
data treatment with PBDE-47 and PBDE-99.
Pelagic food web biomagnification was assessed by estimating trophic magnification factors
(TMFs)15,20. In brief, the relative trophic level (TL) of each sample (consumer) was calculated
from δ15N using an enrichment factor (ΔN) of 3.4 ‰17,18,26. The lowest epilimnion zooplankton
δ15N for the respective lake was defined as the baseline primary consumer of trophic level 2
(15N primary consumer) (Equation 1).
TLconsumer=(( δ15Nconsumer– δ15Nprimary consumer)/ ΔN)+2 (1)
TMFs were estimated as the slope (b) of the lipid normalized contaminant concentration
([Contaminant]LW) regressed onto the TL, analysing for interaction with lake to test if the TMF
differ between lakes (Equation 2 and 3). Benthic fish and abiotic samples were not included
in the regression as they are not components of the pelagic food web.
Ln[Contaminant]LW = Ln a + bTL + c Lake + d TLxLake (2)
For chemicals with non-significant interaction between trophic level and lake, the term was
removed from the regression, and the TMF estimated from the slope (b) (Equation 3). For
chemicals with significant interaction (only PCB-180), the TMF were estimated separate for
each lake.
TMF = eb (3)
TMFs were calculated for cVMS and selected legacy POPs. For cVMS, more than 80% of the
data were quantified above the LOQthroughout the food web (Table S 12). Thus, uncensored
cVMS data were included in the data analysis, using estimated values below LOQ but above
LOD for cVMS. Data treatment and estimation of TMF based on original uncensored data is
preferable to censored data by replacement of values below LOQ with a fixed or random
value15. As POPs were quanfitied using LOD as the cut off, values below LOD were censored
and replaced by the samples and chemical specific LOD. When data were quantified below
the LOQ for cVMS, or LOD for POPs, these data were generally comparable to the data above
the LOQ or LOD, respecitvely. Thus the data were included in the analysis, and if more than
50% of data were below the LOQ, or LOD, respectively, the TMFs were estimated and
presented for comparison. They are labeled with an asterix for recognition (TMF*) to denote
that they have a greater uncertainty. TMFs were not estimated for Femunden, as the whole

Siloxanes in freshwater food webs – a study of three lakes in Norway | M-81/2013
14
food web was not analysed for cVMS, following the observations of low levels in trout and
sediments.
In Randsfjorden, one hypolimnion zooplankton sample (R8) was identified as a multivariate outlier and was excluded from the dataset for all data analysis.

Siloxanes in freshwater food webs – a study of three lakes in Norway | M-81/2013
15
5. Results and Discussion
5.1 cVMS QA/QC results
5.1.1 Control samples and repeatability of analysis The repeatability of the method was assessed using the matrix control samples analysed
during each round of extractions. The relative standard deviation (RSD) of the control samples
was between 8% and 11% for D5 and D6 in both the sediment and the herring matrices (Table
S 6), which is a good result, particularly in light of the low D5 and D6 concentrations in these
samples. The RSD was higher for D4 in herring, which can be attributed to the very low levels
in the matrix control samples (a factor of 2 above the LOQ). D4 was below the LOQ in the
sediment.
5.1.2 Limit of Quantification and comparison to blank
The amount of D4, D5 and D6 was above the LOQ in 23%, 98% and 58%, respectively, of the
biota samples (total biota samples n = 91), and 0%, 80% and 73%, respectively, of sediment
samples (total sediment samples n = 18), depending on the lake (Table S 11). In the reference
lake, Femunden, all cVMS were below LOQ in all samples except for a few trout in which D5
was above the LOQ. Low cVMS levels in Femunden had been anticipated and therefore
sediments and samples of the top predators brown trout and arctic char were analysed first.
Due to the low levels found, the remaining samples collected in Femunden (zooplankton,
whitefish, arctic char) were not analyzed.
All of the effluent water samples contained all cVMS above the LOQ, with the exception of D6
in the sample from Lillehammer, Mjøsa (Table S 11). For the filter (GFF) samples, an error in
the field unfortunately resulted in no field blank being available. Since it could therefore not
be excluded that these samples were contaminated, the measured concentrations were
designated “<”.
In biotia samples, the total content of D5 and D6 in the field blanks from Lake Mjøsa was in all cases low compared to the total amount extracted from the samples above LOQ (ratio >4.4 up to 3499, Table S 11). For D4 the difference between field blanks and samples was lower; still 11 of 21 samples from Mjøsa contained more than 5 times the amount in the field blank (total range 3-94). For Randsfjorden, although more samples were close to or below the LOQ for D4 and D6, the biotia sample to field blank ratio for D5 was greater than 5 for all but 6 samples (Table S 11). In Femunden only D5 was quantified above the LOQ in trout, with values 15-23 times higher than the field blank.

Siloxanes in freshwater food webs – a study of three lakes in Norway | M-81/2013
16
Table 2. Species collected in Norwegian lakes in 2012 and analysed for trophic descriptors (stable isotopes of nitrogen (δ15N), and carbon (δ13C), ‰),
cyclic volatile methylsiloxanes (cVMS, ng/g lipid weight), and persistent organic pollutants (POPs, ng/g lipid weight)a.
Species Biometry Length (cm)
Weight (g) SI
δ13C
δ15N Trophic level Lipid Lipid %
N Mean SE Mean SE N Mean SE Mean SE Mean SE N Mean SE
MJØSA
Zooplankton Epilimnion
4 -31.6 ± 0.3 7.7 ± 0.0 2.0 ± 0.0 4 0.72 ± 0.04
Zooplankton Hypolimnion
5 -33.5 ± 0.7 9.7 ± 0.6 2.6 ± 0.2 5 3.50 ± 1.36
Mysis
5 -30.9 ± 0.4 10.5 ± 0.3 2.8 ± 0.1 5 2.54 ± 0.55
Vendace 7 22.0 ± 0.2 67.9 ± 2.4 7 -29.6 ± 0.3 13.9 ± 0.1 3.9 ± 0.0 7 1.17 ± 0.11
Smelt, smallb 35 10.8 ± 0.1 5.9 ± 0.1 5 -28.9 ± 0.1 13.5 ± 0.2 3.8 ± 0.1 5 1.03 ± 0.03
Smelt, large 5 20.5 ± 1.1 48.6 ± 8.5 5 -27.6 ± 0.2 15.8 ± 0.1 4.4 ± 0.0 5 1.27 ± 0.23
Brown trout 5 56.4 ± 2.3 2054 ± 306 5 -28.3 ± 0.5 15.6 ± 0.1 4.4 ± 0.0 5 2.92 ± 0.56
Whitefish 5 32.3 ± 1.5 241 ± 89.6 5 -27.0 ± 0.3 13.0 ± 0.3 3.6 ± 0.1 5 0.84 ± 0.19
Perch 6 26.2 ± 2.1 224 ± 148 6 -26.2 ± 0.4 14.3 ± 0.3 4.0 ± 0.1 6 0.69 ± 0.04
Burbot, liver 6 31.7 ± 1.5 206 ± 72.1
6 40.5
2.96
Burbot, muscle 6 31.7 ± 1.5 206 ± 72.1 6 -25.6 ± 0.5 15.7 ± 0.2 4.4 ± 0.1 6 0.69 ± 0.02
RANDSFJORDEN
Zooplankton Epilimnion
4 -32.3 ± 0.1 6.3 ± 0.0 2.0 ± 0.0 4 0.73 ± 0.03
Zooplankton Hypolimnion
3 -36.4 ± 0.8 9.5 ± 0.9 3.0 ± 0.3 3 1.65 ± 0.48
Whitefish 10 24.6 ± 2.3 157 ± 31.3 9 -28.2 ± 1.1 10.4 ± 0.2 3.2 ± 0.1 9 1.24 ± 0.22
Smeltb 25 12.5 ± 0.1 10.3 ± 0.2 5 -30.4 ± 0.1 11.3 ± 0.2 3.5 ± 0.1 5 1.97 ± 0.20
Brown trout 5 40.8 ± 2.5 862 ± 180 5 -28.4 ± 0.6 12.2 ± 0.3 3.8 ± 0.1 5 0.68 ± 0.09
FEMUNDEN
Arctic char 1 32.2 ±
321
1 -26.1
6.9
1 1.00
Brown trout 6 38.1 ± 2.0 550 ± 92.2 6 -23.2 ± 0.3 9.3 ± 0.5 6 0.74 ± 0.16
Siloxanes in freshwater food webs – a study of three lakes in Norway | M-81/2013
17
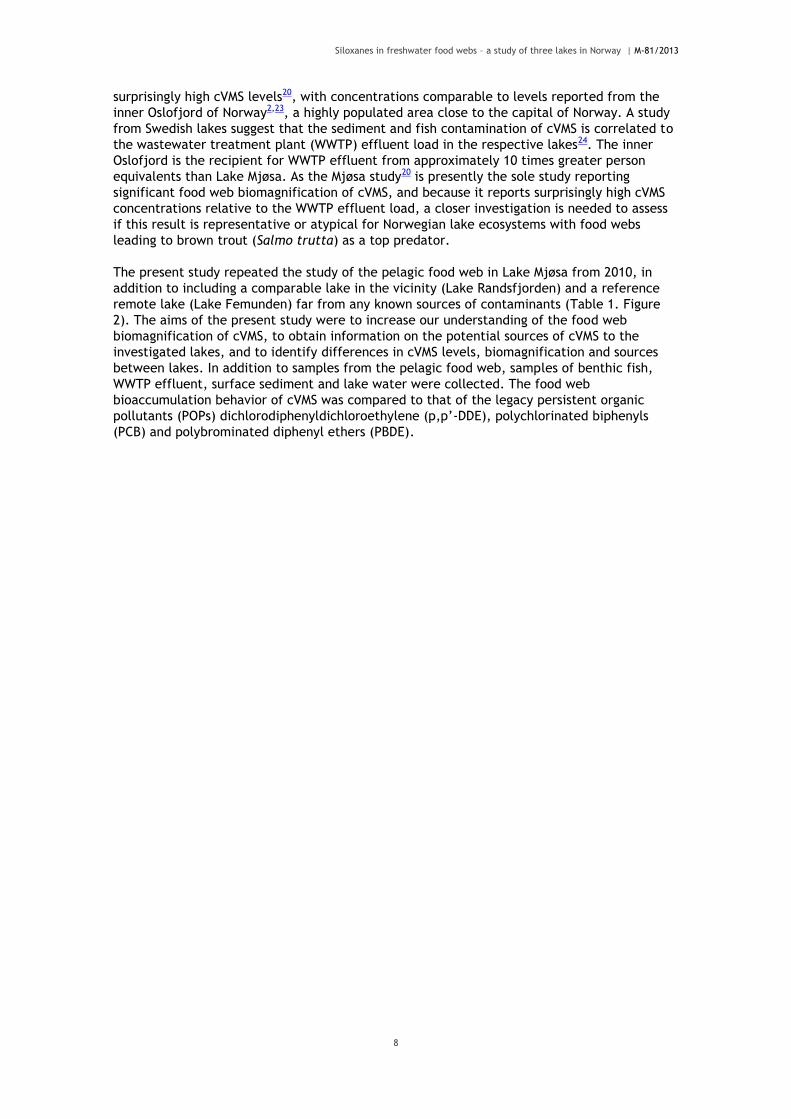
Table 2. cont.
Species
D4
D5
D6
POPs
PCB-153
PCB-180
p,p’-DDE
PBDE-47
PBDE-99
N Mean
SE Mean SE Mean
SE N Mean SE Mean SE Mean SE Mean SE Mean SE
MJØSA
Zooplankton Epi 3 <46
342 ± 33 <48
2 (1) 10 ± 0 <8
38 ± 1 (11)
(1)
Zooplankton Hypo 4 36 ± 3 1664 ± 296 48
3 20 ± 1 5 ± 1 67 ± 2 35 ± 5 8 ± 1
Mysis 4 53 ± 13 927 ± 116 59 ± 13 4 25 ± 6 <4
82 ± 17 34 ± 6 10 ± 2
Vendace 7 81 ± 8 14160 ± 2446 786 ± 117 7 333 ± 70 69 ± 15 890 ± 167 415 ± 83 146 ± 32
Smelt, smallb 5 <24 ± 3 3533 ± 224 184 ± 21 5 73 ± 11 9.6 ± 4 216 ± 29 105 ± 12 16 ± 1
Smelt, large 5 <17 ± 3 5256 ± 737 325 ± 55 5 337 ± 50 50.1 ± 11 853 ± 120 552 ± 89 16 ± 4
Brown trout 5 27 ± 7 5629 ± 1041 285 ± 45 5 322 ± 81 54 ± 13 837 ± 208 659 ± 204 68 ± 18
Whitefish 5 <38
1027 ± 325 <122
5 308 ± 89 47 ± 18 807 ± 193 789 ± 161 141 ± 31
Perch 6 <29
403 ± 47 <66
6 335 ± 107 41 ± 14 655 ± 210 362 ± 218 117 ± 34
Burbot, liver 6 44 ± 7 5296 ± 1019 260 ± 73 6 415 ± 78 48 ± 9 793 ± 106 1406 ± 267 78 ± 13
Burbot, muscle 6 <61
1507 ± 244 174 ± 21 6 113 ± 17 15 ± 2 217 ± 28 376 ± 74 22 ± 2
RANDSFJORDEN
Zooplankton Epi 4 <34
251 ± 5 <37
4 8 ± 0 <7
21 ± 2
Zooplankton Hypo 3 51 ± 2 2251 ± 39 48 ± 10 3 26 ± 7 8 ± 2 51 ± 13
Whitefish 9 <19
112 ± 39 <30
9 27 ± 5 7 ± 1 47 ± 6
Smeltb 5 <11
969 ± 71 58 ± 9 5 9 ± 1 <3
23 ± 2
Brown trout 5 16 ± 3 2579 ± 806 132 ± 31 5 59 ± 4 14 ± 1 113 ± 8
FEMUNDEN
Arctic char 1 <10
<20
<40
Brown trout 6 <40 39 ± 14 <80
a. For cVMS or POPs with more than 50% of values below LOQ or LOD, respectively, for a given species and lake, the estimated mean include all values (also those <LOQ), and the estimate is flagged by <.
b. 5-6 small smelt filets were pooled into one sample for contaminant and stable isotope analyses. All other fish were analysed individually.

Siloxanes in freshwater food webs – a study of three lakes in Norway | M-81/2013
18
Table 3. Abiotic samples collected in Norwegian lakes in 2012; surface sediments (0-1 cm), deeper pre-industrial sediments for reference, effluent water from wastewater treatment plants, water particulate phase and water dissolved phase. All samples are reported individually, except water which is an average of 3 samples. Sediment samples were analysed for total organic carbon (TOC, %), stable isotopes of nitrogen (δ15N, ‰), and carbon δ13C, ‰), cyclic volatile methyl siloxanes (cVMS), and persistent organic pollutants (POPs)a,b.
MATRIX /
Lake
Date Area Depth
(m)
TOC δ13C δ15N D4 D5 D6 PCB-153 PCB-
180
p,p’-DDE PBDE-47 PBDE-99
SEDIMENTS (ng/g TOC)
Mjøsa Sept 3rd Ottestad/
Gillundstranda
120 2.16 -26.1 -2.6 <125 <8 <15 <6.9 <6.9 <4.6 <9.3 <9.3
Sept 5th Ottestad 30 3.73 -26.7 2.9 <46 154 166 61.7 21.7 131 <5.4 <11
Sept 5th Lillehammer 30 3.22 -27.8 0.04 <9.3 210 95 6.2 <2.5 9.3 <6.2 <9.3
Sept 5th Lillehammer 80 3.56 -28.1 0.8 <14 729 264 6.5 <2.3 7.3 9.8 <11
Sept 5th Gjøvik 28 5.61 -27.7 2.4 <66 5086 602 32.1 13.0 14 11.9 37.4
Sept 5th Gjøvik 120 5.57 -26.7 2.1 <120 6022 725 104.1 44.9 29 9.3 18.0
Sept 5th Lillehammer-
reference
80 3.31 -26.5 -0.8 <9.1 28 <30 45.3 13.3 42 <6.0 <6.0
Randsfjorden
Aug 30th Jevnaker 65 2.65 -26.8 1.4 <45 37 32 23.0 9.1 67.9
Aug 30th Jevnaker 70 2.51 -26.6 1.9 <155 32 40 8.0 4.0 8.8
Aug 30th Brandbu 28 6.55 -27.8 4.7 <17 795 152 24.4 10.4 64.1
Aug 30th Brandbu 30 5.79 -27.3 3.7 <28 2540 385 16.2 7.4 32.8

Siloxanes in freshwater food webs – a study of three lakes in Norway | M-81/2013
19
Table 3.
cont.
Date Area Depth
(m)
TOC δ13C δ15N D4 D5 D6 PCB-
153
PCB-
180
p,p’-
DDE
PBDE-
47
PBDE-99
Randsfjorden cont.
Aug 30th Fluberg 41 4.77 -28.1 2.1 <6.3 126 93 7.5 <2.5 13.2
Aug 30th Fluberg 42 5.89 -28.4 1.4 <80 193 133 <2.5 <1.7 4.4
Aug 30th Jevnaker-reference 65 2.02 -26.6 1.9 17 5.6 7.6 <5.0 <5.0 <5.0
Aug 30th Fluberg-reference 42 2.18 -27.2 -2.1 <64 8.6 9.6 4.6 4.6 <4.6
Femunden
Aug 8-9th Femunden 70 5.7 <16 <3.5 <11
Aug 8-9th Femunden 75 5.7 <21 <8.8 <19
Aug 8-9th Femunden 80 5.7 <7.0 <5.2 <12
EFFLUENT WATER (ng/L)
Aug 22nd Mjøsa Rambekk WWTP (Gjøvik) 8.9 82 12.1
Aug 22nd Mjøsa Hias WWTP (Ottestad) 15 111 14.0
Aug 22nd Mjøsa Lillehammer WWTP 7.7 29 <3.1
Aug 22nd Randsfjorden Jevnaker WWTP 13 61 11
Aug 22nd Randsfjorden Brandbu WWTP 27 351 11
Aug 22nd Randsfjorden Dokka WWTP 24 368 9.3

Siloxanes in freshwater food webs – a study of three lakes in Norway | M-81/2013
20
Table 3
cont.
Date Area Depth
(m)
TOC δ13C δ15N
D4 D5 D6 PCB-153 PCB-
180
p,p’-DDE PBDE-47 PBDE-99
WATER PARTICULATE (ng/g TOCc)
Mjøsa Sept 3rd Ottestad/Gillundstranda <171 <200 <143
WATER DISSOLVED (pg/L)
Mjøsa Sept 3rd Ottestad/Gillundstranda mean <0.9 <0.9 2 7 4
SD 0.4 0.9 1.3
a. < = lower than limit of detection for PCBs and PBDEs.For cVMS the concentration measured in the sample is reported and designated with < if it is below the LOQ.
b. Empty cells indicates the parameter was not analysed c. Based on 1 mg/L particles in the water column, from on turbidity measurements, and on the assumtion of 35% TOC in particles.

Siloxanes in freshwater food webs – a study of three lakes in Norway | M-81/2013
21
5.2 General trends in cVMS concentrations 2012
In both the food web and the sediments, Lake Mjøsa was more contaminated with cVMS than Lake
Randsfjorden (Table 2, Table 3). In addition to a higher human population and thus higher discharge
from WWTPs, Mjøsa supports more traffic, local industry and business, including garages, and
agricultural activity compared to Randsfjorden. Of the cVMS, D5 dominated both biotic and abiotic
samples, followed by D6 and D4 that were below LOQ in several samples.
The high levels of cVMS found in 2010 in fish from Mjøsa were confirmed in the present study. For
instance, the D5 concentrations in trout ranged from 3000 ng/g lw to 9200 ng/g lw (Table 2). The
D5 levels in Randsfjorden were lower, with concentrations in brown trout from 60 ng/g lw to 4900
ng/g lw. In the remote reference lake, Femunden, D5 concentrations in trout were low, ranging
from <23 ng/g lw to 69 ng/g lw. The two orders of magnitude lower cVMS levels in Femunden biota
compared to Mjøsa and Randsfjorden is in line with reports from Swedish lakes comparing perch in
lakes receiving and not receiving discharge from WWTP.24 The low cVMS levels in biota from the
remote Femunden are also in line with a study of arctic char in remote Swedish lakes9.
The cVMS concentrations in sediment displayed considerable variability. One sample, the deep
water sediment from Ottestad/Gillundstranda (Mjøsa), contained very low D5 and D6 levels, only 7%
compared to the shallower sample from the same area (Table 3). The fact that p,p’-DDE was not 15N
level, suggested that this was disturbed sediment (e.g. from a slump or dumped material). The
sediment was collected in an area with steep slope and strong currents, thus unstable
sedimentation and absence of accumulation sediments is likely. Within each of the other areas
there was good agreement between the two samples collected (median difference 67%). The low
variability within sampling areas contrasted with high variability between sampling areas within a
lake. The mean concentrations in the most contaminated sampling area of Lake Mjøsa were 36 and
4 times higher for D5 and D6, respectively, than the mean concentrations in the least
contaminanted area. The corresponding values for Lake Randsfjorden were 48 and 7. Comparing the
most contaminated sampling areas of the lakes with each other, the mean D5 and D6 concentrations
were higher in Lake Mjøsa by a factor of 3.5 and 2.5, respectively. Smaller differences were
observed when the least contaminated sampling areas of the two lakes were compared.
The dry weight normalized D5 concentrations in sediment from this work (Mjøsa: 2-400 ng/g dw;
Randsfjorden: 0.1-150 ng/g dw) can be compared with other studies. The present highest sediment
concentrations were 1-2 orders of magnitude lower than reported from water bodies highly
impacted by wastewater such as the inner Oslofjord, Norway32, Humber estuary3, and other areas
receiving effluent from WWTPs3. The highest D5 sediment concentrations (ng/g dw) were however
comparable to those of other Nordic areas with moderate human impact2, whereas the low
concentration areas were comparable to those reported from the Arctic4. Thus, whereas the trout
cVMS concentrations are comparable to those reported from the inner Oslofjord (high human
impact), the cVMS concentrations in the sediments are more in line with those reported from
moderate to low human impact areas.
All benthic feeding fish in Lake Mjøsa (burbot, perch and whitefish) had lower lipid normalized
concentrations of cVMS in muscle compared to pelagic feeding fish at comparable trophic levels
(trout, smelt and vendace, respectively) (Table 2). This may be due to lower exposure (lower
fugacity) from sediment than in the water column, lower bioaccumulation at the first trophic levels
of the food web, and/or lower biomagnification and enrichment from prey to predator (i.e. less
efficient trophic transfer and retention) within the benthic compared to the pelagic food web.
The levels of legacy POPs were higher in fish from Mjøsa than in Randsfjorden, whereas the levels in
zooplankton were comparable (Table 2). The observed levels of legacy POPs were comparable to
recent studies from Mjøsa33. A previous comparison of Randsfjorden and Mjøsa, in 1998, also
reported higher PCB levels (3 times) in Mjøsa trout compared to Randsfjorden trout34.

Siloxanes in freshwater food webs – a study of three lakes in Norway | M-81/2013
22
5.3 Sources of cVMS
The area with highest cVMS concentration in sediments in Mjøsa was Gjøvik, and Brandbu in
Randsfjorden (sediment sampling was approximately 1-5 km from the discharge area of the
respective WWTPs). The higher levels in sediments close to Gjøvik compared to the other
areas in Mjøsa, may be due to the its area close to a catchment area of a large industrial area
including industry such as manufacturing and surface treatment of plastics for automotive
industry, manufacturing of storage systems for alternative fuels, aluminum industry and junk
yards. The river Hundselva passes through this industrial area and has its outlet north of
Gjøvik. cVMS were found in effluent grab samples from the WWTPs of both Mjøsa and
Randsfjorden. Effluent grab samples were collected from the WWTPs, rather than flow
proportional samples, to avoid contamination of the sample and volatilization of cVMS. Thus,
the effluent samples did not represent flow volume corrected concentrations, and could not
be directly compared across WWTPs. Nevertheless, as they were collected from the WWTP
outlet, they represent effluent averaged over all connected sources and at least several hours
in time. The cVMS concentrations in effluent grab samples from Mjøsa WWTPs were highest
and comparable at HIAS (close to Ottestad) and Rambekk (close to Gjøvik), and lowest at
Lillehammer (Lillehammer). Earlier estimates of daily flow through the WWTPs, showed
substantial variation during the year, with estimated daily flow of 6,000-40,000 m3/day in
Rambekk, 14,500-28,000 m3/day in HIAS and 11,000-31,000 m3/day at Lillehammer35. The
highest sediment concentrations in Randsfjorden close to the Brandbu WWTP coincides with
the relative denser population in this area. Although also Jevnaker has a dense population in
Randsfjorden, the sediment samples were collected in the lake upstream for the WWTP
discharge area, which is in the river outlet of the lake. The Jevnaker sediments therefore do
not reflect the impact from the Jevnaker population.
As cVMS have high KOW and high octanol air partitioning coefficient (KOA), they are very
hydrophobic and will tend to sorb to particles in the water column or to volatilize to the
atmosphere. cVMS are therefore difficult to analyze in sirface water due to low dissolved
water concentrations, risk of cross contamination, and risk of volatilization during storage of
water. Nevertheless, in Lake Mjøsa the particulate phasewas collected on filters with an in
situ pump. The estimated upper bounds of the OC normalized concentrations in the pelagic
particulate matter (<170, <200 and <143 ng/g dw TOC for D4, D5 and D6, respectively) were
similar to the concentrations measured in the near surface sediment at the same area (<125,
154 and 166 ng/g dw TOC) (Table 3). Considering that the level in the water column all
represent upper limits, this suggest that the higher measured concentrations in pelagic fish
compared to benthic fish at the same trophic level can not be explained by consistently
higher exposure in the pelagic habitat compared to the benthic habitat. However, this should
be the topic of future studies.
The majority of cVMS emissions to the environment are to the atmosphere, and they have the potential for long range atmospheric transport12,36,37. However, they are also released to the environment in WWTP effluent6, as was confirmed by analysis in this project. The present study found up to two orders of magnitude higher concentrations in biota and sediments from lakes Mjøsa and Randsfjorden compared to the reference lake, Femunden. This is comparable to findings from Swedish lakes where perch D5 levels between lakes receiving WWTP effluent and lakes receiving no effluent differed by up to three orders of magnitude24. If long range transport was the dominant source of cVMS to the lakes, the concentrations would be expected to be more similar between the lakes. Although Femunden is remote from local sources, it is not remote from the perspective of long range atmospheric transport, and thus the deposition of cVMS from the atmosphere is not likely to differ greatly between the investigated lakes on this relatively small spatial scale. Thus, local sources such as discharged effluent water from the WWTPs are suggested to be the primary source of cVMS in the Norwegian lakes.

Siloxanes in freshwater food webs – a study of three lakes in Norway | M-81/2013
23
5.4 Dietary relationships
Analysis of the dietary descriptors δ 13C and δ15N enabled an evaluation of the major carbon
source and relative trophic position in the fish community of Lake Mjøsa (Figure 3.). The food
web sampled in Mjøsa ranged across 2.4 trophic levels, from 2 to 4.4 (Table 2). The pelagic
feeding fish were separated from the benthic feeding fish in the δ 13C signal, but overlapped
in trophic position, i.e. trout and burbot occupied the highest pelagic and benthic trophic
positions, followed by vendace and perch, respectively. The pelagic feeding smelt consisted
of two size groups that were separated in trophic position, with the large smelt occupying a
higher trophic position that overlapped with trout, while the smaller smelt occupied a lower
trophic position that overlapped with vendace and perch (Figure 3., Table 2). The smelt diet
shifts from being predominantly zooplankton for younger and smaller smelt, to an increasing
degree of cannibalism once the fish are in their fourth year (3+) and longer than
approximately 10 cm38.
Of the Lake Mjøsa invertebrates, epilimnic zooplankton occupied the lowest trophic position, and there was little variance in the isotopic signals among the samples. Hypolimnic zooplankton had higher δ15N values, and showed larger spread in data (the samples collected on August 2nd 2012 had markedly lower δ15N values than the samples collected on August 21st 2012) (Figure 3.). In accordance with its main prey and predator, Mysis occupied an intermediate trophic position between the epilimnic zooplankton and the planktivorous fish, with some variation among samples due to different sampling dates (higher δ15N in one
13C values did not vary greatly among the invertebrate samples.
In Randsfjorden, the food web sampled ranged 1.7 over trophic levels from 2.0 to 3.7, and was thus narrower compared to the Mjøsa food web (Table 2). Smelt had lower trophic position than large fish-feeding trout, whereas whitefish occupied the lowest trophic position. The fish overlapped in δ 13
C values, whereby the variation was particular high for whitefish (Figure 3., Table 2). The spread in δ 13
C suggest that there is considerable variation in diet within the whitefish, which is supported by earlier investigations of stomach contents, that identified both purely pelagic feeding fish and fish feeding on benthic and terrestrial invertebrates39. TMFs were thus calculated both excluding and including whitefish.
In Randsfjorden, the epilimnic zooplankton isotopic values were tightly grouped, whereas the hypolimnion samples varied substantially, particularly in δ15N, spanning more than one trophic level (Figure 3.). These samples were collected the same day, by the same people, and using the same methods. Thus, the most likely explanation is that the species composition differs with variable amounts of carnivorous hypolimnic zooplankton, as each sample reflects its own individual net haul.

Siloxanes in freshwater food webs – a study of three lakes in Norway | M-81/2013
24
Figure 3. Relationship between the dietary descriptors δ15N and δ 13C in biota from Mjøsa (upper panel) and Randsfjorden (lower panel). Zoopl e. and h. is zooplankton epilimnion and hypolimnion, respectively.

Siloxanes in freshwater food webs – a study of three lakes in Norway | M-81/2013
25
A) MJØSA

Siloxanes in freshwater food webs – a study of three lakes in Norway | M-81/2013
26
B) RANDSFJORDEN
Figure 4. Scatter plot matrix for lipid normalized concentrations of cVMS and legacy
POPs, and trophic level (TL) in A) Mjøsa and B) Randsfjorden. Zoopl e. and h. is
zooplankton epilimnion and hypolimnion, respectively.

Siloxanes in freshwater food webs – a study of three lakes in Norway | M-81/2013
27
5.5 Food web biomagnification of cVMS
The food web biomagnification of D4 and D5 did not differ between the lakes, regardless of
whitefish from Randsfjorden being included or not in the regression (i.e. the interaction TL x
Lake was not significant p > 0.28, Table S13). Thus, one TMF for each of these chemicals was
valid for both lakes (Table 4). Detailed results including whitefish are found in Table 4, Table
S13 and Fig. S2. For D4 66% of the samples were below the LOQ for the two lakes combined,
indicating a greater uncertainty for the TMF (indicated by the asterix). This uncertainty was
however unbiased as the samples below the LOQ were distributed throughout the food web
(Table S11). The D4 data resulted in a low TMF* of 0.7 (0.5-0.9) (Fig 5, Table 4). Due to the
uncertainty associated to the D4 TMF*, it cannot firmly be concluded that D4 was subject to
trophic dilution, however, the results show that D4 biomagnification, if it was occurring,
would have been very low. The low D4 TMF* observed in this study is in agreement with
previous findings,21,22,40 and does not support the classification of D4 as vB.
D5 showed significant food web biomagnification with a TMF of 2.9 (2.1 - 4.0) (Table 4). The
D5 TMF was within the range previously measured for the same food web.20 The consistency
with similar TMFs between lakes and between years adds to the body of evidence of
significant food web biomagnification of D5 in pelagic freshwater food webs leading to brown
trout. Thus, the elevated D5 concentrations in trout from Mjøsa compared to Randsfjorden
were not likely due to differences in food web biomagnification, but resulted from higher D5
exposure at the base of the food web (epilimnetic zooplankton) in combination with trout
occupying a higher trophic level in Mjøsa due to the presence of Mysis (Table 2, Fig. 5).
For D6, the TMF was similar between the food webs when Randsfjorden whitefish was omitted
(TL x Lake, p=0.0605), resulting in a D6 TMF of 2.3 (1.8 - 3.0) (Table 4). This is the first
empirical field evidence for D6 biomagnification in a food web. When whitefish from
Randsfjorden was included in the regression, the D6 TMF differed between the food webs
(p=0.0360). This resulted in a significant D6 TMF in Mjøsa of 2.7 (2.0-3.8) (p<0.0001), and a
non-significant D6 TMF* in Randsfjorden of 1.5 (0.9-2.4) (p=0.1173). When omitting whitefish,
D6 TMF* in Randsfjorden was significant (p=0.0189), and with a comparable value of 1.6 (1.1-
2.3). The same shift in significance was found for D5TMF when calculated for Randsfjorden
with and without whitefish (Table 4). The change in D5 TMF and D6 TMF* significance in
Randsfjorden was due to the low D5 and D6 concentrations in whitefish compared to other
samples at the same trophic level, which resulted in the lower confidence interval
intersecting 1 when including whitefish, although the TMF value itself was not greatly
affected (Table 4).
PCBs and p,p’-DDE TMFs were higher in Mjøsa than in Randsfjorden (i.e. significant
interaction TL x Lake, p < 0.005), regardless of whether whitefish from Randsfjorden were
included or not in the regression (Table 4). In Mjøsa, the TMFs of PCBs, p,p’-DDE and PBDEs
were within or overlapped the ranges that were previously measured for the same food
web.20 For all chemicals that were compared between years, the present regression results
were more precise with a narrower confidence interval and a higher R2. The TMFs for PCBs
and p,p’-DDE were within the range documented in Canadian lake trout food webs.41 The
TMFs for PBDEs were comparable to those reported from a Canadian lake food web.42 The
higher TMFs of PCBs and p,p’-DDE in Mjøsa than Randsfjorden (Table 4), suggest that the food
web structure in Mjøsa differs from the structure in Randsfjorden, not just in length, but also
in a manner that affected the TMF of legacy POPs, but not cVMS. This will be discussed
further under TMF sensitivity.

Siloxanes in freshwater food webs – a study of three lakes in Norway | M-81/2013
28
Table 4. Trophic magnification factors (TMF) in freshwater food webs (Mjøsa and
Randsfjorden)a for cyclic volatile methylsiloxanes (cVMS: D4, D5, D6) and legacy
chlorinated and brominated contaminants based on lipid normalized concentrations and
trophic levels estimated from stable isotopes of nitrogenb.
Chemical Lake Whitefish TMF 95% L 95% U t Ratio Prob>|t| R2 N
Same TMF in the two lakes
D5 Both - 2.91 2.11 4.02 6.63 <0.0001 0.60 51
D5 Both + 2.79 1.86 4.20 5.03 <0.0001 0.57 59
D6 Both - 2.30 1.76 3.02 6.21 <0.0001 0.59 51
D4* Both - 0.69 0.54 0.89 -2.98 0.0045 0.29 51
D4* Both + 0.70 0.56 0.88 -3.10 0.0031 0.30 59
TMF for each lake separately
cVMS
D4* Mjøsa - 0.76 0.57 1.01 -1.94 0.0621 0.11 33
D4* Randsfjorden - 0.57 0.35 0.93 -2.46 0.0267 0.29 17
D4* Randsfjorden + 0.58 0.38 0.87 -2.75 0.0111 0.24 26
D5 Mjøsa - 3.12 2.28 4.29 7.35 <0.0001 0.64 33
D5 Randsfjorden - 2.74 1.70 4.41 4.52 0.0004 0.58 17
D5 Randsfjorden + 2.13 0.76 5.98 1.51 0.1444 0.09 26
D6 Mjøsa - 2.72 1.96 3.77 6.20 <0.0001 0.55 33
D6* Randsfjorden - 1.60 1.09 2.34 2.63 0.0189 0.32 17
D6* Randsfjorden + 1.46 0.90 2.36 1.62 0.1173 0.10 26
Legacy POPs
PCB-153 Mjøsa - 5.04 3.71 6.85 10.78 <0.0001 0.80 31
PCB-153 Randsfjorden - 2.19 1.26 3.80 3.04 0.0083 0.38 17
PCB-153 Randsfjorden + 2.29 1.46 3.60 3.79 0.0009 0.37 26
p,p'-DDE Mjøsa - 4.19 3.12 5.61 10.00 <0.0001 0.78 31
p,p'-DDE Randsfjorden - 1.94 1.23 3.07 3.09 0.0075 0.39 17
p,p'-DDE Randsfjorden + 1.96 1.36 2.84 3.76 0.0010 0.37 26
PCB-180 Mjøsa - 4.58 2.89 7.26 6.75 <0.0001 0.61 31
PCB-180* Randsfjorden - 1.41 0.70 2.82 1.04 0.3137 0.07 17
PCB-180* Randsfjorden + 1.48 0.85 2.56 1.46 0.1564 0.08 26
BDE-47 Mjøsa - 5.72 4.16 7.86 11.22 <0.0001 0.81 30
BDE-99 Mjøsa - 2.95 1.62 5.35 3.71 0.0009 0.33 30
a The Mjøsa food web included: epi- and hypolimnetic zooplankton, Mysis, vendace, smelt,
brown trout. The Randsfjorden food web included epi- and hypolimnetic zooplankton,
whitefish (+), smelt and brown trout. The regression was also run omitting whitefish (-).
b The regression was based on natural logarithm transformed lipid normalized contaminant
concentrations. Regression estimates for the intercept, slope, interactions and main effects,
can be found in Table S13.
c Chemicals marked *: >50% of the data from one or both of the lakes were below LOQ (for
cVMS) or LOD (for PCB and BDE). For the lakes combined, D4 and D6 had 66% and 33%,
respectively, of the data below LOQ.

Siloxanes in freshwater food webs – a study of three lakes in Norway | M-81/2013
29
Figure 5. Relationship between lipid normalized concentrations of cVMS (D4, D5 D6) and
PCB-153, and trophic level (TL) from Lake Mjøsa and Randsfjorden pelagic food webs.
Chemicals marked with asterix (*) have >50% of data below LOQ. Zooplankton epi and
hypo are epi- and hypolimnetic zooplankton, respectively. The trophic magnification
factor (TMF) was estimated separately for Mjøsa (Mj) and Randsfjorden (Ra) when the
interaction TLxLake was significant.
TMF sensitivity
Due to indications of semi-pelagic feeding of whitefish based on previous diet analysis, the
wide spread in 13C in whitefish, and low levels of cVMS in whitefish compared to other
species with same trophic level, the sensitivity of the TMF to the inclusion of Randsfjorden
whitefish was investigated more closely for cVMS and legacy POPs. In Randsfjorden, the D5
TMF and D6 TMF* estimates were not greatly affected by the inclusion or omission of
whitefish in the food web (Table 4). However, it resulted in non-significant versus significant
TMF, respectively, as including whitefish reduced the lower confidence interval so that it
intersected 1 (Table 4). The PCB and p,p’-DDE TMF regressions were not affected, as
whitefish had concentrations of legacy contaminants that were comparable to concentrations
in other species at the same trophic level (Table 2, Table 4, Fig. 4). The difference in food
web magnification between the chemicals in lake Randsfjorden is also illustrated by the poor
correlation among D5, D6 and legacy POPs, a correlation that was only significant when

Siloxanes in freshwater food webs – a study of three lakes in Norway | M-81/2013
30
whitefish was omitted, despite the decrease in sample size (Table S14). The sensitivity of the
cVMS TMF to the low cVMS concentrations in whitefish suggest that its cVMS source and
uptake differ from the other species in the purely pelagic food web, e.g., as a result of
feeding more in the littoral zone on terrestrial and benthic prey. It also suggests that the
environmental distribution of cVMS and legacy POPs differs so that littoral and benthic prey
are less contaminated with cVMS compared to pelagic prey, whereas legacy POPs do not
differ as much in prey concentrations depending on habitat. This hypothesis remains to be
addressed, but one can imagine several explanations for differences in cVMS concentrations in
littoral and benthic prey. One is that cVMS have a much lower fugacity in the terrestrial
environment due to their comparatively rapid elimination in air via phototransformation,
which would explain lower concentrations in terrestrial prey such as surface insects. Another
would be that cVMS have important ongoing point source discharges to lakes from WWTP
effluent,24 whereas the legacy contaminants have had a historic diffuse presence in Mjøsa
since the 1970s with several identified minor point sources.43 This consideration illustrates
that although PCBs are good benchmarks from a bioaccumulation point of view, they do not
reflect variability in TMF that is caused by other factors such as differences in environmental
distribution between chemicals. The present results suggest that TMF in pelagic food webs
leading to trout is robust with respect to spatial variation in contaminant exposure between
and within lakes for point source present-use chemicals such as cVMS, and that their TMF is
more affected by habitat related differences in contaminant concentrations and food web
structure.
The present study confirms and provides new documentation of significant D5 and D6 food
web biomagnification with TMF > 1 for the freshwater pelagic food web in two Norwegian
lakes. This is in contrast to the two other available food web studies, which report trophic
dilution and TMFs < 1 for cVMS in the benthic freshwater food web from Lake Pepin,
Mississippi, USA,21 and in the marine benthopelagic food web of Oslofjorden, Norway.22 The
silicone industry also reported TMF < 1 for D4 and D5 based on preliminary data from pelagic
marine fish in Tokyo Bay, Japan.40,44 As suggested in the present study, as well as the previous
Lake Mjøsa study,20 the cVMS TMF is sensitive to food web composition, and an explanation
for differences in TMFs between studies may be ecosystem characteristics that affect both
the trophic transfer and retention of contaminants, and thus the degree of biomagnification.
Some obvious differences among the existing cVMS TMF studies, in addition to the habitat
(pelagic versus benthic/benthopelagic), are water temperature, water residence time, water
depth, species composition, and salinity. The influence of differences in these characteristics
on cVMS biomagnification should be the subject of future investigations.
One explanation for the different biomagnification behavior of D4 compared to D5 and D6
could be a more rapid metabolism of D4 than the other cVMS. This is suggested by
biotransformation rates in fish derived from inverse modeling of bioconcentration studies.45
There are, however, few empirical studies of metabolism and elimination of cVMS.40,44
Although mammals have been shown to rapidly metabolise and eliminate D4 and D5, fish
seem to have a slower metabolism of D4 (2% of recovered dose was present as metabolites)
than of D5 (14% of recovered dose was present as metabolites).40,44 In many environmental
biota studies, the D4 concentrations are close to or below the LOQ,3,20 which add an
uncertainty to the evaluation of the biomagnification of D4.
Although the TMFs vary within and between studies and ecosystems for a given chemical
(Table 4), the present study documents a consistent pattern regarding the TMF being > or < 1,
i.e. biomagnification or not, as long as the majority of data are above the quality threshold,
and the organisms included in the estimation reflect a clearly defined food web. The present
results support a consistency in significant D5 TMF above 1 between lakes and years, and
present novel documentation of D6 food web biomagnification above 1 in a pelagic food web
leading to brown trout.

Siloxanes in freshwater food webs – a study of three lakes in Norway | M-81/2013
31
6. Conclusions
The present study from 2012 has confirmed the high cVMS concentrations, and food web biomagnification of D5, in Mjøsa that was reported from 2010. The levels in predatory fish are comparable to those reported for the Inner Oslofjord.
The present study has documented the potential of D5 and D6 to biomagnify in pelagic freshwater food webs (TMF > 1), whereas D4 seems to be subject to trophic dilution (TMF* < 1).
Whereas D5 and D6 concentrations within the pelagic food web were significantly correlated with biomagnifying legacy contaminants (e.g. PCB-153, p,p’-DDE), D4 correlated with neither D5 or D6 nor PCB-153 or p,p’-DDE.
The cVMS levels were highest in Mjøsa, intermediate in Randsfjorden, and below limit of quantification in most samples in Femunden.
cVMS were quantified in grab samples of WWTP effluent, while D5 and D6 were quantified in surface sediments from Mjøsa and Randsfjorden. The surface sediments from Randsfjorden and Mjøsa showed high spatial variation in cVMS concentrations, with highest concentrations near Brandbu and Gjøvik, respectively.
Due to the large difference in cVMS levels between the lakes, the presence of cVMS in effluent water, and the large spatial variation in cVMS concentrations within the lakes with WWTPs, local sources rather than long range atmospheric transport, are the likely major sources of cVMS to the lakes,.

Siloxanes in freshwater food webs – a study of three lakes in Norway | M-81/2013
32
7. References
(1) Howard, P. H.; Muir, D. C. G., Identifying new persistent and bioaccumulative
organics among chemicals in commerce. Environmental Science & Technology 2010, 44, 2277-
2285.
(2) Norden, Siloxanes in the Nordic Environment. TemaNord 2006, 2005:593, 92.
(3) Kierkegaard, A.; van Egmond, R.; McLachlan, M. S., Cyclic volatile methylsiloxane
bioaccumulation in flounder and ragworm in the Humber Estuary. Environmental Science &
Technology 2011, 45, 5936-5942.
(4) Warner, N. A.; Evenset, A.; Christensen, G.; Gabrielsen, G. W.; Borga, K.; Leknes, H.,
Volatile siloxanes in the European Arctic: assessment of sources and spatial distribution.
Environmental Science & Technology 2010, 44, 7705-7710.
(5) Kierkegaard, A.; Bignert, A.; McLachlan, M. S., Cyclic volatile methylsiloxanes in fish
from the Baltic Sea. Chemosphere 2013, 93, 774-778.
(6) Brooke, D. N.; Crookes, M. J.; Gray, D.; Robertson, S., Risk Assessment
Report:Decamethylcyclopentasilicone. Environment Agency of England and Wales, Bristol,
UK. 2009.
(7) Brooke, D. N.; Crookes, M. J.; Gray, D.; Robertson, S., Risk Assessment Report:
Octamethylcyclotetrasilicone. Environment Agency of England and Wales, Bristol, UK. 2009.
(8) Brooke, D. N.; Crookes, M. J.; Gray, D.; Robertson, S., Risk Assessment Report:
Dodecamethylcyclohexasilicone. Environment Agency of England and Wales, Bristol, UK.
2009.
(9) Kierkegaard, A.; Adolfsson-Erici, M.; McLachlan, M. S., Determination of cyclic
volatile methylsiloxanes in biota with a purge and trap method. Analytical Chemistry 2010,
82, 9573-9578.
(10) McGoldrick, D. J.; Durham, J.; Leknes, H.; Kierkegaard, A.; Gerhards, R.; Powell, D.
E.; McLachlan, M. S., Assessing inter-laboratory comparability and limits of determination for
the analysis of cyclic volatile methyl siloxanes in whole Rainbow Trout (Oncorhynchus
mykiss). Chemosphere 2011, 85, 1241-1247.
(11) Whelan, M. J.; Breivik, K., Dynamic modelling of aquatic exposure and pelagic food
chain transfer of cyclic volatile methyl siloxanes in the inner Oslofjord. Chemosphere 2013,
93, 794-804.
(12) McLachlan, M. S.; Kierkegaard, A.; Hansen, K. M.; van Egmond, R.; Christensen, J. H.;
Skjoth, C. A., Concentrations and Fate of Decamethylcyclopentasiloxane (D(5)) in the
Atmosphere. Environmental Science & Technology 2010, 44, 5365-5370.
(13) Gobas, F. A. P. C.; de Wolf, W.; Burkhard, L. P.; Verbruggen, E.; Plotzke, K.,
Revisiting Bioaccumulation Criteria for POPs and PBT Assessments. Integrated Environmental
Assessment and Management 2009, 5, 624–637.
(14) Burkhard, L.; Arnot, J.; Embry, M.; Farley, K.; Hoke, R.; Kitano, M.; Leslie, H.;
Lotufo, G.; Parkerton, T.; Sappington, K.; Tomy, G.; Woodburn, K., Comparing Laboratory
and Field Measured Bioaccumulation Endpoint. Integr Environ Assess Manag 2012, 8, 17-31.
(15) Borgå, K.; Kidd, K. A.; Muir, D. C. G.; Berglund, O.; Conder, J. M.; Gobas, F. A. P. C.;
Kucklick, J.; Malm, O.; Powell, D. E., Trophic Magnification Factors: Considerations of
Ecology, Ecosystems, and Study Design. Integrated Environmental Assessment and
Management 2012, 8, 64−84.
(16) Xu, S.; Kropscott, B., Method for simultaneous determination of partition coefficients
for cyclic volatile methylsiloxanes and dimethylsilanediol. Analytical Chemistry 2012, 84,
1948-1955.
(17) Burkhard, L. P.; Borgå, K.; Powell, D. E.; Leonards, P.; Muir, D. C. G.; Parkerton, T.
F.; Woodburn, K. B., Improving the quality and scientific understanding of trophic
magnification factors (TMFs). Environmental Science & Technology 2013, 47, 1186–1187.
(18) Conder, J. M.; Gobas, F. A. P. C.; Borgå, K.; Muir, D. C. G.; Powell, D. E.,
Characterizing bioaccumulative potential of chemicals using trophic magnification factors and
related measures. Integr Environ Assess Manag 2012, 8, 85−97.

Siloxanes in freshwater food webs – a study of three lakes in Norway | M-81/2013
33
(19) REACH, Registration, Evaluation, Authorisation and Restriction of Chemicals (REACH).
EC)1907/2006 2006, http://eur-
lex.europa.eu/LexUriServ/LexUriServ.do?uri=OJ:L:2006:396:0001:0849:EN:.
(20) Borgå, K.; Fjeld, E.; Kierkegaard, A.; McLachlan, M. S., Food web accumulation of
cyclic siloxanes in Lake Mjøsa, Norway. Environmental Science & Technology 2012, 46, 6347-
6354.
(21) Powell, D. E.; Woodburn, K. B.; Drottar, K.; Durham, J.; Huff, D. W., Trophic dilution
of cyclic volatile methysiloxanes (cVMS) materials in a temperate
freshwater lake. 2009, Final Report, Dow Corning, HES study no 10771-108. , 61 p.
http://www.epa.gov/oppt/tsca8e/pubs/8ehq/2010/feb10/8ehq_0210_17834a.pdf.
Accessed December 19th 2011.
(22) Powell, D. E.; Durham, J.; Huff, D. W.; Böhmer, T.; Gerhards, R.; Koerner, M.,
Bioaccumulation and trophic transfer of cyclic volatile methylsiloxane (cVMS) materials in the
aqiuatic marine food webs of the inner and outer Oslofjord, Norway. 2010, Final Report, Dow
Corning, HES study no 11060-108. , 40 p.
http://www.epa.gov/oppt/tsca8e/pubs/8ehq/2010/feb10/8ehq_0210_17834a.pdf. Accessed
December 19 2011.
(23) Kaj L; Andersson J; Palm Cousins A; Remberger M; Brorström-Lundén E; I, C., Results
from the Swedish National Scrrening Programme 2004. Subreport 4: Siloxanes. IVL report
B1643 2005, 39.
(24) Kierkegaard, A.; Bignert, A.; McLachlan, M. S., Bioaccumulation of
decamethylcyclopentasiloxane in perch in Swedish lakes. Chemosphere 2013, 93, 789-793
(25) Taugbøl, T.; Aass, P., Ørretfiske i Mjøsa: Fangsrapportering 1977-1991 (Trout fishing
in Mjøsa: catch report 1977-1992). Rapport Fylkesmannen i Oppland, miljøvernavdelinga
(Report County governor in Oppland, environmental division) 1992, 11, 21 pp.
(26) Centre, I. W. P. ICP Waters Programme Manual 2010; NIVA: 2010; p 91.
(27) Sørmo, E. G.; Jenssen, B. M.; Lie, E.; Skaare, J. U., Brominated flame retardants in
aquatic organisms from the North Sea in comparison with biota from the high Arctic marine
environment. Environ. Toxicol. Chem. 2009, 28, 2082-2090.
(28) Allan, I. J.; Ranneklev, S. B., Occurrence of PAHs and PCBs in the Alna River, Oslo
(Norway). Journal of Environmental Monitoring 2011, 13, 2420-2426.
(29) EPA, method TO-10A. www.epa.org.
(30) Schlechtriem, C.; Fliedner, A.; Schäfers, C., Determination of lipid content in fish
samples from bioaccumulation studies: contributions to the revision of guideline OECD 305.
Environmental Sciences Europe 2012, 24, 1-7.
(31) Fjeld, E.; Enge, E. K.; Rognerud, S.; Rustadbakken, A.; Løvik, J. E., Environmental
contaminants in fish and zooplankton from Lake Mjøsa, 2010. Climate and Pollution Agency
Klif Report 2011, TA-2774/2011, 59.
(32) Schlabach, M.; Andersen, M. S.; Green, N.; Schøyen, M.; Kaj, L., Siloxanes in the
Environment of the Inner Oslofjord. . Report TA-2269/2007; 2007, http://www.klif.no/
publikasjoner/2269/ta2269.pdf.
(33) Fjeld, E.; Enge, E. K.; Rognerud, S.; Rustadbakken, A.; Løvik, J. E., Environmental
contaminants in fish and zooplankton from Lake Mjøsa, 2011. Climate and Pollution Agency
(Klif) Report TA-2889/2012 2012, 63 p.
(34) Fjeld, E., Miljøgifter i fisk fra Randsfjorden, 1998. Kvikksølv og klororganiske
forbindelser. . Norsk institutt for vannforskning (NIVA). 1999, Rapport l. nr OR-4073, 29 p.
(35) Fjeld, E.; Rognerud, S.; Enge, E. K.; Borgen, A. R.; Dye, C., Tilførsler av miljøgifter til
Mjøsa via kommunale renseanlegg og elver 2006. Climate and Pollution Agency (Klif) Report
TA-2270/2007 2007, 93 pp.
(36) Genualdi, S.; Harner, T.; Cheng, Y.; MacLeod, M.; Hansen, K. M.; van Egmond, R.;
Shoeib, M.; Lee, S. C., Global Distribution of Linear and Cyclic Volatile Methyl Siloxanes in
Air. Environmental Science & Technology 2011, 45, 3349-3354.
(37) Krogseth, I. S.; Kierkegaard, A.; McLachlan, M. S.; Breivik, K.; Hansen, K. M.;
Schlabach, M., Occurrence and seasonality of cyclic volatile methyl siloxanes in Arctic air.
Environmental Science & Technology 2013, 47, 502-509.
(38) Vinni, M.; Lappalainen, J.; Malinen, T.; Peltonen, H., Seasonal bottlenecks in diet
shifts and growth of smelt in a large eutrophic lake. J. Fish Biol. 2004, 64, 567-579.

Siloxanes in freshwater food webs – a study of three lakes in Norway | M-81/2013
34
(39) Nielsen, P. S.; Brittain, J. E.; Saltveit, S. J.; Brabrand, A., Randsfjorden:
Undersøkelse og vurdering av fiskeribiologiske forhold. Rappprt Laboratorium for
ferskvannsøkologi og- innlandsfiske (LFI), Zoologisk Museum, Universitetet i Oslo, Norge
1985, 79, 70 pp.
(40) (ECHA), E. C. A., D4 PBT/vPvB Evaluation. 2012, 141 pp.
http://echa.europa.eu/documents/10162/13628/decamethyl_pbtsheet_en.pdf.
(41) Houde, M.; Muir, D. C. G.; Kidd, K. A.; Guildford, S.; Drouillard, K.; Evans, M. S.;
Wang, X. W.; Whittle, D. M.; Haffner, D.; Kling, H., Influence of lake characteristics on the
biomagnification of persistent organic pollutants in lake trout food webs. Environ. Toxicol.
Chem. 2008, 27, 2169-2178.
(42) Law, K.; Halldorson, T.; Danell, R.; Stern, G.; Gewurtz, S.; Alaee, M.; Marvin, C.;
Whittle, M.; Tomy, G., Bioaccumulation and trophic transfer of some brominated flame
retardants in a Lake Winnipeg (Canada) food web. Environ. Toxicol. Chem. 2006, 25, 2177-
2186.
(43) Schlabach, M.; Breivik, K.; Fjeld, E.; Hirdmann, D.; Pfaffhuber, K. A.; Stohl, A.,
Atmospheric transport of environmental pollutants to Lake Mjøsa. NILU report OR 47/2009
2009, 86pp.
(44) (ECHA), E. C. A., D5 PBT/vPvB Evaluation. 2012, 141 pp.
http://echa.europa.eu/documents/10162/13628/decamethyl_pbtsheet_en.pdf.
(45) Arnot, J. A.; Mackay, D.; Parkerton, T. F.; Bonnell, M., A database of fish
biotransformation rates for organic chemicals. Environ. Toxicol. Chem. 2008, 27, 2263-2270.

Siloxanes in freshwater food webs – a study of three lakes in Norway | M-81/2013
35
8. Supporting information
CHAPTERS Lake description 36 Sampling description 42 Chemical analysis 43 Results 54 TABLES Table S 1 Sampling dates, Mjøsa, Randsfjorden and Femunden 36 Table S 2 Water content and lipid content of zooplankton samples 42 Table S 3
Concentrations* of 13C labeled cVMS in standards of 13C labeled D5 and D6 before and after having been submitted to the cleanup procedure
45
Table S 4 Quotient of D5 in the second and first extracts of biota samples 47 Table S 5
Recovery of cVMS surrogate standards from the analysed samples (mean ± std dev in %).
47
Table S 6 Results of the analyses of the matrix control samples 48 Table S 7
Comparison of the method with ENV cleanup used in this paper with a reference method involving direct injection of the raw extract; duplicate analyses of 7 different sediments
49
Table S 8
Limit of quantification (LOQ) for a) biota samples, based on mean procedural blanks + 10 x standard deviation (SD), and b) sediment samples, based on maximum concentration measured in reference sediments from Randsfjorden x 3. The reference sediment was sampled 40-42 cm deep in the sediment core
50
Table S 9
Analytical uncertainty for a) sediment, with SRM 1944 as reference material and b) fish muscle with HSD8 as reference material.
52
Table S 10
Lipid quantification results in the the Quasimeme test programme.Z-score ≤ │2│ is acceptable.
53
Table S 11
cVMS measured in A) Lake Mjøsa B) Lake Randsfjorden and C) Lake Femunden. Biota (ng/g ww), sediments (ng/g dw), effluent water (ng/L) and filtered particles from the water (ng/L), and their respective field blanks or reference material
54
Table S 12
Percentage (%) samples in the pelagic food web of Mjøsa and Randsfjorden, that were quantified below the limit of quantification (LOQ) for cyclic volatile methylsiloxanes (D4, D5, D6), or limit of detection (LOD) for PCBs, ppDDE and PBDEs.
59
Table S 13
Trophic magnification factor (TMF) statistics for cyclic volatile methylsiloxanes (D4, D5, D6) and selected legacy chlorinated and brominated contaminants in the Lakes Mjøsa [M] and Randsfjorden [R]. TMFs are based on the regression of lipid normalised concentrations onto trophic level (TL) estimated from stable isotopes of nitrogen.
60
Table S 14
Product-moment correlation coefficients (r: left triangular matrix) between trophic position (TL), and log-transformed concentrations of cVMS and selected legacy contaminants in the pelagic food web in a) Mjøsa and b) Randsfjorden
63

Siloxanes in freshwater food webs – a study of three lakes in Norway | M-81/2013
36
Lake description
The primary research lake, Lake Mjøsa is Norway’s largest lake (Table 1. , Figure 2), with a
species rich fish community and a well defined pelagic food web leading to brown trout
(Salma trutta) as the top predator, smelt (Osmerus eperlanus) and vendace (Coregonus
albula) as primary plantivorous prey, and an invertebrate community consisting of
cladocerans, copepods and Mysis relicta.
There are no other lakes in Norway with an identical food web and human impact from
agriculture, industry and the general population. Ecologically, Lake Randsfjorden wich is
Norway’s 4th largest lake, is the lake with most similarities to Mjøsa. Randsfjorden is a deep
fjordlake with a well-defined pelagic food web with brown trout and arctic char (Salvelinus
alpinus) as top predators, and whitefish (Coregonus lavaretus) and smelt as planktivorous
prey. In contrast to Lake Mjøsa, the invertebrate community lacks Mysis relicta.
As a reference site, the remote Lake Femunden, Norway’s third largest lake was selected as it
is in the wilderness. Femunden’s main basin is deep with a pelagic fish community of brown
trout, arctic char and whitefish. Mysis relicta is not found in the invertebrate community.
Table S 1. Sampling dates, Mjøsa, Randsfjorden and Femunden
Vial ID Species Tissue/Matrix Date
sampled
Notes
MJØSA
S-1 Mysis whole body,
pooled ind.
2 August Gillundstranda
S-2 Mysis whole body,
pooled ind.
2 August Gillundstranda
S-3 Mysis whole body,
pooled ind.
2 August Gillundstranda
S-4 Zooplankton hypo whole body,
pooled ind.
2 August Gillundstranda
S-5 Zooplankton hypo whole body,
pooled ind.
2 August Gillundstranda
S-6 Zooplankton hypo whole body,
pooled ind.
2 August Gillundstranda
S-7 Zooplankton hypo whole body,
pooled ind.
2 August Gillundstranda
S-8 Zooplankton hypo whole body,
pooled ind.
2 August Gillundstranda
S-9 Zooplankton epi whole body,
pooled ind.
3 August Gillundstranda
S-10 Zooplankton epi whole body,
pooled ind.
3 August Gillundstranda
S-11 Zooplankton epi whole body, 3 August Gillundstranda

Siloxanes in freshwater food webs – a study of three lakes in Norway | M-81/2013
37
pooled ind.
S-12 Zooplankton epi whole body,
pooled ind.
3 August Gillundstranda
S-13 Zooplankton epi whole body,
pooled ind.
3 August Gillundstranda
B-1 Mysis whole body,
pooled ind.
21 August Gillundstranda
B-2 Zooplankton hypo whole body,
pooled ind.
21 August Gillundstranda
B-3 Mysis whole body,
pooled ind.
21 August Gillundstranda
B-4 Zooplankton hypo whole body,
pooled ind.
21 August Gillundstranda
B-5 Zooplankton epi whole body,
pooled ind.
21 August Gillundstranda
M-14 Mysis-1 whole body,
pooled ind.
6 July Gillundstranda
L-1 Vendace skin free filet 3 July Gillundstranda
L-2 Vendace skin free filet 3 July Gillundstranda
L-3 Vendace skin free filet 3 July Gillundstranda
L-4 Vendace skin free filet 3 July Gillundstranda
L-6 Vendace skin free filet 3 July Gillundstranda
L-7 Vendace skin free filet 3 July Gillundstranda
L-8 Vendace skin free filet 3 July Gillundstranda
K-1 Smelt skin free filet,
homogenate 6
ind.
6 July Gillundstranda
K-2 Smelt skin free filet,
homogenate 6
ind.
6 July Gillundstranda
K-3 Smelt skin free filet,
homogenate 6
ind.
6 July Gillundstranda
K-4 Smelt skin free filet,
homogenate 6
ind.
6 July Gillundstranda
K-5 Smelt skin free filet,
homogenate 6
ind.
6 July Gillundstranda

Siloxanes in freshwater food webs – a study of three lakes in Norway | M-81/2013
38
K-7 Smelt skin free filet 7 September Ottestad
K-8 Smelt skin free filet 7 September Ottestad
K-9 Smelt skin free filet 13
September
Ottestad
K-10 Smelt skin free filet 13
September
Ottestad
K-11 Smelt skin free filet 13
September
Ottestad
MS-1 Whitefish skin free filet 3 July Gillundstranda
MS-2 Whitefish skin free filet 3 July Gillundstranda
MS-3 Whitefish skin free filet 3 July Gillundstranda
MS-4 Whitefish skin free filet 3 July Gillundstranda
MS-6 Whitefish skin free filet 3 July Gillundstranda
MT-1 Brown trout skin free filet 29 August Gjøvik
MT-2 Brown trout skin free filet 29 August Gjøvik
MT-3 Brown trout skin free filet 29 August Gjøvik
MT-4 Brown trout skin free filet 29 August Gjøvik
MT-5 Brown trout skin free filet 29 August Gjøvik
A-1 Perch skin free filet 3 July Gillundstranda
A-2 Perch skin free filet 3 July Gillundstranda
A-3 Perch skin free filet 3 July Gillundstranda
A-4 Perch skin free filet 3 July Gillundstranda
A-5 Perch skin free filet 3 July Gillundstranda
A-6 Perch skin free filet 3 July Gillundstranda
Lake-1 Burbot Liver and filet 5 July Gillundstranda
Lake-2 Burbot Liver and filet 5 July Gillundstranda
Lake-3 Burbot Liver and filet 5 July Gillundstranda
Lake-4 Burbot Liver and filet 5 July Gillundstranda
Lake-5 Burbot Liver and filet 5 July Gillundstranda
Lake-6 Burbot Liver and filet 5 July Gillundstranda
MJ-1 PUF Water dissolved 03 September Gillundstrand
a
MJ-2 PUF Water dissolved 03 September Gillundstrand

Siloxanes in freshwater food webs – a study of three lakes in Norway | M-81/2013
39
a
MJ-3 PUF Water dissolved 03 September Gillundstrand
a
MF-1 Filter Water particle 3 September Gillundstranda
MF-2 Filter Water particle 3 September Gillundstranda
MF-3 Filter Water particle 3 September Gillundstranda
Msed-1 Sediment Sediment 3 September Gillundstranda
Msed-2 Sediment Sediment 5 September Ottestad
Msed-3 Sediment Sediment 5 September Lillehammer
Msed-4 Sediment Sediment 5 September Lillehammer
Msed-5 Sediment Sediment 5 September Lillehammer
Msed-6 Sediment Sediment 5 September Gjøvik
Msed-7 Sediment Sediment 5 September Gjøvik
WTP-1 Effluent water grab
sample
Effluent water 21 August Hias
(Ottestad)
WTP-2 Effluent water grab
sample
Effluent water 21 August Rambekk
(Gjøvik)
WTP-3 Effluent water grab
sample
Effluent water 21 August Lillehammer
RANDSFJORDEN
R1 zooplankton
epilimnion
whole body,
pooled ind.
27-29 August
R3 zooplankton
epilimnion
whole body,
pooled ind.
27-29 August
R4 zooplankton
epilimnion
whole body,
pooled ind.
27-29 August
R5 zooplankton
epilimnion
whole body,
pooled ind.
27-29 August
R6 zooplankton
hypolimnion
whole body,
pooled ind.
27-29 August
R7 zooplankton
hypolimnion
whole body,
pooled ind.
27-29 August
R8 zooplankton
hypolimnion
whole body,
pooled ind.
27-29 August

Siloxanes in freshwater food webs – a study of three lakes in Norway | M-81/2013
40
R9 zooplankton
hypolimnion
whole body,
pooled ind.
27-29 August
R11 Smelt skin free filet 27-29 August
R12 Smelt skin free filet 27-29 August
R14 Smelt skin free filet 27-29 August
R15 Smelt skin free filet 27-29 August
R16 Smelt skin free filet 27-29 August
R17 Whitefish skin free filet 27-29 August
R18 Whitefish skin free filet 27-29 August
R19 Whitefish skin free filet 27-29 August
R20 Whitefish skin free filet 27-29 August
R21 Whitefish skin free filet 27-29 August
R22 Whitefish skin free filet 27-29 August
R23 Whitefish skin free filet 27-29 August
R24 Whitefish skin free filet 27-29 August
R25 Whitefish skin free filet 27-29 August
R36 Brown trout skin free filet 27-29 August
R37 Brown trout skin free filet 27-29 August
R38 Brown trout skin free filet 27-29 August
R39 Brown trout skin free filet 27-29 August
R40 Brown trout skin free filet 27-29 August
RS-26 Sediment Sediment 30 August Jevnaker
RS-27 Sediment Sediment-
reference
30 August Jevnaker
RS-28 Sediment Sediment 30 August Jevnaker
RS-29 Sediment Sediment 30 August Brandbu
RS-30 Sediment Sediment 30 August Brandbu
RS-31 Sediment Sediment 30 August Fluberg
RS-32 Sediment Sediment 30 August Fluberg
RS-33 Sediment Sediment-
reference
30 August Fluberg
WTP-4 Effluent water Effluent water 21 August Brandbu -1

Siloxanes in freshwater food webs – a study of three lakes in Norway | M-81/2013
41
WTP-5 Effluent water Effluent water 21 August Jevnaker-1
WTP-6 Effluent water Effluent water 21 August Dokka - 2
FEMUNDEN
F2 Zooplankton epi whole body,
pooled ind.
8-9 August
F3 Zooplankton epi whole body,
pooled ind.
8-9 August
F4 Zooplankton epi whole body,
pooled ind.
8-9 August
F5 Zooplankton epi whole body,
pooled ind.
8-9 August
F6 Zooplankton epi whole body,
pooled ind.
8-9 August
F7 Sediments Sediment 8-9 August
F8 Sediments Sediment 8-9 August
F10 Sediments Sediment 8-9 August
F12 Whitefish skin free filet 8-9 August
F13 Whitefish skin free filet 8-9 August
F14 Whitefish skin free filet 8-9 August
F15 Whitefish skin free filet 8-9 August
F16 Whitefish skin free filet 8-9 August
F17 Whitefish skin free filet 8-9 August
F19 Arctic char skin free filet 8-9 August
F20 Arctic char skin free filet 8-9 August
F21 Arctic char skin free filet 8-9 August
F22 Arctic char skin free filet 8-9 August
F23 Arctic char skin free filet 8-9 August
F24 Arctic char skin free filet 8-9 August
F25 Arctic char skin free filet 8-9 August
F26 Brown trout skin free filet 8-9 August

Siloxanes in freshwater food webs – a study of three lakes in Norway | M-81/2013
42
F27 Brown trout skin free filet 8-9 August
F28 Brown trout skin free filet 8-9 August
F29 Brown trout skin free filet 8-9 August
F30 Brown trout skin free filet 8-9 August
F31 Brown trout skin free filet 8-9 August
Sampling description
Zooplankton from the epilimnion and from the hypolimnion were collected by horizontal
trawling at separate depths above and below the thermocline (zooplankton net 250 µm Nylon
single strand, custom made at the Norwegian Institute for Water Research (NIVA), with brass
cup and brass mesh). In Mjøsa, Mysis relicta was picked with tweezers from the hypolimnion
trawls. Mysis and zooplankton contaminant analysis were kept in preheated glass jars, and
material for stable isotopes was wrapped in aluminum foil. Some of the zooplankton material
was difficult to concentrate (i.e. filter off all water), thus some samples contained more
water, leading to a higher estimate of water content (Table S 2).
Table S 2. Water content and lipid content of zooplankton samples
Species Vial ID Sample weight (g) Dry weight % Lipid %
MJØSA
Zooplankton epilimnion S-13 5.2 6.2 0.76
Zooplankton epilimnion B-5 54.7 4.9 0.59
Zooplankton hypolimnion B-2 16.8 13 6.2
Zooplankton hypolimnion S-8 5.8 5.7 1.3
Zooplankton hypolimnion B-4 24.4 14 7.4
Mysis relicta S-3 2.4 11 2.1
Mysis relicta B-1 18.2 13 3.4
Mysis relicta B-3 21.0 13 4.1
Mysis relicta M-14 7.3 6.6 0.99
RANDSFJORDEN
Zooplankton epilimnion R1 27.0 6.0 0.76
Zooplankton epilimnion R3 44.0 4.8 0.67
Zooplankton epilimnion R4 19.9 6.75 0.80
Zooplankton epilimnion R5 33.1 6.0 0.67
Zooplankton hypolimnion R6 13.3 2.4 0.73
Zooplankton hypolimnion R7 16.0 3.6 1.85
Zooplankton hypolimnion R8 27.2 1.28 0.23
Zooplankton hypolimnion R9 29.7 4.33 2.37

Siloxanes in freshwater food webs – a study of three lakes in Norway | M-81/2013
43
In Lake Mjøsa, vendace and small smelt were collected with gill nets in the surface waters,
whereas perch, whitefish, burbot and larger smelt were collected in gill nets deployed at
deeper waters. In Randsfjorden, smelt were collected with gill nets in the surface waters,
and whitefish was collected from large traps used for commercial fishing. Brown trout from
Mjøsa and Randsfjorden, and arctic char from Femunden, was fished by angling by local
fishermen according to specific protocol and instruction by NIVA. In Femunden, whitefish and
brown trout were collected with pelagic gill nets, by local fishers according to specific
protocol and instruction by NIVA. All Femunden fish were immediately wrapped in aluminium
foil and sealed polyethylene bags, and stored cooled until dissected back on land. From Lake
Mjøsa, some benthopelagic species (perch (Perca fluviatilis), burbot (Lota lota), whitefish
(not primarily a member of the pelagic food web as it is in Lake Randsfjorden and Lake
Femunden) were sampled to allow comparison between fish feeding from different carbon
sources (benthic versus pelagic). Only brown trout larger than 30 cm were included, to ensure
fish-feeding specimens.
In Mjøsa, high volume water samples (n=3; 191 L, 237.6 L, 237.8 L) were collected using a
pre-programmed in situ water sampler at ca 15 m depth (Figure 2). The in situ water sampler
was custom made for NIVA, and includes a filter holder in stainless steel for collection of the
particulate phase (for analysis of cVMS in the present study) and a chamber for polyurethan
foam (PUFs) for collection of the water dissolved fraction (for analysis of PCBs in the present
study). Glassfibre filters (GFF, 29.9 cm, 1 µm pore size) were purchased from Chongqing
Zaisheng Technology Development Co., Ltd, and PUFs were purchased as polyurethan foam
from Gumotex and cleaned with solvents at the Research Center for Toxic Compounds in the
Environment (RECETOX).
Grab samples of effluent water were sampled during the same day (from 8 am to 3 pm
Tuesday August 21st 2012) direclty from the outlet drain of WWTPs in Lake Mjøsa and Lake
Randsfjorden (Table 3). It was heavy rainfall on Monday August 20th, whereas August 21st was
sunny with little/no rainfall. Effluent water was sampled directly from the outlet drain by
trained personnel at the WWTPs instructed by NIVA personnel regarding sampling precautions.
In Randsfjorden, the effluent was collected directly onto the clean glass bottles (2.5 L), and
in Mjøsa the water was transferred to the glass bottle using a clean beaker of stainless steel.
Aluminum foil sealed the bottle under the cap. The samples were stored cooled until analysis
at ITM. Two bottles were collected from each plant, and were pooled into one sample (5 L) in
the laboratory.
Chemical analysis
cVMS analysis - Method Description
Fish. About 10 g of tissue (1 g for three of the fish liver samples) was weighed into 50 mL
centrifuge tubes. After addition of 20 mL of dichloromethane (DCM) (Lichrosolve, Merck,
Germany) and 60 uL of the surrogate standard solution (containing 13C labeled D4, D5, and
D6), the tubes were closed with aluminum foil under the lid and left to stand overnight in the
clean air cabinet. The tissue was homogenized with an ultra turrax and centrifuged for 10 min
at 2200 rpm. This resulted in 3 phases, with DCM at the bottom, fish homogenate in the
middle, and water on the top. The water phase was decanted and discarded. The homogenate
was punctured and the DCM extract was transferred to a 250 mL Erlenmeyer flask containing
16-21 g of glass beads (diameter 4 mm, Marienfeld, Germany) and a magnetic stir bar. For the
procedural blanks, 75-200 mg of corn oil was also added to simulate the sample matrix. A gas
washing bottle stopper was placed on the flask. The inlet port of the stopper was connected
to a nitrogen gas supply, which was equipped with purification cartridges containing ENV+ to
remove any traces of cVMS. The outlet port of the stopper was connected to a sorbent
cartridge. The 1mL plastic cartridges were manually filled with 10-15 mg of Isolute ENV+
packed between 2 PE frits (all from Biotage AB, Sweden). After the first 4 extractions the PE
frits were identified as a source of D6 contamination. The frits were from that point stored in
DCM and repeatedly ultrasonicated and rinsed with DCM prior to use and the lower frit was

Siloxanes in freshwater food webs – a study of three lakes in Norway | M-81/2013
44
replaced with glass wool.. The cleanup of the extract was started by turning on the magnetic
stirrer and purging the flask with N2 at a flow rate of 200-300 mL/min until the solvent was
fully evaporated (2.5-3 h). Then the heating element of the magnetic stirrer (5 positions,
IKAMAG, Germany) was set to maximum, giving a flask wall temperature of ~72 °C, and
purging was continued for a further 2 h. The sorbent cartridge was removed and eluted with
0.8 mL hexane. Tetrakis(trimethylsiloxy)silane, M4Q, was added as a volumetric standard,
and the cVMS were analysed by GC/MS as described in Kierkegaard et al. (2010).
Zooplankton and Mysis. Sub-samples were transferred from the sample jar to two 50 mL
centrifuge tubes using a spoon, stirring the sample jar between each spoonful, and
alternating between centrifuge tubes. Surrogate standard solution and 20 mL of DCM were
added and the tubes were ultrasonicated for 2*15 min, mixing the tubes between the
sonications. The tubes were centrifuged, the water discarded, and the DCM transferred to
Erlenmeyer flasks. The extraction was then repeated with another 15 mL of DCM. The
extracts were cleaned up and analysed in the same manner as the fish samples.
Sediment. The sediment was weighed after centrifugation and the water discarded. An
aliquot (2-3 g) of the centrifuged wet weight was taken for dry weight determination. The
remaining sediment was weighed and 15 mL acetone, 3 mL DCM and the surrogate standard
solution were added. The tube was ultrasonicated for 2*15 min with thorough mixing between
the sonications, centrifuged, and the organic phase was transferred to a new tube. The
procedure was repeated with 10 mL acetone and 5 mL DCM. The organic phases were
combined and mixed with 20 mL of MilliQ water containing 1% NaCl. After centrifugation the
DCM phase was transferred to a 250 mL Erlenmeyer flask and the acetone/water phase was
reextracted with another 5 mL DCM. The DCM extract was cleaned up and analysed in the
same manner as the fish samples.
As part of the quality assurance program, 9 sediment samples were solvent extracted and
analysed without cleanup. About 10 g dewatered sediment was ultrasonicated (2*15 min) in a
centrifuge tube with 15 ml acetone, 2 mL n-hexane and the surrogate standards. The organic
phase was transferred to a new centrifuge tube and the extraction repeated with 6.5 mL
acetone plus 2 ml n-hexane and 15 min ultrasonification. 15 mL of 2% NaCl in MilliQ water was
added to the combined extract. The hexane phase was transferred to a GC vial and analyzed
by GC/MS.
Suspended particulate material. The damp filters were extracted with 80 mL DCM in a 250 mL
Erlenmeyer flask employing ultrasonification for 3*15 min. The extraction was repeated with
50 mL DCM (2*15 min). The combined DCM extract was cleaned up and analysed in the same
manner as the fish samples with the only exception that the extract was evaporated
overnight.
STP effluent. The effluent samples were stored at 4 °C in fully filled 2.5 L brown glass bottles
until analysis. Before analysis 250 mL of the effluent water was replaced by 250 mL DCM
containing the surrogate standards dissolved in ethyl acetate. The bottle was vigorously
stirred with a magnetic stir bar overnight, after which it was allowed to stand for 1 h. 25 g of
NaCl was added and the bottle was slowly stirred for 30 min. Most of the water was decanted
and discarded. The bottle was shaken with the remaining water/DCM fraction, which was
then transferred to a 250 mL flask. Following phase separation (emulsions were centrifuged),
the DCM phase was transferred to a 500 mL Erlenmeyer flask. The DCM extract was cleaned
up and analysed in the same manner as the fish samples, but with a higher N2 flow ( 350
mL/min) and a sorbent cartridge with more ENV+ (25 mg). The procedural blank consisted of
2.5 L of MilliQ water and 36 mg of corn oil.
Field blanks. The pouches were transferred to a glass tube. 1.5 mL of n-hexane and the
surrogate standard solution were added. The tube was mixed with a vortex mixer for about 15
s. The n-hexane was transferred to a GC vial and analyzed.

Siloxanes in freshwater food webs – a study of three lakes in Norway | M-81/2013
45
Method Evaluation and QA/QC
cVMS formation. It has previously been shown that D5 can be transformed into D4 and D3
during sampling out of the gas phase onto ENV+ (Krogseth et al., 2013). To test whether this
was occurring, two blank samples with 100 mg of corn oil were analysed in which the
surrogate standard solution of 13C labeled D4, D5 and D6 was replaced with a single 13C
labeled cVMS: 13C-D5 for one of the blank samples and 13C-D6 for the other. After these
standards were added to the extraction solvent and submitted to the sample cleanup, they
were quantified against the volumetric standard M4Q. The results showed that there was a
high recovery of the labeled D5 and D6 and no evidence for the formation of 13C labeled D4,
D5, or D6 during the sample cleanup procedure (Table S 3).
Table S 3. Concentrations* of 13C labeled cVMS in standards of 13C labeled D5 and D6
before and after having been submitted to the cleanup procedure.
13CD4 13CD5 13CD6 13CD5 before cleanup 0.002 1.025 0.000 13CD5 after cleanup 0.001 0.916 0.000 13CD6 before cleanup 0.003 0.002 0.330 13CD6 after cleanup 0.003 0.002 0.310
*Concentration approximated as the peak area of the analyte normalized to that of the
volumetric standard (M4Q).
Extraction efficiency. Extraction efficiency was assessed in two manners. First the effect of
extending the second (heated) phase of the purge and trap cleanup was studied. Two smelt
samples were extracted and subjected to the cleanup. However, instead of using one ENV+
cartridge on the outlet of the Erlenmeyer flask, the cartridge was exchanged, first after the
end of the solvent evaporation phase, and then at intervals of 30 min, 40 min, 60 min and 30
min during the heating phase. The recovery of the surrogate standards was quantified in each
of the samples. The results showed that no further cVMS were transferred from the extract to
the cartridge after the solvent evaporation phase plus 70 min of the heating phase (see Figure
S 1). On the basis of these results we chose a 2 h duration for the heating phase as more than
sufficient to transfer all of the cVMS from the extract.

Siloxanes in freshwater food webs – a study of three lakes in Norway | M-81/2013
46
Figure S 1. Recovery of the surrogate standards from 2 smelt samples for which 5 sorbent
cartridges were deployed sequentially during the purge and trap cleanup.
The second test of the extraction efficiency was to re-extract 8 biota samples. The same
extraction method was applied, and a second batch of surrogate standard was added to the
solvent used for re-extraction. The results showed that the second extract contained of the
order of 10-20 % of quantity of D5 present in the initial extract (see Table S 4, the results for
D4 and D6 are not shown due to the low levels present in the second extract). A burbot
muscle sample and a zooplankton sample showed higher values (28% and 37% respectively).
The higher value for the zooplankton was attributed to the high water content of the sample,
and it was thus decided to extract all zooplankton and mysis samples twice. The extraction
efficiency of 80-90% for the other samples was judged sufficient. Note that the percent
underestimation of the concentrations due to incomplete extraction is likely to be lower than
suggested by the extraction efficiencies estimated here because the extraction efficiency of
the surrogate standard was also incomplete, e.g. due to residual solvent in the extracted
matrix. If the extraction efficiency of the surrogate standard and the native compound were
the same, then there would be no error in the measured concentration.
Table S 4. Quotient of D5 in the second and first extracts of biota samples
Sample Extract 2/Extract 1
(D5, in %)
Zooplankton epilimnion 37
Mysis 18
Smelt 10
Burbot 1 16
Burbot 3 18
Burbot 4a 21
Burbot 4b 10
Burbot 5 28

Siloxanes in freshwater food webs – a study of three lakes in Norway | M-81/2013
47
Recovery. The recovery of the 13C labeled D4, D5, and D6 surrogate standards was determined
for each sample. High and consistent recoveries were observed for all analytes in almost all
matrices (see Table S 5). The recoveries were higher in the zooplankton and Mysis samples
than in the fish samples, which could be due to the fact that the former were extracted twice
while the fish samples were extracted once. Very variable recoveries were observed for D4 in
sediment. In some samples the recovery approached 100% while in one it was <10%. The
reason for this is unknown. In the 8 samples for which the D4 recovery was <25% the D4
concentration was designated “<” (the matrix control samples showed that when recovery
was low the concentrations were overestimates, see below).
Table S 5. Recovery of cVMS surrogate standards from the analysed samples (mean ± std
dev in %).
Matrix N 13CD4 13CD5 13CD6
Zooplankton/Mysis 19 81±8 81±7 86±14
Fish 85 72±13 71±13 74±13
Sediment 22 50±32 70±11 80±14
Suspended particulate matter 3 87±1 86±1 87±8
Effluent 7 83±11 86±12 90±14
Repeatability. The repeatability of the method was assessed using the matrix control samples
analysed during each round of extractions. The relative standard deviation (RSD) was between
8% and 11% for D5 and D6 in both the sediment and the herring matrices (seeTable S 6). This
is a good result, particularly in light of the low D5 and D6 concentrations in these samples.
The RSD was higher for D4, which can be attributed to the very low levels in the matrix
control samples (a factor of 2 above the LOQ for herring). D4 was below the LOQ in the
sediment.

Siloxanes in freshwater food webs – a study of three lakes in Norway | M-81/2013
48
Table S 6. Results of the analyses of the matrix control samples
D4 D5 D6
Herring (ng/g ww)
N 13 14 14
Mean 0.9 6.8 2.3
standard deviation 0.3 0.7 0.2
RSD 32% 10% 11%
Sediment (ng/g dw)
N 6 6 6
Mean <LOQ 6.9 2.9
standard deviation 0.6 0.2
RSD 8% 8%
Accuracy. Due to the absence of a certified standard reference material for trace analysis of
cVMS, the accuracy was evaluated by comparing the method with existing methods for which
accuracy information is available. The method of Kierkegaard et al. (2010) for analyzing cVMS
in biota has been shown to perform successfully in an interlaboratory comparison (McGoldrick
et al., 2011). This method had also been used to analyze the herring homogenate matrix
control sample used in this study. The means concentrations for D5 (6.0 ng/g ww, n=18) and
D6 (1.7 ng/g ww, n=18) obtained with this method during the year prior to the development
of the new method are in reasonable agreement with the values of 6.8 ng/g ww and 2.3 ng/g
ww obtained with the new method (Table S 7). The somewhat higher mean concentrations
measured with the new method as well as the better repeatability (10 versus 23% and 11
versus 31% for D5 and D6, respectively) may be a reflection of better and more repeatable
extraction with the new method.
For sediment, the method in this study was compared with the direct injection of raw
extracts, a method which we have previously evaluated in an interlaboratory comparison
(Kierkegaard et al., 2013). Seven of the sediments in this study were analysed with both
methods. The results for D5 and D6 are shown in Table S 7; D4 was below the LOQ. No
consistent difference between the methods was observed and the difference between the
results was <25% for 9 of the 14 data pairs.
Table S 7. Comparison of the method with ENV cleanup used in this paper with a
reference method involving direct injection of the raw extract; duplicate analyses of 7
different sediments.
Sediment Method D5 D6
Ottestad 30 m ENV cleanup 5.8 6.2
Raw extract 4.7 4.6
Gjövik 28m ENV cleanup 285 34
Raw extract 395 42
Gjövik 120m ENV cleanup 335 40
Raw extract 358 40
Ottestad 120 m ENV cleanup 0.2 <0.3
Raw extract 2.0 <0.4
Lillehammer, reference ENV cleanup 0.9 < 1.0

Siloxanes in freshwater food webs – a study of three lakes in Norway | M-81/2013
49
Raw extract 1.7 <1.0
Lillehammer 80m
ENV cleanup 26 9.4
Raw extract 25 8.7
Jevnaker, 65 m ENV cleanup 0.99 0.85
Raw extract 1.3 <0.9

Siloxanes in freshwater food webs – a study of three lakes in Norway | M-81/2013
50
Table S 8. Limit of quantification (LOQ) for a) biota samples, based on mean procedural blanks + 10 x standard deviation (SD), and b) sediment samples,
based on maximum concentration measured in reference sediments from Randsfjorden x 3. The reference sediment was sampled 40-42 cm deep in the
sediment core.
a) LOQ for biota samples
D4 D5 D6a
mean
ng SD LOQ, ng mean ng SD LOQ, ng mean ng SD LOQ, ng
Procedural blanks 1-4
4.9 0.8 13
Procedural blanks 5-20
1.0 0.4 5.2
Procedural blanks 1-20 0.50 0.41 4.6 0.42 0.22 2.6
aFor D6 two LOQ were applied (the 4 first extraction rounds were contaminated from a source that was later identified)
b) LOQ for sediment samples
ng D4 ng D4/g dw LOQ ng/g dw ng D5 ng D5/g dw LOQ ng/g dw ng D6 ng D6/g dw LOQ ng/g dw
sediment, Fluberg, reference RS33 < 13 < 1.4 4.2 1.8 0.2 0.6 2.0 0.2 0.6
sediment, Jevnaker,
reference RS27 <2.4 <0.3 0.8 0.1 1.1 0.2
aFor D6 two LOQ were applied (the 4 first extraction rounds were contaminated from a source that was later identified)

Siloxanes in freshwater food webs – a study of three lakes in Norway | M-81/2013
51
POP chemical analysis
Extraction Biological samples
Samples were homogenized and an aliquot was taken for extraction and added internal standards
PCB 30, 53, 204 (Ultra Scientific) and BDE 30, 119, 181 (Cambridge isotope laboratories). Samples
were then extracted twice using a 50/50 mixture of isopropanol/cyclohexane followed removal of
isopropanol by addition of water. All cyclohexane was evaporated off and the fat was dried until
stable weight was achieved for total lipid determination. The fat were then dissolved in isohexane
and then repeatedly treated with concentrated sulphuric acid. Extract was evaporated to about
100µl followed by PCB analysis. After PCB analysis the extract was solvent extracted twice using
acetonitrile saturated with isohexane followed by evaporation and analysis of PBDEs.
Extraction Sediment samples
Sediments samples were added the same internal standards as the biota samples and extracted
twice using dichloromethane. The organic phase was then dried using sodium sulphate and then
solvent exchanged into isohexane. Cleanup then followed the same procedure as biological samples.
Extraction Polyuretanefoam (PUF) samples.
Each PUF was added the same internal standard as biota and then extracted by soxhlet using 5%
ether in n-hexane (EPA method TO-10A, www.epa.org). The organic phase was dried by Na2SO4,
transferred off and solvent exchanged into isohexane. Cleanup then followed the same procedure as
biological samples.
PCB Quantification
Extracts was analyzed on an Agilent 7890A gas chromatograph coupled to an Agilent 5975C
masspektrometer Agilent JW schientific, Santa Clara, USA. The instrument was operated in single
ion monitoring (SIM) mode using electron impact ionization (69,9EV). The gas chromatograph was
equipped with a 30m Agilent DB-5 column (0,25mm i.d. and 0,25µm film thickness) and kept at
constant flow of 1,2ml/min of He. The GC-oven was kept at 60°C for 2 min and then raised to 250°C
at a rate of 7°C/min and then finally raised to 310°C at a rate of 15°C/min, the oven was then held
at 310°C for 2min. Samples injection was 1µl pulsed splitless injection at 20psi for 1,2min and the
injector temperature was set to 300°C. Transfer line, ion source and quadrupole were kept at 280,
230 and 150°C, respectively. Quantification of individual compounds was done using the relative
response of surrogate internal standard and comparing that to a calibration curve.
PBDE analysis
Determination of PBDEs was performed with a Hewlett Packard 6890Plus GC linked to a Hewlett
Packard 5973 MS detector operated in negative chemical ionisation (with methane) and SIM mode. A
4 µL pulsed splitless injection (injector temperature of 280 C and a pulse pressure of 50 psi held for
2 min) allowed transfer of analytes onto a DB-5MS column (Agilent Technologies Inc., 15 m, 0.25
mm i.d., 0.1 µm film thickness). The oven temperature was set to 120 C. It was held for 2 min
before being increased to 345 C at the rate of 25 C min-1 (then held for 5 min). The carrier gas
(helium) flow was set to 1 mL min-1 for the first 13 min and increased to 1.4 mL min-1 at the rate of
0.1 mL min-1. Ion source, quadrupole and transfer line temperatures were 250, 150 and 325 C,
respectively. Ion fragments m/z 79 and 81 were used for qualifying and quantifying PBDEs.
Table S 9. Analytical uncertainty for a) sediment, with SRM 1944 as reference material and b) fish
muscle with HSD8 as reference material.
a) SEDIMENT Average % This study
HCB 30 <30
PCB 52 20 22
PCB 101 30 <30
p,p-DDE 30 <30
PCB 118 30 <30
p,p-DDD 40 <40
PCB 153 30 <30

Siloxanes in freshwater food webs – a study of three lakes in Norway | M-81/2013
52
PCB 105 26 <26
p,p-DDT 60 <60
PCB 138 23 <23
PCB 156 32 <32
PCB 180 25 36
PCB 209 36 <36
b) FISH Average % This study
HCB 40 <40
PCB 52 30 <30
PCB 101 26 <26
p,p-DDE 26 <26
PCB 118 26 <26
PCB 153 26 <26
PCB 105 26 <26
PCB 138 26 <26
PCB 156 26 <26
PCB 180 26 30
PCB 209 40 <40

Siloxanes in freshwater food webs – a study of three lakes in Norway | M-81/2013
53
Table S 10. Lipid quantification results in the the Quasimeme test programme.Z-score ≤ │2│ is
acceptable.
Year Sample Assigned value NIVA Lipid
% lipid % lipid Z-score
2007 R50: 92 14.044 17 0
93 2.643 3 0.9
2008 R52: 94 57.49 58.1 0.1
95 2.629 3.17 1.4
2010 R62:104 17.36 20 1.2
105 2.705 3.1 1
2011 R64:106 11.82 10 -1.2
107 3.22 3.2 0
2011 R66:108 57 49.7 -1
109 4.079 3.9 -0.3
2012 R68:110 2.391 2.4 0
111 3.19 3.2 0
2012 R70:112 2.08 2.14 0.2
113 3.938 3.89 -0.1

Siloxanes in freshwater food webs – a study of three lakes in Norway | M-81/2013
54
Results
Table S 11. cVMS measured in A) Lake Mjøsa B) Lake Randsfjorden and C) Lake Femunden. Biota
(ng/g ww), sediments (ng/g dw), effluent water (ng/L) and filtered particles from the water (ng/L),
and their respective field blanks or reference material.
A) MJØSA
FIELD BLANKS
(FB)
Identification D4 D5 D6
ng D4 ng D5 ng D6
Zooplankton FB-23 M-8a 0.4 0.6 0.1
Mysis FB-25 M-4a 2.7 1.8 0.8
Fish FB-24 MS-7. Gill net bottom 2.8 3.0 1.5
Fish FB-18 MS-5. Gill net surface 3.2 2.5 1.2
Unexposed FBs (mean
of 3)
FB28. 29. 5 1.6 1.1 1.2
Species Sample ng D4 D4
ng/g
ww
ng D5 D5
ng/g
ww
ng D6 D6
ng/g
ww
Zooplankton epi S9 + S10 < 1.8 < 0.2 17 2.3 < 2.5 < 0.3
Zooplankton epi S11 + S12 < 1.9 < 0.2 20 2.4 < 3.0 < 0.4
Mysis S1 + S2 6.1 1.8 49 14 < 4.9 < 1.4
Mysis M-14 < 2.1 < 0.4 52 9.6 < 5.1 < 0.9
Zooplankton hypo S4 + S5 < 3.2 < 0.5 89 15 < 4.0 < 0.7
Zooplankton hypo S6 + S7 < 3.0 < 0.5 85 15 < 3.8 < 0.7
Zooplankton epi B-5 12 0.5 55 2.4 7.9 0.3
Mysis B-1 31 2.0 441 29 20 1.3
Mysis B-3 10 1.1 491 50 16 1.6
Zooplankton hypo B-2 35 2.4 2019 139 38 2.6
Zooplankton hypo B-4 29 2 1953 156 35 2.8
Perch A-1 < 1.4 < 0.1 29 2.8 < 4.1 < 0.4
Perch A-2 < 2.5 < 0.2 47 4.4 < 5.2 < 0.5
Perch A-3 < 1.7 < 0.2 30 2.7 < 4.0 < 0.4
Perch A-4 < 1.7 < 0.2 13 1.3 < 5.0 < 0.5
Perch A-5 < 1.4 < 0.2 25 2.9 < 4.4 < 0.5
Perch A-6 < 3.3 < 0.3 32 2.8 < 5.1 < 0.4
Whitefish MS-3 < 1.0 < 0.2 32 5.2 < 5.0 < 0.8

Siloxanes in freshwater food webs – a study of three lakes in Norway | M-81/2013
55
Whitefish MS-4 < 2.1 < 0.3 93 15 9 1.5
Whitefish MS-6 < 2.7 < 0.4 39 6.0 < 5.2 < 0.8
Whitefish MS-1 < 2.2 < 0.2 57 6 6 0.7
Whitefish MS-2 < 1.7 < 0.2 28 3.0 < 3.3 < 0.4
Vendace L-2 9.8 0.9 2083 196 119 11
Vendace L-1 8.7 1.1 906 120 62 8.1
Vendace L-3 7.5 1.0 2451 311 118 15
Vendace L-4 6.8 1.1 830 134 46 7.4
Vendace L-6 6.3 0.9 832 120 30 4.4
Vendace L-7 6.1 0.8 1301 176 60 8.1
Vendace L-8 < 4.5 < 0.6 593 76 55 7.0
Smelt. homogenate 6
ind.
K-1 < 2.1 < 0.2 394 36 16 1.5
Smelt. homogenate 6
ind.
K-2 < 2.3 < 0.2 373 34 19 1.7
Smelt. homogenate 6
ind.
K-3 < 2.1 < 0.2 331 32 16 1.6
Smelt. homogenate 6
ind.
K-4 < 3.6 < 0.3 457 39 24 2.1
Smelt. homogenate 6
ind.
K-5 < 3.1 < 0.3 374 39 23 2.4
Smelt K-7 < 0.7 < 0.1 383 62 22 3.5
Smelt K-8 < 0.4 < 0.1 243 38 13 2.0
Smelt K-9 < 1.6 < 0.4 528 126 27 6.4
Smelt K-10 < 1.1 < 0.2 313 59 25 4.7
Smelt K-11 < 1.5 < 0.3 238 41 17 3.0
Brown trout MT-1 5.3 0.8 1146 166 60 8.6
Brown trout MT-2 6.1 0.8 1716 235 93 12.7
Brown trout MT-3 < 4.3 < 0.6 1548 203 69 9.1
Brown trout MT-4 < 2.7 < 0.4 804 131 38 6.1
Brown trout MT-5 4.9 0.6 421 52 25 3.1
Burbot M L-1 muscle < 3.5 < 0.4 45 4.6 7.5 0.8
Burbot L L-1 liver < 3.9 < 8.2 314 667 30 64
Burbot M L-2 muscle < 4.1 < 0.4 96 9.7 13 1.3
Burbot L L-2 liver 10 22.7 675 1489 39 86
Burbot M L-3 muscle < 4.2 < 0.4 91 8.7 11 1.0
Burbot L L-3 liver < 3.7 < 27 425 3080 35 252
Burbot M L-4 muscle 4.8 0.3 237 15 26 1.7
Burbot L L-4 liver 38 21.4 3855 2192 242 138
Burbot M L-5 muscle < 4.4 < 0.4 92 9.0 9.8 1.0
Burbot L L-5 liver 13 12.6 2011 1888 39 37

Siloxanes in freshwater food webs – a study of three lakes in Norway | M-81/2013
56
Burbot M L-6 muscle 6.5 0.6 151 14 14 1.3
Burbot L L-6 liver 11 11.7 2767 2937 58 62
ng D4 D4
ng /g
dw
ng D5 D5
ng/g
dw
ng D6 D6
ng/g
dw
Sediment.
Lillehammer.
reference
Msed-5 <1.8 <0.3 5.7 0.9 < 6.0 < 1.0
Sediment Ottestad
30 m
Msed-2 <2.9 <1.7 10 5.8 10.3 6.2
Sediment Ottestad
120 m
Msed-1 <12.5 <2.7 <0.8 <0.2 <1.5 0.3
Sediment Gjövik
28m
Msed-6 <9.9 <3.7 761 285 90 34
Sediment Gjövik
120m
Msed-7 <15 <6.7 751 335 90 40
Sediment.
Lillehammer 30m
Msed-3 < 1.6 < 0.3 30 6.8 14 3.1
Sediment.
Lillehammer 80m
Msed-4 <1.5 <0.5 74 26 27 9.4
ng D4 D4
ng/L
ng D5 D5
ng/L
ng D6 D6
ng/L
Solvent blank 1.2 1.1 1.6
Filter blank 1 filter < 5.9 46 48
Filter particulate
phase
MF-1 < 16 < 0.08 < 16 < 0.09 < 11 < 0.06
Filter particulate
phase
MF-2 < 12 < 0.05 < 14 < 0.06 < 11 < 0.04
Filter particulate
phase
MF-3 < 12 < 0.06 < 12 < 0.05 < 8.6 < 0.04
ng D4 D4
ng/L
ng D5 D5
ng/L
ng D6 D6
ng/L
Blank MilliQ (2.5L) 2.2 0.9 2.3 0.9 5.7 2.3
Effluent water Hias 38 15 274 111 35 14.0
Effluent water Gjövik 22 8.9 201 82 30 12.1
Effluent water Lillehammer 19 7.7 72 29 < 7.7 < 3.1
B) LAKE RANDSFJORDEN
FIELD BLANKS (FBs) SAMPLE ng D4 ng D5 ng D6
Zooplankton epi FB-20 R2 1.5 0.9 0.9
Fish whole procedure
FB-21
R10 1.3 3.4 0.6

Siloxanes in freshwater food webs – a study of three lakes in Norway | M-81/2013
57
Smelt- sample
preparation. FB-26
R13 2.1 3.9 1.9
Unexposed FBs
(mean of 3)
FB28. 29. 5 1.6 1.1 1.2
SPECIES SAMPLE ng D4 D4 ng/g
ww
ng D5 D5ng/g
ww
ng D6 D6 ng/g
ww
zooplankton
epilimnion
R1 9.5 0.4 48 1.9 8.3 0.3
zooplankton
epilimnion
R3 < 2.5 < 0.1 36 1.7 < 4.2 < 0.2
zooplankton
epilimnion
R4 < 2.6 < 0.3 21 2.1 < 4.0 < 0.4
zooplankton
epilimnion
R5 < 3.7 < 0.2 34 1.6 < 4.8 < 0.2
zooplankton
hypolimnion
R6 < 2.3 < 0.4 83 16 < 2.7 < 0.5
zooplankton
hypolimnion
R7 12 0.9 566 43 9.4 0.7
zooplankton
hypolimnion
R8 < 1.4 < 0.1 40 3.0 < 1.9 < 0.1
zooplankton
hypolimnion
R9 16 1.2 727 53 13 0.9
Whitefish R17 < 2.4 < 0.2 16 1.2 < 3.2 < 0.2
Whitefish R18 < 1.4 < 0.2 4.0 0.5 < 3.1 < 0.4
Whitefish R19 < 2.3 < 0.2 37 3.3 < 4.5 < 0.4
Whitefish R20 < 1.3 < 0.1 4.7 0.4 < 2.3 < 0.2
Whitefish R21 < 0.8 < 0.1 2.8 0.2 < 1.9 < 0.2
Whitefish R22 < 2.6 < 0.2 11 0.9 < 3.1 < 0.3
Whitefish R23 < 1.3 < 0.1 6.5 0.6 < 2.4 < 0.2
Whitefish R24 7.7 0.5 41 2.8 5.4 0.4
Whitefish R25 < 2.8 < 0.3 13 1.3 < 3.6 < 0.4
Smelt R11 < 1.8 < 0.2 131 15 8.7 1.0
Smelt R12 < 2.4 < 0.3 169 20 10 1.2
Smelt R14 < 1.8 < 0.2 129 16 11 1.4
Smelt R15 < 1.4 < 0.1 324 25 10 0.8
Smelt R16 < 1.9 < 0.2 201 18 11 1.0
Brown trout R36 < 3.0 < 0.3 492 56 25 2.9
Brown trout R37 < 0.7 < 0.1 81 9.9 < 8.5 < 1.1
Brown trout R38 < 0.7 < 0.1 99 12 < 8.8 < 1.1
Brown trout R39 9.6 0.9 1161 115 31 3.0
Brown trout R40 < 2.0 < 0.2 422 41 17 1.6
ng D4 D4
ng /g dw
ng D5 D5
ng/g dw
ng D6 D6
ng/g

Siloxanes in freshwater food webs – a study of three lakes in Norway | M-81/2013
58
dw
sediment. Fluberg.
reference
RS33 < 13 < 1.4 1.8 0.2 2.0 0.2
sediment. Jevnaker.
reference
RS27 2.4 0.3 0.8 0.1 1.1 0.2
sediment. Jevnaker RS26 <7.9 <1.2 6.6 1.0 5.7 0.8
sediment. Jevnaker RS28 < 29 < 3.9 6.0 0.81 7.5 1.00
sediment. Brandbu RS29 7.8 1.1 356 52 68 10
sediment. Brandbu RS30 9.4 1.6 858 147 130 22
sediment. Fluberg RS31 < 1.9 < 0.3 38 6.0 28 4.5
sediment. Fluberg RS32 < 24 < 4.7 57 11 40 7.8
ng D4 D4 ng/L ng D5 D5ng/L ng D6 D6ng/L
Blank MilliQ
(2.5L)
2.2 0.9 2.3 0.9 5.7 2.3
Effluent water Brandbu 66 27 861 351 27 11
Effluent water Jevnaker 33 13 151 61 28 11
Effluent water Otta 60 24 912 368 23 9.3
C) LAKE FEMUNDEN
FIELD BLANK (FB) SAMPLE ng D4 ng D5 ng D6
Fish FB-10 F18 1.7 1.3 1.0
Sediments FB-4 F11 1.4 0.8 0.5
Zooplankton FB-8 F1 2.0 1.5 0.9
Unexposed FBs
(mean of 3)
FB28. 29. 5 1.6 1.1 1.2
SPECIES SAMPLE ng D4 D4 ng/g ww ng D5 D5 ng/g ww ng D6 D6 ng/g ww
Char F19 < 0.9 < 0.1 < 2.3 < 0.2 < 4.7 < 0.4
Brown trout F26 < 4.4 < 0.5 3.3 0.4 < 8.0 < 0.9
Brown trout F27 < 3.4 < 0.3 2.9 0.3 < 4.2 < 0.4
Brown trout F28 < 3.3 < 0.3 2.9 0.3 < 4.1 < 0.4
Brown trout F29 < 1.7 < 0.1 < 1.4 < 0.1 < 5.9 < 0.5
Brown trout F30 < 1.6 < 0.2 4.3 0.4 < 3.6 < 0.4
Brown trout F31 < 2.7 < 0.2 4.0 0.4 < 4.0 < 0.4
ng D4 D4 ng/g dw ng D5 D5 ng/g dw ng D6 D6 ng/g dw
Sediment F7 < 3.7 < 0.9 < 0.9 < 0.2 < 2.4 < 0.6
Sediment F8 < 5.9 < 1.2 < 2.6 < 0.5 < 5.5 < 1.1
Sediment F10 < 1.9 < 0.4 < 1.3 < 0.3 < 3.3 < 0.7

Siloxanes in freshwater food webs – a study of three lakes in Norway | M-81/2013
59
Table S 12. Percentage (%) samples in the pelagic food web of Mjøsa and Randsfjorden, that were
quantified below the limit of quantification (LOQ) for cyclic volatile methylsiloxanes (D4, D5, D6),
or limit of detection (LOD) for PCBs, ppDDE and PBDEs.
Mjøsa
Randsfjorden
(excluding/including whitefish)
D4 52 82 / 81
D5 0 0 /0
D6 13 61 / 54
PCB-153 0 0 /0
PCB-180 19 53 / 50
p,p'-DDE 0 0 /0
PBDE-47 0 N/A
PBDE-99 3 N/A

Siloxanes in freshwater food webs – a study of three lakes in Norway | M-81/2013
60
Table S 13. Trophic magnification factor (TMF) statistics for cyclic volatile methylsiloxanes (D4, D5, D6) and selected legacy chlorinated and brominated
contaminants in the Lakes Mjøsa [M] and Randsfjorden [R]. TMFs are based on the regression of lipid normalised concentrations onto trophic level (TL)
estimated from stable isotopes of nitrogen.
Chemica
l Whitefish Model term Estimate SE
t
Ratio p>|t| Estimate CI TMF TMF CI R2 N
Interactions
(TLxLake) Comments
[R]
Lower
95%
Upper
95%
Lower
95%
Upper
95% t-test
p(t)
D5 Included Intercept 3.60 0.70 5.12
0.000
0 2.19 5.01
D5 Included Lake[M] 0.80 0.15 5.31
0.000
0 0.50 1.11
D5 Included Lake[R] -0.80 0.15 -5.31
0.000
0 -1.11 -0.50
D5 Included TL 1.03 0.20 5.03
0.000
0 0.62 1.43 2.79 1.86 4.20 0.57 59 0.86 0.4
D5 Excluded Intercept 3.80 0.44 8.72
0.000
0 2.93 4.68
D5 Excluded Lake[M] 0.33 0.11 3.15
0.002
9 0.12 0.54
D5 Excluded Lake[R] -0.33 0.11 -3.15
0.002
9 -0.54 -0.12
D5 Excluded TL 1.10 0.13 8.73
0.000
0 0.85 1.36 3.01 2.33 3.88 0.66 50 0.47 0.64
D4* Included Intercept 4.43 0.40 11.15
0.000
0 3.63 5.22
D4* Included Lake[M] 0.38 0.09 4.47
0.000
0 0.21 0.55
D4* Included Lake[R] -0.38 0.09 -4.47
0.000
0 -0.55 -0.21
D4* Included TL -0.36 0.12 -3.10
0.003
1 -0.59 -0.13 0.70 0.56 0.88 0.16 59 1.08 0.28
D4* Excluded Intercept 4.44 0.42 10.64
0.000
0 3.60 5.28

Siloxanes in freshwater food webs – a study of three lakes in Norway | M-81/2013
61
D4* Excluded Lake[M] 0.37 0.10 3.62
0.000
7 0.16 0.57
D4* Excluded Lake[R] -0.37 0.10 -3.62
0.000
7 -0.57 -0.16
D4* Excluded TL -0.36 0.12 -2.95
0.005
0 -0.60 -0.11 0.70 0.55 0.89 0.12 50 1.05 0.3
D6 Included Intercept[M] 1.62 0.59 2.73
0.010
3 0.41 2.82
D6 Included TL[M] 1.00 0.16 6.20
0.000
0 0.67 1.33 2.72 1.96 3.77 0.55 33 2.15 0.04
Separate
regression after
significant test for
interaction
D6* Included Intercept[R] 2.61 0.75 3.47
0.002
0 1.06 4.16
D6* Included TL[R] 0.38 0.23 1.62
0.117
3 -0.10 0.86 1.46 0.90 2.36 0.10 26 2.15 0.04
Separate
regression after
significant test for
interaction
D6* Excluded Intercept 1.80 0.44 4.06
0.000
2 0.91 2.69
D6* Excluded Lake[M] 0.36 0.11 3.37
0.001
5 0.15 0.58
D6* Excluded Lake[R] -0.36 0.11 -3.37
0.001
5 -0.58 -0.15
D6* Excluded TL 0.85 0.13 6.63
0.000
0 0.59 1.11 2.34 1.81 3.02 0.61 50 1.92 0.06
PCB-153 Included Intercept[M] -1.30 0.56 -2.32
0.027
9 -2.45 -0.15
PCB-153 Included TL[M] 1.62 0.15 10.78
0.000
0 1.31 1.92 5.04 3.71 6.85 0.80 31 2.98 0.005
Separate
regression after
significant test for
interaction
PCB-153 Included Intercept[R] 0.35 0.70 0.50
0.619
6 -1.10 1.81

Siloxanes in freshwater food webs – a study of three lakes in Norway | M-81/2013
62
PCB-153 Included TL[R] 0.83 0.22 3.79
0.000
9 0.38 1.28 2.29 1.46 3.60 0.37 26 2.98 0.005
Separate
regression after
significant test for
interaction
PCB-153 Excluded Intercept[R] 0.42 0.83 0.51
0.620
0 -1.35 2.19
PCB-153 Excluded TL[R] 0.78 0.26 3.04
0.008
3 0.23 1.33 2.19 1.26 3.80 0.38 17 3.01 0.004
Separate
regression after
significant test for
interaction
PCB-180 Included Intercept[M] -2.78 0.85 -3.29
0.002
7 -4.50 -1.05
PCB-180 Included TL[M] 1.52 0.23 6.75
0.000
0 1.06 1.98 4.58 2.89 7.26 0.61 31 3.91 0.003
Separate
regression after
significant test for
interaction
PCB-
180* Included Intercept[R] 1.63 0.65 2.50
0.019
8 0.28 2.98
PCB-
180* Included TL[R] 0.08 0.20 0.41
0.683
8 -0.34 0.50 1.09 0.72 1.65 0.00 26 3.91
0.000
3
Separate
regression after
significant test for
interaction
PCB-
180* Excluded Intercept[R] 0.43 1.05 0.41
0.684
9 -1.80 2.67
PCB-
180* Excluded TL[R] 0.34 0.33 1.04
0.313
7 -0.36 1.04 1.41 0.70 2.82 0.07 19 3.01 0.004
Separate
regression after
significant test for
interaction
ppDDE Included Intercept[M] 0.45 0.54 0.84
0.406
8 -0.65 1.55
ppDDE Included TL[M] 1.43 0.14 10.00
0.000
0 1.14 1.73 4.19 3.12 5.61
3.24 0.002
Separate
regression after
significant test for

Siloxanes in freshwater food webs – a study of three lakes in Norway | M-81/2013
63
interaction
ppDDE Included Intercept[R] 1.59 0.58 2.75
0.011
0 0.40 2.79
ppDDE Included TL[R] 0.67 0.18 3.76
0.001
0 0.30 1.04 1.96 1.36 2.84 0.76 31 3.24 0.002
Separate
regression after
significant test for
interaction
ppDDE Excluded Intercept[R] 1.62 0.69 2.35
0.033
0 0.15 3.09
ppDDE Excluded TL[R] 0.66 0.21 3.09
0.007
5 0.21 1.12 1.94 1.23 3.07 0.37 17 3.05 0.004
Separate
regression after
significant test for
interaction
PBDE-47
Not
relevant Intercept[M] -1.37 0.59 -2.33
0.027
5 -2.58 -0.16
PBDE only
measured in [M]
PBDE-47
Not
relevant TL[M] 1.74 0.16 11.22
0.000
0 1.42 2.06 5.72 4.16 7.86 0.81 30
PBDE only
measured in [M]
PBDE-99
Not
relevant Intercept[M] -0.83 1.10 -0.75
0.460
1 -3.09 1.43
PBDE only
measured in [M]
PBDE-99
Not
relevant TL[M] 1.08 0.29 3.71
0.000
9 0.48 1.68 2.95 1.62 5.35 0.33 30
PBDE only
measured in [M]
*more than 50% of data quantified below quality threshold (LOQ for cVMS, LOD for legacy POPs).

Siloxanes in freshwater food webs – a study of three lakes in Norway | M-81/2013
64
Figure S2. Relationship between lipid normalized concentrations of cVMS (D4, D5 D6) and PCB-153,
and trophic level (TL) from Lake Mjøsa and Randsfjorden pelagic food webs, including whitefish
from Randsfjorden. Chemicals marked with asterix (*) have >50% of data below LOQ in one or both
of the lakes. Zooplankton epi and hypo are epi- and hypolimnetic zooplankton, respectively. Trophic
magnification factor (TMF) estimated separately for Mjøsa (Mj) and Randsfjorden (Ra) when the
interaction TLxLake was significant.

Siloxanes in freshwater food webs – a study of three lakes in Norway | M-81/2013
65
Table S 14. Product-moment correlation coefficients (r: left triangular matrix) between trophic position (TL), and log-transformed concentrations
of cVMS and selected legacy contaminants in the pelagic food web in a) Mjøsa and b) Randsfjorden.
a) MJØSAa n = 31 (30 hvor PBDE inngår)
Variable TL D5 D6 D4 PCB-153 PCB-180 ppDDE PBDE-47 PBDE-99
TL 1.00
D4c 0.76 1.00
D5 0.71 0.91 1.00
D6 -0.39 0.13 0.21 1.00
PCB-153 0.89 0.84 0.85 -0.15 1.00
PCB-180 0.76 0.77 0.80 -0.09 0.92 1.00
ppDDE 0.88 0.84 0.86 -0.14 1.00 0.92 1.00
PBDE-47 0.90 0.79 0.80 -0.14 0.99 0.90 0.98 1.00
PBDE-99 0.57 0.82 0.78 0.31 0.78 0.75 0.78 0.74 1.00
b) RANDSFJORDENb Upper right diagonal without whitefish (n=17). Lower left diagonal with whitefish (n=26).
Variable TL D5 D6 D4 PCB-153 PCB-180 ppDDE
TL 1.00 0.55 0.51 -0.53 0.60 0.27 0.61
D5 0.41 1.00 0.78 0.14 0.53 0.39 0.53
D6c 0.41 0.81 1.00 -0.18 0.55 0.47 0.53
D4c -0.51 0.23 -0.02 1.00 -0.18 0.01 -0.19
PCB-153 0.59 0.40 0.40 -0.23 1.00 0.91 0.99
PCB-180c 0.27 0.34 0.43 0.00 0.86 1.00 0.90
ppDDE 0.59 0.47 0.46 -0.20 0.97 0.85 1.00
a Mjøsa correlation zooplankton epilimnion and hypolimnion, Mysis relicta, vendace, smelt and trout.
b Randsfjorden correlation included zooplankton epilimnion and hypolimnion, whitefish, smelt and trout.
c correlation included >50 % values below the established limit of quantification (LOQ) for cVMS and LOD for PCB-180.

Siloxanes in freshwater food webs – a study of three lakes in Norway | M-81/2013
66
Utførende institusjon ISBN-nummer
Norsk institutt for vannforskning (NIVA) 978-82-577-6255-1
Oppdragstakers prosjektansvarlig Kontaktperson M-nummer
Katrine Borgå Bård Nordbø M-81
År Sidetall Miljødirektoratets
kontraktsummer
2013 36 +
vedlegg 7013520
Utgiver Prosjektet er finansiert av
Norsk institutt for vannforskning
NIVA LNR 6520-2013
NIVA O-NR 12255
Miljødirektoratet
Forfatter(e)
Katrine Borgå (NIVA), Eirik Fjeld (NIVA), Amelie Kierkegaard (ITM), Jarl Eivind Jarl Eivind Løvik
(NIVA), Sigurd Rognerud (NIVA), Andreas S. Høgfeldt (NIVA), Kine Bæk (NIVA), Michael S.
McLachlan (ITM)
Tittel – norsk og engelsk
Siloksaner i ferskvanns næringsnett – et studie av tre innsjøer i Norge.
Siloxanes in freshwater food webs – a study of three lakes in Norway
Sammendrag – summary
Presence, sources and food web biomagnification of cyclic volatile methylsiloxanes (cVMS) was
investigated in three Norwegian lakes (Mjøsa, Randsfjorden, Femunden). The high levels and
food web biomagnification of the cVMS D5 in Mjøsa reported in 2010 was confirmed.
The cVMS levels in lakes with discharge from waste water treatment plants were higher than in
the reference lake with minor human impact (Femunden), suggesting that local sources are the
major input of cVMS, rather than long range transport. The cVMS analysed for (D4, D5, D6) were
found in effluent water from the investigated waste water treatment plants in Mjøsa and
Randsfjorden.
D5 and D6 biomagnified in the pelagic food web with trophic magnification factors above 1 in
both Mjøsa and Randsfjorden. Results indicated that D4 is not subject to biomagnification, with
decreasing concentrations with increasing trophic level.
4 emneord 4 subject words
Sykliske volatile metylerte siloksaner
Biomangifisering i næringsnett
Nivåer og kilder
Trofiske magnifikasjonsfaktorer
Cyclic volatile methylsiloxanes
Biomagnification in food webs
Levels and sources
Trophic magnification factors


Miljødirektoratet ble opprettet 1. juli 2013 og er
en sammenslåing av Direktoratet for
naturforvaltning og Klima- og
forurensningsdirektoratet (Klif).
Vi er et direktorat under Miljøverndepartementet
med 700 ansatte i Trondheim og Oslo. Statens
naturoppsyn er en del av direktoratet med over
60 lokalkontor.
Miljødirektoratet har sentrale oppgaver og ansvar
i arbeidet med å redusere klimagassutslipp,
forvalte norsk natur og hindre forurensning.
Våre viktigste funksjoner er å overvåke
miljøtilstanden og formidle informasjon, være
myndighetsutøver, styre og veilede regionalt og
kommunalt nivå, samarbeide med berørte
sektormyndigheter, være faglig rådgiver og bidra
i internasjonalt miljøarbeid.
Miljødirektoratet
Telefon: 03400/73 58 05 00 | Faks: 73 58 05 01
E-post: [email protected]
Nett: www.miljødirektoratet.no
Post: Postboks 5672 Sluppen, 7485 Trondheim
Besøksadresse Trondheim: Brattørkaia 15, 7010
Trondheim
Besøksadresse Oslo: Strømsveien 96, 0602 Oslo