Siloam's Financial
63
Draft/July 26, 2013 Paraf: PT SILOAM INTERNATIONAL HOSPITALS Tbk AND SUBSIDIARIES Interim Consolidated Financial Statements For the Years Ended December 31, 2010, 2011 and 2012 and For the Four (4) Months Period Ended April 30, 2013
-
Upload
uswatun-khasanah -
Category
Documents
-
view
26 -
download
1
description
no description
Transcript of Siloam's Financial
Draft/July 26, 2013 Paraf:
PT SILOAM INTERNATIONAL HOSPITALS Tbk
AND SUBSIDIARIES
Interim Consolidated Financial Statements
For the Years Ended December 31, 2010, 2011 and 2012 and
For the Four (4) Months Period Ended April 30, 2013
D1/July 26, 2013 paraf:
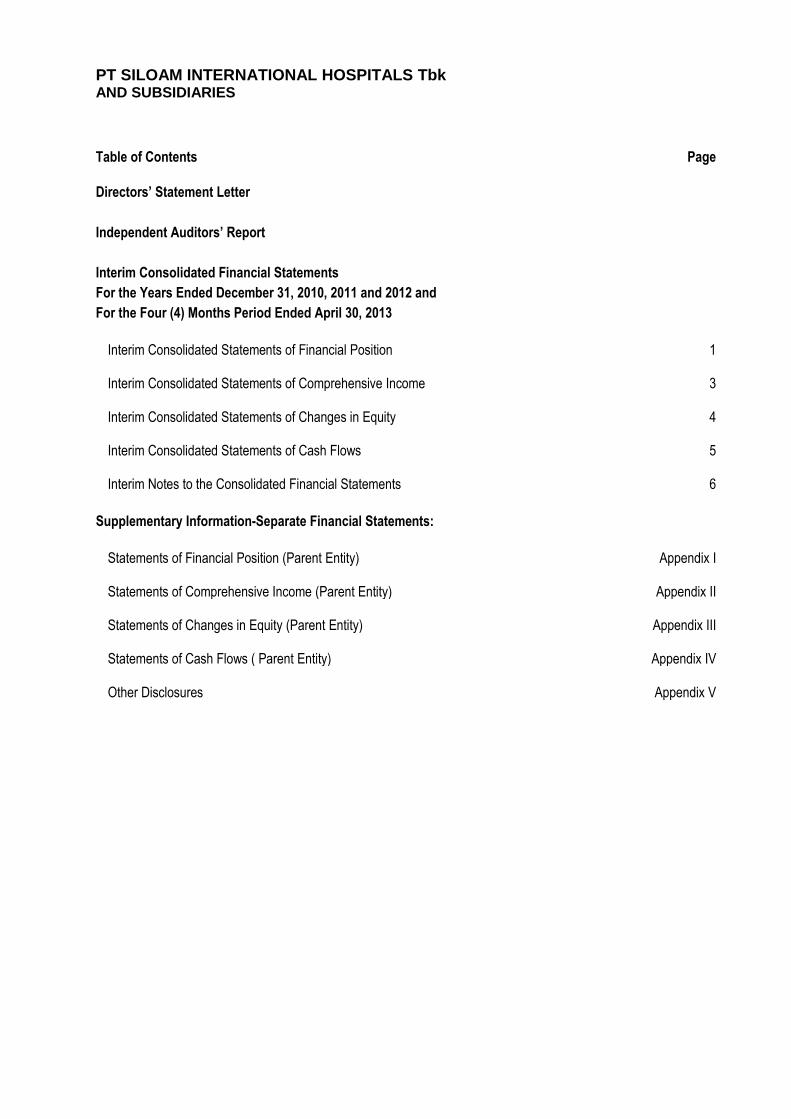
PT SILOAM INTERNATIONAL HOSPITALS Tbk AND SUBSIDIARIES
Table of Contents Page
Directors’ Statement Letter
Independent Auditors’ Report
Interim Consolidated Financial Statements
For the Years Ended December 31, 2010, 2011 and 2012 and
For the Four (4) Months Period Ended April 30, 2013
Interim Consolidated Statements of Financial Position 1 Interim Consolidated Statements of Comprehensive Income 3 Interim Consolidated Statements of Changes in Equity 4 Interim Consolidated Statements of Cash Flows 5 Interim Notes to the Consolidated Financial Statements 6
Supplementary Information-Separate Financial Statements:
Statements of Financial Position (Parent Entity) Appendix I Statements of Comprehensive Income (Parent Entity) Appendix II Statements of Changes in Equity (Parent Entity) Appendix III Statements of Cash Flows ( Parent Entity) Appendix IV Other Disclosures Appendix V

The accompanying notes form an integral part of these
consolidated financial statements
Draft/26 Juli 2013 1 paraf:
These consolidated financial statements are originally issued in Indonesian language
PT SILOAM INTERNATIONAL HOSPITALS Tbk AND SUBSIDIARIES
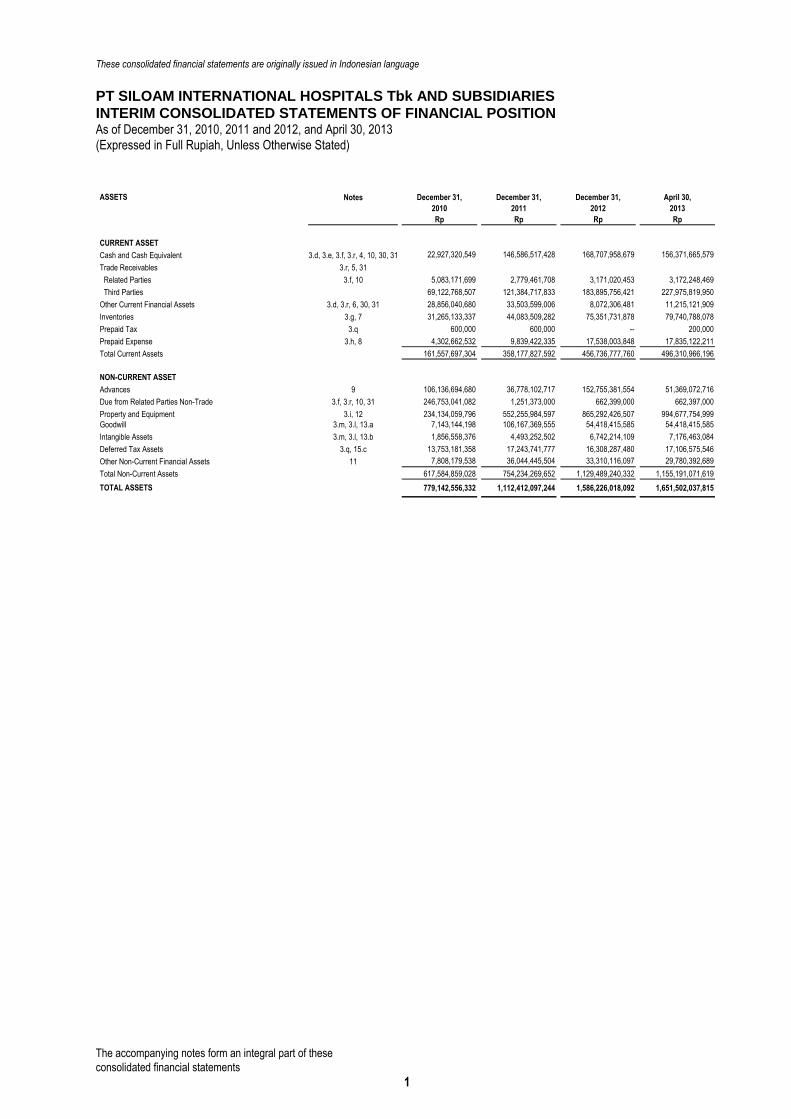
INTERIM CONSOLIDATED STATEMENTS OF FINANCIAL POSITION As of December 31, 2010, 2011 and 2012, and April 30, 2013
(Expressed in Full Rupiah, Unless Otherwise Stated)
ASSETS Notes December 31, December 31, December 31, April 30,
2010 2011 2012 2013
Rp Rp Rp Rp
CURRENT ASSET
Cash and Cash Equivalent 3.d, 3.e, 3.f, 3.r, 4, 10, 30, 31 22,927,320,549 146,586,517,428 168,707,958,679 156,371,665,579
Trade Receivables 3.r, 5, 31
Related Parties 3.f, 10 5,083,171,699 2,779,461,708 3,171,020,453 3,172,248,469
Third Parties 69,122,768,507 121,384,717,833 183,895,756,421 227,975,819,950
Other Current Financial Assets 3.d, 3.r, 6, 30, 31 28,856,040,680 33,503,599,006 8,072,306,481 11,215,121,909
Inventories 3.g, 7 31,265,133,337 44,083,509,282 75,351,731,878 79,740,788,078
Prepaid Tax 3.q 600,000 600,000 -- 200,000
Prepaid Expense 3.h, 8 4,302,662,532 9,839,422,335 17,538,003,848 17,835,122,211
Total Current Assets 161,557,697,304 358,177,827,592 456,736,777,760 496,310,966,196
NON-CURRENT ASSET
Advances 9 106,136,694,680 36,778,102,717 152,755,381,554 51,369,072,716
Due from Related Parties Non-Trade 3.f, 3.r, 10, 31 246,753,041,082 1,251,373,000 662,399,000 662,397,000
Property and Equipment 3.i, 12 234,134,059,796 552,255,984,597 865,292,426,507 994,677,754,999
Goodwill 3.m, 3.l, 13.a 7,143,144,198 106,167,369,555 54,418,415,585 54,418,415,585
Intangible Assets 3.m, 3.l, 13.b 1,856,558,376 4,493,252,502 6,742,214,109 7,176,463,084
Deferred Tax Assets 3.q, 15.c 13,753,181,358 17,243,741,777 16,308,287,480 17,106,575,546
Other Non-Current Financial Assets 11 7,808,179,538 36,044,445,504 33,310,116,097 29,780,392,689
Total Non-Current Assets 617,584,859,028 754,234,269,652 1,129,489,240,332 1,155,191,071,619
TOTAL ASSETS 779,142,556,332 1,112,412,097,244 1,586,226,018,092 1,651,502,037,815 Total Aset Tidak LancarTOTAL ASET
The accompanying notes form an integral part of these
consolidated financial statements
Draft/26 Juli 2013 2 paraf:
These consolidated financial statements are originally issued in Indonesian language
PT SILOAM INTERNATIONAL HOSPITALS Tbk AND SUBSIDIARIES
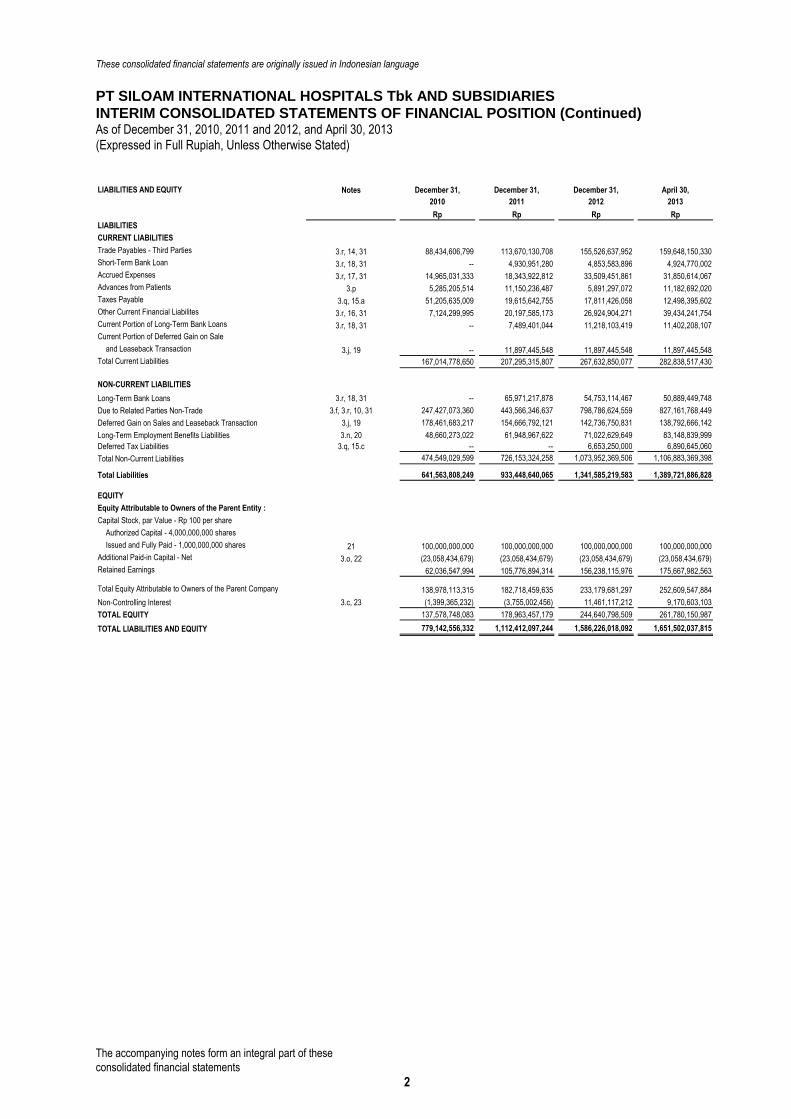
INTERIM CONSOLIDATED STATEMENTS OF FINANCIAL POSITION (Continued) As of December 31, 2010, 2011 and 2012, and April 30, 2013
(Expressed in Full Rupiah, Unless Otherwise Stated)
LIABILITIES AND EQUITY Notes December 31, December 31, December 31, April 30,
2010 2011 2012 2013
Rp Rp Rp Rp
LIABILITIES
CURRENT LIABILITIES
Trade Payables - Third Parties 3.r, 14, 31 88,434,606,799 113,670,130,708 155,526,637,952 159,648,150,330
Short-Term Bank Loan 3.r, 18, 31 -- 4,930,951,280 4,853,583,896 4,924,770,002
Accrued Expenses 3.r, 17, 31 14,965,031,333 18,343,922,812 33,509,451,861 31,850,614,067
Advances from Patients 3.p 5,285,205,514 11,150,236,487 5,891,297,072 11,182,692,020
Taxes Payable 3.q, 15.a 51,205,635,009 19,615,642,755 17,811,426,058 12,498,395,602
Other Current Financial Liabilites 3.r, 16, 31 7,124,299,995 20,197,585,173 26,924,904,271 39,434,241,754
Current Portion of Long-Term Bank Loans 3.r, 18, 31 -- 7,489,401,044 11,218,103,419 11,402,208,107
Current Portion of Deferred Gain on Sale
and Leaseback Transaction 3.j, 19 -- 11,897,445,548 11,897,445,548 11,897,445,548
Total Current Liabilities 167,014,778,650 207,295,315,807 267,632,850,077 282,838,517,430
NON-CURRENT LIABILITIES
Long-Term Bank Loans 3.r, 18, 31 -- 65,971,217,878 54,753,114,467 50,889,449,748
Due to Related Parties Non-Trade 3.f, 3.r, 10, 31 247,427,073,360 443,566,346,637 798,786,624,559 827,161,768,449
Deferred Gain on Sales and Leaseback Transaction 3.j, 19 178,461,683,217 154,666,792,121 142,736,750,831 138,792,666,142
Long-Term Employment Benefits Liabilities 3.n, 20 48,660,273,022 61,948,967,622 71,022,629,649 83,148,839,999
Deferred Tax Liabilities 3.q, 15.c -- -- 6,653,250,000 6,890,645,060
Total Non-Current Liabilities 474,549,029,599 726,153,324,258 1,073,952,369,506 1,106,883,369,398
Total Liabilities 641,563,808,249 933,448,640,065 1,341,585,219,583 1,389,721,886,828
EQUITY
Equity Attributable to Owners of the Parent Entity :
Capital Stock, par Value - Rp 100 per share
Authorized Capital - 4,000,000,000 shares as of December 31,
Issued and Fully Paid - 1,000,000,000 shares 21 100,000,000,000 100,000,000,000 100,000,000,000 100,000,000,000
Additional Paid-in Capital - Net 3.o, 22 (23,058,434,679) (23,058,434,679) (23,058,434,679) (23,058,434,679)
Retained Earnings 62,036,547,994 105,776,894,314 156,238,115,976 175,667,982,563
Total Equity Attributable to Owners of the Parent Company 138,978,113,315 182,718,459,635 233,179,681,297 252,609,547,884
Non-Controlling Interest 3.c, 23 (1,399,365,232) (3,755,002,456) 11,461,117,212 9,170,603,103
TOTAL EQUITY 137,578,748,083 178,963,457,179 244,640,798,509 261,780,150,987
TOTAL LIABILITIES AND EQUITY 779,142,556,332 1,112,412,097,244 1,586,226,018,092 1,651,502,037,815
The accompanying notes form an integral part of these
consolidated financial statements
Draft/26 Juli 2013 3 paraf:
These consolidated financial statements are originally issued in Indonesian language
PT SILOAM INTERNATIONAL HOSPITALS Tbk AND SUBSIDIARIES
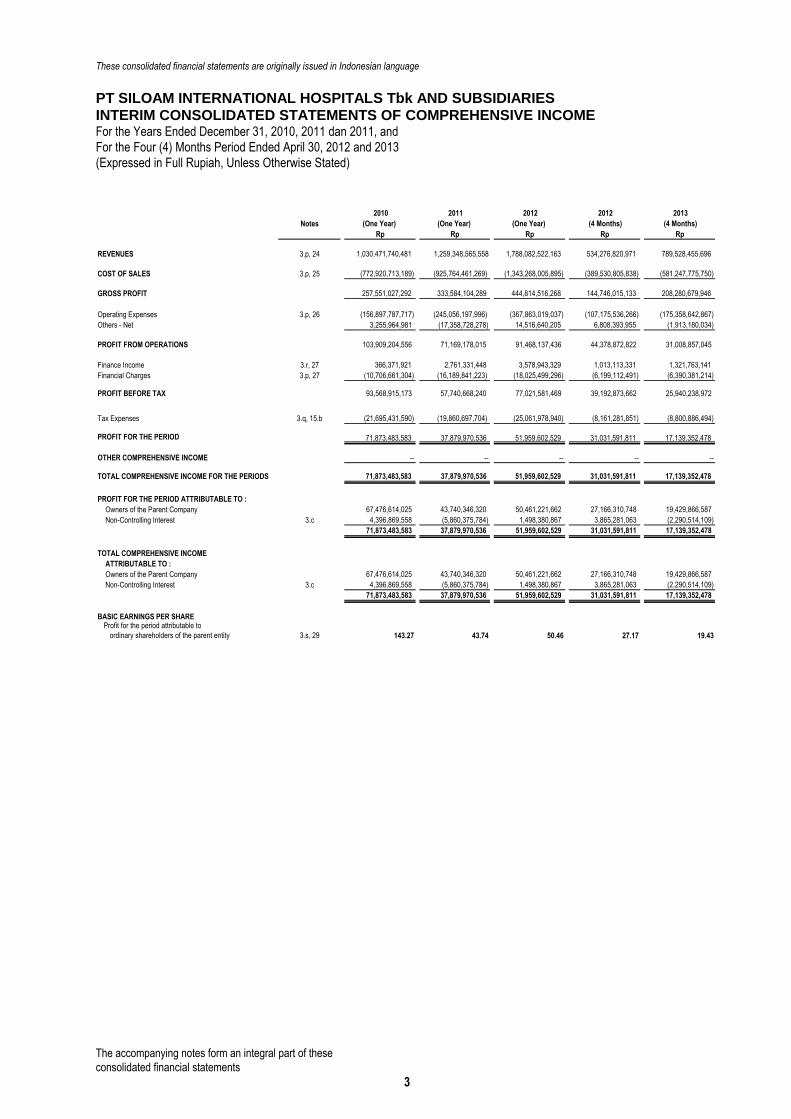
INTERIM CONSOLIDATED STATEMENTS OF COMPREHENSIVE INCOME For the Years Ended December 31, 2010, 2011 dan 2011, and
For the Four (4) Months Period Ended April 30, 2012 and 2013
(Expressed in Full Rupiah, Unless Otherwise Stated)
2010 2011 2012 2012 2013
Notes (One Year) (One Year) (One Year) (4 Months) (4 Months)
Rp Rp Rp Rp RpOPERASI YANG DILANJUTKAN
REVENUES 3.p, 24 1,030,471,740,481 1,259,348,565,558 1,788,082,522,163 534,276,820,971 789,528,455,696
COST OF SALES 3.p, 25 (772,920,713,189) (925,764,461,269) (1,343,268,005,895) (389,530,805,838) (581,247,775,750)
GROSS PROFIT 257,551,027,292 333,584,104,289 444,814,516,268 144,746,015,133 208,280,679,946
Operating Expenses 3.p, 26 (156,897,787,717) (245,056,197,996) (367,863,019,037) (107,175,536,266) (175,358,642,867)
Others - Net 3,255,964,981 (17,358,728,278) 14,516,640,205 6,808,393,955 (1,913,180,034)
PROFIT FROM OPERATIONS 103,909,204,556 71,169,178,015 91,468,137,436 44,378,872,822 31,008,857,045
Finance Income 3.r, 27 366,371,921 2,761,331,448 3,578,943,329 1,013,113,331 1,321,763,141
Financial Charges 3.p, 27 (10,706,661,304) (16,189,841,223) (18,025,499,296) (6,199,112,491) (6,390,381,214)
PROFIT BEFORE TAX 93,568,915,173 57,740,668,240 77,021,581,469 39,192,873,662 25,940,238,972
Tax Expenses 3.q, 15.b (21,695,431,590) (19,860,697,704) (25,061,978,940) (8,161,281,851) (8,800,886,494)
PROFIT FOR THE PERIOD 71,873,483,583 37,879,970,536 51,959,602,529 31,031,591,811 17,139,352,478
OTHER COMPREHENSIVE INCOME -- -- -- -- --
TOTAL COMPREHENSIVE INCOME FOR THE PERIODS 71,873,483,583 37,879,970,536 51,959,602,529 31,031,591,811 17,139,352,478
PROFIT FOR THE PERIOD ATTRIBUTABLE TO :
Owners of the Parent Company 67,476,614,025 43,740,346,320 50,461,221,662 27,166,310,748 19,429,866,587
Non-Controlling Interest 3.c 4,396,869,558 (5,860,375,784) 1,498,380,867 3,865,281,063 (2,290,514,109)
71,873,483,583 37,879,970,536 51,959,602,529 31,031,591,811 17,139,352,478
TOTAL COMPREHENSIVE INCOME
YANG DAPAT DIATRIBUSIKAN KEPADA:ATTRIBUTABLE TO :
Owners of the Parent Company 67,476,614,025 43,740,346,320 50,461,221,662 27,166,310,748 19,429,866,587
Non-Controlling Interest 3.c 4,396,869,558 (5,860,375,784) 1,498,380,867 3,865,281,063 (2,290,514,109)
71,873,483,583 37,879,970,536 51,959,602,529 31,031,591,811 17,139,352,478
BASIC EARNINGS PER SHAREProfit for the period attributable to
ordinary shareholders of the parent entity 3.s, 29 143.27 43.74 50.46 27.17 19.43
The accompanying notes form an integral part of these
consolidated financial statements
Draft/ 26 July 2013 4 paraf:
These consolidated financial statements are originally issued in Indonesian language
PT SILOAM INTERNATIONAL HOSPITALS Tbk AND SUBSIDIARIES
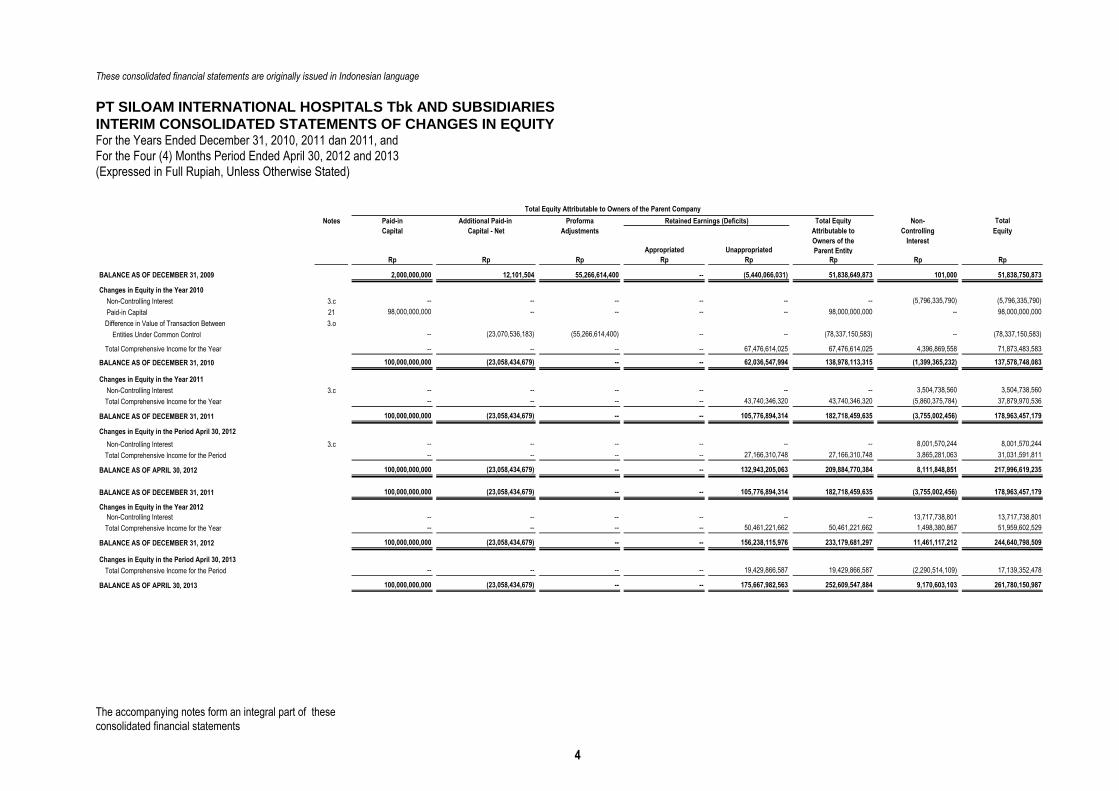
INTERIM CONSOLIDATED STATEMENTS OF CHANGES IN EQUITY For the Years Ended December 31, 2010, 2011 dan 2011, and
For the Four (4) Months Period Ended April 30, 2012 and 2013
(Expressed in Full Rupiah, Unless Otherwise Stated)
Notes Paid-in Additional Paid-in Proforma Total Equity Non- Total
Capital Capital - Net Adjustments Attributable to Controlling Equity
Owners of the InterestAppropriated Unappropriated Parent Entity
Rp Rp Rp Rp Rp Rp Rp Rp
BALANCE AS OF DECEMBER 31, 2009 2,000,000,000 12,101,504 55,266,614,400 -- (5,440,066,031) 51,838,649,873 101,000 51,838,750,873 `
Changes in Equity in the Year 2010
Kepentingan NonpengendaliNon-Controlling Interest 3.c -- -- -- -- -- -- (5,796,335,790) (5,796,335,790)
Tambahan Modal DisetorPaid-in Capital 21 98,000,000,000 -- -- -- -- 98,000,000,000 -- 98,000,000,000
Difference in Value of Transaction Between 3.o
Entities Under Common Control -- (23,070,536,183) (55,266,614,400) -- -- (78,337,150,583) -- (78,337,150,583)
Total Comprehensive Income for the Year -- -- -- -- 67,476,614,025 67,476,614,025 4,396,869,558 71,873,483,583
BALANCE AS OF DECEMBER 31, 2010 100,000,000,000 (23,058,434,679) -- -- 62,036,547,994 138,978,113,315 (1,399,365,232) 137,578,748,083 ` ` ` ` ` `
Changes in Equity in the Year 2011
Kepentingan NonpengendaliNon-Controlling Interest 3.c -- -- -- -- -- -- 3,504,738,560 3,504,738,560
Total Comprehensive Income for the Year -- -- -- -- 43,740,346,320 43,740,346,320 (5,860,375,784) 37,879,970,536
BALANCE AS OF DECEMBER 31, 2011 100,000,000,000 (23,058,434,679) -- -- 105,776,894,314 182,718,459,635 (3,755,002,456) 178,963,457,179 ` ` ` ` ` `
Changes in Equity in the Period April 30, 2012
Kepentingan NonpengendaliNon-Controlling Interest 3.c -- -- -- -- -- -- 8,001,570,244 8,001,570,244
Total Comprehensive Income for the Period -- -- -- -- 27,166,310,748 27,166,310,748 3,865,281,063 31,031,591,811
BALANCE AS OF APRIL 30, 2012 100,000,000,000 (23,058,434,679) -- -- 132,943,205,063 209,884,770,384 8,111,848,851 217,996,619,235 ` ` ` ` ` `
BALANCE AS OF DECEMBER 31, 2011 100,000,000,000 (23,058,434,679) -- -- 105,776,894,314 182,718,459,635 (3,755,002,456) 178,963,457,179
Changes in Equity in the Year 2012
Kepentingan NonpengendaliNon-Controlling Interest -- -- -- -- -- -- 13,717,738,801 13,717,738,801
Total Comprehensive Income for the Year -- -- -- -- 50,461,221,662 50,461,221,662 1,498,380,867 51,959,602,529
BALANCE AS OF DECEMBER 31, 2012 100,000,000,000 (23,058,434,679) -- -- 156,238,115,976 233,179,681,297 11,461,117,212 244,640,798,509 ` ` ` ` ` `
Changes in Equity in the Period April 30, 2013
Total Comprehensive Income for the Period -- -- -- -- 19,429,866,587 19,429,866,587 (2,290,514,109) 17,139,352,478
BALANCE AS OF APRIL 30, 2013 100,000,000,000 (23,058,434,679) -- -- 175,667,982,563 252,609,547,884 9,170,603,103 261,780,150,987 ` ` ` ` ` `
Total Equity Attributable to Owners of the Parent Company
Retained Earnings (Deficits)

The accompanying notes form an integral part of these
consolidated financial statements
Draft/26 Juli 2013 5 paraf:
These consolidated financial statements are originally issued in Indonesian language
PT SILOAM INTERNATIONAL HOSPITALS Tbk AND SUBSIDIARIES
INTERIM CONSOLIDATED STATEMENTS OF CASH FLOWS For the Years Ended December 31, 2010, 2011 dan 2011, and
For the Four (4) Months Period Ended April 30, 2012 and 2013
(Expressed in Full Rupiah, Unless Otherwise Stated)
2010 2011 2012 2012 2013
(One Year) (One Year) (One Year) (4 Months) (4 Months)
Rp Rp Rp Rp Rp
CASH FLOWS FROM OPERATING ACTIVITIES
Collections from Customers 1,012,918,495,073 1,215,161,716,555 1,717,899,210,398 504,590,716,320 748,063,449,927
Payments to Suppliers (567,175,616,152) (929,372,228,432) (1,185,761,503,827) (209,484,467,998) (558,531,169,712)
Payments to Management and Employees (148,372,963,517) (195,789,623,285) (281,533,520,002) (80,357,877,279) (128,064,190,140)
Cash Flows from (Used in) Operations 297,369,915,404 89,999,864,838 250,604,186,569 214,748,371,043 61,468,090,075
Financial Charges Payment - Net (10,340,289,383) (13,428,509,775) (14,446,555,967) (5,185,999,160) (5,068,618,073)
Payments of Taxes (23,632,052,250) (23,146,312,250) (33,150,330,144) (16,677,150,999) (9,225,679,354)
Net Cash Provided by Operating Activities 263,397,573,771 53,425,042,813 203,007,300,458 192,885,220,884 47,173,792,648
CASH FLOWS FROM INVESTING ACTIVITIES
Advances for Purchase of Property and Equipment and Other Advances (1,676,266,867) (34,740,233,850) (128,786,188,553) (108,154,950,119) (12,387,108,295)
Property and Equipment
Disposal 24,500,000 63,233,901 45,520,996 -- --
Acquisition (165,696,987,329) (246,675,387,886) (394,108,463,782) (70,012,999,910) (71,510,290,234)
Acquisition of subsidiaries, net of Cash Acquired -- -- (52,811,697,309) (52,811,697,309) --
Receipt of Hospital Performance Guarantee -- -- 61,000,000,000 -- --
Payment of Advances for Investment (104,098,825,813) -- -- -- --
Net Cash Used in Investing Activities (271,447,580,009) (281,352,387,835) (514,660,828,648) (230,979,647,338) (83,897,398,529)
CASH FLOWS FROM FINANCING ACTIVITIES
Receipt from (Payment to) Related Parties - Net
Proceeds 364,812,000,000 973,664,465,115 641,716,869,459 235,360,829,459 184,600,000,000
Payment (446,519,022,300) (616,837,485,787) (313,699,617,537) (214,980,604,743) (156,224,854,110)
Bank Loans
Proceeds -- -- -- -- 71,186,106
Payment (1,009,877,929) (4,919,933,715) (7,566,768,420) (2,500,664,496) (3,679,560,031)
Receipt of Paid-in Capital 98,000,000,000 -- -- -- --
Net Cash Provided by Financing Activities 15,283,099,771 351,907,045,613 320,450,483,502 17,879,560,220 24,766,771,965
NET INCREASE (DECREASE) IN CASH AND CASH EQUIVALENT 7,233,093,533 123,979,700,591 8,796,955,312 (20,214,866,234) (11,956,833,916)
Effect of Foreign Exchange on Cash and Cash Equivalents at the End of the Period (1,374,849,354) (320,503,712) 13,324,485,939 6,897,848,021 (379,459,184)
CASH AND CASH EQUIVALENTS AT BEGINNING PERIOD 17,069,076,370 22,927,320,549 146,586,517,428 146,586,517,428 168,707,958,679
CASH AND CASH EQUIVALENTS AT ENDING PERIOD 22,927,320,549 146,586,517,428 168,707,958,679 133,269,499,215 156,371,665,579
These consolidated financial statements are originally issued in Indonesian language
PT SILOAM INTERNATIONAL HOSPITALS Tbk AND SUBSIDIARIES
NOTES TO THE INTERIM CONSOLIDATED FINANCIAL STATEMENTS For the Years Ended December 31, 2010, 2011 and 2012 and
For the Four (4) Months Period Ended April 30, 2012 and 2013
(In Full Rupiah, Unless Otherwise Stated)
DrDraft/ July 26, 2013 6 paraf:
1. General
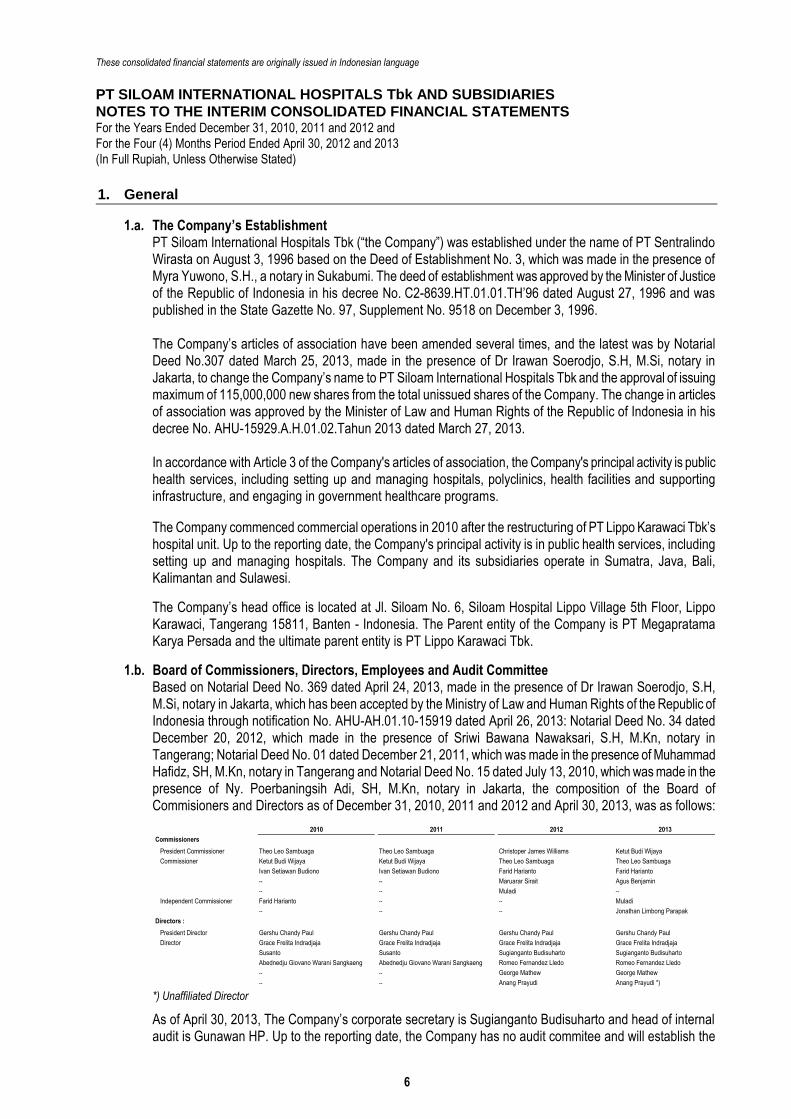
1.a. The Company’s Establishment PT Siloam International Hospitals Tbk (“the Company”) was established under the name of PT Sentralindo Wirasta on August 3, 1996 based on the Deed of Establishment No. 3, which was made in the presence of Myra Yuwono, S.H., a notary in Sukabumi. The deed of establishment was approved by the Minister of Justice of the Republic of Indonesia in his decree No. C2-8639.HT.01.01.TH’96 dated August 27, 1996 and was published in the State Gazette No. 97, Supplement No. 9518 on December 3, 1996. The Company’s articles of association have been amended several times, and the latest was by Notarial Deed No.307 dated March 25, 2013, made in the presence of Dr Irawan Soerodjo, S.H, M.Si, notary in Jakarta, to change the Company’s name to PT Siloam International Hospitals Tbk and the approval of issuing maximum of 115,000,000 new shares from the total unissued shares of the Company. The change in articles of association was approved by the Minister of Law and Human Rights of the Republic of Indonesia in his decree No. AHU-15929.A.H.01.02.Tahun 2013 dated March 27, 2013. In accordance with Article 3 of the Company's articles of association, the Company's principal activity is public health services, including setting up and managing hospitals, polyclinics, health facilities and supporting infrastructure, and engaging in government healthcare programs.
The Company commenced commercial operations in 2010 after the restructuring of PT Lippo Karawaci Tbk’s hospital unit. Up to the reporting date, the Company's principal activity is in public health services, including setting up and managing hospitals. The Company and its subsidiaries operate in Sumatra, Java, Bali, Kalimantan and Sulawesi.
The Company’s head office is located at Jl. Siloam No. 6, Siloam Hospital Lippo Village 5th Floor, Lippo Karawaci, Tangerang 15811, Banten - Indonesia. The Parent entity of the Company is PT Megapratama Karya Persada and the ultimate parent entity is PT Lippo Karawaci Tbk.
1.b. Board of Commissioners, Directors, Employees and Audit Committee Based on Notarial Deed No. 369 dated April 24, 2013, made in the presence of Dr Irawan Soerodjo, S.H, M.Si, notary in Jakarta, which has been accepted by the Ministry of Law and Human Rights of the Republic of Indonesia through notification No. AHU-AH.01.10-15919 dated April 26, 2013: Notarial Deed No. 34 dated December 20, 2012, which made in the presence of Sriwi Bawana Nawaksari, S.H, M.Kn, notary in Tangerang; Notarial Deed No. 01 dated December 21, 2011, which was made in the presence of Muhammad Hafidz, SH, M.Kn, notary in Tangerang and Notarial Deed No. 15 dated July 13, 2010, which was made in the presence of Ny. Poerbaningsih Adi, SH, M.Kn, notary in Jakarta, the composition of the Board of Commisioners and Directors as of December 31, 2010, 2011 and 2012 and April 30, 2013, was as follows:
2010 2011 2012 2013
Commissioners
President Commissioner Theo Leo Sambuaga Theo Leo Sambuaga Christoper James Williams Ketut Budi Wijaya
Commissioner Ketut Budi Wijaya Ketut Budi Wijaya Theo Leo Sambuaga Theo Leo Sambuaga
Ivan Setiawan Budiono Ivan Setiawan Budiono Farid Harianto Farid Harianto
-- -- Maruarar Sirait Agus Benjamin
-- -- Muladi --
Independent Commissioner Farid Harianto -- -- Muladi
-- -- -- Jonathan Limbong Parapak
Directors :
President Director Gershu Chandy Paul Gershu Chandy Paul Gershu Chandy Paul Gershu Chandy Paul
Director Grace Frelita Indradjaja Grace Frelita Indradjaja Grace Frelita Indradjaja Grace Frelita Indradjaja
Susanto Susanto Sugianganto Budisuharto Sugianganto Budisuharto
Abednedju Giovano Warani Sangkaeng Abednedju Giovano Warani Sangkaeng Romeo Fernandez Lledo Romeo Fernandez Lledo
-- -- George Mathew George Mathew
-- -- Anang Prayudi Anang Prayudi *) *) Unaffiliated Director
As of April 30, 2013, The Company’s corporate secretary is Sugianganto Budisuharto and head of internal audit is Gunawan HP. Up to the reporting date, the Company has no audit commitee and will establish the
These consolidated financial statements are originally issued in Indonesian language
PT SILOAM INTERNATIONAL HOSPITALS Tbk AND SUBSIDIARIES
NOTES TO THE INTERIM CONSOLIDATED FINANCIAL STATEMENTS (Continued) For the Years Ended December 31, 2010, 2011 and 2012 and
For the Four (4) Months Period Ended April 30, 2012 and 2013
(In Full Rupiah, Unless Otherwise Stated)
Draft/July 26, 2013 7 paraf:
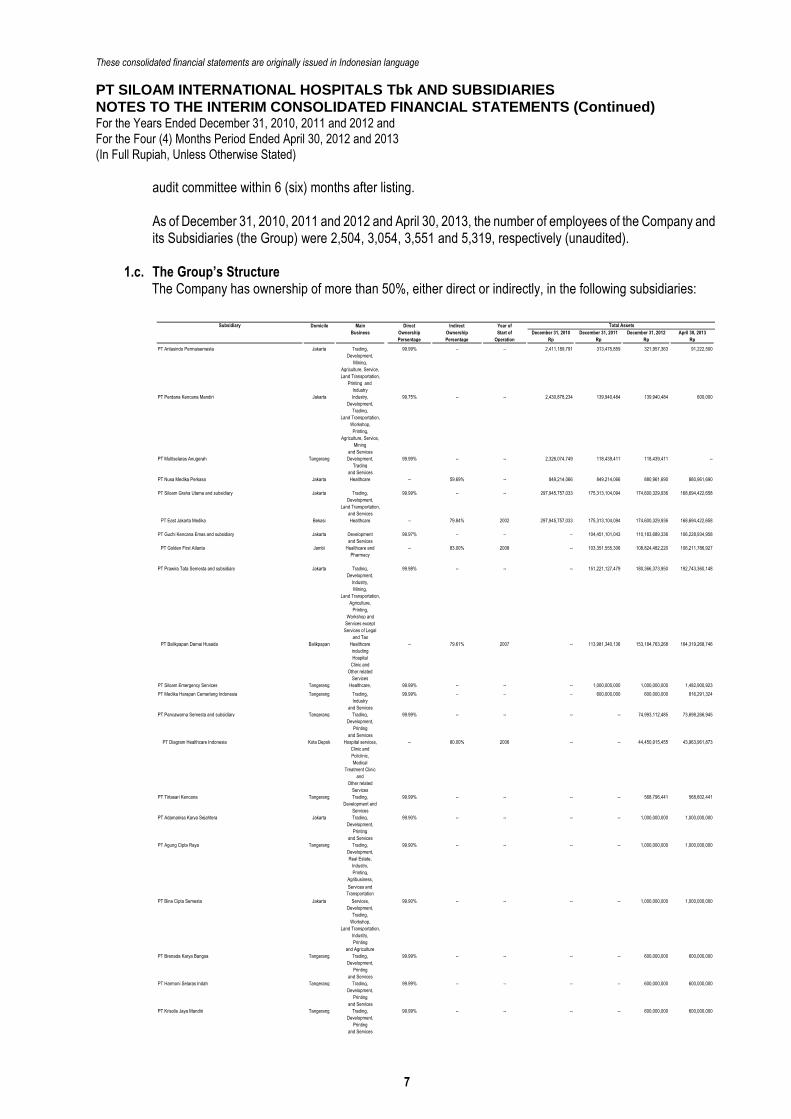
audit committee within 6 (six) months after listing. As of December 31, 2010, 2011 and 2012 and April 30, 2013, the number of employees of the Company and its Subsidiaries (the Group) were 2,504, 3,054, 3,551 and 5,319, respectively (unaudited).
1.c. The Group’s Structure The Company has ownership of more than 50%, either direct or indirectly, in the following subsidiaries:
Domicile Main Direct Indirect Year of
Business Ownership Ownership Start of December 31, 2010 December 31, 2011 December 31, 2012 April 30, 2013
Persentage Persentage Operation Rp Rp Rp Rp
PT Aritasindo Permaisemesta Jakarta Trading, 99.99% -- -- 2,411,189,791 313,475,859 321,957,363 91,222,500
Development,
Mining,
Agriculture, Service,
Land Transportation,
Printing and
Industry
PT Perdana Kencana Mandiri Jakarta Industry, 99.75% -- -- 2,430,878,234 139,940,484 139,940,484 600,000
Development,
Trading,
Land Transportation,
Workshop,
Printing,
Agriculture, Service,
Mining
and Services
PT Multiselaras Anugerah Tangerang Development, 99.99% -- -- 2,326,074,749 118,439,411 118,439,411 --
Trading
and Services
PT Nusa Medika Perkasa Jakarta Healthcare -- 59.69% -- 849,214,066 849,214,066 880,961,690 880,961,690
PT Siloam Graha Utama and subsidiary Jakarta Trading, 99.99% -- -- 297,945,757,033 175,313,104,094 174,600,329,936 168,694,422,658
Development,
Land Transportation,
and Services
PT East Jakarta Medika Bekasi Healthcare -- 79.84% 2002 297,945,757,033 175,313,104,094 174,600,329,936 168,694,422,658
PT Guchi Kencana Emas and subsidiary Jakarta Development 99.97% -- -- -- 104,451,101,043 110,183,689,336 106,228,934,958
and Services
PT Golden First Atlanta Jambi Healthcare and -- 83.00% 2008 -- 103,351,555,306 108,824,482,220 106,211,786,927
Pharmacy
PT Prawira Tata Semesta and subsidiary Jakarta Trading, 99.98% -- -- -- 151,221,127,479 180,366,373,950 192,743,360,148
Development,
Industry,
Mining,
Land Transportation,
Agriculture,
Printing,
Workshop and
Services except
Services of Legal
and Tax
PT Balikpapan Damai Husada Balikpapan Healthcare -- 79.61% 2007 -- 113,981,340,136 153,184,763,268 164,319,268,746
including
Hospital
Clinic and
Other related
Services
PT Siloam Emergency Services Tangerang Healthcare, 99.99% -- -- -- 1,000,000,000 1,000,000,000 1,482,900,923
PT Medika Harapan Cemerlang Indonesia Tangerang Trading, 99.99% -- -- -- 600,000,000 600,000,000 816,291,324
Industry
and Services
PT Pancawarna Semesta and subsidiary Tangerang Trading, 99.99% -- -- -- -- 74,993,112,485 73,698,266,945
Development,
Printing
and Services
PT Diagram Healthcare Indonesia Kota Depok Hospital services, -- 80.00% 2006 -- -- 44,450,915,455 43,963,961,873
Clinic and
Policlinic,
Medical
Treatment Clinic
and
Other related
Services
PT Tirtasari Kencana Tangerang Trading, 99.99% -- -- -- -- 568,796,441 568,602,441
Development and
Services
PT Adamanisa Karya Sejahtera Jakarta Trading, 99.90% -- -- -- -- 1,000,000,000 1,000,000,000
Development,
Printing
and Services
PT Agung Cipta Raya Tangerang Trading, 99.90% -- -- -- -- 1,000,000,000 1,000,000,000
Development,
Real Estate,
Industry,
Printing,
Agribusiness,
Services and
Transportation
PT Bina Cipta Semesta Jakarta Services, 99.90% -- -- -- -- 1,000,000,000 1,000,000,000
Development,
Trading,
Workshop,
Land Transportation,
Industry,
Printing
and Agriculture
PT Brenada Karya Bangsa Tangerang Trading, 99.99% -- -- -- -- 600,000,000 600,000,000
Development,
Printing
and Services
PT Harmoni Selaras Indah Tangerang Trading, 99.99% -- -- -- -- 600,000,000 600,000,000
Development,
Printing
and Services
PT Krisolis Jaya Mandiri Tangerang Trading, 99.99% -- -- -- -- 600,000,000 600,000,000
Development,
Printing
and Services
Subsidiary Total Assets
These consolidated financial statements are originally issued in Indonesian language
PT SILOAM INTERNATIONAL HOSPITALS Tbk AND SUBSIDIARIES
NOTES TO THE INTERIM CONSOLIDATED FINANCIAL STATEMENTS (Continued) For the Years Ended December 31, 2010, 2011 and 2012 and
For the Four (4) Months Period Ended April 30, 2012 and 2013
(In Full Rupiah, Unless Otherwise Stated)
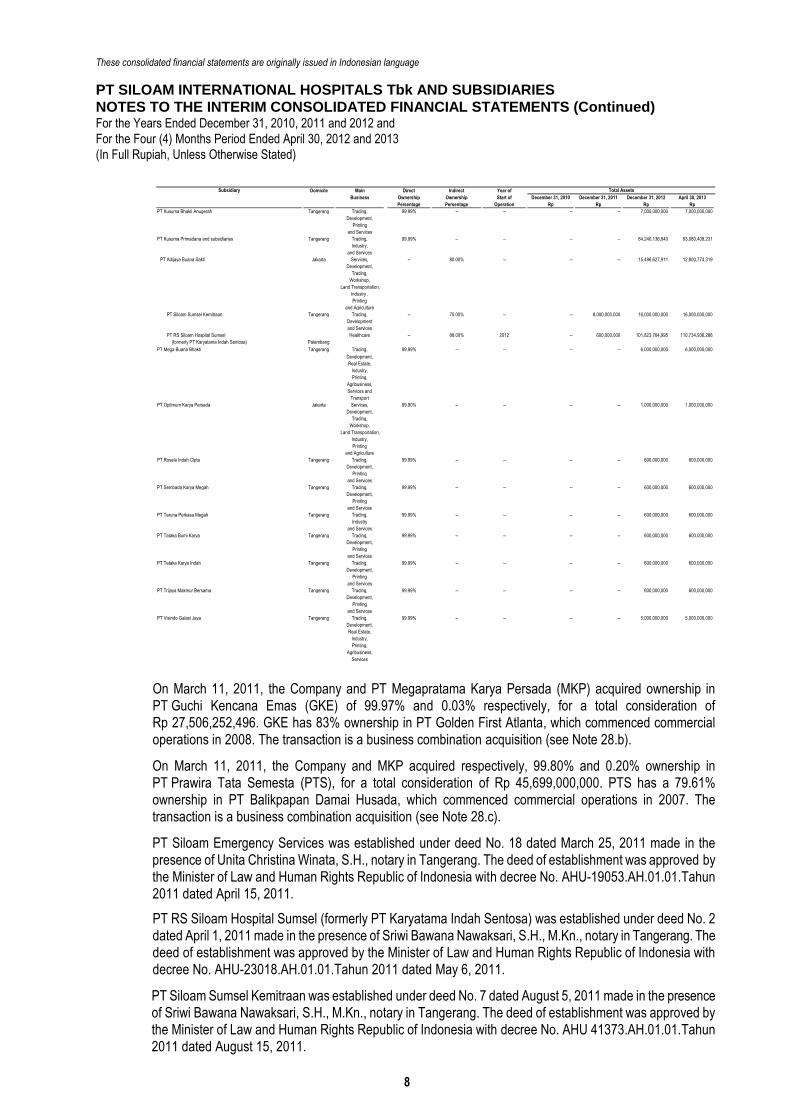
Draft/July 26, 2013 8 paraf:
Domicile Main Direct Indirect Year of
Business Ownership Ownership Start of December 31, 2010 December 31, 2011 December 31, 2012 April 30, 2013
Persentage Persentage Operation Rp Rp Rp Rp
PT Kusuma Bhakti Anugerah Tangerang Trading, 99.99% -- -- -- -- 7,000,000,000 7,000,000,000
Development,
Printing
and Services
PT Kusuma Primadana and subsidiaries Tangerang Trading, 99.99% -- -- -- -- 84,240,136,940 93,080,408,231
Industry,
and Services
PT Adijaya Buana Sakti Jakarta Services, -- 80.00% -- -- -- 15,496,627,911 12,800,774,319
Development,
Trading,
Workshop,
Land Transportation,
Industry ,
Printing
and Agriculture
PT Siloam Sumsel Kemitraan Tangerang Trading, -- 70.00% -- -- 8,000,000,000 16,000,000,000 16,000,000,000
Development
and Services
PT RS Siloam Hospital Sumsel Healthcare -- 88.00% 2012 -- 600,000,000 101,823,764,995 110,734,936,286
(formerly PT Karyatama Indah Sentosa) Palembang
PT Mega Buana Bhakti Tangerang Trading, 99.99% -- -- -- -- 6,000,000,000 6,000,000,000
Development,
Real Estate,
Industry,
Printing,
Agribusiness,
Services and
Transport
PT Optimum Karya Persada Jakarta Services, 99.90% -- -- -- -- 1,000,000,000 1,000,000,000
Development,
Trading,
Workshop,
Land Transportation,
Industry,
Printing
and Agriculture
PT Rosela Indah Cipta Tangerang Trading, 99.99% -- -- -- -- 600,000,000 600,000,000
Development,
Printing
and Services
PT Sembada Karya Megah Tangerang Trading, 99.99% -- -- -- -- 600,000,000 600,000,000
Development,
Printing
and Services
PT Taruna Perkasa Megah Tangerang Trading, 99.99% -- -- -- -- 600,000,000 600,000,000
Industry
and Services
PT Tataka Bumi Karya Tangerang Trading, 99.99% -- -- -- -- 600,000,000 600,000,000
Development,
Printing
and Services
PT Tataka Karya Indah Tangerang Trading, 99.99% -- -- -- -- 600,000,000 600,000,000
Development,
Printing
and Services
PT Trijaya Makmur Bersama Tangerang Trading, 99.99% -- -- -- -- 600,000,000 600,000,000
Development,
Printing
and Services
PT Visindo Galaxi Jaya Tangerang Trading, 99.99% -- -- -- -- 5,000,000,000 5,000,000,000
Development,
Real Estate,
Industry,
Printing,
Agribusiness,
Services
Subsidiary Total Assets
On March 11, 2011, the Company and PT Megapratama Karya Persada (MKP) acquired ownership in PT Guchi Kencana Emas (GKE) of 99.97% and 0.03% respectively, for a total consideration of Rp 27,506,252,496. GKE has 83% ownership in PT Golden First Atlanta, which commenced commercial operations in 2008. The transaction is a business combination acquisition (see Note 28.b).
On March 11, 2011, the Company and MKP acquired respectively, 99.80% and 0.20% ownership in PT Prawira Tata Semesta (PTS), for a total consideration of Rp 45,699,000,000. PTS has a 79.61% ownership in PT Balikpapan Damai Husada, which commenced commercial operations in 2007. The transaction is a business combination acquisition (see Note 28.c).
PT Siloam Emergency Services was established under deed No. 18 dated March 25, 2011 made in the presence of Unita Christina Winata, S.H., notary in Tangerang. The deed of establishment was approved by the Minister of Law and Human Rights Republic of Indonesia with decree No. AHU-19053.AH.01.01.Tahun 2011 dated April 15, 2011.
PT RS Siloam Hospital Sumsel (formerly PT Karyatama Indah Sentosa) was established under deed No. 2 dated April 1, 2011 made in the presence of Sriwi Bawana Nawaksari, S.H., M.Kn., notary in Tangerang. The deed of establishment was approved by the Minister of Law and Human Rights Republic of Indonesia with decree No. AHU-23018.AH.01.01.Tahun 2011 dated May 6, 2011.
PT Siloam Sumsel Kemitraan was established under deed No. 7 dated August 5, 2011 made in the presence of Sriwi Bawana Nawaksari, S.H., M.Kn., notary in Tangerang. The deed of establishment was approved by the Minister of Law and Human Rights Republic of Indonesia with decree No. AHU 41373.AH.01.01.Tahun 2011 dated August 15, 2011.
These consolidated financial statements are originally issued in Indonesian language
PT SILOAM INTERNATIONAL HOSPITALS Tbk AND SUBSIDIARIES
NOTES TO THE INTERIM CONSOLIDATED FINANCIAL STATEMENTS (Continued) For the Years Ended December 31, 2010, 2011 and 2012 and
For the Four (4) Months Period Ended April 30, 2012 and 2013
(In Full Rupiah, Unless Otherwise Stated)
Draft/July 26, 2013 9 paraf:
PT Medika Harapan Cemerlang Indonesia was established under deed No. 1 dated September 5, 2011 made in the presence of Sriwi Bawana Nawaksari, S.H., M.Kn., notary in Tangerang. The deed of establishment was approved by the Minister of Law and Human Rights Republic of Indonesia with decree No. AHU-51717.AH.01.01.Tahun 2011 dated October 24, 2011. On March 26, 2012, the Company and MKP acquired respectively, 99.99% and 0.01% ownership in PT Pancawarna Semesta (PWS). At the acquisition date, PWS has not yet started operation and therefore, it was recorded as an asset acquisition. Based on deed No. 80 dated May 31, 2012, made in the presence of Siti Pertiwi Henny Singgih, SH, Notary in Jakarta, PT Pancawarna Semesta (PWS) acquired 80% ownership in PT Diagram Healthcare Indonesia (DHI), with acquisition cost of Rp 58,752,000,000. This transaction is a business combination acquisition (see Note 28.a). PT DHI commenced commercial operations in 2006. On May 30, 2012, the Company and MKP acquired respectively, 99.99% and 0.01% ownership in PT Bina Cipta Semesta (BCS) with acquisition cost of Rp 999,000,000 and Rp 1,000,000. At the acquisition date, BCS had not yet started operations and therefore, it was recorded as an asset acquisition. On May 30, 2012, the Company and MKP acquired respectively, 99.99% and 0.01% ownership in PT Kusuma Bakti Anugerah (KBA) with acquisition cost of Rp 6,999,900,000 and Rp 100,000. At the acquisition date, KBA had not yet started operations and therefore, it was recorded as an asset acquisition. On May 30, 2012, the Company and MKP acquired respectively, 99.99% and 0.01% ownership in PT Mega Buana Bhakti (MBB) with acquisition cost of Rp 5,999,900,000 and Rp 100,000. At the acquisition date, MBB had not yet started operations and therefore, it was recorded as an asset acquisition. On May 30, 2012, the Company and MKP acquired respectively, 99.99% and 0.01% ownership in PT Visindo Galaxi Jaya (VGJ) with acquisition cost of Rp 4,999,900,000 and Rp 100,000. At the acquisition date, VGJ had not yet started operations and therefore, it was recorded as an asset acquisition.
On May 30, 2012, the Company and MKP acquired respectively, 99.99% and 0.01% ownership in PT Agung Cipta Raya (ACR) with acquisition cost of Rp 999,000,000 and Rp 1,000,000. At the acquisition date, ACR had not yet started operations and therefore, it was recorded as an asset acquisition. On June 4, 2012, the Company and MKP acquired respectively, 99.99% and 0.01% ownership in PT Tirtasari Kencana (TK) with acquisition cost of Rp 599,999,000 and Rp 1,000. At the acquisition date, TK had not yet started operations and therefore, it was recorded as an asset acquisition.
On June 29, 2012, the Company and MKP acquired respectively, 99.99% and 0.01% ownership in PT Adamanisa Karya Sejahtera (AKS) with acquisition cost of Rp 999,000,000 and Rp 1,000,000. At the acquisition date, AKS had not yet started operations and therefore, it was recorded as an asset acquisition.
PT Trijaya Makmur Bersama was established under deed No. 3 dated June 1, 2012 made in the presence of Sriwi Bawana Nawaksari, S.H., M.Kn., notary in Tangerang. The deed of establishment was approved by the Minister of Law and Human Rights Republic of Indonesia with decree No. AHU-32448.AH.01.01.Tahun 2012 dated June 14, 2012. PT Taruna Perkasa Megah was established under deed No. 2 dated June 1, 2012 made in the presence of Sriwi Bawana Nawaksari, S.H., M.Kn., notary in Tangerang. The deed of establishment was approved by the Minister of Law and Human Rights Republic of Indonesia with decree No. AHU-32836.AH.01.01.Tahun 2012 dated June 15, 2012.
These consolidated financial statements are originally issued in Indonesian language
PT SILOAM INTERNATIONAL HOSPITALS Tbk AND SUBSIDIARIES
NOTES TO THE INTERIM CONSOLIDATED FINANCIAL STATEMENTS (Continued) For the Years Ended December 31, 2010, 2011 and 2012 and
For the Four (4) Months Period Ended April 30, 2012 and 2013
(In Full Rupiah, Unless Otherwise Stated)
Draft/July 26, 2013 10 paraf:
PT Krisolis Jaya Mandiri was established under deed No. 1 dated June 1, 2012 made in the presence of Sriwi Bawana Nawaksari, S.H., M.Kn., notary in Tangerang. The deed of establishment was approved by the Minister of Law and Human Rights Republic of Indonesia with decree No. AHU-32835.AH.01.01.Tahun 2012 dated June 15, 2012. On June 4, 2012, the Company and MKP acquired respectively, 99.99% and 0.01% ownership in PT Optimum Karya Persada (OKP) with acquisition cost of Rp 999,000,000 and Rp 1,000,000. At the acquisition date, OKP had not yet started operations and therefore, it was recorded as an asset acquisition. PT Tataka Karya Indah was established under deed No. 11 dated June 4, 2012 made in the presence of Sriwi Bawana Nawaksari, S.H., M.Kn., notary in Tangerang. The deed of establishment was approved by the Minister of Law and Human Rights Republic of Indonesia with decree No. AHU-32573.AH.01.01.Tahun 2012 dated June 14, 2012. PT Brenada Karya Bangsa was established under deed No. 9 dated June 4, 2012 made in the presence of Sriwi Bawana Nawaksari, S.H., M.Kn., notary in Tangerang. The deed of establishment was approved by the Minister of Law and Human Rights Republic of Indonesia with decree No. AHU-32744.AH.01.01.Tahun 2012 dated June 15, 2012. PT Harmoni Selaras Indah was established under deed No. 13 dated June 4, 2012 made in the presence of Sriwi Bawana Nawaksari, S.H., M.Kn., notary in Tangerang. The deed of establishment was approved by the Minister of Law and Human Rights Republic of Indonesia with decree No. AHU-32893.AH.01.01.Tahun 2012 dated June 15, 2012. PT Rosela Indah Cipta was established under deed No. 12 dated June 4, 2012 made in the presence of Sriwi Bawana Nawaksari, S.H., M.Kn., notary in Tangerang. The deed of establishment was approved by the Minister of Law and Human Rights Republic of Indonesia with decree No. AHU-32746.AH.01.01.Tahun 2012 dated June 15, 2012.
PT Tataka Bumi Karya was established under deed No. 10 dated June 4, 2012 made in the presence of Sriwi Bawana Nawaksari, S.H., M.Kn., notary in Tangerang. The deed of establishment was approved by the Minister of Law and Human Rights Republic of Indonesia with decree No. AHU-32745.AH.01.01.Tahun 2012 dated June 15, 2012.
PT Sembada Karya Megah was established under deed No. 8 dated June 4, 2012 made in the presence of Sriwi Bawana Nawaksari, S.H., M.Kn., a notary in Tangerang. The deed of establishment was approved by the Minister of Law and Human Rights Republic of Indonesia with decree No. AHU-32890.AH.01.01.Tahun 2012 dated June 15, 2012.
On June 21, 2012, the Company and MKP acquired respectively, 99.90% and 0.01% ownership in PT Kusuma Primadana (KP) with acquisition cost of Rp 99,999,000 and Rp 1,000. KP has 80% ownership in PT Adijaya Buana Sakti (ABS). At the acquisition date, KP had not yet started operations and therefore, it was recorded as an asset acquisition.
2. New Financial Accounting Standards
Indonesian Financial Accounting Standards (SAK) are Standards and Interpretations issued by the Financial Accounting Standards Board of the Indonesian Institute of Accountants (DSAK-IAI) and the regulation of capital market regulator, that is the Indonesia Financial Services Authority (OJK) (or formerly called Bapepam-LK), for the entity under its supervision. The following new SAK along with its impact applied to the Group:
These consolidated financial statements are originally issued in Indonesian language
PT SILOAM INTERNATIONAL HOSPITALS Tbk AND SUBSIDIARIES
NOTES TO THE INTERIM CONSOLIDATED FINANCIAL STATEMENTS (Continued) For the Years Ended December 31, 2010, 2011 and 2012 and
For the Four (4) Months Period Ended April 30, 2012 and 2013
(In Full Rupiah, Unless Otherwise Stated)
Draft/July 26, 2013 11 paraf:
Statements and Interpretations issued DSAK-IAI The following is statements (PSAK), Interpretations (ISAK) and the Statements of Withdrawal (PPSAK) which have been issued by DSAK-IAI are to be applied to the consolidated financial statements of the fiscal year beginning on or after January 1, 2013:
Adjustments of PSAK No. 60: Financial Instruments and Disclosures
PSAK No. 38 (Revised 2011) : Business Combination for Entities Under Common Control
ISAK No. 21 : Real Estate Construction Agreement
PPSAK No. 7 : Revocation of PSAK No. 44: Accounting for Real Estate Development Activity paragraphs 1-46, 49-55 and 62-64
PPSAK No. 10 : Revocation of PSAK No. 51: Accounting for Quasi-Reorganization
The application of ISAK No. 21 and PPSAK No. 7 above have been postponed until a date to be determined later, according to the announcement letter of DSAK-IAI No. 0643/DSAK/IAI/IX/2012 dated September 21, 2012. Whereas PSAK No. 60, PSAK No. 38 and PPSAK No. 10, did not have a material impact to the consolidated financial statements.
3. Summary of Significant Accounting Policies
3.a. Compliance with the Financial Accounting Standards The Group’s consolidated financial statements have been prepared and presented in accordance with the Indonesian Financial Accounting Standards which include the Statements and the Interpretations as issued by DSAK-IAI and Regulation of Bapepam-LK No. VIII.G.7 regarding the “Guidance of Financial Statements Presentation” as set forth in decree No. KEP-347/BL/2012 regarding the amendment to Regulation No. VIII.G.7 and other accounting policies which prevailing in the Capital Market.
The financial statements were issued by the Company to OJK in relation to the Registration Statement for the Company’s Initial Public Offering.
3.b. Basis of Measurement and Preparation of Consolidated Financial Statements The consolidated financial statements have been prepared on a going concern assumption and on the accrual basis, except for the consolidated statements of cash flows which used the cash basis. The basis of measurement in the preparation of these consolidated financial statements is the historical cost principle, except for certain accounts that were measured using other basis, as described in the respective accounting policy.
The consolidated statements of cash flows have been presented by classifying the activities into operating, investing and financing. The cash flows from operating activities were prepared using the direct method.
The functional currency of the Company and its subsidiaries is Indonesian Rupiah. Transactions are recorded using the functional currency. The reporting currency used in the preparation of these consolidated financial statements is the Indonesian Rupiah.
3.c. Principles of Consolidation The consolidated financial statements include the accounts of the Company and its subsidiaries (including special purpose entities) either directly or indirectly controlled, as presented in Note 1.c.
Control also exists when the parent entity owns half or less of the voting power of an entity when there is: a. power over more than half of the voting rights by virtue of an agreement with other investors; b. power to govern the financial and operating policies of the entity under a statute or an agreement; c. power to appoint or remove the majority of the members of the board of directors or equivalent governing
body and control of the entity is by that board or body; or d. power to cast the majority of votes in the meetings of the board of directors or equivalent governing body
and control of the entity is by that board or body.

These consolidated financial statements are originally issued in Indonesian language
PT SILOAM INTERNATIONAL HOSPITALS Tbk AND SUBSIDIARIES
NOTES TO THE INTERIM CONSOLIDATED FINANCIAL STATEMENTS (Continued) For the Years Ended December 31, 2010, 2011 and 2012 and
For the Four (4) Months Period Ended April 30, 2012 and 2013
(In Full Rupiah, Unless Otherwise Stated)
Draft/July 26, 2013 12 paraf:
The existence and effect of potential voting rights that can be implemented or converted on the date of the reporting period should be considered when assessing whether an entity has the power to govern financial and operating policies of another entity. The entities are consolidated from the date on which control was transferred to the Company and are no longer consolidated when the Company ceases to have control. Control is obtained when the entity has the power to govern the financial and operating policies of another entity to obtain the benefits of the entity activity. The consolidated financial statements have been prepared on the basis of entity concept. All significant related intercompany accounts, transactions and profits among the consolidated companies have been eliminated to reflect the financial position and result of operations as a whole entity. The changes in the Company’s ownership interest in a subsidiary that do not result to a loss of control are accounted for as equity transactions and attributed to the owners of the parent. All major transactions and inter-company account balances (including significant unrealized gain or loss) have been eliminated. Non-controlling interest reflects the profit or loss and net assets of subsidiaries portion that are not attributable directly or indirectly to the parent entity, which is presented in the consolidated statements of comprehensive income and as equity in the consolidated statements of financial position, separated from portion which is attributable to parent entity.
3.d. Foreign Currency Transactions
A foreign currency is a currency other than the functional currency. Transactions during the current period using foreign currencies are recorded at the spot rate prevailing on the transaction date. At the reporting date, transactions in foreign currencies were translated using the following closing rates:
December 31, December 31, December 31, April 30,
2010 2011 2012 2013
Rp Rp Rp Rp
1 USD 8,991 9,068 9,670 9,722
1 EUR 11,956 11,739 12,810 12,730
1 SGD 6,981 6,974 7,907 7,879
Gains and losses from foreign exchange differences arising from foreign currency transactions into Rupiah are charged to profit or loss.
Whereas the non-monetary assets and liabilities denominated in foreign currencies were measured using the exchange rate on the transaction date and monetary assets and liabilities denominated in foreign currencies were measured at fair value using the exchange rate on the date of fair value measurement.
3.e. Cash and Cash Equivalent Cash consist of cash on hand and in banks, are not used as collateral and not restricted.
Cash equivalent consists of time deposits certificates with maturities of not more than or equal to three (3) months from the date of placement and are not restricted.
These consolidated financial statements are originally issued in Indonesian language
PT SILOAM INTERNATIONAL HOSPITALS Tbk AND SUBSIDIARIES
NOTES TO THE INTERIM CONSOLIDATED FINANCIAL STATEMENTS (Continued) For the Years Ended December 31, 2010, 2011 and 2012 and
For the Four (4) Months Period Ended April 30, 2012 and 2013
(In Full Rupiah, Unless Otherwise Stated)
Draft/July 26, 2013 13 paraf:
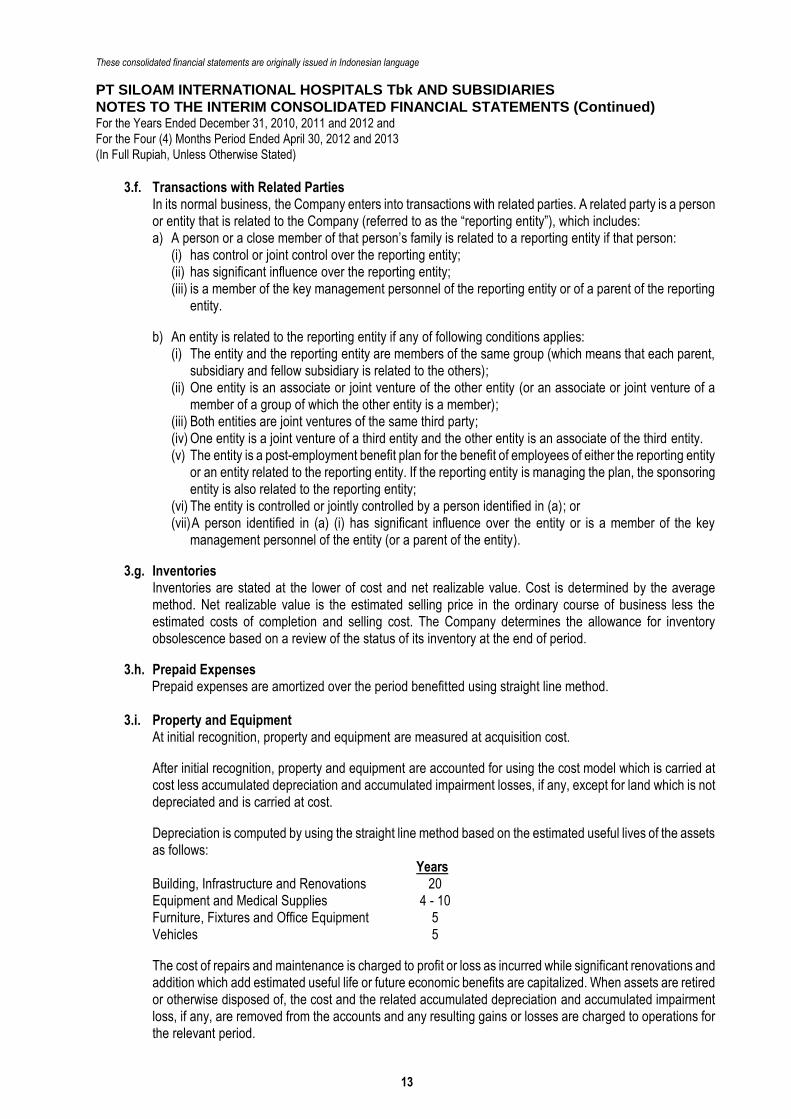
3.f. Transactions with Related Parties In its normal business, the Company enters into transactions with related parties. A related party is a person or entity that is related to the Company (referred to as the “reporting entity”), which includes: a) A person or a close member of that person’s family is related to a reporting entity if that person:
(i) has control or joint control over the reporting entity; (ii) has significant influence over the reporting entity; (iii) is a member of the key management personnel of the reporting entity or of a parent of the reporting
entity.
b) An entity is related to the reporting entity if any of following conditions applies: (i) The entity and the reporting entity are members of the same group (which means that each parent,
subsidiary and fellow subsidiary is related to the others); (ii) One entity is an associate or joint venture of the other entity (or an associate or joint venture of a
member of a group of which the other entity is a member); (iii) Both entities are joint ventures of the same third party; (iv) One entity is a joint venture of a third entity and the other entity is an associate of the third entity. (v) The entity is a post-employment benefit plan for the benefit of employees of either the reporting entity
or an entity related to the reporting entity. If the reporting entity is managing the plan, the sponsoring entity is also related to the reporting entity;
(vi) The entity is controlled or jointly controlled by a person identified in (a); or (vii) A person identified in (a) (i) has significant influence over the entity or is a member of the key
management personnel of the entity (or a parent of the entity).
3.g. Inventories Inventories are stated at the lower of cost and net realizable value. Cost is determined by the average method. Net realizable value is the estimated selling price in the ordinary course of business less the estimated costs of completion and selling cost. The Company determines the allowance for inventory obsolescence based on a review of the status of its inventory at the end of period.
3.h. Prepaid Expenses Prepaid expenses are amortized over the period benefitted using straight line method.
3.i. Property and Equipment At initial recognition, property and equipment are measured at acquisition cost.
After initial recognition, property and equipment are accounted for using the cost model which is carried at cost less accumulated depreciation and accumulated impairment losses, if any, except for land which is not depreciated and is carried at cost.
Depreciation is computed by using the straight line method based on the estimated useful lives of the assets as follows: Years Building, Infrastructure and Renovations 20 Equipment and Medical Supplies 4 - 10 Furniture, Fixtures and Office Equipment 5 Vehicles 5
The cost of repairs and maintenance is charged to profit or loss as incurred while significant renovations and addition which add estimated useful life or future economic benefits are capitalized. When assets are retired or otherwise disposed of, the cost and the related accumulated depreciation and accumulated impairment loss, if any, are removed from the accounts and any resulting gains or losses are charged to operations for the relevant period.
These consolidated financial statements are originally issued in Indonesian language
PT SILOAM INTERNATIONAL HOSPITALS Tbk AND SUBSIDIARIES
NOTES TO THE INTERIM CONSOLIDATED FINANCIAL STATEMENTS (Continued) For the Years Ended December 31, 2010, 2011 and 2012 and
For the Four (4) Months Period Ended April 30, 2012 and 2013
(In Full Rupiah, Unless Otherwise Stated)
Draft/July 26, 2013 14 paraf:
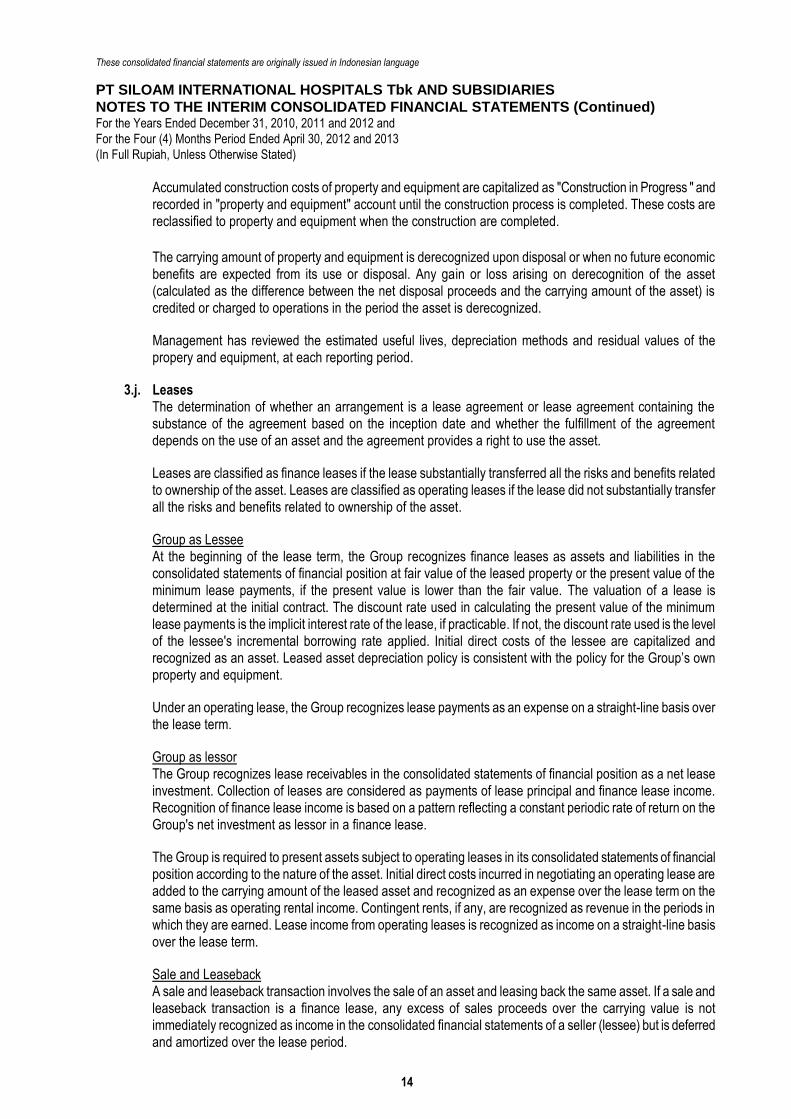
Accumulated construction costs of property and equipment are capitalized as "Construction in Progress " and recorded in "property and equipment" account until the construction process is completed. These costs are reclassified to property and equipment when the construction are completed.
The carrying amount of property and equipment is derecognized upon disposal or when no future economic benefits are expected from its use or disposal. Any gain or loss arising on derecognition of the asset (calculated as the difference between the net disposal proceeds and the carrying amount of the asset) is credited or charged to operations in the period the asset is derecognized.
Management has reviewed the estimated useful lives, depreciation methods and residual values of the propery and equipment, at each reporting period.
3.j. Leases The determination of whether an arrangement is a lease agreement or lease agreement containing the substance of the agreement based on the inception date and whether the fulfillment of the agreement depends on the use of an asset and the agreement provides a right to use the asset.
Leases are classified as finance leases if the lease substantially transferred all the risks and benefits related to ownership of the asset. Leases are classified as operating leases if the lease did not substantially transfer all the risks and benefits related to ownership of the asset.
Group as Lessee At the beginning of the lease term, the Group recognizes finance leases as assets and liabilities in the consolidated statements of financial position at fair value of the leased property or the present value of the minimum lease payments, if the present value is lower than the fair value. The valuation of a lease is determined at the initial contract. The discount rate used in calculating the present value of the minimum lease payments is the implicit interest rate of the lease, if practicable. If not, the discount rate used is the level of the lessee's incremental borrowing rate applied. Initial direct costs of the lessee are capitalized and recognized as an asset. Leased asset depreciation policy is consistent with the policy for the Group’s own property and equipment.
Under an operating lease, the Group recognizes lease payments as an expense on a straight-line basis over the lease term.
Group as lessor The Group recognizes lease receivables in the consolidated statements of financial position as a net lease investment. Collection of leases are considered as payments of lease principal and finance lease income. Recognition of finance lease income is based on a pattern reflecting a constant periodic rate of return on the Group's net investment as lessor in a finance lease.
The Group is required to present assets subject to operating leases in its consolidated statements of financial position according to the nature of the asset. Initial direct costs incurred in negotiating an operating lease are added to the carrying amount of the leased asset and recognized as an expense over the lease term on the same basis as operating rental income. Contingent rents, if any, are recognized as revenue in the periods in which they are earned. Lease income from operating leases is recognized as income on a straight-line basis over the lease term.
Sale and Leaseback A sale and leaseback transaction involves the sale of an asset and leasing back the same asset. If a sale and leaseback transaction is a finance lease, any excess of sales proceeds over the carrying value is not immediately recognized as income in the consolidated financial statements of a seller (lessee) but is deferred and amortized over the lease period.

These consolidated financial statements are originally issued in Indonesian language
PT SILOAM INTERNATIONAL HOSPITALS Tbk AND SUBSIDIARIES
NOTES TO THE INTERIM CONSOLIDATED FINANCIAL STATEMENTS (Continued) For the Years Ended December 31, 2010, 2011 and 2012 and
For the Four (4) Months Period Ended April 30, 2012 and 2013
(In Full Rupiah, Unless Otherwise Stated)
Draft/July 26, 2013 15 paraf:
If a sale and leaseback transaction is an operating lease, and it is clear that the transaction is established at fair value, any profit or loss is recognized immediately. If the sales price is below fair value, any profit or loss is recognized immediately except if the loss is compensated by future lease payments below market price where it is deferred and amortized in proportion to the lease payments over the period for which the asset is expected to be used.
3.k. Impairment of Non-Financial Assets The amount of recoverable assets shall be estimated at the time of the events or changes in circumstances indicate that the carrying value may not be recoverable. An impairment loss is recognized in the current period.
The impairment loss which was recognized in prior periods is reversed if and only if there is a change in the estimates used to determine the assets recoverable amount since the last impairment loss was recognized. Recoverable amount can be recognized only by reversing an amount which has been recognized. In the periods of consolidated financial statements, there were no impairment of non-financial assets.
3.l. Business Combination The Group accounts for each business combination by applying the acquisition method. The consideration transferred for an acquisition is measured at the aggregate of the fair values of assets given-up, liabilities assumed and equity instruments issued by the Company. Acquisition-related costs are recognized in the profit or loss as incurred. The Group recognizes the identifiable assets acquired and liabilities taken over at their fair value on the acquisition date, except for the following:
Deferred tax assets or liabilities that are related to assets acquired and liabilities taken over in business combination are recognized and measured in accordance with PSAK No. 46 (Revised 2010), “Income Taxes”.
Liabilities (or assets, if any) related to employee benefit arrangements from the acquiree are recognized and measured in accordance with PSAK No. 24 (Revised 2010), “Employee Benefits”.
Liabilities or equity instruments related to the replacement of an acquiree’s share-based payment awards are measured in accordance with PSAK No. 53 (Revised 2010), “Share-based Payment”.
Non-current assets (or disposal groups) acquired which are classified as held for sale are measured in accordance with PSAK No. 58 (Revised 2009), “Non-current Assets Held for Sale and Discontinued Operations”.
3.m. Intangible Assets
Goodwill Goodwill arising in a business combination is recognized as an asset on the date that control is acquired. Goodwill is measured as the excess of the sum of the consideration transferred, the amount of any noncontrolling interests in the acquiree, and the fair value of the acquirer’s previously held equity interest in the acquiree over the net of the acquisition date amounts of the identifiable assets acquired and the liabilities taken over. Goodwill is not amortized but is reviewed for impairment at least annually or more frequently when there is an indication that the goodwill may be impaired. For the purpose of impairment testing, goodwill is allocated to each of the cash-generating units expected to benefit from the synergies of the combination. If the recoverable amount of the cash-generating unit is less than its carrying amount, the impairment loss is allocated first to reduce the carrying amount of any goodwill allocated to the unit and then to the other assets of the unit prorated on the basis of the carrying amount of each asset in the unit. An impairment loss is
These consolidated financial statements are originally issued in Indonesian language
PT SILOAM INTERNATIONAL HOSPITALS Tbk AND SUBSIDIARIES
NOTES TO THE INTERIM CONSOLIDATED FINANCIAL STATEMENTS (Continued) For the Years Ended December 31, 2010, 2011 and 2012 and
For the Four (4) Months Period Ended April 30, 2012 and 2013
(In Full Rupiah, Unless Otherwise Stated)
Draft/July 26, 2013 16 paraf:
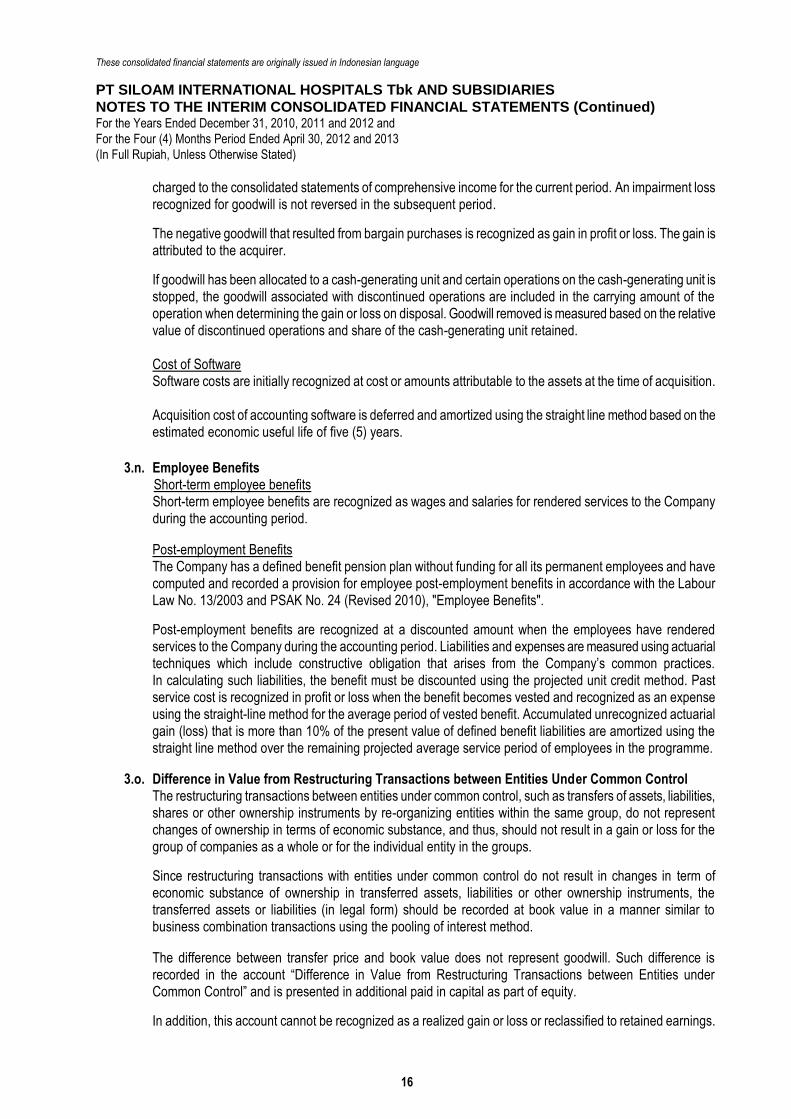
charged to the consolidated statements of comprehensive income for the current period. An impairment loss recognized for goodwill is not reversed in the subsequent period.
The negative goodwill that resulted from bargain purchases is recognized as gain in profit or loss. The gain is attributed to the acquirer.
If goodwill has been allocated to a cash-generating unit and certain operations on the cash-generating unit is stopped, the goodwill associated with discontinued operations are included in the carrying amount of the operation when determining the gain or loss on disposal. Goodwill removed is measured based on the relative value of discontinued operations and share of the cash-generating unit retained. Cost of Software Software costs are initially recognized at cost or amounts attributable to the assets at the time of acquisition. Acquisition cost of accounting software is deferred and amortized using the straight line method based on the estimated economic useful life of five (5) years.
3.n. Employee Benefits Short-term employee benefits
Short-term employee benefits are recognized as wages and salaries for rendered services to the Company during the accounting period.
Post-employment Benefits The Company has a defined benefit pension plan without funding for all its permanent employees and have computed and recorded a provision for employee post-employment benefits in accordance with the Labour Law No. 13/2003 and PSAK No. 24 (Revised 2010), "Employee Benefits".
Post-employment benefits are recognized at a discounted amount when the employees have rendered services to the Company during the accounting period. Liabilities and expenses are measured using actuarial techniques which include constructive obligation that arises from the Company’s common practices. In calculating such liabilities, the benefit must be discounted using the projected unit credit method. Past service cost is recognized in profit or loss when the benefit becomes vested and recognized as an expense using the straight-line method for the average period of vested benefit. Accumulated unrecognized actuarial gain (loss) that is more than 10% of the present value of defined benefit liabilities are amortized using the straight line method over the remaining projected average service period of employees in the programme.
3.o. Difference in Value from Restructuring Transactions between Entities Under Common Control The restructuring transactions between entities under common control, such as transfers of assets, liabilities, shares or other ownership instruments by re-organizing entities within the same group, do not represent changes of ownership in terms of economic substance, and thus, should not result in a gain or loss for the group of companies as a whole or for the individual entity in the groups.
Since restructuring transactions with entities under common control do not result in changes in term of economic substance of ownership in transferred assets, liabilities or other ownership instruments, the transferred assets or liabilities (in legal form) should be recorded at book value in a manner similar to business combination transactions using the pooling of interest method.
The difference between transfer price and book value does not represent goodwill. Such difference is recorded in the account “Difference in Value from Restructuring Transactions between Entities under Common Control” and is presented in additional paid in capital as part of equity.
In addition, this account cannot be recognized as a realized gain or loss or reclassified to retained earnings.
These consolidated financial statements are originally issued in Indonesian language
PT SILOAM INTERNATIONAL HOSPITALS Tbk AND SUBSIDIARIES
NOTES TO THE INTERIM CONSOLIDATED FINANCIAL STATEMENTS (Continued) For the Years Ended December 31, 2010, 2011 and 2012 and
For the Four (4) Months Period Ended April 30, 2012 and 2013
(In Full Rupiah, Unless Otherwise Stated)
Draft/July 26, 2013 17 paraf:
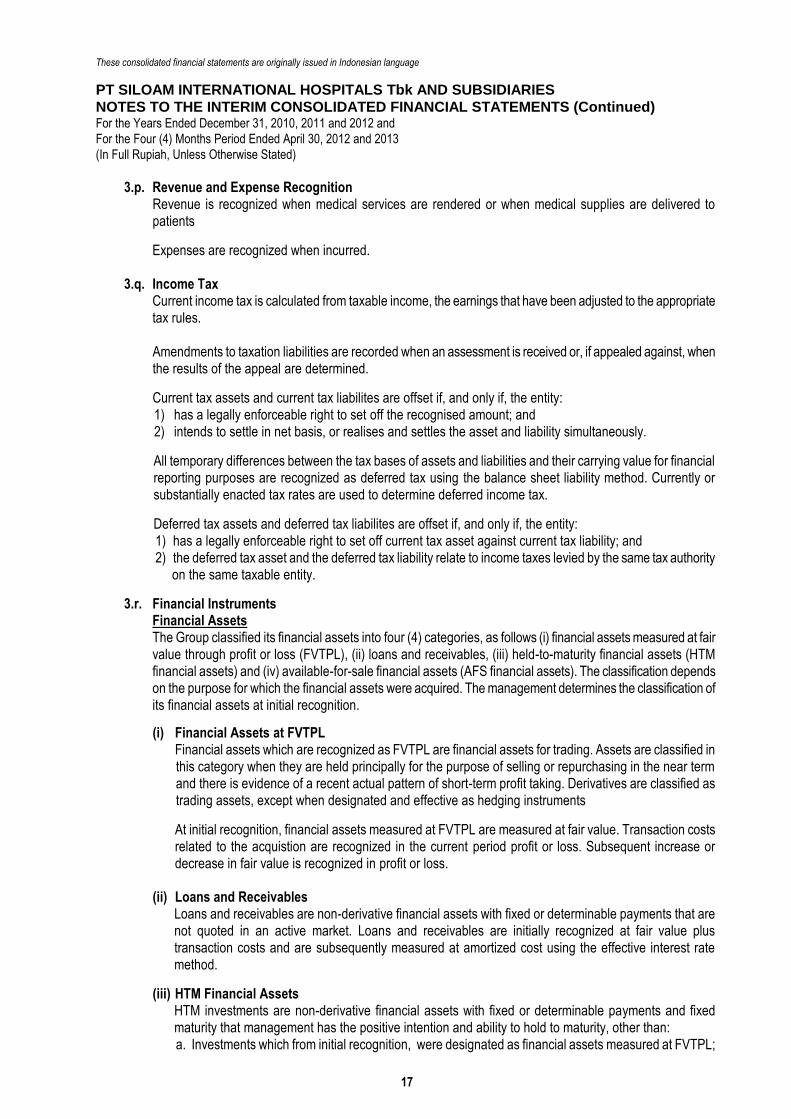
3.p. Revenue and Expense Recognition Revenue is recognized when medical services are rendered or when medical supplies are delivered to patients
Expenses are recognized when incurred.
3.q. Income Tax Current income tax is calculated from taxable income, the earnings that have been adjusted to the appropriate tax rules. Amendments to taxation liabilities are recorded when an assessment is received or, if appealed against, when the results of the appeal are determined.
Current tax assets and current tax liabilites are offset if, and only if, the entity: 1) has a legally enforceable right to set off the recognised amount; and 2) intends to settle in net basis, or realises and settles the asset and liability simultaneously.
All temporary differences between the tax bases of assets and liabilities and their carrying value for financial reporting purposes are recognized as deferred tax using the balance sheet liability method. Currently or substantially enacted tax rates are used to determine deferred income tax.
Deferred tax assets and deferred tax liabilites are offset if, and only if, the entity: 1) has a legally enforceable right to set off current tax asset against current tax liability; and 2) the deferred tax asset and the deferred tax liability relate to income taxes levied by the same tax authority
on the same taxable entity.
3.r. Financial Instruments Financial Assets The Group classified its financial assets into four (4) categories, as follows (i) financial assets measured at fair value through profit or loss (FVTPL), (ii) loans and receivables, (iii) held-to-maturity financial assets (HTM financial assets) and (iv) available-for-sale financial assets (AFS financial assets). The classification depends on the purpose for which the financial assets were acquired. The management determines the classification of its financial assets at initial recognition.
(i) Financial Assets at FVTPL Financial assets which are recognized as FVTPL are financial assets for trading. Assets are classified in this category when they are held principally for the purpose of selling or repurchasing in the near term and there is evidence of a recent actual pattern of short-term profit taking. Derivatives are classified as trading assets, except when designated and effective as hedging instruments
At initial recognition, financial assets measured at FVTPL are measured at fair value. Transaction costs related to the acquistion are recognized in the current period profit or loss. Subsequent increase or decrease in fair value is recognized in profit or loss.
(ii) Loans and Receivables Loans and receivables are non-derivative financial assets with fixed or determinable payments that are not quoted in an active market. Loans and receivables are initially recognized at fair value plus transaction costs and are subsequently measured at amortized cost using the effective interest rate method.
(iii) HTM Financial Assets HTM investments are non-derivative financial assets with fixed or determinable payments and fixed maturity that management has the positive intention and ability to hold to maturity, other than: a. Investments which from initial recognition, were designated as financial assets measured at FVTPL;
These consolidated financial statements are originally issued in Indonesian language
PT SILOAM INTERNATIONAL HOSPITALS Tbk AND SUBSIDIARIES
NOTES TO THE INTERIM CONSOLIDATED FINANCIAL STATEMENTS (Continued) For the Years Ended December 31, 2010, 2011 and 2012 and
For the Four (4) Months Period Ended April 30, 2012 and 2013
(In Full Rupiah, Unless Otherwise Stated)
Draft/July 26, 2013 18 paraf:
b. Investments which are designated as available-for-sale; and c. Investments that meet the definition of loans and receivables.
At initial recognition, HTM investments are recognized at fair value plus transaction costs and are subsequently measured at amortized cost using the effective interest rate method.
(iv) AFS Financial Assets AFS financial asset are non-derivative financial assets that are held during a certain period with the intention for sale in order to fulfill liquidity needs, changes in interest rates or foreign exchange, or those that are not classified as loans and receivables, investments that are classified as held-to-maturity or financial assets at fair value through profit or loss.
At initial recognition, available for sale financial assets are recognized at fair value plus transaction costs and subsequently measured at fair value with any gain or loss recognized as other comprehensive income, except for impairment loss and foreign exchange, until the derecognition of the financial assets.
Financial Liabilities and Equity Instruments
Classification as debt or equity Financial liabilities and equity instruments issued by the Group are classified according to the substance of the contractual arrangements entered into and the definitions of financial liabilities and equity instruments.
Equity instruments An equity instrument is any contract that evidences a residual interest in the assets of the Group after deducting all of its liabilities. Equity instruments are recorded as the proceeds received, net of direct issue costs. Share issuance costs are presented as part of equity under "Additional Paid-in Capital – Net”.
Financial Liabilities Financial liabilities are classified into the categories of (i) financial liabilities measured at fair value through profit or loss (FVTPL) and (ii) financial liabilities measured at amortized cost.
(i) Financial liabilities measured at FVTPL Financial liabilities at fair value through profit or loss are the financial liabilities that are designated for trading. Financial liabilities are classified for trading if acquired primarily for the purpose of selling or repurchasing in the near term and there is evidence of a pattern of short-term profit taking. Derivatives are classified as trading liabilities except those effectively designated as hedging instruments.
At initial recognition, financial liabilities at FVTPL are recognized at fair value. Transaction costs in connection with to the acquisition are recognized in profit or loss for the period; subsequent increase or decrease in fair value are recognized in the profit or loss.
(ii) Financial Liabilities Measured at Amortized Cost Financial liabilities not classified as financial liabilities at fair value through profit or loss are categorized and measured using amortized cost.
At initial recognition, financial liabilities measured at amortized cost are recognized at fair value net of transaction costs and subsequently measured at amortized cost using the effective interest rate method.
Impairment of Financial Assets Financial assets, other than those at FVTPL, are assessed for indicators of impairment at the reporting date. Financial assets are impaired where there is objective evidence that, as a result of one or more events that occurred after the initial recognition of the financial asset, the estimated future cash flows of the investment have been impacted. For listed and unlisted equity investments classified as AFS, a significant or prolonged decline in the fair value of the equity investment below its cost is considered to be an objective evidence of impairment

These consolidated financial statements are originally issued in Indonesian language
PT SILOAM INTERNATIONAL HOSPITALS Tbk AND SUBSIDIARIES
NOTES TO THE INTERIM CONSOLIDATED FINANCIAL STATEMENTS (Continued) For the Years Ended December 31, 2010, 2011 and 2012 and
For the Four (4) Months Period Ended April 30, 2012 and 2013
(In Full Rupiah, Unless Otherwise Stated)
Draft/July 26, 2013 19 paraf:
Some objective evidence for impairment value are as follows:
significant financial difficulty of the issuer or counterparty; or
default or delinquency in interest or principal payments; or
it becoming probable that the borrower will enter bankruptcy or financial reorganization.
For certain categories of financial assets, such as receivables, the impairment value of assets are assessed individually. Objective evidence of impairment for a portfolio of receivables could include the Group’s past experience of collecting payments, an increase in the number of delayed payments in the portfolio past the average credit period and observable changes in the national or local economic conditions that correlate with default on receivables
For financial assets carried at amortized cost, the amount of impairment is the difference between the asset’s carrying amount and the present value of estimated future cash flows, discounted at the financial asset’s original effective interest rate.
The carrying amount of the financial asset is directly reduced by the amount of impairment loss for all financial assets with the exception of receivables, where the carrying amount is reduced through the use of an allowance account. When a receivable is considered uncollectible, it is written-off against the allowance account. Subsequent recoveries of amounts previously written-off are credited against the allowance account. Changes in the carrying amount of the allowance account are recognized in the profit or loss.
When an AFS financial asset is considered to be impaired, cumulative gains or losses previously recognized in equity are reclassified to the profit or loss.
With the exception of AFS equity instruments, if, in a subsequent period, the amount of the impairment loss decreases and the decrease can be related objectively to an event occurring after the impairment was recognized, the previously recognized impairment loss is reversed through profit or loss to the extent that the carrying amount of the investment on the date of the impairment is reversed does not exceed the amortized cost had there been no impairment recognized.
In respect of AFS equity securities, impairment losses previously recognized in the consolidated statement of comprehensive income are not reversed through profit or loss. Any increase in fair value subsequent to an impairment loss is recognized directly in equity.
Reclassification of Financial Assets Reclassification is only permitted in rare circumstances and where the asset is no longer held for the purpose of selling in the short-term. In all cases, reclassification of financial assets is limited to debt instruments. Reclassifications are accounted for at the fair value of the financial asset on the date of reclassification.
Offsetting of Financial Instruments Financial assets and liabilities are offset and the net amount is reported in the consolidated statements of financial position when there is a legally enforceable right to offset the recognized amounts and there is an intention to settle on a net basis, or realize the asset and settle the liability simultaneously.
Derecognition of Financial Assets and Liabilities The Group derecognizes a financial asset only when the contractual rights to the cash flows from the asset expire, or when it transfers the financial asset and substantially all the risks and rewards of ownership of the asset to another entity. If the Group neither transfers nor retains substantially all the risks and rewards of ownership and continues to control the transferred asset, the Group recognizes their retained interest in the asset and an associated liability for the amounts they may have to pay. If the Group retains substantially all the risks and rewards of ownership of a transferred financial asset, the Group continues to recognize the financial asset and also recognizes a collateralized borrowing for the proceeds received.

These consolidated financial statements are originally issued in Indonesian language
PT SILOAM INTERNATIONAL HOSPITALS Tbk AND SUBSIDIARIES
NOTES TO THE INTERIM CONSOLIDATED FINANCIAL STATEMENTS (Continued) For the Years Ended December 31, 2010, 2011 and 2012 and
For the Four (4) Months Period Ended April 30, 2012 and 2013
(In Full Rupiah, Unless Otherwise Stated)
Draft/July 26, 2013 20 paraf:
The Group derecognizes financial liabilities when, and only when, the Group’s obligations are discharged, cancelled or expired
Effective Interest Method The effective interest method is a method of calculating the amortized cost of a financial instrument and of allocating interest income over the relevant period. The effective interest rate is the rate that exactly discounts estimated future cash receipts (including all fees and others paid or received that form an integral part of the effective interest rate, transaction costs and other premiums or discounts) through the expected life of the financial instrument, or, where appropriate, a shorter period to the net carrying amount on initial recognition.
Income is recognized on an effective interest basis for financial instruments other than those financial
instruments at FVTPL.
Fair Value Determination The fair value of financial assets and liabilities must be estimated for recognition and measurement or for disclosure purposes.
PSAK No. 60, “Financial Instruments: Disclosures” requires disclosure of fair value measurements by level of the following fair value measurement hierarchy: (i) quoted prices (unadjusted) in active markets for identical assets or liabilities (level 1) (ii) inputs other than quoted prices included within level 1 that are observable for the asset or liability, either
directly (as prices) or indirectly (derived from prices) (level 2), and (iii) inputs for the asset or liability that are not based on observable market data (unobservable inputs) (level
3).
The fair value of financial instruments traded in active markets is based on quoted market prices at the reporting date. The quoted market price used for financial assets held by the Group is the current bid price, while ask price is used for financial liabilities. These instruments are included in level 1.
The fair value of financial instruments that are not traded in an active market is determined using valuation techniques. These valuation techniques maximize the use of observable market data where it is available and rely as minimum as possible on estimates. If all significant inputs required to fair value an instrument are observable, the instrument is included in level 2.
If one or more of the significant inputs is not based on observable market data, the instrument is included in level 3. This is the case for unlisted equity securities.
3.s. Earnings Per Share Earnings per share is computed by dividing income attributable to the parent by the weighted average number of common shares outstanding during the period.
Diluted earnings per share is computed considering other securities that potentially have a dilutive effect to ordinary shares outstanding during the reporting period.
3.t. Operating Segments Operating segments are identified based on internal reports on components of the Group that are regularly reviewed by the "operational decision maker" in allocating resources and assessing performance of the operating segments.
An operating segment is a component of an entity that engages in business activity in which operating results are evaluated regularly by management, and its financial information can be presented separately.
The Group evaluates operating segments based on the business activities of each hospital unit which is a strategic unit that promote products and services in different service areas. Products and services are managed separately because each unit hospital requires different market strategies and resources. Segment accounting policies are the same as described in the summary of significant accounting policies.
These consolidated financial statements are originally issued in Indonesian language
PT SILOAM INTERNATIONAL HOSPITALS Tbk AND SUBSIDIARIES
NOTES TO THE INTERIM CONSOLIDATED FINANCIAL STATEMENTS (Continued) For the Years Ended December 31, 2010, 2011 and 2012 and
For the Four (4) Months Period Ended April 30, 2012 and 2013
(In Full Rupiah, Unless Otherwise Stated)
Draft/July 26, 2013 21 paraf:
3.u. Significant Accounting Estimation and Justification The preparation of the consolidated financial statements in accordance with the Indonesian Financial Accounting Standards requires the management to make assumptions and estimates that could affect the carrying amounts of certain assets and liabilities at end of reporting period.
In the preparation of these consolidated financial statements, accounting assumptions have been made in the process of applying accounting policies that may affect the carrying amounts of assets and liabilties in the consolidated financial statements. In addition, there are accounting assumptions about the sources of estimation uncertainty at end of reporting period that could materially affect the carrying amounts of assets and liabilities in the subsequent reporting period.
The management periodically reviews them to ensure that the assumptions and estimates have been made based on all relevant information available on the date in which the consolidated financial statements have been prepared. Because there is inherent uncertainty in making estimates, the value of assets and liabilities to be reported in the future might differ from those estimates.
At the reporting date, the management has made significant assumptions and estimates which have the most significant impact to the carrying amount recognized in the consolidated financial statements, as follows:
Allowance for Impairment of Accounts Receivable In general, the management analyzes the adequacy of the allowance for impairment based on several data, which include analyzing historical bad debts, the concentration of each customer's trade receivables, credit worthiness and changes in a given period of repayment. The analysis is carried out individually on a significant amount of accounts receivable, while the insignificant group of trade receivables is carried on the collective basis. At the reporting date, the carrying amount of trade receivables has been reflected at fair value and the carrying value may change materially in the subsequent reporting period. The change, however, will not be attributable to the assumptions and estimates made as of this reporting date.
Deferred Tax Assets Estimation Management considerations are needed to determine the amount of deferred tax recognized in the profit or loss and the amount recorded as deferred tax assets. Recognition is performed only if it is probable that the asset will be recovered in the form of economic benefits to be received in future periods, in which the temporary differences and tax losses can still be used. Management also considers the future estimated taxable income and strategic tax planning in order to evaluate its deferred tax assets in accordance with applicable tax laws and its updates. As a result, related to its inherent nature, it is likely that the calculation of deferred taxes is related to a complex pattern where assessment requires a judgment and is not expected to provide an accurate calculation.
Estimated Useful Lives of Property and Equipment The Group makes a periodic review of the useful lives of property and equipment based on several factors such as physical and technical conditions and development of medical equipment technology in the future. The results of future operations will be materially influenced by the change in estimate as caused by changes in the factors mentioned above. Changes in estimated useful life of property and equipment, if any, are prospectively treated in accordance with PSAK No. 25 (Revised 2010), “Accounting Policies, Changes in Accounting Estimates and Errors”.
Post-employment Benefits The present value of post-employment benefits liability depends on several factors that are determined on an actuarial basis based on several assumptions. Assumptions used to determine the cost (income) include the discount rate. Changes in these assumptions will affect the carrying amount of post-employment benefits.
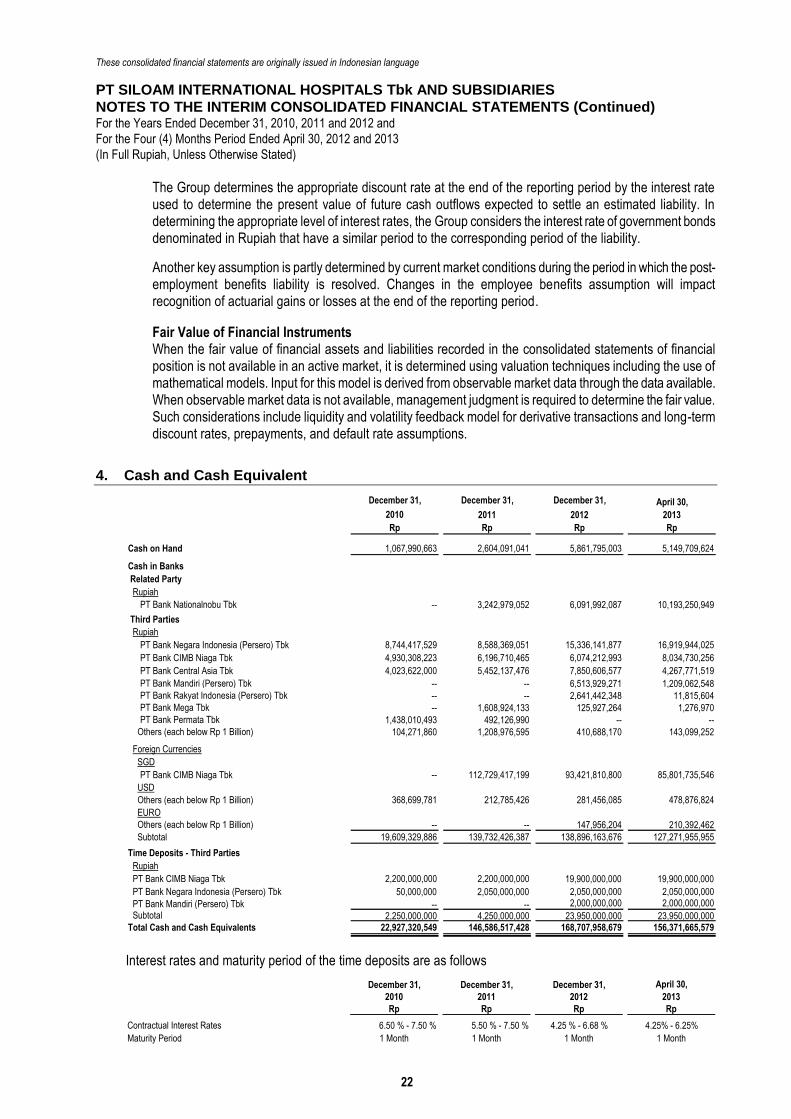
These consolidated financial statements are originally issued in Indonesian language
PT SILOAM INTERNATIONAL HOSPITALS Tbk AND SUBSIDIARIES
NOTES TO THE INTERIM CONSOLIDATED FINANCIAL STATEMENTS (Continued) For the Years Ended December 31, 2010, 2011 and 2012 and
For the Four (4) Months Period Ended April 30, 2012 and 2013
(In Full Rupiah, Unless Otherwise Stated)
Draft/July 26, 2013 22 paraf:
The Group determines the appropriate discount rate at the end of the reporting period by the interest rate used to determine the present value of future cash outflows expected to settle an estimated liability. In determining the appropriate level of interest rates, the Group considers the interest rate of government bonds denominated in Rupiah that have a similar period to the corresponding period of the liability.
Another key assumption is partly determined by current market conditions during the period in which the post-employment benefits liability is resolved. Changes in the employee benefits assumption will impact recognition of actuarial gains or losses at the end of the reporting period.
Fair Value of Financial Instruments When the fair value of financial assets and liabilities recorded in the consolidated statements of financial position is not available in an active market, it is determined using valuation techniques including the use of mathematical models. Input for this model is derived from observable market data through the data available. When observable market data is not available, management judgment is required to determine the fair value. Such considerations include liquidity and volatility feedback model for derivative transactions and long-term discount rates, prepayments, and default rate assumptions.
4. Cash and Cash Equivalent
December 31, December 31, December 31, April 30,
2010 2011 2012 2013
Rp Rp Rp Rp
Cash on Hand 1,067,990,663 2,604,091,041 5,861,795,003 5,149,709,624
Cash in Banks
Related Party
Rupiah
PT Bank Nationalnobu Tbk -- 3,242,979,052 6,091,992,087 10,193,250,949
Third Parties
Rupiah
PT Bank Negara Indonesia (Persero) Tbk 8,744,417,529 8,588,369,051 15,336,141,877 16,919,944,025
PT Bank CIMB Niaga Tbk 4,930,308,223 6,196,710,465 6,074,212,993 8,034,730,256
PT Bank Central Asia Tbk 4,023,622,000 5,452,137,476 7,850,606,577 4,267,771,519
PT Bank Mandiri (Persero) Tbk -- -- 6,513,929,271 1,209,062,548
PT Bank Rakyat Indonesia (Persero) Tbk -- -- 2,641,442,348 11,815,604
PT Bank Mega Tbk -- 1,608,924,133 125,927,264 1,276,970
PT Bank Permata Tbk 1,438,010,493 492,126,990 -- --
Others (each below Rp 1 Billion) 104,271,860 1,208,976,595 410,688,170 143,099,252
Foreign Currencies
SGD
PT Bank CIMB Niaga Tbk -- 112,729,417,199 93,421,810,800 85,801,735,546
USD
PT Bank Negara Indonesia (Persero) Tbk Others (each below Rp 1 Billion) 368,699,781 212,785,426 281,456,085 478,876,824
PT Bank CIMB Niaga Tbk EURO
Others (each below Rp 1 Billion) -- -- 147,956,204 210,392,462
Subtotal 19,609,329,886 139,732,426,387 138,896,163,676 127,271,955,955
Time Deposits - Third Parties
Rupiah
PT Bank CIMB Niaga Tbk 2,200,000,000 2,200,000,000 19,900,000,000 19,900,000,000
PT Bank Negara Indonesia (Persero) Tbk 50,000,000 2,050,000,000 2,050,000,000 2,050,000,000
PT Bank Mandiri (Persero) Tbk -- -- 2,000,000,000 2,000,000,000
Subtotal 2,250,000,000 4,250,000,000 23,950,000,000 23,950,000,000 Total Cash and Cash Equivalents 22,927,320,549 146,586,517,428 168,707,958,679 156,371,665,579
Interest rates and maturity period of the time deposits are as follows
December 31, December 31, December 31, April 30,
2010 2011 2012 2013
Rp Rp Rp Rp
Contractual Interest Rates 6.50 % - 7.50 % 5.50 % - 7.50 % 4.25 % - 6.68 % 4.25% - 6.25%
Maturity Period 1 Month 1 Month 1 Month 1 Month
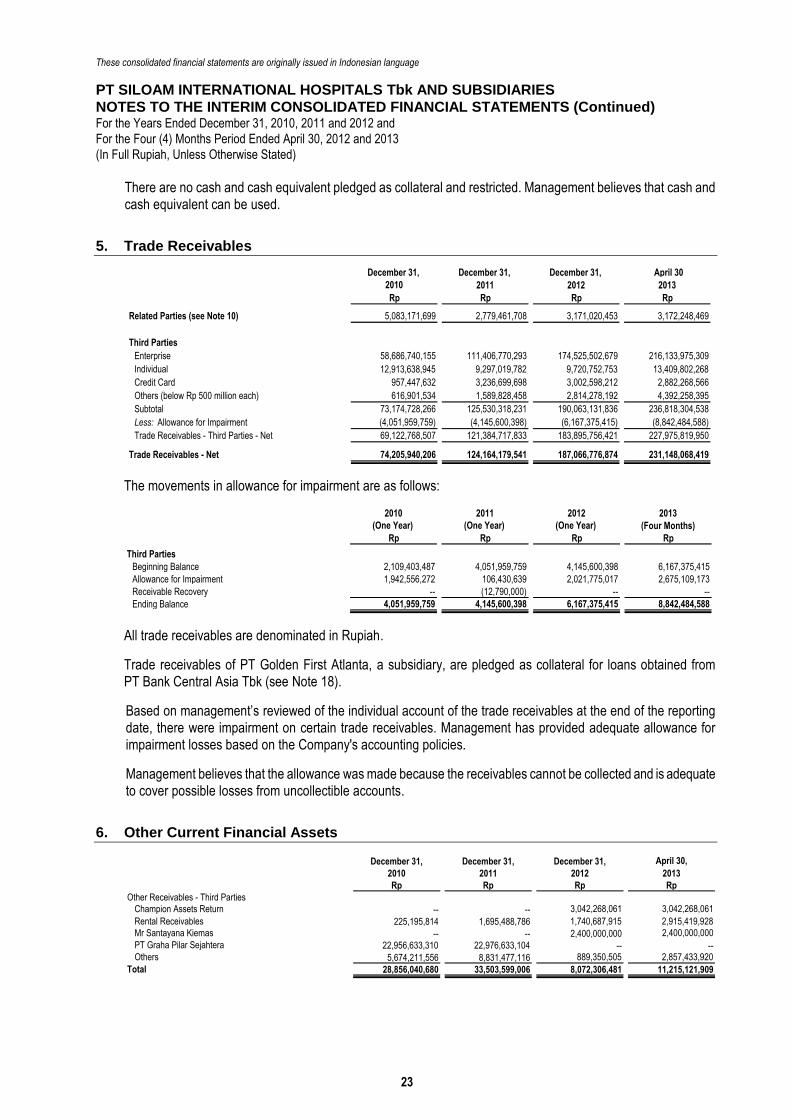
These consolidated financial statements are originally issued in Indonesian language
PT SILOAM INTERNATIONAL HOSPITALS Tbk AND SUBSIDIARIES
NOTES TO THE INTERIM CONSOLIDATED FINANCIAL STATEMENTS (Continued) For the Years Ended December 31, 2010, 2011 and 2012 and
For the Four (4) Months Period Ended April 30, 2012 and 2013
(In Full Rupiah, Unless Otherwise Stated)
Draft/July 26, 2013 23 paraf:
There are no cash and cash equivalent pledged as collateral and restricted. Management believes that cash and cash equivalent can be used.
5. Trade Receivables
December 31, December 31, December 31, April 30
2010 2011 2012 2013
Rp Rp Rp Rp
Related Parties (see Note 10) 5,083,171,699 2,779,461,708 3,171,020,453 3,172,248,469
Third Parties
Enterprise 58,686,740,155 111,406,770,293 174,525,502,679 216,133,975,309
Individual 12,913,638,945 9,297,019,782 9,720,752,753 13,409,802,268
Credit Card 957,447,632 3,236,699,698 3,002,598,212 2,882,268,566
Others (below Rp 500 million each) 616,901,534 1,589,828,458 2,814,278,192 4,392,258,395
Subtotal 73,174,728,266 125,530,318,231 190,063,131,836 236,818,304,538
Less: Allowance for Impairment (4,051,959,759) (4,145,600,398) (6,167,375,415) (8,842,484,588)
Trade Receivables - Third Parties - Net 69,122,768,507 121,384,717,833 183,895,756,421 227,975,819,950
Trade Receivables - Net 74,205,940,206 124,164,179,541 187,066,776,874 231,148,068,419
The movements in allowance for impairment are as follows:
2010 2011 2012 2013
(One Year) (One Year) (One Year) (Four Months)
Rp Rp Rp Rp
Third Parties
Beginning Balance 2,109,403,487 4,051,959,759 4,145,600,398 6,167,375,415
Allowance for Impairment 1,942,556,272 106,430,639 2,021,775,017 2,675,109,173
Receivable Recovery -- (12,790,000) -- --
Ending Balance 4,051,959,759 4,145,600,398 6,167,375,415 8,842,484,588
All trade receivables are denominated in Rupiah.
Trade receivables of PT Golden First Atlanta, a subsidiary, are pledged as collateral for loans obtained from PT Bank Central Asia Tbk (see Note 18).
Based on management’s reviewed of the individual account of the trade receivables at the end of the reporting date, there were impairment on certain trade receivables. Management has provided adequate allowance for impairment losses based on the Company's accounting policies.
Management believes that the allowance was made because the receivables cannot be collected and is adequate to cover possible losses from uncollectible accounts.
6. Other Current Financial Assets
December 31, December 31, December 31, April 30,
2010 2011 2012 2013
Rp Rp Rp Rp
Other Receivables - Third Parties
Champion Assets Return -- -- 3,042,268,061 3,042,268,061
Rental Receivables 225,195,814 1,695,488,786 1,740,687,915 2,915,419,928
Mr Santayana Kiemas -- -- 2,400,000,000 2,400,000,000
PT Graha Pilar Sejahtera 22,956,633,310 22,976,633,104 -- --Others 5,674,211,556 8,831,477,116 889,350,505 2,857,433,920
Total 28,856,040,680 33,503,599,006 8,072,306,481 11,215,121,909
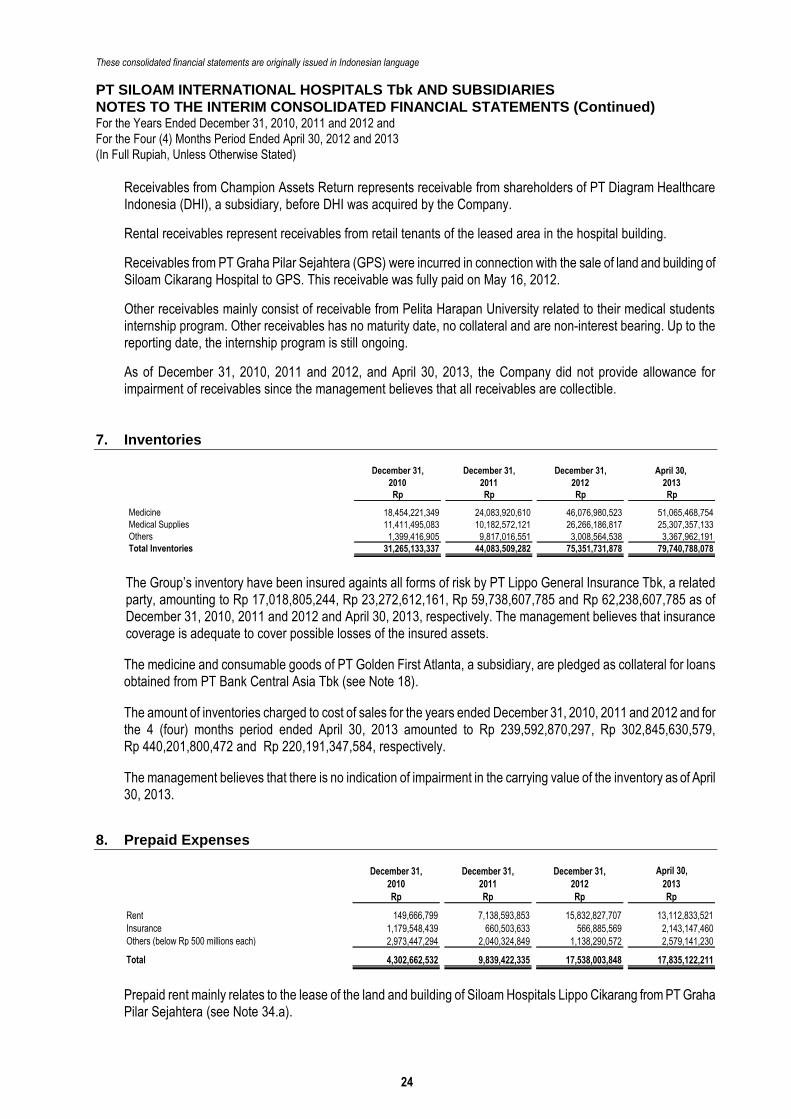
These consolidated financial statements are originally issued in Indonesian language
PT SILOAM INTERNATIONAL HOSPITALS Tbk AND SUBSIDIARIES
NOTES TO THE INTERIM CONSOLIDATED FINANCIAL STATEMENTS (Continued) For the Years Ended December 31, 2010, 2011 and 2012 and
For the Four (4) Months Period Ended April 30, 2012 and 2013
(In Full Rupiah, Unless Otherwise Stated)
Draft/July 26, 2013 24 paraf:
Receivables from Champion Assets Return represents receivable from shareholders of PT Diagram Healthcare Indonesia (DHI), a subsidiary, before DHI was acquired by the Company.
Rental receivables represent receivables from retail tenants of the leased area in the hospital building.
Receivables from PT Graha Pilar Sejahtera (GPS) were incurred in connection with the sale of land and building of Siloam Cikarang Hospital to GPS. This receivable was fully paid on May 16, 2012.
Other receivables mainly consist of receivable from Pelita Harapan University related to their medical students internship program. Other receivables has no maturity date, no collateral and are non-interest bearing. Up to the reporting date, the internship program is still ongoing.
As of December 31, 2010, 2011 and 2012, and April 30, 2013, the Company did not provide allowance for impairment of receivables since the management believes that all receivables are collectible.
7. Inventories
December 31, December 31, December 31, April 30,
2010 2011 2012 2013
Rp Rp Rp Rp
Medicine 18,454,221,349 24,083,920,610 46,076,980,523 51,065,468,754
Medical Supplies 11,411,495,083 10,182,572,121 26,266,186,817 25,307,357,133
Others 1,399,416,905 9,817,016,551 3,008,564,538 3,367,962,191
Total Inventories 31,265,133,337 44,083,509,282 75,351,731,878 79,740,788,078
The Group’s inventory have been insured againts all forms of risk by PT Lippo General Insurance Tbk, a related party, amounting to Rp 17,018,805,244, Rp 23,272,612,161, Rp 59,738,607,785 and Rp 62,238,607,785 as of December 31, 2010, 2011 and 2012 and April 30, 2013, respectively. The management believes that insurance coverage is adequate to cover possible losses of the insured assets.
The medicine and consumable goods of PT Golden First Atlanta, a subsidiary, are pledged as collateral for loans obtained from PT Bank Central Asia Tbk (see Note 18).
The amount of inventories charged to cost of sales for the years ended December 31, 2010, 2011 and 2012 and for the 4 (four) months period ended April 30, 2013 amounted to Rp 239,592,870,297, Rp 302,845,630,579, Rp 440,201,800,472 and Rp 220,191,347,584, respectively.
The management believes that there is no indication of impairment in the carrying value of the inventory as of April 30, 2013.
8. Prepaid Expenses
December 31, December 31, December 31, April 30,
2010 2011 2012 2013
Rp Rp Rp Rp
Rent 149,666,799 7,138,593,853 15,832,827,707 13,112,833,521
Insurance 1,179,548,439 660,503,633 566,885,569 2,143,147,460
Others (below Rp 500 millions each) 2,973,447,294 2,040,324,849 1,138,290,572 2,579,141,230
Total 4,302,662,532 9,839,422,335 17,538,003,848 17,835,122,211
Prepaid rent mainly relates to the lease of the land and building of Siloam Hospitals Lippo Cikarang from PT Graha Pilar Sejahtera (see Note 34.a).

These consolidated financial statements are originally issued in Indonesian language
PT SILOAM INTERNATIONAL HOSPITALS Tbk AND SUBSIDIARIES
NOTES TO THE INTERIM CONSOLIDATED FINANCIAL STATEMENTS (Continued) For the Years Ended December 31, 2010, 2011 and 2012 and
For the Four (4) Months Period Ended April 30, 2012 and 2013
(In Full Rupiah, Unless Otherwise Stated)
Draft/July 26, 2013 25 paraf:
9. Advances
December 31, December 31, December 31, April 30,
2010 2011 2012 2013Rp Rp Rp Rp
Advances for Purchase of Property and Equipment 1,520,988,674 11,205,812,335 141,743,826,536 46,030,092,390
Investment
PT Guchi Kencana Emas 57,443,246,813 -- -- --
PT Prawira Tata Semesta 46,655,579,000 -- -- --
Construction -- 23,484,277,582 9,439,593,907 1,752,373,246
Others (below Rp 500 millions each) 516,880,193 2,088,012,800 1,571,961,111 3,586,607,080
Total 106,136,694,680 36,778,102,717 152,755,381,554 51,369,072,716
Advances for purchase of property and equipment mainly represent the purchase of medical equipment for Siloam Hospitals. Advances for construction represent downpaymen to suppliers related to the renovation of the interior of existing hospitals and certain suppliers of hospitals under construction that will be operated by the Company.
10. Transactions and Balances with Related Parties
In its normal business transactions, the Company conducts business transactions with related parties as follows:
December 31, December 31, December 31, April 30, December 31, December 31, December 31, April 30,
2010 2011 2012 2013 2010 2011 2012 2013
Rp Rp Rp Rp % % % %
Cash and Cash Equivalent
PT Bank Nationalnobu Tbk -- 3,242,979,052 6,091,992,087 10,193,250,949 -- 0.00 0.00 0.01
Trade Receivables
Employees 2,989,240,399 1,454,191,220 1,253,220,859 1,824,557,810 0.00 0.00 0.00 0.00
Non-employees 2,093,931,300 1,325,270,488 1,917,799,594 1,347,690,659 0.00 0.00 0.00 0.00
Total 5,083,171,699 2,779,461,708 3,171,020,453 3,172,248,469 0.01 0.00 0.00 0.00
Due from Related Parties Non-Trade
PT Eramulia Pratamajaya 599,997,000 662,397,000 662,397,000 662,397,000 0.00 0.00 0.00 0.00
Bridgewater International Ltd 244,335,000,000 -- -- -- 0.31 -- -- --
PT Primakreasi Propertindo 974,001,500 -- -- -- 0.00 -- -- --
PT Grand Villa Persada 1,001,000 -- -- -- 0.00 -- -- --
PT Megapratama Karya Persada -- -- 2,000 -- -- -- 0.00 --
Employees 843,041,582 588,976,000 -- -- 0.00 0.00 -- --
Total 246,753,041,082 1,251,373,000 662,399,000 662,397,000 0.32 0.00 0.00 0.00
Percentage to Total Assets/Liabilities
Due to Related Parties - Non Trade
PT Lippo Karawaci Tbk 246,428,074,360 442,567,347,637 796,448,380,152 827,161,768,449 0.38 0.47 0.59 0.60
PT PKPPT Primakreasi Propertindo 998,999,000 998,999,000 1,588,998,000 -- 0.00 0.00 0.00 --
Others (below Rp 1 billion each) -- -- 749,246,407 -- -- -- 0.00 --
Total 247,427,073,360 443,566,346,637 798,786,624,559 827,161,768,449 0.39 0.48 0.60 0.60
2010 2011 2012 2012 2013 2010 2011 2012 2012 2013
(One Year) (One Year) (One Year) (Four Months) (Four Months) (One Year) (One Year) (One Year) (Four Months) (Four Months)
Rp Rp Rp Rp % % % Rp % %
Employee Benefits of Key Management - -- -- -- -- -- -- -- -- -- --
Short Term Employee Benefits
Directors -- 9,248,412,683 11,272,616,841 6,322,091,278 3,975,945,000 -- 0.04 0.03 0.06 0.02
Commisioners -- -- -- -- -- -- -- -- -- --
Others Key Management -- -- -- -- -- -- -- -- -- --
Total -- 9,248,412,683 11,272,616,841 6,322,091,278 3,975,945,000 -- 0.04 0.03 0.06 0.02
Percentage to Total Revenues/ Operating Expenses
The loan obtained from PT Lippo Karawaci is non-interest bearing loan and payment of short term employee benefits of the Directors. The short term employee benefits to the Directors amounted to nil and Rp 9,248,412,683, respectively, for the years ended 31 December 2010 and 2011. The non-interest bearing loan incurred in relation to the restructuring of PT Lippo Karawaci Tbk’s hospital unit and funding for expansion and acquisition of subsidiaries.
On April 30, 2013, the Company entered into a loan agreement with PT Lippo Karawaci Tbk. This agreement was effective from the signing of the agreement and will expire immediately when the Company repays the loan. It does not bear interest if fully paid by December 31, 2013.
The entire balance of the related party transactions are transactions denominated in Rupiah.
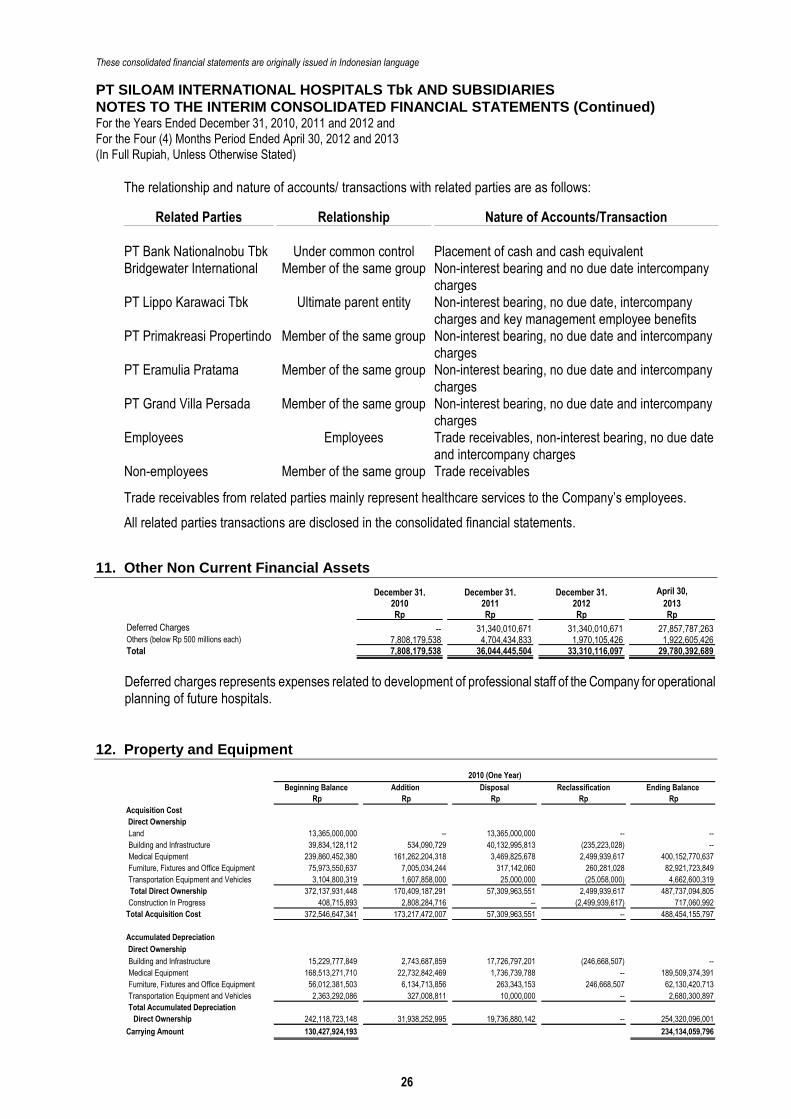
These consolidated financial statements are originally issued in Indonesian language
PT SILOAM INTERNATIONAL HOSPITALS Tbk AND SUBSIDIARIES
NOTES TO THE INTERIM CONSOLIDATED FINANCIAL STATEMENTS (Continued) For the Years Ended December 31, 2010, 2011 and 2012 and
For the Four (4) Months Period Ended April 30, 2012 and 2013
(In Full Rupiah, Unless Otherwise Stated)
Draft/July 26, 2013 26 paraf:
The relationship and nature of accounts/ transactions with related parties are as follows:
Related Parties Relationship Nature of Accounts/Transaction
PT Bank Nationalnobu Tbk Under common control Placement of cash and cash equivalent Bridgewater International Member of the same group Non-interest bearing and no due date intercompany
charges PT Lippo Karawaci Tbk Ultimate parent entity Non-interest bearing, no due date, intercompany
charges and key management employee benefits PT Primakreasi Propertindo Member of the same group Non-interest bearing, no due date and intercompany
charges PT Eramulia Pratama Member of the same group Non-interest bearing, no due date and intercompany
charges PT Grand Villa Persada Member of the same group Non-interest bearing, no due date and intercompany
charges Employees Employees Trade receivables, non-interest bearing, no due date
and intercompany charges Non-employees Member of the same group Trade receivables
Trade receivables from related parties mainly represent healthcare services to the Company’s employees.
All related parties transactions are disclosed in the consolidated financial statements.
11. Other Non Current Financial Assets
December 31, December 31, December 31, April 30,
2010 2011 2012 2013Rp Rp Rp Rp
Deferred Charges -- 31,340,010,671 31,340,010,671 27,857,787,263Others (below Rp 500 millions each) 7,808,179,538 4,704,434,833 1,970,105,426 1,922,605,426Total 7,808,179,538 36,044,445,504 33,310,116,097 29,780,392,689
Deferred charges represents expenses related to development of professional staff of the Company for operational planning of future hospitals.
12. Property and Equipment
Beginning Balance Addition Disposal Reclassification Ending Balance
Rp Rp Rp Rp Rp
Acquisition Cost
Direct Ownership
Land 13,365,000,000 -- 13,365,000,000 -- --
Building and Infrastructure 39,834,128,112 534,090,729 40,132,995,813 (235,223,028) --
Medical Equipment 239,860,452,380 161,262,204,318 3,469,825,678 2,499,939,617 400,152,770,637
Furniture, Fixtures and Office Equipment 75,973,550,637 7,005,034,244 317,142,060 260,281,028 82,921,723,849
Transportation Equipment and Vehicles 3,104,800,319 1,607,858,000 25,000,000 (25,058,000) 4,662,600,319
Total Direct Ownership 372,137,931,448 170,409,187,291 57,309,963,551 2,499,939,617 487,737,094,805
Construction In Progress 408,715,893 2,808,284,716 -- (2,499,939,617) 717,060,992
Total Acquisition Cost 372,546,647,341 173,217,472,007 57,309,963,551 -- 488,454,155,797
Accumulated Depreciation
Direct Ownership
Building and Infrastructure 15,229,777,849 2,743,687,859 17,726,797,201 (246,668,507) --
Medical Equipment 168,513,271,710 22,732,842,469 1,736,739,788 -- 189,509,374,391
Furniture, Fixtures and Office Equipment 56,012,381,503 6,134,713,856 263,343,153 246,668,507 62,130,420,713
Transportation Equipment and Vehicles 2,363,292,086 327,008,811 10,000,000 -- 2,680,300,897
Total Accumulated Depreciation
Direct Ownership 242,118,723,148 31,938,252,995 19,736,880,142 -- 254,320,096,001
Carrying Amount 130,427,924,193 234,134,059,796
2010 (One Year)
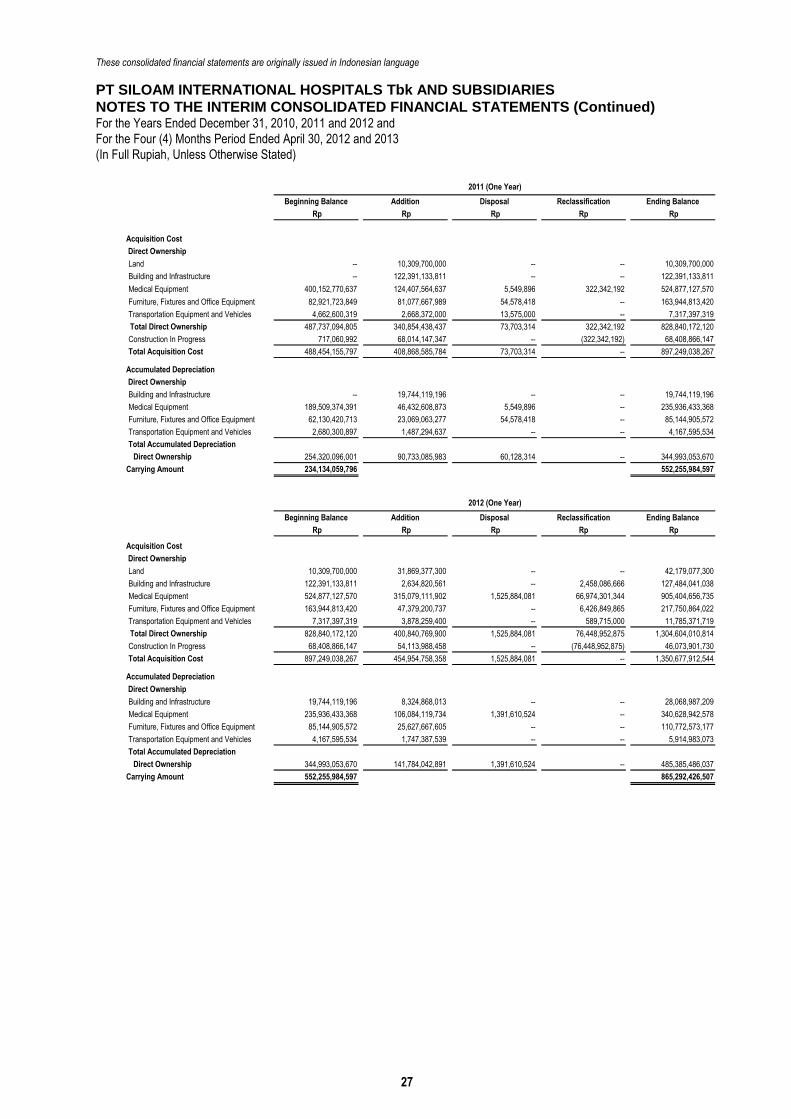
These consolidated financial statements are originally issued in Indonesian language
PT SILOAM INTERNATIONAL HOSPITALS Tbk AND SUBSIDIARIES
NOTES TO THE INTERIM CONSOLIDATED FINANCIAL STATEMENTS (Continued) For the Years Ended December 31, 2010, 2011 and 2012 and
For the Four (4) Months Period Ended April 30, 2012 and 2013
(In Full Rupiah, Unless Otherwise Stated)
Draft/July 26, 2013 27 paraf:
Beginning Balance Addition Disposal Reclassification Ending Balance
Rp Rp Rp Rp Rp
Acquisition Cost
Direct Ownership
Land -- 10,309,700,000 -- -- 10,309,700,000
Building and Infrastructure -- 122,391,133,811 -- -- 122,391,133,811
Medical Equipment 400,152,770,637 124,407,564,637 5,549,896 322,342,192 524,877,127,570
Furniture, Fixtures and Office Equipment 82,921,723,849 81,077,667,989 54,578,418 -- 163,944,813,420
Transportation Equipment and Vehicles 4,662,600,319 2,668,372,000 13,575,000 -- 7,317,397,319
Total Direct Ownership 487,737,094,805 340,854,438,437 73,703,314 322,342,192 828,840,172,120
Construction In Progress 717,060,992 68,014,147,347 -- (322,342,192) 68,408,866,147
Total Acquisition Cost 488,454,155,797 408,868,585,784 73,703,314 -- 897,249,038,267
Accumulated Depreciation
Direct Ownership
Building and Infrastructure -- 19,744,119,196 -- -- 19,744,119,196
Medical Equipment 189,509,374,391 46,432,608,873 5,549,896 -- 235,936,433,368
Furniture, Fixtures and Office Equipment 62,130,420,713 23,069,063,277 54,578,418 -- 85,144,905,572
Transportation Equipment and Vehicles 2,680,300,897 1,487,294,637 -- -- 4,167,595,534
Total Accumulated Depreciation
Direct Ownership 254,320,096,001 90,733,085,983 60,128,314 -- 344,993,053,670
Carrying Amount 234,134,059,796 552,255,984,597
2011 (One Year)
Beginning Balance Addition Disposal Reclassification Ending Balance
Rp Rp Rp Rp Rp
Acquisition Cost
Direct Ownership
Land 10,309,700,000 31,869,377,300 -- -- 42,179,077,300
Building and Infrastructure 122,391,133,811 2,634,820,561 -- 2,458,086,666 127,484,041,038
Medical Equipment 524,877,127,570 315,079,111,902 1,525,884,081 66,974,301,344 905,404,656,735
Furniture, Fixtures and Office Equipment 163,944,813,420 47,379,200,737 -- 6,426,849,865 217,750,864,022
Transportation Equipment and Vehicles 7,317,397,319 3,878,259,400 -- 589,715,000 11,785,371,719
Total Direct Ownership 828,840,172,120 400,840,769,900 1,525,884,081 76,448,952,875 1,304,604,010,814
Construction In Progress 68,408,866,147 54,113,988,458 -- (76,448,952,875) 46,073,901,730
Total Acquisition Cost 897,249,038,267 454,954,758,358 1,525,884,081 -- 1,350,677,912,544
Accumulated Depreciation
Direct Ownership
Building and Infrastructure 19,744,119,196 8,324,868,013 -- -- 28,068,987,209
Medical Equipment 235,936,433,368 106,084,119,734 1,391,610,524 -- 340,628,942,578
Furniture, Fixtures and Office Equipment 85,144,905,572 25,627,667,605 -- -- 110,772,573,177
Transportation Equipment and Vehicles 4,167,595,534 1,747,387,539 -- -- 5,914,983,073
Total Accumulated Depreciation
Direct Ownership 344,993,053,670 141,784,042,891 1,391,610,524 -- 485,385,486,037
Carrying Amount 552,255,984,597 865,292,426,507
2012 (One Year)
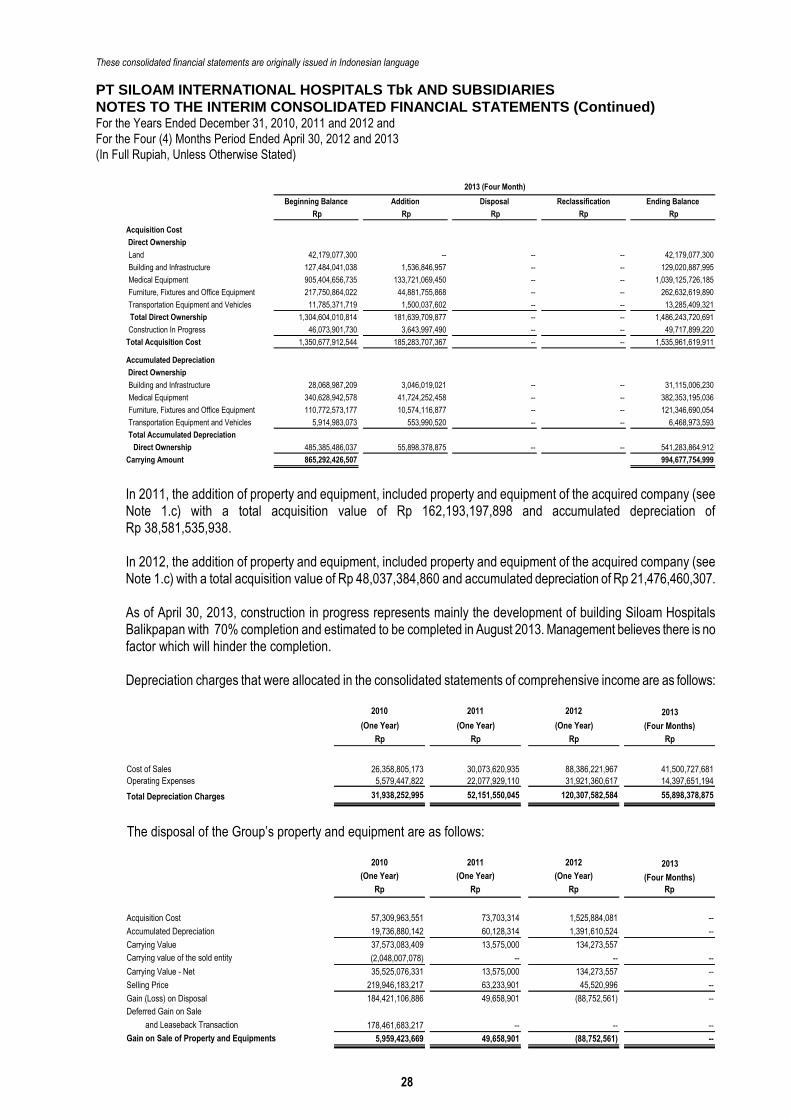
These consolidated financial statements are originally issued in Indonesian language
PT SILOAM INTERNATIONAL HOSPITALS Tbk AND SUBSIDIARIES
NOTES TO THE INTERIM CONSOLIDATED FINANCIAL STATEMENTS (Continued) For the Years Ended December 31, 2010, 2011 and 2012 and
For the Four (4) Months Period Ended April 30, 2012 and 2013
(In Full Rupiah, Unless Otherwise Stated)
Draft/July 26, 2013 28 paraf:
Beginning Balance Addition Disposal Reclassification Ending Balance
Rp Rp Rp Rp Rp
Acquisition Cost
Direct Ownership
Land 42,179,077,300 -- -- -- 42,179,077,300
Building and Infrastructure 127,484,041,038 1,536,846,957 -- -- 129,020,887,995
Medical Equipment 905,404,656,735 133,721,069,450 -- -- 1,039,125,726,185
Furniture, Fixtures and Office Equipment 217,750,864,022 44,881,755,868 -- -- 262,632,619,890
Transportation Equipment and Vehicles 11,785,371,719 1,500,037,602 -- -- 13,285,409,321
Total Direct Ownership 1,304,604,010,814 181,639,709,877 -- -- 1,486,243,720,691
Construction In Progress 46,073,901,730 3,643,997,490 -- -- 49,717,899,220
Total Acquisition Cost 1,350,677,912,544 185,283,707,367 -- -- 1,535,961,619,911
Accumulated Depreciation
Direct Ownership
Building and Infrastructure 28,068,987,209 3,046,019,021 -- -- 31,115,006,230
Medical Equipment 340,628,942,578 41,724,252,458 -- -- 382,353,195,036
Furniture, Fixtures and Office Equipment 110,772,573,177 10,574,116,877 -- -- 121,346,690,054
Transportation Equipment and Vehicles 5,914,983,073 553,990,520 -- -- 6,468,973,593
Total Accumulated Depreciation
Direct Ownership 485,385,486,037 55,898,378,875 -- -- 541,283,864,912
Carrying Amount 865,292,426,507 994,677,754,999
2013 (Four Month)
In 2011, the addition of property and equipment, included property and equipment of the acquired company (see Note 1.c) with a total acquisition value of Rp 162,193,197,898 and accumulated depreciation of Rp 38,581,535,938. In 2012, the addition of property and equipment, included property and equipment of the acquired company (see Note 1.c) with a total acquisition value of Rp 48,037,384,860 and accumulated depreciation of Rp 21,476,460,307. As of April 30, 2013, construction in progress represents mainly the development of building Siloam Hospitals Balikpapan with 70% completion and estimated to be completed in August 2013. Management believes there is no factor which will hinder the completion. Depreciation charges that were allocated in the consolidated statements of comprehensive income are as follows:
2010 2011 2012 2013
(One Year) (One Year) (One Year) (Four Months)
Rp Rp Rp Rp
Cost of Sales 26,358,805,173 30,073,620,935 88,386,221,967 41,500,727,681
Operating Expenses 5,579,447,822 22,077,929,110 31,921,360,617 14,397,651,194
Total Depreciation Charges 31,938,252,995 52,151,550,045 120,307,582,584 55,898,378,875
The disposal of the Group’s property and equipment are as follows:
2010 2011 2012 2013
(One Year) (One Year) (One Year) (Four Months)
Rp Rp Rp Rp
Acquisition Cost 57,309,963,551 73,703,314 1,525,884,081 --
Accumulated Depreciation 19,736,880,142 60,128,314 1,391,610,524 --
Carrying Value 37,573,083,409 13,575,000 134,273,557
Carrying value of the sold entity (2,048,007,078) -- -- --
Carrying Value - Net 35,525,076,331 13,575,000 134,273,557 --
Selling Price 219,946,183,217 63,233,901 45,520,996 --
Gain (Loss) on Disposal 184,421,106,886 49,658,901 (88,752,561) --
Deferred Gain on Sale
and Leaseback Transaction 178,461,683,217 -- -- --
Gain on Sale of Property and Equipments 5,959,423,669 49,658,901 (88,752,561) --
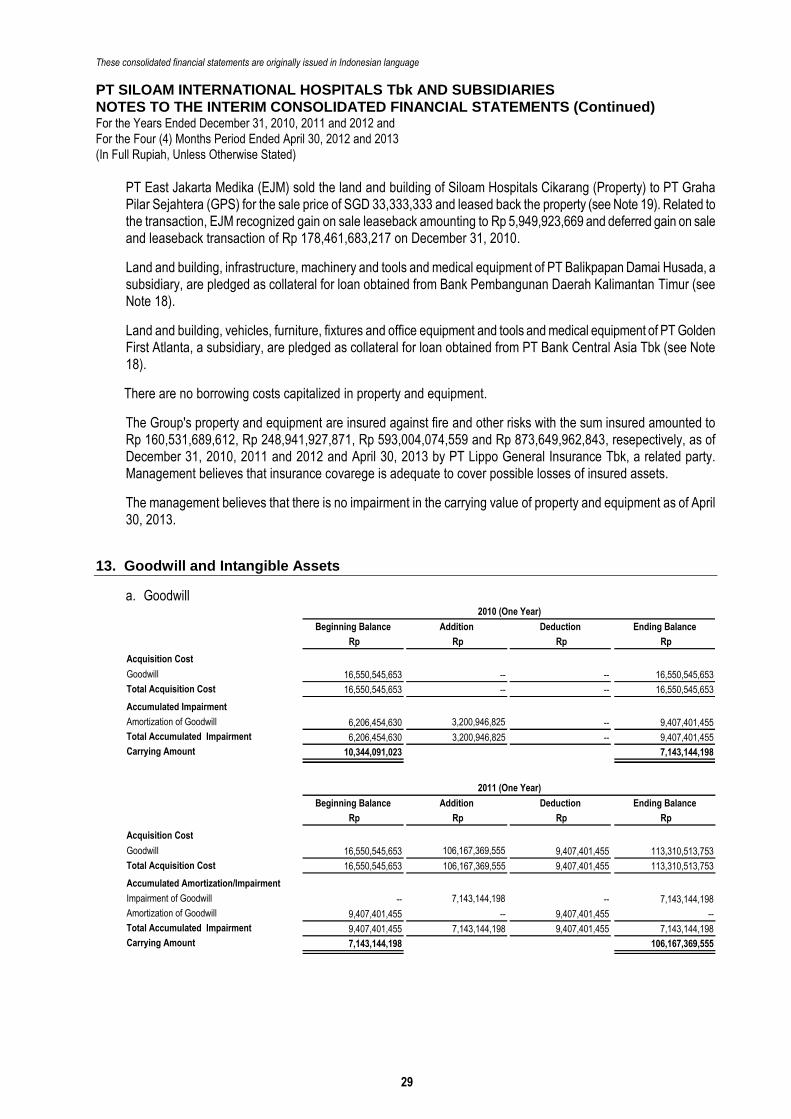
These consolidated financial statements are originally issued in Indonesian language
PT SILOAM INTERNATIONAL HOSPITALS Tbk AND SUBSIDIARIES
NOTES TO THE INTERIM CONSOLIDATED FINANCIAL STATEMENTS (Continued) For the Years Ended December 31, 2010, 2011 and 2012 and
For the Four (4) Months Period Ended April 30, 2012 and 2013
(In Full Rupiah, Unless Otherwise Stated)
Draft/July 26, 2013 29 paraf:
PT East Jakarta Medika (EJM) sold the land and building of Siloam Hospitals Cikarang (Property) to PT Graha Pilar Sejahtera (GPS) for the sale price of SGD 33,333,333 and leased back the property (see Note 19). Related to the transaction, EJM recognized gain on sale leaseback amounting to Rp 5,949,923,669 and deferred gain on sale and leaseback transaction of Rp 178,461,683,217 on December 31, 2010.
Land and building, infrastructure, machinery and tools and medical equipment of PT Balikpapan Damai Husada, a subsidiary, are pledged as collateral for loan obtained from Bank Pembangunan Daerah Kalimantan Timur (see Note 18).
Land and building, vehicles, furniture, fixtures and office equipment and tools and medical equipment of PT Golden First Atlanta, a subsidiary, are pledged as collateral for loan obtained from PT Bank Central Asia Tbk (see Note 18).
There are no borrowing costs capitalized in property and equipment.
The Group's property and equipment are insured against fire and other risks with the sum insured amounted to Rp 160,531,689,612, Rp 248,941,927,871, Rp 593,004,074,559 and Rp 873,649,962,843, resepectively, as of December 31, 2010, 2011 and 2012 and April 30, 2013 by PT Lippo General Insurance Tbk, a related party. Management believes that insurance covarege is adequate to cover possible losses of insured assets.
The management believes that there is no impairment in the carrying value of property and equipment as of April 30, 2013.
13. Goodwill and Intangible Assets
a. Goodwill
Beginning Balance Addition Deduction Ending Balance
Rp Rp Rp Rp
Acquisition Cost
Goodwill 16,550,545,653 -- -- 16,550,545,653
Total Acquisition Cost 16,550,545,653 -- -- 16,550,545,653
Accumulated Impairment
Amortization of Goodwill 6,206,454,630 3,200,946,825 -- 9,407,401,455
Total Accumulated Impairment 6,206,454,630 3,200,946,825 -- 9,407,401,455
Carrying Amount 10,344,091,023 7,143,144,198
2010 (One Year)
Beginning Balance Addition Deduction Ending Balance
Rp Rp Rp Rp
Acquisition Cost
Goodwill 16,550,545,653 106,167,369,555 9,407,401,455 113,310,513,753
Total Acquisition Cost 16,550,545,653 106,167,369,555 9,407,401,455 113,310,513,753
Accumulated Amortization/Impairment
Impairment of Goodwill -- 7,143,144,198 -- 7,143,144,198
Amortization of Goodwill 9,407,401,455 -- 9,407,401,455 --
Total Accumulated Impairment 9,407,401,455 7,143,144,198 9,407,401,455 7,143,144,198
Carrying Amount 7,143,144,198 106,167,369,555
2011 (One Year)
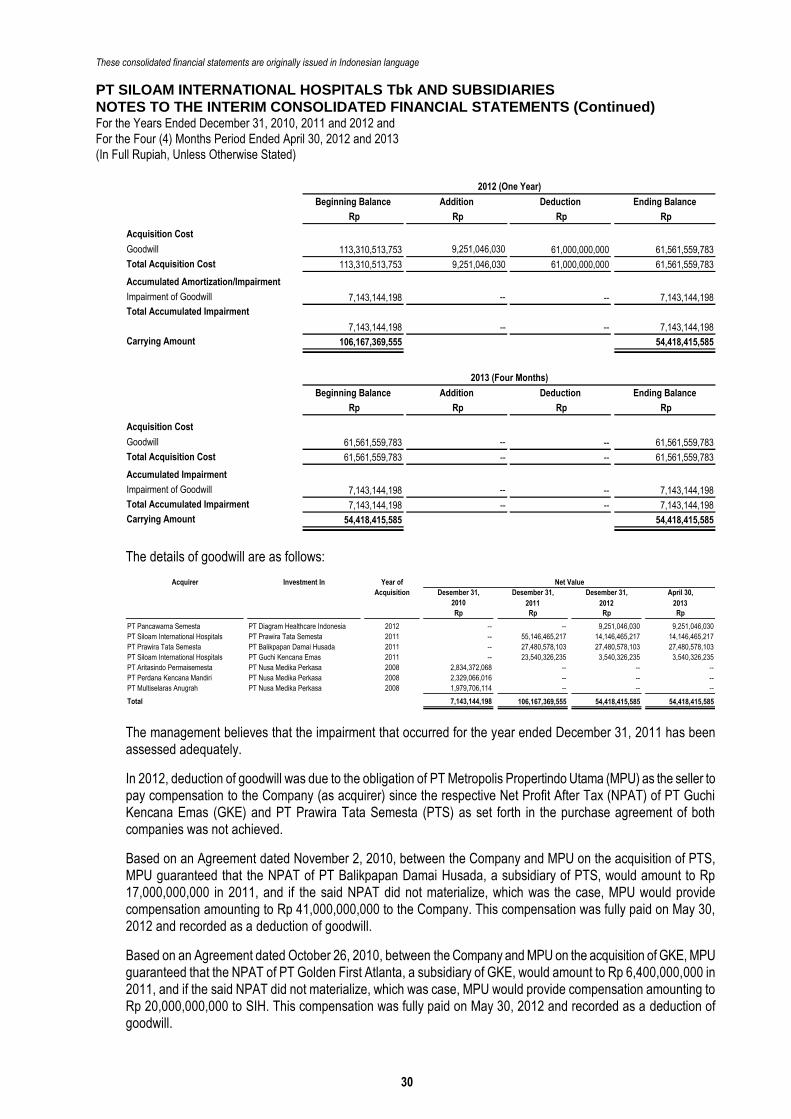
These consolidated financial statements are originally issued in Indonesian language
PT SILOAM INTERNATIONAL HOSPITALS Tbk AND SUBSIDIARIES
NOTES TO THE INTERIM CONSOLIDATED FINANCIAL STATEMENTS (Continued) For the Years Ended December 31, 2010, 2011 and 2012 and
For the Four (4) Months Period Ended April 30, 2012 and 2013
(In Full Rupiah, Unless Otherwise Stated)
Draft/July 26, 2013 30 paraf:
Beginning Balance Addition Deduction Ending Balance
Rp Rp Rp Rp
Acquisition Cost
Goodwill 113,310,513,753 9,251,046,030 61,000,000,000 61,561,559,783
Total Acquisition Cost 113,310,513,753 9,251,046,030 61,000,000,000 61,561,559,783
Accumulated Amortization/Impairment
Impairment of Goodwill 7,143,144,198 -- -- 7,143,144,198
Total Accumulated Impairment
7,143,144,198 -- -- 7,143,144,198
Carrying Amount 106,167,369,555 54,418,415,585
2012 (One Year)
Beginning Balance Addition Deduction Ending Balance
Rp Rp Rp Rp
Acquisition Cost
Goodwill 61,561,559,783 -- -- 61,561,559,783
Total Acquisition Cost 61,561,559,783 -- -- 61,561,559,783
Accumulated Impairment
Impairment of Goodwill 7,143,144,198 -- -- 7,143,144,198
Total Accumulated Impairment 7,143,144,198 -- -- 7,143,144,198
Carrying Amount 54,418,415,585 54,418,415,585
2013 (Four Months)
The details of goodwill are as follows:
Acquirer Investment In Year of
Acquisition Desember 31, Desember 31, Desember 31, April 30,
2010 2011 2012 2013
Rp Rp Rp Rp
PT Pancawarna Semesta PT Diagram Healthcare Indonesia 2012 -- -- 9,251,046,030 9,251,046,030
PT Siloam International Hospitals PT Prawira Tata Semesta 2011 -- 55,146,465,217 14,146,465,217 14,146,465,217
PT Prawira Tata Semesta PT Balikpapan Damai Husada 2011 -- 27,480,578,103 27,480,578,103 27,480,578,103
PT Siloam International Hospitals PT Guchi Kencana Emas 2011 -- 23,540,326,235 3,540,326,235 3,540,326,235
PT Aritasindo Permaisemesta PT Nusa Medika Perkasa 2008 2,834,372,068 -- -- --
PT Perdana Kencana Mandiri PT Nusa Medika Perkasa 2008 2,329,066,016 -- -- --
PT Multiselaras Anugrah PT Nusa Medika Perkasa 2008 1,979,706,114 -- -- --
Total 7,143,144,198 106,167,369,555 54,418,415,585 54,418,415,585
Net Value
The management believes that the impairment that occurred for the year ended December 31, 2011 has been assessed adequately.
In 2012, deduction of goodwill was due to the obligation of PT Metropolis Propertindo Utama (MPU) as the seller to pay compensation to the Company (as acquirer) since the respective Net Profit After Tax (NPAT) of PT Guchi Kencana Emas (GKE) and PT Prawira Tata Semesta (PTS) as set forth in the purchase agreement of both companies was not achieved.
Based on an Agreement dated November 2, 2010, between the Company and MPU on the acquisition of PTS, MPU guaranteed that the NPAT of PT Balikpapan Damai Husada, a subsidiary of PTS, would amount to Rp 17,000,000,000 in 2011, and if the said NPAT did not materialize, which was the case, MPU would provide compensation amounting to Rp 41,000,000,000 to the Company. This compensation was fully paid on May 30, 2012 and recorded as a deduction of goodwill.
Based on an Agreement dated October 26, 2010, between the Company and MPU on the acquisition of GKE, MPU guaranteed that the NPAT of PT Golden First Atlanta, a subsidiary of GKE, would amount to Rp 6,400,000,000 in 2011, and if the said NPAT did not materialize, which was case, MPU would provide compensation amounting to Rp 20,000,000,000 to SIH. This compensation was fully paid on May 30, 2012 and recorded as a deduction of goodwill.
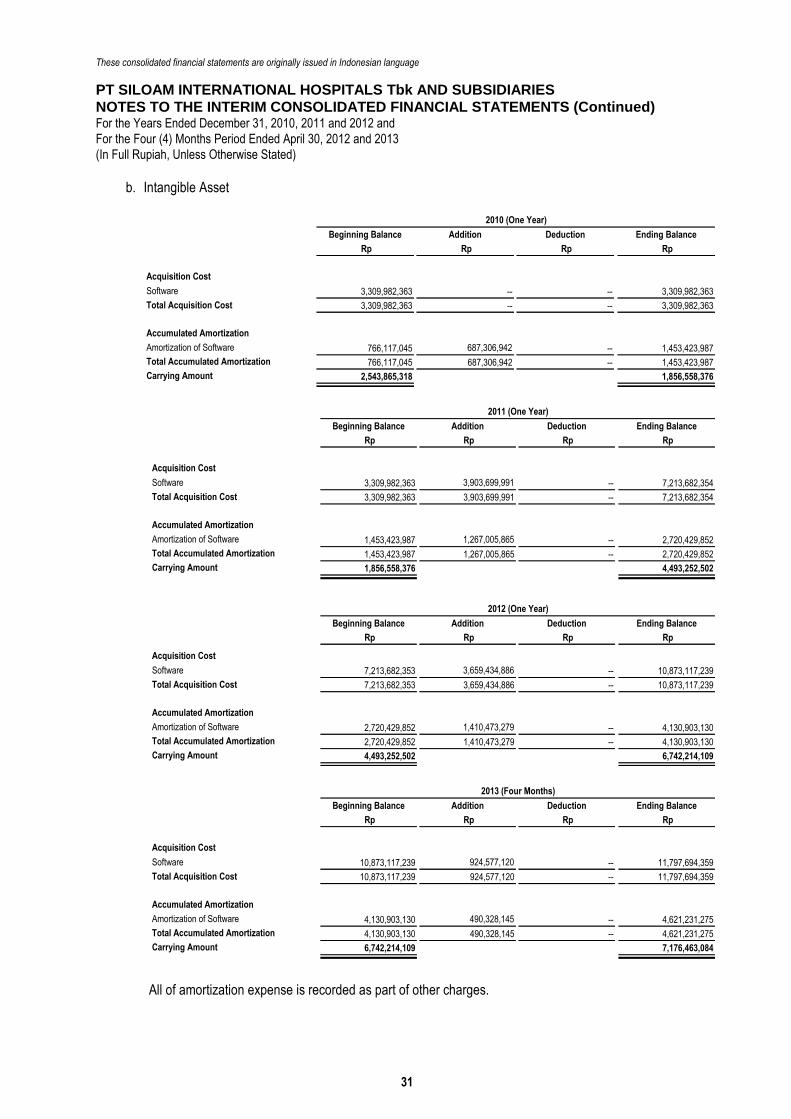
These consolidated financial statements are originally issued in Indonesian language
PT SILOAM INTERNATIONAL HOSPITALS Tbk AND SUBSIDIARIES
NOTES TO THE INTERIM CONSOLIDATED FINANCIAL STATEMENTS (Continued) For the Years Ended December 31, 2010, 2011 and 2012 and
For the Four (4) Months Period Ended April 30, 2012 and 2013
(In Full Rupiah, Unless Otherwise Stated)
Draft/July 26, 2013 31 paraf:
b. Intangible Asset
Beginning Balance Addition Deduction Ending Balance
Rp Rp Rp Rp
Acquisition Cost
Software 3,309,982,363 -- -- 3,309,982,363
Total Acquisition Cost 3,309,982,363 -- -- 3,309,982,363
Accumulated Amortization
Amortization of Software 766,117,045 687,306,942 -- 1,453,423,987
Total Accumulated Amortization 766,117,045 687,306,942 -- 1,453,423,987
Carrying Amount 2,543,865,318 1,856,558,376
2010 (One Year)
Beginning Balance Addition Deduction Ending Balance
Rp Rp Rp Rp
Acquisition Cost
Software 3,309,982,363 3,903,699,991 -- 7,213,682,354
Total Acquisition Cost 3,309,982,363 3,903,699,991 -- 7,213,682,354
Accumulated Amortization
Amortization of Software 1,453,423,987 1,267,005,865 -- 2,720,429,852
Total Accumulated Amortization 1,453,423,987 1,267,005,865 -- 2,720,429,852
Carrying Amount 1,856,558,376 4,493,252,502
2011 (One Year)
Beginning Balance Addition Deduction Ending Balance
Rp Rp Rp Rp
Acquisition Cost
Software 7,213,682,353 3,659,434,886 -- 10,873,117,239
Total Acquisition Cost 7,213,682,353 3,659,434,886 -- 10,873,117,239
Accumulated Amortization
Amortization of Software 2,720,429,852 1,410,473,279 -- 4,130,903,130
Total Accumulated Amortization 2,720,429,852 1,410,473,279 -- 4,130,903,130
Carrying Amount 4,493,252,502 6,742,214,109
2012 (One Year)
Beginning Balance Addition Deduction Ending Balance
Rp Rp Rp Rp
Acquisition Cost
Software 10,873,117,239 924,577,120 -- 11,797,694,359
Total Acquisition Cost 10,873,117,239 924,577,120 -- 11,797,694,359
Accumulated Amortization
Amortization of Software 4,130,903,130 490,328,145 -- 4,621,231,275
Total Accumulated Amortization 4,130,903,130 490,328,145 -- 4,621,231,275
Carrying Amount 6,742,214,109 7,176,463,084
2013 (Four Months)
All of amortization expense is recorded as part of other charges.
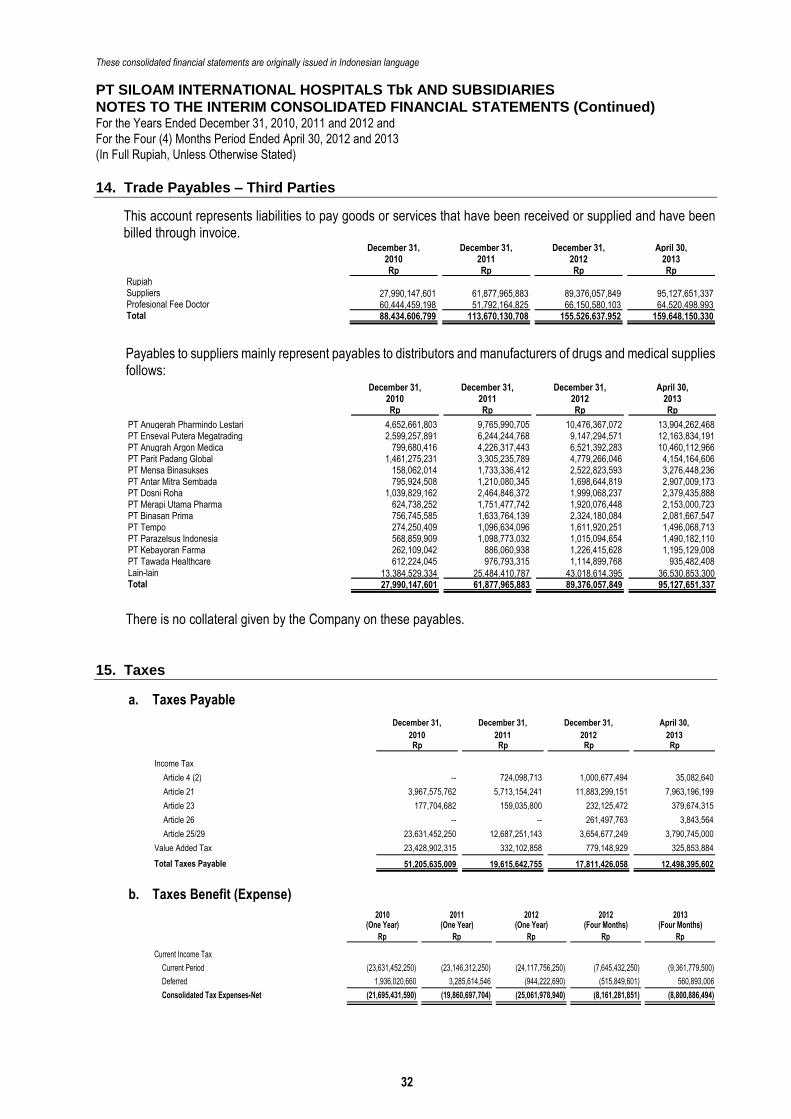
These consolidated financial statements are originally issued in Indonesian language
PT SILOAM INTERNATIONAL HOSPITALS Tbk AND SUBSIDIARIES
NOTES TO THE INTERIM CONSOLIDATED FINANCIAL STATEMENTS (Continued) For the Years Ended December 31, 2010, 2011 and 2012 and
For the Four (4) Months Period Ended April 30, 2012 and 2013
(In Full Rupiah, Unless Otherwise Stated)
Draft/July 26, 2013 32 paraf:
14. Trade Payables – Third Parties
This account represents liabilities to pay goods or services that have been received or supplied and have been billed through invoice.
December 31, December 31, December 31, April 30,2010 2011 2012 2013Rp Rp Rp Rp
RupiahSuppliers 27,990,147,601 61,877,965,883 89,376,057,849 95,127,651,337 Profesional Fee Doctor 60,444,459,198 51,792,164,825 66,150,580,103 64,520,498,993 Total 88,434,606,799 113,670,130,708 155,526,637,952 159,648,150,330
Payables to suppliers mainly represent payables to distributors and manufacturers of drugs and medical supplies follows:
December 31, December 31, December 31, April 30,2010 2011 2012 2013Rp Rp Rp Rp
PT Anugerah Pharmindo Lestari 4,652,661,803 9,765,990,705 10,476,367,072 13,904,262,468PT Enseval Putera Megatrading 2,599,257,891 6,244,244,768 9,147,294,571 12,163,834,191PT Anugrah Argon Medica 799,680,416 4,226,317,443 6,521,392,283 10,460,112,966PT Parit Padang Global 1,461,275,231 3,305,235,789 4,779,266,046 4,154,164,606PT Mensa Binasukses 158,062,014 1,733,336,412 2,522,823,593 3,276,448,236PT Antar Mitra Sembada 795,924,508 1,210,080,345 1,698,644,819 2,907,009,173PT Dosni Roha 1,039,829,162 2,464,846,372 1,999,068,237 2,379,435,888PT Merapi Utama Pharma 624,738,252 1,751,477,742 1,920,076,448 2,153,000,723PT Binasan Prima 756,745,585 1,633,764,139 2,324,180,084 2,081,667,547PT Tempo 274,250,409 1,096,634,096 1,611,920,251 1,496,068,713PT Parazelsus Indonesia 568,859,909 1,098,773,032 1,015,094,654 1,490,182,110PT Kebayoran Farma 262,109,042 886,060,938 1,226,415,628 1,195,129,008PT Tawada Healthcare 612,224,045 976,793,315 1,114,899,768 935,482,408Lain-lain 13,384,529,334 25,484,410,787 43,018,614,395 36,530,853,300 Total 27,990,147,601 61,877,965,883 89,376,057,849 95,127,651,337
There is no collateral given by the Company on these payables.
15. Taxes
a. Taxes Payable
December 31, December 31, December 31, April 30,
2010 2011 2012 2013Rp Rp Rp Rp
Income Tax
Article 4 (2) -- 724,098,713 1,000,677,494 35,082,640
Article 21 3,967,575,762 5,713,154,241 11,883,299,151 7,963,196,199
Article 23 177,704,682 159,035,800 232,125,472 379,674,315
Article 26 -- -- 261,497,763 3,843,564
Article 25/29 23,631,452,250 12,687,251,143 3,654,677,249 3,790,745,000
Value Added Tax 23,428,902,315 332,102,858 779,148,929 325,853,884
Total Taxes Payable 51,205,635,009 19,615,642,755 17,811,426,058 12,498,395,602
b. Taxes Benefit (Expense)
2010 2011 2012 2012 2013(One Year) (One Year) (One Year) (Four Months) (Four Months)
Rp Rp Rp Rp Rp
Current Income Tax
Current Period (23,631,452,250) (23,146,312,250) (24,117,756,250) (7,645,432,250) (9,361,779,500)
Deferred 1,936,020,660 3,285,614,546 (944,222,690) (515,849,601) 560,893,006
Consolidated Tax Expenses-Net (21,695,431,590) (19,860,697,704) (25,061,978,940) (8,161,281,851) (8,800,886,494)
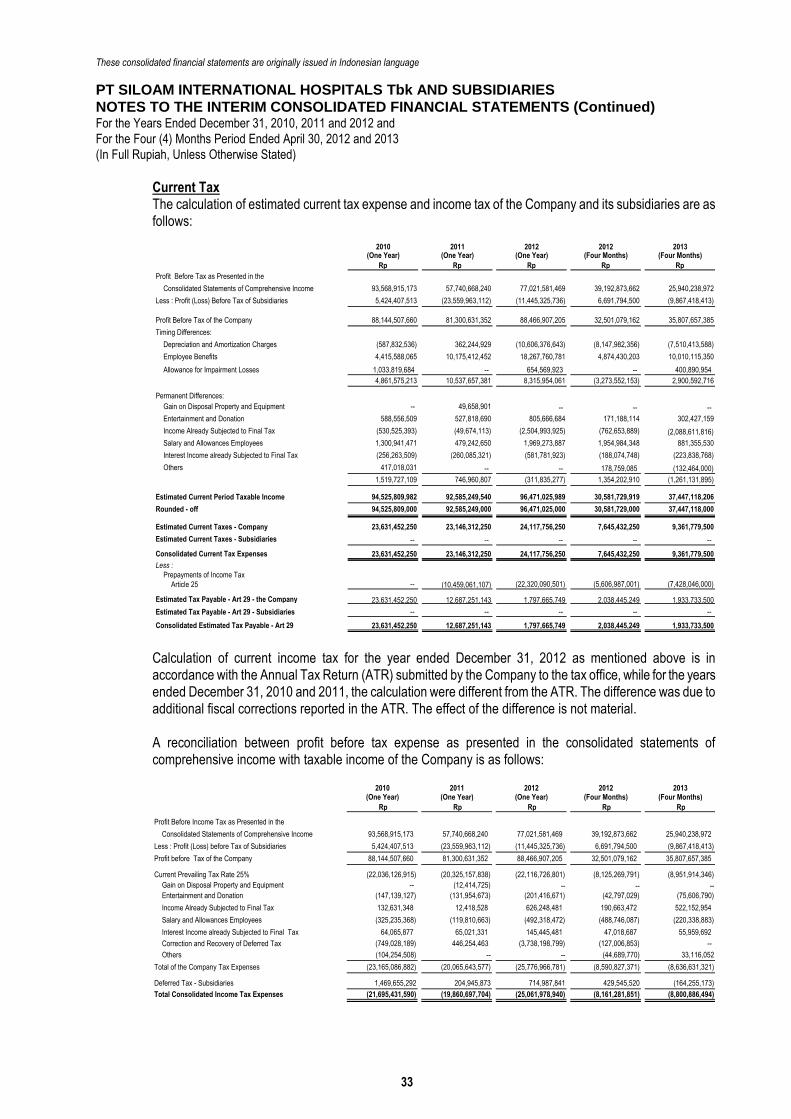
These consolidated financial statements are originally issued in Indonesian language
PT SILOAM INTERNATIONAL HOSPITALS Tbk AND SUBSIDIARIES
NOTES TO THE INTERIM CONSOLIDATED FINANCIAL STATEMENTS (Continued) For the Years Ended December 31, 2010, 2011 and 2012 and
For the Four (4) Months Period Ended April 30, 2012 and 2013
(In Full Rupiah, Unless Otherwise Stated)
Draft/July 26, 2013 33 paraf:
Current Tax The calculation of estimated current tax expense and income tax of the Company and its subsidiaries are as follows:
2010 2011 2012 2012 2013(One Year) (One Year) (One Year) (Four Months) (Four Months)
Rp Rp Rp Rp Rp
Profit Before Tax as Presented in the
Consolidated Statements of Comprehensive Income 93,568,915,173 57,740,668,240 77,021,581,469 39,192,873,662 25,940,238,972
Less : Profit (Loss) Before Tax of Subsidiaries 5,424,407,513 (23,559,963,112) (11,445,325,736) 6,691,794,500 (9,867,418,413)
Profit Before Tax of the Company 88,144,507,660 81,300,631,352 88,466,907,205 32,501,079,162 35,807,657,385
Timing Differences:
Depreciation and Amortization Charges (587,832,536) 362,244,929 (10,606,376,643) (8,147,982,356) (7,510,413,588)
Employee Benefits 4,415,588,065 10,175,412,452 18,267,760,781 4,874,430,203 10,010,115,350
Allowance for Impairment Losses 1,033,819,684 -- 654,569,923 -- 400,890,954
4,861,575,213 10,537,657,381 8,315,954,061 (3,273,552,153) 2,900,592,716
Permanent Differences:
Gain on Disposal Property and Equipment -- 49,658,901 -- -- --
Entertainment and Donation 588,556,509 527,818,690 805,666,684 171,188,114 302,427,159
Income Already Subjected to Final Tax (530,525,393) (49,674,113) (2,504,993,925) (762,653,889) (2,088,611,816)
Salary and Allowances Employees 1,300,941,471 479,242,650 1,969,273,887 1,954,984,348 881,355,530
Interest Income already Subjected to Final Tax (256,263,509) (260,085,321) (581,781,923) (188,074,748) (223,838,768)
Others 417,018,031 -- -- 178,759,085 (132,464,000)
1,519,727,109 746,960,807 (311,835,277) 1,354,202,910 (1,261,131,895)
Estimated Current Period Taxable Income 94,525,809,982 92,585,249,540 96,471,025,989 30,581,729,919 37,447,118,206
Rounded - off 94,525,809,000 92,585,249,000 96,471,025,000 30,581,729,000 37,447,118,000
Estimated Current Taxes - Company 23,631,452,250 23,146,312,250 24,117,756,250 7,645,432,250 9,361,779,500
Estimated Current Taxes - Subsidiaries -- -- -- -- --
Consolidated Current Tax Expenses 23,631,452,250 23,146,312,250 24,117,756,250 7,645,432,250 9,361,779,500
Less :
Prepayments of Income Tax
Pajak Penghasilan Pasal 25Article 25 -- (10,459,061,107) (22,320,090,501) (5,606,987,001) (7,428,046,000)
Estimated Tax Payable - Art 29 - the Company 23,631,452,250 12,687,251,143 1,797,665,749 2,038,445,249 1,933,733,500
Estimated Tax Payable - Art 29 - Subsidiaries -- -- -- -- --
Consolidated Estimated Tax Payable - Art 29 23,631,452,250 12,687,251,143 1,797,665,749 2,038,445,249 1,933,733,500
Calculation of current income tax for the year ended December 31, 2012 as mentioned above is in accordance with the Annual Tax Return (ATR) submitted by the Company to the tax office, while for the years ended December 31, 2010 and 2011, the calculation were different from the ATR. The difference was due to additional fiscal corrections reported in the ATR. The effect of the difference is not material.
A reconciliation between profit before tax expense as presented in the consolidated statements of comprehensive income with taxable income of the Company is as follows:
2010 2011 2012 2012 2013(One Year) (One Year) (One Year) (Four Months) (Four Months)
Rp Rp Rp Rp Rp
Profit Before Income Tax as Presented in the
Consolidated Statements of Comprehensive Income 93,568,915,173 57,740,668,240 77,021,581,469 39,192,873,662 25,940,238,972
Less : Profit (Loss) before Tax of Subsidiaries 5,424,407,513 (23,559,963,112) (11,445,325,736) 6,691,794,500 (9,867,418,413)
Profit before Tax of the Company 88,144,507,660 81,300,631,352 88,466,907,205 32,501,079,162 35,807,657,385
Current Prevailing Tax Rate 25% (22,036,126,915) (20,325,157,838) (22,116,726,801) (8,125,269,791) (8,951,914,346)
Gain on Disposal Property and Equipment -- (12,414,725) -- -- --
Entertainment and Donation (147,139,127) (131,954,673) (201,416,671) (42,797,029) (75,606,790)
Income Already Subjected to Final Tax 132,631,348 12,418,528 626,248,481 190,663,472 522,152,954
Salary and Allowances Employees (325,235,368) (119,810,663) (492,318,472) (488,746,087) (220,338,883)
Interest Income already Subjected to Final Tax 64,065,877 65,021,331 145,445,481 47,018,687 55,959,692
Correction and Recovery of Deferred Tax (749,028,189) 446,254,463 (3,738,198,799) (127,006,853) --
Others (104,254,508) -- -- (44,689,770) 33,116,052
Total of the Company Tax Expenses (23,165,086,882) (20,065,643,577) (25,776,966,781) (8,590,827,371) (8,636,631,321)
Deferred Tax - Subsidiaries 1,469,655,292 204,945,873 714,987,841 429,545,520 (164,255,173)
Total Consolidated Income Tax Expenses (21,695,431,590) (19,860,697,704) (25,061,978,940) (8,161,281,851) (8,800,886,494)
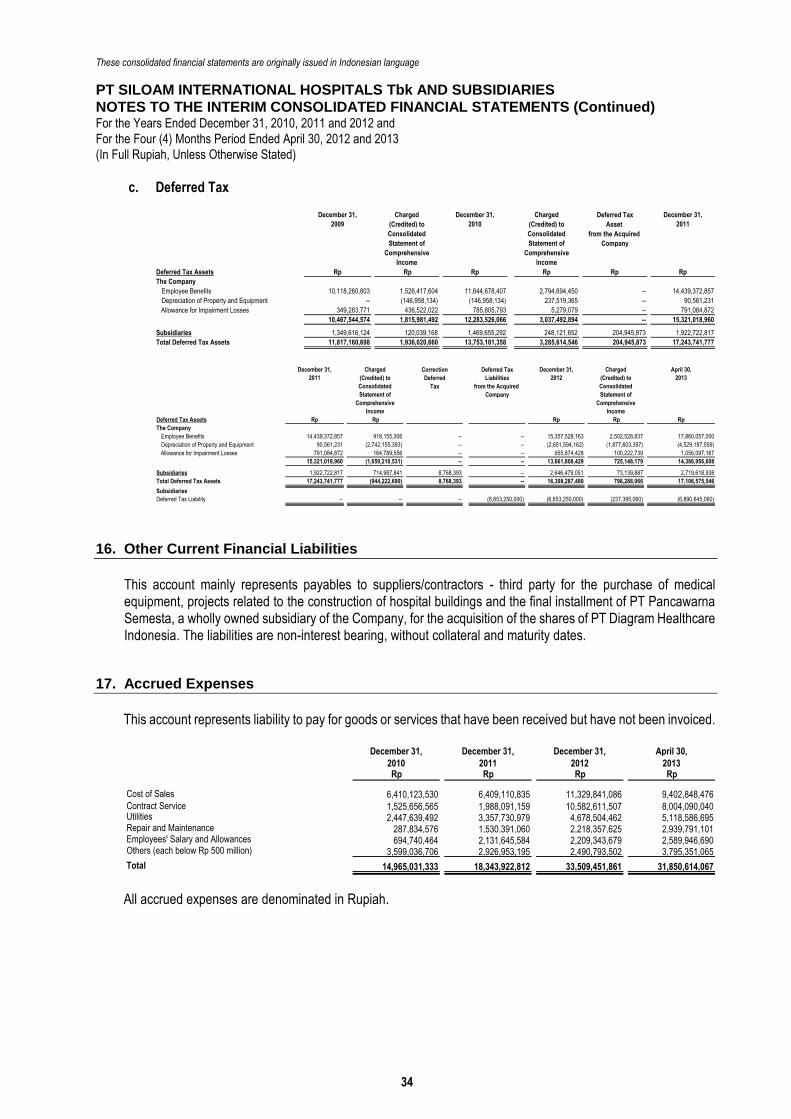
These consolidated financial statements are originally issued in Indonesian language
PT SILOAM INTERNATIONAL HOSPITALS Tbk AND SUBSIDIARIES
NOTES TO THE INTERIM CONSOLIDATED FINANCIAL STATEMENTS (Continued) For the Years Ended December 31, 2010, 2011 and 2012 and
For the Four (4) Months Period Ended April 30, 2012 and 2013
(In Full Rupiah, Unless Otherwise Stated)
Draft/July 26, 2013 34 paraf:
c. Deferred Tax
December 31, Charged December 31, Charged Deferred Tax December 31,
2009 (Credited) to 2010 (Credited) to Asset 2011
Consolidated Consolidated from the Acquired
Statement of Statement of Company
Comprehensive Comprehensive
Income Income
Deferred Tax Assets Rp Rp Rp Rp Rp Rp
The Company
Employee Benefits 10,118,260,803 1,526,417,604 11,644,678,407 2,794,694,450 -- 14,439,372,857
Depreciation of Property and Equipment -- (146,958,134) (146,958,134) 237,519,365 -- 90,561,231
Allowance for Impairment Losses 349,283,771 436,522,022 785,805,793 5,279,079 -- 791,084,872
10,467,544,574 1,815,981,492 12,283,526,066 3,037,492,894 -- 15,321,018,960
Subsidiaries 1,349,616,124 120,039,168 1,469,655,292 248,121,652 204,945,873 1,922,722,817
Total Deferred Tax Assets 11,817,160,698 1,936,020,660 13,753,181,358 3,285,614,546 204,945,873 17,243,741,777
December 31, Charged Correction Deferred Tax December 31, Charged April 30,
2011 (Credited) to Deferred Liabilities 2012 (Credited) to 2013
Consolidated Tax from the Acquired Consolidated
Statement of Company Statement of
Comprehensive Comprehensive
Income Income
Deferred Tax Assets Rp Rp Rp Rp Rp
The Company
Employee Benefits 14,439,372,857 918,155,306 -- -- 15,357,528,163 2,502,528,837 17,860,057,000
Depreciation of Property and Equipment 90,561,231 (2,742,155,393) -- -- (2,651,594,162) (1,877,603,397) (4,529,197,559)
Allowance for Impairment Losses 791,084,872 164,789,556 -- -- 955,874,428 100,222,739 1,056,097,167
15,321,018,960 (1,659,210,531) -- -- 13,661,808,429 725,148,179 14,386,956,608
Subsidiaries 1,922,722,817 714,987,841 8,768,393 -- 2,646,479,051 73,139,887 2,719,618,938
Total Deferred Tax Assets 17,243,741,777 (944,222,690) 8,768,393 -- 16,308,287,480 798,288,066 17,106,575,546
Subsidiaries
Deferred Tax Liability -- -- -- (6,653,250,000) (6,653,250,000) (237,395,060) (6,890,645,060)
16. Other Current Financial Liabilities
This account mainly represents payables to suppliers/contractors - third party for the purchase of medical equipment, projects related to the construction of hospital buildings and the final installment of PT Pancawarna Semesta, a wholly owned subsidiary of the Company, for the acquisition of the shares of PT Diagram Healthcare Indonesia. The liabilities are non-interest bearing, without collateral and maturity dates.
17. Accrued Expenses
This account represents liability to pay for goods or services that have been received but have not been invoiced.
December 31, December 31, December 31, April 30,
2010 2011 2012 2013Rp Rp Rp Rp
Cost of Sales 6,410,123,530 6,409,110,835 11,329,841,086 9,402,848,476 Contract Service 1,525,656,565 1,988,091,159 10,582,611,507 8,004,090,040 Utilities 2,447,639,492 3,357,730,979 4,678,504,462 5,118,586,695 Repair and Maintenance 287,834,576 1,530,391,060 2,218,357,625 2,939,791,101 Employees' Salary and Allowances 694,740,464 2,131,645,584 2,209,343,679 2,589,946,690 Others (each below Rp 500 million) 3,599,036,706 2,926,953,195 2,490,793,502 3,795,351,065
Total 14,965,031,333 18,343,922,812 33,509,451,861 31,850,614,067
All accrued expenses are denominated in Rupiah.
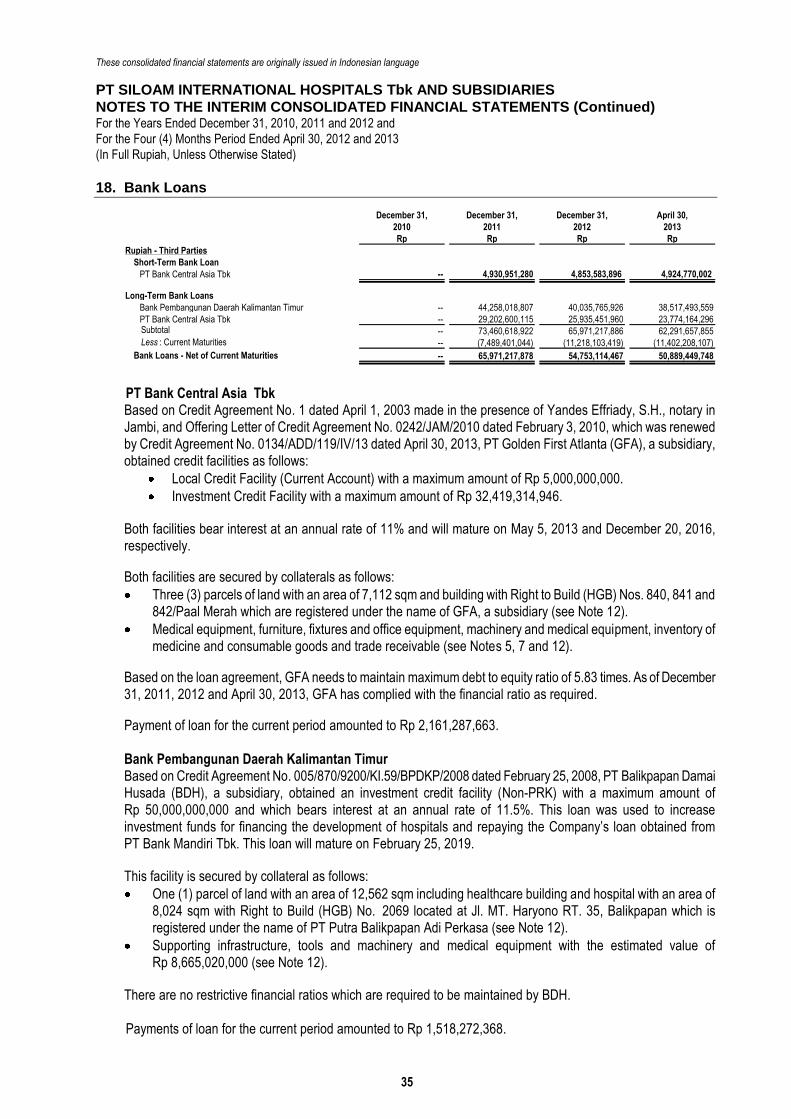
These consolidated financial statements are originally issued in Indonesian language
PT SILOAM INTERNATIONAL HOSPITALS Tbk AND SUBSIDIARIES
NOTES TO THE INTERIM CONSOLIDATED FINANCIAL STATEMENTS (Continued) For the Years Ended December 31, 2010, 2011 and 2012 and
For the Four (4) Months Period Ended April 30, 2012 and 2013
(In Full Rupiah, Unless Otherwise Stated)
Draft/July 26, 2013 35 paraf:
18. Bank Loans
December 31, December 31, December 31, April 30,
2010 2011 2012 2013
Rp Rp Rp Rp
Rupiah - Third Parties
Utang Bank Jangka PendekShort-Term Bank Loan
PT Bank Central Asia Tbk -- 4,930,951,280 4,853,583,896 4,924,770,002
Long-Term Bank Loans
Bank Pembangunan Daerah Kalimantan Timur -- 44,258,018,807 40,035,765,926 38,517,493,559
PT Bank Central Asia Tbk -- 29,202,600,115 25,935,451,960 23,774,164,296Subtotal -- 73,460,618,922 65,971,217,886 62,291,657,855Dikurangi: Bagian LancarLess : Current Maturities -- (7,489,401,044) (11,218,103,419) (11,402,208,107)
Bagian Jangka PanjangBank Loans - Net of Current Maturities -- 65,971,217,878 54,753,114,467 50,889,449,748
PT Bank Central Asia Tbk Based on Credit Agreement No. 1 dated April 1, 2003 made in the presence of Yandes Effriady, S.H., notary in Jambi, and Offering Letter of Credit Agreement No. 0242/JAM/2010 dated February 3, 2010, which was renewed by Credit Agreement No. 0134/ADD/119/IV/13 dated April 30, 2013, PT Golden First Atlanta (GFA), a subsidiary, obtained credit facilities as follows:
Local Credit Facility (Current Account) with a maximum amount of Rp 5,000,000,000.
Investment Credit Facility with a maximum amount of Rp 32,419,314,946.
Both facilities bear interest at an annual rate of 11% and will mature on May 5, 2013 and December 20, 2016, respectively.
Both facilities are secured by collaterals as follows:
Three (3) parcels of land with an area of 7,112 sqm and building with Right to Build (HGB) Nos. 840, 841 and 842/Paal Merah which are registered under the name of GFA, a subsidiary (see Note 12).
Medical equipment, furniture, fixtures and office equipment, machinery and medical equipment, inventory of medicine and consumable goods and trade receivable (see Notes 5, 7 and 12).
Based on the loan agreement, GFA needs to maintain maximum debt to equity ratio of 5.83 times. As of December 31, 2011, 2012 and April 30, 2013, GFA has complied with the financial ratio as required.
Payment of loan for the current period amounted to Rp 2,161,287,663. Bank Pembangunan Daerah Kalimantan Timur Based on Credit Agreement No. 005/870/9200/KI.59/BPDKP/2008 dated February 25, 2008, PT Balikpapan Damai Husada (BDH), a subsidiary, obtained an investment credit facility (Non-PRK) with a maximum amount of Rp 50,000,000,000 and which bears interest at an annual rate of 11.5%. This loan was used to increase investment funds for financing the development of hospitals and repaying the Company’s loan obtained from PT Bank Mandiri Tbk. This loan will mature on February 25, 2019.
This facility is secured by collateral as follows:
One (1) parcel of land with an area of 12,562 sqm including healthcare building and hospital with an area of 8,024 sqm with Right to Build (HGB) No. 2069 located at Jl. MT. Haryono RT. 35, Balikpapan which is registered under the name of PT Putra Balikpapan Adi Perkasa (see Note 12).
Supporting infrastructure, tools and machinery and medical equipment with the estimated value of Rp 8,665,020,000 (see Note 12).
There are no restrictive financial ratios which are required to be maintained by BDH. Payments of loan for the current period amounted to Rp 1,518,272,368.
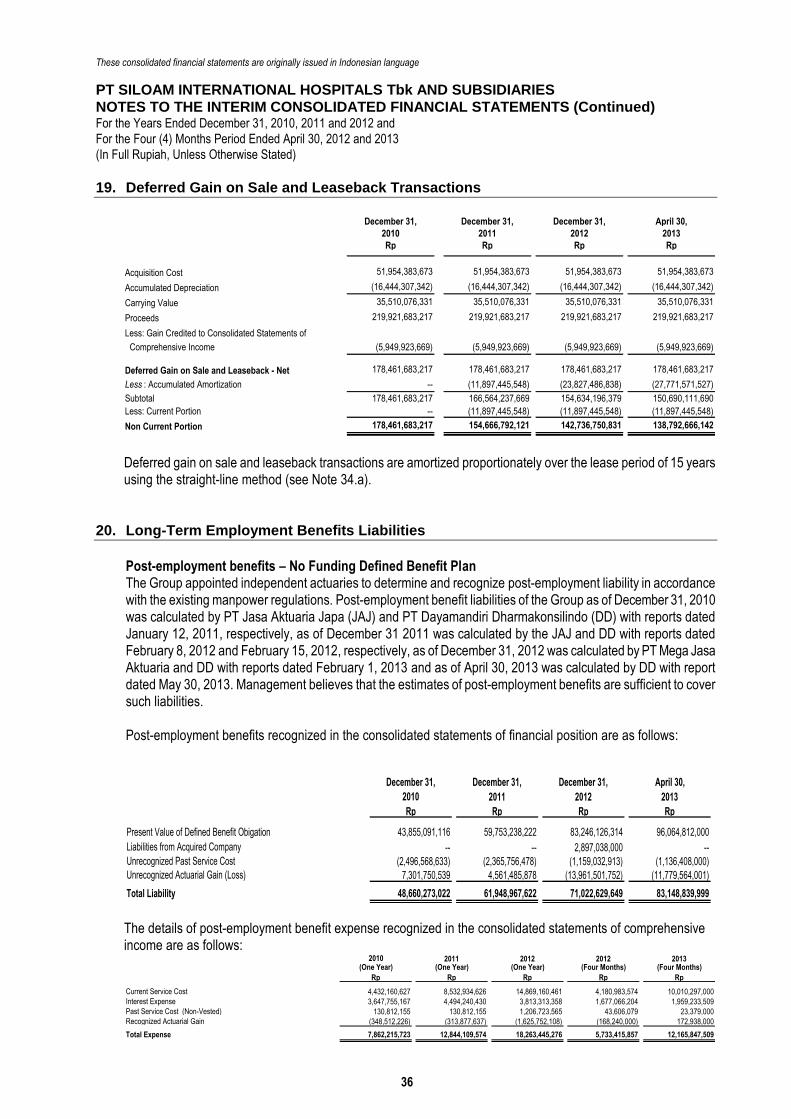
These consolidated financial statements are originally issued in Indonesian language
PT SILOAM INTERNATIONAL HOSPITALS Tbk AND SUBSIDIARIES
NOTES TO THE INTERIM CONSOLIDATED FINANCIAL STATEMENTS (Continued) For the Years Ended December 31, 2010, 2011 and 2012 and
For the Four (4) Months Period Ended April 30, 2012 and 2013
(In Full Rupiah, Unless Otherwise Stated)
Draft/July 26, 2013 36 paraf:
19. Deferred Gain on Sale and Leaseback Transactions
December 31, December 31, December 31, April 30,
2010 2011 2012 2013
Rp Rp Rp Rp
Acquisition Cost 51,954,383,673 51,954,383,673 51,954,383,673 51,954,383,673
Accumulated Depreciation (16,444,307,342) (16,444,307,342) (16,444,307,342) (16,444,307,342)
Carrying Value 35,510,076,331 35,510,076,331 35,510,076,331 35,510,076,331
Proceeds 219,921,683,217 219,921,683,217 219,921,683,217 219,921,683,217
Less: Gain Credited to Consolidated Statements of
Comprehensive Income (5,949,923,669) (5,949,923,669) (5,949,923,669) (5,949,923,669)
Deferred Gain on Sale and Leaseback - Net 178,461,683,217 178,461,683,217 178,461,683,217 178,461,683,217
Less : Accumulated Amortization -- (11,897,445,548) (23,827,486,838) (27,771,571,527)
Subtotal 178,461,683,217 166,564,237,669 154,634,196,379 150,690,111,690
Less: Current Portion -- (11,897,445,548) (11,897,445,548) (11,897,445,548)
Non Current Portion 178,461,683,217 154,666,792,121 142,736,750,831 138,792,666,142
Deferred gain on sale and leaseback transactions are amortized proportionately over the lease period of 15 years using the straight-line method (see Note 34.a).
20. Long-Term Employment Benefits Liabilities
Post-employment benefits – No Funding Defined Benefit Plan The Group appointed independent actuaries to determine and recognize post-employment liability in accordance with the existing manpower regulations. Post-employment benefit liabilities of the Group as of December 31, 2010 was calculated by PT Jasa Aktuaria Japa (JAJ) and PT Dayamandiri Dharmakonsilindo (DD) with reports dated January 12, 2011, respectively, as of December 31 2011 was calculated by the JAJ and DD with reports dated February 8, 2012 and February 15, 2012, respectively, as of December 31, 2012 was calculated by PT Mega Jasa Aktuaria and DD with reports dated February 1, 2013 and as of April 30, 2013 was calculated by DD with report dated May 30, 2013. Management believes that the estimates of post-employment benefits are sufficient to cover such liabilities. Post-employment benefits recognized in the consolidated statements of financial position are as follows:
December 31, December 31, December 31, April 30,
2010 2011 2012 2013
Rp Rp Rp Rp
Present Value of Defined Benefit Obigation 43,855,091,116 59,753,238,222 83,246,126,314 96,064,812,000
Liabilities from Acquired Company -- -- 2,897,038,000 --
Unrecognized Past Service Cost (2,496,568,633) (2,365,756,478) (1,159,032,913) (1,136,408,000)
Unrecognized Actuarial Gain (Loss) 7,301,750,539 4,561,485,878 (13,961,501,752) (11,779,564,001)
Total Liability 48,660,273,022 61,948,967,622 71,022,629,649 83,148,839,999
The details of post-employment benefit expense recognized in the consolidated statements of comprehensive income are as follows:
2010 2011 2012 2012 2013(One Year) (One Year) (One Year) (Four Months) (Four Months)
Rp Rp Rp Rp Rp
Current Service Cost 4,432,160,627 8,532,934,626 14,869,160,461 4,180,983,574 10,010,297,000
Interest Expense 3,647,755,167 4,494,240,430 3,813,313,358 1,677,066,204 1,959,233,509
Past Service Cost (Non-Vested) 130,812,155 130,812,155 1,206,723,565 43,606,079 23,379,000
Recognized Actuarial Gain (348,512,226) (313,877,637) (1,625,752,108) (168,240,000) 172,938,000
Total Expense 7,862,215,723 12,844,109,574 18,263,445,276 5,733,415,857 12,165,847,509
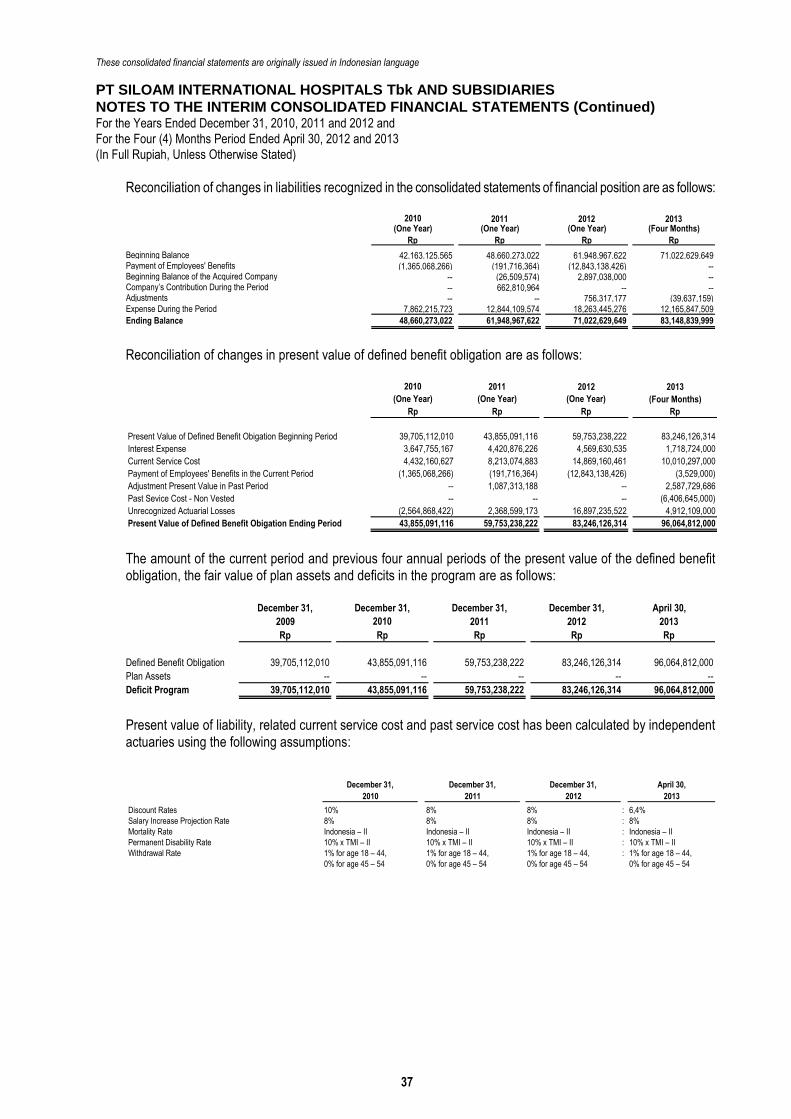
These consolidated financial statements are originally issued in Indonesian language
PT SILOAM INTERNATIONAL HOSPITALS Tbk AND SUBSIDIARIES
NOTES TO THE INTERIM CONSOLIDATED FINANCIAL STATEMENTS (Continued) For the Years Ended December 31, 2010, 2011 and 2012 and
For the Four (4) Months Period Ended April 30, 2012 and 2013
(In Full Rupiah, Unless Otherwise Stated)
Draft/July 26, 2013 37 paraf:
Reconciliation of changes in liabilities recognized in the consolidated statements of financial position are as follows:
2010 2011 2012 2013(One Year) (One Year) (One Year) (Four Months)
Rp Rp Rp Rp
Beginning Balance 42,163,125,565 48,660,273,022 61,948,967,622 71,022,629,649Payment of Employees' Benefits (1,365,068,266) (191,716,364) (12,843,138,426) --Beginning Balance of the Acquired Company -- (26,509,574) 2,897,038,000 --Company’s Contribution During the Period -- 662,810,964 -- --Adjustments -- -- 756,317,177 (39,637,159)Expense During the Period 7,862,215,723 12,844,109,574 18,263,445,276 12,165,847,509
Ending Balance 48,660,273,022 61,948,967,622 71,022,629,649 83,148,839,999 Reconciliation of changes in present value of defined benefit obligation are as follows:
2010 2011 2012 2013
(One Year) (One Year) (One Year) (Four Months)
Rp Rp Rp Rp
Present Value of Defined Benefit Obigation Beginning Period 39,705,112,010 43,855,091,116 59,753,238,222 83,246,126,314
Interest Expense 3,647,755,167 4,420,876,226 4,569,630,535 1,718,724,000
Current Service Cost 4,432,160,627 8,213,074,883 14,869,160,461 10,010,297,000
Payment of Employees' Benefits in the Current Period (1,365,068,266) (191,716,364) (12,843,138,426) (3,529,000)
Adjustment Present Value in Past Period -- 1,087,313,188 -- 2,587,729,686
Past Sevice Cost - Non Vested -- -- -- (6,406,645,000)
Unrecognized Actuarial Losses (2,564,868,422) 2,368,599,173 16,897,235,522 4,912,109,000
Present Value of Defined Benefit Obigation Ending Period 43,855,091,116 59,753,238,222 83,246,126,314 96,064,812,000
The amount of the current period and previous four annual periods of the present value of the defined benefit obligation, the fair value of plan assets and deficits in the program are as follows:
December 31, December 31, December 31, December 31, April 30,
2009 2010 2011 2012 2013
Rp Rp Rp Rp Rp
Defined Benefit Obligation 39,705,112,010 43,855,091,116 59,753,238,222 83,246,126,314 96,064,812,000
Plan Assets -- -- -- -- --
Deficit Program 39,705,112,010 43,855,091,116 59,753,238,222 83,246,126,314 96,064,812,000 Present value of liability, related current service cost and past service cost has been calculated by independent actuaries using the following assumptions:
December 31, December 31, December 31, April 30,
2010 2011 2012 2013
Discount Rates 10% 8% 8% : 6,4%
Salary Increase Projection Rate 8% 8% 8% : 8%
Mortality Rate Indonesia – II Indonesia – II Indonesia – II : Indonesia – II
Permanent Disability Rate 10% x TMI – II 10% x TMI – II 10% x TMI – II : 10% x TMI – II
Withdrawal Rate 1% for age 18 – 44, 1% for age 18 – 44, 1% for age 18 – 44, : 1% for age 18 – 44,
0% for age 45 – 54 0% for age 45 – 54 0% for age 45 – 54 0% for age 45 – 54
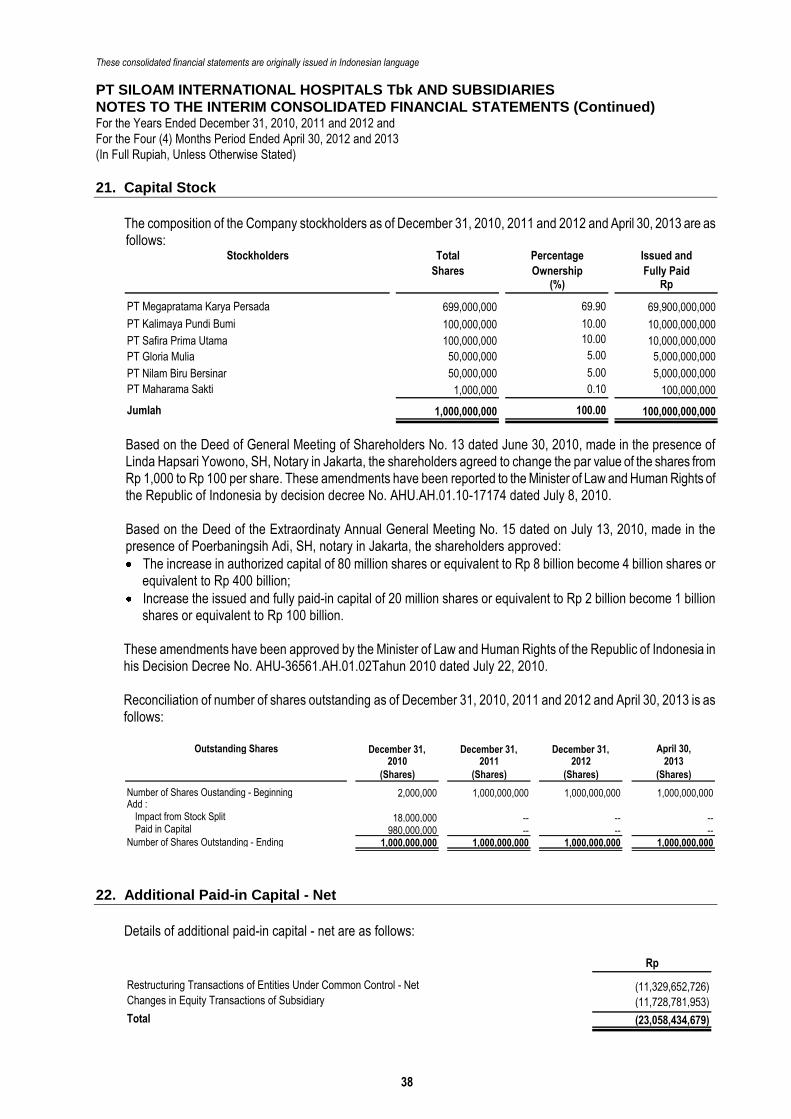
These consolidated financial statements are originally issued in Indonesian language
PT SILOAM INTERNATIONAL HOSPITALS Tbk AND SUBSIDIARIES
NOTES TO THE INTERIM CONSOLIDATED FINANCIAL STATEMENTS (Continued) For the Years Ended December 31, 2010, 2011 and 2012 and
For the Four (4) Months Period Ended April 30, 2012 and 2013
(In Full Rupiah, Unless Otherwise Stated)
Draft/July 26, 2013 38 paraf:
21. Capital Stock
The composition of the Company stockholders as of December 31, 2010, 2011 and 2012 and April 30, 2013 are as follows:
Total Percentage Issued and
Shares Ownership Fully Paid(%) Rp
PT Megapratama Karya Persada 699,000,000 69.90 69,900,000,000
PT Kalimaya Pundi Bumi 100,000,000 10.00 10,000,000,000
PT Safira Prima Utama 100,000,000 10.00 10,000,000,000
PT Gloria Mulia 50,000,000 5.00 5,000,000,000
PT Nilam Biru Bersinar 50,000,000 5.00 5,000,000,000
PT Maharama Sakti 1,000,000 0.10 100,000,000
Jumlah 1,000,000,000 100.00 100,000,000,000
Stockholders
Based on the Deed of General Meeting of Shareholders No. 13 dated June 30, 2010, made in the presence of Linda Hapsari Yowono, SH, Notary in Jakarta, the shareholders agreed to change the par value of the shares from Rp 1,000 to Rp 100 per share. These amendments have been reported to the Minister of Law and Human Rights of the Republic of Indonesia by decision decree No. AHU.AH.01.10-17174 dated July 8, 2010.
Based on the Deed of the Extraordinaty Annual General Meeting No. 15 dated on July 13, 2010, made in the presence of Poerbaningsih Adi, SH, notary in Jakarta, the shareholders approved:
The increase in authorized capital of 80 million shares or equivalent to Rp 8 billion become 4 billion shares or equivalent to Rp 400 billion;
Increase the issued and fully paid-in capital of 20 million shares or equivalent to Rp 2 billion become 1 billion shares or equivalent to Rp 100 billion.
These amendments have been approved by the Minister of Law and Human Rights of the Republic of Indonesia in his Decision Decree No. AHU-36561.AH.01.02Tahun 2010 dated July 22, 2010. Reconciliation of number of shares outstanding as of December 31, 2010, 2011 and 2012 and April 30, 2013 is as follows:
Outstanding Shares December 31, December 31, December 31, April 30,
2010 2011 2012 2013
(Shares) (Shares) (Shares) (Shares)
Number of Shares Oustanding - Beginning 2,000,000 1,000,000,000 1,000,000,000 1,000,000,000Add :
Impact from Stock Split 18,000,000 -- -- --Paid in Capital 980,000,000 -- -- --
Number of Shares Outstanding - Ending 1,000,000,000 1,000,000,000 1,000,000,000 1,000,000,000
22. Additional Paid-in Capital - Net
Details of additional paid-in capital - net are as follows:
Rp
Restructuring Transactions of Entities Under Common Control - Net (11,329,652,726)Changes in Equity Transactions of Subsidiary (11,728,781,953)
Total (23,058,434,679)
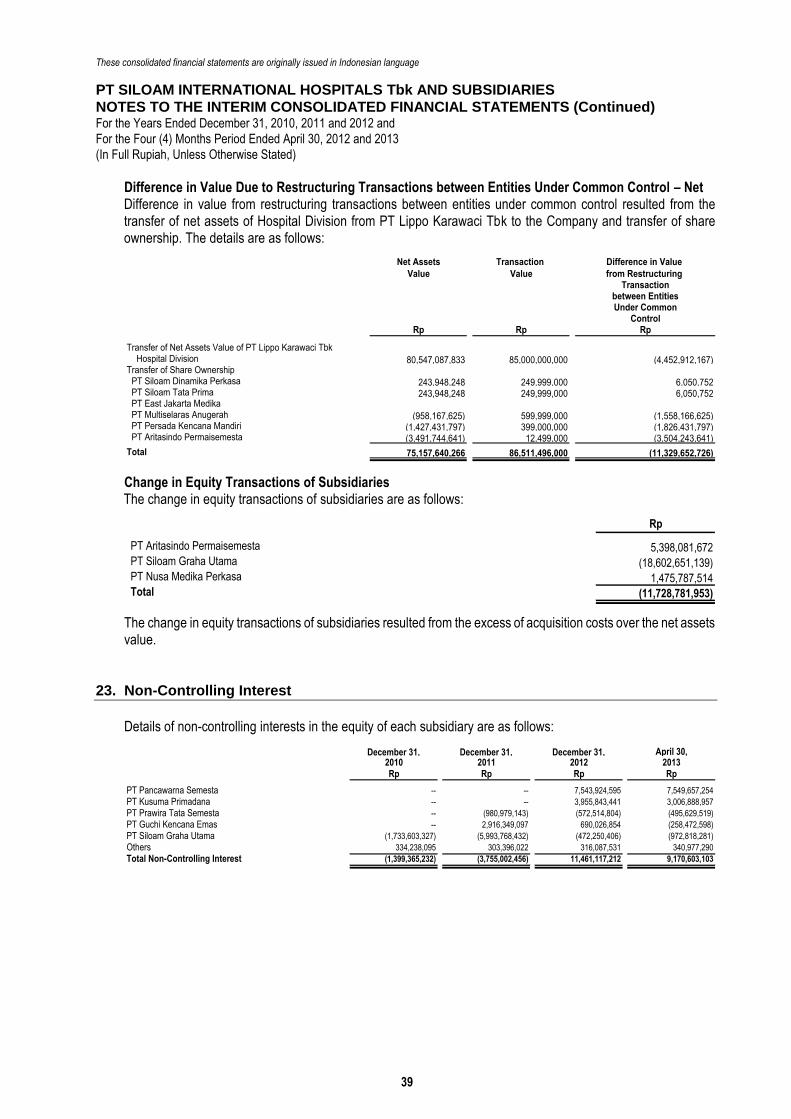
These consolidated financial statements are originally issued in Indonesian language
PT SILOAM INTERNATIONAL HOSPITALS Tbk AND SUBSIDIARIES
NOTES TO THE INTERIM CONSOLIDATED FINANCIAL STATEMENTS (Continued) For the Years Ended December 31, 2010, 2011 and 2012 and
For the Four (4) Months Period Ended April 30, 2012 and 2013
(In Full Rupiah, Unless Otherwise Stated)
Draft/July 26, 2013 39 paraf:
Difference in Value Due to Restructuring Transactions between Entities Under Common Control – Net Difference in value from restructuring transactions between entities under common control resulted from the transfer of net assets of Hospital Division from PT Lippo Karawaci Tbk to the Company and transfer of share ownership. The details are as follows:
Net Assets Transaction Difference in Value
Value Value from Restructuring Transaction
between EntitiesUnder Common
ControlRp Rp Rp
Transfer of Net Assets Value of PT Lippo Karawaci Tbk Hospital Division 80,547,087,833 85,000,000,000 (4,452,912,167)
Transfer of Share OwnershipPT Siloam Dinamika Perkasa 243,948,248 249,999,000 6,050,752PT Siloam Tata Prima 243,948,248 249,999,000 6,050,752PT East Jakarta MedikaPT Multiselaras Anugerah (958,167,625) 599,999,000 (1,558,166,625)PT Persada Kencana Mandiri (1,427,431,797) 399,000,000 (1,826,431,797)PT Aritasindo Permaisemesta (3,491,744,641) 12,499,000 (3,504,243,641)
--Total 75,157,640,266 86,511,496,000 (11,329,652,726)
Change in Equity Transactions of Subsidiaries The change in equity transactions of subsidiaries are as follows:
Rp
PT Aritasindo Permaisemesta 5,398,081,672PT Siloam Graha Utama (18,602,651,139)PT Nusa Medika Perkasa 1,475,787,514Total (11,728,781,953)
The change in equity transactions of subsidiaries resulted from the excess of acquisition costs over the net assets value.
23. Non-Controlling Interest
Details of non-controlling interests in the equity of each subsidiary are as follows:
December 31, December 31, December 31, April 30,2010 2011 2012 2013Rp Rp Rp Rp
PT Pancawarna Semesta -- -- 7,543,924,595 7,549,657,254
PT Kusuma Primadana -- -- 3,955,843,441 3,006,888,957
PT Prawira Tata Semesta -- (980,979,143) (572,514,804) (495,629,519)
PT Guchi Kencana Emas -- 2,916,349,097 690,026,854 (258,472,598)
PT Siloam Graha Utama (1,733,603,327) (5,993,768,432) (472,250,406) (972,818,281)
Others 334,238,095 303,396,022 316,087,531 340,977,290
Total Non-Controlling Interest (1,399,365,232) (3,755,002,456) 11,461,117,212 9,170,603,103
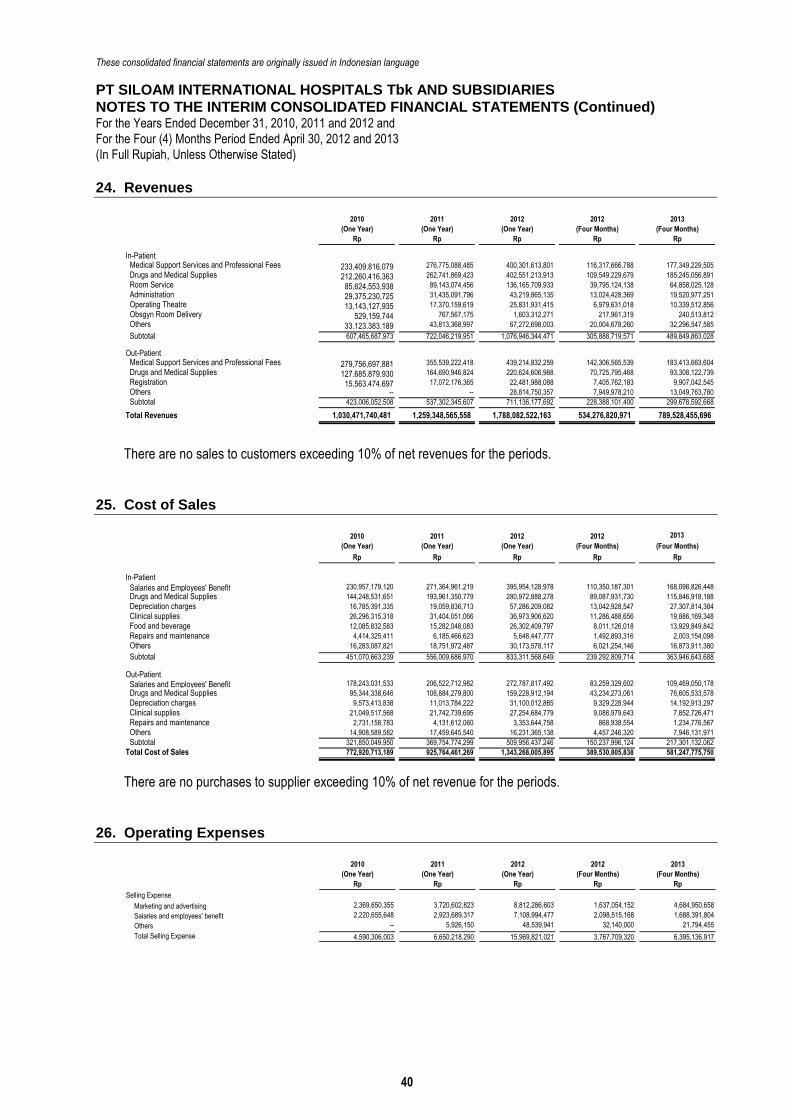
These consolidated financial statements are originally issued in Indonesian language
PT SILOAM INTERNATIONAL HOSPITALS Tbk AND SUBSIDIARIES
NOTES TO THE INTERIM CONSOLIDATED FINANCIAL STATEMENTS (Continued) For the Years Ended December 31, 2010, 2011 and 2012 and
For the Four (4) Months Period Ended April 30, 2012 and 2013
(In Full Rupiah, Unless Otherwise Stated)
Draft/July 26, 2013 40 paraf:
24. Revenues
2010 2011 2012 2012 2013
(One Year) (One Year) (One Year) (Four Months) (Four Months)
Rp Rp Rp Rp Rp
In-PatientMedical Support Services and Professional Fees 233,409,816,079 276,775,088,485 400,301,613,801 116,317,666,788 177,349,229,505
Drugs and Medical Supplies 212,260,416,363 262,741,869,423 402,551,213,913 109,549,229,679 185,245,056,891
Room Service 85,624,553,938 89,143,074,456 136,165,709,933 39,795,124,138 64,858,025,128
Administration 29,375,230,725 31,435,091,796 43,219,865,135 13,024,428,369 19,520,977,251
Operating Theatre 13,143,127,935 17,370,159,619 25,831,931,415 6,979,631,018 10,339,512,856
Obsgyn Room Delivery 529,159,744 767,567,175 1,603,312,271 217,961,319 240,513,812
Others 33,123,383,189 43,813,368,997 67,272,698,003 20,004,678,260 32,296,547,585
Subtotal 607,465,687,973 722,046,219,951 1,076,946,344,471 305,888,719,571 489,849,863,028
Out-Patient Medical Support Services and Professional Fees 279,756,697,881 355,539,222,418 439,214,832,259 142,306,565,539 183,413,663,604
Drugs and Medical Supplies 127,685,879,930 164,690,946,824 220,624,606,988 70,725,795,468 93,308,122,739
Registration 15,563,474,697 17,072,176,365 22,481,988,088 7,405,762,183 9,907,042,545
Others -- -- 28,814,750,357 7,949,978,210 13,049,763,780
Subtotal 423,006,052,508 537,302,345,607 711,136,177,692 228,388,101,400 299,678,592,668
Total Revenues 1,030,471,740,481 1,259,348,565,558 1,788,082,522,163 534,276,820,971 789,528,455,696
There are no sales to customers exceeding 10% of net revenues for the periods.
25. Cost of Sales
2010 2011 2012 2012 2013
(One Year) (One Year) (One Year) (Four Months) (Four Months)
Rp Rp Rp Rp Rp
In-Patient
Salaries and Employees' Benefit 230,957,179,120 271,364,961,219 395,954,128,978 110,350,187,301 168,098,826,448
Drugs and Medical Supplies 144,248,531,651 193,961,350,779 280,972,888,278 89,087,931,730 115,846,918,188
Depreciation charges 16,785,391,335 19,059,836,713 57,286,209,082 13,042,928,547 27,307,814,384
Clinical supplies 26,296,315,318 31,404,051,066 36,973,906,620 11,286,488,656 19,886,169,348
Food and beverage 12,085,832,583 15,282,048,083 26,302,409,797 8,011,126,018 13,929,849,842
Repairs and maintenance 4,414,325,411 6,185,466,623 5,648,447,777 1,492,893,316 2,003,154,098
Others 16,283,087,821 18,751,972,487 30,173,578,117 6,021,254,146 16,873,911,380
Subtotal 451,070,663,239 556,009,686,970 833,311,568,649 239,292,809,714 363,946,643,688
Out-PatientSalaries and Employees' Benefit 178,243,031,533 206,522,712,982 272,787,817,492 83,259,329,602 109,469,050,178
Drugs and Medical Supplies 95,344,338,646 108,884,279,800 159,228,912,194 43,234,273,061 76,605,533,578
Depreciation charges 9,573,413,838 11,013,784,222 31,100,012,885 9,329,228,944 14,192,913,297
Clinical supplies 21,049,517,568 21,742,739,695 27,254,684,779 9,088,979,643 7,852,726,471
Repairs and maintenance 2,731,158,783 4,131,612,060 3,353,644,758 868,938,554 1,234,776,567
Others 14,908,589,582 17,459,645,540 16,231,365,138 4,457,246,320 7,946,131,971
Subtotal 321,850,049,950 369,754,774,299 509,956,437,246 150,237,996,124 217,301,132,062
Total Cost of Sales 772,920,713,189 925,764,461,269 1,343,268,005,895 389,530,805,838 581,247,775,750
There are no purchases to supplier exceeding 10% of net revenue for the periods.
26. Operating Expenses
2010 2011 2012 2012 2013
(One Year) (One Year) (One Year) (Four Months) (Four Months)
Rp Rp Rp Rp Rp
Selling Expense
Marketing and advertising 2,369,650,355 3,720,602,823 8,812,286,603 1,637,054,152 4,684,950,658
Gaji dan Kesejahteraan KaryawanSalaries and employees' benefit 2,220,655,648 2,923,689,317 7,108,994,477 2,098,515,168 1,688,391,804
Lain-lainOthers -- 5,926,150 48,539,941 32,140,000 21,794,455
Sub JumlahTotal Selling Expense 4,590,306,003 6,650,218,290 15,969,821,021 3,767,709,320 6,395,136,917
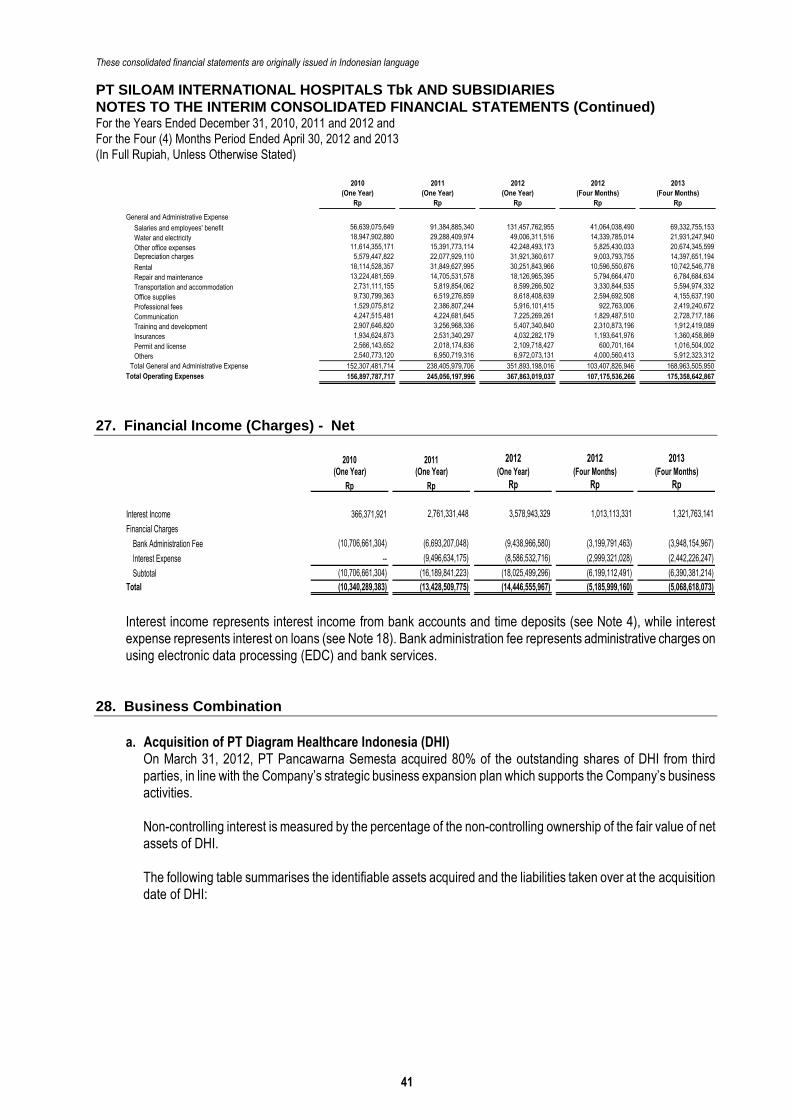
These consolidated financial statements are originally issued in Indonesian language
PT SILOAM INTERNATIONAL HOSPITALS Tbk AND SUBSIDIARIES
NOTES TO THE INTERIM CONSOLIDATED FINANCIAL STATEMENTS (Continued) For the Years Ended December 31, 2010, 2011 and 2012 and
For the Four (4) Months Period Ended April 30, 2012 and 2013
(In Full Rupiah, Unless Otherwise Stated)
Draft/July 26, 2013 41 paraf:
2010 2011 2012 2012 2013
(One Year) (One Year) (One Year) (Four Months) (Four Months)
Rp Rp Rp Rp Rp
General and Administrative Expense
Gaji dan Kesejahteraan KaryawanSalaries and employees' benefit 56,639,075,649 91,384,885,340 131,457,762,955 41,064,038,490 69,332,755,153
Listrik dan AirWater and electricity 18,947,902,880 29,288,409,974 49,006,311,516 14,339,785,014 21,931,247,940
Biaya Kantor LainnyaOther office expenses 11,614,355,171 15,391,773,114 42,248,493,173 5,825,430,033 20,674,345,599
PenyusutanDepreciation charges 5,579,447,822 22,077,929,110 31,921,360,617 9,003,793,755 14,397,651,194
SewaRental 18,114,528,357 31,849,627,995 30,251,843,966 10,596,550,876 10,742,546,778
Perbaikan dan PerawatanRepair and maintenance 13,224,481,559 14,705,531,578 18,126,965,395 5,794,664,470 6,784,684,634
Transportasi dan AkomodasiTransportation and accommodation 2,731,111,155 5,819,854,062 8,599,266,502 3,330,844,535 5,594,974,332
Perlengkapan KantorOffice supplies 9,730,799,363 6,519,276,859 8,618,408,639 2,594,692,508 4,155,637,190
Jasa KonsultanProfessional fees 1,529,075,812 2,386,807,244 5,916,101,415 922,763,006 2,419,240,672
KomunikasiCommunication 4,247,515,481 4,224,681,645 7,225,269,261 1,829,487,510 2,728,717,186
Pelatihan dan PengembanganTraining and development 2,907,646,820 3,256,968,336 5,407,340,840 2,310,873,196 1,912,419,089
AsuransiInsurances 1,934,624,873 2,531,340,297 4,032,282,179 1,193,641,976 1,360,458,869
Legal dan PerizinanPermit and license 2,566,143,652 2,018,174,836 2,109,718,427 600,701,164 1,016,504,002
Lain-lainOthers 2,540,773,120 6,950,719,316 6,972,073,131 4,000,560,413 5,912,323,312
Sub JumlahTotal General and Administrative Expense 152,307,481,714 238,405,979,706 351,893,198,016 103,407,826,946 168,963,505,950
Total Operating Expenses 156,897,787,717 245,056,197,996 367,863,019,037 107,175,536,266 175,358,642,867
27. Financial Income (Charges) - Net
2010 2011 2012 2012 2013
(One Year) (One Year) (One Year) (Four Months) (Four Months)
Rp Rp Rp Rp Rp
Interest Income 366,371,921 2,761,331,448 3,578,943,329 1,013,113,331 1,321,763,141
Financial Charges
Bank Administration Fee (10,706,661,304) (6,693,207,048) (9,438,966,580) (3,199,791,463) (3,948,154,967)
Interest Expense -- (9,496,634,175) (8,586,532,716) (2,999,321,028) (2,442,226,247)
Subtotal (10,706,661,304) (16,189,841,223) (18,025,499,296) (6,199,112,491) (6,390,381,214)
Total (10,340,289,383) (13,428,509,775) (14,446,555,967) (5,185,999,160) (5,068,618,073) Interest income represents interest income from bank accounts and time deposits (see Note 4), while interest expense represents interest on loans (see Note 18). Bank administration fee represents administrative charges on using electronic data processing (EDC) and bank services.
28. Business Combination
a. Acquisition of PT Diagram Healthcare Indonesia (DHI)
On March 31, 2012, PT Pancawarna Semesta acquired 80% of the outstanding shares of DHI from third parties, in line with the Company’s strategic business expansion plan which supports the Company’s business activities. Non-controlling interest is measured by the percentage of the non-controlling ownership of the fair value of net assets of DHI. The following table summarises the identifiable assets acquired and the liabilities taken over at the acquisition date of DHI:
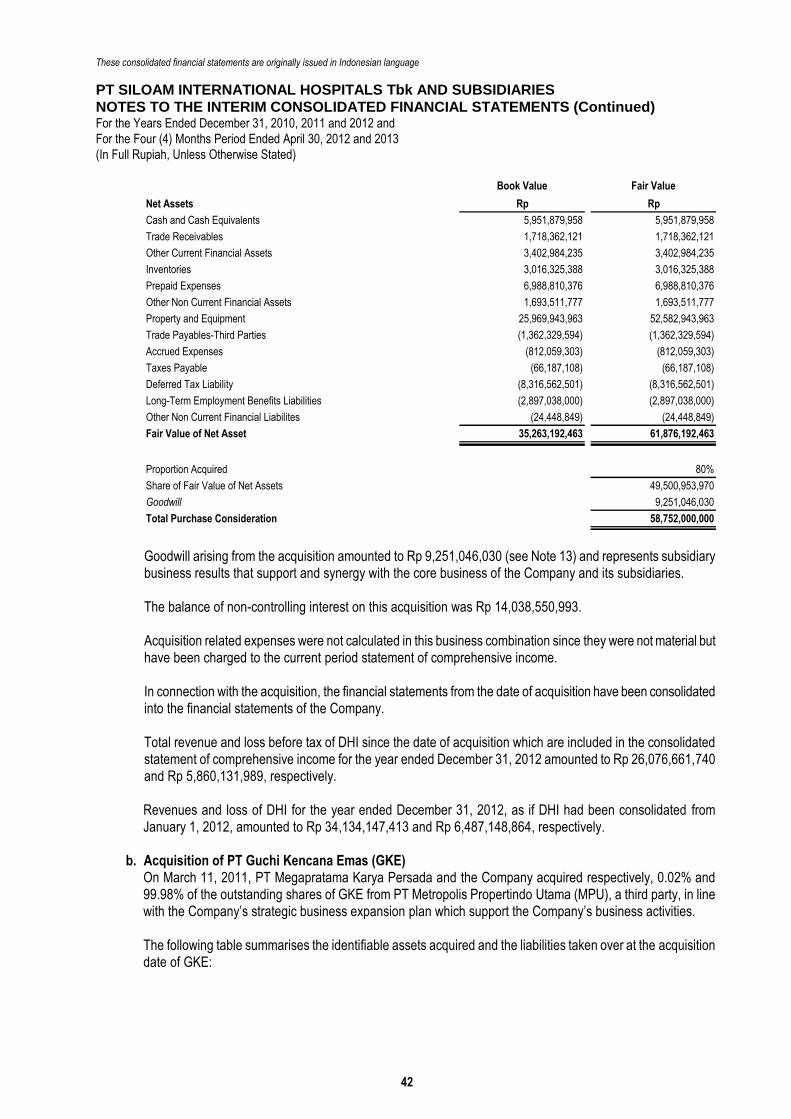
These consolidated financial statements are originally issued in Indonesian language
PT SILOAM INTERNATIONAL HOSPITALS Tbk AND SUBSIDIARIES
NOTES TO THE INTERIM CONSOLIDATED FINANCIAL STATEMENTS (Continued) For the Years Ended December 31, 2010, 2011 and 2012 and
For the Four (4) Months Period Ended April 30, 2012 and 2013
(In Full Rupiah, Unless Otherwise Stated)
Draft/July 26, 2013 42 paraf:
Book Value Fair Value
Net Assets Rp Rp
Cash and Cash Equivalents 5,951,879,958 5,951,879,958
Trade Receivables 1,718,362,121 1,718,362,121
Other Current Financial Assets 3,402,984,235 3,402,984,235
Inventories 3,016,325,388 3,016,325,388
Prepaid Expenses 6,988,810,376 6,988,810,376
Other Non Current Financial Assets 1,693,511,777 1,693,511,777
Property and Equipment 25,969,943,963 52,582,943,963
Trade Payables-Third Parties (1,362,329,594) (1,362,329,594)
Accrued Expenses (812,059,303) (812,059,303)
Taxes Payable (66,187,108) (66,187,108)
Deferred Tax Liability (8,316,562,501) (8,316,562,501)
Long-Term Employment Benefits Liabilities (2,897,038,000) (2,897,038,000)
Other Non Current Financial Liabilites (24,448,849) (24,448,849)
Fair Value of Net Asset 35,263,192,463 61,876,192,463
Proportion Acquired 80%
Share of Fair Value of Net Assets 49,500,953,970
Goodwill 9,251,046,030
Total Purchase Consideration 58,752,000,000
Goodwill arising from the acquisition amounted to Rp 9,251,046,030 (see Note 13) and represents subsidiary business results that support and synergy with the core business of the Company and its subsidiaries. The balance of non-controlling interest on this acquisition was Rp 14,038,550,993. Acquisition related expenses were not calculated in this business combination since they were not material but have been charged to the current period statement of comprehensive income. In connection with the acquisition, the financial statements from the date of acquisition have been consolidated into the financial statements of the Company. Total revenue and loss before tax of DHI since the date of acquisition which are included in the consolidated statement of comprehensive income for the year ended December 31, 2012 amounted to Rp 26,076,661,740 and Rp 5,860,131,989, respectively. Revenues and loss of DHI for the year ended December 31, 2012, as if DHI had been consolidated from January 1, 2012, amounted to Rp 34,134,147,413 and Rp 6,487,148,864, respectively.
b. Acquisition of PT Guchi Kencana Emas (GKE) On March 11, 2011, PT Megapratama Karya Persada and the Company acquired respectively, 0.02% and 99.98% of the outstanding shares of GKE from PT Metropolis Propertindo Utama (MPU), a third party, in line with the Company’s strategic business expansion plan which support the Company’s business activities. The following table summarises the identifiable assets acquired and the liabilities taken over at the acquisition date of GKE:
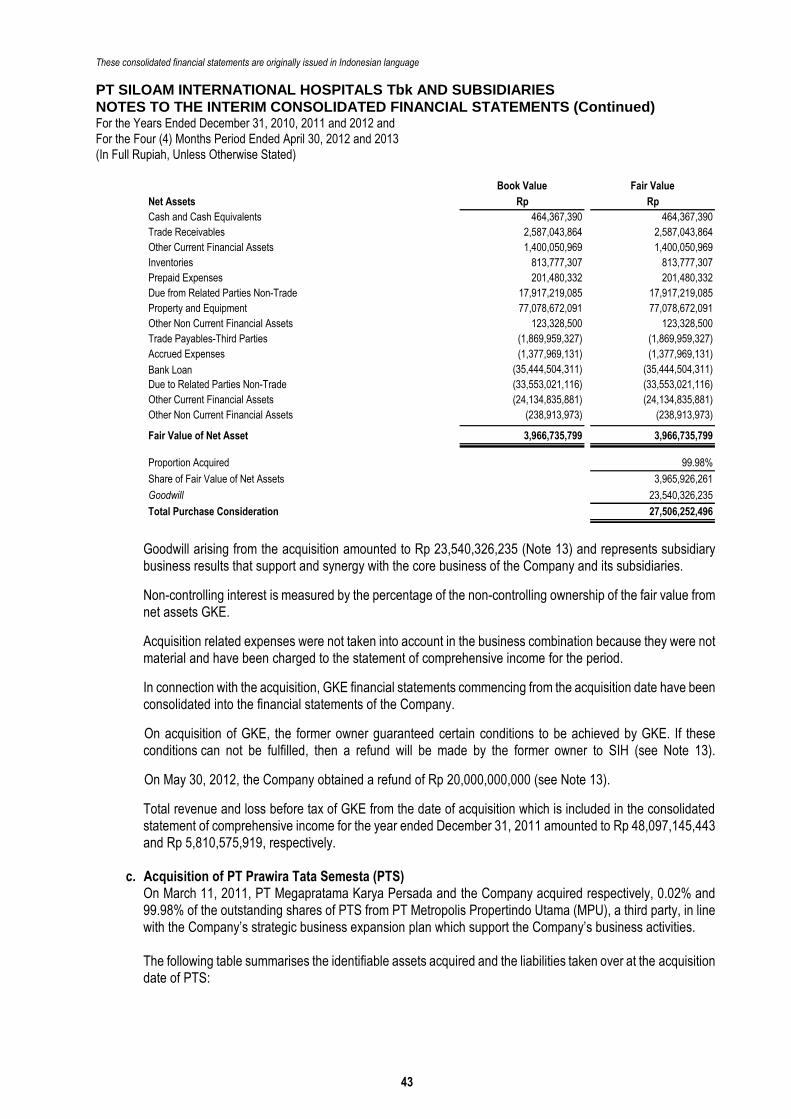
These consolidated financial statements are originally issued in Indonesian language
PT SILOAM INTERNATIONAL HOSPITALS Tbk AND SUBSIDIARIES
NOTES TO THE INTERIM CONSOLIDATED FINANCIAL STATEMENTS (Continued) For the Years Ended December 31, 2010, 2011 and 2012 and
For the Four (4) Months Period Ended April 30, 2012 and 2013
(In Full Rupiah, Unless Otherwise Stated)
Draft/July 26, 2013 43 paraf:
Book Value Fair Value
Net Assets Rp Rp
Cash and Cash Equivalents 464,367,390 464,367,390
Trade Receivables 2,587,043,864 2,587,043,864
Other Current Financial Assets 1,400,050,969 1,400,050,969
Inventories 813,777,307 813,777,307
Prepaid Expenses 201,480,332 201,480,332
Due from Related Parties Non-Trade 17,917,219,085 17,917,219,085
Property and Equipment 77,078,672,091 77,078,672,091
Other Non Current Financial Assets 123,328,500 123,328,500
Trade Payables-Third Parties (1,869,959,327) (1,869,959,327)
Accrued Expenses (1,377,969,131) (1,377,969,131)
Bank Loan (35,444,504,311) (35,444,504,311)
Due to Related Parties Non-Trade (33,553,021,116) (33,553,021,116)
Other Current Financial Assets (24,134,835,881) (24,134,835,881)
Other Non Current Financial Assets (238,913,973) (238,913,973)
Fair Value of Net Asset 3,966,735,799 3,966,735,799
Proportion Acquired 99.98%
Share of Fair Value of Net Assets 3,965,926,261
Goodwill 23,540,326,235
Total Purchase Consideration 27,506,252,496
Goodwill arising from the acquisition amounted to Rp 23,540,326,235 (Note 13) and represents subsidiary business results that support and synergy with the core business of the Company and its subsidiaries.
Non-controlling interest is measured by the percentage of the non-controlling ownership of the fair value from net assets GKE.
Acquisition related expenses were not taken into account in the business combination because they were not material and have been charged to the statement of comprehensive income for the period.
In connection with the acquisition, GKE financial statements commencing from the acquisition date have been consolidated into the financial statements of the Company.
On acquisition of GKE, the former owner guaranteed certain conditions to be achieved by GKE. If these conditions can not be fulfilled, then a refund will be made by the former owner to SIH (see Note 13).
On May 30, 2012, the Company obtained a refund of Rp 20,000,000,000 (see Note 13).
Total revenue and loss before tax of GKE from the date of acquisition which is included in the consolidated statement of comprehensive income for the year ended December 31, 2011 amounted to Rp 48,097,145,443 and Rp 5,810,575,919, respectively.
c. Acquisition of PT Prawira Tata Semesta (PTS)
On March 11, 2011, PT Megapratama Karya Persada and the Company acquired respectively, 0.02% and 99.98% of the outstanding shares of PTS from PT Metropolis Propertindo Utama (MPU), a third party, in line with the Company’s strategic business expansion plan which support the Company’s business activities. The following table summarises the identifiable assets acquired and the liabilities taken over at the acquisition date of PTS:

These consolidated financial statements are originally issued in Indonesian language
PT SILOAM INTERNATIONAL HOSPITALS Tbk AND SUBSIDIARIES
NOTES TO THE INTERIM CONSOLIDATED FINANCIAL STATEMENTS (Continued) For the Years Ended December 31, 2010, 2011 and 2012 and
For the Four (4) Months Period Ended April 30, 2012 and 2013
(In Full Rupiah, Unless Otherwise Stated)
Draft/July 26, 2013 44 paraf:
Book Value Fair Value
Net Assets Rp Rp
Cash and Cash Equivalents 2,450,122,146 2,450,122,146
Trade Receivables 4,195,833,122 4,195,833,122
Other Current Financial Assets 32,303,710,700 32,303,710,700
Inventories 1,242,461,120 1,242,461,120
Due from Related Parties Non-Trade 10,650,000,000 10,650,000,000
Property and Equipment 43,432,600,786 43,432,600,786
Intangible Asset - Net 27,640,947,894 27,640,947,894
Other Non Current Financial Assets 341,439,942 341,439,942
Trade Payables-Third Parties (1,265,031,469) (1,265,031,469)
Accrued Expenses (1,731,573,364) (1,731,573,364)
Bank Loan (48,656,100,504) (48,656,100,504)
Taxes Payable (38,923,795) (38,923,795)
Due to Related Parties Non-Trade (79,828,160,000) (79,828,160,000)
Other Non Current Financial Liabilites (203,724,591) (203,724,591)
Fair Value of Net Asset (9,466,398,013) (9,466,398,013)
Proportion Acquired 99.80%
Share of Fair Value of Net Assets (9,447,465,217)
Goodwill 55,146,465,217
Total Purchase Consideration 45,699,000,000
Goodwill arising from the acquisition amounted to Rp 55,146,465,217 (see Note 13) and represents subsidiary business results that support and synergy with the core business of the Company and its subsidiaries. Non-controlling interest is measured by the percentage of the non-controlling ownership of the fair value from net assets of PTS. Acquisition related expenses were not taken into account in the business combination because they were not material and have been charged to the current year statement of comprehensive income. In connection with the acquisition, the financial statements of PTS from the date of acquisition have been consolidated into the financial statements of the Company. On the acquisition of PTS, the former owner guaranteed certain conditions to be achieved by PTS. If these conditions can not be fulfilled, then a refund will be made by the former owner to SIH, (see Note 13). On May 30, 2012, SIH obtain a refund of Rp 41,000,000,000 (see Note 13).
Total revenue and loss before tax of PTS from the date of acquisition which is included in the consolidated statement of comprehensive income for the year ended December 31, 2011 amounted to amounted to Rp 47,383,884,644 and Rp 5,338,333,857, respectively.
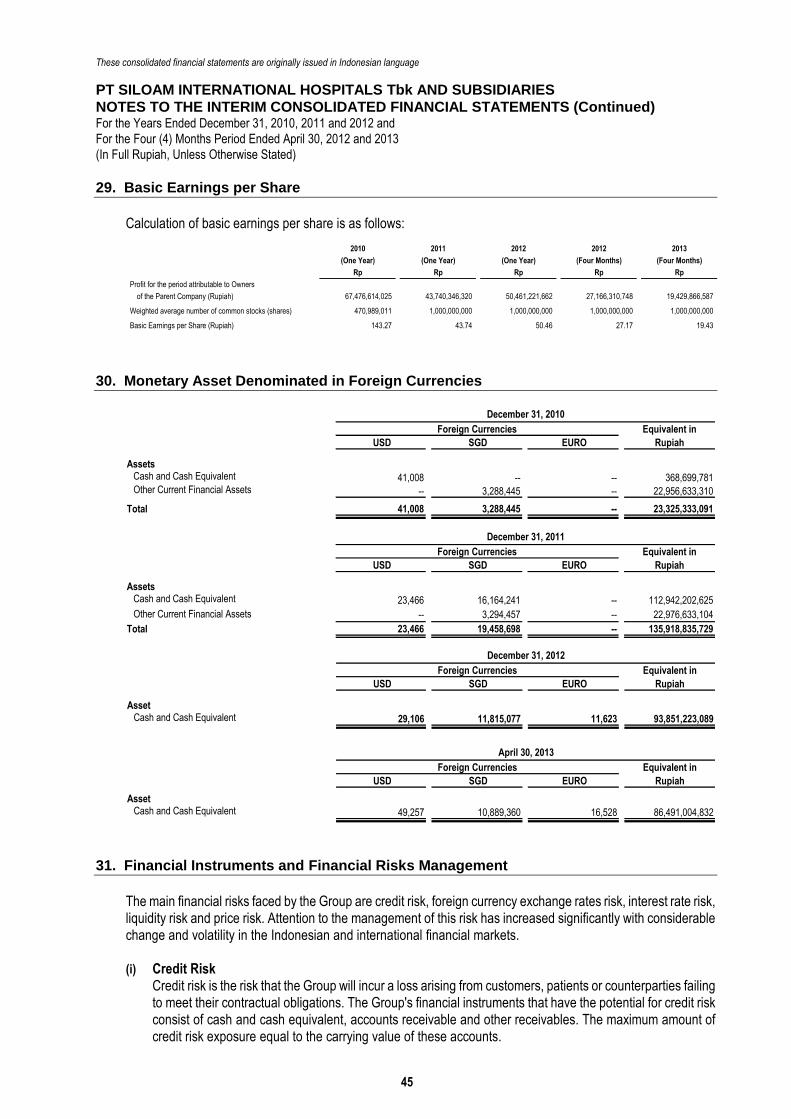
These consolidated financial statements are originally issued in Indonesian language
PT SILOAM INTERNATIONAL HOSPITALS Tbk AND SUBSIDIARIES
NOTES TO THE INTERIM CONSOLIDATED FINANCIAL STATEMENTS (Continued) For the Years Ended December 31, 2010, 2011 and 2012 and
For the Four (4) Months Period Ended April 30, 2012 and 2013
(In Full Rupiah, Unless Otherwise Stated)
Draft/July 26, 2013 45 paraf:
29. Basic Earnings per Share
Calculation of basic earnings per share is as follows:
2010 2011 2012 2012 2013
(One Year) (One Year) (One Year) (Four Months) (Four Months)
Rp Rp Rp Rp Rp
Profit for the period attributable to Owners
of the Parent Company (Rupiah) 67,476,614,025 43,740,346,320 50,461,221,662 27,166,310,748 19,429,866,587
Weighted average number of common stocks (shares) 470,989,011 1,000,000,000 1,000,000,000 1,000,000,000 1,000,000,000
Basic Earnings per Share (Rupiah) 143.27 43.74 50.46 27.17 19.43
30. Monetary Asset Denominated in Foreign Currencies
Equivalent in
USD SGD EURO Rupiah
AssetsCash and Cash Equivalent 41,008 -- -- 368,699,781Other Current Financial Assets -- 3,288,445 -- 22,956,633,310
Total 41,008 3,288,445 -- 23,325,333,091
December 31, 2010
Foreign Currencies
Equivalent in
USD SGD EURO Rupiah
AssetsCash and Cash Equivalent 23,466 16,164,241 -- 112,942,202,625
Other Current Financial Assets -- 3,294,457 -- 22,976,633,104
Total 23,466 19,458,698 -- 135,918,835,729
December 31, 2011
Foreign Currencies
Equivalent in
USD SGD EURO Rupiah
AssetCash and Cash Equivalent 29,106 11,815,077 11,623 93,851,223,089
December 31, 2012
Foreign Currencies
Equivalent in
USD SGD EURO Rupiah
AssetCash and Cash Equivalent 49,257 10,889,360 16,528 86,491,004,832
April 30, 2013
Foreign Currencies
31. Financial Instruments and Financial Risks Management
The main financial risks faced by the Group are credit risk, foreign currency exchange rates risk, interest rate risk, liquidity risk and price risk. Attention to the management of this risk has increased significantly with considerable change and volatility in the Indonesian and international financial markets. (i) Credit Risk
Credit risk is the risk that the Group will incur a loss arising from customers, patients or counterparties failing to meet their contractual obligations. The Group's financial instruments that have the potential for credit risk consist of cash and cash equivalent, accounts receivable and other receivables. The maximum amount of credit risk exposure equal to the carrying value of these accounts.
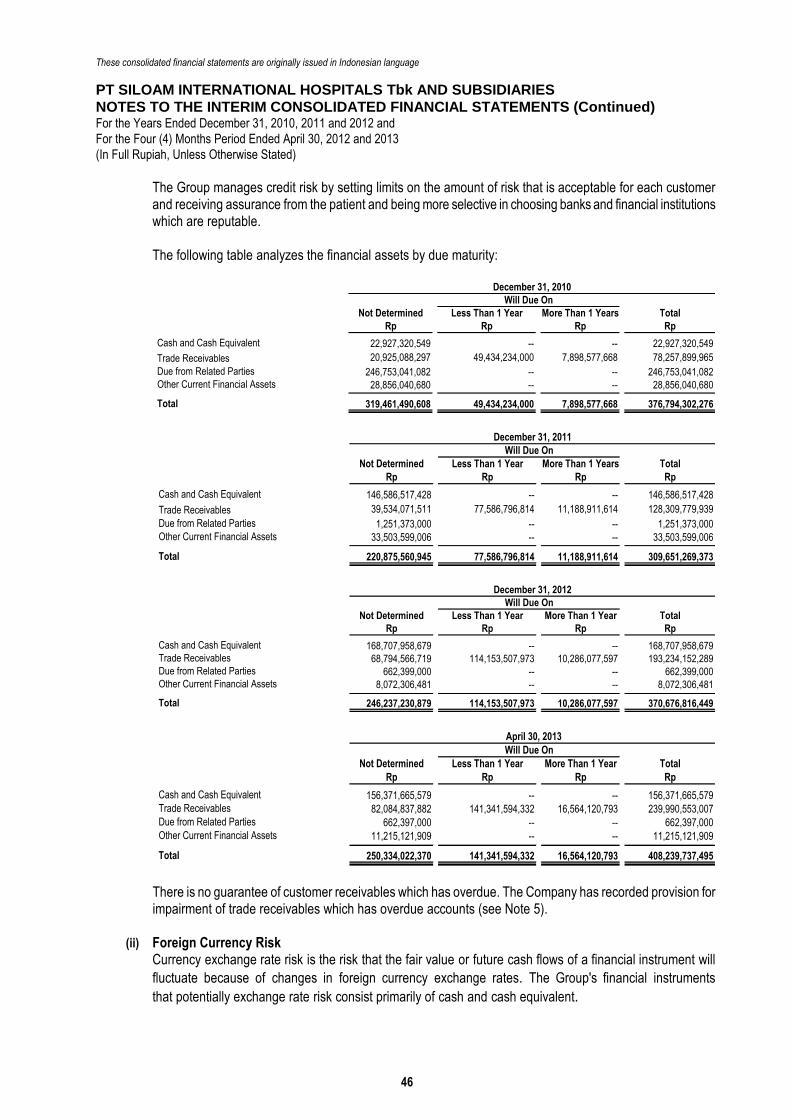
These consolidated financial statements are originally issued in Indonesian language
PT SILOAM INTERNATIONAL HOSPITALS Tbk AND SUBSIDIARIES
NOTES TO THE INTERIM CONSOLIDATED FINANCIAL STATEMENTS (Continued) For the Years Ended December 31, 2010, 2011 and 2012 and
For the Four (4) Months Period Ended April 30, 2012 and 2013
(In Full Rupiah, Unless Otherwise Stated)
Draft/July 26, 2013 46 paraf:
The Group manages credit risk by setting limits on the amount of risk that is acceptable for each customer and receiving assurance from the patient and being more selective in choosing banks and financial institutions which are reputable. The following table analyzes the financial assets by due maturity:
Not Determined Less Than 1 Year More Than 1 Years Total
Rp Rp Rp Rp
Cash and Cash Equivalent 22,927,320,549 -- -- 22,927,320,549
Trade Receivables 20,925,088,297 49,434,234,000 7,898,577,668 78,257,899,965
Due from Related Parties 246,753,041,082 -- -- 246,753,041,082Other Current Financial Assets 28,856,040,680 -- -- 28,856,040,680
Total 319,461,490,608 49,434,234,000 7,898,577,668 376,794,302,276
December 31, 2010
Will Due On
Not Determined Less Than 1 Year More Than 1 Years Total
Rp Rp Rp Rp
Cash and Cash Equivalent 146,586,517,428 -- -- 146,586,517,428
Trade Receivables 39,534,071,511 77,586,796,814 11,188,911,614 128,309,779,939
Due from Related Parties 1,251,373,000 -- -- 1,251,373,000Other Current Financial Assets 33,503,599,006 -- -- 33,503,599,006Other Current Financial Assets
Total 220,875,560,945 77,586,796,814 11,188,911,614 309,651,269,373
December 31, 2011
Will Due On
Not Determined Less Than 1 Year More Than 1 Year Total
Rp Rp Rp Rp
Cash and Cash Equivalent 168,707,958,679 -- -- 168,707,958,679Trade Receivables 68,794,566,719 114,153,507,973 10,286,077,597 193,234,152,289Due from Related Parties 662,399,000 -- -- 662,399,000Other Current Financial Assets 8,072,306,481 -- -- 8,072,306,481
Total 246,237,230,879 114,153,507,973 10,286,077,597 370,676,816,449
December 31, 2012
Will Due On
Not Determined Less Than 1 Year More Than 1 Year Total
Rp Rp Rp Rp
Cash and Cash Equivalent 156,371,665,579 -- -- 156,371,665,579Trade Receivables 82,084,837,882 141,341,594,332 16,564,120,793 239,990,553,007Due from Related Parties 662,397,000 -- -- 662,397,000Other Current Financial Assets 11,215,121,909 -- -- 11,215,121,909
Total 250,334,022,370 141,341,594,332 16,564,120,793 408,239,737,495
April 30, 2013
Will Due On
There is no guarantee of customer receivables which has overdue. The Company has recorded provision for impairment of trade receivables which has overdue accounts (see Note 5).
(ii) Foreign Currency Risk Currency exchange rate risk is the risk that the fair value or future cash flows of a financial instrument will
fluctuate because of changes in foreign currency exchange rates. The Group's financial instruments
that potentially exchange rate risk consist primarily of cash and cash equivalent.
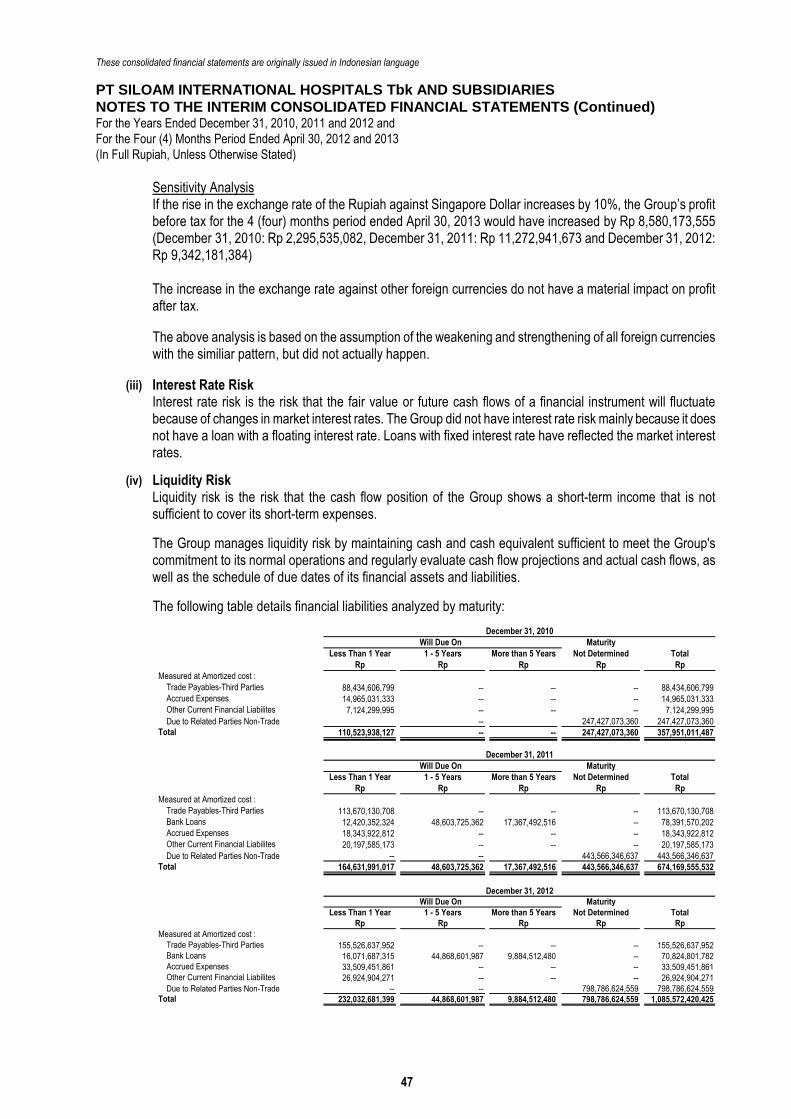
These consolidated financial statements are originally issued in Indonesian language
PT SILOAM INTERNATIONAL HOSPITALS Tbk AND SUBSIDIARIES
NOTES TO THE INTERIM CONSOLIDATED FINANCIAL STATEMENTS (Continued) For the Years Ended December 31, 2010, 2011 and 2012 and
For the Four (4) Months Period Ended April 30, 2012 and 2013
(In Full Rupiah, Unless Otherwise Stated)
Draft/July 26, 2013 47 paraf:
Sensitivity Analysis If the rise in the exchange rate of the Rupiah against Singapore Dollar increases by 10%, the Group’s profit before tax for the 4 (four) months period ended April 30, 2013 would have increased by Rp 8,580,173,555 (December 31, 2010: Rp 2,295,535,082, December 31, 2011: Rp 11,272,941,673 and December 31, 2012: Rp 9,342,181,384) The increase in the exchange rate against other foreign currencies do not have a material impact on profit after tax.
The above analysis is based on the assumption of the weakening and strengthening of all foreign currencies with the similiar pattern, but did not actually happen.
(iii) Interest Rate Risk Interest rate risk is the risk that the fair value or future cash flows of a financial instrument will fluctuate because of changes in market interest rates. The Group did not have interest rate risk mainly because it does not have a loan with a floating interest rate. Loans with fixed interest rate have reflected the market interest rates.
(iv) Liquidity Risk Liquidity risk is the risk that the cash flow position of the Group shows a short-term income that is not sufficient to cover its short-term expenses.
The Group manages liquidity risk by maintaining cash and cash equivalent sufficient to meet the Group's commitment to its normal operations and regularly evaluate cash flow projections and actual cash flows, as well as the schedule of due dates of its financial assets and liabilities.
The following table details financial liabilities analyzed by maturity:
Maturity
Less Than 1 Year 1 - 5 Years More than 5 Years Not Determined Total
Rp Rp Rp Rp Rp
Measured at Amortized cost :
Utang Usaha - pihak ketigaTrade Payables-Third Parties 88,434,606,799 -- -- -- 88,434,606,799Beban AkrualAccrued Expenses 14,965,031,333 -- -- -- 14,965,031,333Liabilitas Keuangan Jangka Pendek LainnyaOther Current Financial Liabilites 7,124,299,995 -- -- -- 7,124,299,995Utang Pihak Berelasi Non-usahaDue to Related Parties Non-Trade -- 247,427,073,360 247,427,073,360
Total 110,523,938,127 -- -- 247,427,073,360 357,951,011,487
December 31, 2010
Will Due On
Maturity
Less Than 1 Year 1 - 5 Years More than 5 Years Not Determined Total
Rp Rp Rp Rp Rp
Measured at Amortized cost :
Utang Usaha - pihak ketigaTrade Payables-Third Parties 113,670,130,708 -- -- -- 113,670,130,708Utang BankBank Loans 12,420,352,324 48,603,725,362 17,367,492,516 -- 78,391,570,202Beban AkrualAccrued Expenses 18,343,922,812 -- -- -- 18,343,922,812Liabilitas Keuangan Jangka Pendek LainnyaOther Current Financial Liabilites 20,197,585,173 -- -- -- 20,197,585,173Utang Pihak Berelasi Non-usahaDue to Related Parties Non-Trade -- -- 443,566,346,637 443,566,346,637
Total 164,631,991,017 48,603,725,362 17,367,492,516 443,566,346,637 674,169,555,532
December 31, 2011
Will Due On
Maturity
Less Than 1 Year 1 - 5 Years More than 5 Years Not Determined Total
Rp Rp Rp Rp Rp
Measured at Amortized cost :
Utang Usaha - pihak ketigaTrade Payables-Third Parties 155,526,637,952 -- -- -- 155,526,637,952Utang BankBank Loans 16,071,687,315 44,868,601,987 9,884,512,480 -- 70,824,801,782Beban AkrualAccrued Expenses 33,509,451,861 -- -- -- 33,509,451,861Liabilitas Keuangan Jangka Pendek LainnyaOther Current Financial Liabilites 26,924,904,271 -- -- -- 26,924,904,271Utang Pihak Berelasi Non-usahaDue to Related Parties Non-Trade -- -- 798,786,624,559 798,786,624,559
Total 232,032,681,399 44,868,601,987 9,884,512,480 798,786,624,559 1,085,572,420,425
Will Due On
December 31, 2012
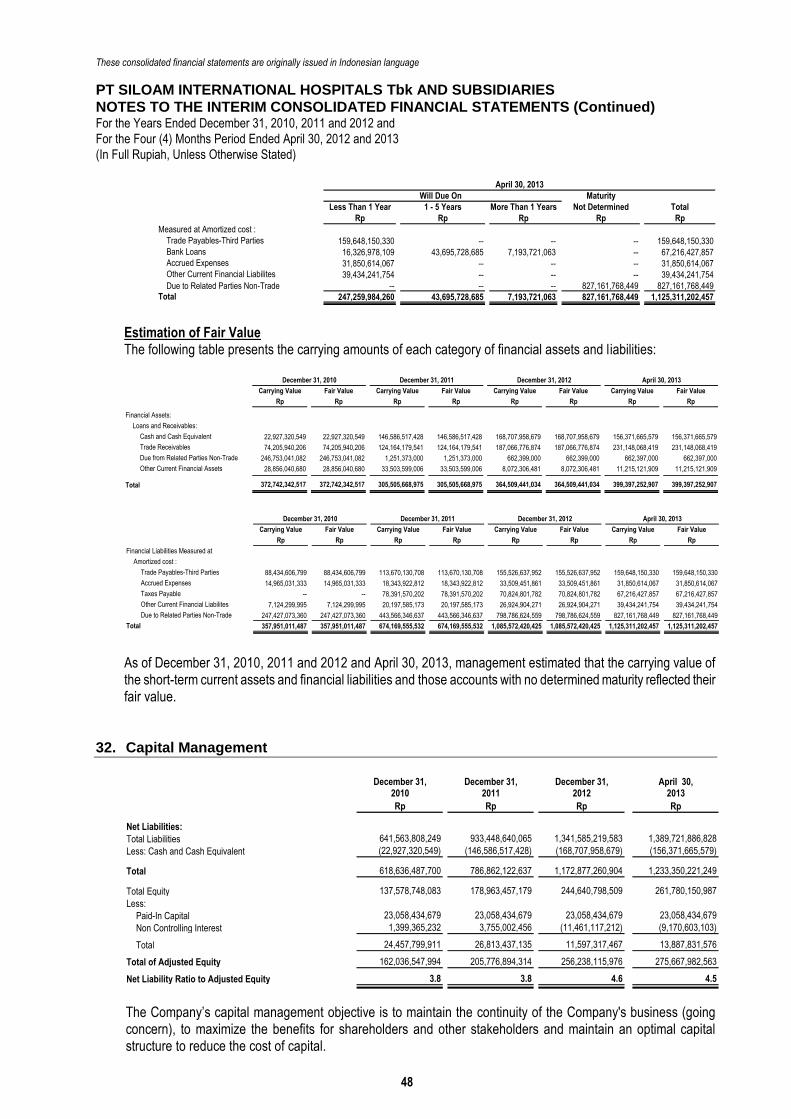
These consolidated financial statements are originally issued in Indonesian language
PT SILOAM INTERNATIONAL HOSPITALS Tbk AND SUBSIDIARIES
NOTES TO THE INTERIM CONSOLIDATED FINANCIAL STATEMENTS (Continued) For the Years Ended December 31, 2010, 2011 and 2012 and
For the Four (4) Months Period Ended April 30, 2012 and 2013
(In Full Rupiah, Unless Otherwise Stated)
Draft/July 26, 2013 48 paraf:
Maturity
Less Than 1 Year 1 - 5 Years More Than 1 Years Not Determined Total
Rp Rp Rp Rp Rp
Measured at Amortized cost :
Trade Payables-Third Parties 159,648,150,330 -- -- -- 159,648,150,330Utang BankBank Loans 16,326,978,109 43,695,728,685 7,193,721,063 -- 67,216,427,857Beban AkrualAccrued Expenses 31,850,614,067 -- -- -- 31,850,614,067Liabilitas Keuangan Jangka Pendek LainnyaOther Current Financial Liabilites 39,434,241,754 -- -- -- 39,434,241,754Utang Pihak Berelasi Non-usahaDue to Related Parties Non-Trade -- -- -- 827,161,768,449 827,161,768,449
Total 247,259,984,260 43,695,728,685 7,193,721,063 827,161,768,449 1,125,311,202,457
April 30, 2013
Will Due On
Estimation of Fair Value The following table presents the carrying amounts of each category of financial assets and liabilities:
Carrying Value Fair Value Carrying Value Fair Value Carrying Value Fair Value Carrying Value Fair Value
Rp Rp Rp Rp Rp Rp Rp Rp
Financial Assets:
Loans and Receivables:
Cash and Cash Equivalent 22,927,320,549 22,927,320,549 146,586,517,428 146,586,517,428 168,707,958,679 168,707,958,679 156,371,665,579 156,371,665,579
Trade Receivables 74,205,940,206 74,205,940,206 124,164,179,541 124,164,179,541 187,066,776,874 187,066,776,874 231,148,068,419 231,148,068,419
Due from Related Parties Non-Trade 246,753,041,082 246,753,041,082 1,251,373,000 1,251,373,000 662,399,000 662,399,000 662,397,000 662,397,000
Other Current Financial Assets 28,856,040,680 28,856,040,680 33,503,599,006 33,503,599,006 8,072,306,481 8,072,306,481 11,215,121,909 11,215,121,909Deposito
Total 372,742,342,517 372,742,342,517 305,505,668,975 305,505,668,975 364,509,441,034 364,509,441,034 399,397,252,907 399,397,252,907
December 31, 2010 December 31, 2012December 31, 2011 April 30, 2013
Carrying Value Fair Value Carrying Value Fair Value Carrying Value Fair Value Carrying Value Fair Value
Rp Rp Rp Rp Rp Rp Rp Rp
Financial Liabilities Measured at
Amortized cost :
Trade Payables-Third Parties 88,434,606,799 88,434,606,799 113,670,130,708 113,670,130,708 155,526,637,952 155,526,637,952 159,648,150,330 159,648,150,330
Accrued Expenses 14,965,031,333 14,965,031,333 18,343,922,812 18,343,922,812 33,509,451,861 33,509,451,861 31,850,614,067 31,850,614,067
Taxes Payable -- -- 78,391,570,202 78,391,570,202 70,824,801,782 70,824,801,782 67,216,427,857 67,216,427,857
Other Current Financial Liabilites 7,124,299,995 7,124,299,995 20,197,585,173 20,197,585,173 26,924,904,271 26,924,904,271 39,434,241,754 39,434,241,754
Due to Related Parties Non-Trade 247,427,073,360 247,427,073,360 443,566,346,637 443,566,346,637 798,786,624,559 798,786,624,559 827,161,768,449 827,161,768,449
Total 357,951,011,487 357,951,011,487 674,169,555,532 674,169,555,532 1,085,572,420,425 1,085,572,420,425 1,125,311,202,457 1,125,311,202,457
December 31, 2010 December 31, 2012December 31, 2011 April 30, 2013
As of December 31, 2010, 2011 and 2012 and April 30, 2013, management estimated that the carrying value of the short-term current assets and financial liabilities and those accounts with no determined maturity reflected their fair value.
32. Capital Management
December 31, December 31, December 31, April 30,
2010 2011 2012 2013
Rp Rp Rp Rp
Net Liabilities:
Total Liabilities 641,563,808,249 933,448,640,065 1,341,585,219,583 1,389,721,886,828
Less: Cash and Cash Equivalent (22,927,320,549) (146,586,517,428) (168,707,958,679) (156,371,665,579)
Total 618,636,487,700 786,862,122,637 1,172,877,260,904 1,233,350,221,249
Total Equity 137,578,748,083 178,963,457,179 244,640,798,509 261,780,150,987
Less:
Paid-In Capital 23,058,434,679 23,058,434,679 23,058,434,679 23,058,434,679
Non Controlling Interest 1,399,365,232 3,755,002,456 (11,461,117,212) (9,170,603,103)
Total 24,457,799,911 26,813,437,135 11,597,317,467 13,887,831,576
Total of Adjusted Equity 162,036,547,994 205,776,894,314 256,238,115,976 275,667,982,563
Net Liability Ratio to Adjusted Equity 3.8 3.8 4.6 4.5
The Company’s capital management objective is to maintain the continuity of the Company's business (going concern), to maximize the benefits for shareholders and other stakeholders and maintain an optimal capital structure to reduce the cost of capital.
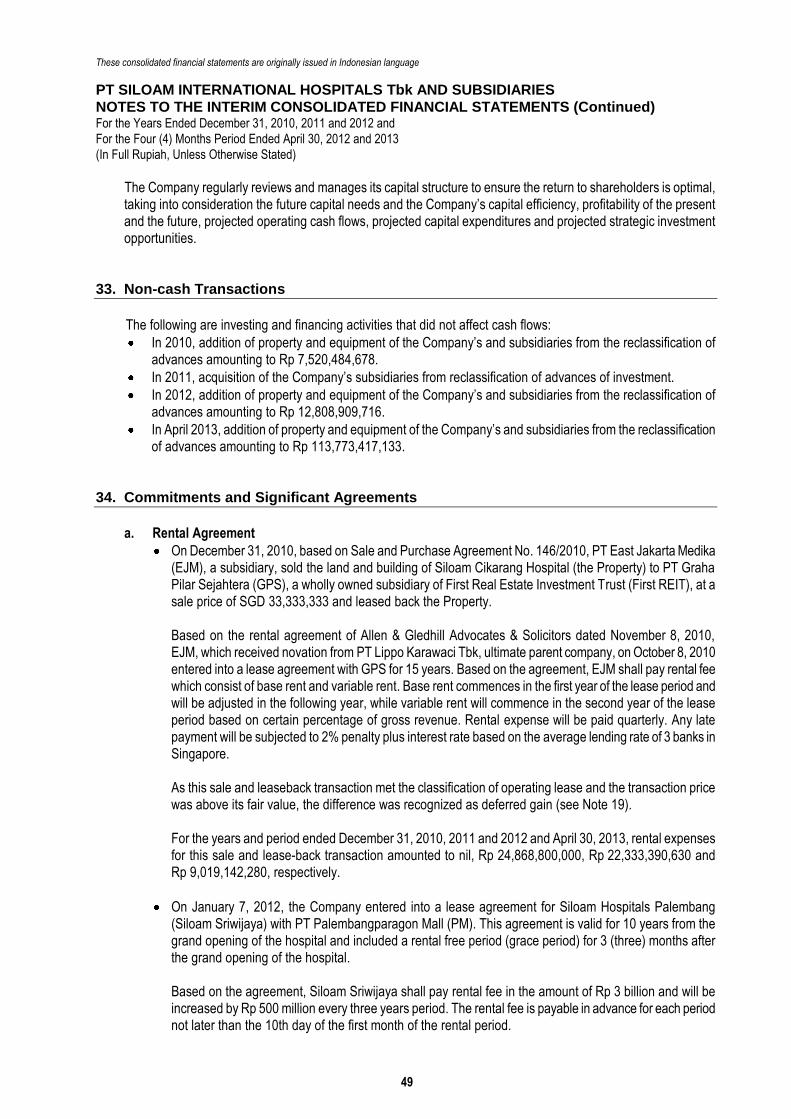
These consolidated financial statements are originally issued in Indonesian language
PT SILOAM INTERNATIONAL HOSPITALS Tbk AND SUBSIDIARIES
NOTES TO THE INTERIM CONSOLIDATED FINANCIAL STATEMENTS (Continued) For the Years Ended December 31, 2010, 2011 and 2012 and
For the Four (4) Months Period Ended April 30, 2012 and 2013
(In Full Rupiah, Unless Otherwise Stated)
Draft/July 26, 2013 49 paraf:
The Company regularly reviews and manages its capital structure to ensure the return to shareholders is optimal, taking into consideration the future capital needs and the Company’s capital efficiency, profitability of the present and the future, projected operating cash flows, projected capital expenditures and projected strategic investment opportunities.
33. Non-cash Transactions
The following are investing and financing activities that did not affect cash flows:
In 2010, addition of property and equipment of the Company’s and subsidiaries from the reclassification of advances amounting to Rp 7,520,484,678.
In 2011, acquisition of the Company’s subsidiaries from reclassification of advances of investment.
In 2012, addition of property and equipment of the Company’s and subsidiaries from the reclassification of advances amounting to Rp 12,808,909,716.
In April 2013, addition of property and equipment of the Company’s and subsidiaries from the reclassification of advances amounting to Rp 113,773,417,133.
34. Commitments and Significant Agreements
a. Rental Agreement
On December 31, 2010, based on Sale and Purchase Agreement No. 146/2010, PT East Jakarta Medika (EJM), a subsidiary, sold the land and building of Siloam Cikarang Hospital (the Property) to PT Graha Pilar Sejahtera (GPS), a wholly owned subsidiary of First Real Estate Investment Trust (First REIT), at a sale price of SGD 33,333,333 and leased back the Property.
Based on the rental agreement of Allen & Gledhill Advocates & Solicitors dated November 8, 2010, EJM, which received novation from PT Lippo Karawaci Tbk, ultimate parent company, on October 8, 2010 entered into a lease agreement with GPS for 15 years. Based on the agreement, EJM shall pay rental fee which consist of base rent and variable rent. Base rent commences in the first year of the lease period and will be adjusted in the following year, while variable rent will commence in the second year of the lease period based on certain percentage of gross revenue. Rental expense will be paid quarterly. Any late payment will be subjected to 2% penalty plus interest rate based on the average lending rate of 3 banks in Singapore. As this sale and leaseback transaction met the classification of operating lease and the transaction price was above its fair value, the difference was recognized as deferred gain (see Note 19).
For the years and period ended December 31, 2010, 2011 and 2012 and April 30, 2013, rental expenses for this sale and lease-back transaction amounted to nil, Rp 24,868,800,000, Rp 22,333,390,630 and Rp 9,019,142,280, respectively.
On January 7, 2012, the Company entered into a lease agreement for Siloam Hospitals Palembang (Siloam Sriwijaya) with PT Palembangparagon Mall (PM). This agreement is valid for 10 years from the grand opening of the hospital and included a rental free period (grace period) for 3 (three) months after the grand opening of the hospital. Based on the agreement, Siloam Sriwijaya shall pay rental fee in the amount of Rp 3 billion and will be increased by Rp 500 million every three years period. The rental fee is payable in advance for each period not later than the 10th day of the first month of the rental period.

These consolidated financial statements are originally issued in Indonesian language
PT SILOAM INTERNATIONAL HOSPITALS Tbk AND SUBSIDIARIES
NOTES TO THE INTERIM CONSOLIDATED FINANCIAL STATEMENTS (Continued) For the Years Ended December 31, 2010, 2011 and 2012 and
For the Four (4) Months Period Ended April 30, 2012 and 2013
(In Full Rupiah, Unless Otherwise Stated)
Draft/July 26, 2013 50 paraf:
On October 5, 2012, PM entered into transfer of property ownership agreement with PT Bisma Pratama Karya, thus, Siloam Sriwijaya receive novation of lease ownership. This agreement did not change the terms of the original lease agreement. For the 4 (four) months period ended 30 April 2013, no rental expenses were paid.
b. Software licences, Supply & Support Agreement On April 24, 2012, the Company (as Licensee) entered into the Software License, Supply & Support Agreement with PT Solusi Informasi (as Licensor). The parties have agreed that the Licensor wishes to supply a permanent non-exlusive and non-transferable licence of the software MedicOS Centric Enterprise (MCE) and MedicOS Radiag (RIS/PACS) to the Licensee and provide installation, testing, training, release and support services for the software for unlimited use at all hospitals the Licensee owns. The Licensee shall pay certain fee for license fee, one-time software implementation fee, annual software supports fee and other related services.
c. Sub-Lease Agreement between the Company and PT Lippo Karawaci Tbk (LK) On April 30, 2013, the Company entered into a sub-lease agreement with LK, ultimate parent entity of the Company, covering property of Siloam Hospitals Lippo Village, Siloam Hospitals Kebon Jeruk, Siloam Hospitals Surabaya, Siloam Hospitals Semanggi MRCCC, Siloam Hospitals Manado and Siloam Hospitals Makassar.
d. Master Agreement between the Company with PT Lippo Karawaci Tbk (LK) On April 30, 2013, the Company entered into a preliminary agreements with LK, ultimate parent entity of the Company, which include:
Property lease agreement of Rumah Sakit Umum Siloam and Siloam Hospitals Bali and the properties to be used as Siloam Hospitals Kemang and Siloam Hospitals St. Moritz;
The right to build properties that will be used as Siloam Hospitals Yogyakarta, Siloam Hospitals Bintaro and Siloam Hospitals Surabaya Manyar;
The agreement to offer certain property to be operated as Siloam Hospitals Pontianak; and
Co-operation agreement Siloam Hospitals Bandung.
e. Master Agreement between the Company with PT Metropolis Propertindo Utama (MPU) On April 30, 2013, the Company entered into a preliminary agreements with MPU which include:
Sale and purchase of shares of Siloam Hospitals Malang, Siloam Hospitals Salemba, Siloam Hospitals Palembang, Siloam Hospitals Medan and Siloam Hospitals Surabaya Sea Master;
Right to build properties that will be used as Siloam Hospitals Padang, Siloam Hospitals Bangka Belitung, Siloam Hospitals Semarang Srondol, Siloam Hospitals Bogor Internusa, Siloam Hospitals Jember, Siloam Hospitals Bluemall Bekasi, Siloam Hospitals Bekasi Grand Mall, Siloam Hospitals MT Haryono, Siloam Hospitals Salemba, Siloam Hospitals Lampung and Siloam Hospitals Kupang;
The right to operate and manage Siloam Hospitals Medan and Siloam Hospitals Kupang;
Property lease agreement of Siloam Hospitals Surabaya Sea Master, Siloam Hospitals Pluit and Siloam Hospitals Cempaka Putih; and
The agreement to offer certain property to be operated as Siloam Hospitals TB Simatupang, Siloam Hospitals Purwakarta, Siloam Hospitals Ambon, Siloam Hospitals Lubuk Linggau, Siloam Hospitals Manado Kairagi, Siloam Hospitals Serang and Siloam Hospitals Pekanbaru.
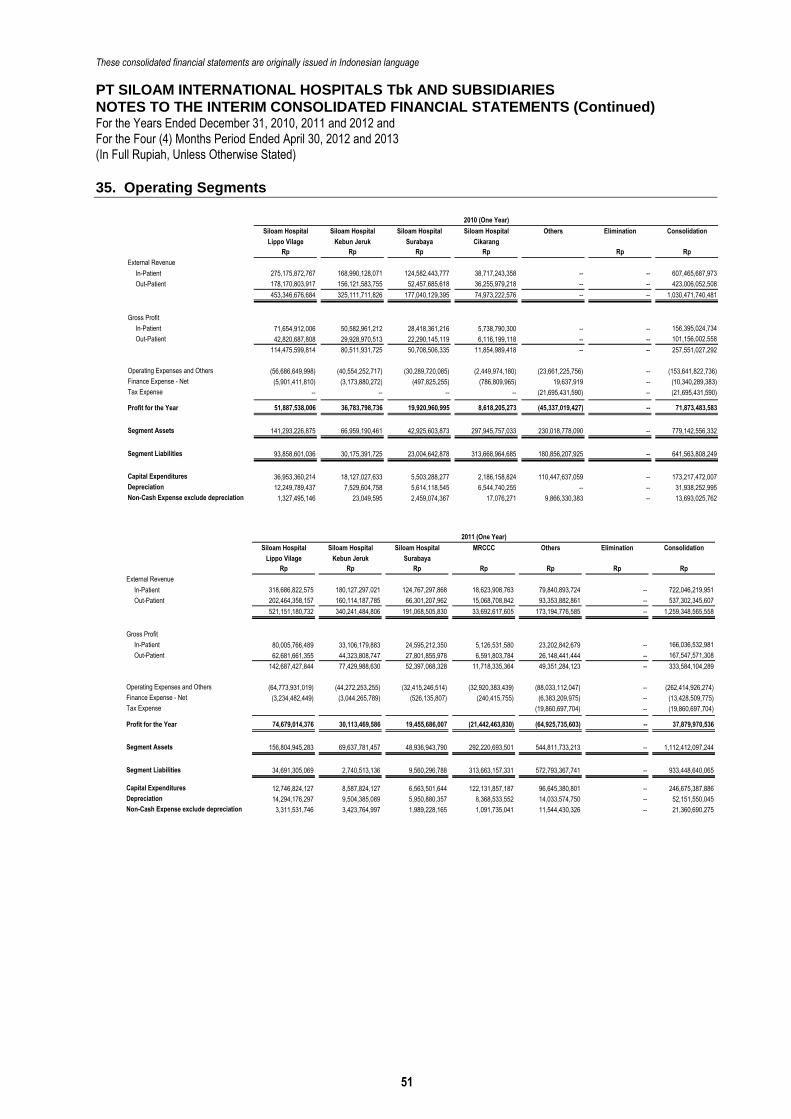
These consolidated financial statements are originally issued in Indonesian language
PT SILOAM INTERNATIONAL HOSPITALS Tbk AND SUBSIDIARIES
NOTES TO THE INTERIM CONSOLIDATED FINANCIAL STATEMENTS (Continued) For the Years Ended December 31, 2010, 2011 and 2012 and
For the Four (4) Months Period Ended April 30, 2012 and 2013
(In Full Rupiah, Unless Otherwise Stated)
Draft/July 26, 2013 51 paraf:
35. Operating Segments
Siloam Hospital Siloam Hospital Siloam Hospital Siloam Hospital Others Elimination Consolidation
Lippo Vilage Kebun Jeruk Surabaya Cikarang
Rp Rp Rp Rp Rp Rp
External Revenue
In-Patient 275,175,872,767 168,990,128,071 124,582,443,777 38,717,243,358 -- -- 607,465,687,973
Out-Patient 178,170,803,917 156,121,583,755 52,457,685,618 36,255,979,218 -- -- 423,006,052,508
453,346,676,684 325,111,711,826 177,040,129,395 74,973,222,576 -- -- 1,030,471,740,481
Gross Profit
In-Patient 71,654,912,006 50,582,961,212 28,418,361,216 5,738,790,300 -- -- 156,395,024,734
Out-Patient 42,820,687,808 29,928,970,513 22,290,145,119 6,116,199,118 -- -- 101,156,002,558
114,475,599,814 80,511,931,725 50,708,506,335 11,854,989,418 -- -- 257,551,027,292
Operating Expenses and Others (56,686,649,998) (40,554,252,717) (30,289,720,085) (2,449,974,180) (23,661,225,756) -- (153,641,822,736)
Finance Expense - Net (5,901,411,810) (3,173,880,272) (497,825,255) (786,809,965) 19,637,919 -- (10,340,289,383)
Tax Expense -- -- -- -- (21,695,431,590) -- (21,695,431,590)
Profit for the Year 51,887,538,006 36,783,798,736 19,920,960,995 8,618,205,273 (45,337,019,427) -- 71,873,483,583
Segment Assets 141,293,226,875 66,959,190,461 42,925,603,873 297,945,757,033 230,018,778,090 -- 779,142,556,332
Segment Liabilities 93,858,601,036 30,175,391,725 23,004,642,878 313,668,964,685 180,856,207,925 -- 641,563,808,249
Capital Expenditures 36,953,360,214 18,127,027,633 5,503,288,277 2,186,158,824 110,447,637,059 -- 173,217,472,007
Depreciation 12,249,789,437 7,529,604,758 5,614,118,545 6,544,740,255 -- -- 31,938,252,995
Non-Cash Expense exclude depreciation 1,327,495,146 23,049,595 2,459,074,367 17,076,271 9,866,330,383 -- 13,693,025,762
2010 (One Year)
Siloam Hospital Siloam Hospital Siloam Hospital MRCCC Others Elimination Consolidation
Lippo Vilage Kebun Jeruk Surabaya
Rp Rp Rp Rp Rp Rp Rp
External Revenue
In-Patient 318,686,822,575 180,127,297,021 124,767,297,868 18,623,908,763 79,840,893,724 -- 722,046,219,951
Out-Patient 202,464,358,157 160,114,187,785 66,301,207,962 15,068,708,842 93,353,882,861 -- 537,302,345,607
521,151,180,732 340,241,484,806 191,068,505,830 33,692,617,605 173,194,776,585 -- 1,259,348,565,558
Gross Profit
In-Patient 80,005,766,489 33,106,179,883 24,595,212,350 5,126,531,580 23,202,842,679 -- 166,036,532,981
Out-Patient 62,681,661,355 44,323,808,747 27,801,855,978 6,591,803,784 26,148,441,444 -- 167,547,571,308
142,687,427,844 77,429,988,630 52,397,068,328 11,718,335,364 49,351,284,123 -- 333,584,104,289
Operating Expenses and Others (64,773,931,019) (44,272,253,255) (32,415,246,514) (32,920,383,439) (88,033,112,047) -- (262,414,926,274)
Finance Expense - Net (3,234,482,449) (3,044,265,789) (526,135,807) (240,415,755) (6,383,209,975) -- (13,428,509,775)
Tax Expense (19,860,697,704) -- (19,860,697,704)
Profit for the Year 74,679,014,376 30,113,469,586 19,455,686,007 (21,442,463,830) (64,925,735,603) -- 37,879,970,536
Segment Assets 156,804,945,283 69,637,781,457 48,936,943,790 292,220,693,501 544,811,733,213 -- 1,112,412,097,244
Segment Liabilities 34,691,305,069 2,740,513,136 9,560,296,788 313,663,157,331 572,793,367,741 -- 933,448,640,065
Capital Expenditures 12,746,824,127 8,587,824,127 6,563,501,644 122,131,857,187 96,645,380,801 -- 246,675,387,886
Depreciation 14,294,176,297 9,504,385,089 5,950,880,357 8,368,533,552 14,033,574,750 -- 52,151,550,045
Non-Cash Expense exclude depreciation 3,311,531,746 3,423,764,997 1,989,228,165 1,091,735,041 11,544,430,326 -- 21,360,690,275
2011 (One Year)
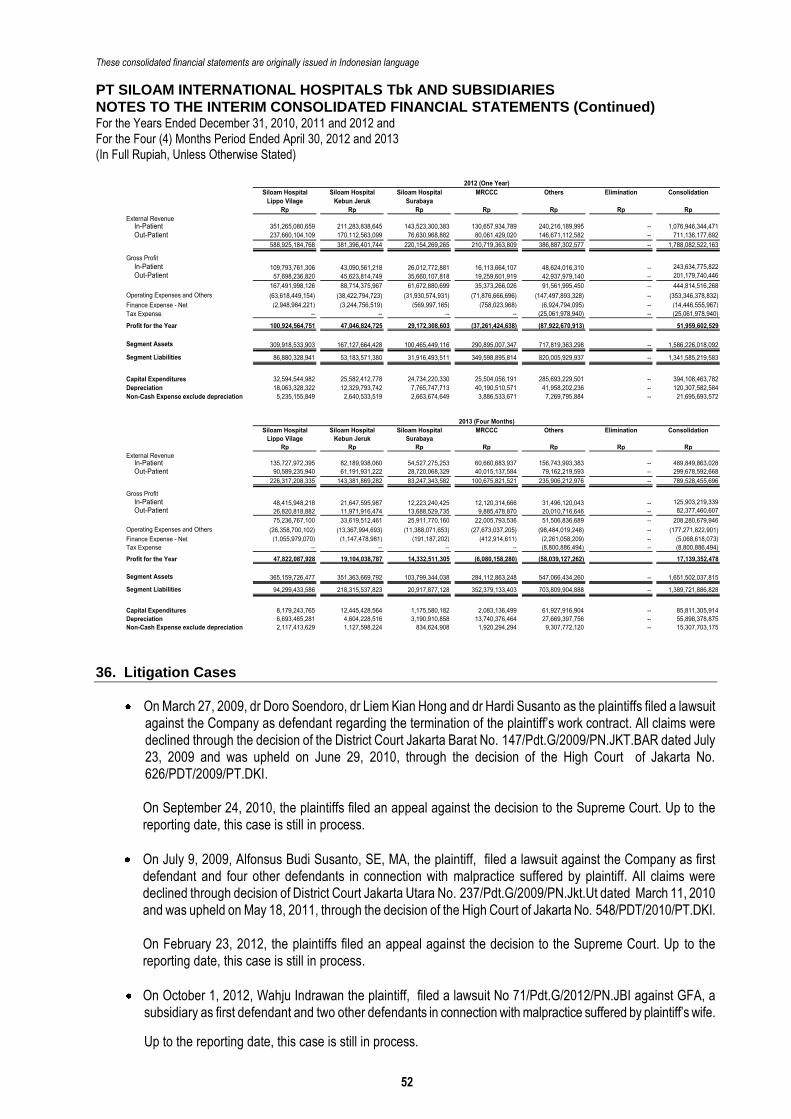
These consolidated financial statements are originally issued in Indonesian language
PT SILOAM INTERNATIONAL HOSPITALS Tbk AND SUBSIDIARIES
NOTES TO THE INTERIM CONSOLIDATED FINANCIAL STATEMENTS (Continued) For the Years Ended December 31, 2010, 2011 and 2012 and
For the Four (4) Months Period Ended April 30, 2012 and 2013
(In Full Rupiah, Unless Otherwise Stated)
Draft/July 26, 2013 52 paraf:
Siloam Hospital Siloam Hospital Siloam Hospital MRCCC Others Elimination Consolidation
Lippo Vilage Kebun Jeruk Surabaya
Rp Rp Rp Rp Rp Rp Rp
External RevenueIn-Patient 351,265,080,659 211,283,838,645 143,523,300,383 130,657,934,789 240,216,189,995 -- 1,076,946,344,471
Out-Patient 237,660,104,109 170,112,563,099 76,630,968,882 80,061,429,020 146,671,112,582 -- 711,136,177,692
588,925,184,768 381,396,401,744 220,154,269,265 210,719,363,809 386,887,302,577 -- 1,788,082,522,163
Gross Profit
In-Patient 109,793,761,306 43,090,561,218 26,012,772,881 16,113,664,107 48,624,016,310 -- 243,634,775,822
Out-Patient 57,698,236,820 45,623,814,749 35,660,107,818 19,259,601,919 42,937,979,140 -- 201,179,740,446
167,491,998,126 88,714,375,967 61,672,880,699 35,373,266,026 91,561,995,450 -- 444,814,516,268
Operating Expenses and Others (63,618,449,154) (38,422,794,723) (31,930,574,931) (71,876,666,696) (147,497,893,328) -- (353,346,378,832)
Finance Expense - Net (2,948,984,221) (3,244,756,519) (569,997,165) (758,023,968) (6,924,794,095) -- (14,446,555,967)
Tax Expense -- -- -- -- (25,061,978,940) -- (25,061,978,940)
Profit for the Year 100,924,564,751 47,046,824,725 29,172,308,603 (37,261,424,638) (87,922,670,913) 51,959,602,529
Segment Assets 309,918,533,903 167,127,664,428 100,465,449,116 290,895,007,347 717,819,363,298 -- 1,586,226,018,092
Segment Liabilities 86,880,328,941 53,183,571,380 31,916,493,511 349,598,895,814 820,005,929,937 -- 1,341,585,219,583
Capital Expenditures 32,594,544,982 25,582,412,778 24,734,220,330 25,504,056,191 285,693,229,501 -- 394,108,463,782
Depreciation 18,063,328,322 12,329,793,742 7,765,747,713 40,190,510,571 41,958,202,236 -- 120,307,582,584
Non-Cash Expense exclude depreciation 5,235,155,849 2,640,533,519 2,663,674,649 3,886,533,671 7,269,795,884 -- 21,695,693,572
2012 (One Year)
Siloam Hospital Siloam Hospital Siloam Hospital MRCCC Others Elimination Consolidation
Lippo Vilage Kebun Jeruk Surabaya
Rp Rp Rp Rp Rp Rp Rp
External RevenueIn-Patient 135,727,972,395 82,189,938,060 54,527,275,253 60,660,683,937 156,743,993,383 -- 489,849,863,028
Out-Patient 90,589,235,940 61,191,931,222 28,720,068,329 40,015,137,584 79,162,219,593 -- 299,678,592,668
226,317,208,335 143,381,869,282 83,247,343,582 100,675,821,521 235,906,212,976 -- 789,528,455,696
Gross Profit
In-Patient 48,415,948,218 21,647,595,987 12,223,240,425 12,120,314,666 31,496,120,043 -- 125,903,219,339
Out-Patient 26,820,818,882 11,971,916,474 13,688,529,735 9,885,478,870 20,010,716,646 -- 82,377,460,607
75,236,767,100 33,619,512,461 25,911,770,160 22,005,793,536 51,506,836,689 -- 208,280,679,946
Operating Expenses and Others (26,358,700,102) (13,367,994,693) (11,388,071,653) (27,673,037,205) (98,484,019,248) -- (177,271,822,901)
Finance Expense - Net (1,055,979,070) (1,147,478,981) (191,187,202) (412,914,611) (2,261,058,209) -- (5,068,618,073)
Tax Expense -- -- -- -- (8,800,886,494) -- (8,800,886,494)
Profit for the Year 47,822,087,928 19,104,038,787 14,332,511,305 (6,080,158,280) (58,039,127,262) 17,139,352,478
Segment Assets 365,159,726,477 351,363,669,792 103,799,344,038 284,112,863,248 547,066,434,260 -- 1,651,502,037,815
Segment Liabilities 94,299,433,586 218,315,537,823 20,917,877,128 352,379,133,403 703,809,904,888 -- 1,389,721,886,828
Capital Expenditures 8,179,243,765 12,445,428,564 1,175,580,182 2,083,136,499 61,927,916,904 -- 85,811,305,914
Depreciation 6,693,465,281 4,604,228,516 3,190,910,858 13,740,376,464 27,669,397,756 -- 55,898,378,875
Non-Cash Expense exclude depreciation 2,117,413,629 1,127,598,224 834,624,908 1,920,294,294 9,307,772,120 -- 15,307,703,175
2013 (Four Months)
36. Litigation Cases
On March 27, 2009, dr Doro Soendoro, dr Liem Kian Hong and dr Hardi Susanto as the plaintiffs filed a lawsuit against the Company as defendant regarding the termination of the plaintiff’s work contract. All claims were declined through the decision of the District Court Jakarta Barat No. 147/Pdt.G/2009/PN.JKT.BAR dated July 23, 2009 and was upheld on June 29, 2010, through the decision of the High Court of Jakarta No. 626/PDT/2009/PT.DKI. On September 24, 2010, the plaintiffs filed an appeal against the decision to the Supreme Court. Up to the reporting date, this case is still in process.
On July 9, 2009, Alfonsus Budi Susanto, SE, MA, the plaintiff, filed a lawsuit against the Company as first defendant and four other defendants in connection with malpractice suffered by plaintiff. All claims were declined through decision of District Court Jakarta Utara No. 237/Pdt.G/2009/PN.Jkt.Ut dated March 11, 2010 and was upheld on May 18, 2011, through the decision of the High Court of Jakarta No. 548/PDT/2010/PT.DKI.
On February 23, 2012, the plaintiffs filed an appeal against the decision to the Supreme Court. Up to the reporting date, this case is still in process.
On October 1, 2012, Wahju Indrawan the plaintiff, filed a lawsuit No 71/Pdt.G/2012/PN.JBI against GFA, a subsidiary as first defendant and two other defendants in connection with malpractice suffered by plaintiff’s wife.
Up to the reporting date, this case is still in process.
These consolidated financial statements are originally issued in Indonesian language
PT SILOAM INTERNATIONAL HOSPITALS Tbk AND SUBSIDIARIES
NOTES TO THE INTERIM CONSOLIDATED FINANCIAL STATEMENTS (Continued) For the Years Ended December 31, 2010, 2011 and 2012 and
For the Four (4) Months Period Ended April 30, 2012 and 2013
(In Full Rupiah, Unless Otherwise Stated)
Draft/July 26, 2013 53 paraf:
37. Events After Reporting Date
Based on Notarial Deed No. 05 dated June 4, 2013, made in presence of Ir. Nanette Handari Adi Warsito, S.H., notary in Jakarta, it was agreed to increase the issued 115,000,000 shares to 190,500,000 shares.
On June 21, 2013, the Company submit Registration Statement in relation to the Company’s Initial Public Offering to Otoritas Jasa Keuangan.
On July 1, 2013, the Company enter into agreement to acquire the medical equipment owned by PT Elektra Setya Ekatama (ESE) in the amount of Rp 170 billion (excluding VAT). The amount will be paid to ESE in 4 installments.
On July 1, 2013, the Company entered into a sub-lease agreement with PT Lippo Karawaci Tbk, ultimate parent company, related to sub-lease property of Siloam Hospitals TB Simatupang.
38. Reissuance of the Consolidated Financial Statements
For the purpose of the Initial Public Offering and a review of the Registration Statement from the Indonesian Financial Services Authority, the Company has reissued the consolidated financial statements for the years ended December 31, 2010, 2011 and 2012 and for the four (4) months period ended April 30, 2013 with additional presentation and disclosures in Notes 1, 3, 4, 5, 6, 7, 9, 10, 12, 13, 14, 16, 18, 28, 31,33, 34, 37 and 38 to the previous consolidated financial statements and supplemental information of the separate financial statements of the Parent Entity.
39. Responsibility and Issuance of the Consolidated Financial Statements
The management of the Company is responsible for the preparation and presentation of the consolidated financial statements. The consolidated financial statements were authorized for issuance by Directors on July 8, 2013.
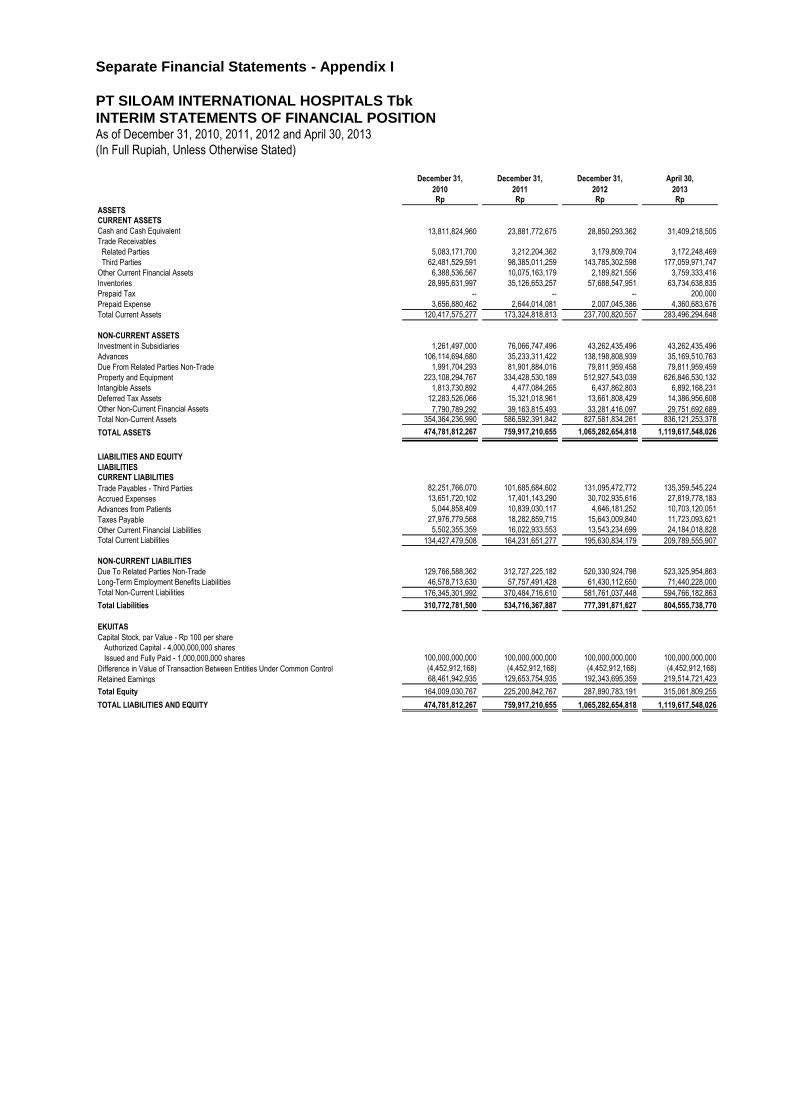
Catatan terlampir merupakan bagian yang tidak terpisahkan dari
laporan keuangan konsolidasian secara keseluruhan
Final Draft/10 June 2013 1 paraf:
Separate Financial Statements - Appendix I
PT SILOAM INTERNATIONAL HOSPITALS Tbk
INTERIM STATEMENTS OF FINANCIAL POSITION As of December 31, 2010, 2011, 2012 and April 30, 2013
(In Full Rupiah, Unless Otherwise Stated)
Catatan December 31, December 31, December 31, April 30,
2010 2011 2012 2013Rp Rp Rp Rp
ASSETS
CURRENT ASSETS
Cash and Cash Equivalent 3.c, 3.d, 3.e, 3.p, 4, 11, 27, 28 13,811,824,960 23,881,772,675 28,850,293,362 31,409,218,505 Trade Receivables 3.p, 5, 28
Related Parties 3.e, 11 5,083,171,700 3,212,204,362 3,179,809,704 3,172,248,469
Third Parties 62,481,529,591 98,385,011,259 143,785,302,598 177,059,971,747
Other Current Financial Assets 3.p, 6, 30, 28 6,388,536,567 10,075,163,179 2,189,821,556 3,759,333,416
Inventories 3.f, 7 28,995,631,997 35,126,653,257 57,688,547,951 63,734,638,835
Prepaid Tax 3.o -- -- -- 200,000
Prepaid Expense 3.g, 8 3,656,880,462 2,644,014,081 2,007,045,386 4,360,683,676
Total Current Assets 120,417,575,277 173,324,818,813 237,700,820,557 283,496,294,648
NON-CURRENT ASSETS
Investment in Subsidiaries 3.p, 9 1,261,497,000 76,066,747,496 43,262,435,496 43,262,435,496
Advances 10 106,114,694,680 35,233,311,422 138,198,808,939 35,169,510,763
Due From Related Parties Non-Trade 3.e, 3.p, 11, 28 1,991,704,293 81,901,884,016 79,811,959,458 79,811,959,459
Property and Equipment 3.h, 13 223,108,294,767 334,428,530,189 512,927,543,039 626,846,530,132
Intangible Assets 3.j, 3.k, 14 1,813,730,892 4,477,084,265 6,437,862,803 6,892,168,231
Deferred Tax Assets 3.o, 16.c 12,283,526,066 15,321,018,961 13,661,808,429 14,386,956,608
Other Non-Current Financial Assets 12 7,790,789,292 39,163,815,493 33,281,416,097 29,751,692,689 Total Non-Current Assets 354,364,236,990 586,592,391,842 827,581,834,261 836,121,253,378
TOTAL ASSETS 474,781,812,267 759,917,210,655 1,065,282,654,818 1,119,617,548,026
LIABILITIES AND EQUITY
LIABILITIES
CURRENT LIABILITIES
Trade Payables - Third Parties 3.r, 15, 28 82,251,766,070 101,685,684,602 131,095,472,772 135,359,545,224
Accrued Expenses 3.r, 18, 28 13,651,720,102 17,401,143,290 30,702,935,616 27,819,778,183
Advances from Patients 3.p 5,044,858,409 10,839,030,117 4,646,181,252 10,703,120,051
Taxes Payable 3.o, 16.a 27,976,779,568 18,282,859,715 15,643,009,840 11,723,093,621
Other Current Financial Liabilities 3.r, 17, 28 5,502,355,359 16,022,933,553 13,543,234,699 24,184,018,828
Total Current Liabilities 134,427,479,508 164,231,651,277 195,630,834,179 209,789,555,907
NON-CURRENT LIABILITIES
Due To Related Parties Non-Trade 3.f, 3.r, 11, 28 129,766,588,362 312,727,225,182 520,330,924,798 523,325,954,863
Long-Term Employment Benefits Liabilities 3.l, 19 46,578,713,630 57,757,491,428 61,430,112,650 71,440,228,000
Total Non-Current Liabilities 176,345,301,992 370,484,716,610 581,761,037,448 594,766,182,863
Total Liabilities 310,772,781,500 534,716,367,887 777,391,871,627 804,555,738,770
EKUITAS
Capital Stock, par Value - Rp 100 per share
Authorized Capital - 4,000,000,000 shares
Issued and Fully Paid - 1,000,000,000 shares 20 100,000,000,000 100,000,000,000 100,000,000,000 100,000,000,000
Difference in Value of Transaction Between Entities Under Common Control (4,452,912,168) (4,452,912,168) (4,452,912,168) (4,452,912,168)
Retained Earnings 3.m, 21 68,461,942,935 129,653,754,935 192,343,695,359 219,514,721,423
Total Equity 164,009,030,767 225,200,842,767 287,890,783,191 315,061,809,255
TOTAL LIABILITIES AND EQUITY 474,781,812,267 759,917,210,655 1,065,282,654,818 1,119,617,548,026
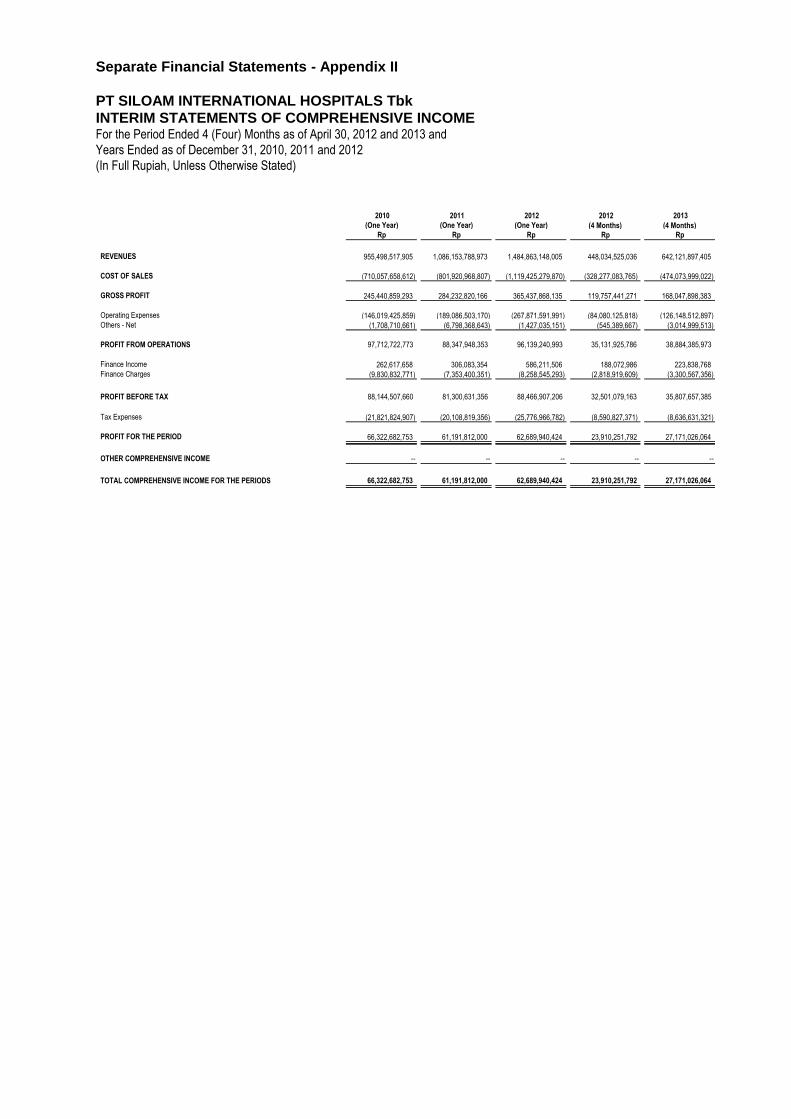
Catatan terlampir merupakan bagian yang tidak terpisahkan dari
laporan keuangan konsolidasian secara keseluruhan
Final Draft/10 June 2013 2 paraf:
Separate Financial Statements - Appendix II
PT SILOAM INTERNATIONAL HOSPITALS Tbk
INTERIM STATEMENTS OF COMPREHENSIVE INCOME For the Period Ended 4 (Four) Months as of April 30, 2012 and 2013 and
Years Ended as of December 31, 2010, 2011 and 2012
(In Full Rupiah, Unless Otherwise Stated)
2010 2011 2012 2012 2013
Catatan (One Year) (One Year) (One Year) (4 Months) (4 Months)
Rp Rp Rp Rp Rp
REVENUES 3.n, 22 955,498,517,905 1,086,153,788,973 1,484,863,148,005 448,034,525,036 642,121,897,405
COST OF SALES 3.n, 23 (710,057,658,612) (801,920,968,807) (1,119,425,279,870) (328,277,083,765) (474,073,999,022)
GROSS PROFIT 245,440,859,293 284,232,820,166 365,437,868,135 119,757,441,271 168,047,898,383
Operating Expenses 3.n, 24 (146,019,425,859) (189,086,503,170) (267,871,591,991) (84,080,125,818) (126,148,512,897)Others - Net (1,708,710,661) (6,798,368,643) (1,427,035,151) (545,389,667) (3,014,999,513)
PROFIT FROM OPERATIONS 97,712,722,773 88,347,948,353 96,139,240,993 35,131,925,786 38,884,385,973
Finance Income 3.n, 25 262,617,658 306,083,354 586,211,506 188,072,986 223,838,768 Finance Charges 3.n, 25 (9,830,832,771) (7,353,400,351) (8,258,545,293) (2,818,919,609) (3,300,567,356)
PROFIT BEFORE TAX 88,144,507,660 81,300,631,356 88,466,907,206 32,501,079,163 35,807,657,385
Tax Expenses 3.o, 16.b (21,821,824,907) (20,108,819,356) (25,776,966,782) (8,590,827,371) (8,636,631,321)
PROFIT FOR THE PERIOD 66,322,682,753 61,191,812,000 62,689,940,424 23,910,251,792 27,171,026,064
OTHER COMPREHENSIVE INCOME -- -- -- -- --
TOTAL COMPREHENSIVE INCOME FOR THE PERIODS 66,322,682,753 61,191,812,000 62,689,940,424 23,910,251,792 27,171,026,064
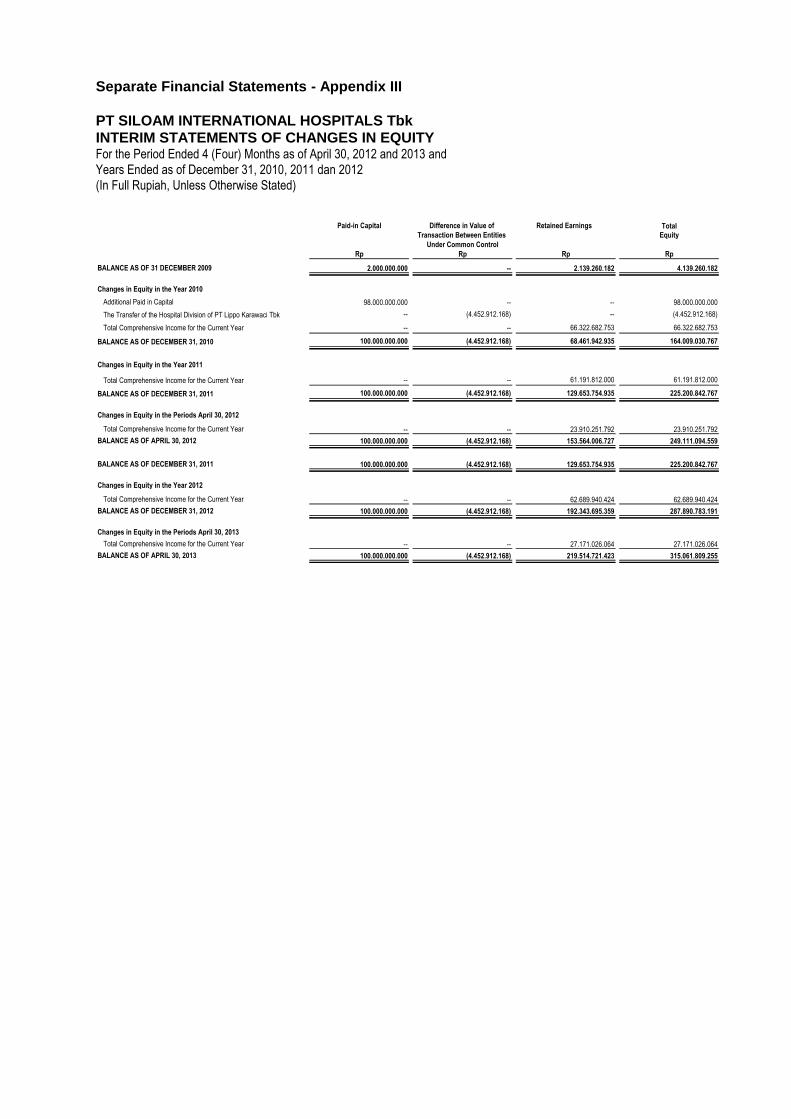
Catatan terlampir merupakan bagian yang tidak terpisahkan dari
laporan keuangan konsolidasian secara keseluruhan
Final Draft/10 June 2013 3
paraf:
Separate Financial Statements - Appendix III
PT SILOAM INTERNATIONAL HOSPITALS Tbk
INTERIM STATEMENTS OF CHANGES IN EQUITY For the Period Ended 4 (Four) Months as of April 30, 2012 and 2013 and
Years Ended as of December 31, 2010, 2011 dan 2012
(In Full Rupiah, Unless Otherwise Stated)
Catatan Paid-in Capital Difference in Value of Total
Transaction Between Entities Unappropriated Equity
Under Common Control
Rp Rp Rp Rp
BALANCE AS OF 31 DECEMBER 2009 2.000.000.000 -- 2.139.260.182 4.139.260.182 `
Changes in Equity in the Year 2010
Additional Paid in Capital # 98.000.000.000 -- -- 98.000.000.000
The Transfer of the Hospital Division of PT Lippo Karawaci Tbk 3.m, 21 -- (4.452.912.168) -- (4.452.912.168)
Total Comprehensive Income for the Current Year -- -- 66.322.682.753 66.322.682.753
BALANCE AS OF DECEMBER 31, 2010 100.000.000.000 (4.452.912.168) 68.461.942.935 164.009.030.767 ` ` ` `
Changes in Equity in the Year 2011
Total Comprehensive Income for the Current Year -- -- 61.191.812.000 61.191.812.000
BALANCE AS OF DECEMBER 31, 2011 100.000.000.000 (4.452.912.168) 129.653.754.935 225.200.842.767 ` ` ` `
Changes in Equity in the Periods April 30, 2012
Total Comprehensive Income for the Current Year -- -- 23.910.251.792 23.910.251.792
BALANCE AS OF APRIL 30, 2012 100.000.000.000 (4.452.912.168) 153.564.006.727 249.111.094.559 ` ` ` `
BALANCE AS OF DECEMBER 31, 2011 100.000.000.000 (4.452.912.168) 129.653.754.935 225.200.842.767
Changes in Equity in the Year 2012
Total Comprehensive Income for the Current Year -- -- 62.689.940.424 62.689.940.424
BALANCE AS OF DECEMBER 31, 2012 100.000.000.000 (4.452.912.168) 192.343.695.359 287.890.783.191 ` ` ` `
Changes in Equity in the Periods April 30, 2013
Total Comprehensive Income for the Current Year -- -- 27.171.026.064 27.171.026.064
BALANCE AS OF APRIL 30, 2013 100.000.000.000 (4.452.912.168) 219.514.721.423 315.061.809.255 ` ` ` `
Retained Earnings
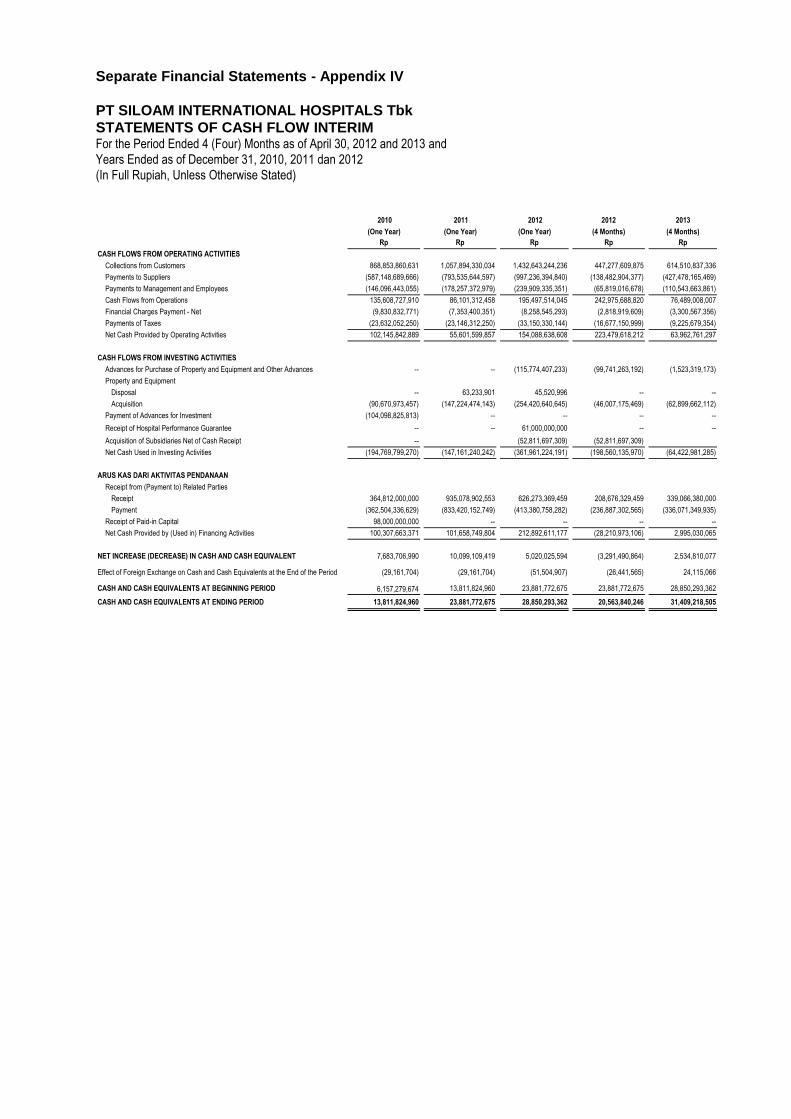
Catatan terlampir merupakan bagian yang tidak terpisahkan dari
laporan keuangan konsolidasian secara keseluruhan
Final Draft/10 June 2013 4 paraf:
Separate Financial Statements - Appendix IV
PT SILOAM INTERNATIONAL HOSPITALS Tbk
STATEMENTS OF CASH FLOW INTERIM For the Period Ended 4 (Four) Months as of April 30, 2012 and 2013 and
Years Ended as of December 31, 2010, 2011 dan 2012
(In Full Rupiah, Unless Otherwise Stated)
2010 2011 2012 2012 2013
(One Year) (One Year) (One Year) (4 Months) (4 Months)
Rp Rp Rp Rp Rp
CASH FLOWS FROM OPERATING ACTIVITIES
Collections from Customers 868,853,860,631 1,057,894,330,034 1,432,643,244,236 447,277,609,875 614,510,837,336
Payments to Suppliers (587,148,689,666) (793,535,644,597) (997,236,394,840) (138,482,904,377) (427,478,165,469)
Payments to Management and Employees (146,096,443,055) (178,257,372,979) (239,909,335,351) (65,819,016,678) (110,543,663,861)
Cash Flows from Operations 135,608,727,910 86,101,312,458 195,497,514,045 242,975,688,820 76,489,008,007
Financial Charges Payment - Net (9,830,832,771) (7,353,400,351) (8,258,545,293) (2,818,919,609) (3,300,567,356)
Payments of Taxes (23,632,052,250) (23,146,312,250) (33,150,330,144) (16,677,150,999) (9,225,679,354)
Net Cash Provided by Operating Activities 102,145,842,889 55,601,599,857 154,088,638,608 223,479,618,212 63,962,761,297
CASH FLOWS FROM INVESTING ACTIVITIES
Advances for Purchase of Property and Equipment and Other Advances -- -- (115,774,407,233) (99,741,263,192) (1,523,319,173)
Property and Equipment
Disposal -- 63,233,901 45,520,996 -- --
Acquisition (90,670,973,457) (147,224,474,143) (254,420,640,645) (46,007,175,469) (62,899,662,112)
Payment of Advances for Investment (104,098,825,813) -- -- -- --
Receipt of Hospital Performance Guarantee -- -- 61,000,000,000 -- --
Acquisition of Subsidiaries Net of Cash Receipt -- (52,811,697,309) (52,811,697,309)
Net Cash Used in Investing Activities (194,769,799,270) (147,161,240,242) (361,961,224,191) (198,560,135,970) (64,422,981,285)
ARUS KAS DARI AKTIVITAS PENDANAAN
Receipt from (Payment to) Related Parties
Receipt 364,812,000,000 935,078,902,553 626,273,369,459 208,676,329,459 339,066,380,000
Payment (362,504,336,629) (833,420,152,749) (413,380,758,282) (236,887,302,565) (336,071,349,935)
Receipt of Paid-in Capital 98,000,000,000 -- -- -- --
Net Cash Provided by (Used in) Financing Activities 100,307,663,371 101,658,749,804 212,892,611,177 (28,210,973,106) 2,995,030,065
NET INCREASE (DECREASE) IN CASH AND CASH EQUIVALENT 7,683,706,990 10,099,109,419 5,020,025,594 (3,291,490,864) 2,534,810,077
Effect of Foreign Exchange on Cash and Cash Equivalents at the End of the Period (29,161,704) (29,161,704) (51,504,907) (26,441,565) 24,115,066
CASH AND CASH EQUIVALENTS AT BEGINNING PERIOD 6,157,279,674 13,811,824,960 23,881,772,675 23,881,772,675 28,850,293,362
CASH AND CASH EQUIVALENTS AT ENDING PERIOD 13,811,824,960 23,881,772,675 28,850,293,362 20,563,840,246 31,409,218,505
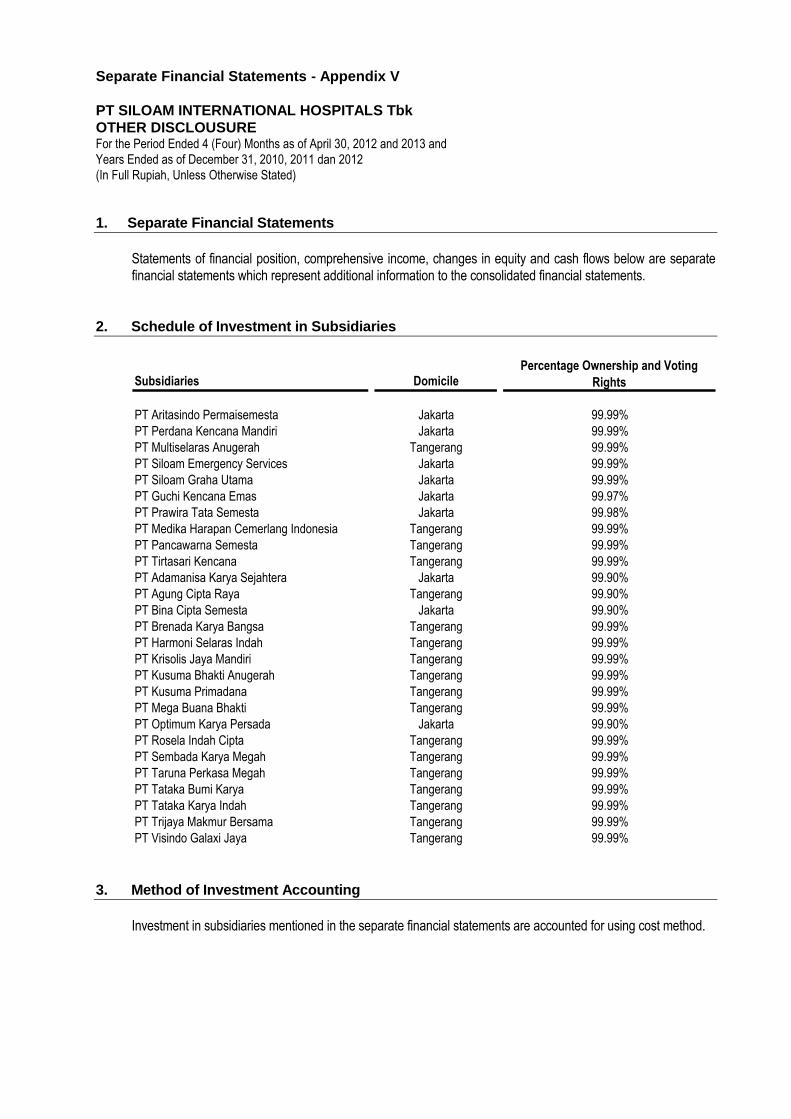
Catatan terlampir merupakan bagian yang tidak terpisahkan dari
laporan keuangan konsolidasian secara keseluruhan
Final Draft/10 June 2013 5 paraf:
Separate Financial Statements - Appendix V
PT SILOAM INTERNATIONAL HOSPITALS Tbk
OTHER DISCLOUSURE For the Period Ended 4 (Four) Months as of April 30, 2012 and 2013 and
Years Ended as of December 31, 2010, 2011 dan 2012
(In Full Rupiah, Unless Otherwise Stated)
1. Separate Financial Statements
Statements of financial position, comprehensive income, changes in equity and cash flows below are separate financial statements which represent additional information to the consolidated financial statements.
2. Schedule of Investment in Subsidiaries
Subsidiaries
PT Aritasindo Permaisemesta
PT Perdana Kencana Mandiri
PT Multiselaras Anugerah
PT Siloam Emergency Services
PT Siloam Graha Utama
PT Guchi Kencana Emas
PT Prawira Tata Semesta
PT Medika Harapan Cemerlang Indonesia
PT Pancawarna Semesta
PT Tirtasari Kencana
PT Adamanisa Karya Sejahtera
PT Agung Cipta Raya
PT Bina Cipta Semesta
PT Brenada Karya Bangsa
PT Harmoni Selaras Indah
PT Krisolis Jaya Mandiri
PT Kusuma Bhakti Anugerah
PT Kusuma Primadana
PT Mega Buana Bhakti
PT Optimum Karya Persada
PT Rosela Indah Cipta
PT Sembada Karya Megah
PT Taruna Perkasa Megah
PT Tataka Bumi Karya
PT Tataka Karya Indah
PT Trijaya Makmur Bersama
PT Visindo Galaxi Jaya
Jakarta 99.99%
Tangerang 99.99%
Jakarta 99.99%
Percentage Ownership and Voting
RightsDomicile
Jakarta 99.99%
Jakarta 99.98%
Tangerang 99.99%
Jakarta 99.99%
Jakarta 99.97%
Tangerang 99.99%
Tangerang 99.99%
Tangerang 99.90%
Jakarta 99.90%
Tangerang 99.99%
Jakarta 99.90%
Tangerang 99.99%
Tangerang 99.99%
Jakarta 99.90%
Tangerang 99.99%
Tangerang 99.99%
Tangerang 99.99%
Tangerang 99.99%
Tangerang 99.99%
Tangerang 99.99%
Tangerang 99.99%
Tangerang 99.99%
Tangerang 99.99%
Tangerang 99.99%
3. Method of Investment Accounting
Investment in subsidiaries mentioned in the separate financial statements are accounted for using cost method.