Silica! Its NOT just dust, Its Silica! The Health Hazards of Silica in Construction Work.

Master Thesis
Silica Application as a Promising Approach for Control of Fungal Diseases for Grapevine Vitis vinifera L.
February 14, 2017 Paul Schabl, BSc 1051866 / 376258
Advisors: Prof. Dr. Walter Wenzel University of Natural Resources and Life Sciences Vienna Department of Forest and Soil Sciences Institute of Soil Research Prof. Dr. Annette Reineke Hochschule Geisenheim University Center of Applied Biology Department of Phytomedicine Ing. Christoph Gabler Division of Viticulture School of Viticulture and Pomology Krems Dipl. Päd. Ing. Erhard Kührer Division of Viticulture School of Viticulture and Pomology Krems

Master Thesis Silica Application as a Promising Approach for Control of Fungal Diseases for Grapevine Vitis vinifera L. February 14, 2017 Paul Schabl, BSc 1051866 / 376258 Advisors: Prof. Dr. Walter Wenzel University of Natural Resources and Life Sciences Vienna Department of Forest and Soil Sciences Institute of Soil Research Prof. Dr. Annette Reineke Hochschule Geisenheim University Center of Applied Biology Department of Phytomedicine Ing. Christoph Gabler Division of Viticulture School of Viticulture and Pomology Krems Dipl. Päd. Ing. Erhard Kührer Division of Viticulture School of Viticulture and Pomology Krems

i
Abstract
Silicon applications have the potential to substitute cost intensive and
environmentally unfriendly fungicide treatments for grapevine Vitis vinifera L. An
enormous amount of literature examines the benefits of silicon in improving
overall crop productivity and health under biotic and abiotic stress for many
agrarian cultures. Powdery and downy Mildew are the major fungal pathogens in
grape growing, which cause immense damage every year. Previous studies tried
different silicon components for the control of fungi for grapevine, but their
results are contradictory. Therefore, this thesis tests the efficiency of silica soil
amendments and foliar spray to control for mildew pathogens for grapevine cv.
Grüner Veltliner in a field trial in Austria. Assessments of fungal infestations
determined reduced rates of powdery mildew for silica treated plants. Silicon
deposits in the leaves doubled for the silica foliar spray. Although the enrichment
of the soil with silicon was high, there is no evidence of increased silicon uptake
by the plants from the soil. Photosynthetic measurements revealed that intense
spraying of conventional systemic fungicides reduced the photosynthetic activity
of grapevine. Silica treatments are a potential substitute for the control of
powdery mildew. Material cost is low, plant performance is not disturbed and
silica would potentially fall within guidelines for organic winegrowers as a natural
substance.

ii
Acknowledgement
I would like to thank my advisor Professor Walter Wenzel and his team for their
expert advice, encouragement and support throughout this project. Special
thanks to Ing. Christoph Gabler and Ing. Erhard Kührer from the School of
Viticulture and Pomology in Krems for their immediate willingness to support this
research with their experience in viticulture and for the possibility to run this
experiment in a field trial. Special thanks to Professor Annette Reineke for co-
advising this thesis and assisting with helpful hints and tricks. Moreover, I want to
thank Professor Astrid Forneck and her team for their support.

iii
Table of Content
1 Introduction ............................................................................................................................. 1
Silicon in Soil ..................................................................................................................... 3
Soluble and Available Silicon in Soils ........................................................................ 5
Silicon in Plants ................................................................................................................. 6
Major Fungal Pathogens of Grapevine............................................................................. 9
Powdery Mildew ....................................................................................................... 9
Downy Mildew ........................................................................................................ 10
Defense and Resistance of Grapevine ........................................................................... 12
Research Objective ......................................................................................................... 13
2 Material & Methods .............................................................................................................. 15
Experimental Design ...................................................................................................... 15
Soil Characteristics ......................................................................................................... 16
Treatments ..................................................................................................................... 17
Plant Protection.............................................................................................................. 20
Time Table ...................................................................................................................... 20
Weather Data ................................................................................................................. 21
Measurements ............................................................................................................... 22
Assessment of Fungal Diseases ............................................................................... 22
Soil Analysis ............................................................................................................. 23
Leaf Analysis ............................................................................................................ 23
Analysis of Photosynthesis ...................................................................................... 24
Fruit Quality Parameters ......................................................................................... 25
Statistical Analysis .......................................................................................................... 25
3 Results .................................................................................................................................... 26
Assessment of Fungal Diseases ...................................................................................... 26
Powdery Mildew ..................................................................................................... 26
Downy Mildew ........................................................................................................ 29
Silicon Status in Soil ........................................................................................................ 32
Plant-Available Silicon ............................................................................................. 32

iv
Amorphous Silicon .................................................................................................. 34
Leaf Analysis ................................................................................................................... 36
Photosynthesis ............................................................................................................... 38
Fruit Quality Parameters ................................................................................................ 39
4 Discussion .............................................................................................................................. 40
5 Literature ............................................................................................................................... 44
6 Appendix ................................................................................................................................ 49
EPPO Standard Uncinula necator PP 1/4(4) ................................................................... 49
EPPO Standard Plasmopara viticola PP 1/4(4) ............................................................... 52
Evaluation Form ............................................................................................................. 55
BBCH-Scale for Grapevine .............................................................................................. 56
Powdery Mildew VitiMeteo Prognostic Data ................................................................. 57
Downy Mildew VitiMeteo Prognostic Data .................................................................... 65
CaCl2 Extraction of Plant-Available Silicon on Soils ........................................................ 73
NaOH Extraction of Amorphous Silica in Soils ............................................................... 73
Adsorptiometric Determination of Silicon ..................................................................... 74
NaOH Extraction of Amorphous Silica in Plants ............................................................. 75
LUDOX TM50 Colloidal Silica .......................................................................................... 76
Equisetum Plus ............................................................................................................... 77

v
List of Tables
Table 1: Silicon analysis of the vineyard in Krems, Landersdorf ................................................... 16
Table 2: Characteristics of the experimental soil in Krems, Landersdorf ..................................... 16
Table 3: Detailed information for the soil amendment ................................................................ 17
Table 4: Detailed information of the foliar spray ......................................................................... 17
Table 5: Detailed information of the foliar spray with the Horsetail extract ............................... 18
Table 6: Detailed information of the common plant protection treatment ................................ 19
Table 7: Detailed information of the basic plant protection for all treatments........................... 20
Table 8: Weather data 2015 from Adcon Telmetry Live Data, Krems Landersdorf ..................... 21
Table 9: Weather data 2016 from Adcon Telmetry Live Data, Krems Landersdorf ..................... 21
Table 10: Means of fruit quality parameters ................................................................................ 39

vi
List of Figures
Figure 1: Different fractions of Si in soils ........................................................................................ 3
Figure 2: Symptoms of powdery mildew ...................................................................................... 10
Figure 3: Symptoms of downy mildew ......................................................................................... 11
Figure 4: Experimental design ...................................................................................................... 15
Figure 5: Time table of all applications and measurements ........................................................ 20
Figure 6: Overview of abaxial leaf surface affected by downy mildew ........................................ 22
Figure 7: Assessment of powdery mildew of grape clusters on August 11, 2016 ........................ 27
Figure 8: Analysis of grouped data for the assessment of powdery mildew ............................... 27
Figure 9: Assessment of powdery mildew of grape leaves on August 11, 2016 .......................... 28
Figure 10: Assessment of downy mildew of grape clusters on June 24, 2016 ............................. 29
Figure 11: Assessment of downy mildew of grape clusters on August 11, 2016 ......................... 30
Figure 12: Assessment of downy mildew of grape leaves on June 24, 2016 ............................... 31
Figure 13: Assessment of downy mildew of grape leaves on August 11, 2016 ........................... 31
Figure 14: Plant-available silicon in the topsoil ............................................................................ 32
Figure 15: Plant-available silicon in the subsoil ............................................................................ 33
Figure 16: Amorphous silicon in the topsoil ................................................................................. 34
Figure 17: Amorphous silicon in the subsoil ................................................................................. 35
Figure 18: Silicon concentrations of mature grapevine leaves .................................................... 36
Figure 19: Silicon concentrations of young grapevine leaves ...................................................... 37
Figure 20: Chlorophyll florescence of mature grapevine leaves .................................................. 38
Figure 21: Chlorophyll florescence of young grapevine leaves .................................................... 38
Figure 22: Analysis of alpha amino acids in the fruit juice ........................................................... 39

1
1 Introduction
The history of European grape-growing can be divided into three periods. The first (before 1845)
was characterized by the absence of major phytosanitary problems. This was followed by a
troubled half century during which European grape crops were faced with the arrival of three
major problems: (1) powdery mildew, (2) phylloxera and (3) downy mildew. The following years
were characterized by a search for solutions for these problems and a period of intensive use of
chemical protection lasting until the present (Gessler et al., 2011). The European grape species
Vitis vinifera, mainly used for winemaking due to its unique characteristics, is propagated
vegetative. Therefore, there was no possibility of a natural adaption to mildew pathogens and
Vitis vinifera is highly susceptible. Plasmopara viticola, causing downy mildew, and Uncinula
necator, responsible for powdery mildew, are endemic on wild Vitis species of North America.
Many of those non-vinifera grape species display varying levels of resistance to fungal pathogens
due to co-evolution (Gadoury et al., 2012). The cultivation of resistant grape species or
interspecific hybrids is only of minor importance at present time. The principal barriers are
market driven such as consumer acceptance of new varieties, unusual tastes and most often a
perceived reduced quality of fruit and wine (Gessler et al., 2011).
Diseases caused by these fungal pathogens are among the major constraints of viticulture. Repeated fungicide treatments generate important economic losses, emergence of resistant pathogen populations and potential environmental impacts. In organic viticulture the use of copper for control of downy mildew has long-term consequences due to its accumulation in the soil, which is incompatible with organic farming's objective of environmental friendliness (Currie and Perry, 2007). Not only environmental issues force viticulturists to find alternative methods for the management of fungal plant pathogens, but also governmental restrictions are imposed. With the revision of plant protection products undertaken in the EU (Council Directive No 414/91), many conventional fungicides have been removed from the market (Gessler et al., 2011). The Commission Regulation of the European Union (EC) No 473/2002 amended Annex II specifies the conditions under which copper may be used and introduced limits on its use (The European Commission, 2002) which were confirmed in 2007 in the Council Regulation (EC) No. 834/2007 on organic production and labeling of organic products (The European Commission, 2007). Dagosting et al. (2011) tested a total of 112 different treatments, including biocontrol agents,
materials of animal origin, homeopathic preparations, inorganic materials, microbial extracts,
natural derivatives, plant extracts, physical methods and synthetic materials and almost none of
them resulted to be a good substitute of copper in terms of disease control effectiveness thus
indicating the need for alternatives. Although deemed as nonessential nutrient for plants, silicon
(Si) has been proposed as a viable alternative to conventional control techniques. In the past 20
years manifold scientific documentation gave evidence of the benefits of Si to crops and brought
light into the Si-driven mechanism enhancing the productivity of a wide array of crops under
stressed conditions (Tubana et al., 2016).

2
Silicon is the eighth most common element in the universe by mass, but very rarely occurs as the
pure free element in the Earth's crust. It is widely distributed in dusts, sands, planetoids, and
planets as various forms of silicon dioxide (silica) or silicates (Hull, 1999). Over 90% of the Earth's
crust are composed of silicate minerals, making silicon the second most abundant element in the
Earth's crust after oxygen. It adds up to 70% of the soil mass in the form of minerals and water-
soluble silicic acid (H4SiO4), which is the fundamental building block of silica (Sakr, 2016). Silicon
is used commercially, often with little processing of the natural minerals. Such use includes
industrial construction with clays, silica sand, and stone. Silicate is used in cement, white ware
ceramics and glass. Elemental silicon has a large impact on the modern world economy such as
in the steel refining, aluminum-casting, and fine chemical industries. Very highly purified silicon
used in semiconductor electronics is essential in modern technology. Silicon is the basis of the
widely used synthetic polymers called silicones (Liang et al. 2015).
Moreover, silicon is an essential element in biology, although only traces are required by animals.
Various sea sponges and microorganisms, such as diatoms and protozoa, secrete skeletal
structures made of silica. Silica is deposited in many plant tissues, such as in the bark and wood
of Chrysobalanaceae and the silica cells and silicified trichomes of Cannabis sativa, horsetails and
many grasses. In higher plants, the silica phytoliths are rigid microscopic bodies occurring in the
cell. Some plants, for example rice, need silicon for their growth (Liang et al. 2015). Silicon
provides many benefits, such as improved resistance to pests and diseases, drought tolerance,
salinity, heavy metals and high temperatures (Currie and Perry, 2007; Epstein, 1999). In the
literature two hypotheses for silicon-enhanced resistance to fungal diseases have been
proposed. The first one is associated with the higher deposits of silicon in the leaf so as to form
a physical barrier to impede pathogen penetration. The second hypothesis is related to its
biologically active role in the expression of natural defense mechanisms. While physical defense
may partly explain the prophylactic effects of silicon, the biochemical defense is more accepted
for explaining the protective role of silicon against many plant pathogens (Datnoff et al, 2007).
The next chapters focus on the abundance, occurrence and dynamics of Si in soil, the uptake,
assimilation and Si-induced mechanism of resistance of plants and the specific fungal pathogens
and their interactions with grapevine to give a conclusive picture of the silicon-plant-pathogens
interactions.

3
Silicon in Soil
In rocks, the concentrations of silicon range from 23% (e.g. basalt) to 46.5% (e.g. orthoquartzite).
Trance amounts of silicon are also in carbonaceous rocks (Monger and Kelly, 2002). The chemical
weathering of silicate-containing minerals is the ultimate source of dissolved Si (as monosilicic
acid, H4SiO4), which contributes to continental soil formation through linked biogeochemical
reactions. Silicon release to the soil solution from weathering of silicate-containing minerals is
rather slow and is governed by precipitation and neoformation of authigenic Si-constituents, Si
adsorption/desorption on various solid phases, uptake and assimilation by vegetation and
microorganisms, preservation of stable Si form in the profile, and addition from external
atmospheric inputs. The largest inter-pool Si transfer takes place between biomass, biogenic
silica from phytoliths and microorganism and soil solution (Tubana et al., 2016). The contribution
of silicon to the soil solution from the atmosphere via wind-blown dust and phytolith particles is
very small compared to soil-plant inputs (Tubana et al, 2015).
Figure 1: Different fractions of Si in soils (Tubana et al., 2016)
In soils, silicon is generally grouped into three different fractions (1) the liquid phase, (2) the
adsorbed phase and (3) the solid phase, which are the key components of the silicon cycle in soil
(Matichencov and Bocharnikova, 2001). Figure 1 shows the different fractions in the classification
of silicon compounds in soils. The solid Si phase consists of poorly crystalline and microcrystalline,
amorphous and crystalline forms of Si. The largest solid phase fraction of Si occurs in crystalline
form consisting of primary and secondary silicates. Amorphous Si originates either from biogenic
sources such as plant residues and remains of microorganisms or litho/pedogenic materials,
which are Si complexes with Al, Fe, heavy metals and soil organic matter. The amount of
amorphous Si ranges from less than 1,000 to 30,000 mg/kg on a total soil basis and effects the
concentration of Si in soil solution (Tubana et al., 2016). The components of silicon in liquid and
adsorbed phases are similar, with exception that those in liquid phase are dissolved in the soil

4
solution, whereas those that are adsorbed are held onto soil particles and Fe and Al oxides or
hydroxides. A number of processes regulate the chemistry of silicon in the liquid phase: (1)
dissolution of silicon contained in primary and secondary minerals, (2) absorption of H4SiO4 in the
soil solution by the vegetation and microorganisms, (3) silicon adsorption on and desorption from
various solid phases, (4) preservation of stable silicon in the soil profile (5) leaching and (6)
addition such as by fertilization (Tubana et al., 2015).
Most soils are abundant in silicon, but certain soils contain low levels, especially of the plant-
available form of silicon. These soils include Oxisols and Ultisols, which are characterized as highly
weathered, leached, acidic and low in base saturation. Histosols, which contain high levels of
organic matter and very low mineral content are also ranked as low Si soil. Additionally, soils
composed of a large fraction of quartz sand and those that have been under long-term crop
production typically have low plant-available silicon (Datnoff et al., 1997a). Crop cultivation can
significantly alter the biogeochemical silica cycle and affects terrestrial silica mobilization and the
availability of Si for the growth of plants and oceanic phytoplankton blooms (Liang et al., 2015).
Based on data from the Food and Agriculture Organization of the United Nations (FAO) on world
crop production, it was calculated that 210-224 million tons of plant-available Si are removed
from the soil annually. This results in acceleration of mineral weathering, depolymerization of
polysilicic acids, change of P, Al, heavy metals, Fe and Mn behavior, degradation of soil humic
compounds, increased erosion, decreased microbial population and decreased plant Si nutrition.
Si fertilization may be required on all soils except for unique soils with an abnormally high level
of Si, such as recent volcanic soils. Silicon fertilizers increase the content of monosilicic acid in the
soil (Matichenkov et al., 2001).
The application of a silicon-rich material influences the dynamics of different elements in the soil.
Silicon is also added to soils with the application of manure and compost. The following direct
effects of Si fertilizers on soil properties have been observed (Tubana et al, 2015):
(1) Optimization of phosphate fertilizer efficiency,
(2) increase in K fertilizer efficiency,
(3) decrease in Al toxicity,
(4) change in heavy metal mobility in the soil,
(5) initiation of soil mineral formation process,
(6) improvement in adsorption properties and water-air regime of soil.

5
Soluble and Available Silicon in Soils Primary silicates and secondary mineral phases containing silica and biogenic silica to some
extent dissolve in water to produce silicic acid. It is produced by a non-biological process called
hydration involving water and quartz (Cooke et al., 2011). The reaction producing silicic acid from
quartz can be written as:
Quartz + Water → Silicic acid
SiO2 + 2 H2O → H4SiO4
Silicic acid concentration varies with soil type and is affected by its dissolution from soil minerals
and its adsorption or resorption by the soil (Epstein, 1994). Extreme conditions including high
temperatures and rainfall increase the release of silicic acid, explaining why most weathered soils
in the tropics are silicon-deficient (Cooke at al., 2011).
Silicic acid (H4SiO4) is the only form of Si present in soil solution, whereas the measured
concentrations range between 0.1 – 0.6 mM (Epstein, 1994), which is much less than that in
saturated silicic acid solution and is mainly controlled by the pH-dependent absorption-
desorption processes on sesquioxides (Liang et al., 2015). Available Si in soils refers to an amount
of Si that can be taken up by plants during the growing season and is considered an index of Si-
supplying capacity in soil. However, in silicic acid-saturated soil solution the monosilicic acid
polymerizes into polymeric acid, which is in a dynamic equilibrium with amorphous and
crystalline silicates, exchangeable silicates and sesquioxides. Therefore, parts of silicate
components that can be easily converted into silicic acids such as polymerized silicic acid,
exchangeable silicates and part of colloidal silicates also count to available Si (Liang et al., 2015).
The main factors influencing soil Si availability or Si-supplying power include types of soil and
parent material, historical land-use change, soil pH, soil texture, soil redox potential, organic
matter, temperature and accompanying ions (Liang et al., 2015). Moreover, the results of
Biyutskii et al. (2016) highlight the importance of earthworms in plant acquisition and
biogeochemistry of Si. Earthworms can increase mobility and bioavailability of silicon in soils.

6
Silicon in Plants As other plants grapevines require three categories of resources to grow and produce fruit: (1)
carbon, (2) water and (3) mineral nutrients. Exposed to suboptimal conditions abiotic and biotic
stresses can be limiting to one or several resources to the plant. Abiotic stresses include overcast
or too bright sky, heat or cold, water surplus or deficit and nutrient deficiency. Pests and disease
attacks rank among biotic stresses. Grapevines share their living quarters with a wide range of
other organisms, mainly arthropods and microorganisms, and in addition to some nematodes,
birds, mammals and plants. Although the majority of these do not harm grapes, some organisms
compete with the vines for resources or make a living feeding on various grapevine structures,
which make them pests or pathogens (Keller, 2010). Although a certain level of stress will
improve fruit quality in the vineyard, stresses adversely affect plant growth, development, or
productivity. (Bauer et al., 2015).
Although not traditionally thought of as an element essential to the life cycle of plants, with the
exception of the early-diverging Equisetaceae, Si is found in plants at concentrations from 1 to
100 g/kg which is equivalent to or even exceeding several macronutrients (Epstein, 1994). For
plant nutrition silicon has not been considered as an essential element, according to the classical
definition of essentiality (Arno and Stout, 1939), but it is regarded as one of the most beneficial
elements that increases plant resistance against abiotic and biotic stresses. It has been shown to
improve plant cell wall strength and structural integrity, improve drought and frost resistance,
decrease lodging potential (Currie and Perry, 2007), and boost the plant's natural pest and
disease fighting systems (Datnoff, 2007). Silicon has also been shown to improve plant vigor and
physiology by improving root mass and density, and increasing above ground plant biomass and
crop yields (Epstein, 2009b). In 2013, the American Association for Plant Food Control Officials
(AAPFCO), the regulatory body that governs the labeling of fertilizers in the USA, recognized
silicon as a beneficial substance that can now be sold as a fertilizer across the USA (Datnoff et al.,
2015).
Silicic acid is the only known precursor of silicon compounds in biota, and plants take up aqueous,
uncharged silicic acid through their roots when the pH-value of the soil solution is below 9 (Ma
and Yamaji, 2006). The ability of plants to accumulate Si varies greatly between species. Silicon
accumulation has been found to a greater extent, but not exclusively, in monocotyledonous
plants. Plants of the families Poaceae, Equisaetaceae and Cyperaceae show high Si-accumulation
whereas different parts of the same plant can show large differences in Si-content. Silicon
concentration of shoots typically tend to decline in the order
liverworts > horsetail > clubmosses > mosses > angiosperms > gymnosperms > ferns
(Currie & Perry, 2007). Its uptake is passive for dicotyledons and largely determined by
transpiration rate and is transported in the xylem. Therefore, silicon accumulates in higher
amounts in mature leaves than in young ones (Ma and Takahashi, 2002). The absorption of silicic
acid takes place at the lateral roots also via active or rejective mechanisms (Tubana et al. 2015).

7
An active mechanism corresponds to a silicon uptake in larger quantity than predicted by simple
mass flow, while passive Si uptake is directly proportional to mass flow. Rejective uptake is
characterized by low Si uptake by plants implying H4SiO4 accumulation in soil solution (Cornelis
et al., 2011).
Two different silicon transporters have been identified in the roots of rice, a high silicic acid
accumulating species. Such extreme accumulators contain 10 to 100g/kg Si in dry weight, and
most are monocotyledons, such as wheat, sugarcane, rice and barley. Intermediate Si
accumulators contain between 5 to 10g/kg dry weight and dicots plants with less than 5g/kg Si
in dry matter are classified as low Si accumulators (Datnoff et al., 2015).
Silicic acid saturates at 1.67 mM and then becomes highly polymerized, resulting in the
deposition of solid, amorphous, hydrated silica. Silicon can be deposited in any plant part, within
or between cells or as part of the cell wall, with discrete silica bodies known as phytoliths which
record shapes of the cellular and intercellular spaces that they fill. Once deposited, they are
immobile and cannot be translocated to new growing leaves. Following plant senescence, much
plant silicon dissolves in the soil solution and either cycles through biota or is leached into
waterways. In some systems, most of the silicon entering streams has passed through the
biogenic silica pool. However, some phytoliths can be preserved for long periods, although
amorphous silica has a higher solubility than does quartz which is crystalline silica (Cooke et al,
2011).
Plants deprived of Si are often weaker structurally and more prone to abnormalities of growth,
development and reproduction. It is the only nutrient which is not detrimental when collected in
excess (Epstein, 1994). The mechanisms which are responsible for relieving stresses remain partly
unclear and are thought to act in the soil, at the root surface and within plants at shoots and
roots (Van Bockhaven et al, 2013). As mentioned previously, the mechanical barrier formed from
Si polymerization below the cuticle and in the cell walls was the first proposed hypothesis to
explain how Si reduces or impedes fungal penetration (Ma et al., 2004). However, new insights
suggest Si effects on plant resistance may also occur through mediated host plant resistance
mechanisms against pathogen infection (Rodrigues et al., 2015).
In such a mechanism an R gene of the plant forms products, such as proteins, or activates a
defense mechanism that transfers resistance to specific plant pathogens. Silicon has been shown
to up- and downregulate certain genes and their defensive products in a number of host-
pathogen interactions. Activities of pathogenesis-related proteins, peroxidase, polyphenol
oxidase and chitinase were significantly stimulated by Si in cucumber Cucumis sativus (Tubana et
al., 2015). Fauteux et al. (2005) suggested that Si might act as a potentiator of plant defense
response or as an activator of specific signaling proteins that interact with several key
components of plant stress signaling systems, leading to induced resistance against pathogenic
fungi. Although the molecular mechanism of how such priming is associated with Si are not well
understood, a growing body of research suggests that Si may be influencing plants’ endogenous
defensive hormone balance (Rodriques et al., 2015). Higher levels of salicylic acid, jasmonic acid

8
and ethylene have been reported to be induced by Si supplements in a number of host-pathogen
interactions. Clearly more research is warranted to determine how Si potentiates host plant
resistance against both biotic and abiotic stress (Tubana et al., 2015).

9
Major Fungal Pathogens of Grapevine
Grapevine species are prone to several diseases, fungi being the major pathogens compromising
its cultivation and economic profit around the world. Knowledge of the complexity of
mechanisms responsible for resistance to fungus infection is necessary to develop strategies
which will improve the grapevine’s resistance (Bauer et al., 2015).
Powdery Mildew Uncinula necator (syn. Erysiphe necator) is a fungus that causes grapevine powdery mildew, also
termed Oidium. It is the most widespread and most consistently damaging pathogen which is
parasitic on genera within the Vitaceae. The most economically important host is grapevine
(Vitis), particularly the European grape, Vitis vinifera, which is highly susceptible. The fungus
originated in North America and spread through Europe in the 1840s at a time where little was
known about germ theory (Gadoury et al., 2012).
Uncinula necator infects all green tissue on the grapevine, including leaves and young berries.
Ascospores colonies are most commonly found on the lower surface of the leaves and may be
accompanied by a similarly shaped chlorotic spot on the upper surface. Severely affected leaves
usually senesce, develop necrotic blotches and fall prematurely. Inflorescences and berries are
most susceptible when young and can become completely coated with whitish mildew. Powdery
mildew causes crop loss and poor wine quality if untreated (Bauer et al., 2015).
This fungus requires only 40% relative humidity to germinate, a threshold that is easily reached
on the lower surface of transpiring leaves, even if the surrounding air is much drier. The optimum
is at 85% humidity and 25°C, but heavy rain and temperatures below 10 and over 31°C limit the
development. Mild rainfall seems to benefit by enhancing spore dispersal. Spores germinate on
the surface of plant organs, invade the cuticle and cell walls and rapidly establish haustoria inside
the epidermis cell. Like all biotrophic pathogens, U. necator needs living host plants for assimilate
supply. It suppresses the defense responses in susceptible cultivars and acts as another sink.
Infected leaves have higher concentration of sugars especially hexoses due to import of sucrose
from uninfected plant parts and subsequent breakdown by invertase in the cell walls. An injection
of cytokinin from the pathogen induces invertase activity and also involves amino acid imports.
Photosynthesis and starch storage will decrease in infected leaves. This powerful extra sink alters
assimilates partitioning in the vine at the expense of other sinks such as fruit, roots and storage
reserves (Keller, 2010).
Unlike American Vitis species, which are relatively resistant to the fungus, European Vitis vinifera
L. cultivars are readily infected because they did not coevolve with the pathogen and produce
lower amounts of PR proteins. Within European cultivars susceptibility varies, with Chardonnay
and Cabernet Sauvignon being among the most susceptible cultivars (Keller, 2010). Even though

10
stilbene phytoalexins are also effective against Uncinula necator, infections do not normally
trigger their production. One explanation could be that the fungus avoids cell damage so as not
to threaten its own survival. The resistant American Vitis species accumulate stilbenes in
response to infections. Also flavonols, which accumulate in the epidermis, and cuticular wax may
be involved in Vitis vinifera resistance against Uncinula necator (Keller, 2010). Flavonol
production is strongly reduced by high soil nitrogen availability and high plant N status makes
vines more susceptible to colonization by powdery mildew. An additional resistance mechanism
may be vitrification of penetrating mycelium by the localized accumulation of silicates in the cell
walls (Blaich and Wind, 1989).
Downy Mildew Although usually regarded as a fungus because it looks like one and produces spores, the causal
agent Plasmopora viticola is in fact more closely related to certain algae, kelps and diatoms with
which they are placed in the kingdom of Protista. In contrast to fungi, its cell walls contain
cellulose instead of chitin and its cell nuclei are diploid, not haploid. It belongs to the class of
Oomycetes and is not related to the powdery mildew fungus. (Gessler et al., 2011)
Plasmopora viticola also termed Peronospora can infest all green parts of the plant but usually
colonizes young leaves or young berries by penetrating through the stomata. The spores can
germinate at greater than 95% relative humidity in shady conditions especially with frequent
rainfall and temperatures between 20 and 25°C. The mycelium develops an intercellular network
in the leaf mesophyll and creates haustoria to feed from these cells. The first symptoms appear
on the adaxial side of leaves as yellow or in some cultivars red oily spots, which spread and later
Figure 2: Symptoms of powdery mildew, left: fully infested grape cluster (own picture), right: spots of powdery mildew on the adaxial side of the leaf (www.rebschutzdienst.at)

11
become angular necrotic patches. On the abaxial leaf surface the typical whitish downy
symptoms arise from the sporulation of the pathogen through the stomata (Keller, 2010). The
invading pathogen prevents the stomata from closing at night. The unrestrained water deficit
leads to water loss and wilting of infected leaves. Plasmopora viticola does not stimulate sugar
accumulation in infected leaves like Uncinula necator, but an infection leads to a reduction in
photosynthesis and the shedding of severely damaged leaves. This can have negative effects on
yield formation and fruit ripening as for the storage of reserves. Infected shoot tips, tendrils,
petiols and inflorescences often become necrotic and are abscised. The young grape berries get
covered with a grayish felt (Gessler et al., 2011).
While Vitis vinifera is highly susceptible, American Vitis species, which have coevolved with the
pathogen, are partly or fully resistant to downy mildew, and some Asian species also show partial
resistance. Resistant species defend themselves against the fungal pathogen by secreting callose
that plugs their stomata and coats the pathogens spores. This stops mycelial growth, reduces
water loss from the leaves and stilbenes are upregulated. High plant N status seems to
compromise the leaves’ ability to produce stilbenes and leads to higher vulnerability to infection.
Garibaldi et al. (2012) have found that Si and an increased electrical conductivity lead to a
reduction of downy mildew infections of soilless grown lettuce.
Figure 3: Symptoms of downy mildew, left: infested and uninfested berries, right: a necrotic spot on the abaxial side of the leaf surrounded by a downy mycelium (own pictures)

12
Defense and Resistance of Grapevine A prospective pathogen that attempts to penetrate the epidermis first has to overcome the
cuticle and thick outer cell walls on the leaves. The thickness of the cuticle and the outer cell wall
of different Vitis cultivars determine their susceptibility to powdery mildew (Heintz and Blaich,
1989). Access points for pathogens are wounds caused by herbivore, birds, arthropods or
mechanical damage. During anthesis exposed surfaces provide ideal sites for pathogen invasion
and therefore special attention for plant protection has to be paid during flowering. Plants
respond to physical damage by mechanisms that aim to heal wounds and prevent pathogen
invasion. Deposition of callose, lignin glycoproteins and phenolics strengthen the cell wall and
the production of so-called pathogenesis-related (PR) proteins such as chitinases and glucanases
increase the defense mechanism (Gessler et al., 2011).
If defense responses are unsuccessful and pathogens penetrate into the tissues, plants have
evolved a broad range of strategies to resists fungal infections. These strategies are either
constitutive or induced. Constitutive resistance strategies are passive and are present regardless
of an infection. They include physical barriers such as cell walls, the cuticle and chemicals with
antimicrobial activity like phenolics, which are generally accumulated in the cell vacuoles (Keller,
2010).
Induced strategies are actively initiated in response to pathogen invasion and specifically target
pathogens that have overcome the constitutive barriers. The production of reactive oxygen
species and antimicrobial compounds such as proteins and phytoalexins starts. The fortification
of cell walls with lignin, suberin or the incorporation of callose, proteins or silicon are part of the
induced strategies. Active defense is usually restricted to the site of invasion as only infected and
neighboring cells accumulate the antimicrobial chemicals to concentrations to restrict the
spreading of the pathogen (Keller, 2010; Gessler et al., 2011). The first hypothesis of silicon-
enhanced resistance is associated with silicon deposits in the cell walls and below the cuticle
which act as an addition physical border (Sakr, 2016).
Plants have special receptor proteins that can recognize invading pathogens by some of the
microbial enzymes or complex carbohydrates. They are able to interpret the breakdown products
of their own cuticle and cell walls as signals of the intruder. These compounds are collectively
termed elicitors. The defense response results from activation of various biochemical pathways
by a series of signaling cascades that are triggered by the detection of a pathogen. Within minutes
of an attempted infection by a foreign invader, there is a rapid rise in reactive oxygen species in
the apoplast (Apel and Hirt, 2004). The surrounding cells mount structural barriers and produce
PR-proteins which degrade chitin and glucans, which are important components of the cell walls
of fungi (Keller, 2010).
Secondary signaling molecules, including salicylic acid, jasmonic acid and ethylene then augment
the early defense response and may even activate defenses in distant healthy tissues and act
systemically (Heil and Ton, 2008). In some instances, these secondary signals and H202 make

13
infected and surrounding cells to commit suicide in a process termed hypersensitive response.
This limits food supply to the pathogen and may kill it. Although, this strategy is indeed useful in
fighting off biotrophs such as Unicator. necator and Plasmopora. viticola, the susceptibility to
necrotrophs rises. Necrotrophs such as Botrytis cinerea grow on dead tissues and can exploit the
plant’s defense response by promoting tissue senescence. (Keller, 2010)
If the pathogen could penetrate into the tissue, the vine activates a second line of defense after
several hours. This biochemical defense includes accumulation of antimicrobial compounds,
including phytoalexins and PR proteins. In response to xylem-invading fungal pathogens, the
accumulation of elemental sulfur in the vessel walls and xylem parenchyma cells is expedited
(Gessler et al., 2011).
Research Objective
The aim of this thesis is to test the efficiency of silicon applications to control for downy and
powdery mildew in grapevine V. vinifera L. cv. Grüner Veltliner in a field trial. In the literature
two hypotheses for silicon-enhanced resistance to fungal diseases have been proposed: (1)
Increased levels of silicon deposits in the plant act as physical barriers and (2) the upregulation
of natural defense mechanism which actively fight off fungal pathogens.
Previous studies have shown that the supplement of silicon to grapevine increased the maximum
yield and potential photochemical efficiency of the photochemical reactions in photosystem II
(Qin et al., 2016). Ling et al. (2016) state that silicon might play an important role in protecting
photosynthetic machinery from damage and improving the salt-tolerance of the grapevine by
increasing the concentration of soluble sugars and starch.
On potted plants root-feeding at 1.7mM silicon solution had no effect on fungal disease severity,
but foliar sprays at 17mM Si substantially reduced the number of mildew colonies that developed
in inoculated grapevine leaves. Hyphae did not develop in areas where thick Si deposits were
present on the leaf surface (Bowen et al, 1992). Reynolds et al. (1995) showed that potassium
silicate sprays reduced the incidence of powdery mildew in two of three years. The study
concluded that grape berries may utilize endogenous Si to help fight diseases. Furthermore,
exogenously applied silicates may act to augment the activity of their endogenous counterparts.
Appropriate application intervals and concentrations will increase the effectiveness of silicon
sprays.
Klaus et al. (1990) performed a Si-fertilizer trial in a vineyard with grapevine cv. Müller-Thurgau
and Silvaner. Vines were fertilized with 2.5 and 5 t/ha of calcium silicate over four years before
starting measurements. Minor Si accumulation in the tested leaves could be determined.
However, Leusch (1986) indicates that the fertilization with calcium silicate does not always lead
to an increased amount of silicic acid due to a rise in pH and therefore a reduced solubility. The

14
authors note that the conversion from calcium silicate into silicic acid performed unsatisfactory
and may have been the reason for the insignificant uptake.
Lafos (1995) states a 10% reduction of powdery mildew due to Si fertilization in the greenhouse
but emphasizes large differences between cultivars. Blaich (1997) showed significant varietal
differences only for cv. Regent, an inter-specific hybrid grape variety, which accumulated about
20% more Si.
Blaich et al. (1997) deny the efficiency of silica sprays against fungal infections. The results from
Blaich et al. (1998) show silica to be essential for a normal powdery mildew resistance, but
provide evidence that Oidium susceptibility of cultivars cannot be overcome by supplementary
silica fertilization in the field. Furthermore, they state that the Si content of most soil solutions
are far above the minimal requirements of grapevine (Blaich et al, 1998). However, continuous
cropping of land, natural weathering, or inherently deficient soils can be causes of deficiency
(Tubana et al., 2016) and will become even more problematic in the future. Although some
studies contradict each other, most of the studies have revealed benefits of silicon fertilization
and foliar sprays for grapevine. Silicon seems to have potential as an alternative spray material
to fungi control and impresses with low material cost, lower risk of off-flavors like H2S in wines
and its potential acceptability in guidelines for organic winegrowers as a natural substance
(Tubana et al., 2016).
Since many of the previous studies were performed in the green house and used different silicon
solution such as potassium silicate or calcium silicate, this study was performed as a field trial.
For the fertilization and the foliar sprays silica is used to avoid any interfering effects of binding
partner like potassium or calcium. Assessments of fungal pathogens were used to monitor the
status of infestations of the different treatments. Soil samples were analyzed to determine if Si
amendments enrich the soil in the top and subsoil layer. Foliar samples were analyzed for their
Si concentrations to assess the effect of the treatments on Si allocation to leaves. Moreover,
measurements of the photosynthetic performance were taken to detect stress factors. At the
end of the growing season the fruit quality of the different treatments was compared.
In this study the following hypothesis were tested:
H1: Silicon treatment can partly substitute for fungicides while maintaining a similar level of
fungal symptoms.
H2: Silicon fractions in the soil are enriched due to Si fertilization.
H3: Si-treated plants show higher levels of silicon in the leaves than untreated plants.
H4: Si-treated plants are less stressed and show higher photosynthetic activity.
H5: Grape clusters of Si-treated plants show better quality than grape clusters of untreated
plants.

15
2 Material & Methods
Experimental Design
The field trial was situated in Krems Landersdorf at a vineyard of the School of Viticulture and
Horticulture in Krems, Austria and was supported by Ing. Christoph Gabler and Ing. Erhard Kührer.
For each treatment 48 plants of Vitis vinifera cv. Grüner Veltliner (scion: SO4) were used and
divided into four groups of 12 plants. The vineyard was planted in 2012 with a distance of 3x1m
(Figure 4).
Figure 4: Experimental design, V1: Amorphous Silicon Soil Amendment (yellow), V2: Amorphous Silicon Foliar Spray (blue), V3: Amorphous Silicon Combination V1 + V2 (green), V4: Equisetum Plus Spray (red), V6: Control Group Water Spray (light blue), V7: Control Group Common Plant Protection (grey), colored blocks consisted of 12 plants, total number of plants per treatment were 48
Amorphous silica was either applied to the soil as a fertilizer (V1) or sprayed as foliar spray to the
canopy (V2). For treatment V3 a combination of Si-fertilization and foliar spray was used. In
treatment V4 a horsetail extract, which has already been used in organic viticulture was applied
as foliar spray. The control groups V5 and V6 received water sprayed on leaves and soil irrigation
with water, respectively. Treatment V7 served as a comparison to common plant protection.
V4
V5
V5
V6
V6
V
1
V2
V
3
V7
V
7
V7
V4
V4
V
4
V5
V5
V6
V6
V1
V1
V1
V2
V2
V2
V3
V3
V3
V7

16
Soil Characteristics
Before starting the experiment soils of different vineyards were analyzed to ensure low plant-
available and amorphous silicon in the soil. The vineyard at Krems, Landersdorf is low in both
silicon fractions. Table 1 shows the analysis of silicon in the soils of the experimental vineyard.
Plant-available (i.e. CaCl2-extractable) Si amounted to 0.126 mM in the topsoil and 0.118 mM in
the subsoil which compares to a typical range between 0.029 – 0.175 mM plant-available silicon
(Sakr, 2016), indicating a medium available Si status of the experimental soil. Similarly, also for
the amorphous fraction (i.e., NaOH-extractable) of silica (1.25 g/kg in the top and 1.37 g/kg in
the subsoil) falls in the lower range compared to the typical range of 1,000 to 30,000 mg/kg as
reported by Tubana et al. (2016).
Table 1: Silicon analysis of the vineyard in Krems, Landersdorf, soil samples were taken on March 18, topsoil ranges from 0-30 cm, subsoil ranges 30-60 cm, plant-available silicon was analyzed with a CaCl2-extraction modified from Haysom and Chapman, 1975 and Liang et al., 2015, amorphous silicon was extracted with a NaOH-solution modified from Georgiadis et al., 2015
Table 2 provides additional information about the soil characteristics of the vineyard. According
to its texture composition of around 100 g/kg sand, 700 g/kg silt and 200 g/kg clay it can be
classified as loess soil, an aeolian sediment formed by the accumulation of wind-blown silt (Miller
et al., 1990). A thick blackish mineral surface layer that is rich in organic matter and the parent
material of mostly aeolian and reworked aeolian sediments indicate the classification of a
Chernozems soil. This soil is typical for this region and develops in a continental climate (FAO,
2015). The carbon-to-nitrogen ratio at a medium level for a cultivated Chernozem soil.
Table 2: Characteristics of the experimental soil in Krems, Landersdorf, analysis was performed according to Blum et al. (1996)
Soil pH Sand Silt Clay C/N ratio Organic Carbon
Carbonate Content Nitrogen
Topsoil 7.43 100 g/kg 672 g/kg 228 g/kg 13.8 19.3 g/kg
184.9 g/kg 1.4 g/kg
Subsoil 7.55 89 g/kg 758 g/kg 153 g/kg 16.4 16.4 g/kg
192.1 g/kg 1.0 g/kg
Soil Analysis
Plant-available Silicon (in mM)
Amorphous Silicon (in mg/kg)
Topsoil 0.126 1,250 Subsoil 0.118 1,370

17
Treatments
[V1] Amorphous Silicon – Soil Amendment
LUDOX TM-50 Colloidal Silica was applied to the soil with a watering pot in 6 portions during
the growing season. For an easier application and to avoid drain of the fertilizer a pouring ring
around the vine with a diameter of 40cm were installed. A total amount of 5 t/ha LUDOX TM-50
Colloidal Silica were applied (Table 3). Taking into account that this is a 50% wt. suspension in
water, this corresponds to a total amount of 2.5 t/ha of silica.
Amount of application for 48 plants:
Table 3: Detailed information for the soil amendment with LUDOX TM-50 Colloidal Silica for the treatment V1 and V3. The same amount of water was used for the control group V5, the BBCH-code identifies the phenological stages of the grapevine
Date BBCH Product Amount Concentration Water M SiO2
per Plant
19-May 17 LUDOX TM-50 Colloidal Silica 8.0 l 4.20% 192 l 93.0
7-Jun 57 LUDOX TM-50 Colloidal Silica 3.2 l 1.70% 192 l 37.2
28-Jun 73 LUDOX TM-50 Colloidal Silica 3.2 l 1.70% 192 l 37.2
12-Jul 77 LUDOX TM-50 Colloidal Silica 3.2 l 1.70% 192 l 37.2
29-Jul 81 LUDOX TM-50 Colloidal Silica 3.2 l 1.70% 192 l 37.2
17-Aug 83 LUDOX TM-50 Colloidal Silica 3.2 l 1.70% 192 l 37.2
[V2] Amorphous Silicon – Foliar Spray
The first two applications were sprayed at a concentration of 1% of LUDOX TM-50 colloidal
silica. After the first assessment of fungal diseases the amount was increased to a concentration
of 2% to gain better results (Table 4).
Amount of application for 48 plants:
Table 4: Detailed information of the foliar spray with LUDOX TM-50 Colloidal Silica for the treatment V2 and V3. The same amount of water was used for the control group V6, the BBCH-code identifies the phenological stages of the grapevine
Date BBCH Product Amount Concentration Water mM SiO2
per Plant
19-May 17 LUDOX TM-50 Colloidal Silica 50ml 1.00% 5 l 12.1
7-Jun 57 LUDOX TM-50 Colloidal Silica 60ml 1.00% 6 l 14.5
28-Jun 73 LUDOX TM-50 Colloidal Silica 160ml 2.00% 8 l 38.8
12-Jul 77 LUDOX TM-50 Colloidal Silica 160ml 2.00% 8 l 38.8
29-Jul 81 LUDOX TM-50 Colloidal Silica 160ml 2.00% 8 l 38.8
17-Aug 83 LUDOX TM-50 Colloidal Silica 200ml 2.00% 10 l 48.5

18
[V3] Amorphous Silicon – Soil Amendment + Foliar Spray
This treatment was a combination of V1 and V2 and exactly the same amount of LUDOX TM-50
Colloidal Silica was brought out for the soil amendment from V1 and the foliar spray from V2
(Tables 3 and 4).
[V4] Equisetum Plus – Foliar Spray
The first two applications were sprayed at a concentration of 1% of Equisetum Plus. After the
first assessment of fungal diseases the amount was increased to a concentration of 2% to gain
better results (Table 6).
Amount of application for 48 plants:
Table 5: Detailed information of the foliar spray with Equisetum Plus for the treatment V4, the BBCH-code identifies the phenological stages of the grapevine
Date BBCH Product Amount Concentration Water
19-May 17 Equisetum Plus 50ml 1.00% 5 l
7-Jun 57 Equisetum Plus 60ml 1.00% 6 l
28-Jun 73 Equisetum Plus 160ml 2.00% 8 l
12-Jul 77 Equisetum Plus 160ml 2.00% 8 l
29-Jul 81 Equisetum Plus 160ml 2.00% 8 l
17-Aug 83 Equisetum Plus 200ml 2.00% 10 l
[V5] Control group – Watered
For this control group the same amount of water was brought out as for the treatment V1. The
product LUDOX TM-50 Colloidal Silica was not added (Table 3).
[V6] Control group – Water Spray
For this control group the same amount of water was sprayed as for treatment V2. The product
LUDOX TM-50 Colloidal Silica was not added (Table 4).

19
[V7] Common Plant Protection
This treatment acted as a comparison to common conventional spraying. Different systemic
and non-systemic fungicides were applied to avoid emergence of resistant pathogen
populations.
Amount of application for 48 plants:
Table 6: Detailed information of the common plant protection treatment (V7), the BBCH-code identifies the phenological stages of the grapevine
Date BBCH Product Amount Concentration Water
19-May 17
Polyram WG 9.6 g 0.17%
5.8 l Kumulus 55.2 g 0.95%
Topas 1.8 ml 0.03%
1-Jun 19 Polyram WG 9.6 g 0.13%
7.2 l Prosper 6 ml 0.08%
16-Jun 68
Veriphos 36 ml 0.30%
12 l Delan 700 WG 4.8 g 0.04%
Luna Experience 4.5 ml 0.04%
24-Jun 71 Aktuan Gold 15 g 0.09%
16.8 l Legend Power 16.8 ml 0.10%
5-Jul 75 Enervin 36 g 0.19%
19.2 l Kumar 60 g 0.31%
19-Jul 79 Aktuan Gold 18 g 0.09%
19.2 l Kumar 60 g 0.31%
2-Aug 81
Cuprozin 19.2 g 0.10%
19.2 l Veriphos 48 ml 0.25%
Kumar 60 g 0.31%

20
Plant Protection
Additionally, conventional spraying as foliar spray was applied to all treatments and controls
except for the common plant protection (V7) (Table 6). This basic plant protection was used
depending on weather conditions and infection risk of fungal pathogens. It was planned to
implement silicon applications into an organic viticulture plant protection plan, which uses mainly
copper and sulfur. Due to high infection risk of Plasmopora viticola, Aktuan Gold, a systemic
fungicide, was used once to keep downy mildew at bay.
Amount of basic plant protection applications for 48 plants:
Table 7: Detailed information of the basic plant protection for all treatments.
Date BBCH Product Amount Concentration Water
16-Jun 68 Cuprozin Progress (Copper) 26ml 0.40%
6.5 l Stulln (Sulfur) 45.5g 0.70%
24-Jun 73 Aktuan Gold 40ml 0.40% 10 l
1-Aug 81 Cuprozin Progress (Copper) 50ml 0.40%
12 l Stulln (Sulfur) 85g 0.70%
15-Aug 85 Cuprozin Progress (Copper) 50ml 0.40%
12 l Stulln (Sulfur) 85g 0.70%
Time Table
Figure 5 gives an overview of all actions during the field experiment. Silicon applications of soil
amendment and foliar spray started in week 20 in the mid of May and ended at week 33 in the
mid of August. Soil samples were taken right before soil amendment, after three applications of
silicon and after 6 applications. Leaf samples were taken after each two applications of silicon.
The analysis of photosynthesis was measured 5 times over the vegetation period. Fruit quality
was measured at harvest time.
Figure 5: Time table of all applications and measurements

21
Weather Data
The vegetation period in 2016 was dominated by frequent rainfalls. June and July had three times
higher precipitation than in the year before (Tables 7 and 8). Average relative humidity was in
these months also higher in 2016 compared to 2015. These are two important factors which favor
spreading and infections of fungal pathogens and presented viticulturists with a challenge for
plant protection.
A detailed overview from Vitimeteo, a forecast system for plant protection in viticulture, of daily
rainfalls and fungal infections can be found in the Appendix.
Table 8: Weather data 2015 from Adcon Telmetry Live Data, Krems Landersdorf
Table 9: Weather data 2016 from Adcon Telmetry Live Data, Krems Landersdorf

22
Measurements
Assessment of Fungal Diseases Infections of Powdery Mildew (Uncinula necator) and Downy Mildew (Plasmopara viticola) were
documented at two times during the period according to EPPO standards PP 1/31(3) Plasmopara
viticola and PP 1/4(4) Uncinula necator, which can be found in the Appendix. The first time was
on June 24 where only Downy Mildew was assessed due to a lack of symptoms from Powdery
Mildew. The second assessment was on August 11 where both fungal diseases were monitored.
Figure 8 shows the percentage of infected leaf surface as a guideline for assessing fungal
infections.
To assess percentage of leaf surface and affected bunch
area, the following scale was used to class-divide the
different levels of infection:
1 = no disease
2 = <5%
3 = 5-10%
4 = 10-25%
5 = 25-50%
6 = 50-75%
7 = >75%.
Out of these classes two performance indicators were calculated:
𝑛 .......... number of observation 𝑖 ........... number of class 𝑛(𝑐𝑖) ..... number of observation in class 𝑖
Rate of Infestation: Intensity of Infestation:
Figure 6: Overview of the percentage of abaxial leaf surface affected by downy mildew (EPPO standards PP 1/31(3))

23
Soil Analysis Plant-available and amorphous silicon fractions were analyzed in soil samples collected from the
top (0-30cm) and subsoil (30-60cm) during the vegetation period at three points of time. The
points of time were before the silicon soil amendment, after three silicon applications and after
six silicon applications.
The soil amendment treatments were [V1] Soil Amendment, [V3] Soil Amendment + Foliar Spray
and [V5] Control – watered. Each treatment is divided into 4 fields with 12 plants. From each field
6 soil samples from the top and subsoil were taken and mixed. Samples were taken three times
during the vegetation period. Thus from each treatment 72 (4 fields * 6 samples *3 times) soil
samples from the topsoil and 72 samples of the subsoil were taken. Resulting in total of 12
batches of mixed soil samples from the topsoil and 12 batches of mixed soil samples from the
subsoil from each treatment.
The level of plant-available silicon in soil was analyzed with a CaCl2-extraction method using a
0.01M solution modified from Haysom and Chapman, 1975 and Liang et al., 2015. 2g of air-dried
soil (<2mm) were mixed with 20ml of the 0.01M CaCl2 solution in a tube and were shaken for 16
hours in an overhead shaker and filtrated it with Munktell Ahlstrom paper filters with
a grade of 14/N. The amorphous silicon was extracted with a NaOH-extraction method modified
from Georgiadis et al. (2015). A 0.2M sodium hydroxide solution was used in a ratio of 1:400 and
samples were shaken 120 hours in an overhead shaker. Samples were analyzed in one replicate.
Filtered extracts of both extractions were analyzed colorimetrically with a Varian DMS 200 UV
visible spectrophotometer. This analysis is based on the absorptiometric measurement of
solutions of reduced β-molybdosilicic acid (modified from Morrison and Wilson, 1963).
Detailed descriptions of the used methods can be found in the Appendix.
Leaf Analysis To gain knowledge about the amount of silicon allocated to leaves, samples from mature and
young leaves were taken at three time points. Mature leaves were taken from the fruit zone and
differ in their leaf age from one to another sample time. Young leaves were side shoots of the
same developmental stage. The points of time were after 2, 4 and 6 applications of silicon. From
each treatment 20 old leaves and 40 young leaves were taken at every sampling time.
Leaves were dried at 65°C for 48 hours in an oven. They were ground with a Retsch ball mill to
pass a 20-mesh screen. The amorphous silicon content was extracted by an autoclave-induced
extraction method (modified from Elliot and Snyder, 1991). A 50% H2O2 -Solution and a 50%
NaOH-Solution was added to the plant material and samples were placed in an autoclave at 121°C
with a sterilization phase of 20 minutes. Samples were analyzed in one replicate.

24
Centrifuged (1000 g, 5min, room temperature) extracts were analyzed colorimetrically with a
Varian DMS 200 UV visible spectrophotometer (modified from Morrison and Wilson, 1963).
Detailed descriptions of the used methods can be found in the Appendix.
Analysis of Photosynthesis Hansatech Handy PEA chlorophyll fluorimeter was used for measurement of chlorophyll
fluorescence five times during the vegetation period. Any forms of biotic or abiotic stress which
have an effect on the photosynthetic performance, will change the intensity of the chlorophyll
fluorescence emission. Healthy samples typically achieve a maximum value of Fv/Fm of 0.85.
Plants with lower values are exposed to stress, which reduced the capacity for photochemical
quenching of energy within photosystem II (Hansatech Handy PEA Manual).
When light energy from the sun is absorbed by a chlorophyll molecule within a sample, the
electronic configuration of the molecule is temporarily altered. Photochemical and non-
photochemical processes compete to dissipate the absorbed energy. Photochemical processes
utilize absorbed energy for the photosynthesis, whereas non-photochemical processes dissipate
energy, which is re-emitted in form of infra-red radiation or heat and far-red radiation which is
known as chlorophyll fluorescence. A reduction in the rate of one process leads to an increase of
the other one e.g. a reduction in the dissipation by photochemistry will be reflected in an increase
in energy dissipation by non-photochemical processes such as heat and chlorophyll fluorescence
(Emerson et al, 1932).
The parameter Fv/Fm describes the maximum quantum efficiency of photosystem II and the
photosynthetic performance. It is presented as the ratio of variable fluorescence (Fv) and the
maximum fluorescence value (Fm). It is therefore important that measurements are taken at
same environmental conditions (Hansatech Handy PEA Manual)

25
Fruit Quality Parameters For the analysis of the quality parameters 30 grapes of each treatment and field were picked at
the end of the growing season, crushed and analyzed with a fourier transform infrared
spectroscopy (FTIR) OenoFoss™. The must weight, the density, the acidity, the pH-value, the
amount of tartaric, malic, acetic and gluconic acid and the amount of alpha amino were gained
from this analysis.
The must weight was measured as Klosterneuburger Zuckergrade (°KMW). The must weight is a
measure of the amount of sugar in grape juice. Hence indicating the amount of alcohol that could
be produced if it is all fermented to alcohol, rather than left as residual sugar. While must weight
is a commonly used term among wine makers, the physically correct term would be must density.
There was no analysis of the berry weight because of high damage by Peronospora. This infection
led to negative effects on yield formation and therefore it was not possible to compare the
impact of silicon onto the size of the clusters.
Statistical Analysis
Statistical analysis of the data was made with the software IBM SPSS Statistics 23. All data were
tested on normal distribution and homogeneity of variance. A One-Way ANOVA Post Hoc
Multiple Comparison test was used by default to determine differences between the treatments.
If assumptions of normal distribution and homogeneity of variance were violated, Man-Whitney
U Test, a non-parametric test was used.

26
3 Results
Assessment of Fungal Diseases
Powdery Mildew Powdery mildew was assessed on August 11. Prior to this date only few symptoms were visible.
Since the first symptoms appeared, the disease has spread rapidly and intensively. Figure 7 shows
that up to 50% of the clusters were infested by the fungi in the control groups [V5] and [V6].
Although it seemed that both the rate and the intensity of the infestation were lower in the
silicon treated groups, [V1], [V2] and [V3], statistical analysis could not find significant
differences. It can be termed as a trend of reduced infections. Noteworthy to mention is the
lower rate of infestation in [V2] silicon foliar spray compared to the [V7] common plant
protection control group. Although the intensity of infestation in both treatments [V2] and [V7]
is at 10 % and the standard error is similar, statistics could not confirm the findings (α=0.05).
For the analysis in Figure 8 data was grouped to increase the sample size and therefore achieve
better statistical results. The first bar “silicon” comprises [V1] Si-soil amendment, [V2] Si-foliar
spray and [V3] Si-soil amendment and foliar spray. The control groups [V5] and [V6] were merged
in “Control”. The sample size for the common plant protection (CPP) remained the same. The
analysis of grouped data shows that the silicon treatments tended to perform better for the rate
of infestation than the control group, however, the difference was not statistically significant
(α=0.05). The decrease of the intensity of infestation relative to the control group was more
pronounced and statistically significant (α=0.05) in the CPP treatment. Relative to the control,
the intensity of infestation was significantly reduced both in the CPP and silicon. Therefore, silicon
treatments can partly substitute for fungicides while maintaining a similar level of fungal
symptoms.
For the assessment of fungal symptoms on the leaves (Figure 9) no differences, nor clear trends
can be determined. High infections of downy mildew on the leaves aggravated the optical
assessment of powdery mildew. From Figure 9 it can be concluded that no treatment attains
better results in the sense of a lower infection of the leaves.

27
Figure 7: Assessment of powdery mildew of grape clusters on August 11, 2016, One-Way ANOVA Post Hoc Multiple Comparison test was used to determine differences between the treatments, different letters above columns indicate significant differences between treatments, α=0.05, at the same time point of analysis, error bars represent standard error of the mean
Figure 8: Analysis of grouped data for the assessment of powdery mildew of grape clusters on August 11, 2016, One-Way ANOVA Post Hoc Multiple Comparison test was used to determine differences between the treatments, different letters above columns indicate significant differences between treatments, α=0.05, at the same time point of analysis, error bars represent standard error of the mean different letters above columns indicate significant differences between treatments, α=0.05, at the same time point of analysis
aa
aa a a
a
a
a
a
a aa
a
0.00
10.00
20.00
30.00
40.00
50.00
60.00
%
Powdery Mildew, August 11 - Clusters
Intensity of Infestation Rate of Infestation
ab
b
a
a
a
a
0.00
10.00
20.00
30.00
40.00
50.00
60.00
Silicon Control CPP
%
Powdery Mildew, August 11Clusters GROUPED
Intensity of Infestation Rate of Infestation

28
Figure 9: Assessment of powdery mildew of grape leaves on August 11, 2016, One-Way ANOVA Post Hoc Multiple Comparison test was used to determine differences between the treatments, different letters above columns indicate significant differences between treatments, α=0.05, at the same time point of analysis, error bars represent standard error of the mean different letters above columns indicate significant differences between treatments, α=0.05, at the same time point of analysis
aa a
aa
aa
a
a
a
a
a
a
a
0.00
1.00
2.00
3.00
4.00
5.00
6.00
7.00
%
Powdery Mildew, August 11 - Leaves
Intensity of Infestation Rate of Infestation

29
Downy Mildew Downy mildew was assessed twice on June 24 and August 11. At the first time, the rate of
infestation for the clusters was below 15% in all treatments (Figure 10), whereas it increased
tremendously up to 90% at the second assessment (Figure 11).
The cluster assessment on June 24 shown in Figure 10 does not give evidence that the silicon
treatments are superior compared to the control group. Clearly visible is the higher efficiency of
the fungicides in CPP control which is secured statistically for both the intensity and rate of
infestation. The assessment of the grape clusters on August 11 (Figure 11) shows a similar
pattern. Although the difference between CPP and the other treatments decreased for the
intensity and the rate of infestation, it is still significant that fungicide application provided better
protection for downy mildew regarding the rate of instestaton.
Figure 10: Assessment of downy mildew of grape clusters on June 24, 2016, One-Way ANOVA Post Hoc Multiple Comparison test was used to determine differences between the treatments, different letters above columns indicate significant differences between treatments, α=0.05, at the same time point of analysis, error bars represent standard error of the mean different letters above columns indicate significant differences between treatments, α=0.05, at the same time point of analysis
abb
ab ab ab ab
a
ab
b
ab abab ab
a
0.00
5.00
10.00
15.00
20.00
25.00
%
Downy Mildew, June 24 - Clusters
Intensity of Infestation Rate of Infestation

30
Figure 11: Assessment of downy mildew of grape clusters on August 11, 2016, One-Way ANOVA Post Hoc Multiple Comparison test was used to determine differences between the treatments, different letters above columns indicate significant differences between treatments, α=0.05, at the same time point of analysis, error bars represent standard error of the mean different letters above columns indicate significant differences between treatments, α=0.05, at the same time point of analysis
One may conclude from the analysis of the symptoms on the leaves from downy mildew (Figures
12 and 13) that silicon treatments cannot better fight off the fungal pathogen than in the control
group. The systemic fungicides in the CPP group show significantly better results on June 24 for
the rate of infestation. On August 11, both the intensity of infestations and the rate of infestation,
were distinguishable from the other treatments and showed lower infections.
aa
a a a aa
b b b ab abab
a
0.00
10.00
20.00
30.00
40.00
50.00
60.00
70.00
80.00
90.00
100.00
%
Downy Mildew, August 11 - Clusters
Intensity of Infestation Rate of Infestation

31
Figure 12: Assessment of downy mildew of grape leaves on June 24, 2016, One-Way ANOVA Post Hoc Multiple Comparison test was used to determine differences between the treatments, different letters above columns indicate significant differences between treatments, α=0.05, at the same time point of analysis, error bars represent standard error of the mean different letters above columns indicate significant differences between treatments, α=0.05, at the same time point of analysis
Figure 13: Assessment of downy mildew of grape leaves on August 11, 2016, One-Way ANOVA Post Hoc Multiple Comparison test was used to determine differences between the treatments, different letters above columns indicate significant differences between treatments, α=0.05, at the same time point of analysis, error bars represent standard error of the mean different letters above columns indicate significant differences between treatments, α=0.05, at the same time point of analysis
aa
aa
a aa
b
b
b
b
b b
a
0.00
2.00
4.00
6.00
8.00
10.00
12.00
%
Downy Mildew, June 24 - Leaves
Intensity of Infestation Rate of Infestation
bb b b b b
a
ab
b
abb b ab
a
0.00
10.00
20.00
30.00
40.00
50.00
60.00
70.00
80.00
%
Downy Mildew, August 11 - Leaves
Intensity of Infestation Rate of Infestation

32
Silicon Status in Soil
Plant-Available Silicon The efficiency of the silicon soil amendment can be clearly seen in Figure 16, where the level of
plant-available silicon in the topsoil (0-30 cm) is shown. All results fall within the typical range of
0.029 – 0.175 mM plant-available silicon reported in the literature (Epstein, 1994).
The first bar (T1) indicates the soil analysis before the Si applications. At this time no differences
in the level of plant-available silicon could be detected for the treatments. After three Si-
applications (T2) the level of plant-available silicon increased in the Si-soil amendment [V1] and
the Si-soil amendment + foliar spray [V3] significantly relative to the control group [V6], which
remained unchanged. After six Si applications (T3) the level of silicic acid still increased to a higher
level and was significantly different to the [V6] control group. Probably due to higher
temperatures and thus higher microbial activity and dissolution rates the level of silicic acid also
increased in the [V6] control group.
Figure 14: Plant-available silicon in the topsoil, T1: date of sample one on May 17, 2016, T2: date of sample two on July 5, 2016, T3: date of sample three on August 25, 2016, One-Way ANOVA Post Hoc Multiple Comparison test was used to determine differences between the treatments, different letters above columns indicate significant differences between treatments, α=0.05, at the same time point of analysis, error bars represent standard error of the mean different letters above columns indicate significant differences between treatments, α=0.05, at the same time point of analysis
a a a
b b
a
b
b
a
0.000
0.050
0.100
0.150
0.200
0.250
V1 Si Soil V3 Si Soil+Spray V6 Control Soil
mM
PLANT-AVAILABLE SILICONTOP SOIL
T1 T2 T3

33
The plant-available Si fraction in the subsoil (30-60 cm) shows similar trends (Figure 17), whereas
no statistical significance could be detected. In both Si treatments, [V1] and [V3], the level of
plant-available silicon shows an accumulative trend. From the analysis of the topsoil (Figure 16)
and the subsoil (Figure 17) it can be expected that the differences between soil amendment and
control group diminish with increasing depth of the soil.
Figure 15: Plant-available silicon in the subsoil, T1: date of sample one on May 17, 2016, T2: date of sample two on July 5, 2016, T3: date of sample three on August 25, 2016, One-Way ANOVA Post Hoc Multiple Comparison test was used to determine differences between the treatments, different letters above columns indicate significant differences between treatments, α=0.05, at the same time point of analysis, error bars represent standard error of the mean different letters above columns indicate significant differences between treatments, α=0.05, at the same time point of analysis
a a aa a
a
a
a
a
0.000
0.050
0.100
0.150
0.200
0.250
0.300
V1 Si Soil V3 Si Soil+Spray V6 Control Soil
mM
PLANT-AVAILABLE SILICONSUB SOIL
T1 T2 T3

34
Amorphous Silicon The enrichment of the amorphous Si fraction worked well in the topsoil as can be seen in Figure
16. Amorphous Silicon ranges from 1000 to 30000 mg/kg in soil (Epstein, 1994). In the Si-
amended soil treatment [V1], the level of amorphous silicon doubled from 1500 mg/kg (T1) to
3000 mg/kg (T3). For the treatment Si-soil + foliar spray treatment [V3] a similar but less
pronounced trend was observed. The amount in the control group [V6] remained stable over
time.
Figure 16: Amorphous silicon in the topsoil, T1: date of sample one on May 17, 2016, T2: date of sample two on July 5, 2016, T3: date of sample three on August 25, 2016, One-Way ANOVA Post Hoc Multiple Comparison test was used to determine differences between the treatments, different letters above columns indicate significant differences between treatments, α=0.05, at the same time point of analysis, error bars represent standard error of the mean different letters above columns indicate significant differences between treatments, α=0.05, at the same time point of analysis
Significant differences can be found for the subsoil as well (Figure 17). Soil with Si-soil
amendments show increased levels of amorphous silicon compared to the control group.
Compared to the topsoil the amplitude of the rise is not that high in the subsoil, but clearly visible
and statistically significant.
a a a
b b
a
b
b
a
0
500
1000
1500
2000
2500
3000
3500
V1 Si Soil V3 Si Soil+Spray V6 Control Soil
mg/
kg
AMORPHOUS SLICONTOP SOIL
T1 T2 T3

35
Figure 17: Amorphous silicon in the subsoil, T1: date of sample one on May 17, 2016, T2: date of sample two on July 5, 2016, T3: date of sample three on August 25, 2016One-Way ANOVA Post Hoc Multiple Comparison test was used to determine differences between the treatments, different letters above columns indicate significant differences between treatments, α=0.05, at the same time point of analysis, error bars represent standard error of the mean different letters above columns indicate significant differences between treatments, α=0.05, at the same time point of analysis
a a a
b ab
a
b
ab
a
0
500
1000
1500
2000
2500
V1 Si Soil V3 Si Soil+Spray V6 Control Soil
mg/
kg
AMORPHOUS SILICONSUB SOIL
T1 T2 T3

36
Leaf Analysis
The Si concentration of mature leaves (Figure 18) increases with leave age. Clearly visible is the
boost of Si concentrations in the treatments with foliar spray [V2] and the combined soil
amendment + foliar spray [V3]. Since the treatment Si soil amendment [V1] does not show an
increased level of Si compared to the control groups, one can conclude that only the foliar spray
increased the level of Si in the leaves.
Figure 18: Silicon concentrations of mature grapevine leaves. T1: date of sample one on June 21, 2016, T2: date of sample two on July 20, 2016, T3: date of sample three on August 25, 2016, One-Way ANOVA Post Hoc Multiple Comparison test was used to determine differences between the treatments, different letters above columns indicate significant differences between treatments, α=0.05, at the same time point of analysis, error bars represent standard error of the mean different letters above columns indicate significant differences between treatments, α=0.05, at the same time point of analysis
The Si level in young leaves was initially much lower at around 200 mg/kg (Figure 19) than for
mature leaves which were general > 1000 mg/kg. At time T2, the treatments [V2] and [V3]
exceeded 1000 mg/kg also in younger leaved and were statistically distinguishable from the
control groups [V5] and [V6]. Surprising is the last sample at T3 where all treatments show highly
elevated amounts of Si and the treatments [V2] and [V3] even surpass the Si levels of the mature
leaves.
Noteworthy is the significant difference between Si-foliar spray [V2] and the soil amendment +
foliar spray [V3] at time T3. Although the soil amendment in [V1] does not show elevated levels
of foliar Si, the combination of soil amendment and foliar spray in treatment [V3] seems to
further increase the silicon deposits in the leaves.
ab b
a a a
a
b b
a a ab
bb
a a a
0.00
2000.00
4000.00
6000.00
8000.00
10000.00
12000.00
V1 Si Soil V2 Si Spray V3 SiSoil+Spray
V4 Horsetail V5 ControlSoil
V6 ControlSpray
mg/
kg
SILICON IN MATURE LEAVES
T1 T2 T3

37
Figure 19: Silicon concentrations of young grapevine leaves, T1: date of sample one on June 21, 2016, T2: date of sample two on July 20, 2016, T3: date of sample three on August 25, 2016, One-Way ANOVA Post Hoc Multiple Comparison test was used to determine differences between the treatments, different letters above columns indicate significant differences between treatments, α=0.05, at the same time point of analysis, error bars represent standard error of the mean different letters above columns indicate significant differences between treatments, α=0.05, at the same time point of analysis
a a a a b ababc bc abc a a
a
b
c
a a a
0.00
2000.00
4000.00
6000.00
8000.00
10000.00
12000.00
V1 Si Soil V2 Si Spray V3 SiSoil+Spray
V4 Horsetail V5 ControlSoil
V6 ControlSpray
mg/
kg
SILICON IN YOUNG LEAVES
T1 T2 T3

38
Photosynthesis
The results of the chlorophyll fluorescence for mature leaves (Figure 20) showed at times T3 and
T4 significant reductions in the CPP control group [V7]. The analysis of the chlorophyll
fluorescence of young leaves (Figure 21) shows similar results. There is no data in T1 because the
first appearing grapevine leaves are included in the mature leaves.
Figure 20: Chlorophyll florescence of mature grapevine leaves, T1: date of sample one on May 30, 2016, T2: date of sample two on June 16, 2016, T3: date of sample three on July 5, 2016, T4: date of sample four July 28, 2016, T5: date of sample five on August 16, 2016, One-Way ANOVA Post Hoc Multiple Comparison test was used to determine differences between the treatments, different letters above columns indicate significant differences between treatments, α=0.05, at the same time point of analysis, error bars represent standard error of the mean different letters above columns indicate significant differences between treatments, α=0.05, at the same time point of analysis
Figure 21: Chlorophyll florescence of young grapevine leaves, T1: date of sample one on May 30, 2016, T2: date of sample two on June 16, 2016, T3: date of sample three on July 5, 2016, T4: date of sample four July 28, 2016, T5: date of sample five on August 16, 2016, One-Way ANOVA Post Hoc Multiple Comparison test was used to determine differences between the treatments, different letters above columns indicate significant differences between treatments, α=0.05, at the same time point of analysis, error bars represent standard error of the mean different letters above columns indicate significant differences between treatments, α=0.05, at the same time point of analysis
a
a b ab a
a
a b b a
a
a
b ab
a
a
a ab ab
a
a
a b ab
a
a
a b ab
a
a
a a
a
a
0.00
0.20
0.40
0.60
0.80
1.00
T 1 T 2 T 3 T 4 T 5
Fv/F
m
CHLOROPHYLL FLUORESCENCEMATURE LEAVES
Si Soil Si Spray Si Soil+Spray Horsetail Control Soil Control Spray CPP
a
a ab
a
ab
a ab ab
a
a ab ab
ab
a ab ab
ab
a
ab ab
a
a
b b
b a
a a
0.00
0.20
0.40
0.60
0.80
1.00
T 2 T 3 T 4 T 5
Fv/F
m
CHLOROPHYLL FLUORESCENCEYOUNG LEAVES
Si Soil Si Spray Si Soil+Spray Horsetail Control Soil Control Spray CPP

39
Fruit Quality Parameters
The analysis of the fruit quality parameters gives a consistent picture. There is no treatment
which enhances the quality of one or more parameters of the fruit juice (Table 7). The only
exception is the amount of alpha amino acids (Figure 22) when grouped into categories “Silicon”,
“Control” and “CPP”. Silicon treated vines show elevated values of amino acids compared to the
control group and CPP.
Treatment °KMW Density pH Acidity
(g/l) Tartaric Acid
(g/l) Malic Acid
(g/l) Acetic Acid
(g/l) Gluconic Acid
(g/l) Alpha Amino
(mg/l)
V1 15.73 1.08 3.10 8.73 7.74 3.34 0.01 0.56 193.60
V2 15.98 1.08 3.11 9.05 7.81 3.79 0.04 0.56 192.90
V3 15.78 1.17 3.12 8.83 7.73 3.66 0.03 0.65 186.18
V4 15.93 1.08 3.12 8.93 7.80 3.74 0.04 0.60 188.65
V5 15.83 1.08 3.09 9.14 7.96 3.80 0.03 0.53 175.74
V6 15.33 1.08 3.11 8.96 7.65 3.61 0.02 0.49 180.61
V7 15.35 1.16 3.12 8.65 7.59 3.34 0.03 0.44 157.39
Table 10: Means of fruit quality parameters
Figure 22: Analysis of alpha amino acids in the fruit juice, One-Way ANOVA Post Hoc Multiple Comparison test was used to determine differences between the treatments, different letters above columns indicate significant differences between treatments, α=0.05, at the same time point of analysis, error bars represent standard error of the mean different letters above columns indicate significant differences between treatments, α=0.05, at the same time point of analysis
bab
a
0.00
50.00
100.00
150.00
200.00
250.00
Silicon Control CPP
mg/
l
ALPHA AMINO ACIDS

40
4 Discussion
Silicon application could be a promising approach for sustainable, environmentally sound and
broad-spectrum control of fungal diseases in viticulture like it already is in other agricultural
contexts. Applications of silicon can enhance the resistance of certain susceptible cultivars to the
same level as those that have complete genetic resistance (Sakr, 2016). Since the effect on
enhancing plant resistance against fungal pathogens is not limited to high Si accumulators, this
thesis has been carried out to investigate the protective role of Si for grapevine, a low Si-
accumuator. We tested one of the two mechanisms of silicon-enhanced fungal resistance based
on higher silicon deposits in the plant.
Colloidal Silica as a 50% wt. suspension in water was used for the soil amendment and the foliar
spray. The advantage of this product is that no influence of other nutrients is given like in other
Si-fertilizers, which can contain potassium or calcium for example. However, slag-based silicate
fertilizers are more cost-effective. In the field more attention should be paid for slag-based
silicates due to their potential environmental risks which may arise from the heavy metals
contained in the fertilizers. Soluble potassium or sodium silicates are completely water soluble
and can be used as foliar fertilizers, but are usually too expensive for soil application. Slow-
releasing potassium-containing or potassium-rich silicates that are manufactured using feldspar
as raw materials are not only cost-effective and agriculturally effective but also environmentally
friendly.
During the vegetation period 2016 a high risk of fungal infections was given. This led to an
extreme spread of downy and powdery mildew for grapevine and brought all plant protection
products to their limits. The optical assessment of one disease was aggravated by the symptoms
of the other and made it difficult for the assessing persons to identify coinfections. Nonetheless
there is evidence that Si-treated grapes showed a trend towards less infection for powdery
mildew. Silicon treatments can partly substitute for fungicides while maintaining a similar level
of fungal symptoms. For downy mildew, no differences in the extent of symptoms could be
determined. The findings conform to Reynolds et al. (1995) and Bowen et al. (1992) who also
detected reduced powdery mildew infections for Si-sprayed vines compared to a non-treated
control.
The content concentration of leaves only increased with the silica foliar spray. The obtained
results from the analysis of the Si deposits in the leaves are in the range of the findings of Lafos
(1995), who studied the uptake of silicon for grapevine. The silicon concentrations of foliar
treatments fluctuated between 170 – 15,800 mg/kg and average at 2,150 mg/kg dry mass.
Comparing this with the maximum values of 10,000 mg/kg for mature leaves, leads to the
conclusion that the amount of the foliar applied silicon could have been higher concentrated. It
can also be possible that the uptake of the leaf was too slow for gaining even higher levels and
applied silicon got washed up by precipitation. Mature leaves correlate in both studies with leaf

41
age and the number of Si applications, thus confirming that silicon is transported in the xylem
and is accumulated in the leaves. The Si concentration in young leaves at the same
developmental stage increased with the number of foliar Si applications. Blaich and Grundhöfer,
(1998) found substantially more Si deposits in infected compared to uninfected leaves. They
suggested that this might be a mechanism to fight off penetrating mycelium by the localized
accumulation of silicates in the cell wall (Blaich and Wind, 1989). The enormous increase in Si
deposits at the last sample date of the young leaves can be associated with the defense
mechanism due to a prior period of high infections.
Lafos (1995) stated also a 10% reduction of powdery mildew upon Si fertilization compared to a
non-treated control group in the greenhouse, which could not be confirmed in our field
experiment. Comparing the content of silicon in the soil with the amount of silicon soil
amendment of 2.5t silica per hectare shows that it was sufficient. The plant-available silicon was
raised significantly to a high level. Unfertilized soils range from 0.029 to 0.175 mM plant-available
silicon (Epstein, 1994), whereas the soil in the Si-fertilized treatments showed levels of up to
0.190 mM in the topsoil. In the subsoil a minor increase could be detected. Referring to the
amorphous silicon fraction, the amount of 2.5t silica per hectare increased the level of 1,500 up
to 3,000 mg/kg. Compared to the range of 1,000 to 30,000 mg/kg amorphous silicon in soils
(Epstein, 1994) this amount is low. An increase in plant-available silicon due to hydration of
amorphous silicon can be expected in the next years. Although the amendment of the soil worked
well for both Si fractions in the topsoil, the effect was always less pronounced in the subsoil.
Accordingly, it can be expected that parts of the roots in the deeply rooted loess soil did not
benefit from the silicon applied to the soil during the vegetation period.
The horsetail extraction treatment showed neither increased levels of Si in the leaves nor
reduced mildew symptoms. Since no detailed analysis of the specific compounds of the horsetail
extraction product is available one can only speculate why an increased silicon concentration
could not be detected. The silicon availability could be lower than for the LUDOX colloidal silica
suspension. Furthermore, the horsetail extract could contain amorphous phytoliths, which show
lower plant-availability. The application was conducted according to the guideline for the product
for viticulture. In addition, no increased photosynthetic activity was observed for this treatment.
Overall no enhanced photosynthetic activity could be determined for any treatment. However,
the common plant protection treatment showed reduced photosynthetic activity at two out of
five dates. These dates correspond to a time of high systemic fungicide applications for this
treatment and make it evident that intense spraying of systemic fungicides disturbs the plants
physiology.
Silicon applications did not increase sugar content or acidity levels of the berries. Due to generally
high damage caused by downy mildew, the weight of the clusters could not be determined and
compared between the treatments. Differences in the level of amino acids were found and were
higher for the Si-treated grapes. Low values of amino acids, also termed yeast-assimilable
nitrogen (YAN), are the cause of sluggish fermentations often leading to off-flavors in the wine

42
(Ribéreau-Gayon et al., 2006). Reduced levels of YAN are associated with bunch rot on the grapes
or with vines suffering from drought conditions (Ribéreau-Gayon et al., 2006). Applying silica to
gain higher levels of YAN could provide a welcomed tool especially in view of expected
temperature rise caused by global warming. Additionally, referring to bunch rot, another fungal
pathogen for grapevine which consumes amino acids, increased levels of YAN could be a hint for
another potential fungal pathogen, which could be alleviated by silica applications.
Although foliar Si application may be effective in reducing many foliar diseases, applying silicon
to the roots through the soil pathway may be even more effective because it mediates the plant’s
defense responses to both foliar and root infections (Datnoff et al., 2015). Only when applied to
the roots, Si will change plant responses to pathogen infections at both the physiological and
molecular level. This implies an active role for Si in one or more plant defense signaling pathways.
Therefore, it is necessary to find a better way to fertilize vines in the field with Si. A plain
alternative is to run the experiment on a site with low soil depth, where root growth is constricted
by underlying rocks and are forced to develop near the surface of the soil. Fertilizing silica will
then lead to an increased concentration of silicic acid in the main root zone. Another approach is
to get the silica into deeper soil layers by letting it flow through a dug pipe to the right spot. A
third idea is letting the silicic acid get transported into deeper layers by precipitation over time.
However, this method is time consuming and could take years to reach a favored concentration
of silicic acid also in the deeper root zone.
The uptake by the roots would support a continuous enrichment, which is important for the
disease-suppressing effects. These will be reduced or non-existent if the continuity is disturbed.
For any plant disease, a minimum silicon concentration is needed to suppress a disease. Once
that level has been obtained, plant disease suppression increases proportionally as the silicon
concentration increases in plant tissues (Datnoff et al., 2015). Therefore, it is substantial that this
level of minimum silicon concentration is met early in the vegetation period to fully protect the
vines from mildew infections. The time for the highest infection risk for grapevine is from pre-
flowering (BBCH 60) to pea-sized berries (BBCH 75). Intensive silica foliar applications early in the
season combined with a sap flow enriched with silicic acid taken up from the root zone are
probably crucial for sufficient protection.
An analysis of biochemical defense mechanisms of the vines would have exceeded the workload
of this thesis. Nevertheless, some thoughts can be given to it. Plants supplied with Si exhibit
potentiated activation of the phenylpropanoid pathway resulting in increases in total soluble
phenolics and lignin (Datnoff et al., 2015). Although playing an important role for defense,
increased levels of phenolics in grape berries could have a negative impact on the wine due to
bitter compounds (Ribéreau-Gayon et al., 2006). The activities of defense enzymes in Si-treated
plants, such as chitinases and β-1,3-glucanases, are maintained at higher levels during infection
and the transcription of defense-related genes occurs faster and with greater output (Datnoff et
al., 2015). These PR proteins are significantly increased in powdery mildew infected grape leaves

43
and pre-veraison berries and it was shown that they can cause lysis of E. necator germ tubes in
vitro (Gadoury et al., 2012).
Further research in this field should focus on the biochemical defense mechanisms of grapevine
like PR-proteins and phytoalexins and the expression of genes associated with these defense
mechanisms. Systemically acquired resistance (SAR) or induced systemic resistance (ISR)
pathways are associated with higher levels of salicylic acid, jasmonic acid and ethylene, which
have been reported to be induced by Si supplements in a number of host-pathogen interactions
(Tubana et al., 2015) and could also be of major interest in viticulture. Moreover, an overview of
different vineyard soils focusing on the levels of silicon fractions would give new inputs for soil-
plant-interactions and will bring light into possible Si deficiencies.
Since the introduction of pests for grapevine Vitis vinifera in the middle of the 19th century in
Europe, much effort has been put into plant protection strategies. Nowadays intensive use of
chemical protection, with all its negative side effects, is still the most widespread approach to
control fungal pathogens in viticulture. This study tried to find an alternative approach using silica
as controlling agent for powdery and downy mildew. Photosynthetic measurements confirm that
systemic fungicides do not only harm the environment, but also hinder the vine’s physiology by
inducing abiotic stress. However, fungal assessments in our study determined a trend of reduced
infections of powdery mildew in silica treatments. Closer intervals and better timed applications
will potentially foster the effectiveness of silica foliar sprays.

44
5 Literature
Apel, K., & Hirt, H. (2004). Reactive oxygen species: metabolism, oxidative stress, and signal transduction. Annual Review Plant Biology, 55, 373-399.
Arnon, D. I., & Stout, P. R. (1939). The essentiality of certain elements in minute quantity for plants with special reference to copper. Plant physiology, 14(2), 371.
Bauer, K., Regner, F., Schildberger, B. (2015). Weinbau. 10. Auflage. avBuch im Cadmos Verlag, Wien
Bityutskii, N., Kaidun, P., & Yakkonen, K. (2016). Earthworms can increase mobility and bioavailability of silicon in soil. Soil Biology and Biochemistry, 99, 47-53.
Blaich, R., & Grundhöfer, H. (1998). The influence of silica fertilization on the resistance of grapevines to powdery mildew. Vitis, 37(1), 21–26.
Blaich, R., & Grundhöfer, H. (1997). Uptake of silica by grapevines from soil and recirculating nutrient solutions. Vitis, 36(4), 161.
Blaich, R., & Wind, R. (1989). Inducible silica incrusts in cell walls of Vitis leaves. Vitis, 28(2), 73-80.
Blum, W. E., Spiegel, H., & Wenzel, W. W. (1996). Bodenzustandsinventur: Konzeption, Durchführung und Bewertung; Empfehlungen zur Vereinheitlichung der Vorgangsweise in Österreich. Institut für Bodenforschung, Univ. für Bodenkultur Wien.
Bowen, P. a., Menzies, J. G., & Ehret, D. L. (1992). Soluble Silicon Sprays Inhibit Powdery Mildew on grape leaves. Journal of the American Society for Horticultural Science, 117(6), 906–912.
Cai, K., Gao, D., Chen, J., & Luo, S. (2009). Probing the mechanisms of silicon-mediated pathogen resistance. Plant Signaling & Behavior, 4(1), 1–3.
Cooke, J., & Leishman, M. R. (2011). Is plant ecology more siliceous than we realise? Trends in plant science, 16(2), 61-68.
Cornelis, J. T., Delvaux, B., Georg, R. B., Lucas, Y., Ranger, J., & Opfergelt, S. (2011). Tracing the origin of dissolved silicon transferred from various soil-plant systems towards rivers: a review. Biogeosciences, 8(1), 89-112.
Currie, H. A., & Perry, C. C. (2007). Silica in plants: Biological, biochemical and chemical studies. Annals of Botany, 100(7), 1383–1389.

45
Dagostin, S., Schärer, H. J., Pertot, I., & Tamm, L. (2011). Are there alternatives to copper for controlling grapevine downy mildew in organic viticulture? Crop protection, 30(7), 776-788.
Datnoff, L.E. and Heckman, J.R. (2014). Silicon fertilizers for plant disease protection. In Proceedings of the 16th World Fertilizer Congress of CIECRio. De Janeiro-RJ, Brazil, 20-24 October, p. 37-38.
Datnoff, L. E., Elmer, W. H., & Huber, D. M. (2007a). Mineral nutrition and plant disease. American Phytopathological Society (APS Press)
Datnoff, L. E., & Rodrigues, F. A. (2015). Highlights and Prospects for Using Silicon in the Future. In Silicon and Plant Diseases (pp. 139-145). Springer International Publishing.
Datnoff, L. E., Rodrigues, F. A., & Seebold, K. W. (2007b). Silicon and plant disease. Mineral nutrition and plant disease. Springer International Publishing, Switzerland
Datnoff, L. E., Snyder, G. H., & Korndörfer, G. H. (Eds.). (2001). Silicon in agriculture (Vol. 8). Elsevier
The European Commission. (2002). Commission Regulation (EC) No 753/2002 of 29 April 2002 on laying down certain rules for applying Council Regulation (EC) No 1493/1999 as regards the description, designation, presentation and protection of certain wine sector products. The European Commission, (OJ L 118, 4.5.2002, p. 1)
The European Commission. (2007). Council Regulation (EC) No 834/2007 of 28 June 2007 on organic production and labelling of organic products and repealing Regulation (EEC) No 2092/91. The European Commission, (O.J. L 189, 20.07.2007, p. 1)
Elliott, C. L., & Snyder, G. H. (1991). Autoclave-induced digestion for the colorimetric determination of silicon in rice straw. Journal of Agricultural and Food Chemistry, 39(6), 1118-1119.
Emerson, R., & Arnold, W. (1932). The photochemical reaction in photosynthesis. The Journal of general physiology, 16(2), 191-205.
Epstein, E. (2009a). Silicon: Its manifold roles in plants. Annals of Applied Biology, 155(2), 155–160.
Epstein, E. (2009b). Plant nutrition, plant stress, and plant silicon. Comparative Biochemistry and Physiology Part A: Molecular & Integrative Physiology, 153(2), S185-S186.
Epstein, E. (1999c). Silicon. Annual Reviews of Plant Physiology and Plant Molecular Biology, 50, 641–664.

46
Epstein, E. (1994). The anomaly of silicon in plant biology. Proceedings of the National Academy of Sciences of the United States of America, 91(1), 11–17.
Fauteux, F., Rémus-Borel, W., Menzies, J. G., & Bélanger, R. R. (2005). Silicon and plant disease resistance against pathogenic fungi. FEMS Microbiology letters, 249(1), 1-6.
Food and Agriculture Organisation of the United Nations (2015). World reference base for soil resources 2014. International soil classification system for naming soils and creating legends for soil maps - Update 2015. World Soil Resources Reports, Series number: no. 106. #203 p. FAO, Rome
Garibaldi, A., Gilardi, G., Cogliati, E. E., & Gullino, M. L. (2012). Silicon and increased electrical conductivity reduce downy mildew of soilless grown lettuce. European journal of plant pathology, 132(1), 123-132.
Georgiadis, A., Sauer, D., Breuer, J., Herrmann, L., Rennert, T., & Stahr, K. (2015). Optimising the extraction of amorphous silica by NaOH from soils of temperate-humid climate. Soil Research, 53(4), 392-400.
Gessler, C., Pertot, I., & Perazzolli, M. (2011). Plasmopara viticola: a review of knowledge on downy mildew of grapevine and effective disease management. Phytopathologia Mediterranea, 50(1), 3-44.
Hallmann, J., Quadt-Hallmann, A., & von Tiedemann, A. (2009). Phytomedizin: Grundwissen Bachelor (Vol. 2863). UTB.
Haysom, M. B. C., & Chapman, L. S. (1975). Some aspects of the calcium silicate trials at Mackay. In Proceedings.
Heintz, C., & Blaich, R. (1989). Structural characters of epidermal cell walls and resistance to powdery mildew of different grapevine cultivars. Vitis, 28(3), 153-60.
Hull, R. (1999). Properties of crystalline silicon (No. 20). IET.
Keller C, Guntzer F, Barboni D, et al. (2012) Impact of agriculture on the Si biogeochemical cycle: Input from phytolith studies. Comptes Rendus - Geoscience 344: 739-746.
Keller, M. (2010). The Science of Grapevines: Anatomy and Physiology. In The Science of Grapevines, London: Academic Press.
Morrison, I. R., & Wilson, A. L. (1963). The absorptiometric determination of silicon in water. Part II. Method for determining “reactive” silicon in power-station waters. Analyst, 88 (1043), 100-104.

47
Kemp, M. S., & Burden, R. S. (1986). Phytoalexins and stress metabolites in the sapwood of trees. Phytochemistry, 25(6), 1261-1269.Liang, Y., Sun, W., Zhu, Y. G., & Christie, P. (2007). Mechanisms of silicon-mediated alleviation of abiotic stresses in higher plants: A review. Environmental Pollution, 147(2), 422–428.
Lafos, K. (1995). Die Aufnahme und Verteilung von Silicium in Reben (Vitis spp.). Diss. Geisenheimer Berichte, (22).
Leusch, H. J. (1986). Untersuchungen zum Einfluss von Bodenbehandlungen mit Huttenkalk und Natriumtrisilikat sowie von Spritzbehandlungen mit Silizium-reichen Verbindungen auf den Befall von Weizen und Gerste mit pilzlichen Krankheitserregern. IV, 136 S., Bonn, Univ., Diss., 1986
Liang, Y., Nikolic, M., Bélanger, R., Gong, H., & Song, A. (2015). Silicon in Agriculture. Springer, Dordrecht.
Ma, J.F. and Takahashi, E. (2002). Soil, fertilizer, and plant silicon research in Japan. Elsevier Science, Amsterdam, The Netherlands, 294 p.
Ma, J. F., & Yamaji, N. (2006). Silicon uptake and accumulation in higher plants. Trends in Plant Science, 11(8), 392–397.
Matichenkov, V. V., & Bocharnikova, E. A. (2001). The relationship between silicon and soil physical and chemical properties. Studies in Plant Science, 8, 209-219.
Miller, R. W., & Donahue, R. L. (1990). Soils: an introduction to soils and plant growth (No. Ed. 6). Prentice-Hall International Inc.
Monger, H.C., Kelly, E.F. (2002). Silica minerals. In: Soil Mineralogy with environmental applications. Soil Science Society of America, Madison, pp 611–636.
ÖNORM, L. (1999). 1061-2 (2002): Physikalische Bodenuntersuchungen–Bestimmung der Korngrößenverteilung des Mineralbodens; Teil 2: Feinboden. Wien: Österreichisches Normungsinstitut.
Qin, L., Kang, W., Qi, Y., Zhang, Z., & Wang, N. (2016). The influence of silicon application on growth and photosynthesis response of salt stressed grapevines (Vitis vinifera L.). Acta Physiologiae Plantarum, 38(3), 1–9.
Reynolds, A. G., Veto, L. J., Sholberg, P. L., Wardle, D. A., & Haag, P. (1996). Use of potassium silicate for the control of powdery mildew [Uncinula necator (Schwein) Burrill] in Vitis vinifera L. cultivar Bacchus. American journal of enology and viticulture, 47(4), 421-428.

48
Ribéreau-Gayon, P., Dubourdieu, D., Donèche, B., & Lonvaud, A. (Eds.). (2006). Handbook of enology, the microbiology of wine and vinifications (Vol. 1). John Wiley & Sons.
Richmond, K. E., & Sussman, M. (2003). Got silicon? The non-essential beneficial plant nutrient. Current Opinion in Plant Biology, 6(3), 268–272.
Rodrigues F. A., R. S. Resende, L. J. Dallgnol, and L. E. Datnoff. 2015. Silicon potentiates host defense mechanisms against infection by plant pathogens. In: Silicon and Plant Disease. Springer International Publishing, Switzerland, pp. 109–138.
Rouse, J. W., R. H. Haas, J. A. Schell, and D. W. Deering (1973). Monitoring vegetation systems in the Great Plains with ERTS, Third ERTS Symposium, NASA SP-351 I, 309-317.
Sakr, N. (2016). The role of silicon (Si) in increasing plant resistance against fungal diseases. Hellenic Plant Protection Journal, 9(1), 1–15.
Schaller, K., Löhnertz, O., & Muskat, S. (1990). Anreicherung von Silizium in den Blättern von Müller-Thurgau und Silvaner im Verlaufe zweier Vegetationsperioden und in Abhängigkeit einer Silikatdüngung. Wein-Wissenschaft, 45, 128-134.
Soylemezoglu, G., Demir, K., Inal, A., & Gunes, A. (2009). Effect of silicon on antioxidant and stomatal response of two grapevines (Vitis vinifera L.) rootstocks grown in boron toxic, saline and boron toxic-saline soil. Scientia Horticulturae, 123(2), 240–246.
Thomas, E. (2006). Feldversuchswesen. UTB.
Tubaña, B. S., & Heckman, J. R. (2015). Silicon in Soils and Plants. In Silicon and Plant Diseases (pp. 7-51). Springer International Publishing, Switzerland
Tubana, B. S., Babu, T., & Datnoff, L. E. (2016). A Review of Silicon in Soils and Plants and Its Role in US Agriculture: History and Future Perspectives. Soil Science, 181(9/10), 393-411.
Van Bockhaven, J., De Vleesschauwer, D., & Höfte, M. (2013). Towards establishing broad-spectrum disease resistance in plants: silicon leads the way. Journal of experimental botany, 64(5), 1281-1293.
Van Loon, L. C. (1985). Pathogenesis-related proteins. Plant Molecular Biology, 4(2), 111-116.

49
6 Appendix
EPPO Standard Uncinula necator PP 1/4(4) European and Mediterranean Plant Protection Organization Organisation Européenne et Méditerranéenne pour la Protection des Plantes
PP 1/4(4) Efficacy evaluation of fungicides Uncinula necator Specific scope This standard describes the conduct of trials for the efficacy evaluation of fungicides against Uncinula necator, causing powdery mildew of grapevine.
1. Experimental conditions 1.1 Test organisms, selection of crop and cultivar Test organism: Uncinula necator (UNCINE). Only productive grapevine Vitis vinifera (VITVI) of the same susceptible cultivar, rootstock habit and age, should be used. 1.2 Trial conditions The trial should be set up in the field. The vineyard should be homogeneous in cultivar, age, plant width, training system, rootstock and general cultivation and health status. Cultural conditions (e.g. soil type, fertilization) should be uniform for all plots of the trial and should conform with local agricultural practice. Microclimate conditions should as far as possible be homogeneous, particularly with respect to altitude, slope and wind exposure. The trial should form part of a trial series carried out in different regions with distinct environmental conditions and preferably in different years or growing seasons (see EPPO Standard PP 1/181 Conduct and reporting of efficacy evaluation trials). 1.3 Design and lay-out of the trial Treatments: test product(s), reference product and untreated control, arranged in a suitable statistical design. Plot size (net): at least 10 vines (or sufficient to provide at least 100 leaves and at least 50 bunches for assessment, as in 3.2) on 3 rows. Sample size may be increased (e.g. 150 leaves and 100 bunches) if the intensity of the disease is not expected to be high. Replicates: at least 4. For further information on trial
Specific approval and amendment First approved in 1977-09. Revision approved in 1987-09. Aligned with revised standard text in 1996. Revision approved in 2001-09. 2. Application of treatments 2.1 Test product(s) The product(s) under investigation should be the named formulated product(s) (see EPPO Standard PP 1/181 Conduct and reporting of efficacy evaluation trials). 2.2 Reference product The reference product should be a product known to be satisfactory in practice under the agricultural, plant health and environmental (including climatic) conditions in the area of intended use. In general, type of action, time of application and method of application should be as close as possible to those of the test product. 2.3 Mode of application Applications should comply with good standard practice. 2.3.1 Type of application The type of application (e.g. a spray or a dust) should be as specified for the intended use. 2.3.2 Type of equipment Application(s) should be made with equipment which provides an even distribution of product on the whole plot or accurate directional application where appropriate, equivalent to good commercial practice. Factors which may affect efficacy (such as operating pressure, nozzle type) should be chosen in relation to the intended use.

50
2.3.3 Time and frequency of application The number of applications and the date of each application should be as specified for the intended use. The 1st application is normally made at BBCH growth stage 13-14 (3-4 leaves unfolded). 2.3.4 Doses and volumes The product should normally be applied at the dosage specified for the intended use. Doses higher or lower than the intended dose may be tested to determine the margin of effectiveness and crop safety. The dosage applied should normally be expressed in kg (or L) of formulated product per ha. It may also be useful to record the dose in g of active substance per ha. For sprays, data on concentration (%) and volume (L ha-1) should also be given. Deviations from the intended dosage should be noted. 2.3.5 Data on other plant protection products If other plant protection products (or any biocontrol agents) have to be used, they should be applied uniformly to all plots, separately from the test product and reference product. Possible interference with these should be kept to a minimum. 3. Mode of assessment, recording and Measurements 3.1 Meteorological and edaphic data 3.1.1 Meteorological data On the days before and after application, meteorological data should be recorded which is likely to affect the development of the crop and/or pest and the action of the plant protection product. This normally includes data on precipitation and temperature. All data should preferably be recorded on the trial site, but may be obtained from a nearby meteorological station. On the date of application, meteorological data should be recorded which is likely to affect the quality and persistence of the treatment. This normally includes at least precipitation (type and amount in mm) and temperature (average, maximum, minimum in °C). Any significant change in weather should be noted, and in particular its time relative to the time of application. Throughout the trial period, extreme weather conditions, such as severe or prolonged drought, heavy rain, late frosts, hail, etc., which are likely to influence the results, should also be reported. All data concerning irrigation should be recorded as appropriate. 3.1.2 Edaphic data Not required.
3.2 Type, time and frequency of assessment The BBCH growth stage of the crop at each date of application and assessment should be recorded. 3.2.1 Type Assessment on leaves For each plot, the percentage of leaf area affected should be assessed on at least 100 leaves randomly selected, from the same position on the shoot. Assessment on fruits For each plot, the percentage infected area of at least 50 randomly selected bunches should be assessed. See Appendix I for scales that may be used. 3.2.2 Time and frequency Assessment on leaves A preliminary assessment is made immediately before application, and a final assessment is made at berry ripening (BBCH 81-89). Intermediate assessments may be made. Assessment on fruits Assessments are made at the fruitsetting stage (BBCH 71) and at the beginning of ripening (BBCH 81). An additional assessment may be useful at the end of ripening (BBCH 89). 3.3 Direct effects on the crop The crop should be examined for the presence of phytotoxic effects (or visible remains of the product). In addition, any positive effects should be noted. The type and extent of such effects on the crop should be recorded and, if there are no effects, this fact should also be recorded. Phytotoxicity should be scored as follows:
(1) if the effect can be counted or measured, it should be expressed in absolute figures; (2) in other cases, the frequency and intensity of damage should be estimated. This may be done in either of two ways: each plot is scored for phytotoxicity by reference to a scale, or each treated plot is compared with an untreated plot and percentage phytotoxicity estimated.
In all cases, symptoms of damage to the crop should be accurately described (stunting, chlorosis, deformation, etc.). For further details, see EPPO Standard PP 1/135 Phytotoxicity assessment which contains sections on individual crops. It may be useful to assess effects on oenological and organoleptic quality using appropriate methodology (see EPPO Standard on oenological testing, in preparation); such information may come from an additional trial. In particular, attention should be paid

51
to palatability and flavour of table grapes. 3.4 Effects on non-target organisms 3.4.1 Effects on other pests Any observed effects, positive or negative, on the incidence of other pests should be recorded. 3.4.2 Effects on other non-target organisms Any observed effects, positive or negative, on naturally occurring or introduced pollinators or natural enemies should be recorded. Any observed effect, positive or negative, on adjacent or succeeding crops should be recorded. Any environmental effects should also be recorded, especially effects on wildlife. 3.5 Quantitative and qualitative recording of yield Not required. The grapes harvested in the various plots may be weighed but extrapolation of the data is only valid if the vineyard is homogeneous. 4. Results The results should be reported in a systematic form and the report should include an analysis and evaluation. Original (raw) data should be available. Statistical analysis should normally be used, by appropriate methods which should be indicated. If statistical analysis is not used, this should be justified. See EPPO Standard PP 1/152 Design and analysis of efficacy evaluation trials
Appendix I To assess percentage of leaf surface and bunch area affected, a scale such as the following may be used and should be described: 1 = no disease; 2 = <5%; 3 = 5-10%; 4 = 10-25%; 5 = 25-50%; 6 = 50-75%; 7 = >75%. (from EPPO Standard PP 1/31 Plasmopara viticola) 1 = no disease; 2 = 1-5 %; 3 = 5-25 %; 4 = 25-50%; 5 = >50%. (from EPPO Standard PP 1/17 Botryotinia fuckeliana on grapevine, bunch area affected)

52
EPPO Standard Plasmopara viticola PP 1/4(4) European and Mediterranean Plant Protection Organization Organisation Européenne et méditerranéenne pour la Protection des Plantes
PP 1/31(3) Efficacy evaluation of fungicides Plasmopara viticola Specific scope This standard describes the conduct of trials for the efficacy evaluation of fungicides against Plasmopara viticola, causing downy mildew of grapevine. 1. Experimental conditions 1.1 Test organisms, selection of crop and cultivar Test organism: Plasmopara viticola (PLASVI). Crop: grapevine Vitis vinifera (VITVI). 1.2 Trial conditions The trial should be set up in the field in productive vineyards with natural infection but, in certain circumstances, it may be necessary to carry out the trial on special small plots, with artificial inoculation and misting in order to enhance infection. Cultural conditions (e.g. soil type, fertilization) should be uniform for all plots of the trial and should conform with local viticultural practice. The trial should preferably be set up in a topographically and climatically homogeneous environment favorable to the pathogen. The trial should form part of a trial series carried out in different regions with distinct environmental conditions and preferably in different years or growing seasons (see EPPO Standard PP 1/181 Conduct and reporting of efficacy evaluation trials). 1.3 Design and lay-out of the trial Treatments: test product(s), reference product and untreated control, arranged in a suitable statistical design. Plot size (net): sufficient to provide at least 100 bunches per plot for natural infection or 50 bunches per plot when artificial inoculation is used. Replicates: at least 4. For further information on trial design, see EPPO Standard PP 1/152 Design and analysis of efficacy evaluation trials.
Specific approval and amendment First approved in 1980-09. Aligned with revised standard text in 1996. Revision approved in 2000-09.
2. Application of treatments 2.1 Test product(s) The product(s) under investigation should be the named formulated product(s) (see EPPO Standard PP 1/181 Conduct and reporting of efficacy evaluation trials). 2.2 Reference product The reference product should be a product known to be satisfactory in practice under the agricultural, plant health and environmental (including climatic) conditions in the area of intended use. In general, type of action, time of application and method of application should be as close as possible to those of the test product. 2.3 Mode of application Applications should comply with good standard practice. 2.3.1 Type of application The type of application (e.g. a spray) should be as specified for the intended use. 2.3.2 Type of equipment Application(s) should be made with equipment which provides an even distribution of product on the whole plot or accurate directional application where appropriate, equivalent to a good commercial practice. Factors which may affect efficacy (such as operating pressure, nozzle type) should be chosen in relation to the intended use. 2.3.3 Time and frequency of application The number of applications and the date of each application should be as specified for the intended use.

53
2.3.4 Doses and volumes The product should normally be applied at the dosage specified for the intended use. Doses higher or lower than the intended dose may be tested to determine the margin of effectiveness and crop safety. The dosage applied should normally be expressed as a concentration (%) combined with a volume (L ha-1) appropriate to the state of the crop. These should be recorded together with the dosage in kg (or L) of formulated product per ha. It may also be useful to record the dose in g of active substance per ha. Deviations from the intended dosage should be noted. 2.3.5 Data on other plant protection products If other plant protection products (or any biocontrol agents) have to be used, they should be applied uniformly to all plots, separately from the test product and reference product. Possible interference with these should be kept to a minimum. 3. Mode of assessment, recording and Measurements 3.1 Meteorological and edaphic data 3.1.1 Meteorological data On the days before and after application, meteorological data should be recorded which is likely to affect the development of the crop and/or pest and the action of the plant protection product. This normally includes data on precipitation and temperature. All data should preferably be recorded on the trial site, but may be obtained from a nearby meteorological station. On the date of application, meteorological data should be recorded which is likely to affect the quality and persistence of the treatment. This normally includes at least precipitation (type and amount in mm) and temperature (average, maximum, minimum in °C). Any significant change in weather should be noted, and in particular its time relative to the time of application. Because of the importance of climatic conditions for epidemiology of this disease, rainfall and temperature should be recorded throughout the trial period. In addition, any extreme weather conditions, such as severe or prolonged drought, heavy rain, late frosts, hail, etc., which are likely to influence the results, should also be reported. All data concerning irrigation should be recorded as appropriate. 3.1.2 Edaphic data Not required.
3.2 Type, time and frequency of assessment The BBCH growth stage of the crop at each date of application and assessment should be recorded. 3.2.1 Type On leaves: samples of 100 leaves should be randomly selected from each plot and the percentage area on each leaf occupied by downy mildew estimated. If infection is low in the untreated plot (e.g. less than 1% of leaves), spots should be counted on 100 random leaves or the percentage of leaves affected should be determined on at least 15 randomly selected shoots per plot. If infection is heavy in the untreated plot (e.g. above 30–40 %), the degree of infection should be assessed in the whole plot, at least by estimating the percentage area affected on both faces of the row. See Appendix I and Fig. 1 for scales that may be used. On fruits: at least 100 bunches should be examined per plot for trials with natural infection and at least 50 bunches per plot for trials with artificial inoculation. If infection is heavy in the untreated plot, the percentage area infected should be assessed in each bunch. If infection is light in the untreated plot, percentage infected bunches should be determined. 3.2.2 Time and frequency 1st assessment when first symptoms occur in the untreated control. 2nd assessment at the beginning of ripening. It may be useful to make additional assessments, especially between first and second assessments. 3.3 Direct effects on the crop The crop should be examined for the presence of phytotoxic effects (or visible remains of the product; deposits on table grapes), and this should be noted. In addition, any positive effects should be noted. The type and extent of such effects on the crop should be recorded and, if there are no effects, this fact should also be recorded. Phytotoxicity should be scored as follows:
(1) if the effect can be counted or measured, it should be expressed in absolute figures; (2) in other cases, the frequency and intensity of damage should be estimated. This may be done in either of two ways: each plot is scored for phytotoxicity by reference to a scale, or each treated plot is compared with an untreated plot and % phytotoxicity estimated.
In all cases, symptoms of damage to the crop should be accurately described (stunting, chlorosis, deformation, etc.). For further details, see EPPO

54
Standard PP 1/135 Phytotoxicity assessment which contains sections on individual crops. It may be useful to assess effects on oenological and organoleptic quality using appropriate methodology (see EPPO Standard on oenological testing, in preparation); such information may come from an additional trial. In particular, attention should be paid to palatability and flavour of table grapes. 3.4 Effects on non-target organisms 3.4.1 Effects on other pests Any observed effects, positive or negative, on the incidence of other pests should be recorded. 3.4.2 Effects on other non-target organisms Any observed effects, positive or negative, on naturally occurring or introduced pollinators or natural enemies should be recorded. Any observed effect, positive or negative, on adjacent or succeeding crops should be recorded. Any environmental effects should also be recorded, especially effects on wildlife. 3.5 Quantitative and qualitative recording of yield The fruits harvested in the various plots may be weighed but extrapolation of the data is only valid if the vineyard is homogeneous. 4. Results The results should be reported in a systematic form and the report should include an analysis and evaluation. Original (raw) data should be available. Statistical analysis should normally be used, by
appropriate methods which should be indicated. If statistical analysis is not used, this should be justified. See EPPO Standard PP 1/152 Design and analysis of efficacy evaluation trials. Appendix I To assess percentage of leaf surface and bunch area affected, a scale such as the following may be used and should be described:
1 = no disease; 2 = <5%;
3 = 5-10%; 4 = 10-25%; 5 = 25-50%; 6 = 50-75%;
7 = >75%.

55
Evaluation Form

56
BBCH-Scale for Grapevine
Growth stage Code Description
0: Sprouting/Bud development
00 Dormancy: winter buds pointed to rounded, light or dark brown according to cultivar; bud scales more or less closed according to cultivar
01 Beginning of bud swelling: buds begin to expand inside the bud scales
03 End of bud swelling: buds swollen, but not green
05 “Wool stage”: brown wool clearly visible
07 Beginning of bud burst: green shoot tips just visible
09 Bud burst: green shoot tips clearly visible
1: Leaf development 11 First leaf unfolded and spread away from shoot
12 2nd leaves unfolded
13 3rd leaves unfolded
19 9 or more leaves unfolded
5: Inflorescence emerge
53 Inflorescences clearly visible
55 Inflorescences swelling, flowers closely pressed together
57 Inflorescences fully developed; flowers separating
6: Flowering 60 First flowerhoods detached from the receptacle
61 Beginning of flowering: 10% of flowerhoods fallen
62 20% of flowerhoods fallen
63 Early flowering: 30% of flowerhoods fallen
64 40% of flowerhoods fallen
65 Full flowering: 50% of flowerhoods fallen
66 60% of flowerhoods fallen
67 70% of flowerhoods fallen
68 80% of flowerhoods fallen
69 End of flowering
7: Development of fruits
71 Fruit set: young fruits begin to swell, remains of flowers lost
73 Berries groat-sized, bunches begin to hang
75 Berries pea-sized, bunches hang
77 Berries beginning to touch
79 Majority of berries touching
8: Ripening of berries
81 Beginning of ripening: berries begin to develop variety-specific colour
83 Berries developing colour
85 Softening of berries
89 Berries ripe for harvest
9: Senescence 91 After harvest; end of wood maturation

57
Powdery Mildew VitiMeteo Prognostic Data

58

59

60

61

62

63

64

65
Downy Mildew VitiMeteo Prognostic Data

66

67

68

69

70

71

72

73
CaCl2 Extraction of Plant-Available Silicon on Soils (modified from Haysom and Chapman, 1975 and Liang et al., 2015)
SERVES
10 samples in duplicate
20 MINUTES
16 HOURS SHAKING
2g air-dried soil
0.01M CaCl2 SOLUTION
1 Liter HQ Water
1.4702g calcium chloride
As the total Si content is not related to the concentration of soluble Si in soils and can
provide little information on soil Si availability to plants, this method is developed to
extract plant-available Si from soils.
For the preparation of the 0.01M solution add the calcium chloride to
the HQ Water.
Put 2g of air-dried soil (<2mm) into a 50-ml polyethylene tube and by
pipette, add 20ml of the 0.01M CaCl2 solution to the tube. Shake this
for 16 hours in an overhead shaker and filtrate it with Munktell
Ahlstrom paper filters with a grade of 14/N.
NaOH Extraction of Amorphous Silica in Soils (modified from Georgiadis et al., 2015)
SERVES
25 samples in duplicate
121 HOURS
25mg of ground soil
0.2M NaOH SOLUTION
8g Sodium hydroxide
1 Liter HQ water
A solution of 0.2 M NaOH almost completely extracts amorphous silica, and when
applied at room temperature and a solid: solution ratio of 1:400, only slightly brakes
down crystalline Si compounds. The predictable and reproducible underestimation
was considered more acceptable than the variable partial dissolution of silicates that
occurs during extraction at higher temperatures. It is recommended using this
method on soils from temperate-humid climate to estimate the amorphous Si
fraction.
Before starting with the procedure it is important to calculate the
water content of the soil. Therefore, weigh the wet and dry weight of
the soil samples. Dry them at 105°C for 48 hours. The water content
is calculated as a ratio of the weight of the evaporated water and the
weight of the wet soil (wc = wH20 / wwet)
Prepare the NaOH solution and grind you soil samples in a Retsch Ball
Mill for 10min. In a 100ml calibrated flask, add the 0.2M sodium
hydroxide solution in a ratio of 1:400 to it. Use a balance for
determining the exact amount.
Afterwards shake the samples for 120 hours in an overhead shaker at
room temperature and filtrate the samples with Munktell Ahlstrom
paper filters with a grade of 14/N.

74
Adsorptiometric Determination of Silicon (modified from Morrison and Wilson, 1963)
SERVES
10 samples in duplicate
1 HOUR 30 MINUTES
Soil extraction samples
(see CaCl2 extraction or
NaOH extraction)
HQ Water
Tartaric acid
ACIDIFIED MOLYBDATE
SOLUTION
89g ammonium molybdate
62ml of 98% sulphuric acid
REDUCING AGENT
1.2g sodium sulphite
0.2g 4-amino-3-hydroxy-1-
naphthalenesulphonic acid
(purest grad available)
14g potassium disulphite
STANDARD SOLUTIONS OF
SILICA
1000g pure dry silica
5g anhydrous sodium
carbonate
A method together with a modification for obtaining high sensitivity for determining
plant-available silicon in soil. It is based on the absorptiometric measurement of
solutions of reduced β-molybdosilicic acid. The limit of detection was about 0.001
ppm of silica.
All reagents should be of analytical grade unless otherwise stated. Start with the acidified molybdate solution and dissolve the ammonium molybdate in about 800 ml of water at room temperature. Dilute the sulphuric acid to about 100ml by adding it cautiously to water, with stirring, and allow to cool. Add the acid to the molybdate solution and dilute to 1 liter. The reagent may be kept for several months. Make a 28 per cent. w/v solution with the tartaric acid. It can be kept for at least 3 months. For the reducing agent dissolve the sodium sulphite and 4-amino-3-hydroxy-1-naphthalenesulphonic acid in about 70ml of water. Add the potassium disulphite and shake well until dissolved and dilute to 100ml. This reagent should be freshly prepared each week. For the standard solutions of silica fuse the pure dry silica with the anhydrous sodium carbonate in a platinum crucible at red heat. When cool, dissolve in water and dilute to exactly 1 liter. This solution contains 1000 ppm of silica. Prepare different solutions of silica by diluting. The solutions are stable for at least 3 months. By pipette place 0.4ml of your extraction samples in 100ml calibrated flasks. Add 16ml of HQ water and 1ml of acidified molybdate solution. 10 minutes later ±3 minutes add 1ml of tartaric acid and wait for 5 minutes ±1 minute before proceeding. 0.5ml of the reducing agent is added and some samples might already become blueish. Fill up the flasks with 1.1ml to a 20ml solution. Wait one hour before measuring the optical density with a photometer. Use the prepared standard solution to get a calibration curve of the photometer. The blank solution should contain 80ml of water of the same batch as was used for the preparing and diluting the standards. From the obtained results prepare a calibration curve.

75
NaOH Extraction of Amorphous Silica in Plants (modified from Elliot and Snyder, 1991)
SERVES
24 samples in duplicate
3 HOURS
100mg ground plant
tissue
HQ water
50% H2O2
50% NaOH SOLUTION
Many methodologies for the determination of Si in plant tissue are tedious
and slow and/or involve cumbersome safety precautions. This new
autoclave-induced digestions (AID) method has been developed to make
plant tissue extraction easier. The method is linearly correlated with Si
determination by NaOH fusion.
100mg of ground plant tissue is wetted with 2ml of 50% H2O2 in
100-ml polyethylene tubes. Add 4.5g of 50% NaOH solution and
vortex the tubes gently.
The tubes were covered with lose fitting plastic caps and
samples were placed in an autoclave at 121°C with a sterilization
phase of 20 minutes. Afterwards when cooled down the content
is filled up with HQ water to 50ml and samples are centrifuged
at 1000 g for 5 minutes at room temperature.
Eextracts were analyzed colorimetrically with a Varian DMS 200
UV visible spectrophotometer (see 6.9 Adsorptiometric
Determination of Silicon).

76
LUDOX TM50 Colloidal Silica

77
Equisetum Plus

iii
Table of Content 1 Introduction ............................................................................................................................. 1
Silicon in Soil ..................................................................................................................... 3
Soluble and Available Silicon in Soils ........................................................................ 5
Silicon in Plants ................................................................................................................. 6
Major Fungal Pathogens of Grapevine............................................................................. 9
Powdery Mildew ....................................................................................................... 9
Downy Mildew ........................................................................................................ 10
Defense and Resistance of Grapevine ........................................................................... 12
Research Objective ......................................................................................................... 13
2 Material & Methods .............................................................................................................. 15
Experimental Design ...................................................................................................... 15
Soil Characteristics ......................................................................................................... 16
Treatments ..................................................................................................................... 17
Plant Protection.............................................................................................................. 20
Time Table ...................................................................................................................... 20
Weather Data ................................................................................................................. 21
Measurements ............................................................................................................... 22
Assessment of Fungal Diseases ............................................................................... 22
Soil Analysis ............................................................................................................. 23
Leaf Analysis ............................................................................................................ 23
Analysis of Photosynthesis ...................................................................................... 24
Fruit Quality Parameters ......................................................................................... 25
Statistical Analysis .......................................................................................................... 25
3 Results .................................................................................................................................... 26
Assessment of Fungal Diseases ...................................................................................... 26
Powdery Mildew ..................................................................................................... 26
Downy Mildew ........................................................................................................ 29
Silicon Status in Soil ........................................................................................................ 32
Plant-Available Silicon ............................................................................................. 32

iv
Amorphous Silicon .................................................................................................. 34
Leaf Analysis ................................................................................................................... 36
Photosynthesis ............................................................................................................... 38
Fruit Quality Parameters ................................................................................................ 39
4 Discussion .............................................................................................................................. 40
5 Literature ............................................................................................................................... 44
6 Appendix ................................................................................................................................ 49
EPPO Standard Uncinula necator PP 1/4(4) ................................................................... 49
EPPO Standard Plasmopara viticola PP 1/4(4) ............................................................... 52
Evaluation Form ............................................................................................................. 55
BBCH-Scale for Grapevine .............................................................................................. 56
Powdery Mildew VitiMeteo Prognostic Data ................................................................. 57
Downy Mildew VitiMeteo Prognostic Data .................................................................... 65
CaCl2 Extraction of Plant-Available Silicon on Soils ........................................................ 73
NaOH Extraction of Amorphous Silica in Soils ............................................................... 73
Adsorptiometric Determination of Silicon ..................................................................... 74
NaOH Extraction of Amorphous Silica in Plants ............................................................. 75
LUDOX TM50 Colloidal Silica .......................................................................................... 76
Equisetum Plus ............................................................................................................... 77

3
Silicon in Soil In rocks, the concentrations of silicon range from 23% (e.g. basalt) to 46.5% (e.g. orthoquartzite). Trance amounts of silicon are also in carbonaceous rocks (Monger and Kelly, 2002). The chemical weathering of silicate-containing minerals is the ultimate source of dissolved Si (as monosilicic acid, H4SiO4), which contributes to continental soil formation through linked biogeochemical reactions. Silicon release to the soil solution from weathering of silicate-containing minerals is rather slow and is governed by precipitation and neoformation of authigenic Si-constituents, Si adsorption/desorption on various solid phases, uptake and assimilation by vegetation and microorganisms, preservation of stable Si form in the profile, and addition from external atmospheric inputs. The largest inter-pool Si transfer takes place between biomass, biogenic silica from phytoliths and microorganism and soil solution (Tubana et al., 2016). The contribution of silicon to the soil solution from the atmosphere via wind-blown dust and phytolith particles is very small compared to soil-plant inputs (Tubana et al, 2015).
Figure 1: Different fractions of Si in soils (Tubana et al., 2016)
In soils, silicon is generally grouped into three different fractions (1) the liquid phase, (2) the adsorbed phase and (3) the solid phase, which are the key components of the silicon cycle in soil (Matichencov and Bocharnikova, 2001). Figure 1 shows the different fractions in the classification of silicon compounds in soils. The solid Si phase consists of poorly crystalline and microcrystalline, amorphous and crystalline forms of Si. The largest solid phase fraction of Si occurs in crystalline form consisting of primary and secondary silicates. Amorphous Si originates either from biogenic sources such as plant residues and remains of microorganisms or litho/pedogenic materials, which are Si complexes with Al, Fe, heavy metals and soil organic matter. The amount of amorphous Si ranges from less than 1,000 to 30,000 mg/kg on a total soil basis and effects the concentration of Si in soil solution (Tubana et al., 2016). The components of silicon in liquid and adsorbed phases are similar, with exception that those in liquid phase are dissolved in the soil

5
Soluble and Available Silicon in Soils Primary silicates and secondary mineral phases containing silica and biogenic silica to some extent dissolve in water to produce silicic acid. It is produced by a non-biological process called hydration involving water and quartz (Cooke et al., 2011). The reaction producing silicic acid from quartz can be written as:
Quartz + Water → Silicic acid SiO2 + 2 H2O → H4SiO4
Silicic acid concentration varies with soil type and is affected by its dissolution from soil minerals and its adsorption or resorption by the soil (Epstein, 1994). Extreme conditions including high temperatures and rainfall increase the release of silicic acid, explaining why most weathered soils in the tropics are silicon-deficient (Cooke at al., 2011).
Silicic acid (H4SiO4) is the only form of Si present in soil solution, whereas the measured concentrations range between 0.1 – 0.6 mM (Epstein, 1994), which is much less than that in saturated silicic acid solution and is mainly controlled by the pH-dependent absorption-desorption processes on sesquioxides (Liang et al., 2015). Available Si in soils refers to an amount of Si that can be taken up by plants during the growing season and is considered an index of Si-supplying capacity in soil. However, in silicic acid-saturated soil solution the monosilicic acid polymerizes into polymeric acid, which is in a dynamic equilibrium with amorphous and crystalline silicates, exchangeable silicates and sesquioxides. Therefore, parts of silicate components that can be easily converted into silicic acids such as polymerized silicic acid, exchangeable silicates and part of colloidal silicates also count to available Si (Liang et al., 2015).
The main factors influencing soil Si availability or Si-supplying power include types of soil and parent material, historical land-use change, soil pH, soil texture, soil redox potential, organic matter, temperature and accompanying ions (Liang et al., 2015). Moreover, the results of Biyutskii et al. (2016) highlight the importance of earthworms in plant acquisition and biogeochemistry of Si. Earthworms can increase mobility and bioavailability of silicon in soils.

6
Silicon in Plants As other plants grapevines require three categories of resources to grow and produce fruit: (1) carbon, (2) water and (3) mineral nutrients. Exposed to suboptimal conditions abiotic and biotic stresses can be limiting to one or several resources to the plant. Abiotic stresses include overcast or too bright sky, heat or cold, water surplus or deficit and nutrient deficiency. Pests and disease attacks rank among biotic stresses. Grapevines share their living quarters with a wide range of other organisms, mainly arthropods and microorganisms, and in addition to some nematodes, birds, mammals and plants. Although the majority of these do not harm grapes, some organisms compete with the vines for resources or make a living feeding on various grapevine structures, which make them pests or pathogens (Keller, 2010). Although a certain level of stress will improve fruit quality in the vineyard, stresses adversely affect plant growth, development, or productivity. (Bauer et al., 2015).
Although not traditionally thought of as an element essential to the life cycle of plants, with the exception of the early-diverging Equisetaceae, Si is found in plants at concentrations from 1 to 100 g/kg which is equivalent to or even exceeding several macronutrients (Epstein, 1994). For plant nutrition silicon has not been considered as an essential element, according to the classical definition of essentiality (Arno and Stout, 1939), but it is regarded as one of the most beneficial elements that increases plant resistance against abiotic and biotic stresses. It has been shown to improve plant cell wall strength and structural integrity, improve drought and frost resistance, decrease lodging potential (Currie and Perry, 2007), and boost the plant's natural pest and disease fighting systems (Datnoff, 2007). Silicon has also been shown to improve plant vigor and physiology by improving root mass and density, and increasing above ground plant biomass and crop yields (Epstein, 2009b). In 2013, the American Association for Plant Food Control Officials (AAPFCO), the regulatory body that governs the labeling of fertilizers in the USA, recognized silicon as a beneficial substance that can now be sold as a fertilizer across the USA (Datnoff et al., 2015).
Silicic acid is the only known precursor of silicon compounds in biota, and plants take up aqueous, uncharged silicic acid through their roots when the pH-value of the soil solution is below 9 (Ma and Yamaji, 2006). The ability of plants to accumulate Si varies greatly between species. Silicon accumulation has been found to a greater extent, but not exclusively, in monocotyledonous plants. Plants of the families Poaceae, Equisaetaceae and Cyperaceae show high Si-accumulation whereas different parts of the same plant can show large differences in Si-content. Silicon concentration of shoots typically tend to decline in the order
liverworts > horsetail > clubmosses > mosses > angiosperms > gymnosperms > ferns
(Currie & Perry, 2007). Its uptake is passive for dicotyledons and largely determined by transpiration rate and is transported in the xylem. Therefore, silicon accumulates in higher amounts in mature leaves than in young ones (Ma and Takahashi, 2002). The absorption of silicic acid takes place at the lateral roots also via active or rejective mechanisms (Tubana et al. 2015).

9
Major Fungal Pathogens of Grapevine
Grapevine species are prone to several diseases, fungi being the major pathogens compromising its cultivation and economic profit around the world. Knowledge of the complexity of mechanisms responsible for resistance to fungus infection is necessary to develop strategies which will improve the grapevine’s resistance (Bauer et al., 2015).
Powdery Mildew Uncinula necator (syn. Erysiphe necator) is a fungus that causes grapevine powdery mildew, also termed Oidium. It is the most widespread and most consistently damaging pathogen which is parasitic on genera within the Vitaceae. The most economically important host is grapevine (Vitis), particularly the European grape, Vitis vinifera, which is highly susceptible. The fungus originated in North America and spread through Europe in the 1840s at a time where little was known about germ theory (Gadoury et al., 2012).
Uncinula necator infects all green tissue on the grapevine, including leaves and young berries. Ascospores colonies are most commonly found on the lower surface of the leaves and may be accompanied by a similarly shaped chlorotic spot on the upper surface. Severely affected leaves usually senesce, develop necrotic blotches and fall prematurely. Inflorescences and berries are most susceptible when young and can become completely coated with whitish mildew. Powdery mildew causes crop loss and poor wine quality if untreated (Bauer et al., 2015).
This fungus requires only 40% relative humidity to germinate, a threshold that is easily reached on the lower surface of transpiring leaves, even if the surrounding air is much drier. The optimum is at 85% humidity and 25°C, but heavy rain and temperatures below 10 and over 31°C limit the development. Mild rainfall seems to benefit by enhancing spore dispersal. Spores germinate on the surface of plant organs, invade the cuticle and cell walls and rapidly establish haustoria inside the epidermis cell. Like all biotrophic pathogens, U. necator needs living host plants for assimilate supply. It suppresses the defense responses in susceptible cultivars and acts as another sink. Infected leaves have higher concentration of sugars especially hexoses due to import of sucrose from uninfected plant parts and subsequent breakdown by invertase in the cell walls. An injection of cytokinin from the pathogen induces invertase activity and also involves amino acid imports. Photosynthesis and starch storage will decrease in infected leaves. This powerful extra sink alters assimilates partitioning in the vine at the expense of other sinks such as fruit, roots and storage reserves (Keller, 2010).
Unlike American Vitis species, which are relatively resistant to the fungus, European Vitis vinifera L. cultivars are readily infected because they did not coevolve with the pathogen and produce lower amounts of PR proteins. Within European cultivars susceptibility varies, with Chardonnay and Cabernet Sauvignon being among the most susceptible cultivars (Keller, 2010). Even though

10
stilbene phytoalexins are also effective against Uncinula necator, infections do not normally trigger their production. One explanation could be that the fungus avoids cell damage so as not to threaten its own survival. The resistant American Vitis species accumulate stilbenes in response to infections. Also flavonols, which accumulate in the epidermis, and cuticular wax may be involved in Vitis vinifera resistance against Uncinula necator (Keller, 2010). Flavonol production is strongly reduced by high soil nitrogen availability and high plant N status makes vines more susceptible to colonization by powdery mildew. An additional resistance mechanism may be vitrification of penetrating mycelium by the localized accumulation of silicates in the cell walls (Blaich and Wind, 1989).
Downy Mildew Although usually regarded as a fungus because it looks like one and produces spores, the causal agent Plasmopora viticola is in fact more closely related to certain algae, kelps and diatoms with which they are placed in the kingdom of Protista. In contrast to fungi, its cell walls contain cellulose instead of chitin and its cell nuclei are diploid, not haploid. It belongs to the class of Oomycetes and is not related to the powdery mildew fungus. (Gessler et al., 2011)
Plasmopora viticola also termed Peronospora can infest all green parts of the plant but usually colonizes young leaves or young berries by penetrating through the stomata. The spores can germinate at greater than 95% relative humidity in shady conditions especially with frequent rainfall and temperatures between 20 and 25°C. The mycelium develops an intercellular network in the leaf mesophyll and creates haustoria to feed from these cells. The first symptoms appear on the adaxial side of leaves as yellow or in some cultivars red oily spots, which spread and later
Figure 2: Symptoms of powdery mildew, left: fully infested grape cluster (own picture), right: spots of powdery mildew on the adaxial side of the leaf (www.rebschutzdienst.at)

12
Defense and Resistance of Grapevine A prospective pathogen that attempts to penetrate the epidermis first has to overcome the cuticle and thick outer cell walls on the leaves. The thickness of the cuticle and the outer cell wall of different Vitis cultivars determine their susceptibility to powdery mildew (Heintz and Blaich, 1989). Access points for pathogens are wounds caused by herbivore, birds, arthropods or mechanical damage. During anthesis exposed surfaces provide ideal sites for pathogen invasion and therefore special attention for plant protection has to be paid during flowering. Plants respond to physical damage by mechanisms that aim to heal wounds and prevent pathogen invasion. Deposition of callose, lignin glycoproteins and phenolics strengthen the cell wall and the production of so-called pathogenesis-related (PR) proteins such as chitinases and glucanases increase the defense mechanism (Gessler et al., 2011).
If defense responses are unsuccessful and pathogens penetrate into the tissues, plants have evolved a broad range of strategies to resists fungal infections. These strategies are either constitutive or induced. Constitutive resistance strategies are passive and are present regardless of an infection. They include physical barriers such as cell walls, the cuticle and chemicals with antimicrobial activity like phenolics, which are generally accumulated in the cell vacuoles (Keller, 2010).
Induced strategies are actively initiated in response to pathogen invasion and specifically target pathogens that have overcome the constitutive barriers. The production of reactive oxygen species and antimicrobial compounds such as proteins and phytoalexins starts. The fortification of cell walls with lignin, suberin or the incorporation of callose, proteins or silicon are part of the induced strategies. Active defense is usually restricted to the site of invasion as only infected and neighboring cells accumulate the antimicrobial chemicals to concentrations to restrict the spreading of the pathogen (Keller, 2010; Gessler et al., 2011). The first hypothesis of silicon-enhanced resistance is associated with silicon deposits in the cell walls and below the cuticle which act as an addition physical border (Sakr, 2016).
Plants have special receptor proteins that can recognize invading pathogens by some of the microbial enzymes or complex carbohydrates. They are able to interpret the breakdown products of their own cuticle and cell walls as signals of the intruder. These compounds are collectively termed elicitors. The defense response results from activation of various biochemical pathways by a series of signaling cascades that are triggered by the detection of a pathogen. Within minutes of an attempted infection by a foreign invader, there is a rapid rise in reactive oxygen species in the apoplast (Apel and Hirt, 2004). The surrounding cells mount structural barriers and produce PR-proteins which degrade chitin and glucans, which are important components of the cell walls of fungi (Keller, 2010).
Secondary signaling molecules, including salicylic acid, jasmonic acid and ethylene then augment the early defense response and may even activate defenses in distant healthy tissues and act systemically (Heil and Ton, 2008). In some instances, these secondary signals and H202 make

13
infected and surrounding cells to commit suicide in a process termed hypersensitive response. This limits food supply to the pathogen and may kill it. Although, this strategy is indeed useful in fighting off biotrophs such as Unicator. necator and Plasmopora. viticola, the susceptibility to necrotrophs rises. Necrotrophs such as Botrytis cinerea grow on dead tissues and can exploit the plant’s defense response by promoting tissue senescence. (Keller, 2010)
If the pathogen could penetrate into the tissue, the vine activates a second line of defense after several hours. This biochemical defense includes accumulation of antimicrobial compounds, including phytoalexins and PR proteins. In response to xylem-invading fungal pathogens, the accumulation of elemental sulfur in the vessel walls and xylem parenchyma cells is expedited (Gessler et al., 2011).
Research Objective
The aim of this thesis is to test the efficiency of silicon applications to control for downy and powdery mildew in grapevine V. vinifera L. cv. Grüner Veltliner in a field trial. In the literature two hypotheses for silicon-enhanced resistance to fungal diseases have been proposed: (1) Increased levels of silicon deposits in the plant act as physical barriers and (2) the upregulation of natural defense mechanism which actively fight off fungal pathogens.
Previous studies have shown that the supplement of silicon to grapevine increased the maximum yield and potential photochemical efficiency of the photochemical reactions in photosystem II (Qin et al., 2016). Ling et al. (2016) state that silicon might play an important role in protecting photosynthetic machinery from damage and improving the salt-tolerance of the grapevine by increasing the concentration of soluble sugars and starch.
On potted plants root-feeding at 1.7mM silicon solution had no effect on fungal disease severity, but foliar sprays at 17mM Si substantially reduced the number of mildew colonies that developed in inoculated grapevine leaves. Hyphae did not develop in areas where thick Si deposits were present on the leaf surface (Bowen et al, 1992). Reynolds et al. (1995) showed that potassium silicate sprays reduced the incidence of powdery mildew in two of three years. The study concluded that grape berries may utilize endogenous Si to help fight diseases. Furthermore, exogenously applied silicates may act to augment the activity of their endogenous counterparts. Appropriate application intervals and concentrations will increase the effectiveness of silicon sprays.
Klaus et al. (1990) performed a Si-fertilizer trial in a vineyard with grapevine cv. Müller-Thurgau and Silvaner. Vines were fertilized with 2.5 and 5 t/ha of calcium silicate over four years before starting measurements. Minor Si accumulation in the tested leaves could be determined. However, Leusch (1986) indicates that the fertilization with calcium silicate does not always lead to an increased amount of silicic acid due to a rise in pH and therefore a reduced solubility. The

15
2 Material & Methods
Experimental Design The field trial was situated in Krems Landersdorf at a vineyard of the School of Viticulture and Horticulture in Krems, Austria and was supported by Ing. Christoph Gabler and Ing. Erhard Kührer. For each treatment 48 plants of Vitis vinifera cv. Grüner Veltliner (scion: SO4) were used and divided into four groups of 12 plants. The vineyard was planted in 2012 with a distance of 3x1m (Figure 4).
Figure 4: Experimental design, V1: Amorphous Silicon Soil Amendment (yellow), V2: Amorphous Silicon Foliar Spray (blue), V3: Amorphous Silicon Combination V1 + V2 (green), V4: Equisetum Plus Spray (red), V6: Control Group Water Spray (light blue), V7: Control Group Common Plant Protection (grey), colored blocks consisted of 12 plants, total number of plants per treatment were 48
Amorphous silica was either applied to the soil as a fertilizer (V1) or sprayed as foliar spray to the canopy (V2). For treatment V3 a combination of Si-fertilization and foliar spray was used. In treatment V4 a horsetail extract, which has already been used in organic viticulture was applied as foliar spray. The control groups V5 and V6 received water sprayed on leaves and soil irrigation with water, respectively. Treatment V7 served as a comparison to common plant protection.
V4
V5
V5
V6
V6
V1
V2
V3
V7
V7
V7
V4
V4
V4
V5
V5
V6
V6
V1
V1
V1
V2
V2
V2
V3
V3
V3
V7

16
Soil Characteristics Before starting the experiment soils of different vineyards were analyzed to ensure low plant-available and amorphous silicon in the soil. The vineyard at Krems, Landersdorf is low in both silicon fractions. Table 1 shows the analysis of silicon in the soils of the experimental vineyard. Plant-available (i.e. CaCl2-extractable) Si amounted to 0.126 mM in the topsoil and 0.118 mM in the subsoil which compares to a typical range between 0.029 – 0.175 mM plant-available silicon (Sakr, 2016), indicating a medium available Si status of the experimental soil. Similarly, also for the amorphous fraction (i.e., NaOH-extractable) of silica (1.25 g/kg in the top and 1.37 g/kg in the subsoil) falls in the lower range compared to the typical range of 1,000 to 30,000 mg/kg as reported by Tubana et al. (2016).
Table 1: Silicon analysis of the vineyard in Krems, Landersdorf, soil samples were taken on March 18, topsoil ranges from 0-30 cm, subsoil ranges 30-60 cm, plant-available silicon was analyzed with a CaCl2-extraction modified from Haysom and Chapman, 1975 and Liang et al., 2015, amorphous silicon was extracted with a NaOH-solution modified from Georgiadis et al., 2015
Table 2 provides additional information about the soil characteristics of the vineyard. According to its texture composition of around 100 g/kg sand, 700 g/kg silt and 200 g/kg clay it can be classified as loess soil, an aeolian sediment formed by the accumulation of wind-blown silt (Miller et al., 1990). A thick blackish mineral surface layer that is rich in organic matter and the parent material of mostly aeolian and reworked aeolian sediments indicate the classification of a Chernozems soil. This soil is typical for this region and develops in a continental climate (FAO, 2015). The carbon-to-nitrogen ratio at a medium level for a cultivated Chernozem soil.
Table 2: Characteristics of the experimental soil in Krems, Landersdorf, analysis was performed according to Blum et al. (1996)
Soil pH Sand Silt Clay C/N ratio Organic Carbon
Carbonate Content Nitrogen
Topsoil 7.43 100 g/kg 672 g/kg 228 g/kg 13.8 19.3 g/kg
184.9 g/kg 1.4 g/kg
Subsoil 7.55 89 g/kg 758 g/kg 153 g/kg 16.4 16.4 g/kg
192.1 g/kg 1.0 g/kg
Soil Analysis
Plant-available Silicon (in mM)
Amorphous Silicon (in mg/kg)
Topsoil 0.126 1,250 Subsoil 0.118 1,370

17
Treatments
[V1] Amorphous Silicon – Soil Amendment LUDOX TM-50 Colloidal Silica was applied to the soil with a watering pot in 6 portions during the growing season. For an easier application and to avoid drain of the fertilizer a pouring ring around the vine with a diameter of 40cm were installed. A total amount of 5 t/ha LUDOX TM-50 Colloidal Silica were applied (Table 3). Taking into account that this is a 50% wt. suspension in water, this corresponds to a total amount of 2.5 t/ha of silica. Amount of application for 48 plants:
Table 3: Detailed information for the soil amendment with LUDOX TM-50 Colloidal Silica for the treatment V1 and V3. The same amount of water was used for the control group V5, the BBCH-code identifies the phenological stages of the grapevine
Date BBCH Product Amount Concentration Water M SiO2 per Plant
19-May 17 LUDOX TM-50 Colloidal Silica 8.0 l 4.20% 192 l 93.0 7-Jun 57 LUDOX TM-50 Colloidal Silica 3.2 l 1.70% 192 l 37.2
28-Jun 73 LUDOX TM-50 Colloidal Silica 3.2 l 1.70% 192 l 37.2 12-Jul 77 LUDOX TM-50 Colloidal Silica 3.2 l 1.70% 192 l 37.2 29-Jul 81 LUDOX TM-50 Colloidal Silica 3.2 l 1.70% 192 l 37.2
17-Aug 83 LUDOX TM-50 Colloidal Silica 3.2 l 1.70% 192 l 37.2 [V2] Amorphous Silicon – Foliar Spray The first two applications were sprayed at a concentration of 1% of LUDOX TM-50 colloidal silica. After the first assessment of fungal diseases the amount was increased to a concentration of 2% to gain better results (Table 4).
Amount of application for 48 plants:
Table 4: Detailed information of the foliar spray with LUDOX TM-50 Colloidal Silica for the treatment V2 and V3. The same amount of water was used for the control group V6, the BBCH-code identifies the phenological stages of the grapevine
Date BBCH Product Amount Concentration Water mM SiO2 per Plant
19-May 17 LUDOX TM-50 Colloidal Silica 50ml 1.00% 5 l 12.1 7-Jun 57 LUDOX TM-50 Colloidal Silica 60ml 1.00% 6 l 14.5
28-Jun 73 LUDOX TM-50 Colloidal Silica 160ml 2.00% 8 l 38.8 12-Jul 77 LUDOX TM-50 Colloidal Silica 160ml 2.00% 8 l 38.8 29-Jul 81 LUDOX TM-50 Colloidal Silica 160ml 2.00% 8 l 38.8
17-Aug 83 LUDOX TM-50 Colloidal Silica 200ml 2.00% 10 l 48.5

20
Plant Protection Additionally, conventional spraying as foliar spray was applied to all treatments and controls except for the common plant protection (V7) (Table 6). This basic plant protection was used depending on weather conditions and infection risk of fungal pathogens. It was planned to implement silicon applications into an organic viticulture plant protection plan, which uses mainly copper and sulfur. Due to high infection risk of Plasmopora viticola, Aktuan Gold, a systemic fungicide, was used once to keep downy mildew at bay.
Amount of basic plant protection applications for 48 plants:
Table 7: Detailed information of the basic plant protection for all treatments.
Date BBCH Product Amount Concentration Water
16-Jun 68 Cuprozin Progress (Copper) 26ml 0.40% 6.5 l Stulln (Sulfur) 45.5g 0.70% 24-Jun 73 Aktuan Gold 40ml 0.40% 10 l
1-Aug 81 Cuprozin Progress (Copper) 50ml 0.40% 12 l Stulln (Sulfur) 85g 0.70%
15-Aug 85 Cuprozin Progress (Copper) 50ml 0.40% 12 l Stulln (Sulfur) 85g 0.70%
Time Table
Figure 5 gives an overview of all actions during the field experiment. Silicon applications of soil amendment and foliar spray started in week 20 in the mid of May and ended at week 33 in the mid of August. Soil samples were taken right before soil amendment, after three applications of silicon and after 6 applications. Leaf samples were taken after each two applications of silicon. The analysis of photosynthesis was measured 5 times over the vegetation period. Fruit quality was measured at harvest time.
Figure 5: Time table of all applications and measurements

21
Weather Data
The vegetation period in 2016 was dominated by frequent rainfalls. June and July had three times higher precipitation than in the year before (Tables 7 and 8). Average relative humidity was in these months also higher in 2016 compared to 2015. These are two important factors which favor spreading and infections of fungal pathogens and presented viticulturists with a challenge for plant protection.
A detailed overview from Vitimeteo, a forecast system for plant protection in viticulture, of daily rainfalls and fungal infections can be found in the Appendix.
Table 8: Weather data 2015 from Adcon Telmetry Live Data, Krems Landersdorf
Table 9: Weather data 2016 from Adcon Telmetry Live Data, Krems Landersdorf

22
Measurements
Assessment of Fungal Diseases Infections of Powdery Mildew (Uncinula necator) and Downy Mildew (Plasmopara viticola) were documented at two times during the period according to EPPO standards PP 1/31(3) Plasmopara viticola and PP 1/4(4) Uncinula necator, which can be found in the Appendix. The first time was on June 24 where only Downy Mildew was assessed due to a lack of symptoms from Powdery Mildew. The second assessment was on August 11 where both fungal diseases were monitored. Figure 8 shows the percentage of infected leaf surface as a guideline for assessing fungal infections.
To assess percentage of leaf surface and affected bunch area, the following scale was used to class-divide the different levels of infection:
1 = no disease 2 = <5% 3 = 5-10% 4 = 10-25% 5 = 25-50% 6 = 50-75% 7 = >75%.
Out of these classes two performance indicators were calculated:
𝑛 .......... number of observation 𝑖 ........... number of class 𝑛(𝑐𝑖) ..... number of observation in class 𝑖
Rate of Infestation: Intensity of Infestation:
Figure 6: Overview of the percentage of abaxial leaf surface affected by downy mildew (EPPO standards PP 1/31(3))

23
Soil Analysis Plant-available and amorphous silicon fractions were analyzed in soil samples collected from the top (0-30cm) and subsoil (30-60cm) during the vegetation period at three points of time. The points of time were before the silicon soil amendment, after three silicon applications and after six silicon applications.
The soil amendment treatments were [V1] Soil Amendment, [V3] Soil Amendment + Foliar Spray and [V5] Control – watered. Each treatment is divided into 4 fields with 12 plants. From each field 6 soil samples from the top and subsoil were taken and mixed. Samples were taken three times during the vegetation period. Thus from each treatment 72 (4 fields * 6 samples *3 times) soil samples from the topsoil and 72 samples of the subsoil were taken. Resulting in total of 12 batches of mixed soil samples from the topsoil and 12 batches of mixed soil samples from the subsoil from each treatment.
The level of plant-available silicon in soil was analyzed with a CaCl2-extraction method using a 0.01M solution modified from Haysom and Chapman, 1975 and Liang et al., 2015. 2g of air-dried soil (<2mm) were mixed with 20ml of the 0.01M CaCl2 solution in a tube and were shaken for 16 hours in an overhead shaker and filtrated it with Munktell Ahlstrom paper filters with a grade of 14/N. The amorphous silicon was extracted with a NaOH-extraction method modified from Georgiadis et al. (2015). A 0.2M sodium hydroxide solution was used in a ratio of 1:400 and samples were shaken 120 hours in an overhead shaker. Samples were analyzed in one replicate.
Filtered extracts of both extractions were analyzed colorimetrically with a Varian DMS 200 UV visible spectrophotometer. This analysis is based on the absorptiometric measurement of solutions of reduced β-molybdosilicic acid (modified from Morrison and Wilson, 1963).
Detailed descriptions of the used methods can be found in the Appendix.
Leaf Analysis To gain knowledge about the amount of silicon allocated to leaves, samples from mature and young leaves were taken at three time points. Mature leaves were taken from the fruit zone and differ in their leaf age from one to another sample time. Young leaves were side shoots of the same developmental stage. The points of time were after 2, 4 and 6 applications of silicon. From each treatment 20 old leaves and 40 young leaves were taken at every sampling time.
Leaves were dried at 65°C for 48 hours in an oven. They were ground with a Retsch ball mill to pass a 20-mesh screen. The amorphous silicon content was extracted by an autoclave-induced extraction method (modified from Elliot and Snyder, 1991). A 50% H2O2 -Solution and a 50% NaOH-Solution was added to the plant material and samples were placed in an autoclave at 121°C with a sterilization phase of 20 minutes. Samples were analyzed in one replicate.

24
Centrifuged (1000 g, 5min, room temperature) extracts were analyzed colorimetrically with a Varian DMS 200 UV visible spectrophotometer (modified from Morrison and Wilson, 1963).
Detailed descriptions of the used methods can be found in the Appendix.
Analysis of Photosynthesis Hansatech Handy PEA chlorophyll fluorimeter was used for measurement of chlorophyll fluorescence five times during the vegetation period. Any forms of biotic or abiotic stress which have an effect on the photosynthetic performance, will change the intensity of the chlorophyll fluorescence emission. Healthy samples typically achieve a maximum value of Fv/Fm of 0.85. Plants with lower values are exposed to stress, which reduced the capacity for photochemical quenching of energy within photosystem II (Hansatech Handy PEA Manual).
When light energy from the sun is absorbed by a chlorophyll molecule within a sample, the electronic configuration of the molecule is temporarily altered. Photochemical and non-photochemical processes compete to dissipate the absorbed energy. Photochemical processes utilize absorbed energy for the photosynthesis, whereas non-photochemical processes dissipate energy, which is re-emitted in form of infra-red radiation or heat and far-red radiation which is known as chlorophyll fluorescence. A reduction in the rate of one process leads to an increase of the other one e.g. a reduction in the dissipation by photochemistry will be reflected in an increase in energy dissipation by non-photochemical processes such as heat and chlorophyll fluorescence (Emerson et al, 1932).
The parameter Fv/Fm describes the maximum quantum efficiency of photosystem II and the photosynthetic performance. It is presented as the ratio of variable fluorescence (Fv) and the maximum fluorescence value (Fm). It is therefore important that measurements are taken at same environmental conditions (Hansatech Handy PEA Manual)

25
Fruit Quality Parameters For the analysis of the quality parameters 30 grapes of each treatment and field were picked at the end of the growing season, crushed and analyzed with a fourier transform infrared spectroscopy (FTIR) OenoFoss™. The must weight, the density, the acidity, the pH-value, the amount of tartaric, malic, acetic and gluconic acid and the amount of alpha amino were gained from this analysis.
The must weight was measured as Klosterneuburger Zuckergrade (°KMW). The must weight is a measure of the amount of sugar in grape juice. Hence indicating the amount of alcohol that could be produced if it is all fermented to alcohol, rather than left as residual sugar. While must weight is a commonly used term among wine makers, the physically correct term would be must density.
There was no analysis of the berry weight because of high damage by Peronospora. This infection led to negative effects on yield formation and therefore it was not possible to compare the impact of silicon onto the size of the clusters.
Statistical Analysis Statistical analysis of the data was made with the software IBM SPSS Statistics 23. All data were tested on normal distribution and homogeneity of variance. A One-Way ANOVA Post Hoc Multiple Comparison test was used by default to determine differences between the treatments. If assumptions of normal distribution and homogeneity of variance were violated, Man-Whitney U Test, a non-parametric test was used.

26
3 Results Assessment of Fungal Diseases
Powdery Mildew
Powdery mildew was assessed on August 11. Prior to this date only few symptoms were visible. Since the first symptoms appeared, the disease has spread rapidly and intensively. Figure 7 shows that up to 50% of the clusters were infested by the fungi in the control groups [V5] and [V6]. Although it seemed that both the rate and the intensity of the infestation were lower in the silicon treated groups, [V1], [V2] and [V3], statistical analysis could not find significant differences. It can be termed as a trend of reduced infections. Noteworthy to mention is the lower rate of infestation in [V2] silicon foliar spray compared to the [V7] common plant protection control group. Although the intensity of infestation in both treatments [V2] and [V7] is at 10 % and the standard error is similar, statistics could not confirm the findings (α=0.05).
For the analysis in Figure 8 data was grouped to increase the sample size and therefore achieve better statistical results. The first bar “silicon” comprises [V1] Si-soil amendment, [V2] Si-foliar spray and [V3] Si-soil amendment and foliar spray. The control groups [V5] and [V6] were merged in “Control”. The sample size for the common plant protection (CPP) remained the same. The analysis of grouped data shows that the silicon treatments tended to perform better for the rate of infestation than the control group, however, the difference was not statistically significant (α=0.05). The decrease of the intensity of infestation relative to the control group was more pronounced and statistically significant (α=0.05) in the CPP treatment. Relative to the control, the intensity of infestation was significantly reduced both in the CPP and silicon. Therefore, silicon treatments can partly substitute for fungicides while maintaining a similar level of fungal symptoms.
For the assessment of fungal symptoms on the leaves (Figure 9) no differences, nor clear trends can be determined. High infections of downy mildew on the leaves aggravated the optical assessment of powdery mildew. From Figure 9 it can be concluded that no treatment attains better results in the sense of a lower infection of the leaves.

29
Downy Mildew Downy mildew was assessed twice on June 24 and August 11. At the first time, the rate of infestation for the clusters was below 15% in all treatments (Figure 10), whereas it increased tremendously up to 90% at the second assessment (Figure 11).
The cluster assessment on June 24 shown in Figure 10 does not give evidence that the silicon treatments are superior compared to the control group. Clearly visible is the higher efficiency of the fungicides in CPP control which is secured statistically for both the intensity and rate of infestation. The assessment of the grape clusters on August 11 (Figure 11) shows a similar pattern. Although the difference between CPP and the other treatments decreased for the intensity and the rate of infestation, it is still significant that fungicide application provided better protection for downy mildew regarding the rate of instestaton.
Figure 10: Assessment of downy mildew of grape clusters on June 24, 2016, One-Way ANOVA Post Hoc Multiple Comparison test was used to determine differences between the treatments, different letters above columns indicate significant differences between treatments, α=0.05, at the same time point of analysis, error bars represent standard error of the mean different letters above columns indicate significant differences between treatments, α=0.05, at the same time point of analysis
abb
ab ab ab ab
a
abb
ab abab ab
a0.00
5.00
10.00
15.00
20.00
25.00
%
Downy Mildew, June 24 - Clusters
Intensity of Infestation Rate of Infestation

32
Silicon Status in Soil
Plant-Available Silicon The efficiency of the silicon soil amendment can be clearly seen in Figure 16, where the level of plant-available silicon in the topsoil (0-30 cm) is shown. All results fall within the typical range of 0.029 – 0.175 mM plant-available silicon reported in the literature (Epstein, 1994).
The first bar (T1) indicates the soil analysis before the Si applications. At this time no differences in the level of plant-available silicon could be detected for the treatments. After three Si-applications (T2) the level of plant-available silicon increased in the Si-soil amendment [V1] and the Si-soil amendment + foliar spray [V3] significantly relative to the control group [V6], which remained unchanged. After six Si applications (T3) the level of silicic acid still increased to a higher level and was significantly different to the [V6] control group. Probably due to higher temperatures and thus higher microbial activity and dissolution rates the level of silicic acid also increased in the [V6] control group.
Figure 14: Plant-available silicon in the topsoil, T1: date of sample one on May 17, 2016, T2: date of sample two on July 5, 2016, T3: date of sample three on August 25, 2016, One-Way ANOVA Post Hoc Multiple Comparison test was used to determine differences between the treatments, different letters above columns indicate significant differences between treatments, α=0.05, at the same time point of analysis, error bars represent standard error of the mean different letters above columns indicate significant differences between treatments, α=0.05, at the same time point of analysis
a a a
b b
a
b
b
a
0.000
0.050
0.100
0.150
0.200
0.250
V1 Si Soil V3 Si Soil+Spray V6 Control Soil
mM
PLANT-AVAILABLE SILICONTOP SOIL
T1 T2 T3

34
Amorphous Silicon The enrichment of the amorphous Si fraction worked well in the topsoil as can be seen in Figure 16. Amorphous Silicon ranges from 1000 to 30000 mg/kg in soil (Epstein, 1994). In the Si-amended soil treatment [V1], the level of amorphous silicon doubled from 1500 mg/kg (T1) to 3000 mg/kg (T3). For the treatment Si-soil + foliar spray treatment [V3] a similar but less pronounced trend was observed. The amount in the control group [V6] remained stable over time.
Figure 16: Amorphous silicon in the topsoil, T1: date of sample one on May 17, 2016, T2: date of sample two on July 5, 2016, T3: date of sample three on August 25, 2016, One-Way ANOVA Post Hoc Multiple Comparison test was used to determine differences between the treatments, different letters above columns indicate significant differences between treatments, α=0.05, at the same time point of analysis, error bars represent standard error of the mean different letters above columns indicate significant differences between treatments, α=0.05, at the same time point of analysis
Significant differences can be found for the subsoil as well (Figure 17). Soil with Si-soil amendments show increased levels of amorphous silicon compared to the control group. Compared to the topsoil the amplitude of the rise is not that high in the subsoil, but clearly visible and statistically significant.
a a a
b b
a
b
b
a
0
500
1000
1500
2000
2500
3000
3500
V1 Si Soil V3 Si Soil+Spray V6 Control Soil
mg/
kg
AMORPHOUS SLICONTOP SOIL
T1 T2 T3

36
Leaf Analysis The Si concentration of mature leaves (Figure 18) increases with leave age. Clearly visible is the boost of Si concentrations in the treatments with foliar spray [V2] and the combined soil amendment + foliar spray [V3]. Since the treatment Si soil amendment [V1] does not show an increased level of Si compared to the control groups, one can conclude that only the foliar spray increased the level of Si in the leaves.
Figure 18: Silicon concentrations of mature grapevine leaves. T1: date of sample one on June 21, 2016, T2: date of sample two on July 20, 2016, T3: date of sample three on August 25, 2016, One-Way ANOVA Post Hoc Multiple Comparison test was used to determine differences between the treatments, different letters above columns indicate significant differences between treatments, α=0.05, at the same time point of analysis, error bars represent standard error of the mean different letters above columns indicate significant differences between treatments, α=0.05, at the same time point of analysis
The Si level in young leaves was initially much lower at around 200 mg/kg (Figure 19) than for mature leaves which were general > 1000 mg/kg. At time T2, the treatments [V2] and [V3] exceeded 1000 mg/kg also in younger leaved and were statistically distinguishable from the control groups [V5] and [V6]. Surprising is the last sample at T3 where all treatments show highly elevated amounts of Si and the treatments [V2] and [V3] even surpass the Si levels of the mature leaves.
Noteworthy is the significant difference between Si-foliar spray [V2] and the soil amendment + foliar spray [V3] at time T3. Although the soil amendment in [V1] does not show elevated levels of foliar Si, the combination of soil amendment and foliar spray in treatment [V3] seems to further increase the silicon deposits in the leaves.
ab b
a a a
a
b b
a a ab
bb
a a a
0.00
2000.00
4000.00
6000.00
8000.00
10000.00
12000.00
V1 Si Soil V2 Si Spray V3 SiSoil+Spray
V4 Horsetail V5 ControlSoil
V6 ControlSpray
mg/
kg
SILICON IN MATURE LEAVES
T1 T2 T3

38
Photosynthesis
The results of the chlorophyll fluorescence for mature leaves (Figure 20) showed at times T3 and T4 significant reductions in the CPP control group [V7]. The analysis of the chlorophyll fluorescence of young leaves (Figure 21) shows similar results. There is no data in T1 because the first appearing grapevine leaves are included in the mature leaves.
Figure 20: Chlorophyll florescence of mature grapevine leaves, T1: date of sample one on May 30, 2016, T2: date of sample two on June 16, 2016, T3: date of sample three on July 5, 2016, T4: date of sample four July 28, 2016, T5: date of sample five on August 16, 2016, One-Way ANOVA Post Hoc Multiple Comparison test was used to determine differences between the treatments, different letters above columns indicate significant differences between treatments, α=0.05, at the same time point of analysis, error bars represent standard error of the mean different letters above columns indicate significant differences between treatments, α=0.05, at the same time point of analysis
Figure 21: Chlorophyll florescence of young grapevine leaves, T1: date of sample one on May 30, 2016, T2: date of sample two on June 16, 2016, T3: date of sample three on July 5, 2016, T4: date of sample four July 28, 2016, T5: date of sample five on August 16, 2016, One-Way ANOVA Post Hoc Multiple Comparison test was used to determine differences between the treatments, different letters above columns indicate significant differences between treatments, α=0.05, at the same time point of analysis, error bars represent standard error of the mean different letters above columns indicate significant differences between treatments, α=0.05, at the same time point of analysis
a
a b ab a
a
a b b a
a a b ab a
a
a ab ab
a
a
a b ab
a
a
a b ab a
a
a a a a
0.00
0.20
0.40
0.60
0.80
1.00
T 1 T 2 T 3 T 4 T 5
Fv/F
m
CHLOROPHYLL FLUORESCENCEMATURE LEAVES
Si Soil Si Spray Si Soil+Spray Horsetail Control Soil Control Spray CPP
a
a ab a
ab
a ab ab
a
a ab ab
ab
a ab ab
ab
a
ab ab
a
a b bb a a a
0.00
0.20
0.40
0.60
0.80
1.00
T 2 T 3 T 4 T 5
Fv/F
m
CHLOROPHYLL FLUORESCENCEYOUNG LEAVES
Si Soil Si Spray Si Soil+Spray Horsetail Control Soil Control Spray CPP
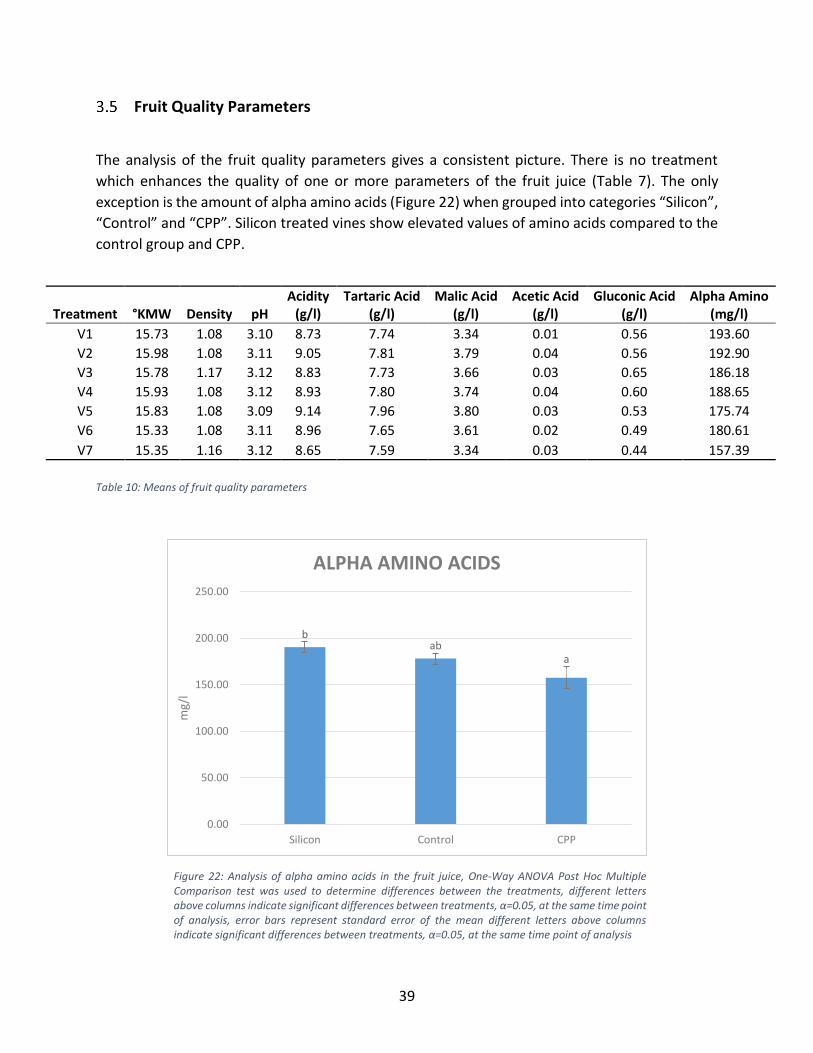
39
Fruit Quality Parameters
The analysis of the fruit quality parameters gives a consistent picture. There is no treatment which enhances the quality of one or more parameters of the fruit juice (Table 7). The only exception is the amount of alpha amino acids (Figure 22) when grouped into categories “Silicon”,
“Control” and “CPP”. Silicon treated vines show elevated values of amino acids compared to the
control group and CPP.
Treatment °KMW Density pH Acidity
(g/l) Tartaric Acid
(g/l) Malic Acid
(g/l) Acetic Acid
(g/l) Gluconic Acid
(g/l) Alpha Amino
(mg/l) V1 15.73 1.08 3.10 8.73 7.74 3.34 0.01 0.56 193.60 V2 15.98 1.08 3.11 9.05 7.81 3.79 0.04 0.56 192.90 V3 15.78 1.17 3.12 8.83 7.73 3.66 0.03 0.65 186.18 V4 15.93 1.08 3.12 8.93 7.80 3.74 0.04 0.60 188.65 V5 15.83 1.08 3.09 9.14 7.96 3.80 0.03 0.53 175.74 V6 15.33 1.08 3.11 8.96 7.65 3.61 0.02 0.49 180.61 V7 15.35 1.16 3.12 8.65 7.59 3.34 0.03 0.44 157.39
Table 10: Means of fruit quality parameters
Figure 22: Analysis of alpha amino acids in the fruit juice, One-Way ANOVA Post Hoc Multiple Comparison test was used to determine differences between the treatments, different letters above columns indicate significant differences between treatments, α=0.05, at the same time point of analysis, error bars represent standard error of the mean different letters above columns indicate significant differences between treatments, α=0.05, at the same time point of analysis
bab
a
0.00
50.00
100.00
150.00
200.00
250.00
Silicon Control CPP
mg/
l
ALPHA AMINO ACIDS

49
6 Appendix EPPO Standard Uncinula necator PP 1/4(4)
European and Mediterranean Plant Protection Organization Organisation Européenne et Méditerranéenne pour la Protection des Plantes
PP 1/4(4) Efficacy evaluation of fungicides Uncinula necator Specific scope This standard describes the conduct of trials for the efficacy evaluation of fungicides against Uncinula necator, causing powdery mildew of grapevine.
1. Experimental conditions 1.1 Test organisms, selection of crop and cultivar Test organism: Uncinula necator (UNCINE). Only productive grapevine Vitis vinifera (VITVI) of the same susceptible cultivar, rootstock habit and age, should be used. 1.2 Trial conditions The trial should be set up in the field. The vineyard should be homogeneous in cultivar, age, plant width, training system, rootstock and general cultivation and health status. Cultural conditions (e.g. soil type, fertilization) should be uniform for all plots of the trial and should conform with local agricultural practice. Microclimate conditions should as far as possible be homogeneous, particularly with respect to altitude, slope and wind exposure. The trial should form part of a trial series carried out in different regions with distinct environmental conditions and preferably in different years or growing seasons (see EPPO Standard PP 1/181 Conduct and reporting of efficacy evaluation trials). 1.3 Design and lay-out of the trial Treatments: test product(s), reference product and untreated control, arranged in a suitable statistical design. Plot size (net): at least 10 vines (or sufficient to provide at least 100 leaves and at least 50 bunches for assessment, as in 3.2) on 3 rows. Sample size may be increased (e.g. 150 leaves and 100 bunches) if the intensity of the disease is not expected to be high. Replicates: at least 4. For further information on trial
Specific approval and amendment First approved in 1977-09. Revision approved in 1987-09. Aligned with revised standard text in 1996. Revision approved in 2001-09. 2. Application of treatments 2.1 Test product(s) The product(s) under investigation should be the named formulated product(s) (see EPPO Standard PP 1/181 Conduct and reporting of efficacy evaluation trials). 2.2 Reference product The reference product should be a product known to be satisfactory in practice under the agricultural, plant health and environmental (including climatic) conditions in the area of intended use. In general, type of action, time of application and method of application should be as close as possible to those of the test product. 2.3 Mode of application Applications should comply with good standard practice. 2.3.1 Type of application The type of application (e.g. a spray or a dust) should be as specified for the intended use. 2.3.2 Type of equipment Application(s) should be made with equipment which provides an even distribution of product on the whole plot or accurate directional application where appropriate, equivalent to good commercial practice. Factors which may affect efficacy (such as operating pressure, nozzle type) should be chosen in relation to the intended use.

52
EPPO Standard Plasmopara viticola PP 1/4(4) European and Mediterranean Plant Protection Organization Organisation Européenne et méditerranéenne pour la Protection des Plantes
PP 1/31(3) Efficacy evaluation of fungicides Plasmopara viticola Specific scope This standard describes the conduct of trials for the efficacy evaluation of fungicides against Plasmopara viticola, causing downy mildew of grapevine. 1. Experimental conditions 1.1 Test organisms, selection of crop and cultivar Test organism: Plasmopara viticola (PLASVI). Crop: grapevine Vitis vinifera (VITVI). 1.2 Trial conditions The trial should be set up in the field in productive vineyards with natural infection but, in certain circumstances, it may be necessary to carry out the trial on special small plots, with artificial inoculation and misting in order to enhance infection. Cultural conditions (e.g. soil type, fertilization) should be uniform for all plots of the trial and should conform with local viticultural practice. The trial should preferably be set up in a topographically and climatically homogeneous environment favorable to the pathogen. The trial should form part of a trial series carried out in different regions with distinct environmental conditions and preferably in different years or growing seasons (see EPPO Standard PP 1/181 Conduct and reporting of efficacy evaluation trials). 1.3 Design and lay-out of the trial Treatments: test product(s), reference product and untreated control, arranged in a suitable statistical design. Plot size (net): sufficient to provide at least 100 bunches per plot for natural infection or 50 bunches per plot when artificial inoculation is used. Replicates: at least 4. For further information on trial design, see EPPO Standard PP 1/152 Design and analysis of efficacy evaluation trials.
Specific approval and amendment First approved in 1980-09. Aligned with revised standard text in 1996. Revision approved in 2000-09.
2. Application of treatments 2.1 Test product(s) The product(s) under investigation should be the named formulated product(s) (see EPPO Standard PP 1/181 Conduct and reporting of efficacy evaluation trials). 2.2 Reference product The reference product should be a product known to be satisfactory in practice under the agricultural, plant health and environmental (including climatic) conditions in the area of intended use. In general, type of action, time of application and method of application should be as close as possible to those of the test product. 2.3 Mode of application Applications should comply with good standard practice. 2.3.1 Type of application The type of application (e.g. a spray) should be as specified for the intended use. 2.3.2 Type of equipment Application(s) should be made with equipment which provides an even distribution of product on the whole plot or accurate directional application where appropriate, equivalent to a good commercial practice. Factors which may affect efficacy (such as operating pressure, nozzle type) should be chosen in relation to the intended use. 2.3.3 Time and frequency of application The number of applications and the date of each application should be as specified for the intended use.

55
Evaluation Form

56
BBCH-Scale for Grapevine
Growth stage Code Description 0: Sprouting/Bud development
00 Dormancy: winter buds pointed to rounded, light or dark brown according to cultivar; bud scales more or less closed according to cultivar
01 Beginning of bud swelling: buds begin to expand inside the bud scales 03 End of bud swelling: buds swollen, but not green 05 “Wool stage”: brown wool clearly visible 07 Beginning of bud burst: green shoot tips just visible 09 Bud burst: green shoot tips clearly visible
1: Leaf development 11 First leaf unfolded and spread away from shoot 12 2nd leaves unfolded 13 3rd leaves unfolded 19 9 or more leaves unfolded
5: Inflorescence emerge
53 Inflorescences clearly visible 55 Inflorescences swelling, flowers closely pressed together 57 Inflorescences fully developed; flowers separating
6: Flowering 60 First flowerhoods detached from the receptacle 61 Beginning of flowering: 10% of flowerhoods fallen 62 20% of flowerhoods fallen 63 Early flowering: 30% of flowerhoods fallen 64 40% of flowerhoods fallen 65 Full flowering: 50% of flowerhoods fallen 66 60% of flowerhoods fallen 67 70% of flowerhoods fallen 68 80% of flowerhoods fallen 69 End of flowering
7: Development of fruits
71 Fruit set: young fruits begin to swell, remains of flowers lost 73 Berries groat-sized, bunches begin to hang 75 Berries pea-sized, bunches hang 77 Berries beginning to touch 79 Majority of berries touching
8: Ripening of berries
81 Beginning of ripening: berries begin to develop variety-specific colour 83 Berries developing colour 85 Softening of berries 89 Berries ripe for harvest
9: Senescence 91 After harvest; end of wood maturation

57
Powdery Mildew VitiMeteo Prognostic Data

65
Downy Mildew VitiMeteo Prognostic Data

73
CaCl2 Extraction of Plant-Available Silicon on Soils (modified from Haysom and Chapman, 1975 and Liang et al., 2015)
SERVES 10 samples in duplicate
20 MINUTES 16 HOURS SHAKING
2g air-dried soil 0.01M CaCl2 SOLUTION
1 Liter HQ Water
1.4702g calcium chloride
As the total Si content is not related to the concentration of soluble Si in soils and can provide little information on soil Si availability to plants, this method is developed to extract plant-available Si from soils.
For the preparation of the 0.01M solution add the calcium chloride to the HQ Water.
Put 2g of air-dried soil (<2mm) into a 50-ml polyethylene tube and by pipette, add 20ml of the 0.01M CaCl2 solution to the tube. Shake this for 16 hours in an overhead shaker and filtrate it with Munktell Ahlstrom paper filters with a grade of 14/N.
NaOH Extraction of Amorphous Silica in Soils
(modified from Georgiadis et al., 2015)
SERVES 25 samples in duplicate
121 HOURS
25mg of ground soil
0.2M NaOH SOLUTION
8g Sodium hydroxide 1 Liter HQ water
A solution of 0.2 M NaOH almost completely extracts amorphous silica, and when applied at room temperature and a solid: solution ratio of 1:400, only slightly brakes down crystalline Si compounds. The predictable and reproducible underestimation was considered more acceptable than the variable partial dissolution of silicates that occurs during extraction at higher temperatures. It is recommended using this method on soils from temperate-humid climate to estimate the amorphous Si fraction.
Before starting with the procedure it is important to calculate the water content of the soil. Therefore, weigh the wet and dry weight of the soil samples. Dry them at 105°C for 48 hours. The water content is calculated as a ratio of the weight of the evaporated water and the weight of the wet soil (wc = wH20 / wwet)
Prepare the NaOH solution and grind you soil samples in a Retsch Ball Mill for 10min. In a 100ml calibrated flask, add the 0.2M sodium hydroxide solution in a ratio of 1:400 to it. Use a balance for determining the exact amount.
Afterwards shake the samples for 120 hours in an overhead shaker at room temperature and filtrate the samples with Munktell Ahlstrom paper filters with a grade of 14/N.

74
Adsorptiometric Determination of Silicon (modified from Morrison and Wilson, 1963)
SERVES 10 samples in duplicate
1 HOUR 30 MINUTES
Soil extraction samples (see CaCl2 extraction or NaOH extraction)
HQ Water
Tartaric acid
ACIDIFIED MOLYBDATE SOLUTION
89g ammonium molybdate
62ml of 98% sulphuric acid
REDUCING AGENT
1.2g sodium sulphite
0.2g 4-amino-3-hydroxy-1-naphthalenesulphonic acid (purest grad available)
14g potassium disulphite
STANDARD SOLUTIONS OF SILICA
1000g pure dry silica
5g anhydrous sodium carbonate
A method together with a modification for obtaining high sensitivity for determining plant-available silicon in soil. It is based on the absorptiometric measurement of solutions of reduced β-molybdosilicic acid. The limit of detection was about 0.001 ppm of silica.
All reagents should be of analytical grade unless otherwise stated. Start with the acidified molybdate solution and dissolve the ammonium molybdate in about 800 ml of water at room temperature. Dilute the sulphuric acid to about 100ml by adding it cautiously to water, with stirring, and allow to cool. Add the acid to the molybdate solution and dilute to 1 liter. The reagent may be kept for several months. Make a 28 per cent. w/v solution with the tartaric acid. It can be kept for at least 3 months. For the reducing agent dissolve the sodium sulphite and 4-amino-3-hydroxy-1-naphthalenesulphonic acid in about 70ml of water. Add the potassium disulphite and shake well until dissolved and dilute to 100ml. This reagent should be freshly prepared each week. For the standard solutions of silica fuse the pure dry silica with the anhydrous sodium carbonate in a platinum crucible at red heat. When cool, dissolve in water and dilute to exactly 1 liter. This solution contains 1000 ppm of silica. Prepare different solutions of silica by diluting. The solutions are stable for at least 3 months. By pipette place 0.4ml of your extraction samples in 100ml calibrated flasks. Add 16ml of HQ water and 1ml of acidified molybdate solution. 10 minutes later ±3 minutes add 1ml of tartaric acid and wait for 5 minutes ±1 minute before proceeding. 0.5ml of the reducing agent is added and some samples might already become blueish. Fill up the flasks with 1.1ml to a 20ml solution. Wait one hour before measuring the optical density with a photometer. Use the prepared standard solution to get a calibration curve of the photometer. The blank solution should contain 80ml of water of the same batch as was used for the preparing and diluting the standards. From the obtained results prepare a calibration curve.

75
NaOH Extraction of Amorphous Silica in Plants (modified from Elliot and Snyder, 1991)
SERVES 24 samples in duplicate
3 HOURS
100mg ground plant tissue
HQ water
50% H2O2
50% NaOH SOLUTION
Many methodologies for the determination of Si in plant tissue are tedious and slow and/or involve cumbersome safety precautions. This new autoclave-induced digestions (AID) method has been developed to make plant tissue extraction easier. The method is linearly correlated with Si determination by NaOH fusion.
100mg of ground plant tissue is wetted with 2ml of 50% H2O2 in 100-ml polyethylene tubes. Add 4.5g of 50% NaOH solution and vortex the tubes gently.
The tubes were covered with lose fitting plastic caps and samples were placed in an autoclave at 121°C with a sterilization phase of 20 minutes. Afterwards when cooled down the content is filled up with HQ water to 50ml and samples are centrifuged at 1000 g for 5 minutes at room temperature.
Eextracts were analyzed colorimetrically with a Varian DMS 200 UV visible spectrophotometer (see 6.9 Adsorptiometric Determination of Silicon).

76
LUDOX TM50 Colloidal Silica

77
Equisetum Plus