Signal System Timing and Phasing Program Mar-15 Second St.€¦ · Signal System Timing and Phasing...
7
Signal System Timing and Phasing Program Mar-15 1 I. Overview Consultant A was retained by the Ohio Department of Transportation to conduct traffic signal timing analyses on approximately one mile of roadway on Sample Road between the Main Street and the Fourth Street intersections, in the City of Generic, Random County, Ohio. Sample Road is a heavily traveled east west principal urban arterial. The study includes analyses of the following signalized intersections: 1. Sample Rd. and Main St. 2. Sample Rd. and Second St. 3. Sample Rd. and Third St. 4. Sample Rd. and Fourth St. A general location map is shown in Figure-1 below: Figure 1: General Location Map Sample Rd. Main St. Second St. II. Analysis A. Signal Operational Analyses Traffic modeling and analysis software, Synchro v8, was used for the signal operation analyses. Models were designed for the different peak conditions: 1. AM Peak model 2. Mid-day Peak model 3. PM Peak model 4. Off Peak model Synchro is used to determine the Level-of-Service (LOS) defined in terms of delay. Table-1 shows the definitions of each LOS. SAMPLE
Transcript of Signal System Timing and Phasing Program Mar-15 Second St.€¦ · Signal System Timing and Phasing...

Signal System Timing and Phasing Program Mar-15
1
I. Overview
Consultant A was retained by the Ohio Department of Transportation to conduct traffic signal
timing analyses on approximately one mile of roadway on Sample Road between the Main Street
and the Fourth Street intersections, in the City of Generic, Random County, Ohio. Sample Road
is a heavily traveled east west principal urban arterial. The study includes analyses of the following
signalized intersections:
1. Sample Rd. and Main St.
2. Sample Rd. and Second St.
3. Sample Rd. and Third St.
4. Sample Rd. and Fourth St.
A general location map is shown in Figure-1 below:
Figure 1: General Location Map
Sample Rd.
Mai
n S
t.
Seco
nd
St.
II. Analysis
A. Signal Operational Analyses
Traffic modeling and analysis software, Synchro v8, was used for the signal operation analyses.
Models were designed for the different peak conditions:
1. AM Peak model
2. Mid-day Peak model
3. PM Peak model
4. Off Peak model
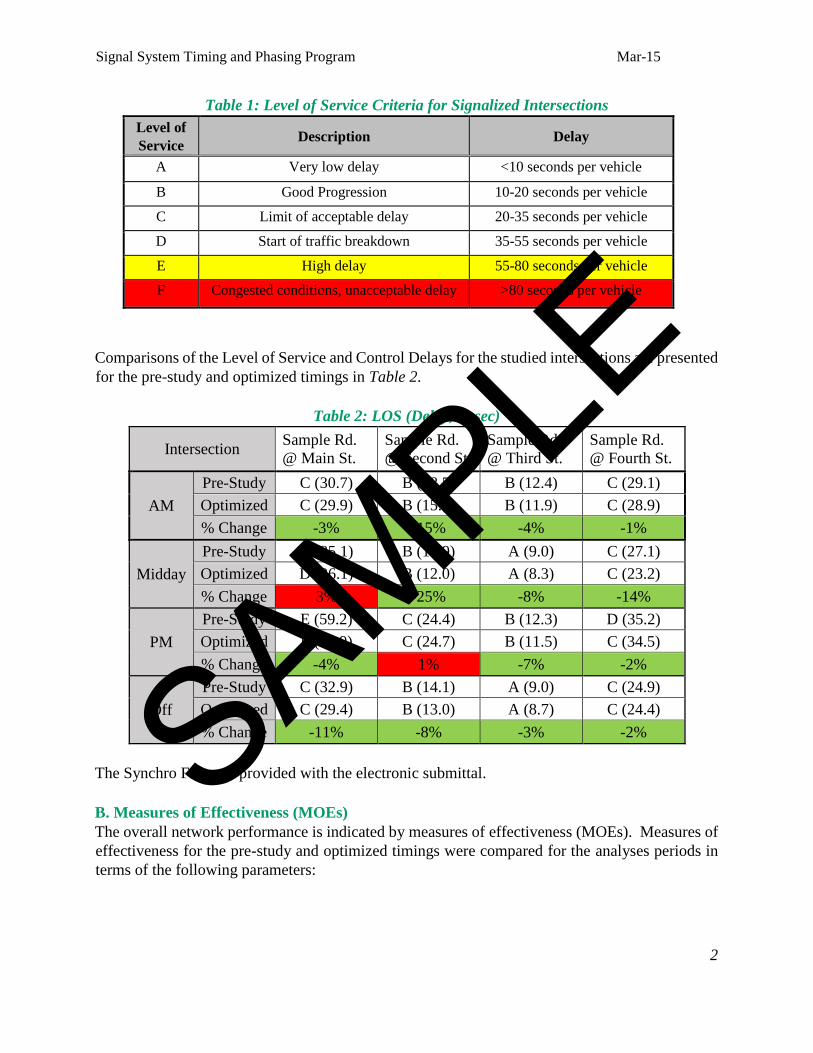
Synchro is used to determine the Level-of-Service (LOS) defined in terms of delay. Table-1 shows
the definitions of each LOS.
SAMPLE
Signal System Timing and Phasing Program Mar-15
2
Table 1: Level of Service Criteria for Signalized Intersections
Level of
Service Description Delay
A Very low delay <10 seconds per vehicle
B Good Progression 10-20 seconds per vehicle
C Limit of acceptable delay 20-35 seconds per vehicle
D Start of traffic breakdown 35-55 seconds per vehicle
E High delay 55-80 seconds per vehicle
F Congested conditions, unacceptable delay >80 seconds per vehicle
Comparisons of the Level of Service and Control Delays for the studied intersections are presented
for the pre-study and optimized timings in Table 2.
Table 2: LOS (Delay, in sec)
Intersection Sample Rd.
@ Main St.
Sample Rd.
@ Second St.
Sample Rd.
@ Third St.
Sample Rd.
@ Fourth St.
AM
Pre-Study C (30.7) B (18.5) B (12.4) C (29.1)
Optimized C (29.9) B (15.7) B (11.9) C (28.9)
% Change -3% -15% -4% -1%
Midday
Pre-Study D (35.1) B (15.9) A (9.0) C (27.1)
Optimized D (36.1) B (12.0) A (8.3) C (23.2)
% Change 3% -25% -8% -14%
PM
Pre-Study E (59.2) C (24.4) B (12.3) D (35.2)
Optimized E (56.9) C (24.7) B (11.5) C (34.5)
% Change -4% 1% -7% -2%
Off
Pre-Study C (32.9) B (14.1) A (9.0) C (24.9)
Optimized C (29.4) B (13.0) A (8.7) C (24.4)
% Change -11% -8% -3% -2%
The Synchro Files are provided with the electronic submittal.
B. Measures of Effectiveness (MOEs)
The overall network performance is indicated by measures of effectiveness (MOEs). Measures of
effectiveness for the pre-study and optimized timings were compared for the analyses periods in
terms of the following parameters:
SAMPLE
Signal System Timing and Phasing Program Mar-15
3
Travel Time (sec)
Vehicle Delay (sec)
Stopped Delay (sec)
Stops/Vehicle
Average Speed (mph)
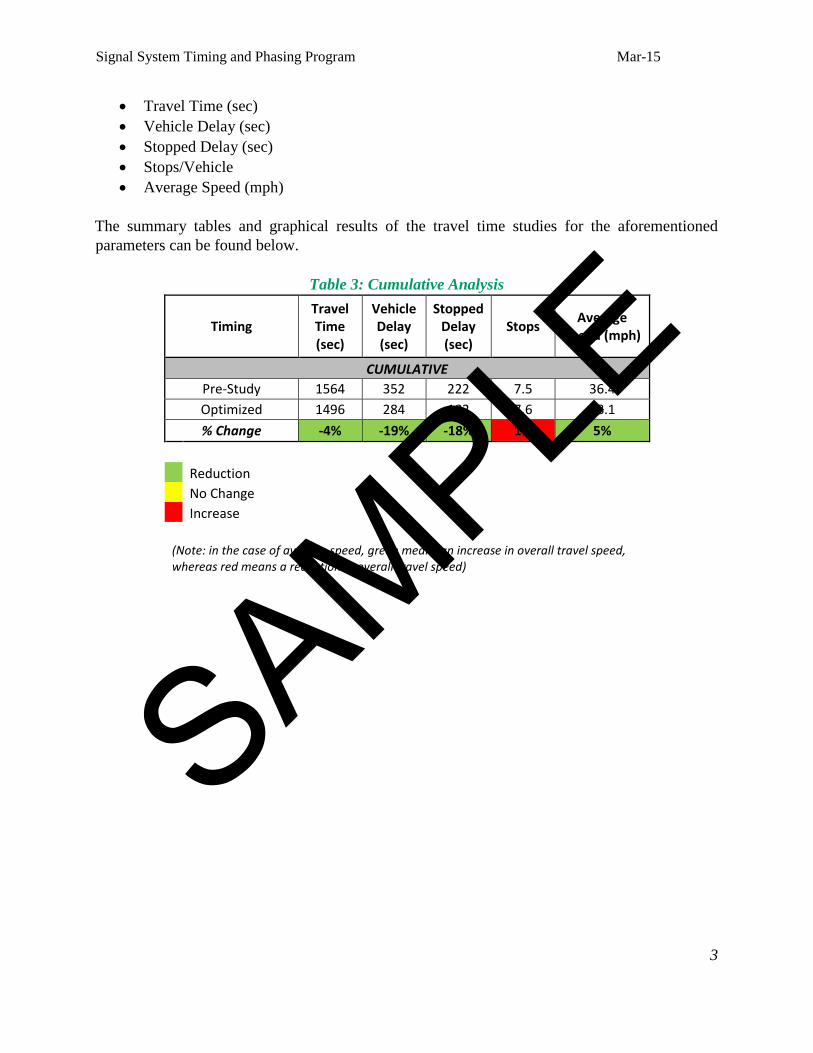
The summary tables and graphical results of the travel time studies for the aforementioned
parameters can be found below.
Table 3: Cumulative Analysis
Timing Travel Time (sec)
Vehicle Delay (sec)
Stopped Delay (sec)
Stops Average
Speed (mph)
CUMULATIVE
Pre-Study 1564 352 222 7.5 36.4
Optimized 1496 284 182 7.6 38.1
% Change -4% -19% -18% 1% 5%
Reduction
No Change
Increase
(Note: in the case of average speed, green means an increase in overall travel speed, whereas red means a reduction in overall travel speed)
SAMPLE

Signal System Timing and Phasing Program Mar-15
4
Table 4: Peak Hour Analysis
Timing Direction Travel Time (sec)
Vehicle Delay (sec)
Stopped Delay (sec)
Stops Average
Speed (mph)
AM Peak
Pre-Study EB 277 75 65 2.0 33.9
Optimized EB 265 63 43 2.0 35.4
EB % Change -4% -16% -34% 0% 4%
Pre-Study WB 231 29 12 0.7 41.3
Optimized WB 230 28 15 1.0 40.5
WB % Change 0% -3% 25% 43% -2%
MIDDAY Peak
Pre-Study EB 279 77 49 1.5 33.5
Optimized EB 255 53 27 1.2 37.1
EB % Change -9% -31% -45% -20% 11%
Pre-Study WB 245 43 20 0.9 38.6
Optimized WB 233 31 23 0.8 41.3
WB % Change -5% -28% 15% -11% 7%
PM Peak
Pre-Study EB 240 38 12 0.7 39.0
Optimized EB 229 27 18 0.7 41.0
EB % Change -5% -29% 50% 0% 5%
Pre-Study WB 292 90 64 1.7 32.0
Optimized WB 284 82 56 1.9 33.2
WB % Change -3% -9% -13% 12% 4%
Reduction
No Change
Increase
(Note: in the case of average speed, green means an increase in overall travel speed, whereas red means a reduction in overall travel speed)
SAMPLE

Signal System Timing and Phasing Program Mar-15
5
Figure 2a: Sample Road, Travel Time
0
50
100
150
200
250
300
350
AM Midday PM AM Midday PM
Trav
el T
ime
in S
eco
nd
s
Sample RoadTravel Time
Optimized Pre-Study
EASTBOUND WESTBOUND
SAMPLE
Signal System Timing and Phasing Program Mar-15
6
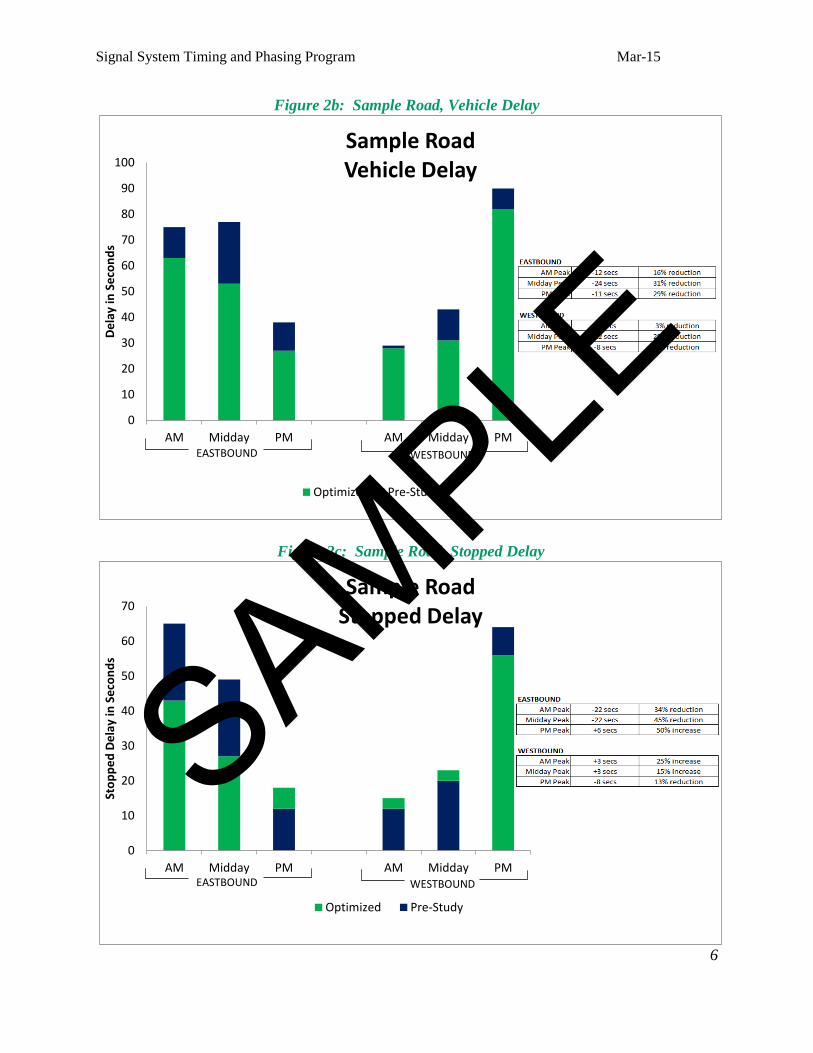
Figure 2b: Sample Road, Vehicle Delay
Figure 2c: Sample Road, Stopped Delay
0
10
20
30
40
50
60
70
80
90
100
AM Midday PM AM Midday PM
De
lay
in S
eco
nd
s
Sample RoadVehicle Delay
Optimized Pre-Study
EASTBOUND WESTBOUND
0
10
20
30
40
50
60
70
AM Midday PM AM Midday PM
Sto
pp
ed
De
lay
in S
eco
nd
s
Sample RoadStopped Delay
Optimized Pre-Study
EASTBOUND WESTBOUND
SAMPLE
Signal System Timing and Phasing Program Mar-15
7
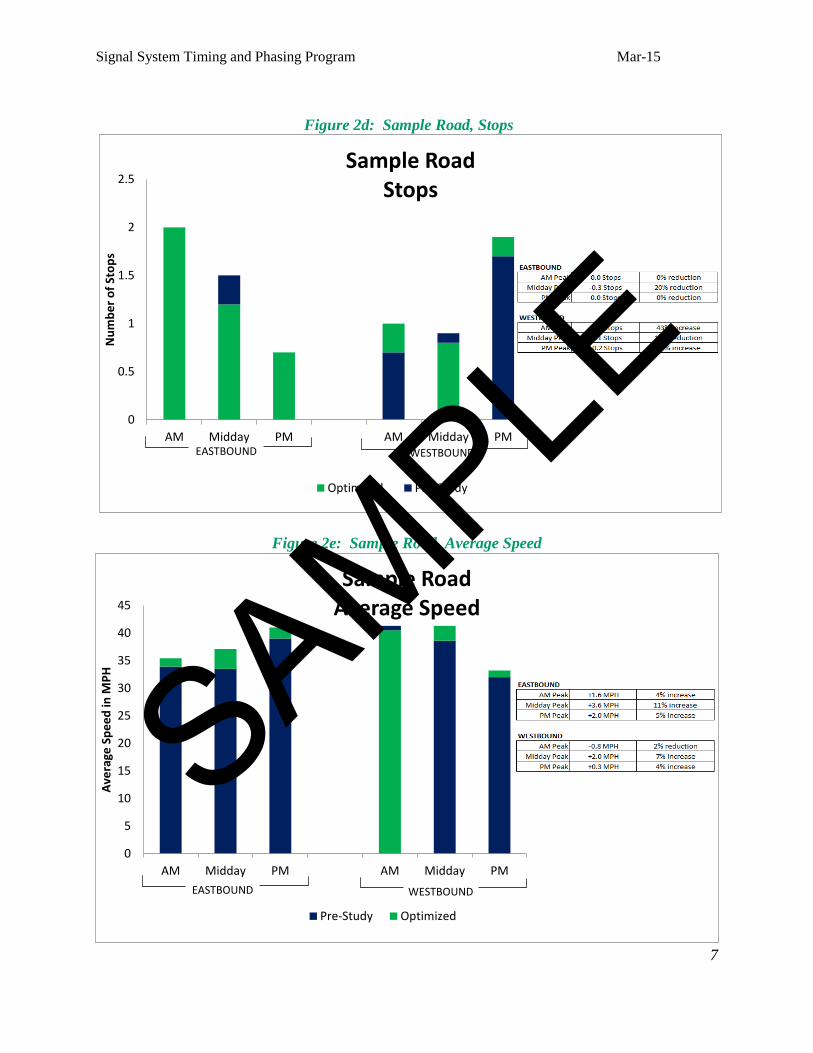
Figure 2d: Sample Road, Stops
Figure 2e: Sample Road, Average Speed
0
0.5
1
1.5
2
2.5
AM Midday PM AM Midday PM
Nu
mb
er
of
Sto
ps
Sample RoadStops
Optimized Pre-Study
EASTBOUND WESTBOUND
0
5
10
15
20
25
30
35
40
45
AM Midday PM AM Midday PM
Ave
rage
Sp
ee
d in
MP
H
Sample RoadAverage Speed
Pre-Study Optimized
EASTBOUND WESTBOUND
SAMPLE