Sierra Club CPUC White Paper Attachment 2
14
ATTACHMENT 2
-
Upload
savethedesert -
Category
Documents
-
view
1.385 -
download
0
description
Sierra Club submission to the California Public Utilities Commission regarding the benefits of rooftop solar.
Transcript of Sierra Club CPUC White Paper Attachment 2

ATTACHMENT 2

1
Non-Energy Benefits of Distributed Generation Inputs for Use in NEM Successor Tariff Proceeding
August 3, 2015
Prepared by Alison Seel (Sierra Club) and Tom Beach (Crossborder Energy)
I. INTRODUCTION
Renewable distributed generation (“DG”) has benefits to society that cannot be measured on
utility balance sheets. When renewable generation takes the place of conventional fossil fuel generation,
everyone benefits from reductions in the air pollution that improves human and environmental health.
Demand on existing water supplies is reduced, avoiding the potential need to acquire new sources of
supply. Distributed generation in particular, by siting energy generation in the built environment, results
in more land being available for other uses, or as natural habitat. Distributed generation makes the power
system more resilient, and stimulates the local economy.
This whitepaper was developed in the context of E3’s “Public Tool” model on the costs and
benefits of distributed generation in California. It makes use of the many existing studies and
methodologies for calculating these non-energy benefits of distributed generation to develop figures for
these benefits that are specific to California, and in the correct metric to enter into the Public Tool.
II. RECOMMENDED INPUTS The following inputs can be entered in the E3 Public Tool on the Key Driver Inputs tab.
Avoided Cost Recommended Value Unit (2015 $) Societal Cost of Carbon with Base Carbon Market Costs:
Base: 30 / High: 109 with High Carbon Market Costs:
Base: 14 / High: 94
$ / tonne CO2
Societal Cost of PM-10 184 $ / lb Societal Cost of NOX 24 $ / lb Externality Costs Related to RPS -- $ / kW-yr RPS Capacity Energy Security Cost -- $ /kWh Thermal Generation Other: Water 0.0007 $ / kWh Thermal Generation Other: Total 0.054 $ / kWh NEM Generation
Reliability and Resiliency 0.022 $ / kWh NEM Generation Land Use 0.002 $ / kWh NEM Generation Local Economic Benefits 0.030 $ / kWh of NEM Generation

2
III. SOCIAL COST OF CARBON
Recommended Inputs: 1 (all figures per tonne CO2) If using High Carbon Market Costs: Base: $14 / High: $94
If using Base Carbon Market Costs: Base: $30 / High: $109
The damage posed by the climate change is severe and impending. Scientists predict costs to
California from increased wildfires, loss of the Sierra snowpack, and sea level rise. Indeed, scientists have
linked California’s current extreme drought, which is crippling the state and costing billions of dollars, to
greenhouse gas pollution.2 The social cost of carbon is a way of conceptualizing the value of immediate
actions to reduce greenhouse gas emissions; in this way it is “a measure of the seriousness of climate
change.”3 The carbon costs that are currently included in the Public Tool are limited to cap and trade
permit compliance costs, and therefore do not fully capture the urgency of necessary action because these
permits are much less costly than the true cost that carbon pollution imposes on society.
A reputable source for estimates of the social cost of carbon is the federal government’s
Interagency Working Group on the Social Cost of Carbon.4 The values developed by the group have
been vetted by numerous government agencies, research institutes and other stakeholders. The estimates
were derived by combining results from the three most prominent integrated climate assessment models,
each run under five different reference scenarios.5 The group gave equal weight to each model and
averaged the results across each scenario to obtain a range of values, given in the table below.
1 Because this benefit is shared by all carbon-free sources of electricity, the Public Tool automatically disregards this value if the model run assumes distributed generation avoids 100% of RPS generation (i.e. DG/RPS parity) or is awarded Bucket 1 treatment. 2 National Science Foundation Press Release 14-129 , “Cause of California drought linked to climate change,” Sept. 29 2014. Available at http://www.nsf.gov/news/news_summ.jsp?cntn_id=132709&WT.mc_id=USNSF_52&WT.mc_ev=click. 3 Anthoff, D. and Toll, R.S.J. 2013. The uncertainty about the social cost of carbon: a decomposition analysis using FUND. Climactic Change 117: 515-530. 4 Interagency Working Group on Social Cost of Carbon, “Technical Update of the Social Cost of Carbon for Regulatory Impact Analysis” (Revised July 2015). Available at https://www.whitehouse.gov/sites/default/files/omb/inforeg/scc-tsd-final-july-2015.pdf. 5 Id. The three models are the Dynamic Integrated Climate-Economy (DICE) model, the Climate Framework for Uncertainty, Negotiation and Distribution (FUND) model, and the Policy Analysis of the Greenhouse Effect (PAGE) model.

3
Table 1: 2015 Societal Cost of Carbon6 Figures in 2007$ per metric ton of CO2
Discount Rate and Statistic
5% Average 3% Average 2.5% Average 3% 95th percentile
11 36 56 105
A base case for the cost of carbon is the mid value of $36 per tonne, with a sensitivity case of
$105 per tonne to represent the possibility that damages from climate change are worse than the models
can currently anticipate. The Public Tool will increase the 2015 inputs by 5% per year, in recognition of
the fact that “future emissions are expected to produce larger incremental damages as physical and
economic systems become more stressed in response to greater climate change.”7
While estimating the social cost of carbon contains many inherent uncertainties, we believe these
values are defensible. Despite the unknowns, federal government agencies are required to use these
figures in cost-benefit analysis. The mid-range real discount rate of 3% is a typical societal discount rate
often used in long-term benefit/cost analyses. It is also a conservative assumption, when considering the
diminished prosperity future generations will face in a world heavily impacted by climate disruption.
Because “the choices we make today greatly influence the climate our children and grandchildren
inherit,” future benefits should not be significantly discounted relative to current costs.8 As Pope Francis
recently wrote in his encyclical calling for “all people of goodwill” to take action on climate change, “The
climate is a common good, belonging to all and meant for all.”9
Including a sensitivity case using carbon costs in the event that climate disruption is worse than
currently anticipated is also appropriate in recognition of California’s vulnerability to climate change, as
well as the ever-escalating predictions of climate impacts: each new study predicts climate impacts will
be more severe than its predecessors previously estimated. Updated assessments consistently conclude
that earlier analyses understate future climate impacts: For example, in its 2012 assessment of climate
change impacts, the California Climate Change Center determined that sea level rise along the California
coast could increase by 31-55 inches by the end of the century, 9-25 inches more than its 2006 estimate.10
6 Id., p. 13. 7 Id, pp. 13-14. 8 California Climate Change Center, Our Changing Climate: Assessing the Risks to California (2006) at p. 2. http://www.energy.ca.gov/2006publications/CEC-500-2006-077/CEC-500-2006-077.pdf. 9 Encyclical Letter Laudato Si’ of the Holy Father Francis on Care for Our Common Home. June 18, 2015. 10 Compare California Climate Change Center, Our Changing Climate 2012: Vulnerability & Adaptation to the Increasing Risks from Climate Change in California (2012) at p. 9, http://www.energy.ca.gov/2012publications/CEC-500-2012-007/CEC-500-2012-007.pdf, with California

4
As the Intergovernmental Panel on Climate Change wrote in their Fourth Assessment Report, “It is very
likely that [social cost of carbon estimates] underestimate the damage costs because they cannot include
many non-quantifiable impacts.”11 The EPA agrees its cost figures are highly conservative
approximations, and advises that even the highest values should be understood to underestimate the true
societal costs of climate change, as the models “do not currently include all of the important physical,
ecological, and economic impacts of climate change … because of a lack of precise information on the
nature of damages.”12
The EPA figure was then converted for use in the Public Tool using the Department of Labor’s
Consumer Price Index Inflation calculator and the price of 2015 carbon permits assumed in the Public
Tool.13
Base case:
�$36/𝑡𝑡 × 1.15 (2015$)1 (2007$) � − $11.47 = $29.93/𝑡𝑡 (𝐵𝐵𝐵𝐵𝐵𝐵𝐵𝐵 𝐶𝐶𝐵𝐵𝐶𝐶𝐶𝐶𝐶𝐶𝐶𝐶 𝑀𝑀𝐵𝐵𝐶𝐶𝑀𝑀𝐵𝐵𝑡𝑡 𝑐𝑐𝐶𝐶𝐵𝐵𝑡𝑡 𝐵𝐵𝑐𝑐𝐵𝐵𝐶𝐶𝐵𝐵𝐶𝐶𝑠𝑠𝐶𝐶)
�$36/𝑡𝑡 × 1.15 (2015$)1 (2007$) � − $27.14 = $14.26/𝑡𝑡 (𝐻𝐻𝑠𝑠𝐻𝐻ℎ 𝐶𝐶𝐵𝐵𝐶𝐶𝐶𝐶𝐶𝐶𝐶𝐶 𝑀𝑀𝐵𝐵𝐶𝐶𝑀𝑀𝐵𝐵𝑡𝑡 𝑐𝑐𝐶𝐶𝐵𝐵𝑡𝑡 𝐵𝐵𝑐𝑐𝐵𝐵𝐶𝐶𝐵𝐵𝐶𝐶𝑠𝑠𝐶𝐶)
High case:
�$105/𝑡𝑡 × 1.15 (2015$)1 (2007$) � − $11.47 = $109.28/𝑡𝑡 (𝐵𝐵𝐵𝐵𝐵𝐵𝐵𝐵 𝐶𝐶𝐵𝐵𝐶𝐶𝐶𝐶𝐶𝐶𝐶𝐶 𝑀𝑀𝐵𝐵𝐶𝐶𝑀𝑀𝐵𝐵𝑡𝑡 𝑐𝑐𝐶𝐶𝐵𝐵𝑡𝑡 𝐵𝐵𝑐𝑐𝐵𝐵𝐶𝐶𝐵𝐵𝐶𝐶𝑠𝑠𝐶𝐶)
�$105/𝑡𝑡 × 1.15 (2015$)1 (2007$) � − $27.14 = $93.61/𝑡𝑡 (𝐻𝐻𝑠𝑠𝐻𝐻ℎ 𝐶𝐶𝐵𝐵𝐶𝐶𝐶𝐶𝐶𝐶𝐶𝐶 𝑀𝑀𝐵𝐵𝐶𝐶𝑀𝑀𝐵𝐵𝑡𝑡 𝑐𝑐𝐶𝐶𝐵𝐵𝑡𝑡 𝐵𝐵𝑐𝑐𝐵𝐵𝐶𝐶𝐵𝐵𝐶𝐶𝑠𝑠𝐶𝐶)
Climate Change Center, Our Changing Climate: Assessing the Risks to California (2006) at p. 15, http://www.energy.ca.gov/2006publications/CEC-500-2006-077/CEC-500-2006-077.PDF (estimating 22-30 inches of sea level rise by the end of the century). 11 Intergovernmental Panel on Climate Change, “Climate Change 2007: Synthesis Report.” at p. 69. Available at http://www.ipcc.ch/pdf/assessment-report/ar4/syr/ar4_syr.pdf. 12 See, e.g., EPA website, “The Social Cost of Carbon,” http://www.epa.gov/climatechange/EPAactivities/economics/scc.html. 13 U.S. Dept. of Labor, Bureau of Labor Statistics CPI Inflation Calculator. Available at http://www.bls.gov/data/inflation_calculator.htm; Public Tool “Key Driver Inputs” tab, carbon price chart.

5
IV. SOCIETAL COST OF PM-10 AND NOX
Recommended Inputs14 PM-10: $ 184 / lb NOX: $ 24 / lb
Reductions in criteria pollutant emissions improve human health. Exposure to particulate matter
(PM) causes asthma and other respiratory illnesses, cancer, and premature death.15 Nitrous oxides (NOX)
react with volatile organic compounds in the atmosphere to form ozone, which causes similar health
problems.16
We recommend using the monetary quantification of the health benefits provided by reductions in
criteria pollutants that were developed by the EPA in conjunction with the Clean Power Plan. These
benefit estimates are recent, as they were developed last year as part of the technical analysis for the
proposed rule. The estimates are provided in the same metric as the Public Tool inputs and therefore
require minimal conversion to be useful. Additionally, the figures are specific to California, and take into
account population density and emissions factors specific to the California electric generation fleet.
A. Particulate Matter While the Public Tool includes an input blank for the societal cost of PM -10 emissions, it is our
understanding that PM-10 is not typically emitted by power plants. Instead, we understand that
combustion processes create PM-2.5:
Fine particles (less than 2.5 microns) are produced mainly by combustion of fossil fuels, either from stationary or mobile sources. Coarse particles (sometimes called PM 102.5 [sic]) are mainly primary pollutants that may come from abrasive or crushing processes or the suspension of soil.17
14 Similar to the social cost of carbon, health benefits are also shared by all carbon-free sources of electricity. These values will also automatically be disregarded by the Public Tool if the model assumes distributed generation avoids 100% RPS generation (i.e. DG/RPS parity) or is awarded Bucket 1 treatment. We assume 2% per year escalation in this benefit. 15 EPA, Regulatory Impact Analysis for the Proposed Carbon Pollution Guidelines for Existing Power Plants and Emission Standards for Modified and Reconstructed Power Plants (June 2014), p. 4-17 (“CPP Technical Analysis”). Available at http://www2.epa.gov/sites/production/files/2014-06/documents/20140602ria-clean-power-plan.pdf 16 Id. 17 National Research Council, Hidden Costs of Energy (National Academies Press, 2010), p. 69. Available at http://www.nap.edu/catalog.php?record_id=12794

6
The Public Tool uses an emissions factor of 0.0077 lbs/MMBtu for PM-10 emissions from natural gas.18
This figure is apparently derived from “AP 42,” the EPA’s compilation of air pollutant emissions
factors.19 AP 42 states that the “PM emission factors presented here may be used to estimate PM-10, PM-
2.5 or PM-1 emissions.”20 We therefore recommend using PM-2.5 damage costs in the space labelled
PM-10 in the Public Tool.
The EPA health co-benefit figures distinguish between types of PM, and calculate two separate
benefit-per-ton estimates for PM: for PM emitted as elemental and organic carbon, and for PM emitted as
crustal particulate matter.21 The EPA estimates that approximately 30% of primary PM-2.5 emitted in
California is crustal material, with the bulk of the remainder being elemental or organic carbon.22 The
emission rate estimates used in the Public Tool are for total primary PM-2.5 and do not differentiate
among particle types.23 As a result, we weigh the mid-point of each of the two benefit-per-ton estimates
according to EPA’s assumptions for California emissions.
For elemental and organic carbon:
425,000 (2011$)1 𝐵𝐵ℎ𝐶𝐶𝐶𝐶𝑡𝑡 𝑡𝑡𝐶𝐶𝐶𝐶 × 1.06 (2015$)
1 (2011$) × 1 𝐵𝐵ℎ𝐶𝐶𝐶𝐶𝑡𝑡 𝑡𝑡𝐶𝐶𝐶𝐶2,000 𝑙𝑙𝐶𝐶𝐵𝐵 = $225.25 𝑝𝑝𝐵𝐵𝐶𝐶 𝑙𝑙𝐶𝐶 𝑃𝑃𝑀𝑀 (𝐸𝐸𝐶𝐶 + 𝑂𝑂𝐶𝐶)
For crustal particulate matter:
165,000 (2011$)1 𝐵𝐵ℎ𝐶𝐶𝐶𝐶𝑡𝑡 𝑡𝑡𝐶𝐶𝐶𝐶 × 1.06 (2015$)
1 (2011$) × 1 𝐵𝐵ℎ𝐶𝐶𝐶𝐶𝑡𝑡 𝑡𝑡𝐶𝐶𝐶𝐶2,000 𝑙𝑙𝐶𝐶𝐵𝐵 = $87.45 𝑝𝑝𝐵𝐵𝐶𝐶 𝑙𝑙𝐶𝐶 𝑃𝑃𝑀𝑀 (𝑐𝑐𝐶𝐶𝑐𝑐𝐵𝐵𝑡𝑡𝐵𝐵𝑙𝑙)
Total:
($225.25 × 0.7) + ($87.45 × 0.3) = $183.91 𝑝𝑝𝐵𝐵𝐶𝐶 𝑙𝑙𝐶𝐶 𝑃𝑃𝑀𝑀-2.5
B. Nitrous Oxides
Heath damages from exposure to nitrous oxides come from the compound’s role in creating
secondary pollutants: nitrous oxides react with volatile organic compounds to form ozone, and are also
precursors to the formation of particulate matter.24 The EPA calculates health benefits of avoiding
formation of either of these pollutants: $7,400 to $31,000 for ozone formation, and $17,000 to $34,000
18 Final Public Tool, “Societal Calcs” tab, cell E12. 19 U.S. EPA, “Emissions Factors & AP 42, Compilation of Air Pollutant Emission Factors,” http://www.epa.gov/ttn/chief/ap42/index.html 20 U.S. EPA, AP 42 Volume I, Fifth Edition, Section 1.4 (Natural Gas Combustion), Table 1.4-2. Available at http://www.epa.gov/ttn/chief/ap42/ch01/index.html (“AP 42”). 21 CPP Technical Analysis, p. 4-17. 22 Id., p. 4A-8, Figure 4A-5. 23 AP 42, Table 1.4-2, Footnote (c). 24 CPP Technical Analysis, p. 4-14.

7
for PM-2.5 formation, both in 2011$. We include both types of avoided health costs in our calculations,
and use the mid-points of EPA’s ranges of health benefits.
44,700 (2011$)1 𝐵𝐵ℎ𝐶𝐶𝐶𝐶𝑡𝑡 𝑡𝑡𝐶𝐶𝐶𝐶 × 1.06 (2015$)
1 (2011$) × 1 𝐵𝐵ℎ𝐶𝐶𝐶𝐶𝑡𝑡 𝑡𝑡𝐶𝐶𝐶𝐶2,000 𝑙𝑙𝐶𝐶𝐵𝐵 = $23.69 𝑝𝑝𝐵𝐵𝐶𝐶 𝑙𝑙𝐶𝐶
V. WATER
Recommended Input25 Avoided Water Use: $0.0007 / kWh of Thermal Generation
Thermal generation consumes water, principally for cooling. As natural gas facilities across
California transition from once-through cooling (which uses sea water) to recirculating cooling using
fresh water, demand on fresh water supplies will increase.26 However, the ongoing drought means that
water supplies are already under stress, and electric reliability is already being affected: two gas-fired
power plants in California have notified the California Energy Commission (CEC) that their water supply
“may be severely restricted or temporarily suspended as early as July 1 as a result of a newly
implemented water plan in response to the ongoing drought.”27 Reducing water use in the electric sector
through the use of renewable generation lowers the vulnerability of electricity supply to the availability of
water, and reduces the possibility that new water supplies will have to be developed to meet growing
demand.
Two recent California studies quantified the additional cost of retrofitting existing natural gas
plants to reduce their water consumption, or to develop other water supplies to replace water consumed in
power generation. A CEC study calculated the “effective cost” of water use at a natural gas plant, or “the
additional cost of using dry cooling expressed on an annualized basis divided by the annual reduction in
water requirement achieved through the use of dry cooling.”28 In other words, if water supply in the
region with the power plant is or becomes constrained, what would it cost (in terms of the direct cost as
well as the cost of lost generation efficiency) to convert the plant to run on dry cooling? The CEC found
25 We assume 2% per year escalation in this benefit. 26 According to analysis performed by the Department of Energy, California’s transition to recirculating cooling will increase statewide freshwater consumption for electric generation by 50%. U.S. Dept. of Energy, Wind Vision, p. 200. Available at http://energy.gov/eere/wind/wind-vision. 27 California Energy Markets, “Drought Leads to Need for Power Plant Water Contingency Plans.” No. 1345 (July 31, 2015), p. 7. 28 California Energy Commission, Cost and Value of Water at Combined Cycle Power Plants. CEC-500-2006-034 (April 2006), p. 4. Available at http://www.energy.ca.gov/2006publications/CEC-500-2006-034/CEC-500-2006-034.PDF.

8
that the effective cost of saved water using this metric ranges from $3.40 to $6.00 per 1,000 gallons, or
$1,110 to $1,955 per acre-foot with a mid-point of $1,530 per acre-foot.29 Similarly, a recent study by E3
calculated the avoided cost of water in California based on the cost of the embedded energy in water and
the avoided costs to develop new water supplies.30 They found an avoided cost of water ranging between
$442 (imported groundwater), $1,093 (treated wastewater) and $2,349 (desalinated water) per acre foot.
We eliminate the option of importing groundwater as infeasible, since California’s crisis of dwindling and
over-used groundwater is well-known.31 The remaining three estimates are roughly consistent, and
average to $1,660 per acre-foot.
As a result, if distributed generation displaces marginal gas-fired thermal generation, it can
reduce the need to develop new supplies of water to meet water needs at gas-fired power plants. The
CEC issues periodic reports on the costs of new electric generation in California, typically in conjunction
with its biennial Integrated Energy Policy Report. These reports are based on a detailed model that the
CEC maintains of the cost of new electric generation in the state, of all types. This Cost of Generation
model includes water consumption and costs as a variable operations and maintenance expense for the
gas-fired combined-cycle gas turbine (CCGT) power plants that comprise the bulk of the state’s fleet of
gas-fired thermal generation. The most recent version of this report estimates CCGT water use as 0.68
acre-feet per GWh, with a water cost of $615 per acre-foot (in 2015 $), based on the median of a 2012
survey.32 The Public Tool appears to include such water consumption costs as part of its assumed
variable O&M costs for thermal generation. We calculate the societal benefit of reduced water use as the
difference between this cost ($615 per acre-foot) and the much higher cost ($1,660 per acre-foot) of
developing new fresh water supplies in California. This societal benefit also reflects the high scarcity
value of water during periodic droughts such as the one California is now experiencing, with current
market prices for water well in excess of $1,000 per acre-foot. This difference results in a societal benefit
29 Id. at p. 4; Wind Vision at p. 201. 30 Cutter, Eric, Ben Haley, Jim Williams and C.K. Woo, “Cost-effective Water-Energy Nexus: A California Case Study.” The Electricity Journal, 27 (5), July 2014. Available at https://ethree.com/documents/E3_Energy_Water_EJ_web.pdf 31 See, e.g., Justin Gillis and Matt Richtel, “Beneath California Crops, Groundwater Crisis Grows.” The New York Times (April 5, 2015). http://www.nytimes.com/2015/04/06/science/beneath-california-crops-groundwater-crisis-grows.html?_r=0. 32 California Energy Commission, Estimated Cost of New Renewable and Fossil Generation in California (March 2015, CEC-200-2014-003-SF), at pp. 138, 145, B-17 and B-18, plus associated cost of generation spreadsheet model. Most recent water cost confirmed by Bryan Neff of the CEC, personal communication.

9
of avoided water use of $0.0007 per kWh. This figure is consistent with DOE’s estimate of water use
benefits of $0.0006 to $0.0017 per kWh from dramatically increased use of the nation’s wind resources.33
0.68 acre− feetGWh × $1,045 (2012$)
1 acre− foot × 1 GWh106 kWh = $0.0007 𝑝𝑝𝐵𝐵𝐶𝐶 𝑀𝑀𝑘𝑘ℎ
VI. RELIABILITY AND RESILIENCY
Recommended Input Reliability and Resiliency: $0.022 / kWh of DER Output
Renewable distributed generation resources are installed as thousands of small, widely distributed
systems and thus are highly unlikely to fail at the same time. Furthermore, the impact of any individual
outage at a DG unit will be far less consequential, and less expensive for ratepayers, than an outage at a
major central station power plant.34 DG is located at the point of end use, and thus also reduces the risk
of outages due to transmission or distribution system failures.
One study of the benefits of solar DG has estimated the reliability benefits of DG from a national
perspective.35 The study assumed that a solar DG penetration of 15% would reduce loadings on the grid
during peak periods, mitigating the 5% of outages that result from such high-stress conditions. Based on
a study which calculated that power outages cost the U.S. economy about $100 billion per year in lost
economic output, the levelized, long-term benefits of this risk reduction were calculated to be $20 per
MWh ($0.02 per kWh) of DG output. This calculation does not necessarily assume that the DG is located
behind the customer’s meter, so this reliability benefit also might result from distributed generation at the
wholesale level.
However, most electric system interruptions do not result from high demand on the system, but
from weather-related transmission and distribution system outages. In these more frequent events,
renewable DG paired with on-site storage can provide customers with an assured back-up supply of
electricity for critical applications should the grid suffer an outage of any kind. This benefit of enhanced
reliability and resiliency has broad societal benefits as a result of the increased ability to maintain
government, institutional, and economic functions related to safety and human welfare during grid
outages. 33 Wind Vision at Chapter 3, p. 74. 34 California has recent experience with the costs of such an outage – the prolonged and expensive shutdown and eventual closure of the San Onofre Nuclear Generating Station as a result of a design flaw in the replacement steam generators. 35 Hoff, Norris and Perez, The Value of Distributed Solar Electric Generation to New Jersey and Pennsylvania (November 2012), at Table ES-2 and pages 18-19.

10
Annual reliability reports filed with the California Public Utilities Commission by the three
investor-owned utilities show that, over the last ten years, customers have averaged about 3 hours per year
(173 minutes, to be exact) of power interruptions.36 Most of these interruptions are the result of outages
on the distribution system, often weather-related. Studies of the cost to customers of electric service
interruptions find that commercial customers place much higher value on uninterrupted electric service
than do residential users.37 Such estimates of the value of service reliability allow one to estimate the
value to customers if DG plus storage were able to reduce annual service interruptions by 3 hours per
year; this calculation is presented in Table 2. The calculation uses the actual distribution of DG
customers (residential, small commercial, and large commercial38) and average system size in 2012.
Table 2: Value of Avoided Interruptions for California IOUs
Both DG and storage are essential in order to provide the reliability enhancement that would be
needed to eliminate or to substantially reduce these interruptions. The DG unit ensures that the storage is
full or can be re-filled promptly in the absence of grid power, and the storage provides the alternative
source of power when the grid is down. DG also can supply some or all of the on-site generation
necessary to develop a micro-grid that can operate independently of the broader electric system. Based
on the Public Tool modeling of the costs of paired solar plus storage systems, the costs to the DG
customer are about 50% solar / 50% storage, assuming a storage unit with the same kilowatt capacity as
the solar array and three hours of storage capacity (i.e. 3 kWh per kW). On this basis, and recognizing 36 Based on the SAIDI statistics that the IOUs file in their annual reliability reports, which are available at http://www.cpuc.ca.gov/PUC/energy/ElectricSR/Reliability/annualreports/2014.htm . 37 For example, see M. Sullivan et al., Updated Value of Service Reliability Estimates for Electric Utility Customers in the United States (January 2015, Nexant for LBNL), at Table ES-1. 38 The definition of these types of customers follows the definitions used in the Nexant/LBNL study referenced in the prior footnote, not the definitions of such customers in the IOU rate designs. Generally, small commercial customers are those with annual usage below 50,000 kWh; large commercial are those with higher usage.
ClassValue/hour [1] Hours/yr [2] Value/yr
2012 DG Share, by # of customers
2012 Avg. DG System Size
Avg. DG Annual kWh Value/kWh
Residential 5$ 3.0 15$ 79% 4.4 7,700 0.002$ Sm Commercial 647$ 3.0 1,941$ 18% 6.9 12,075 0.161$ Lg Commercial 17,804$ 3.0 53,412$ 3% 70.4 123,200 0.434$
0.044$ 50% DG Share: 0.022$
Sources:
2. Assume 3 one-hour events per year, per SAIDI statistics.
DG Output kWh/kW1,750
1. M. Sullivan et al., Updated Value of Service Reliability Estimates for Electric Utility Customers in the United States (January 2015, Nexant for LBNL), at Table ES-1.

11
that both the solar and the storage are necessary for an effective back-up power supply, we propose to
allocate to solar DG 50% of the reliability benefits of a paired solar plus storage backup system. We
acknowledge that these benefits will be realized over time, as storage is added to DG solar systems.39 DG
is a foundational element necessary to realize this benefit – in much the same way that smart meters are
necessary infrastructure to realize the benefits of time-of-use rates, dynamic pricing, and demand
response programs that will be developed in the future – and thus the reliability and resiliency benefits of
wider DG deployment should be recognized as a broad societal benefit.
VII. LAND USE
Recommended Input Land Use: $0.002 / kWh of DER Output
Distributed generation makes use of the built environment in the load center – typically roofs and
parking lots – without disturbing the existing use for the property. In contrast, central station renewable
plants require larger single parcels of land, and are more remotely located where the land has other uses
for agriculture or grazing. The land must be removed from this prior use when it becomes a solar farm.
Central-station solar photovoltaic plants with fixed arrays or single-axis tracking typically require 7.5 to
9.0 acres per MW-AC, or 3.3 to 4.4 acres per GWh per year.40 The lost value of the land depends on the
alternative use to which it could be put. The U.S. Department of Agriculture has reported the average
value of farm and ranch land in California in 2012 as $7,200 per acre.41 Assuming 3.5 acres per GWh per
year, a $7,200 per acre value of land, and a 25-year loan at an interest rate of 4% per year to finance the
land purchase, DG provides the benefit of avoiding a lost land use value of $1.60 per MWh.
39 It is also important to recognize that adding storage may be cost-effective even without considering its reliability benefits when paired with DG. Distributed storage can reduce demand charges, allow TOU rate arbitrage, and provide power quality and capacity-related benefits to the utility or grid operator. Indeed, studies in the Commission’s Storage OIR have shown that distributed storage is economic as a result of these benefits, without considering the reliability benefits for the customer. 40 S. Ong et al., “Land-Use Requirements for Solar Power Plants in the United States” (NREL, June 2013), at Table ES-1. 41 United States Department of Agriculture, National Agricultural Statistics Service - 2012 California Land Values and Cash Rents Release (September 14, 2012). Although we recognize that not all utility-scale solar installations are on agricultural land, we feel this value is a reasonable proxy for the development on federal lands.

12
VIII. LOCAL ECONOMIC BENEFITS
Recommended Inputs Average: $ 0.030 / kWh of Overall NEM Generation Residential – $0.035 / kWh of NEM Generation Small Commercial – $0.017 / kWh of NEM Generation Large Commercial – $0.008 / kWh of NEM Generation
Distributed generation has higher costs per kW than central station renewable generation.
However, a portion of the higher costs – principally for installation labor, permitting, permit fees, and
customer acquisition (marketing) – are spent in the local economy, and thus provide a local economic
benefit in excess of what would be spent on wholesale, central station renewable generation. These local
costs are an appreciable portion of the “soft” costs of DG. Central station renewables that qualify for the
RPS program often are not located in the local area where the power is consumed, and a portion of RPS
resources are located outside of California.
There have been a number of recent studies of the soft costs of solar DG, as the industry has
focused on reducing such costs, which are significantly higher in the U.S. than in other major
international markets for solar PV. The following tables present recent data, from detailed surveys of
solar installers conducted by two national labs (LBNL and NREL), on the soft costs that are likely to be
spent in the local area where the DG customer resides. This tally of the share of solar PV costs that is
spent locally is conservative in that it does not consider the corporate overhead costs of major solar
companies that are located in California, which leads the nation by a considerable margin in solar
installations of all types and which is home to a significant number of major rooftop solar companies.
Table 3: Residential Local Soft Costs
Local Costs LBNL – J. Seel et al. 42 NREL – B. Friedman et al.43 $/watt % $/watt %
Total System Cost 6.19 100% 5.22 100% Local Soft Costs Customer acquisition: marketing & other 0.58 9% 0.48 9% Installation labor 0.59 10% 0.55 11% Permitting, inspection, interconnection 0.15 2% 0.10 2% Permit fees 0.09 1% 0.09 2% Total local soft costs 1.41 22% 1.22 23%
42 J. Seel, G. Barbose, and R. Wiser, Why Are Residential PV Prices So Much Lower in Germany than in the U.S.: A Scoping Analysis (Lawrence Berkeley National Lab, February 2013), at pp. 26 and 37 , 43 B. Friedman et al., Benchmarking Non-Hardware Balance-of-System (Soft) Costs for U.S. Photovoltaic Systems, Using a Bottom-Up Approach and Installer Survey – Second Edition (National Renewable Energy Lab, October 13, 2013), at Table 2.
13
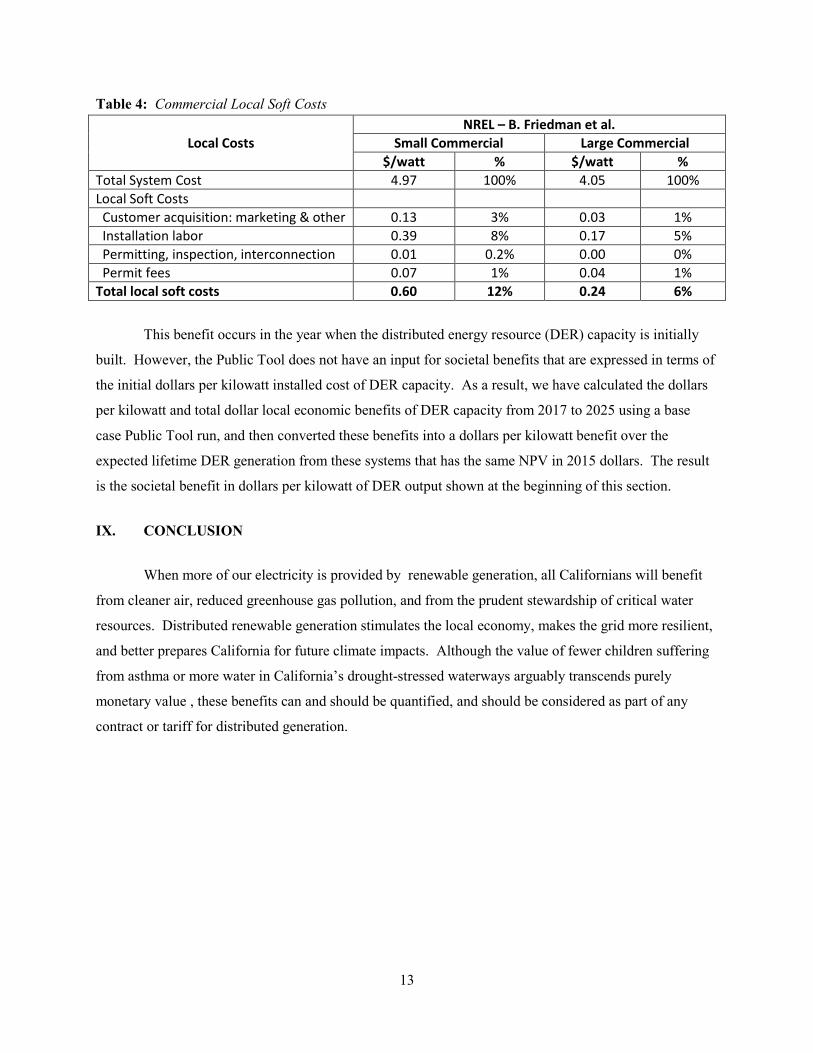
Table 4: Commercial Local Soft Costs
Local Costs NREL – B. Friedman et al.
Small Commercial Large Commercial $/watt % $/watt %
Total System Cost 4.97 100% 4.05 100% Local Soft Costs Customer acquisition: marketing & other 0.13 3% 0.03 1% Installation labor 0.39 8% 0.17 5% Permitting, inspection, interconnection 0.01 0.2% 0.00 0% Permit fees 0.07 1% 0.04 1% Total local soft costs 0.60 12% 0.24 6%
This benefit occurs in the year when the distributed energy resource (DER) capacity is initially
built. However, the Public Tool does not have an input for societal benefits that are expressed in terms of
the initial dollars per kilowatt installed cost of DER capacity. As a result, we have calculated the dollars
per kilowatt and total dollar local economic benefits of DER capacity from 2017 to 2025 using a base
case Public Tool run, and then converted these benefits into a dollars per kilowatt benefit over the
expected lifetime DER generation from these systems that has the same NPV in 2015 dollars. The result
is the societal benefit in dollars per kilowatt of DER output shown at the beginning of this section.
IX. CONCLUSION
When more of our electricity is provided by renewable generation, all Californians will benefit
from cleaner air, reduced greenhouse gas pollution, and from the prudent stewardship of critical water
resources. Distributed renewable generation stimulates the local economy, makes the grid more resilient,
and better prepares California for future climate impacts. Although the value of fewer children suffering
from asthma or more water in California’s drought-stressed waterways arguably transcends purely
monetary value , these benefits can and should be quantified, and should be considered as part of any
contract or tariff for distributed generation.