Pfeiffer Vacuum - SmartTest HLT 550, HLT 560 and HLT 570 Operating Instructions
Upload
loren-worbyCategory
view
217download
0

Sick Patient or Post-Mortem? Diagnosing the Canadian Hotel Investment Industry
What Will It Take To Survive?
Sick Patient or Post-Mortem? Diagnosing the Canadian Hotel Investment Industry
What Will It Take To Survive?
Moderator:
Lyle Hall, HLT Advisory Inc.
Panel:
David Larone, Director, PKF Consulting Inc
Betsy MacDonald, Managing Director, HVS
Abid J. Gilani, SVP Treasury, Marriott International
Chuck Henry, President, Hotel Capital Advisers, Inc.
Craig Wright, Senior VP & Chief Economist, RBC Capital Markets - Real Estate Group

Craig WrightCraig WrightSVP & Chief EconomistSVP & Chief Economist

3-month TED Spread*3-month TED Spread*
00
5050
100100
150150
200200
250250
300300
350350
400400
20022002 20032003 20042004 20052005 20062006 20072007 20082008 20092009
Source: Federal Reserve Board Source: Federal Reserve Board
Basis pointsBasis points
*3-month LIBOR rate - 3-month T-bill *3-month LIBOR rate - 3-month T-bill

World GDP GrowthWorld GDP Growth
-1-1
11
33
55
77
99
7373 7575 7777 7979 8181 8383 8585 8787 8989 9191 9393 9595 9797 9999 0101 0303 0505 0707 0909
% change, year-over-year% change, year-over-year
ForecastForecast
Source: International Monetary Fund, RBC Economics ResearchSource: International Monetary Fund, RBC Economics Research

Canadian and U.S. Real GDPCanadian and U.S. Real GDP
-8-8
-6-6
-4-4
-2-2
00
22
44
66
88
1010
0000 0101 0202 0303 0404 0505 0606 0707 0808 0909 1010
Quarter-over-quarter annualized % changeQuarter-over-quarter annualized % change
CanadaCanada U.SU.S
Source: Statistics Canada, Bureau of Economic Analysis, RBC Economics ResearchSource: Statistics Canada, Bureau of Economic Analysis, RBC Economics Research
ForecastForecast
Annual Growth Rates
'07 '08 '09F ’10F
Canada
2.7 0.5 -1.4 2.6
U.S. 2.0 1.1 -2.4 2.2

Unemployment rateUnemployment rate
3
5
7
9
11
13
15
8282 8484 8686 8888 9090 9292 9494 9696 9898 0000 0202 0404 0606 0808 1010
Canada U.S.
%%
Source: Bank of Canada, Bureau of Labor Statistics, RBC Economics Research
U.S. long-term average: 6.0U.S. long-term average: 6.0
Canada long-term average: 8.7Canada long-term average: 8.7
ForecastForecast

Federal Government Budgetary BalanceFederal Government Budgetary Balance
Billions of dollars
-30.0
-8.7
3.05.8
14.3
19.9
8.0 6.69.1
1.5
13.2 13.8
9.6
-1.1
-33.7-29.8
-13.0
-7.3
0.7
95-9695-96 97-9897-98 99-0099-00 01-0201-02 03-0403-04 05-0605-06 07-0807-08 09-1009-10 11-1211-12 13-1413-14
0.00.0
10.010.0
20.020.0
30.0
30.0
-10.0-10.0
-20.0-20.0
-30.0-30.0
-40.0-40.0
Source: Department of Finance, , RBC Economics Research
Federal budget projection

Canadian and U.S. Central Bank Policy Target RatesCanadian and U.S. Central Bank Policy Target Rates
0
1
2
3
4
5
6
7
00 01 02 03 04 05 06 07 08 09 10
%
0
1
2
3
4
5
6
7%
BoC overnight rateBoC overnight rate
Fed funds rateFed funds rate
Source: Bank of Canada, Federal Reserve Board, RBC Economics ResearchSource: Bank of Canada, Federal Reserve Board, RBC Economics Research
Forecast

Real GDP GrowthReal GDP Growth
-3-3 -2-2 -1-1 00 11 22 33 44
ALTA.ALTA.
ONT.ONT.
B.C.B.C.
CANADACANADA
NFLD.NFLD.
P.E.I.P.E.I.
N.B.N.B.
QUE.QUE.
N.S.N.S.
MAN.MAN.
SASK.SASK.
20092009
20102010
% change, ranked by 2009 growth% change, ranked by 2009 growth
Source: RBC Economics ResearchSource: RBC Economics Research
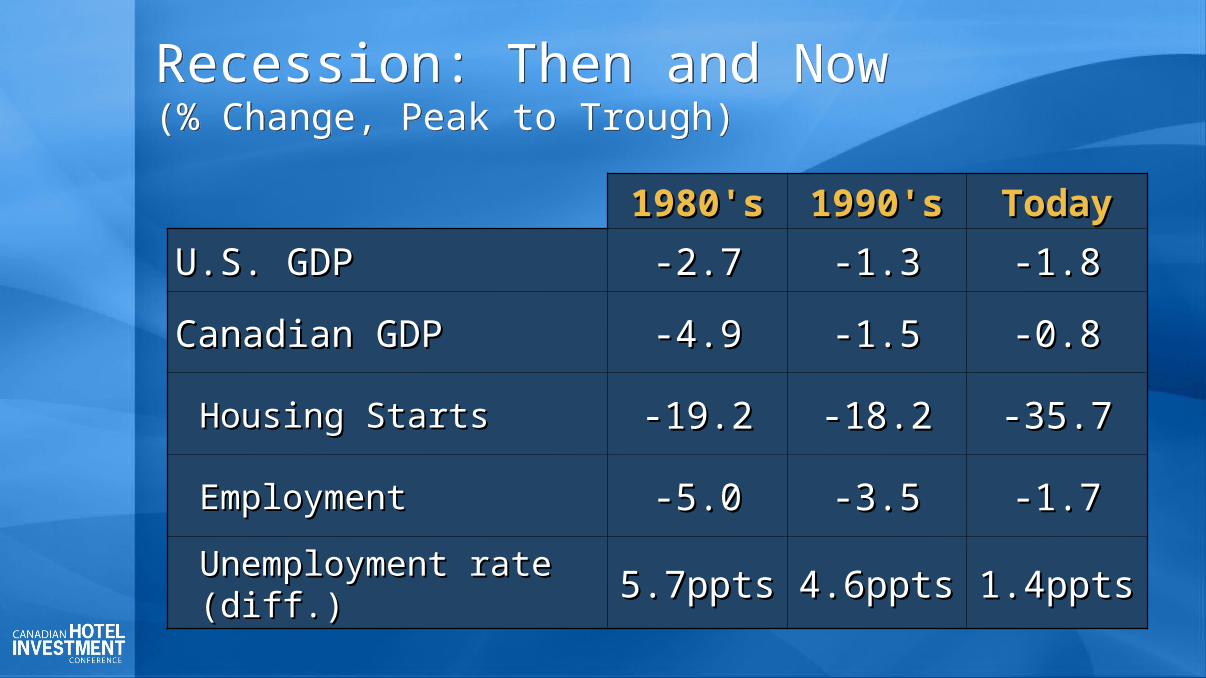
Recession: Then and Now(% Change, Peak to Trough)Recession: Then and Now(% Change, Peak to Trough)
1980's1980's 1990's1990's TodayToday
U.S. GDPU.S. GDP -2.7-2.7 -1.3-1.3 -1.8-1.8
Canadian GDPCanadian GDP -4.9-4.9 -1.5-1.5 -0.8-0.8
Housing StartsHousing Starts -19.2-19.2 -18.2-18.2 -35.7-35.7
EmploymentEmployment -5.0-5.0 -3.5-3.5 -1.7-1.7
Unemployment rate Unemployment rate (diff.)(diff.) 5.7ppts5.7ppts 4.6ppts4.6ppts 1.4ppts1.4ppts

The material contained in this report is the property of Royal Bank of Canada and may not be reproduced in any way, in whole or in part, without express authorization of the copyright holder in writing. The statements and statistics contained herein have been prepared by RBC Economics Research based on information from sources considered to be reliable. We make no representation or warranty, express or implied, as to its accuracy or completeness. This publication is for the information of investors and business persons and does not constitute an offer to sell or a solicitation to buy securities.