Shulman and Rothman PNAS, 1998 In this period of intense research in the neurosciences, nothing is...
89
-
Upload
aldous-lang -
Category
Documents
-
view
214 -
download
0
Transcript of Shulman and Rothman PNAS, 1998 In this period of intense research in the neurosciences, nothing is...

Shulman and Rothman PNAS, 1998
In this period of intense research in the neurosciences, nothing is more promising than functional magnetic resonance imaging (fMRI) and positron emission tomography (PET) methods, which localize brain activities. These functional imaging methodologies map neurophysiological responses to cognitive, emotional, or sensory stimulations. The rapid experimental progress made by using these methods has encouraged widespread optimism about our ability to understand the activities of the mind on a biological basis. However, the relationship between the signal and neurobiological processes related to function is poorly understood, because the functional imaging signal is not a direct measure of neuronal processes related to information transfer, such as action potentials and neurotransmitter release. Rather, the intensity of the imaging signal is related to neurophysiological parameters of energy consumption and blood flow. To relate the imaging signal to specific neuronal processes, two relationships must be established…
The first relationship is between the intensity of the imaging signal and the rate of neurophysiological energy processes, such as the cerebral metabolic rates of glucose (CMRglc) and of oxygen (CMRO2). The second and previously unavailable relationship is between the neurophysiological processes and the activity of neuronal processes. It is necessary to understand these relationships to directly relate functional imaging studies to neurobiological research that seeks the relationship between the regional activity of specific neuronal processes and mental processes.

Shulman and Rothman PNAS, 1998
Psychology
CMRglc
NeuronalNeuroenergetics
MentalImage Signal
NeuroscienceCMRO2
CBF

Let’s back up…What do we know for sure about
fMRI?

280 million Hb molecules per red blood cell
Hemoglobin Molecule

L. Pauling and C. Coryell The Magnetic Properties and Structure of Hemoglobin, Oxyhemoglobin and Carbonmonoxy hemoglobin, PNAS, vol. 22, pp. 210-216, 1936.
Different magnetic properties of hemoglobin and deoxyhemoglobin

Hemoglobin Molecule
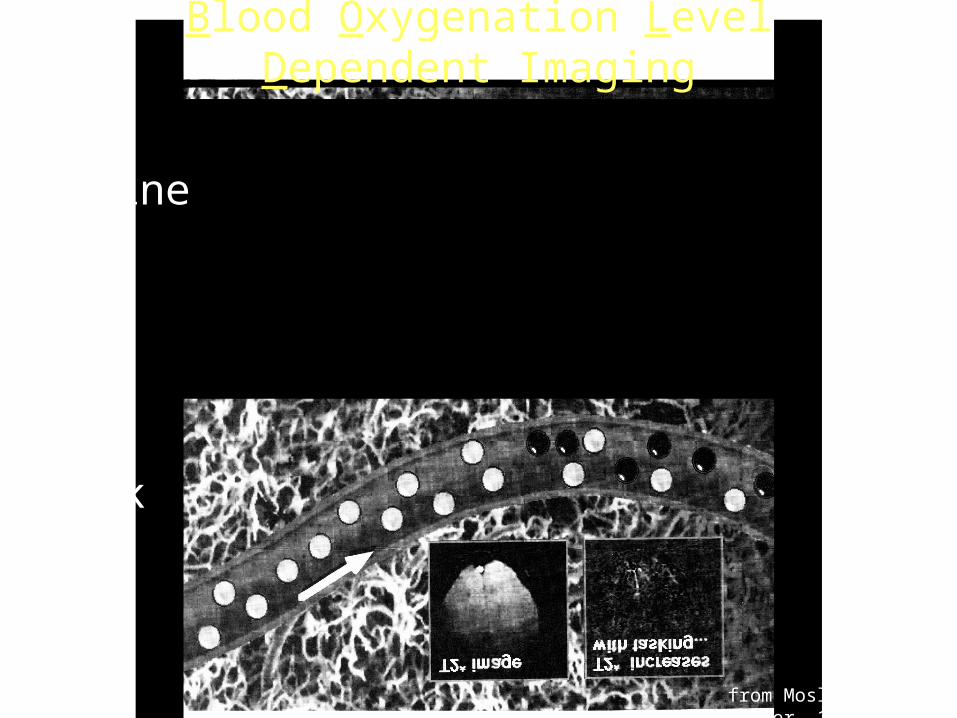
Baseline
Task
from Mosley & Glover, 1995
Blood Oxygenation Level Dependent Imaging

Brain or Vein?


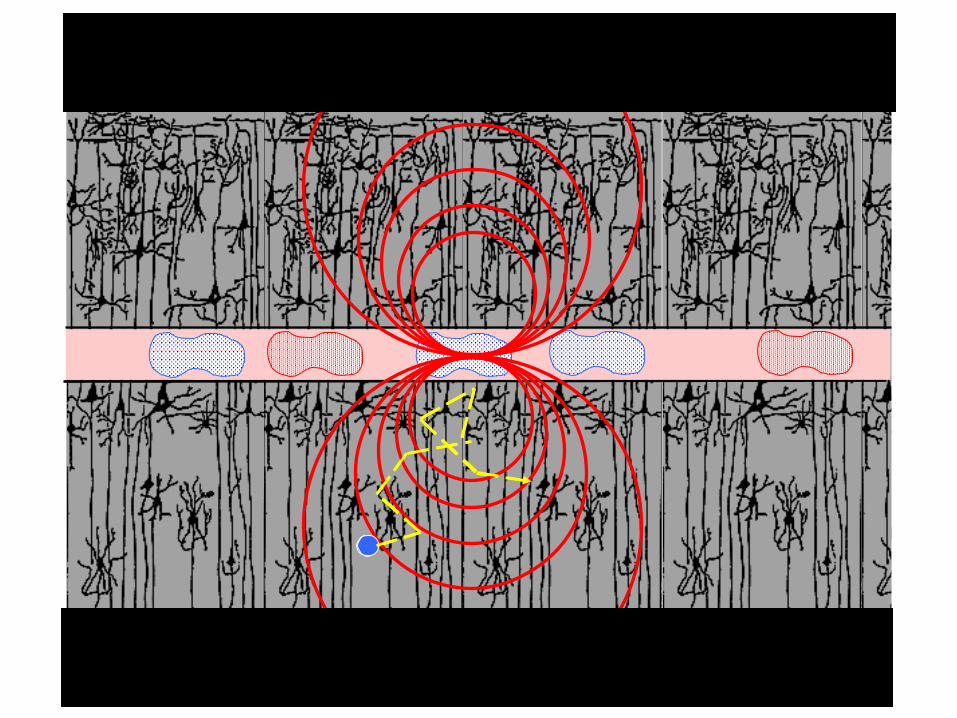
Large Vessel Contributions to BOLD Contrast
Virchow-Robin Space
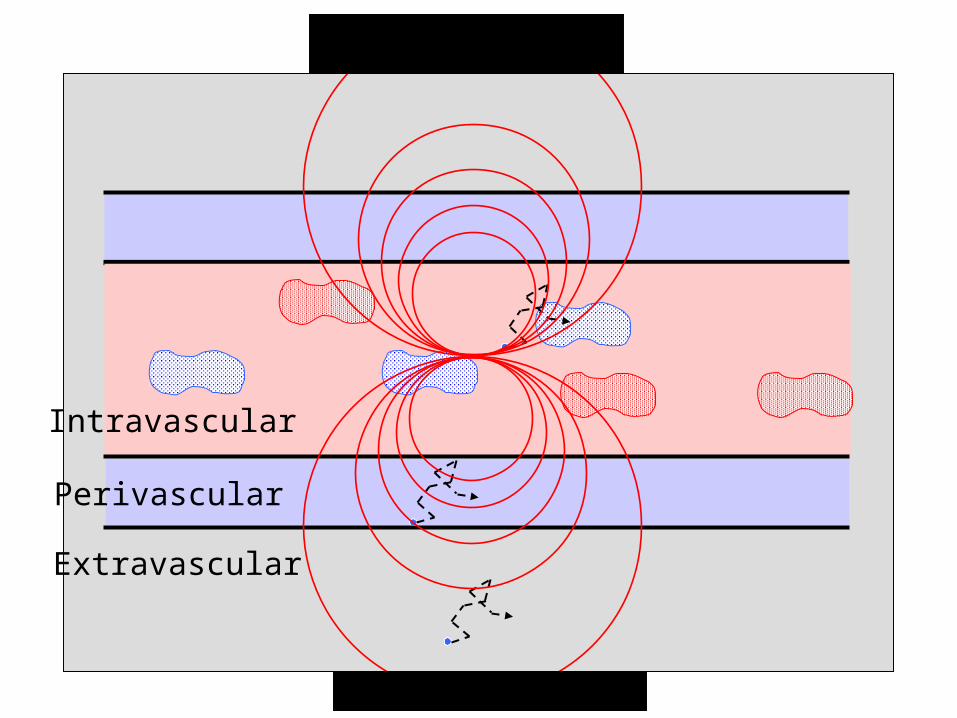
Intravascular
Perivascular
Extravascular

3
z = 1.64 Small
Large
Courtesy of Dr. Allen Song, Duke University
Isotropic Diffusion Weighted Spiral Imaging at 4T

9 sec
9 sec
a
b

Diffusion-weighted (b factor = 54)
Diffusion-weighted (b factor = 108)
Subject 41057, Slice 12, 4.0 Tesla
ADC masked by BOLD activation
BOLD activation (b factor = 0)
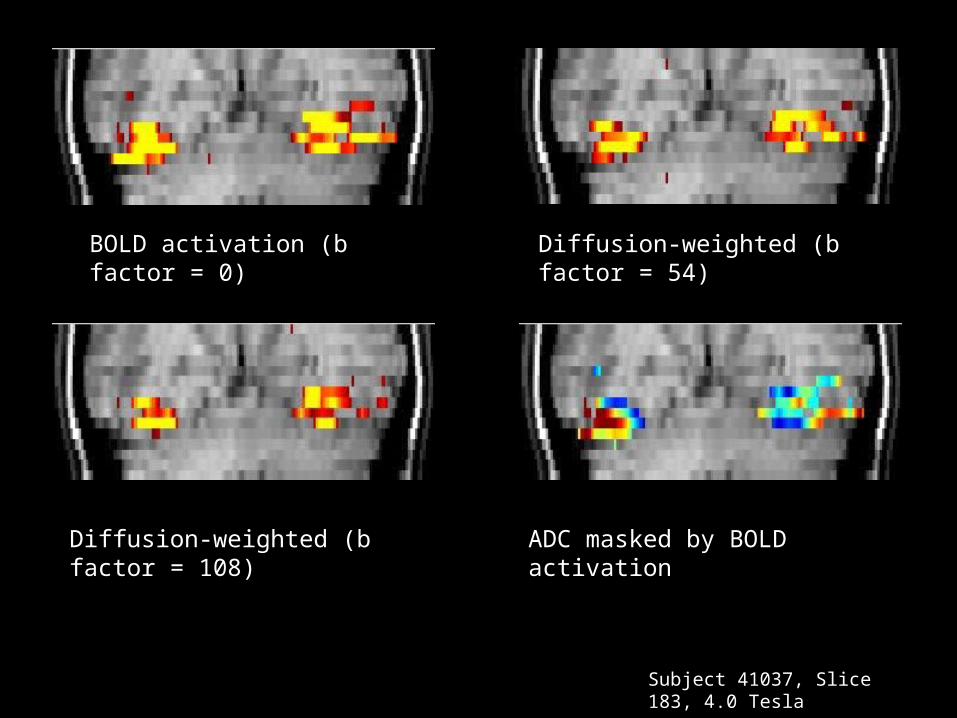
Diffusion-weighted (b factor = 54)
Diffusion-weighted (b factor = 108)
Subject 41037, Slice 183, 4.0 Tesla
ADC masked by BOLD activation
BOLD activation (b factor = 0)

Diffusion-weighted (b factor = 54)
Diffusion-weighted (b factor = 108)
Subject 41037, Slice 177, 4.0 Tesla
ADC masked by BOLD activation
BOLD activation (b factor = 0)

BOLD activation (b factor = 0) ADC masked by BOLD activation
Subject 41037, Slice 177, 4.0 Tesla

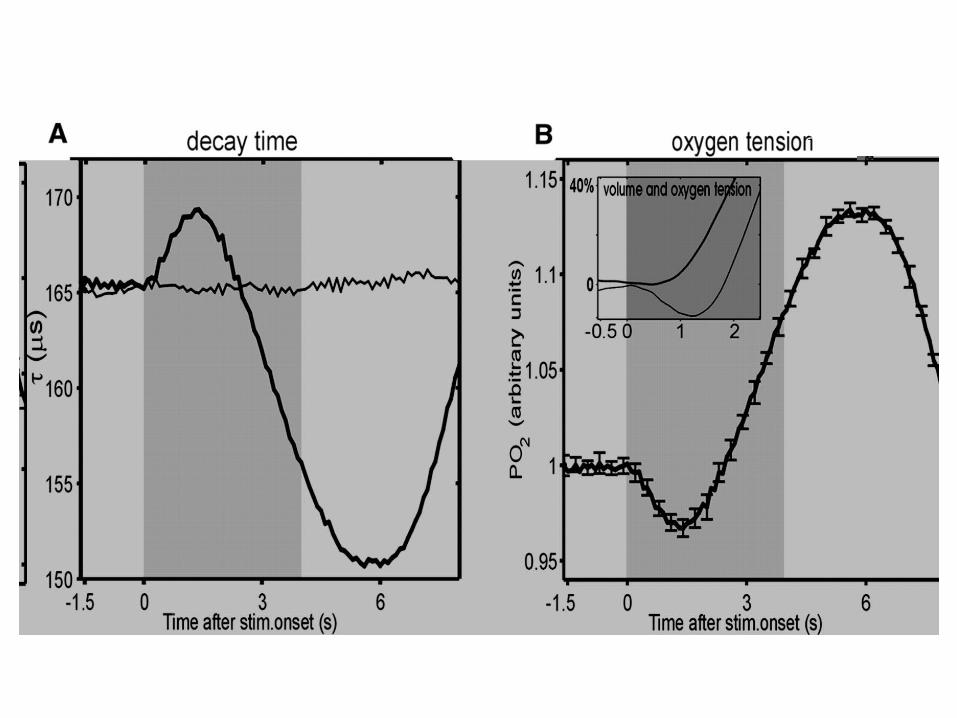
Negative dips

Vanzetta and Grinvald, Science, 286: 1555-1558, 1999
Phosphorescence Decay Time(Oxyphor R2 oxygen tension-sensitive phosphorescent probe)
Vanzetta and Grinvald, Science, 286: 1555-1558, 1999
Phosphorescence Decay Time(Oxyphor R2 oxygen tension-sensitive phosphorescent probe)

Vanzetta and Grinvald, Science, 286: 1555-1558, 1999
Oxy Hbdeoxy Hb

Berwick et al, JCBFM, 2002
Optical imaging of rat barrel cortexHb02= oxyhemoglobin, Hbr = deoxyhemoglobin, Hbt = total blood flow

N. Logothetis, Nature Neuroscience, 1999
Functional Imaging of the Monkey Brain

Hu, Le, Ugurbil MRM, 1997
Early Response in fMRI

Hu, Le, Ugurbil MRM, 1997
Early Response in fMRI

What triggers blood flow?

Arterioles (10 - 300 microns)precapillary sphincters
Capillaries (5-10 microns)Venules (8-50 microns)

Tissue factors
• K+
• H+
• Adenosine
• Nitric oxide
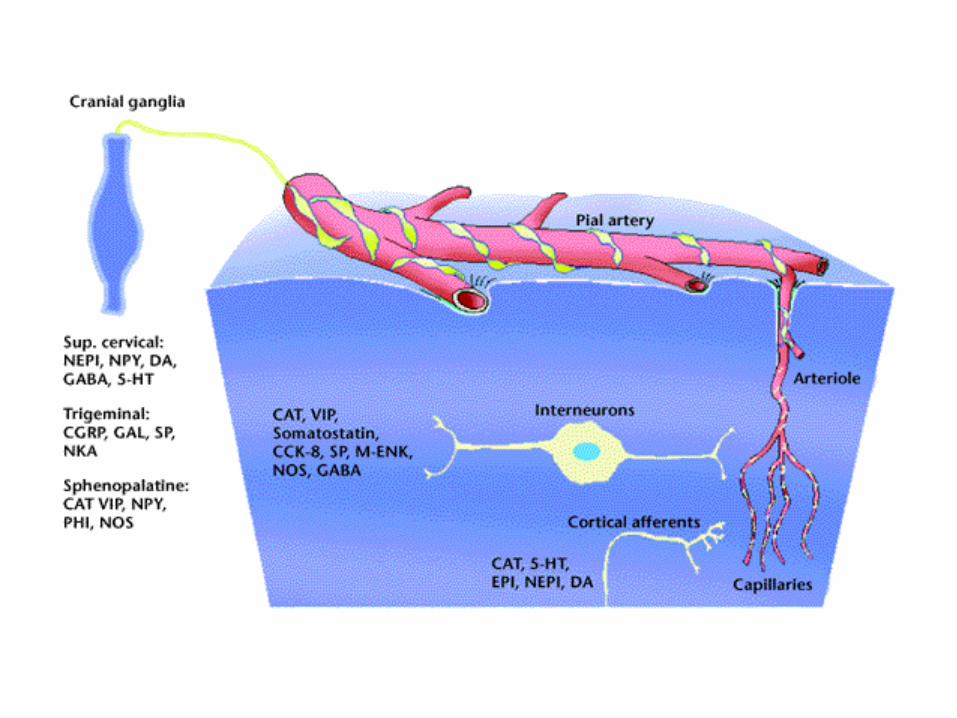
C. Iadecola, Nature Neuroscience, 1998Commentary upon Krimer, Muly, Williams and Goldman-Rakic, Nature Neuroscience, 1998
Neuronal Control of the Microcirculation
Krimer, Muly, Williams, Goldman-Rakic, Nature Neuroscience, 1998
Pial Arteries
10 m
Noradrenergic Dopamine

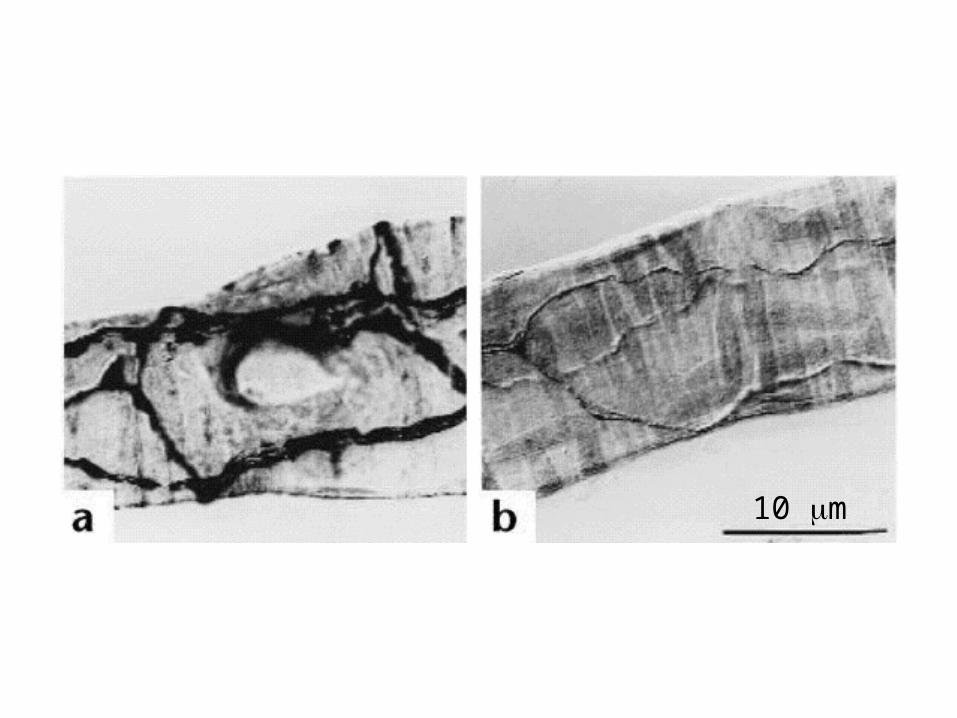
Krimer, Muly, Williams, Goldman-Rakic, Nature Neuroscience, 1998
Dopamanergic terminals associated with small cortical blood vessels
10 m
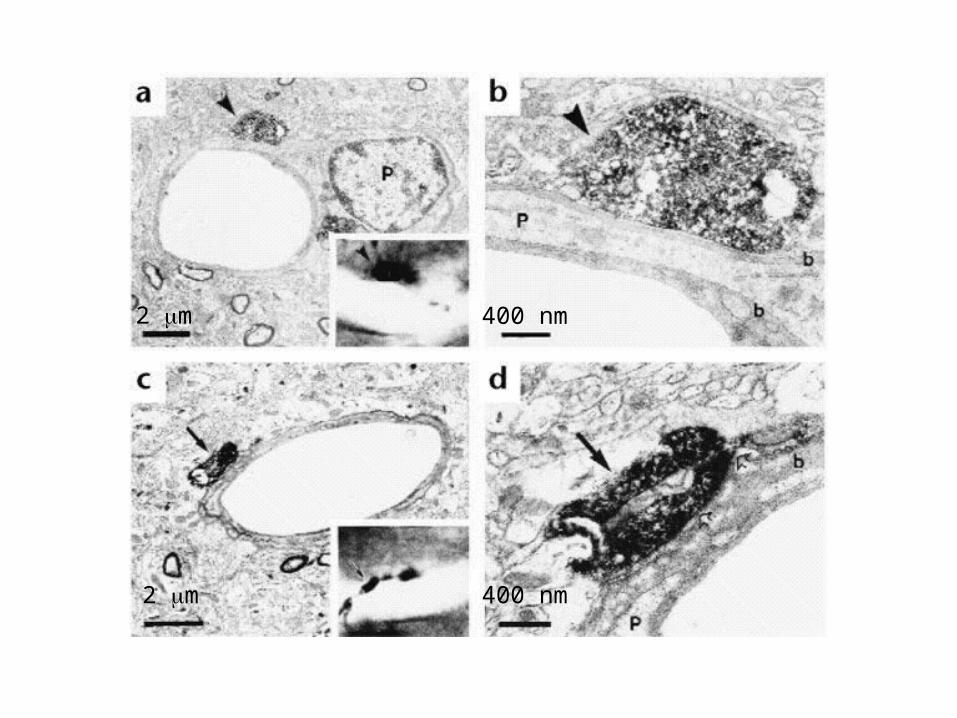
Krimer, Muly, Williams, Goldman-Rakic, Nature Neuroscience, 1998
Dopamanergic terminals associated with small cortical blood vessels
2 m
2 m
400 nm
400 nm

Krimer, Muly, Williams, Goldman-Rakic, Nature Neuroscience, 1998
Perivascular iontophoretic application of dopamine
18-40 s 40-60 s

Let’s back up again…Why isn’t all the oxyHb used up?

Uncoupling…

glucose
pyruvate
Glucose 6 phosphate
Fructose – 1,6-phosphate
TCAcycle
lactate
Net +2 ATP
Net +36 ATP
glucose
O2
CO2 + H20

Shulman and Rothman PNAS, 1998
Stimulation Change CMRglc Change CMRO2 SourceVisual 51 5 Fox et al. 1988
28 28 Marrett et al. 199329 29 Marrett et al. 1993
16 Davis et al. 199823 Chen et al. 199324 Reivich et al. 1984
Mean 31 20
Cognitive 12 Roland et al. 1987Seizure 400 267 Borgstrom et al. 1976

Shulman and Rothman PNAS, 1998
Proposed pathway of glutamate / glutamine neurotransmitter cycling between neurons and glia, whose flux has been quantitated recently by 13C MRS experiments. Action potentials reaching the presynaptic neuron cause release of vesicular glutamate into the synaptic cleft, where it is recognized by glutamate receptors post-synaptically and is cleared by Na+ -coupled transport into glia. There it is converted enzymatically to glutamine, which passively diffuses back to the neuron and, after reconversion to glutamate, is repackaged into vesicles. The rate of the glutamate-to-glutamine step in this cycle (Vcycle), has been derived from recent 13C experiments.

Sibson et al. PNAS, 1998
Stimulation Change CMRglc Change CMRO2 SourceVisual 51 5 Fox et al. 1988
28 28 Marrett et al. 199329 29 Marrett et al. 1993
16 Davis et al. 199823 Chen et al. 199324 Reivich et al. 1984
Mean 31 20
Cognitive 12 Roland et al. 1987Seizure 400 267 Borgstrom et al. 1976

Heeger, Nature Neuroscience 2002
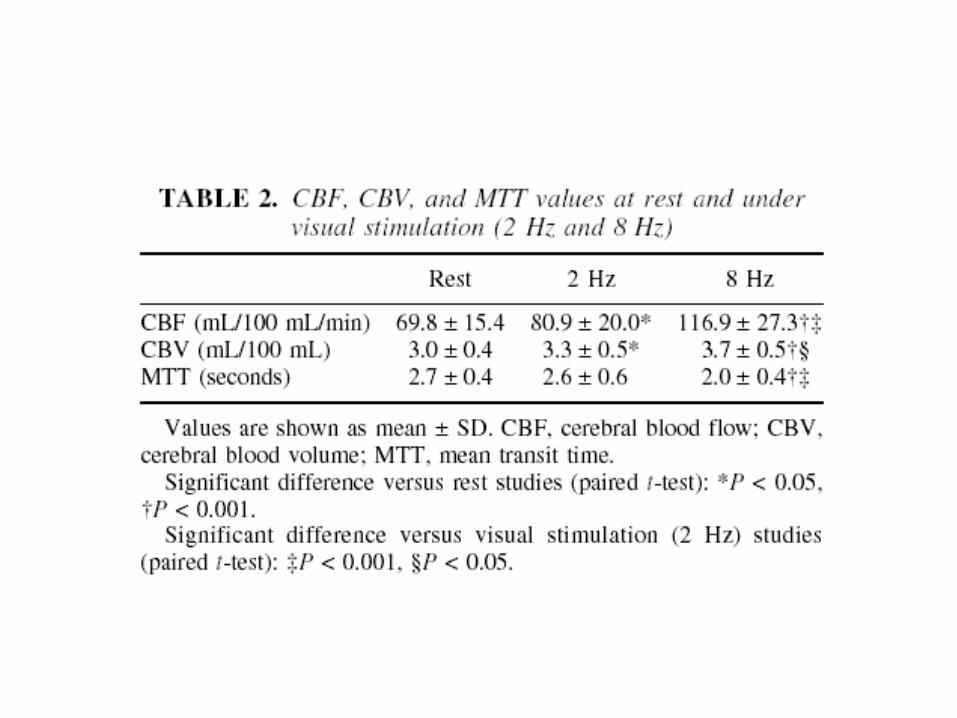
Ito et al. JCBFM, 2001
Stimulation Change CMRglc Change CMRO2 SourceVisual 51 5 Fox et al. 1988
28 28 Marrett et al. 199329 29 Marrett et al. 1993
16 Davis et al. 199823 Chen et al. 199324 Reivich et al. 1984
Mean 31 20
Cognitive 12 Roland et al. 1987Seizure 400 267 Borgstrom et al. 1976

Relationship of BOLD to neuronal activity

Attwell and Laughlin, JCBFM, 2001
Brain Energetics

Attwell and Laughlin, JCBFM, 2001
Brain Energetics

Rees et al. Nature Neuroscience 2000

Heeger, Nature Neuroscience 2000

Lauritzen, JCBFM, 2001
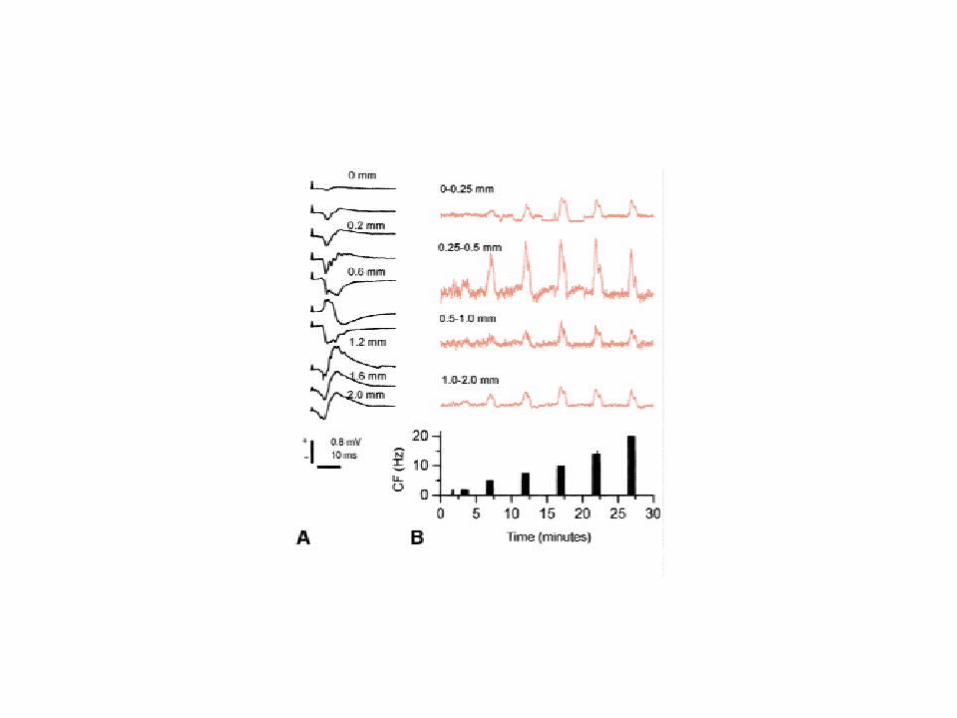
Lauritzen, JCBFM, 2001
Climbing Fiber Stimulation
Lauritzen, JCBFM, 2001
Climbing Fiber Stimulation

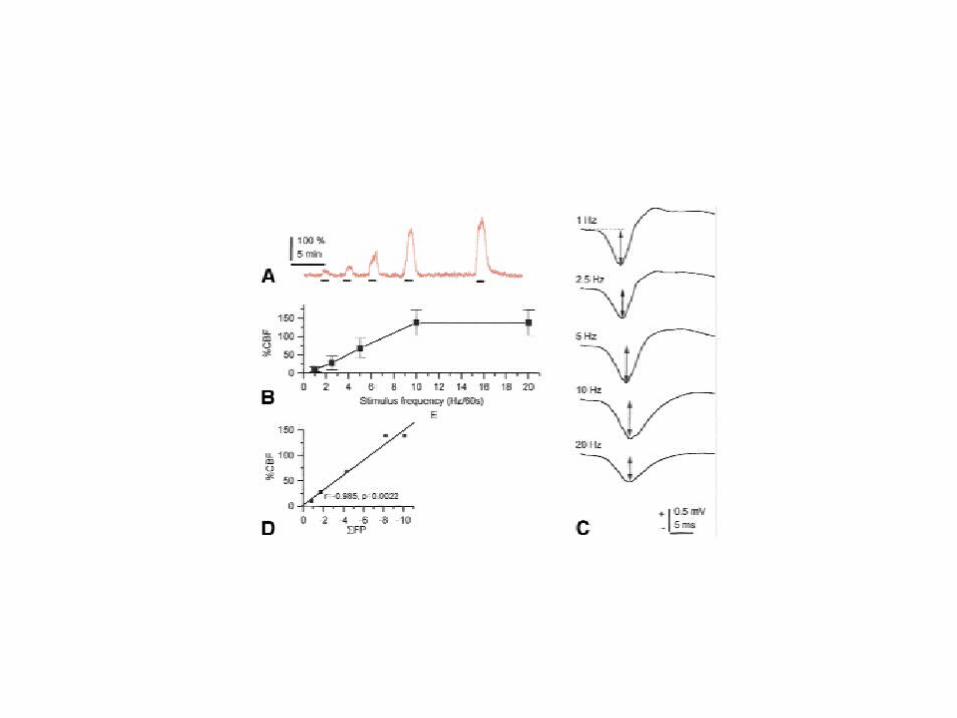
Lauritzen, JCBFM, 2001
Parallel Fiber Stimulation

Lauritzen, JCBFM, 2001
Harmaline IP synchronizes inferior olive

Smith et al. PNAS, 2002

Hyder et al. PNAS, 2002
Stimulation Change CMRglc Change CMRO2 SourceVisual 51 5 Fox et al. 1988
28 28 Marrett et al. 199329 29 Marrett et al. 1993
16 Davis et al. 199823 Chen et al. 199324 Reivich et al. 1984
Mean 31 20
Cognitive 12 Roland et al. 1987Seizure 400 267 Borgstrom et al. 1976

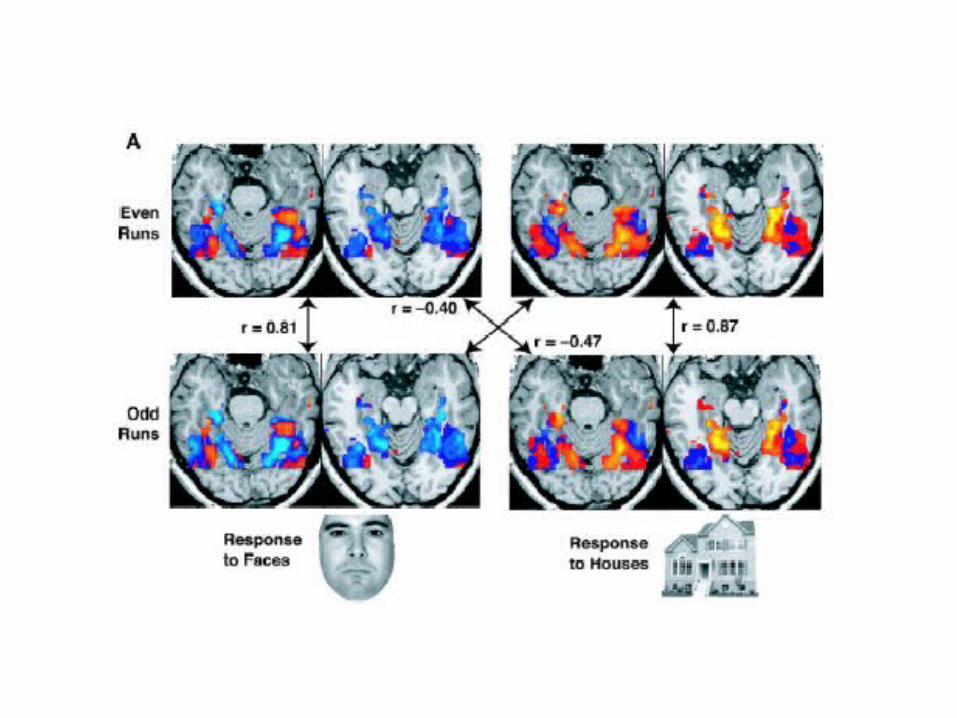
Spatial co-localization?

How neuronal activity changes cerebral blood flow is of biological and practical importance. The rodent whisker-barrel system has special merits as a model for studies of changes in local cerebral blood flow (LCBF).
Whisker-activated changes in flow were measured with intravascular markers at the pia. LCBF changes were always prompt and localized over the appropriate barrel. Stimulus-related changes in parenchymal flow monitored continuously with H2 electrodes recorded short latency flow changes initiated in middle cortical layers. Activation that increased flow to particular barrels often led to reduced flow to adjacent
cortex.
The matching between a capillary plexus (a vascular module) and a barrel (a functional neuronal unit) is a spatial organization of neurons and blood vessels that optimizes local interactions between the two. The paths of communication probably include: neurons to neurons, neurons to glia, neurons to vessels, glia to vessels, vessels to vessels and vessels to brain. Matching a functional grouping of neurons with a vascular module is an elegant means of reducing the risk of embarrassment for energy-expensive neuronal activity (ion pumping) while minimizing energy spent for delivery of the energy (cardiac output). For imaging studies this organization sets biological limits to spatial, temporal and magnitude resolution. Reduced flow to nearby inactive cortex enhances local differences Woolsey et al. Cerebral Cortex, 95: 7715-7720, 1996
Whisker Barrel Model

Yang, Hyder, Shulman PNAS, 93: 475-478, 1996
Rat Single Whisker Barrel fMRI Activation
7 Tesla200 m x 200 m x 1000 m

Berwick et al, JCBFM, 2002
Optical imaging of rat barrel cortexHb02= oxyhemoglobin, Hbr = deoxyhemoglobin, Hbt = total blood flow
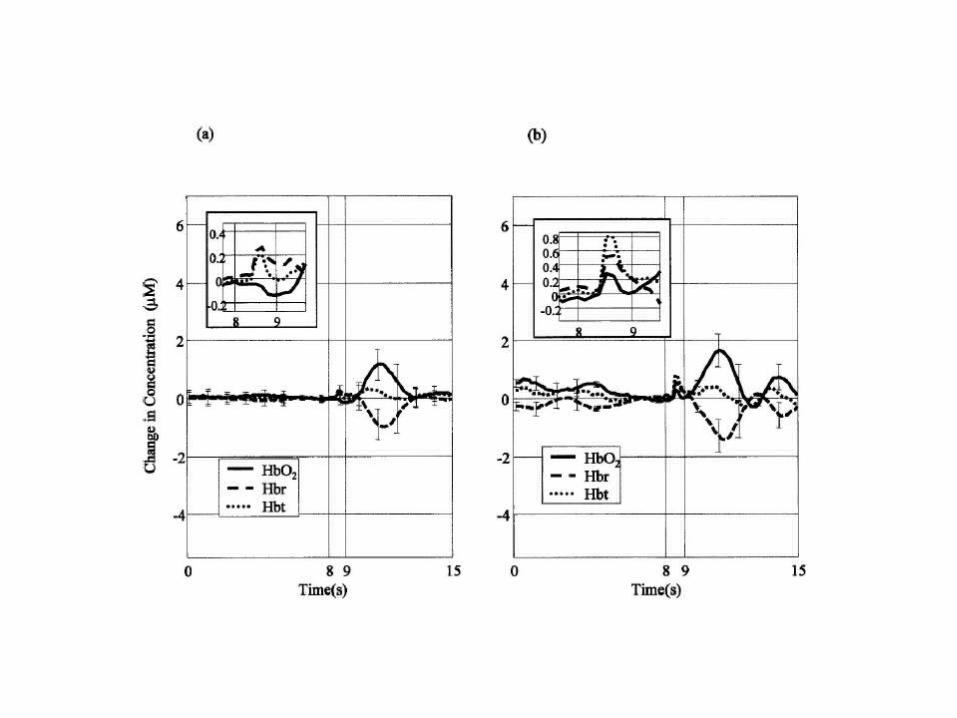
Berwick et al, JCBFM, 2002
(a) Outside activated region, (b) ipsilateral whisker

Relationship between field potentials and functional MRI
-1
0
1
2
3
4
5
6
7
-5 -4 -3 -2 -1 0 1 2 3 4 5 6 7 8 9 10 11 12
100ms
500ms
1500ms
-1
0
1
2
3
4
5
6
7
-5 -4 -3 -2 -1 0 1 2 3 4 5 6 7 8 9 10 11 12
100ms
500ms
1500ms
-1
0
1
2
3
4
5
6
7
-5 -4 -3 -2 -1 0 1 2 3 4 5 6 7 8 9 10 11 12
100ms
500ms
1500ms
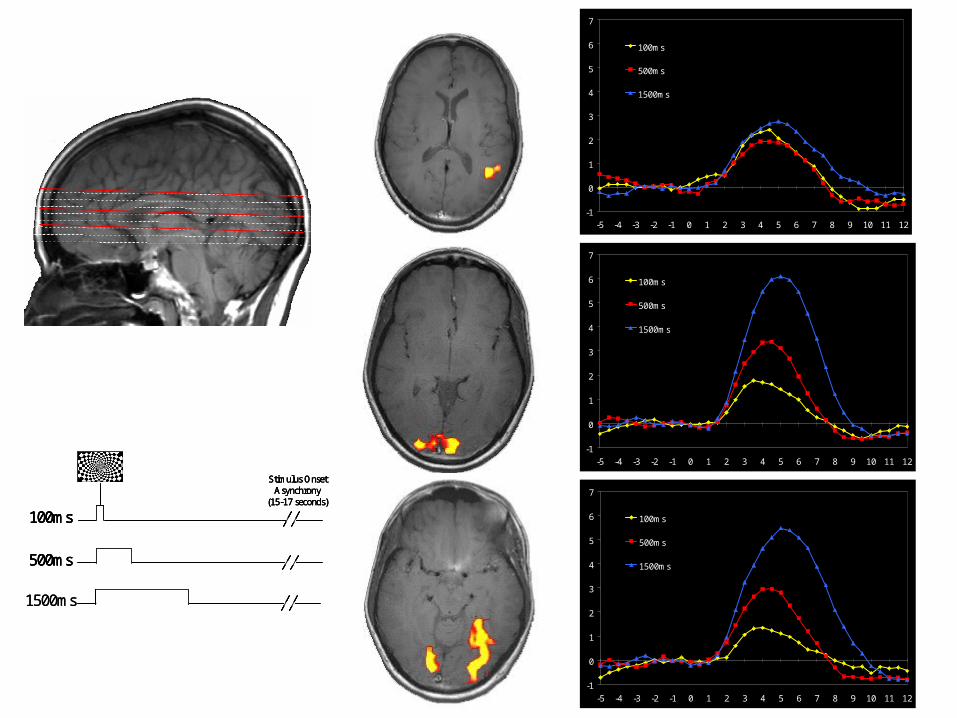
1500ms
Stimulus Onset Asynchrony
(15-17 seconds)
100ms
500ms
1500ms
Stimulus Onset Asynchrony
(15-17 seconds)
100ms
500ms
Stimulus Onset Asynchrony
(15-17 seconds)
100ms
500ms
100ms
500ms

LMY1

- 1 5 0
- 1 0 0
- 5 0
0
5 0
1 0 0
1 5 0
2 0 0
2 5 0
- 1 0 0 0 1 0 0 2 0 0 3 0 0 4 0 0 5 0 0
1 0 0 m s5 0 0 m s1 5 0 0 m s
L P O - 3

- 4 0 0
- 3 0 0
- 2 0 0
- 1 0 0
0
1 0 0
2 0 0
- 1 0 0 0 1 0 0 2 0 0 3 0 0 4 0 0 5 0 0 6 0 0 7 0 0 8 0 0 9 0 0
1 0 0 m s5 0 0 m s1 5 0 0 m s
L P O - 4

-1
0
1
2
3
4
5
6
7
-5 -4 -3 -2 -1 0 1 2 3 4 5 6 7 8 9 10 11 12
100ms
500ms
1500ms
-1
0
1
2
3
4
5
6
7
-5 -4 -3 -2 -1 0 1 2 3 4 5 6 7 8 9 10 11 12
100ms
500ms
1500ms
-1
0
1
2
3
4
5
6
7
-5 -4 -3 -2 -1 0 1 2 3 4 5 6 7 8 9 10 11 12
100ms
500ms
1500ms
1500ms
Stimulus Onset Asynchrony
(15-17 seconds)
100ms
500ms
1500ms
Stimulus Onset Asynchrony
(15-17 seconds)
100ms
500ms
Stimulus Onset Asynchrony
(15-17 seconds)
100ms
500ms
100ms
500ms

LTO10
DWT1
LSOP5
LPT6
LPT7
LTO4
Time (msec)
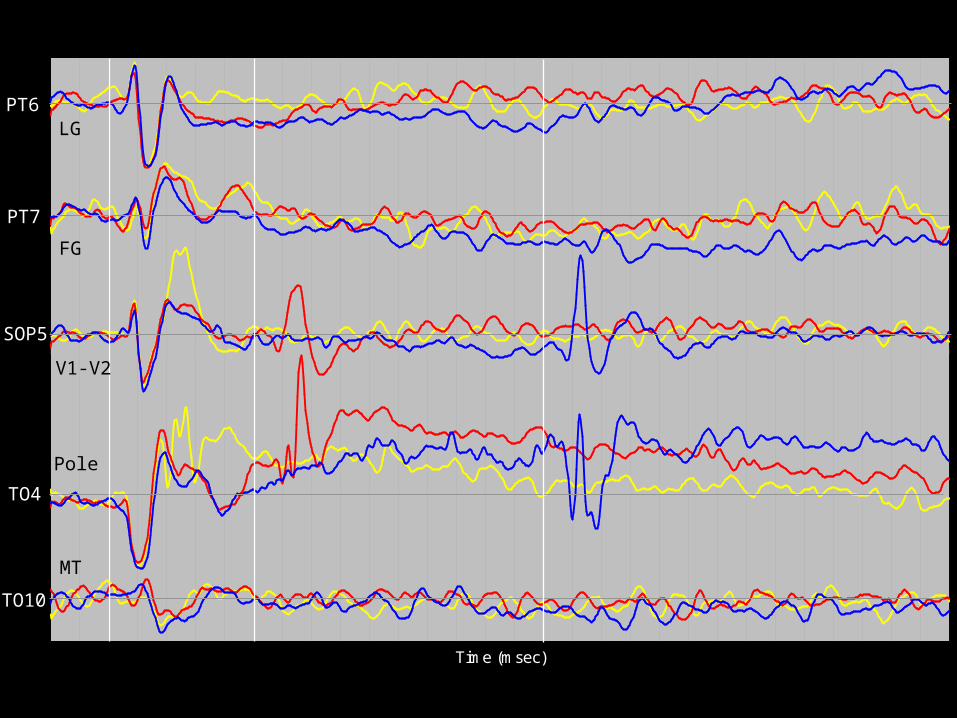
SOP5
PT6
PT7
TO4
TO10
LG
FG
Pole
V1-V2
MT

Timing of activations compared to neuronal activation

Subdural Electrode Strips


Face-Specific N200
2 A
-500
0
500
-100 0 100 200 300 400 500 600
Faces
Flowers
Nouns
Scr Faces
Target
-500
0
500
-100 0 100 200 300 400 500 600
Faces
Flowers
Nouns
Scr Faces
Target
10
11
0 100 200 300 400 500 600
Faces
Cars
Scr Faces
Numbers
Butterflies
0 100 200 300 400 500 600
Faces
Cars
Scr Faces
Numbers
Butterflies
Faces
Cars
Scr Faces
Numbers
Butterflies
B C
LMT 11
LMT 12
LMT 10
LMT 9 RMT 1
RMT 4
RMT 3
RMT 2
2 A
-500
0
500
-100 0 100 200 300 400 500 600
Faces
Flowers
Nouns
Scr Faces
Target
-500
0
500
-100 0 100 200 300 400 500 600
Faces
Flowers
Nouns
Scr Faces
Target
10
11
10
11
0 100 200 300 400 500 600
Faces
Cars
Scr Faces
Numbers
Butterflies
0 100 200 300 400 500 600
Faces
Cars
Scr Faces
Numbers
Butterflies
Faces
Cars
Scr Faces
Numbers
Butterflies
B C
LMT 11
LMT 12
LMT 10
LMT 9 RMT 1
RMT 4
RMT 3
RMT 2

RPTO 8
-300
-250
-200
-150
-100
-50
0
50
100
150
-100 0 100 200 300 400 500 600 700 800 900
Time (msec)
Fruits Face-Cap Tools Scr Faces Circles (Targets)

Face-House Attention Task

-300
-100
100
300
-100 100 300 500 700 900 1100 1300 1500 1700 1900
Attend House
Attend Face
NBH1
CDOB1

Negative activations

Harel et al. JCBFM, 2002

Harel et al. JCBFM, 2002
Harel et al. JCBFM, 2002

9 sec
9 sec
a
b

180° phase-reversed responses to faces among objects

41088
-8
-4
0
4
8
12
0 18 36 54 72 90 108 126 144 162 180 198 216 234 252 270 288 306
Positive ActivationNegative Activation
41088

Is there evidence for inhibition?

-300
-200
-100
0
100
200
300
-100 0 100 200 300 400 500 600 700 800 900
LTTP2-2Letterstring -Specific
RTTP2-5Face -Specific
P200
N200
JRNFaceNoun
RTP2-5 LTTP2-2

-150
-100
-50
0
50
100
0 100 200 300 400 500
FacesNouns
LOTM 8Letterstring - Specific
P200
N200
JGD
-150
-100
-50
0
50
100
150
0 100 200 300 400 500
FacesNouns
LTOI 10Letterstring - Specific
P200
N200
JWR
-100
-80
-60
-40
-20
0
20
40
60
80
100
0 100 200 300 400 500 600 700 800
FacesNouns
LTTP 2Face - Specific
P200
N200
SGN
-250
-200
-150
-100
-50
0
50
100
150
0 100 200 300 400 500 600 700 800
FacesNouns
RTTP 2Face - Specific
P200
N200
LSH
-150
-100
-50
0
50
100
0 100 200 300 400 500
FacesNouns
LOTM 8Letterstring - Specific
P200
N200
JGD
-150
-100
-50
0
50
100
150
0 100 200 300 400 500
FacesNouns
LTOI 10Letterstring - Specific
P200
N200
JWR
-100
-80
-60
-40
-20
0
20
40
60
80
100
0 100 200 300 400 500 600 700 800
FacesNouns
LTTP 2Face - Specific
P200
N200
SGN
-250
-200
-150
-100
-50
0
50
100
150
0 100 200 300 400 500 600 700 800
FacesNouns
RTTP 2Face - Specific
P200
N200
LSH

-
+
Excitatory
Inhibitory
+
-
Face-specific cell Word-specific cell
N200 P200


Rat Olfactory Bulb Structural MRI
Yang, Renken, Hyder, Siddeek, Greer, Shepherd, Shulman PNAS, 95: 7715-7720, 1998
7 Tesla100 m x 100 m x 1000 m

Yang, Renken, Hyder, Siddeek, Greer, Shepherd, Shulman PNAS, 95: 7715-7720, 1998
Rat Olfactory Bulb fMRI Activation
7 Tesla200 m x 200 m x 1000 m