Shrinking Solar Soft Costs - Lewis & Clark Law School
54
Shrinking Solar Soft Costs: Policy Solutions to Make Solar Power Economically Competitive Nick Lawton Energy Fellow at the Green Energy Institute April, 2014
Transcript of Shrinking Solar Soft Costs - Lewis & Clark Law School
Shrinking Solar Soft Costs: Policy Solutions to Make Solar Power
Economically Competitive
Nick Lawton Energy Fellow at the Green Energy Institute
April, 2014
Acknowledgments The author gratefully acknowledges the contributions of Professor Melissa Powers,
Director of the Green Energy Institute, without whose insights and ongoing support this
white paper would not have been possible. Additionally, the author would like to thank
Amelia Schlusser for her assistance and her graceful aesthetic eye. Finally, the author
dedicates this white paper to Dr. Ruth Petkoff for her clarity of vision and depth of thought.
© Nick Lawton, 2014.
Cover photo by Lance Cheung, 2009, Creative Commons License
i
Executive Summary
The past decade has seen a remarkable decline in the price of solar panels and, consequently, remarkable growth of the solar industry. However, without government support, solar power is not yet economically competitive with other forms of energy. For the solar industry to attain competitive prices in the absence of government support, the non-hardware costs, or soft costs, of solar power must decline substantially. The current price trends for solar panels themselves are already falling, but the remaining costs of bringing solar power online are not. The United States Department of Energy has recently launched the SunShot Initiative, which aims to make solar power more economically competitive, in part by substantially reducing soft costs. To that end, this paper explains what soft costs are and provides five policy solutions for reducing soft costs.
Soft costs are all the costs of bringing a solar photovoltaic system online, except the costs of the solar panels themselves. The soft costs of solar power include the following categories: (1) customer acquisition; (2) permitting, inspection, and interconnection; (3) financing; (4) installation labor; (5) affiliated, non-module hardware; and (5) taxes. This paper offers a detailed description of each type of soft cost.
The heart of the paper focuses on policy solutions for reducing these soft costs, offering five ways policy makers can help make solar power economically competitive:
(1) New Corporate Forms and Financing for Solar Power: Currently, the solar industry cannot use some of the most desirable business forms and financing methods. For example, the solar industry cannot use Real Estate Investment Trusts because the Internal Revenue Service does not consider solar panels to be real property. Similarly, the solar industry cannot use Master Limited Partnerships because the federal statute creating this structure makes fossil-fuel companies eligible, but not renewable energy companies. The federal government should reform these policies in order to level the playing field for various sources of energy and to allow the solar industry to take advantage of these business forms.
(2) Standardizing System Designs: Standardized solar power system designs would reduce soft costs at all phases of a solar project. The basic goal is to develop “plug-and-play” solar PV systems that are modular, easy to produce, and easy to install. Standardized hardware that includes integrated electronic components could obtain reduced costs through economies of scale. Additionally, standardized system designs should reduce permitting, inspection, and interconnection costs by reducing uncertainty about solar power’s safety risks or impacts on the utility grid. Fourth, standardized system design would reduce installation labor by providing simpler projects. All of these impacts should make the solar industry more profitable and predictable, turn lowering financing costs by attracting investors and lowering customer acquisition costs by attracting more customers. This paper argues that governments should promote standardization of solar system designs.

ii
(3) Streamlining Permitting and Inspections: Unwieldy, redundant, and needlessly complex permitting and inspection regimes add substantially to the soft costs of solar power. However, because permitting and inspection systems are the products of regulation, policy makers are uniquely well-poised to reduce these unnecessary costs. This paper argues that states should take the lead in streamlining permitting and inspection and should work with local governments. Particularly, states should develop standard technical and procedural requirements, implement clear guidelines and checklists for permit applications, and allow online completion and submission of permit applications. Additionally, states should eliminate unnecessary or redundant reviews and inspections, reduce wait times for inspections, and reduce permit fees.
(4) Utility Regulation to Promote Swift Interconnection: Interconnecting to the utility grid can prove to be a costly roadblock to the development of solar power. In areas with considerable solar power penetration, a new solar photovoltaic system may face supplemental interconnection studies that can add thousands of dollars to the system’s cost. The Federal Energy Regulatory Commission (FERC) recently issued a final rule, Order 792, revising the pro forma agreement under which small electricity generators may interconnect to existing transmission grids. This order regulates the supplemental studies a utility may require for small electricity generators such as distributed solar systems. Order 792 is an excellent step toward promoting swift, low-cost interconnections. This paper describes Order 792 in greater detail and argues that states should follow FERC’s lead to issue similar rules.
(5) Mandating Solar Buildings: The vanguard of government promotion of the solar industry, solar mandates require that new and renovated buildings include solar power. In 2013, the cities of Lancaster and Sebastopol in California passed solar mandates. Although these mandates are so recent that there is little empirical evidence of their effects, solar mandates should reduce solar soft costs in several important ways. Solar mandates should reduce customer acquisition costs by guaranteeing a customer base. Additionally, they would facilitate standardized system designs by incorporating solar power into the designs of entire communities, which often feature a limited number of housing designs. Moreover, solar mandates would also reduce financing costs by allowing solar power to be included in traditional, low-cost real estate financing mechanisms such as mortgages. This paper explores these benefits of solar mandates and advocates for more jurisdictions to implement them.
This suite of policies should help bring down the soft costs of solar power substantially, helping solar power to become cost-competitive with other forms of electricity generation as soon as possible.
[This page intentionally left blank]

Table of Contents
I. Introduction .............................................................................................. 1
II. Solar Power Price Trends ....................................................................... 4 A.Significant Variations in Solar Power Prices ....................................... 5 B. Declining Prices Show that Policy Can Reduce Costs ....................... 5
III. Categories of Soft Costs ........................................................................ 8 A. Customer Acquisition ......................................................................... 9 B. Permitting, Inspection, and Interconnection ..................................... 10 C. Financing ......................................................................................... 13 D. Installation Labor .............................................................................. 14 E. Affiliated Hardware ........................................................................... 16 F.Taxes ................................................................................................. 17
IV. Policy Solutions for Reducing Soft Costs ............................................ 18 A.New Corporate Forms and Financing for Solar Power ..................... 19
1. Yield Cos and REITs ................................................................. 19
2. Master Limited Partnerships ...................................................... 21
3. Real Estate Financing ............................................................... 21 B.Standardizing System Designs ......................................................... 23 C. Streamlining Permitting and Inspections ......................................... 25 D. Utility Regulation to Promote Swift Interconnection ........................ 28 E. Mandating Solar Buildings .............................................................. 31
V.Conclusion ............................................................................................. 36
1
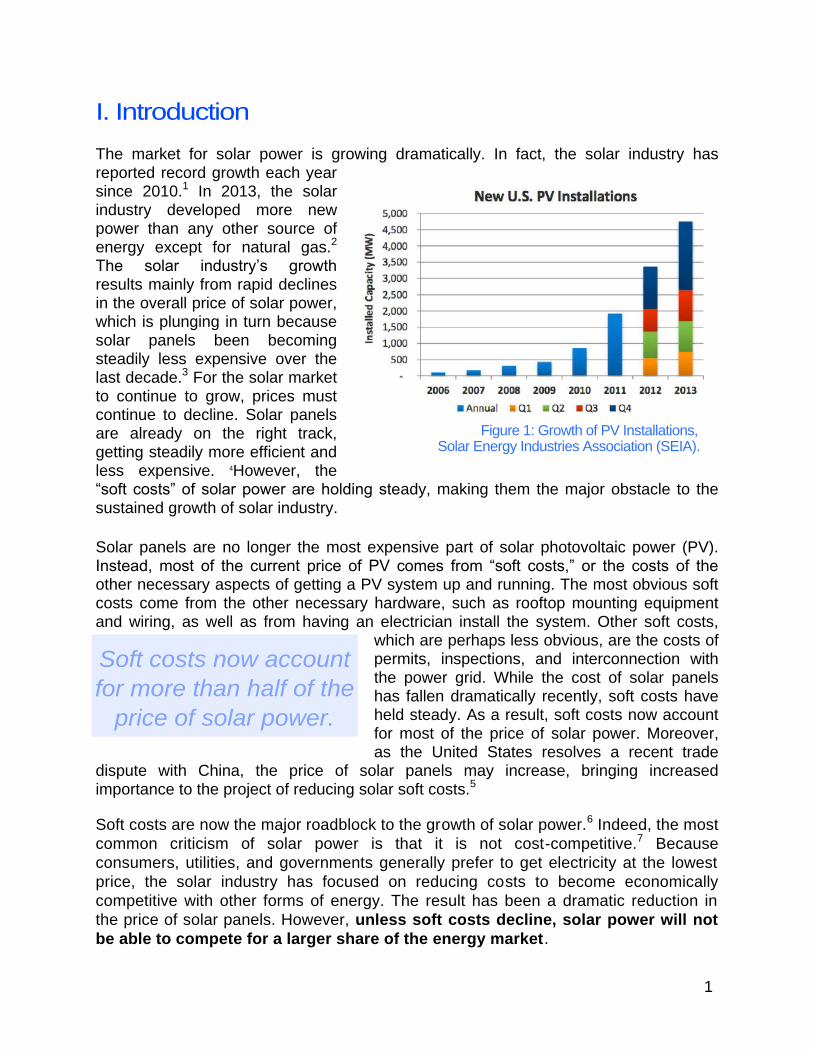
Figure 1: Growth of PV Installations, Solar Energy Industries Association (SEIA).
Soft costs now account
for more than half of the
price of solar power.
I. Introduction
The market for solar power is growing dramatically. In fact, the solar industry has reported record growth each year since 2010.1 In 2013, the solar industry developed more new power than any other source of energy except for natural gas.2
The solar industry’s growth results mainly from rapid declines in the overall price of solar power, which is plunging in turn because solar panels been becoming steadily less expensive over the last decade.3 For the solar market to continue to grow, prices must continue to decline. Solar panels are already on the right track, getting steadily more efficient and less expensive. 4However, the “soft costs” of solar power are holding steady, making them the major obstacle to the sustained growth of solar industry.
Solar panels are no longer the most expensive part of solar photovoltaic power (PV). Instead, most of the current price of PV comes from “soft costs,” or the costs of the other necessary aspects of getting a PV system up and running. The most obvious soft costs come from the other necessary hardware, such as rooftop mounting equipment and wiring, as well as from having an electrician install the system. Other soft costs,
which are perhaps less obvious, are the costs of permits, inspections, and interconnection with the power grid. While the cost of solar panels has fallen dramatically recently, soft costs have held steady. As a result, soft costs now account for most of the price of solar power. Moreover, as the United States resolves a recent trade
dispute with China, the price of solar panels may increase, bringing increased importance to the project of reducing solar soft costs.5
Soft costs are now the major roadblock to the growth of solar power.6 Indeed, the most
common criticism of solar power is that it is not cost-competitive.7 Because
consumers, utilities, and governments generally prefer to get electricity at the lowest
price, the solar industry has focused on reducing costs to become economically
competitive with other forms of energy. The result has been a dramatic reduction in
the price of solar panels. However, unless soft costs decline, solar power will not
be able to compete for a larger share of the energy market.
2
Solar soft costs must
decline by 80%.
This paper explains what soft costs are and offers five ways policy makers can help
reduce them. These policy proposals build on prior soft cost scholarship to provide more concrete detail on the actions policy makers should take. This paper focuses on solar
projects under 10kW, the size of most solar projects.8 Still, this paper’s insights are also important for larger projects. Although larger projects enjoy economies of scale that reduce overall costs, soft costs are a majority share of the overall price of solar power even at the utility scale.9
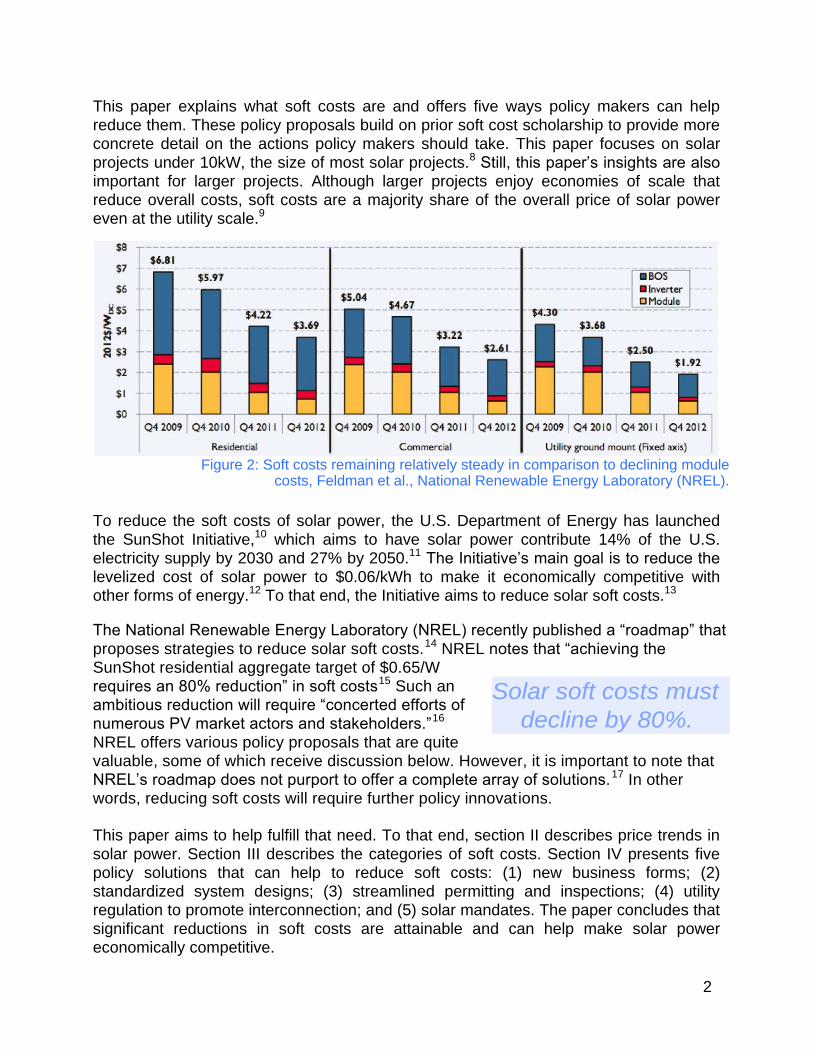
Figure 2: Soft costs remaining relatively steady in comparison to declining module
costs, Feldman et al., National Renewable Energy Laboratory (NREL).
To reduce the soft costs of solar power, the U.S. Department of Energy has launched
the SunShot Initiative,10 which aims to have solar power contribute 14% of the U.S. electricity supply by 2030 and 27% by 2050.11 The Initiative’s main goal is to reduce the levelized cost of solar power to $0.06/kWh to make it economically competitive with other forms of energy.12 To that end, the Initiative aims to reduce solar soft costs.13
The National Renewable Energy Laboratory (NREL) recently published a “roadmap” that
proposes strategies to reduce solar soft costs.14 NREL notes that “achieving the SunShot residential aggregate target of $0.65/W requires an 80% reduction” in soft costs15 Such an ambitious reduction will require “concerted efforts of numerous PV market actors and stakeholders.”16
NREL offers various policy proposals that are quite valuable, some of which receive discussion below. However, it is important to note that NREL’s roadmap does not purport to offer a complete array of solutions.17 In other words, reducing soft costs will require further policy innovations.
This paper aims to help fulfill that need. To that end, section II describes price trends in
solar power. Section III describes the categories of soft costs. Section IV presents five policy solutions that can help to reduce soft costs: (1) new business forms; (2) standardized system designs; (3) streamlined permitting and inspections; (4) utility regulation to promote interconnection; and (5) solar mandates. The paper concludes that significant reductions in soft costs are attainable and can help make solar power economically competitive.

3
Pricing Solar Power
This paper presents costs of solar power in price-per-watt. For example, the nation-wide average price of solar power is around six dollars per watt ($6/W), but to become economically competitive with other energy sources, the price of solar power must fall to one dollar per watt ($1/W).
Price-per-watt is the best metric for soft costs of solar power. First, price-perwatt makes it easy to understand the importance of reducing soft costs by showing that soft costs are more than half of the price of solar power.
Second, price-per-watt makes it easy to compare different types of soft costs, which would be more difficult with other metrics. This comparison can help show which types of soft costs have the greatest impact on the overall price of solar power, which should help policy makers set priorities.
Other studies of solar power often use two other price metrics. First, studies often use the Levelized Cost of Energy (LCOE), which presents prices in dollars or cents per kilowatt-hour ($/kWh). The virtue of LCOE is that it can make it easier to compare solar power to other forms of energy—to show, for example, how solar power compares over time to power from natural gas.
The other common metric for pricing solar power is the concept of “grid parity,” or the point at which solar power requires no incentives or subsidies to be cost-competitive with other forms of energy. The virtue of grid parity is that it makes it easy to know when solar power becomes cost-competitive with other forms of energy.
However, both LCOE and grid parity have significant problems. For example, although policy makers use LCOE most frequently, it has no standard definition and no standard method of calculation. Moreover, LCOE depends sensitively on several underlying assumptions, such as capital costs, system longevity, capacity factor, and operation and maintenance costs. Different assumptions yield profoundly different results. The resulting variability in LCOE makes it hard for policy makers to compare PV to other energy sources.
Calculating grid parity requires this difficult comparison between LCOE of PV and other energy sources, which makes grid parity the most flawed metric of all. The problem with this comparison is that small solar projects contribute power at the retail level (i.e., directly to a consumer) rather than at the wholesale level (i.e., to a utility for distribution to consumers). Because wholesale prices are lower than retail prices, the comparison makes other forms of power seem cheaper and solar power seem more expensive.
Finally, both LCOE and grid parity often rely on outdated information that fails to take into account the dramatic recent plunge in the price of solar power. Outdated, misleading information works against the solar industry.
For more on difficulties of calculating the price of solar power, see Morgan Bazilian et al., Re-considering the Economics of Photovoltaic Power, 53 Renewable Energy 329, 332 (2013), available a t www.bnef.com/ WhitePapers/download/82.

4
II. Solar Power Price Trends
Figure 3: Declining Solar Power Prices, Barbose et al., Lawrence Berkeley National Laboratory (LBNL).
Solar power has become significantly more affordable over at least the last fifteen
years: on average, prices have declined by roughly seven percent each year.18 However, the decline has been driven chiefly by falling prices of solar panels.19
Although soft costs have also declined during this fifteen-year period, they have remained fairly constant in the last five.20 These trends have made soft costs the largest share of the overall price of solar power..21 As hardware prices continue to fall, this trend continues as well.22 This section first describes how solar costs vary through time and by region, and then reviews the history of falling solar prices to show that policy makers can successfully bring costs down.
Figure 4: Soft Costs as the Majority of Solar
Power Price, Ardani et al, NREL.

5
A. Significant Variations in Solar Power Prices
The installed price of solar power varies according to numerous factors.23 For example, even among systems smaller than 10kW, prices vary significantly by project size: systems below 1kW cost an estimated $8.50/W, while systems between 9–10kW cost roughly $5/W.24 Similarly, prices vary significantly among states, with systems in California or Wisconsin costing as much as $2/W (roughly 30%) more than systems in Texas or Colorado.25 Additionally, local cost of living “has a significantly positive impact on installation prices.”26 Some sources of variation are more surprising. For example, “tax-exempt systems generally have higher installed prices than similarly sized residential and commercial systems.”27 Similarly, more educated communities tend to pay lower prices for solar power.28 This significant variability in the market for solar power makes calculating a nationwide average price for solar power difficult.
Figure 5: State Variation in Solar Power Prices Barbose et al., LBNL.
B. Declining prices show that policy can reduce costs
The history of solar prices strongly suggests that policy makers can drive down soft costs. For one, soft costs have fallen in the past.29 In fact, reductions in soft costs have accounted for “38% of the decline in the total installed price for ≤10kW systems over [the last fifteen years], clearly indicating the significant impact of non-module cost reductions over the long term.”30
Similarly, dramatic international differences in the price of solar panels “suggests that near-term price reductions in the United States are possible.”31 For example, soft costs of solar power are dramatically lower in Germany than in the United States, illustrating that Germany has achieved significant reductions in solar soft costs.32
6
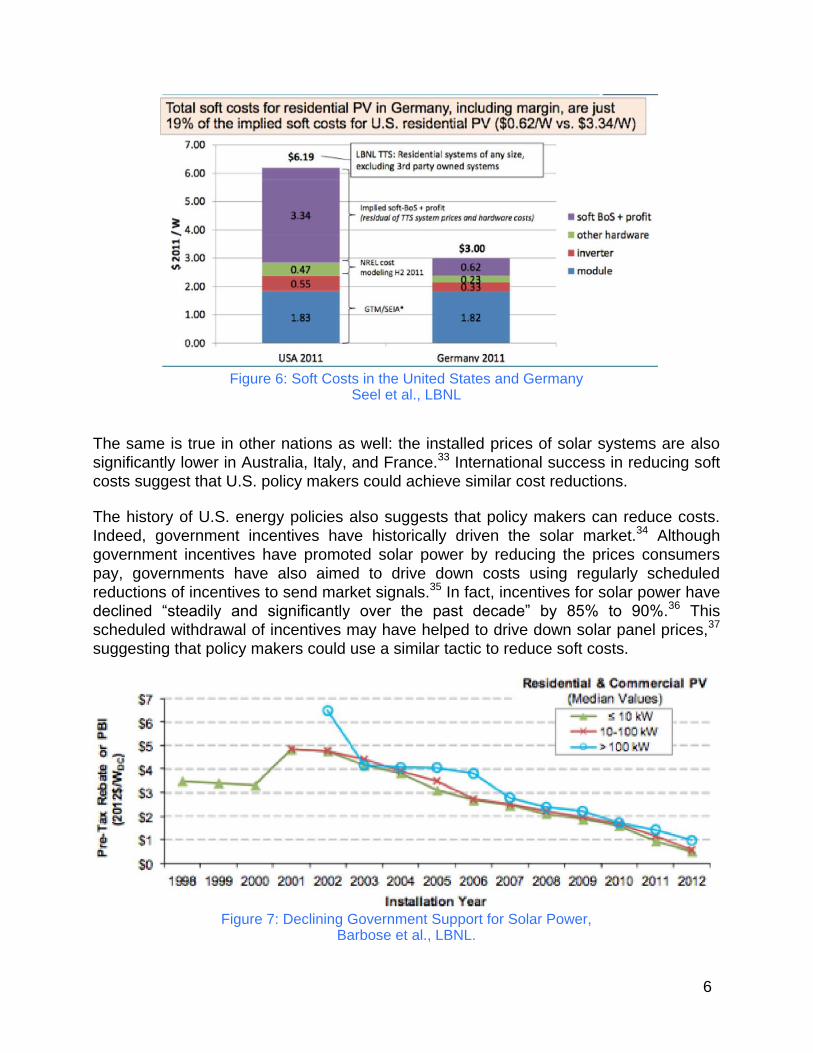
Figure 6: Soft Costs in the United States and Germany Seel et al., LBNL
The same is true in other nations as well: the installed prices of solar systems are also
significantly lower in Australia, Italy, and France.33 International success in reducing soft
costs suggest that U.S. policy makers could achieve similar cost reductions.
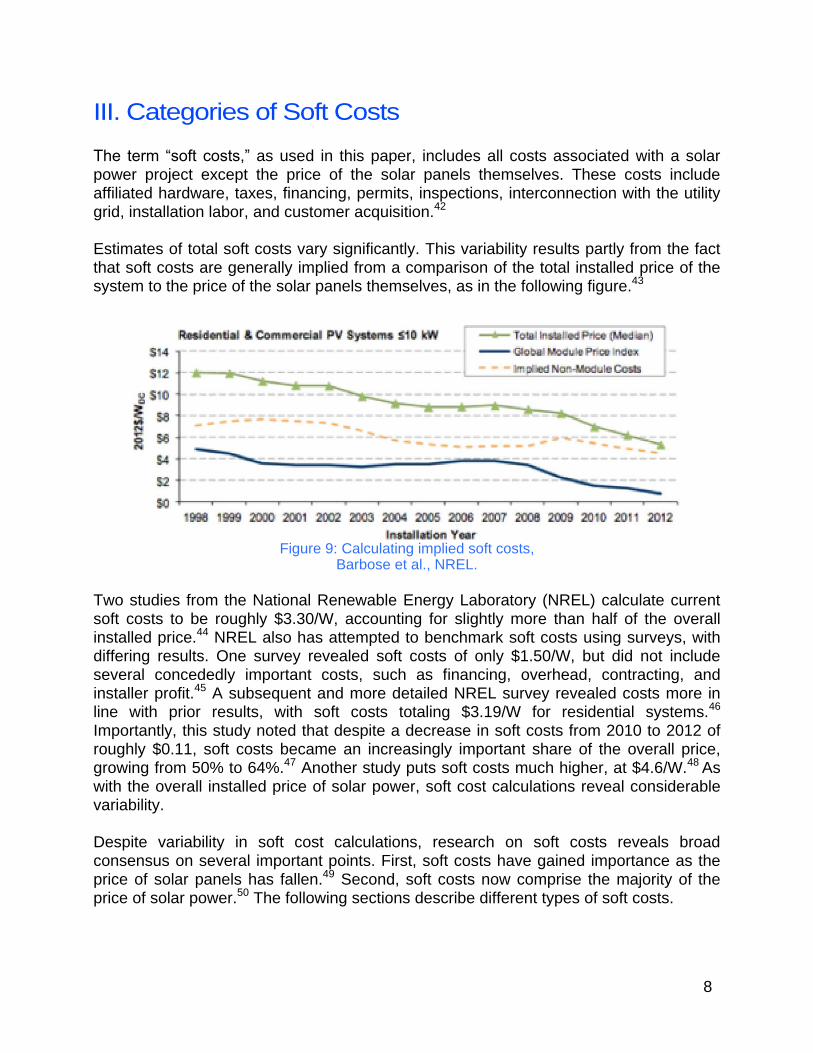
The history of U.S. energy policies also suggests that policy makers can reduce costs.
Indeed, government incentives have historically driven the solar market.34 Although
government incentives have promoted solar power by reducing the prices consumers
pay, governments have also aimed to drive down costs using regularly scheduled
reductions of incentives to send market signals.35 In fact, incentives for solar power have
declined “steadily and significantly over the past decade” by 85% to 90%.36 This
scheduled withdrawal of incentives may have helped to drive down solar panel prices,37
suggesting that policy makers could use a similar tactic to reduce soft costs.
Figure 7: Declining Government Support for Solar Power, Barbose et al., LBNL.

7
The Downside of Withdrawing Government Incentives
Scheduled withdrawal of government incentives may help drive down prices, but it also reduces consumer benefits from cost reductions. In fact, withdrawal of government incentives for solar panels has offset up to 88% of the decline in installed prices.34
Thus, withdrawal of government support for solar power has meant that consumers cannot enjoy the full benefits of significant price reductions. Policy makers should carefully weigh the benefits of cost reductions against the resulting diminished consumer benefits.
In fact, soft costs should be especially responsive to local policies. “Unlike module prices, which are primarily established through global markets, non-module costs consist of a variety of cost components that may be more readily affected by local policies.”38 Indeed, state policies can have a significant, demonstrable impact.
Figure 8: Different State Markets for Solar, Barbose et al., NREL.
Figure 8 shows dramatic differences in PV market development in states with similar solar resources.39 California’s overall solar market and market growth dwarf those of Arizona, though both states have ample solar resources.40 Similarly, New Jersey’s PV market dwarfs New York’s, though both states have similar solar resources.41 The essential difference must be in state policies: these data suggest that policies in California and New Jersey promote the solar industry much more effectively than policies in Arizona and New York. This paper aims to help identify policy strategies that can reduce the soft costs of solar power in order to attain thriving markets like those in California and New Jersey. However, reducing soft costs requires a clear understanding of what soft costs are. The next section addresses the nature of soft costs and previews strategies for reducing them.
8
III. Categories of Soft Costs
The term “soft costs,” as used in this paper, includes all costs associated with a solar power project except the price of the solar panels themselves. These costs include affiliated hardware, taxes, financing, permits, inspections, interconnection with the utility grid, installation labor, and customer acquisition.42
Estimates of total soft costs vary significantly. This variability results partly from the fact that soft costs are generally implied from a comparison of the total installed price of the system to the price of the solar panels themselves, as in the following figure.43
Figure 9: Calculating implied soft costs,
Barbose et al., NREL.
Two studies from the National Renewable Energy Laboratory (NREL) calculate current soft costs to be roughly $3.30/W, accounting for slightly more than half of the overall installed price.44 NREL also has attempted to benchmark soft costs using surveys, with differing results. One survey revealed soft costs of only $1.50/W, but did not include several concededly important costs, such as financing, overhead, contracting, and installer profit.45 A subsequent and more detailed NREL survey revealed costs more in line with prior results, with soft costs totaling $3.19/W for residential systems.46
Importantly, this study noted that despite a decrease in soft costs from 2010 to 2012 of roughly $0.11, soft costs became an increasingly important share of the overall price, growing from 50% to 64%.47 Another study puts soft costs much higher, at $4.6/W.48
As with the overall installed price of solar power, soft cost calculations reveal considerable variability.
Despite variability in soft cost calculations, research on soft costs reveals broad consensus on several important points. First, soft costs have gained importance as the price of solar panels has fallen.49 Second, soft costs now comprise the majority of the price of solar power.50 The following sections describe different types of soft costs.

9
To reach SunShot
Initiative goals, customer
acquisition costs must
fall by 80%.
Figure 10: Current trends in customer acquisition cost reductions,
Ardani et al., NREL.
A. Customer Acquisition
Customer acquisition represents at once among the largest and most amorphous share of soft costs. Customer acquisition includes advertising and marketing, screening potential projects for viability, and designing systems.51
Aside from paying for advertising, the customer acquisition process usually involves the following steps: a screening by phone to determine a potential customer’s utility bills, credit-worthiness, and ownership of the relevant property; a site visit to assess whether the property is suitable for solar; and, finally, engineering of an appropriate system design.52 Installers must bear the costs of these steps before a customer signs a contract.53 Accordingly, if any of these steps reveal that the project cannot go forward, the installer must then either bear those costs itself or pass them on to other customers, thus raising soft costs.
On average, customer acquisition costs add $0.67/W to the price of a residential PV system.54 Some installers report customer acquisition costs as high as $1.00/W.55 Of the average sum, $0.33/W is devoted to marketing and advertising, $0.11/W is devoted to system design, and $0.23/W is devoted to a remainder of customer acquisition costs that studies do not specify.56 Some of the remainder may reflect costs passed on from projects never reach completion. Alternatively, the remainder may reflect costs devoted to aspects of developing a professional reputation other than traditional
advertising or marketing, such as paying staff to attend professional conferences o r t o participate in a trade organization. Customer acquisition costs must decline by about 80% to $0.12/W to meet the DoE’s SunShot Initiative targets.
Fortunately, customer acquisition costs are currently declining. The solar industry has already begun to use NREL’s three suggested strategies for reducing customer acquisition costs: software tools for
10
Policies to Reduce Customer Acquisition Costs
Policy makers can reduce costs of
customer acquisition in several ways.
Standardized solar PV systems could
reduce costs by limiting the need for
customized designs. Streamlined permitting, inspection, and interconnection could help prevent
costs from customers that abandon PV
projects due to delays or costs
associated with bureaucratic hurdles.
Finally, mandating solar homes and businesses could reduce customer
acquisition costs by guaranteeing a pool
of customers from new construction.
PII costs must decline
by more than 75%.
remote site assessment, design templates, and consumer-targeting strategies. However, these strategies will not reduce customer acquisition costs enough to meet SunShot Initiative goals. In fact, current strategies will achieve only 75% of targeted cost reductions. To complete the cost reductions, new policy strategies are necessary.
B. Permitting, Inspection, and Interconnection
Permitting, inspection and interconnection (PII) costs add significantly to overall solar soft costs. Unsurprisingly, estimates of PII costs vary. Different organizations calculate significantly different costs for obtaining permits, with a range between $0.20/W and $0.77/W.57 This large range for permitting costs likely does not reflect inaccuracies in the various studies, but more likely accurately represents the fact that permit processes, and their consequent costs, vary widely among jurisdictions.58 The same is true of inspection and interconnection: different jurisdictions have different requirements and different resulting costs.59 As a result of this variability among jurisdictions, it is difficult to calculate average PII costs. Nonetheless, PII costs contribute significantly to overall solar soft costs and thus offer a good opportunity for policy makers to help bring soft costs down.
This paper treats PII costs together for several
reasons. First, the Department of Energy’s
(DoE’s) SunShot Initiative treats them together when setting cost-reduction goals.60
Following DoE’s lead, many soft cost studies also treat PII costs together.61 Second, it
makes sense to treat these costs together because policy makers are uniquely well-poised to reduce PII costs; unlike other soft costs such as affiliated hardware
costs, which result from larger commodity markets, PII costs are the product of
regulations and thus are particularly susceptible to reduction through regulatory
reform. And third, as discussed above, permitting, inspection, and interconnection
costs each vary widely among jurisdictions, suggesting that successes in some
jurisdictions can teach others how to bring down the bundle of PII costs. However,
despite the fact that some jurisdictions are developing policies to reduce PII costs,
these costs are falling far too slowly to reach the SunShot Initiative’s goals.

11
1/3 of installers avoid
jurisdictions with difficult
permit requirements.
Figure 11: PII costs are not declining quickly enough to meet targets. Ardani et al., NREL.
Variability between jurisdictions helps to keep PII costs high. PII processes vary not only
by state, but also by county and city. For example, “[i]n most states, the local or county building department controls the review and issuance of permits.1162 Inspection and interconnection processes also vary among governments and utilities.63 Some utilities seem resistant to facilitating interconnection, while others (chiefly municipal utilities) seem more eager.64 The result of variable PII processes is that installers must familiarize themselves with different processes in each jurisdiction where they work, and
either the installer or the consumer must pay the cost of that education.65 By forcing installers to spend staff time deciphering different jurisdictions’ requirements,66
variable and inconsistent PII processes raise soft costs.
Onerous jurisdictions may deter installers altogether: “more than one third of installers avoid jurisdictions with particularly challenging permitting processes.1167 This trend is
understandable, given that Sunrun reports
that “[o]ne installer lost money on its first four installations in a jurisdiction due to complicated and unclear requirements.1168
Deterring installers has two significant negative effects. First, that deterrence means that solar power will not be
competitive in markets where installers refuse to do business.69 Second, by restricting the market to more savvy installers, complicated PII processes can erect a barrier to entry into the marketplace, potentially subjecting solar power to anticompetitive market manipulation. Either of these effects would likely raise soft costs.
12
Jurisdictions may have difficult or complex PII processes for several reasons. Permits may require input from many different divisions of a local government, “such as building, electrical, mechanical, plumbing, fire, structural, zoning, and aesthetic
reviews.”70 Cumbersome or redundant processes may also be due to unfamiliarity with solar power.71 Finally, jurisdictions may unnecessarily inflate costs by designing PII processes “for the minority of complicated installations that require more in-depth review.”72
Fees for permitting, inspection, and interconnection, which vary widely, 73 are also a
significant part of PII costs. For permit fees, some jurisdictions charge only a sum necessary to recover the cost of processing the permit application,74 but other
jurisdictions consider permit fees to be sources of revenue,75 implying that fees may be higher than necessary for cost-recovery. Above-cost fees may be based on a PV system’s overall cost or size, but “neither system costs nor size are necessarily reflective of the amount of time it takes ... to process the permit application.”76
The results are substantial permit fees. A Sierra Club study of permit fees in California revealed an average fee of $343, with a range from $0 to roughly $1,400.77
Inspection and interconnection fees can add up to $2,500 per installation.78 Moreover, if
a solar PV system is not standardized, or if the electricity distribution system already hosts numerous small generators, utilities can require supplemental interconnection studies, which sometimes feature extreme fees: “Even residential systems proposed in areas of high [solar] penetration have been quoted supplemental interconnection study fees of $25,000.”79
Current trends in regulation of permitting, inspection, and interconnection are unlikely
to reduce costs sufficiently to meet SunShot Initiative goals. Although solar installers can help keep costs down by completing permit applications correctly and being prepared for inspections, PII costs are for the most part products of policy. Accordingly, policy makers should bring renewed focus on reducing PII costs.
Policies to Reduce Permitting, Inspection, and Interconnection Costs
Policy makers are uniquely well-poised to
reduce PII costs. For example, cities,
counties, or states may limit permit fees to recover only permit-processing costs.
Uniform, streamlined permitting and inspection processes would also
reduce PII costs.
Standardized solar systems would reduce the need for extensive, expensive permits and inspections.
Mandating solar buildings would also
make the solar permitting process a part of the required permitting for new construction, which would reduce costs as well.
Finally, states have the opportunity to promote swift interconnection by modeling utility regulation on FERC’s recent Order 792.
13
Weighted average cost of capital
Various sources of revenue—such as common and preferred stocks, different types of debt, and tax equity investment—generally demand different rates of return. The weighted average cost of capital is the minimum rate of return a company must earn to provide various investors with their expected rates of return.
C. Financing
Unlike many other soft costs of solar power, which tend to increase the upfront cost of a PV system, the cost of financing most solar projects today tends to be distributed over the life of the system, with financial backers expecting a return on an investment.80 In recent years third-party ownership of solar PV systems has come to dominate the field, largely displacing the older model in which homeowners themselves bought and owned PV systems.81 Under this model, as popularized by businesses like SolarCity and Sunrun,82 homeowners pay little or no upfront cost for a solar PV system and instead make monthly payments to a third party owner for solar power,83 in addition to paying utility bills for the rest of their energy use. Although these monthly payments are lower than a utility bill, over time the arrangement may cost consumers more than simply buying a system, because the third-party owner must recoup the upfront cost of installation as well the greater cost of third-party financing.84
Most small-scale solar systems are leased from—and
thus financed by—third-party owners.
Although the most common system of ownership spreads costs over the life of the system, this paper discusses financing along with soft costs that raise upfront costs for two reasons. First, and most fundamentally, as for other soft costs contributing to upfront prices, policy is important to the cost of financing; state and federal lawmakers can take actions that will bring financing costs down. Second, bringing down the cost of financing has very similar effects as reducing other soft costs, reducing the overall cost of a PV system for consumers.85
NREL reports that the weighted average cost of capital for small solar PV systems is nearly 10%.86 However, third-party financing tends to be even more costly, ranging up
to a 14% weighted average cost of capital, because third-party owners of solar projects typically rely on financing sources that demand higher rates of return.87 Thus, PV customers may attain more favorable financing terms by simply buying a system themselves.88 However, regardless of whether property owners finance their own systems or opt for third-party ownership, achieving the reduced soft costs envisioned by the DOE’s SunShot Initiative will require reducing the cost of capital to 3%.89

14
Policies to Reduce Financing costs
Policy makers can reduce financing
costs by improving access to third-
party financing, which generally relies
on tax-equity investment. Policy makers
can help by either increasing the number
of tax equity investors or increasing the
appeal of PV projects to existing tax
equity investors. For example, to
continue attracting tax equity investment,
Congress could amend the Investment
Tax Credit to prevent it from declining
from 30% to 10% in 2017.
Utility financing could also provide
capital for solar projects at lower cost.
One model would have utilities make
upfront payments for solar PV systems,
and then allow ratepayers to pay off
the PV system over time through
increased utility bills. Alternatively,
utilities could themselves finance and
own residential and commercial solar
systems. Direct utility ownership of
distributed solar systems could help
persuade utilities that distributed solar
power is an opportunity rather than a
threat.
Two other forms of financing that could
reduce overall costs are PACE
financing, which would allow mortgage-
like financing for solar projects, and
community solar, which would allow
groups of investors to finance and own
PV systems and to use the solar energy.
However, both systems face significant
legal hurdles that prevent their use in
most states. Policy makers should act to
make these attractive alternative
financing mechanisms available to
consumers throughout the nation.
Section IV discusses all these policy
options in greater detail.
D. Installation Labor
Installation labor contributes on average $0.59/W to the overall cost of a solar PV system, accounting for roughly 15% of the total soft costs. Notably, labor costs in the United States are ten times higher than similar installation costs in Germany,90
suggesting that U.S. policy has
ample room for improvement. The chief reason for this discrepancy is that installing an average solar PV system takes ten times longer in the U.S. than in Germany.91 In short, installing a solar PV system in the U.S. requires more labor at higher wages, inflating overall labor costs.
Installing a solar system is Figure 12: Installing Solar Panels,
costly in the United States in
part because neither solar
Figure 12: Installing Solar Panels Oregon Dept. of Transportation., Creative Commons License.

15
systems nor rooftops are standardized. Sources of variability include different roof designs, electric systems, utility requirements, and customer preferences.92 For example, PV installers must often adapt systems to fit existing roofs, or must refit roofs to guarantee that they can bear the increased load of solar panels. Additionally, many roofs are at least partially shaded, requiring installers to adapt a PV system to maximize energy production.Ó93
These constraints make standardization difficult and raise the cost of solar PV installations.
Figure 13: Discrepancy between the U.S. and Germany
Seet et al., LBNL. Permit and inspection delays also inflate installation costs. Inconsistent permitting requirements, multiple
inspections, and long inspection appointment windows cause solar installations to take far longer than they should, and longer than they do in other nations.
Delays inflate costs, which is especially clear for long inspection appointment windows: work is put on hold while waiting for an inspection, but because
workers remain on site, wages continue to accrue. The installer incurs costs without getting work done. The costs pass through to consumers, and the
installed price of solar rises.
Labor costs are a good example of how reducing soft costs can benefit consumers and
the solar industry alike. Reducing labor costs does not mean losing jobs. Instead,
reducing labor costs means having employees work more efficiently. Efficient work
yields more completed projects, a better reputation, and more customers.
Policies to Reduce Installation Labor Costs
Standardizing solar PV system designs would help reduce the labor necessary to install them.
Streamlining permitting and inspection
procedures will minimize labor necessary
for regulatory compliance and will reduce
delays that inflate costs.
Solar mandates for new construction or large renovations would help reduce installation costs. Mandates would guarantee that buildings are solar-ready, reducing necessary preparatory work. Mandates would also provide large batches of projects, reducing travel time and associated expenses.

16
Figure 14: Solar Tracking System, Leonard G., Creative Commons License.
E. Affiliated Hardware
Apart from solar panels, the hardware for a PV project can add appreciably to the project’s overall costs. Affiliated hardware can include racks for the solar panels, systems that allow the panels to move to
track the sun, and inverters.94 As this equipment becomes more sophisticated, it adds to the overall cost of solar power. For example, “systems with tracking equipment exhibit consistently higher installed prices than their fixed-tilt counterparts.Ó95 For projects less than 10kW, sophisticated tracking systems can add as much as $1.2/W, roughly 20%, of the overall installed cost.96 Similarly, inverters add substantially to the cost of PV projects, adding roughly $0.30/W, or about 5%, to an average PV project. More sophisticated microinverters,97 which have become more popular in the last decade, add even more to the price of a PV project.98
On the other hand, equipment like tracking devices and microinverters also boost the overall efficiency of PV systems, helping offset installation costs more quickly. Microinverters may produce up to 12% more energy annually, with greater efficiency gains in shaded areas.99 Tracking systems may increase overall annual energy production by 12–45%.100 Over the PV system’s life, these gains in efficiency may more than offset upfront costs. However, increased upfront costs may deter property owners or investors who would otherwise be interested in solar power.
Policies for Reducing Non-Module Affiliated Hardware Costs
Targeted, phased subsidies for
efficiency-boosting equipment could help
reduce costs. Predictable, regularly
scheduled reductions in government
support—which may have helped
stimulate reductions in the price of solar
panels—could send market signals to
bring prices down as subsidies
diminish.
Standardized system designs with
integrated electronic components may
substantially reduce costs. Policy makers
could encourage standardization with
streamlined permitting and greater
rebates for standardized systems.
17
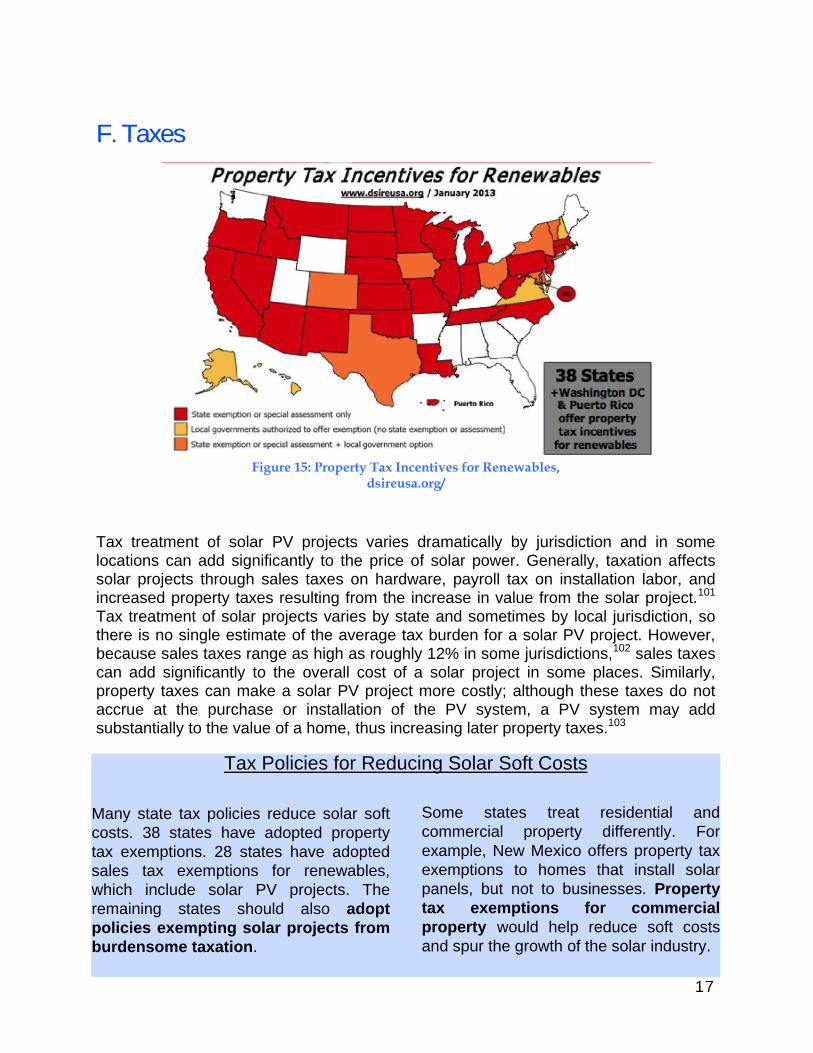
F. Taxes
Figure 15: Property Tax Incentives for Renewables,
dsireusa.org/
Tax treatment of solar PV projects varies dramatically by jurisdiction and in some locations can add significantly to the price of solar power. Generally, taxation affects solar projects through sales taxes on hardware, payroll tax on installation labor, and increased property taxes resulting from the increase in value from the solar project.101
Tax treatment of solar projects varies by state and sometimes by local jurisdiction, so there is no single estimate of the average tax burden for a solar PV project. However, because sales taxes range as high as roughly 12% in some jurisdictions,102 sales taxes can add significantly to the overall cost of a solar project in some places. Similarly, property taxes can make a solar PV project more costly; although these taxes do not accrue at the purchase or installation of the PV system, a PV system may add substantially to the value of a home, thus increasing later property taxes.103
Tax Policies for Reducing Solar Soft Costs
Many state tax policies reduce solar soft
costs. 38 states have adopted property
tax exemptions. 28 states have adopted
sales tax exemptions for renewables,
which include solar PV projects. The
remaining states should also adopt
policies exempting solar projects from
burdensome taxation.
Some states treat residential and
commercial property differently. For
example, New Mexico offers property tax
exemptions to homes that install solar
panels, but not to businesses. Property
tax exemptions for commercial
property would help reduce soft costs
and spur the growth of the solar industry.
18
Market growth will
reduce soft costs.
Soft costs are not falling
fast enough to meet
Sunshot Initiative goals.
IV. Policy Solutions for Reducing Soft Costs
Policy makers can play a key role in driving down the soft costs of solar PV power. Indeed, policy makers have helped to bring down the overall costs of solar PV power in the past.104 Moreover, soft costs are already declining, although too slowly,105 meaning that policy makers need only accelerate an existing trend rather than create a new one. The National Renewable Energy Laboratory’s (NREL’s) Soft Costs Roadmap identifies how various types of soft costs are projected to decline by 2020.106 This trend shows that the growth of the solar PV market itself leads to some decline in price. However, if the NREL’s Roadmap is a cause for hope, it is also a cause for caution, as the Roadmap demonstrates that current soft cost trends will not reach the DoE’s Sunshot Initiative goals. Thus, policy makers have an opportunity—indeed, an imperative—to take action.
NREL’s Soft Costs Roadmap offers valuable suggestions for bringing down many of the soft costs discussed in this paper. The Roadmap focuses on customer acquisition, permitting, inspection and interconnection, installation labor, and financing,107
describing the likelihood that its suggested cost-reduction opportunities will actually take place.108 Rather than merely recite the NREL’s recommendations, this paper commends that invaluable source to readers.
However, the Soft Costs Roadmap by no means completes the task of devising policies to bring down soft costs. For example, within the various categories of soft costs the Roadmap measures, NREL notes that “undefined” solution sets are necessary in order to reach its targets.109 Moreover, the Roadmap does not attempt to measure or to plan
strategies to reduce what it calls “other soft costs.”110 Yet these “other soft costs” are the largest single share of soft costs, at $1.86/W out of a total $3.32/W.111 These “other soft costs” include profit and overhead, but may also include other factors also.112 Both these limitations reveal that the roadmap, while very
valuable, will not achieve the SunShot Initiative’s goals on its own.
To further the goal of reducing solar PV soft costs to meet SunShot targets, this paper discusses five policies: (1) promoting new business forms for solar developers; (2)standardizing system designs; (3) streamlining permitting and inspection; (4) reforming utility regulation to promote swift interconnection; and (5) mandating installation of solar power. Although prior works have suggested some of these policies, no prior work has offered the depth of detail this paper offers. These five policies have great potential to substantially reduce the soft costs of solar and should help bridge the gap between the Soft Cost Roadmap’s identified cost-reduction opportunities and the overarching goal of the SunShot Initiative.
19
New business
forms can attract
more investment at
lower cost.
A. New Corporate Forms and Financing for Solar Power
As discussed above,solar PV projects face a high cost of capital because solar installers do not have access to some lower-cost financing mechanisms and to some business forms that would enable such access. This section argues that policy makers at the federal and state level should enact policies that will allow solar PV projects greater access to low-cost capital.
Certain business forms could allow access to a lower cost of capital by securing more favorable tax treatment that attracts investors. Generally, “[p]roject developers draw
funding from up to six tiers of capital from cheapest to most expensive É [which are] Treasury cash grants, government-enhanced debt, straight debt, tax equity, back-levered debt, and true equity.”113 The basic goal of using new business forms is to gain more investment at lower cost114 To that end, developers would like to use Real Estate Investment Trusts (REITs) and Master Limited Partnerships (MLPs).115
Additionally, solar project developers would like to have direct access to cheaper forms of capital through traditional real-estate financing mechanisms such as mortgages. This section describes the advantages of these business forms and financing methods and argues that regulators should allow their use in the solar industry.
1. Yield Cos and REITs
Yield Cos and REITs provide incentives for investment by allowing favorable tax treatment and the ability for investors to liquidate assets by trading stocks on a public market.116 REITs avoid paying income taxes at the entity level,117 and thus avoid a problem of double taxation common to other corporate forms. Yield Cos, on the other hand, do not avoid double taxation. Yield Cos, however, legal under current regulations, while REITs may not be. This section first describes how each corporate form operates, then explains what policy reforms are necessary to allow the solar industry to use the more advantageous REIT form. This section describes Yield Cos first in order to illustrate why REITs are superior. The goal is for solar developers to raise capital that demands a lower rate of return, reducing the weighted average cost of capital and thus overall solar soft costs.
Yield Cos create different subsidiary businesses for existing solar systems and those still under development. Existing systems attract investors at lower cost because they entail fewer risks. The developer then uses funds raised from existing projects to finance those under development. As a developer completes projects, it moves them to the subsidiary for existing systems, increasing that subsidiary’s allure. Recently, the major solar developer SunEdison launched a Yield Co that it hopes will raise as much as $300 million.118 Other developers are considering this corporate form also. However, because Yield Cos do not avoid double taxation,119 they are not as attractive as REITs.

20
REITs do avoid double taxation but may not be entirely legal under current regulation. REITs allow small investors to pool investments in real estate projects without facing corporate taxes, but “cannot own an operating business.120 Rather, a REIT would provide tax benefits to investors by owning solar panels and leasing them to another company that operates the assets as a business.121 For this approach to be legal, the IRS will have to clarify that renewable energy assets—particularly solar panels—qualify as real property.122 Although at least one renewable energy project has asked the IRS to do so, “[n]o ruling has been issued, and indications from the IRS to date have been that the agency is not prepared to treat solar panels as real property.”123
The IRS should issue a rule clarifying that solar panels do qualify as real property for two reasons. Such a ruling simply makes sense: solar panels are like real property in that they are typically a structural element of a real property asset (a home or building) that is fixed to real property for at least 15–20 years. There is no doubt that a roof,
Figure 16: Solar panels enjoy warranties that last as long as normal roofs, Maehlum, Energy Informative.
which likely lasts for roughly the same time, is a component of real property, and there should similarly be no doubt for rooftop solar. This IRS ruling would allow PV installers to access capital more cheaply, bringing down the cost of capital. Reducing the cost of capital would in turn contribute to the soft cost reductions the federal government has advocated through the Department of Energy’s SunShot Initiative.

21
Figure 17: MLPs used mainly for fossil fuels, Congressional Research Service.
2. Master Limited Partnerships
Like the REIT, the Master Limited Partnership (MLP) is an advantageous business form that is not quite legal for solar companies under current regulations. Unlike most partnerships, MLPs enjoy the ability to sell ownership interests on a stock exchange while retaining the favorable single taxation of a partnership.124 “The liquidity, or the ability to exit the investment in a public market, and the fact that earnings are only taxed once[,] mean that equity can be raised at a higher multiple to earnings.Ó125
However, while natural gas, oil, and mineral companies can take advantage of MLP status, the federal statute allowing MLPs does not allow solar installers to use this business form.126 Because MLPs and their limitations were created by federal statute,127 Congressional action is necessary to allow solar PV companies to qualify as MLPs.
Although hope for a federal statutory fix may be slim, given current Congressional paralysis, in principle Congress should enact such a fix. First, such a statutory amendment would be consistent with the federal government’s goals of promoting renewable energy.128 Second, by
allowing renewable energy companies to take advantage of the same business forms that fossil-fuel companies enjoy, this amendment would help level the playing field for energy developers. Finally, and most relevant to this paper, such a statutory fix would allow solar PV companies easier access to low-cost capital, thus helping to reduce the soft costs of solar.
3. Real Estate Financing
As discussed above, property owners who directly buy solar PV systems may get a better economic deal because third-party financing generally faces a higher cost of capital.129 Property owners could obtain capital at even lower cost, thus reducing the overall soft costs of solar PV systems, through traditional, low-cost real estate financing tools. Perhaps the clearest example is a mortgage; unlike most loans for solar retrofits, which have an average weighted cost of capital of 9.9%,130 average mortgage rates are generally much lower, ranging from roughly 3.5% to 4.5%.131 The Federal Housing Administration (FHA) does insure loans through an Energy Efficient Mortgage program,132 and some private lenders do offer these insured mortgages for retrofits to install solar panels on existing homes.133 These Energy Efficient Mortgages require a 3.5% down payment and offer property owners the lesser of either the cost of energy
22
improvements or 5% of the property’s value.134 These mortgages may be bundled into an existing mortgage only if the value of consequent energy savings is greater than the sum of the loan.135 Energy Efficient Mortgages are an attractive option for homeowners because they provide capital at lower cost than other financing sources. Additionally, homeowners may be able to use traditional mortgages to finance solar power if a solar project is part of the initial construction or purchase of property. Traditional mortgages may yield capital at an even lower cost than the FHA-administered program. Access to these low-cost real estate financing mechanisms should help substantially reduce the cost of capital.
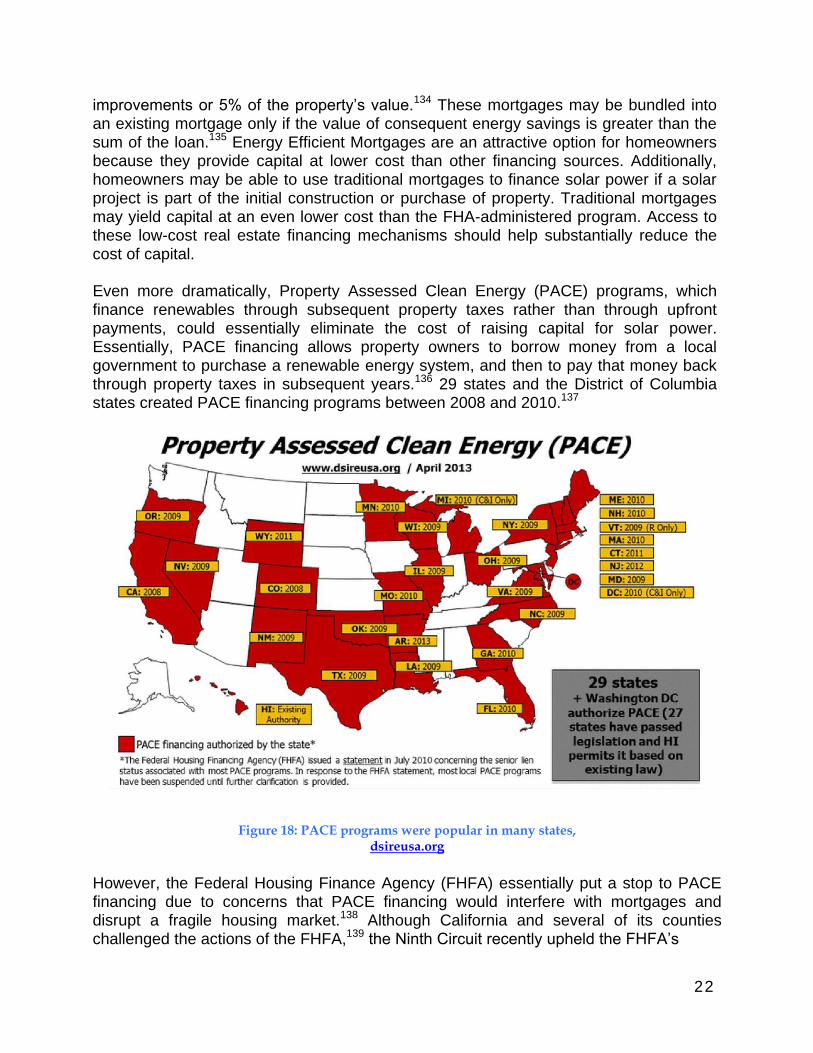
Even more dramatically, Property Assessed Clean Energy (PACE) programs, which finance renewables through subsequent property taxes rather than through upfront payments, could essentially eliminate the cost of raising capital for solar power. Essentially, PACE financing allows property owners to borrow money from a local government to purchase a renewable energy system, and then to pay that money back through property taxes in subsequent years.136 29 states and the District of Columbia states created PACE financing programs between 2008 and 2010.137
Figure 18: PACE programs were popular in many states, dsireusa.org
However, the Federal Housing Finance Agency (FHFA) essentially put a stop to PACE financing due to concerns that PACE financing would interfere with mortgages and disrupt a fragile housing market.138 Although California and several of its counties challenged the actions of the FHFA,139 the Ninth Circuit recently upheld the FHFA’s

23
The federal
government should
allow PACE financing.
decision.140 As a result, neither Fannie Mae nor Freddy Mac, which provide backing for a majority of mortgages,141 will back mortgages for properties featuring PACE financing, essentially ending the PACE program.
Because PACE financing offers property owners access to capital for solar power at a very low cost, this paper urges the FHFA to reconsider its position on PACE financing. As the housing market recovers,142 concerns about interfering with existing mortgages should diminish, and the FHFA should reevaluate its opposition to PACE financing. Alternatively, Congress should direct the FHFA to allow Fannie Mae and Freddy Mac to purchase mortgages that feature PACE financing. A less attractive alternative is for states to conform their PACE financing programs to reduce the FHFA’s concerns. The FHFA’s basic problem was that PACE financing creates a lien on the financed property that is senior to a mortgage.143 The prospect of senior liens could reduce the enthusiasm of mortgage lenders. States could address this concern by subordinating PACE financing to existing mortgages. Any of these alternatives would improve property owners’ access to capital for solar power, thus helping to substantially reduce solar soft costs.
B. Standardizing System Designs
Standardizing PV system designs could significantly reduce soft costs at all phases of a solar project. The basic goal is to develop “plug-and-play” solar PV systems that are modular, easy to produce, and easy to install. First, standardized hardware that includes integrated electronic components such as inverters could allow installers and consumers to take advantage of economies of scale. Second, by standardizing the design of solar PV systems, installers could reduce the amount of customization inherent in the current customer acquisition model. Third, standardized system designs should reduce permitting, inspection, and interconnection costs by reducing the uncertainty about each system’s safety risks or impacts on the utility grid. Fourth, standardized hardware and system design would reduce necessary installation labor by allowing laborers to become familiar with solar projects and by simplifying the task through integration of electronic components. All of these impacts together should help make the solar industry more profitable and predictable, which would in turn lower financing costs by attracting investors and lower customer acquisition costs by attracting more customers.
However, while standardization of solar PV systems will likely lower costs, it also has potential drawbacks. First, because most existing homes and communities are not standardized, retrofitting existing buildings to install solar panels requires a certain degree of customization.144 Too much standardization could prevent installers from adapting to existing conditions. And second, standardization of solar PV systems should be careful not to stifle innovation in this still rapidly changing technological field.
A menu of
standardized
PV system
designs can
reduce every
category of
soft costs.
24
In light of these two important cautionary notes, this paper recommends that solar installers offer a menu of standardized designs. For example, installers could offer a standardized system for the flat roofs typical of commercial buildings and other
standardized systems designed to fit the most common residential roof shapes. Additionally, installers could offer a set of standardized designs of different sizes to fit the needs of common sizes of homes and businesses. This menu-style approach to standardization could allow for the necessary flexibility in system design while still taking advantage of the cost-reduction opportunities.
One way that standardized PV hardware designs could reduce
costs is by allowing solar panel manufacturers and installers to
take advantage of economies of scale for affiliated
hardware. For example, rather than having installers purchase
inverters on an ad hoc basis for each project, solar PV
manufacturers could buy large batches of inverters and integrate them into the panels
before resale to an installer. Presumably, such a large purchase would allow for lower
prices. Similarly, installers could buy large batches of racking or tracking equipment,
taking advantage of similar price breaks.
Additionally, standardized system designs would reduce the labor necessary for
customer acquisition. As described above, customer acquisition typically entails
designing a system for a customer before that customer enters into any binding
contract. However, featuring a menu of standardized designs might reduce the amount
of customization required, especially if the menu featured an array of designs tailored to
fit the most common building shapes. By reducing the amount of customization
necessary, installers could reduce the labor required for customer acquisition and thus
reduce soft costs. This increased efficiency in customer acquisition should allow the
industry to successfully complete more projects, improving its reputation, which in turn
will allow it to attract capital and more customers more easily.
Standardized designs should also reduce permitting, inspection, and
interconnection costs. For one, a standard design is unlikely to pose any novel
safety risks or to feature any unusual building elements. As a result, it should be
possible to allow streamlined permitting of standardized PV systems without entailing
much cost to the reviewing jurisdiction. For the same reason, inspecting standardized
systems should be faster and less costly as well. Similarly, standardized PV systems
would have predictable impacts on the electricity grid, suggesting that interconnection
should require very little analysis from a utility. Accordingly, standardized system
designs should substantially reduce the permitting, inspection, and interconnection
costs for solar PV systems.
Standardized solar PV systems should also be easier and less costly to install. The cost of installation labor would be especially likely to decline if the solar PV system

25
came integrated with such affiliated hardware as inverters and a racking or tracking system. Labor by electricians installing affiliated electronics is especially costly;145
integrating electronic components with panels before installation could substantially reduce this cost. Similarly, prefabricating solar panels with racking or tracking systems could avoid the necessity of performing such installation later in more customized, more costly settings. One company, SolarPod, currently produces a line of plug-andplay solar PV systems that they claim take between 30% to 50% less time to install.
Figure 19: SolarPod’s PV systems are modular and easy to install, mysolarpod.com.
If standardized system designs can reduce the soft costs of solar power, they should contribute to reducing customer acquisition and financing costs also. By reducing soft costs, standardized designs could make PV affordable to more consumers. More successfully completed solar projects would build the industry’s reputation and attract more consumers in turn. Similarly, an enhanced industry reputation for viability and profitability would attract investors as well, thus helping reduce the cost of financing.
To achieve cost reductions, policy makers should encourage standardization of solar PV systems. State or federal policy makers could provide direct financial incentives such as grants for standardized solar PV systems. Similarly, policy makers could offer more generous tax breaks to solar PV projects that feature standardized designs, or could offer incrementally greater rebates for systems that feature integrated electronics or other standardized features. A more revenue-neutral alternative would be to offer streamlined permitting, or a general permit, for such standardized solar PV systems. Standardized solar systems would have predictable impacts, making the job of permitting and inspection much easier. Permitting reforms could incentivize standardization at no cost to government. These tools would encourage standardization, helping to reduce solar soft costs.
26
Streamlined
permitting could
save thousands of
dollars on each
solar installation.
C. Streamlining Permitting and Inspections
Reducing the soft costs of solar power through streamlined permitting and inspection processes is a topic that has received a great deal of attention. For example, Sunrun has recommended that the Department of Energy spearhead a “Residential Solar Permitting Initiative.”146
Sunrun has also recommended that California engage in comprehensive streamlining of local permitting practices.147 That study concluded that streamlining the permitting process would have dramatic economic benefits, reducing the cost of permitting from $2500 per installation to $600 per installation and growing the California economy by roughly $5 billion by 2020.148
Somewhat less dramatically, a study by LBNL concludes that “streamlining the permitting process could potentially reduce the price of a 4kW residential PV system by $1,000 or more, on average.”149
Researchers have reached considerable consensus on what steps are necessary in order to streamline permitting and achieve cost reductions. Common ways to streamline permitting include the following, as reported by LBNL:
1. Standard state or regional technical and procedural requirements; 2. Clear guidelines and checklists for permit applications; 3. Online completion and submission of permit applications; 4. Eliminating unnecessary or redundant reviews and inspections; 5. Reducing wait times; and 6. Reducing permit fees.150
NREL’s soft costs roadmap makes similar recommendations, suggesting standardization of requirements, increased transparency, online permit applications, and reduced permit fees.151 Similarly, a study by the Interstate Renewable Energy Council (IREC) has identified common elements of efficient permitting processes, including regionally consistent requirements, simplified standards and processed, and permit fees limited to cost-recovery.152
IREC’s study also comprehensively reviews existing permitting reforms at the state, regional, and local levels.153 For example, “Colorado and Arizona have implemented statutes requiring local jurisdictions to set fees for solar permits at certain levels.”154
Oregon has implemented a Solar Installation Specialty Code that governs technical requirements and permit processing, featuring expedited permitting for conventional rooftop installations and limited permit fees.155
Some jurisdictions allow expedited permitting for installers that have a good track
record of submitting complete applications and installing solar projects successfully;

Installers with good
records for completing
projects should be eligible
for expedited permitting.
27
these jurisdictions include Portland, OR and various counties in New Jersey implementing the Long Island Unified Solar Permitting Initiative.156 IREC recommends that qualifications for expediting permitting be based either on certification from an independent agency or on a track record of successful installations within a jurisdiction.157 “For example, a jurisdiction could pre-qualify installers that have successfully installed five systems that
passed the plan review and inspection without necessitating any major modification.”158
Perhaps reflecting greater enthusiasm for reform, Vermont has overhauled its solar permitting system by exercising strong state control. Under Vermont law, net-metered systems less than 150kW need only “self certify that they comply with interconnection and certain siting requirements.”159 Although utilities, municipalities, and neighbors can object to this self-certification, if none do object, the permit is granted with no further review.160 Similar streamlining has happened in Germany as well.161
Indeed, in Vermont and Germany, few or no inspections are necessary for a solar PV system.162 This radical approach to reducing inspections would, of course, dramatically reduce inspection-related costs. However, completely eliminating or even substantially reducing the number of safety-related inspections is not completely necessary to substantially reduce costs. One of the most common complaints regarding inspections is simply that the appointment window for each inspection is too long, causing needless delays.163 Accordingly, to substantially reduce soft costs related to inspections, policy makers could insist that inspectors adhere to more narrow appointment windows. Policy makers could design penalties for inspectors who miss appointment windows. For each missed appointment, an inspector could earn a demerit. An inspector who earns too many demerits could face pay deductions, demotion, or even termination. This system would reduce the soft costs of solar by reducing delays associated with long appointment windows.
However, eliminating safety-related inspections altogether is likely not a good idea. In fact, LBNL cautions that streamlined permit processes should avoid “eviscerating the benefits of permitting for protecting consumers, promoting public safety, and rewarding the most diligent installers.”164 Not only could such inspections guard the public against preventable risks, but they could also guard the solar industry’s reputation for safety and reliability. As a result, this paper advocates for reducing appointment windows and eliminating redundant inspections, but not for eliminating safety-related inspections altogether.
Similarly, state policy makers should be careful about how they promote permitting and inspection reforms at local levels. Too aggressive an approach may have counterproductive results. For example, imposing a cap on permit fees for solar

28
States should develop short,
clear permit applications, put
them online, and require their
use by local governments.
projects, instead of simply requiring that fees cover only costs of permit processing, may “cause jurisdictions to simply set the fee at that cap.”165 Similarly, LBNL notes that “[s]treamlined procedures must take care to adequately fund local governments for their time.”166 In the same vein, IREC’s study of permitting reform suggests that “responsibility for change should be shared” between municipalities and the solar industry.167 Noting that many delays associated with permitting are due to incomplete applications and failure to comply with codes, that study argues that meaningful reform will require participation from government and industry alike, and “should offer benefits to municipal governments as well as solar installers and their customers.”168
This paper argues that state
governments should take the lead in
streamlining permitting and
inspections, but should attempt to
work with local governments, rather
than against them. Particularly, state
reforms should make sure to allow local
governments to recover costs
associated with issuing permits and performing inspections. This cooperative
approach should reduce the costs of solar power without making the solar industry
into a net cost to local governments. One clear way to achieve this goal is for states
to develop short, clear permit application forms, make them available online, and
require local governments to use them. This would allow all parties to clearly
understand the requirements for solar PV permits and would reduce variability among
jurisdictions that raises costs. The result would be to reduce the soft costs of solar
power without making the solar industry a burden on local governments.
D. Utility Regulation to Promote Swift Interconnection
As described above, delays and studies associated with interconnecting a solar PV project to the electrical grid can substantially increase soft costs of solar power.169 To ameliorate this problem, the Federal Energy Regulatory Commission (FERC) recently promulgated a final rule, Order 792, revising the pro forma agreement under which small electricity generators may interconnect to existing transmission grids.170
FERC’s amended rule responds to growth of the solar power market that had made the prior rule’s technical screening for speedy interconnection seem less than “just and reasonable.”171 Particularly, the old rule had limited interconnection under a “15 Percent Screen” in proportion to the annual peak load of a distribution circuit: this screen allowed generators to interconnect to the distribution circuit under a streamlined process only if local small generation contributed less than 15% of the circuit’s annual peak load.172 The effect was to prohibit swift interconnection once utilities reached this 15 percent cutoff. Indeed, substantial growth in the solar market had led some new PV projects to fail this 15 Percent Screen, resulting in lengthy, expensive interconnection studies173 FERC reasoned that the interconnection process

Dramatic growth of the solar market made
new interconnection rules necessary.
29
should adapt to allow new projects to
“ c o n t i n u e t o
participate in the less
costly and time-
consuming Fast Track Process while maintaining the safety and reliability of the
Transmission Provider’s system.”174 Particularly, FERC concluded that the old rules
“inhibit[ed] the continued growth in Small Generating Facilities and cause[d]
unnecessary costs to be passed on to consumers.”175
FERC amended the old rule in order to avoid “inefficient interconnection queue backlogs” and to prevent small solar generators from suffering a costly and time-consuming interconnection process “when they could be interconnected under the Fast Track Process safely and reliably.”176 Order 792 aims to prevent “[c]osts resulting from ... inefficiencies in the interconnection process” from falling on consumers.177
FERC’s amended rule “does not modify the 15 Percent Screen” or any other technical
screen, but rather modifies the supplemental review process that occurs if a solar PV project fails a technical screen.178 “[T]he revised supplemental review will offer an opportunity to continue to be evaluated under the Fast Track Process.”179 The goal for
the revised supplemental review process is to “enhance transparency and consistency É and ensure that interconnection remains just and reasonable and not unduly discriminatory.”180
Particularly, the new FERC rule allows supplemental interconnection studies to include
three technical screens: a minimum load screen,181 a voltage and power quality screen,182 and a safety and reliability screen.183 A generation project passes the minimum load screen if the aggregate generating capacity on the relevant line section is
less than 100% of that line’s minimum load.184 A generation project passes the voltage and power quality screen if the transmission provider can maintain voltage in compliance with all relevant technical standards despite the introduction of the generation project.185 A generation project passes the safety and reliability screen if its
impacts on safety and reliability do not require a more complete study.186 If a generation project that fails the initial 15 Percent Screen successfully passes each supplemental technical screen, it may still participate in the Fast Track interconnection process.187
“[T]he three screens in the supplemental review are designed to balance between handling the increased volume of interconnection requests and penetrations of small generators and maintaining the safety and reliability of the electric systems.”188 The
transmission provider may choose the order in which it conducts the supplemental technical screens. 189 However, to prevent excessive costs, if a generation project fails one screen, the transmission provider must obtain the generator’s permission to continue supplemental screening.190 Similarly, FERC aimed to restrict unnecessary costs by “adopt[ing] a supplemental review fee based on actual costs.”191
30
FERC’s Order 792
should promote swift
interconnection for
small solar projects.
FERC’s new final rule will allow an interconnection customer access to a pre-application report that contains information about system conditions at an interconnection point in order to help customers consider where to site projects.192
That pre-application report must be made available for a fixed fee, with $300 as the default, that “should include only the cost of providing the incremental information” that the pre-application report contains.193
The new rule also raised the size limits for eligibility for Fast Track review.194 This amendment will allow some larger projects to qualify for Fast Track review. However, this aspect of FERC’s new rule will not be relevant to the smaller (<10kW) solar PV projects that are the subject of this paper, because the lowest limit is 500kW.195
Nonetheless, this aspect of FERC’s new rule could substantially reduce soft costs of interconnection for utility-scale projects.
FERC’s new final rule on interconnection is an
important step toward swift, transparent
interconnection processes that will reduce soft
costs associated with interconnection. One
especially important aspect of the new rule that it
limits fees for interconnection studies to cover only
the costs of the studies. This limitation has the
potential to reduce soft costs of interconnection.
Additionally, the limitation should prevent the
problem (or perceived problem) of utilities imposing prohibitive fees to stifle a
burgeoning industry. More fundamentally, the new rule should help streamline
interconnection in jurisdictions where there are already numerous small generators by
allowing fast-track interconnection even where new solar projects fail the 15 Percent
Screen. These new aspects of the pro forma interconnection agreement should help
reduce soft costs by allowing for swifter, more hassle-free interconnection.
However, FERC’s new rule has two important limitations. First, the supplemental safety and reliability screen gives utilities (or grid managers) some discretion to decide whether a proposed small generator, such as a solar power project, poses a risk to safety or reliability. Although the rule does require consideration of some technical factors, it allows the utility to consider other factors as well.196 In fact, the safety and reliability screen is “intended to provide Transmission Providers with the flexibility to identify some of the specific issues that may arise due to a Small Generating Facility’s unique variations.”197 While it may be proper to allow transmission providers some discretion or flexibility to consider unspecified technical factors, the rule seemingly would not prevent a recalcitrant utility from using the safety and reliability screen to thwart the rule’s purpose of promoting swift interconnection. In other words, a utility hostile to distributed solar could simply assert that a project fails the supplemental safety and reliability screen, requiring further costly study. Seemingly, the solar project would not have any recourse to challenge this decision. Although there is as yet no evidence of utilities misbehaving in this manner, unbridled utility discretion is an apparent limitation of FERC’s new rule.

31
States should follow FERC’s lead and
adopt similar policies to promote swift
interconnection for solar projects.
Additionally, the sway of FERC’s policy is limited by FERC’s jurisdictional limits.198
FERC’s order states that it “is not encroaching on the States’ jurisdiction and is not asserting jurisdiction over ‘local distribution facilities.’”199 Presumably, FERC thus aims to preserve the distinction between its jurisdiction over transmission and wholesale sale of electricity and state jurisdiction over distribution and retail sale of electricity.200
However, FERC has blurred this jurisdictional line in the past in two ways. First, it has successfully exercised jurisdiction over unbundled transmission of electricity, and has suggested that it may have power to regulate bundled transmission of electricity as well.201 Second, and less successfully, FERC has attempted to regulate net metering by insisting that the netting period for retail sales of energy be the same as the netting period for federal regulation of transmission.202 These prior attempts by FERC to push its jurisdictional limits suggest that it is possible that FERC may in the future be willing to construe its jurisdiction broadly as it issues further interconnection regulations. However, Order 792 instead hews closely to the traditional distinction between federal and state jurisdiction over energy sales. As far as Order 792 is concerned, FERC’s “hope is that states may find this rule helpful in formulating or updating their own interconnection rules,” even though the states “are under no obligation to adopt [FERC’s] provisions.”203
This paper recommends that states take inspiration from FERC’s action in Order 792 and streamline the interconnection process to avoid unnecessary costs. To this end,
the Interstate Renewable Energy Council (IREC) has issued interconnection best practices that should provide helpful guidance.204 These best practices strongly resemble FERC’s rule for the interconnection process, including the 15 Percent Screen.205 This paper recommends that states implement interconnection review processes that resemble FERC’s and IREC’s by providing transparency and balancing the grid’s safety and reliability with the promotion of swift, low-cost interconnection.
E. Mandating Solar Buildings
State and local governments should also consider solar mandates as a method of reducing the soft costs of solar PV power. At heart, solar mandates simply require that new buildings or major renovations feature solar power. Such a requirement should reduce the soft costs of solar power by guaranteeing a customer base, allowing developers to achieve economies of scale and scope, and by facilitating standardized design. This section reviews existing solar mandates, describes their likely benefits, and explores some practical and legal issues regarding their implementation.206

Figure 20: Rex Parris, Mayor of Lancaster, CA (R), City of Lancaster.
32
In the United States, two cities in California are leading the way in implementing solar mandates. As of January, 2014, Lancaster, CA requires new residential buildings to
feature solar generation assets with a power rating of 1kW.207 To comply with the mandate, developers of larger, multi-unit projects may elect to install a form of community solar, building larger, centralized facilities that feature at least 1kW of generating capacity per home.208 Sebastopol, California enacted an even more ambitious mandate on July 21, 2013, requiring a PV system for any new commercial or residential building.209 In Sebastopol, large renovations also trigger the requirement to install a solar PV system, including: any addition to a
commercial building of more than 1800 square feet; any addition to a residential building of more than 75% of the existing square footage; and any renovation of more than 50% of a commercial building or more than 75% of a residential building.210 Sebastopol’s mandate requires that the building either feature two Watts of power per square foot (2W/ft2) of building size or be sufficient to meet 75% of the building’s total annual energy demand.211 The borough of Merton, in London, England, also pioneered a similar, but less rigorous, renewable energy requirement in 2003, requiring new buildings to feature sufficient renewable energy sources to meet 10% of their power requirements.212
Because the solar energy mandates in the United States are quite new, their benefits are still not yet well-documented. In fact, Lancaster’s solar mandate only took effect in January of 2014.213 Similarly, while Sebastopol has kept admirable records of the number of kilowatts of solar power installed in the city,214 it has not tracked the costs of these projects.215 Consequently, neither Lancaster nor Sebastopol have strong, empirical data to confirm whether solar mandates actually achieve the benefits that it seems that they should. The borough of Merton’s experience suggests that renewable energy mandates are most efficient when coupled with energy efficiency mandates,216
as discussed in greater detail below. However, analysis of Merton’s policies has not focused on how it may have reduced renewable energy costs. Nevertheless, it stands to reason that solar mandates should reduce the soft costs of solar power, especially in comparison to installing solar panels on existing buildings.
33
Solar mandates should
reduce costs of financing,
customer acquisition,
hardware, and installation.
Perhaps the clearest cost reduction should come in the area of customer acquisition. Whereas for a retrofit installers must woo customers, under a solar mandate installers would face a guaranteed customer in each new building. Similarly, a solar mandate would help reduce the costs of custom system designs associated with customer acquisition.217 Whereas installers must often refurbish existing roofs to ensure that they can bear the weight of solar panels, as well as to install electrical components to receive solar energy, buildings constructed under a solar mandate would already have such features. Accordingly, solar mandates should facilitate standardization of systems, allowing increased efficiency in customer acquisition.
Solar mandates should also help reduce soft costs associated with affiliated hardware and installation labor by allowing installers to achieve economies of scale and scope. For example, installers of solar PV systems on new buildings should be able to achieve economies of scope “where certain labor or material costs can be shared between the PV installation and other elements of home construction.11218 Similarly, in larger housing developments, installers should be able to achieve economies of scale by purchasing larger batches of hardware and through larger labor contracts.219 This effect should be true as well for any community with a solar mandate, regardless of whether construction proceeds in large batches or small; either way, installers should know that
a mandate guarantees a large group of guaranteed customers, meaning that they can safely invest in purchasing large batches of hardware or in long-term, lower-cost labor contracts. The cost reduction for labor contracts would come from savings on acquiring customers, rather than from reduced wages. In fact, such lower-cost labor contracts resulting from solar
mandates should be a boon to workers, because they will guarantee that the solar industry not only creates jobs, but also promotes job stability.
Solar mandates should also help reduce the costs of financing solar power projects by allowing those costs to be incorporated into traditional, low-cost real estate financing mechanisms such as mortgages. As explained above, mortgages tend to have much lower interest rates, and thus much lower overall costs of capital, than either loans for energy retrofits or the forms of capital available to third-party solar developers. Accordingly, mandating the inclusion of solar power in new development should reduce the cost of financing. Moreover, by including solar projects in the overall cost of a new building, solar mandates could help to avoid the FHFA’s concerns about PACE financing. The solar project’s costs would be built into the home’s costs, so there would be no need for a separate financing mechanism that could subordinate existing mortgages. Accordingly, solar mandates may provide low-cost, low-hassle financing.
Solar mandates also offer several advantages to governments. First, they operate at a low cost to government, because “most of the costs of the new solar energy installations generated by such policies are borne by developers and by buyers.11220

34
Solar mandates should
reduce costs by promoting
standardized system designs.
Similarly, solar mandates require little support, either regulatory or financial, from state governments or utilities.221 For example, solar mandates make it likely that solar development will proceed in large, standardized batches, allowing standardized and streamlined inspections. Additionally, mandates “tend to generate new solar energy installations from a much broader subset of citizens” than financial incentives,222
suggesting that they may be more likely to succeed. Solar mandates may also help stimulate local economies by raising property values.223 Thus, from a government’s perspective, solar mandates provide many potential benefits and few risks.
Finally, solar mandates could help reduce the soft costs of solar power by facilitating standardization of solar PV systems. Especially in larger developments where many buildings are built at once, the entire community could be designed with solar power in mind. In such communities, only a few solar panel configurations would be necessary. Even in other communities where development proceeds in smaller batches, solar mandates could similarly reduce costs. For example, a solar mandate could be integrated into a building code that required certain structural elements, such as a roof angle and orientation that are optimal for solar power. Featuring such common elements in a building code would enable standardization of solar PV systems.
The standardization of larger housing developments should also help reduce one of the issues that is most problematic for solar power: guaranteed continual access to sunlight. “A solar collector is rendered useless if there is no continuing access to sunlight.”224 Unless local laws protect a solar project’s access to sunlight, development on neighboring lots or the growth of trees can shade the solar panels, reducing efficiency and potentially economic viability. Although some jurisdictions have included solar access guarantees in zoning laws or have passed legislation recognizing solar easements,225 solar mandates offer an excellent opportunity for more governments to promote both the installation and the economic longevity of solar power. Solar mandates should feature not only requirements that new development include solar power, but also zoning provisions that guarantee ongoing access to sunlight.
Solar mandates for retrofitting existing buildings, such as Sebastopol’s, should receive more cautious consideration, because retrofit mandates run the risk of inadvertently deterring retrofits by adding cost to projects. The most prominent example of this unintended negative consequence is the Clean Air Act’s major modification rule. That rule provided that “major modifications” of existing power plants triggered the need to install costly emissions reduction technology.226 In order to avoid those costs, many organizations simply declined to update their coal-fired power plants.227 The net result was that—contrary to the goals of the Clean Air Act—many older power plants continued to operate in a very dirty fashion even after they were originally scheduled to be upgraded or retired.228 A similar dynamic has taken place under seismic codes in some cities.229 Thus, governments must craft their retrofit rules carefully.

35
Solar mandates make the
most economic sense when
paired with mandates for
energy efficiency.
Sebastopol, California, which is the only jurisdiction that has adopted a solar mandate for retrofits, designed its retrofit mandate in a thoughtful manner that other jurisdictions should consider emulating. Sebastopol’s mandate applies only to very large retrofits: residential retrofits that affect more than 75% of an existing building or commercial retrofits that affect more than 50% of an existing building.230 Such large retrofits may be costly enough anyway that the incremental cost of adding solar power may not daunt property owners. This type of limit is a good idea, and other jurisdictions should consider such limits for solar mandates for retrofits. Alternatively, governments can promote compliance with retrofit mandates by providing subsidies with the mandates. For example, a retrofit large enough to trigger a solar mandate could also trigger a property tax reduction, either for the increased value of solar power or, more generously, for the entire retrofit’s value. Such an incentive would help prevent increased costs of solar power from deterring retrofits s. In turn, the incentive and mandate would work together to bring more solar power online at lower costs.
The longer experience of the borough of Merton suggests that solar mandates would be more economically attractive when paired with energy efficiency mandates. Merton developed a renewable energy mandate in 2003 (“the Merton Rule”) that became the model for a similar mandate throughout London. A study of the Merton Rule concluded that a renewable energy mandate reduced CO2 emissions further than an energy
efficiency mandate alone, but noted that the renewable energy mandate cost 4.2 times as much per ton of CO2 saved for only a 1.1% improvement.231 In other words, a renewable energy mandate alone was somewhat more effective than an energy efficiency mandate, but much more costly. However, when the two mandates were paired, buildings
achieved twice as significant a reduction in energy use for roughly 60% of the cost (per ton of avoided CO2 emissions) of a renewable energy mandate alone.232 This study suggests that a solar mandate would be much more effective if coupled with an energy efficiency mandate. Additionally, an energy efficiency mandate could help reduce the costs of solar power by reducing the necessary size of a solar installation; a home that requires less energy should be able to fulfill its energy requirements with a smaller solar array. A solar mandate coupled with an energy efficiency mandate could thus help reduce the overall cost of solar projects.
This paper advocates for solar mandates because they are a simple,
straightforward way both to stimulate the growth of the solar market and to bring
down the soft costs of solar power simultaneously. Solar mandates should enable
economies of scale that will make solar installations cheaper, should promote
standardization of solar systems, and should allow for solar projects to remain
economically viable over the long term.

36
V. Conclusion
Although soft costs are currently the largest share of the price of solar power, both soft costs and hardware costs are falling. These price reductions are a consequence of a robust global market for solar panels, ongoing technological innovation, and substantial government support. The fact that government policies have helped reduce the overall installed price of solar power in the past is a good reason to believe that policy makers can continue to help reduce the soft costs of solar power. This paper has described factors that have kept soft costs expensive and has explored five policy strategies that governments may use to reduce them in the future: encouraging new forms of business for solar installers; promoting standardized solar PV systems, streamlining permitting and inspection; promoting swift, low-cost interconnection to the utility grid; and mandating solar buildings. This suite of policies should help bring down the soft costs of solar power substantially, helping solar power to become cost-competitive with other forms of electricity generation as soon as possible.
37
References 1 U.S. Solar Industry Records Second-Largest Quarter Ever, SOLAR ENERGY INDUSTRIES ASSOCIATION (SEIA) (Dec. 9, 2013), http://www.seia.org/news/us-solar-industry-records-second-largest-quarter-ever (“Without a doubt, 2013 will go down as a record-shattering year for the U.S. solar industry”); U.S. Solar
Market Grows 76% in 2012, GREENTECHSOLAR (Mar. 14, 2013), http://www.greentechmedia.com/articles/ read/u.s.-solar-market-grows-76-in-2012 (noting record installations of solar power in 2012); Yani Smith, Record 109% Growth in US Solar Panel Installations, DIGITAL JOURNAL (Apr. 26, 2012) (“2011 was a record smashing year for the US solar industry, with 109% growth in the number of photovoltaic solar installations.”); Wendy Koch, U.S. solar industry reports record 2010 growth, USA TODAY (Mar. 10, 2011), http://content.usatoday.com/communities/greenhouse/post/2011/03/us-solar-industry-2010-record-growth/1#.U01lN-YbDAA.
2 Zachary Shahan, Solar power was 2nd-largest source of new power in US in 2013, TREEHUGGER
(Jan. 28, 2014),http://www.treehugger.com/renewable-energy/solar-power-was-2nd-largest-source-newpower-us-2013.html.
3 GALEN BARBOSE, NAIM DARGHOUTH, SAMANTHA WEAVER, AND RYAN WISER, LAWRENCE BERKELEY NATIONAL
LABORATORY, TRACKING THE SUN VI: AN HISTORICAL SUMMARY OF THE INSTALLED PRICE OF PHOTOVOLTAICS IN
THE UNITED STATES FROM 1998 TO 2012 1 (LBNL 2013), available at http://emp.lbl.gov/publications/ tracking-sun-vi-historical-summary-installed-price-photovoltaics-united-states-1998-201.
4 Id.
5 See Claudia Assis, Chinese Solar-Panel Prices Rising 20% in the U.S., MARKETWATCH (Apr. 10, 2014), http://www.marketwatch.com/story/chinese-solar-panel-prices-rising-20-in-the-us-2014-04-10? link=MW latest news (noting that “[t]he ongoing U.S.-China trade case is the ‘primary driver’ behind behind the price increase”).
6 See e.g. U.S. DEPARTMENT OF ENERGY, About the SunShot Initiative, http://www1.eere.energy.gov/solar/ sunshot/about.html (last visited Jan. 7, 2014) (noting that the purpose of the SunShot Initiative is to reduce the price of solar energy “to make solar energy cost competitive with other forms of electricity by the end of the decade”).
7 See Morgan Bazilian et al., Re-considering the Economics of Photovoltaic Power, 53 Renewable Energy 329, 332 (2013), available at www.bnef.com/WhitePapers/download/82 (noting that “[d]espite the substantial drop in PV costs, many commentators continue to note that PV-generated power is prohibitively expensive unless supported by subsidies or enhanced prices”).
8 BARBOSE ET AL., supra note 3, at 9 (noting a total of 208,529 residential or commercial solar projects between 1998 and 2012, but only 190 utility-scale projects during the same period); see also Julie Cart, After a Building Boom, Solar Energy’s Prospects Now Aren’t As Sunny, LA TIMES (Jan 11, 2014), available at http://www.latimes.com/local/la-me-adv-solarslowdown-2-20140112,0,3755073.story#axzz2qJRCmolc (“In contrast to large-scale projects, mid-sized and rooftop solar power is burgeoning”).
9 DAVID FELDMAN ET AL., NATIONAL RENEWABLE ENERGY LABORATORY, PHOTOVOLTAIC SYSTEM PRICING
TRENDS: HISTORICAL, RECENT, AND NEAR-TERM PROJECTIONS 2013 EDITION, PowerPoint Presentation July 16, 2013 slide 18, http://emp.lbl.gov/publications/photovoltaic-system-pricing-trends-historical-recent-and-nearterm-projections-2013-edi (depicting the large share of soft costs for larger solar projects).
10 U.S. DEPARTMENT OF ENERGY, SunShot Initiative, http://www1.eere.energy.gov/solar/sunshot/index.html (last visited Jan. 7, 2014).
11 U.S. DEPARTMENT OF ENERGY, About the SunShot Initiative, http://www1.eere.energy.gov/solar/sunshot/ about.html (last visited Jan. 7, 2014).
12 Id.
13 U.S. DEPARTMENT OF ENERGY, Reducing Non-Hardware Costs, http://www1.eere.energy.gov/solar/ sunshot/nonhardware_costs.html (last visited Jan. 7, 2014).

38
14 KRISTEN ARDANI ET AL., NATIONAL RENEWABLE ENERGY LABORATORY, NON-HARDWARE (“SOFT”) COST-REDUCTION ROADMAP FOR RESIDENTIAL AND SMALL COMMERCIAL SOLAR PHOTOVOLTAICS, 2013–2020 4 (National Renewable Energy Laboratory 2013), available at http://www.nrel.gov/docs/fy13osti/59155.pdf. [hereinafter NREL Soft Costs Roadmap].
15 Id. at 2.
16 Id. at vii.
17 Id. at 7 (noting that “the roadmap incorporates future deployments of innovations with greater cost-reduction potential, referred to as ‘undefined’ solution sets and [cost-reduction opportunities]”).
18 BARBOSE ET AL., supra note 3 at 14.
19 Id. at 1 (noting that falling module prices . . . represent[] roughly 80% of the drop in total PV system prices for ≤10 kW systems”); see also Bazilian et al., supra note 2, at 331, 334 (noting that the global price of silicon, while generally declining, has experienced spikes that have added volatility to the generally declining price of solar panels).
20 BARBOSE ET AL., supra note 3, at 2.
21 KRISTEN ARDANI, NATIONAL RENEWABLE ENERGY LABORATORY, BENCHMARKING SOFT COSTS FOR PV SYSTEMS IN THE UNITED STATES, Powerpoint Presentation May 17, 2012 slide 7, available at http://www.nrel.gov/ docs/fy12osti/54689.pdf.
22 E.g. FELDMAN ET AL., supra note 9, at slide 5 (depicting a continuing decline in hardware prices from 2011 to 2012); see also BARRY FRIEDMAN, KRISTEN ARDANI, DAVID FELDMAN, RYAN CITRON, & ROBERT
MARGOLIS, NATIONAL RENEWABLE ENERGY LABORATORY, BENCHMARKING NON-HARDWARE BALANCE-OF-SYSTEM
(SOFT COSTS) FOR U.S. PHOTOVOLTAIC SYSTEMS, USING A BOTTOM-UP APPROACH AND INSTALLER SURVEY SECOND EDITION iv (NREL 2013), available at http://www.nrel.gov/docs/fy14osti/60412.pdf (last accessed Jan. 21, 2014) (noting that soft costs contribute 64% of the price of a residential solar system).
23 See BARBOSE ET AL., supra note 3, at 2 (“The distribution of installed prices across projects is quite wide.”).
24 Id. at 23 fig. 18 (depicting the costs of solar projects in 1kW increments).
25 Id. at 25 fig. 19.
26 RYAN WISER & CHANGGUI DONG, EAST ORLANDO LAWRENCE BERKELEY NATIONAL LABORATORY, THE
IMPACT OF CITY-LEVEL PERMITTING PROCESSES ON RESIDENTIAL PHOTOVOLTAIC INSTALLATION PRICES AND
DEVELOPMENT TIMES: AN EMPIRICAL ANALYSIS OF SOLAR SYSTEMS IN CALIFORNIA CITIES 16 (LBNL 2013), available at http:// emp.lbl.gov/reports.
27 BARBOSE ET AL., supra note 3, at 33. This seemingly perverse trend is likely due to a number of factors, such as a preference among government employers for using costlier union labor and domestically manufactured hardware. Id.
28 WISER & DONG, supra note 26, at 16 (noting that “[t]he reasons for this relationship are not well-known but may reflect better price negotiation and more price comparison on the part of more-educated customers”).
29 BARBOSE ET AL., supra note 3, at 2 (“Over the longer-term, installed system prices have fallen É as a result of reductions in non-module costs.”).
30 Id. at 16.
31 Id. at 2.
32 JOACHIM SEEL, GALEN BARBOSE, & RYAN WISER, LAWRENCE BERKELEY NATIONAL LABORATORY, WHY ARE
RESIDENTIAL PV PRICES IN GERMANY SO MUCH LOWER THAN IN THE UNITED STATES: A SCOPING ANALYSIS, PowerPoint Presentation September 2012 slide 24, http://emp.lbl.gov/sites/all/files/german-us-pv-priceppt.pdf.
33 BARBOSE ET AL., supra note 3, at 2; FELDMAN ET AL., supra note 4, at slide 25 (“Installed prices in the United States are high compared to most other international PV markets, due largely to differences in soft costs.”).

39
34 BARBOSE ET AL., supra note 3, at 5 (“The market for PV in the United States is, to a significant extent, driven by national, state, and local governmental incentives, including up-front cash rebates, production-based incentives, renewable portfolio standards, and federal and state tax benefits.”).
35 Id. at 17 (noting that “regular and scheduled incentive reductions can provide a long-term signal to the industry to reduce costs”).
36 Id.
37 The merits of this strategy of withdrawing incentives for solar power are not altogether clear. Although the cost of solar panels has declined over the period during which governments have withdrawn incentives, solar panels are a global commodity with a price driven by global trends. For a more thorough discussion of the factors contributing to solar panel price declines, see Bazilian et al., supra note 2.
38 SEEL, BARBOSE, & WISER, supra note 32, at 43.
39 Id. at 11 fig. 2.
40 See Billy Roberts, NATIONAL RENEWABLE ENERGY LABORATORY, Photovoltaic Solar Resource of the United States, http://www.nrel.gov/gis/images/map_pv_national_lo-res.jpg (October 20, 2008) (last accessed Jan. 13, 2014).
41 Id.
42 See U.S. Dept. of Energy, Reducing Non-Hardware Costs, ENERGY.GOV, http://energy.gov/eere/ sunshot/reducing-non-hardware-costs.
43 Id. at 15 fig. 9.
44 E.g. ARDANI, supra note 21, at slides 6–7; NREL Soft Costs Roadmap, supra note 9, at 4.
45 KRISTEN ARDANI ET AL., BENCHMARKING NON-HARDWARE BALANCE OF SYSTEM (SOFT) COSTS FOR U.S. PHOTOVOLTAIC SYSTEMS USING A DATA-DRIVEN ANALYSIS FROM PV INSTALLER SURVEY RESULTS iv (National Renewable Energy Laboratory 2012), available at http://www.nrel.gov/docs/fy13osti/56806.pdf. Another reason that this study may produce a much lower figure for overall soft costs is that it featured a small sample size of “75 installers, representing approximately 13% of all residential PV installations and 4% of all commercial installations added in 2010.” Id. Importantly, even this study concludes that the limited soft costs it analyzed constitute as much as 23% of the total installed price, and that the soft costs “present significant opportunities for further cost reductions.” Id.
46 Friedman et al., supra note 22, at 3
47 Id.
48 BARBOSE ET AL., supra note 3, at 16.
49 E.g. id. at 2; Bazilian et al., supra note 2, at 331, 5; FELDMAN ET AL., supra note 4, at slide 18; SEEL
ET AL. supra note 51, at slide 24.
50 BARBOSE ET AL., supra note 3, at 15 fig. 9 (reproduced here as figure 3, depicting the increasing importance of soft costs); Bazilian et al., supra note 2, at 331; NREL Soft Costs Roadmap, supra note 9, at 4; SEEL ET AL., supra note 51, at slide 24.
51 NREL Soft Costs Roadmap, supra note 14, at 8–9.
52 Id.
53 Id.
54 ARDANI ET AL., supra note 21, at 5–6.
55 Id.
56 Id.; NREL Soft Costs Roadmap, supra note 14, at 9.
4 0
57 See NREL Soft Costs Roadmap, supra note 14, at 16 (calculating an average permitting cost of $0.20); SUNRUN, THE IMPACT OF LOCAL PERMITTING ON THE COST OF SOLAR POWER: HOW A FEDERAL
EFFORT TO SIMPLIFY PROCESSES CAN MAKE SOLAR AFFORDABLE FOR 50% OF AMERICAN HOMES ES 1 (Sunrun 2011), available at http://www.sunrun.com/solar-lease/cost-of-solar/local-permitting/ (last accessed Jan. 7, 2014) (“Local permitting and inspection add $0.50 per watt, or $2,516 per residential install.”); WISER & DONG, supra note 26, at iv (calculating costs between $0.27/W and $0.77/W).
58 See NREL Soft Costs Roadmap, supra note 14, at 16; WISER & DONG, supra note 21, at 28 (noting that “national or regional average impacts can mask the more substantial impacts that occur at a local level across individual cities”).
59 See SUNRUN, supra note 57, at 18 (noting an average interconnection delay of three weeks across the country, with certain utilities taking as long as ten weeks”); JAMES TONG, CLEAN POWER FINANCE, NATIONWIDE ANALYSIS OF SOLAR PERMITTING AND THE IMPLICATIONS FOR SOFT COSTS 14 (Clean Power Finance 2012), available at http://solarpermit.org/media/upfiles/CPF-DOE_Permitting_Study_Dec2012_Final.pdf (noting that more than 80% of solar PV installations require “[a]t least one site inspection” by an electric utility and “[a]t least one site inspection” by a city department).
60 See Sunshot Initiative: Permitting, Inspection, and Interconnection, U.S. DEPARTMENT OF ENERGY, http:// www1.eere.energy.gov/solar/sunshot/permitting_interconnection_inspection_costs.html (Feb. 1, 2013) (last accessed Jan. 7, 2014).
61 E.g. NREL Soft Costs Roadmap, supra note 14, at 16–20 (discussing PII costs together).
62 SKY STANFIELD, ERICA SCHROEDER, & THAD CULLEY, INTERSTATE RENEWABLE ENERGY COUNCIL, SHARING SUCCESS: EMERGING APPROACHES TO EFFICIENT ROOFTOP SOLAR PERMITTING 7 (IREC 2012), available at http://www.irecusa.org/wp-content/uploads/Sharing-Success-final-version.pdf (last accessed Jan. 7, 2014).
63 See id. at 15–16 (describing one municipal utility’s unique program of promoting solar PV installations); SUNRUN, supra note 57, at 18 (noting lengthy interconnection delays); TONG, supra note 105, at 14 (noting that PV installations may require review by city and county planning and fire departments).
64 STANFIELD, SCHROEDER, & CULLEY, supra note 62, at 15–16, 41–43 (noting that “[o]ften utilities will not begin their interconnection review” until installers have received final permits, which likely increases delays unnecessarily, but also describing efforts by municipal utilities in Long Island, New York and San Diego, California to facilitate speedy interconnections).
65 See SUNRUN, supra note 57, at 3 (noting that “local variation forces installers to spend time and money customizing plans for each jurisdiction”).
66 See e.g. TONG, supra note 59, at 17 (describing the time spent on average by different installer staff members on permitting).
67 WISER & DONG, supra note 26, at 2; TONG, supra note 59, at 19.
68 SUNRUN, supra note 57, at 18.
69 TONG, supra note 59, at 19.
70 WISER & DONG, supra note 26, at 2.
71 SUNRUN, supra note 57, at 7.
72 Id. at 3.
73 STANFIELD, SCHROEDER, & CULLEY, supra note 62, at 36.
74 Arizona, California, and Colorado each purport to limit solar PV permit fees in this manner. Id. at 38– 39. However, California’s Solar Rights Act seems not to have been tremendously effective. See infra note
77 and accompanying text (demonstrating a wide variety in California county solar permit fees, many of which seem too high to be aimed at mere cost recovery).
75 STANFIELD, SCHROEDER, & CULLEY, supra note 62, at 36.
76 Id.

41
77 Kurt Newick, PV Permit Fees for 3kW Residential Systems for 25 California Counties as of 12/26/2011, SIERRA CLUB, http://www.solarpermitfees.org/PVFeesCaliforniaResidential.pdf (Dec. 26, 2011) (last accessed Jan. 7, 2014); see also CARL MILLS, JIM STEWART, & TAMARA WINTER COMPEAN, SOLAR ELECTRIC
PERMIT FEES IN SOUTHERN CALIFORNIA 4–5 (Sierra Club 2009), available at http://www.solarpermitfees.org/ SoCalPVFeeReport.pdf (June 21, 2009) (last accessed Jan. 7, 2014).
78 ARDANI ET AL., supra note 21, at 9.
79 NREL Soft Costs Roadmap, supra note 14, at 20.
80 Id. at 29–30.
81 Id. at 27 (noting that third parties owned roughly half of PV systems installed in 2011, and roughly 75% of PV systems installed in 2012); see also Todd Woody, The Next Big Innovation in Renewable
Energy Won’t Be Technological, THE ATLANTIC, Nov. 11, 2013, available at http://www.theatlantic.com/ technology/archive/2013/11/the-next-big-innovation-in-renewable-energy-wont-be-technological/ 281345/ (last accessed Jan. 7, 2014) (noting that “between 75 and 90 percent of all solar systems are now leased” from a third-party owner).
82 See Shayle Kann, Can You Name All the Residential Solar Lease Providers, GREENTECH MEDIA
(March 26, 2013), http://www.greentechmedia.com/articles/read/can-you-name-all-the-residential-solar-leaseproviders (listing residential solar lease providers and providing information on each).
83 NREL Soft Costs Roadmap, supra note 14, at 29.
84 Id.
85 Id. at 27 (“Reducing either the cost of capital or the ‘other soft costs’ (inclusive of financing transaction costs) to roadmap targets, while holding the other constant, results in nearly identical reductions in the cost of solar PV, as measured in cents per kilowatt-hour.”).
86 Id. at 29.
87 Id. at 30.
88 Id. at 29.
89 NREL Soft Costs Roadmap, supra note 14, at 29.
90 SEEL ET AL., supra note 32, at slide 31.
91 Id. at slide 31. In addition, wages for installers are lower in Germany, due to dynamics that are beyond the scope of this paper. One such dynamic is that wages in the U.S. tend to incorporate the costs of employer-based health insurance, while wages in Germany do not incorporate this, due to universal health care in that country.
92 NREL Soft Costs Roadmap, supra note 14, at 20.
93 Id.
94 Inverters are electrical components that convert the direct-current output from solar panels into alternating current that is suitable for residential use and compatible with the utility grid. See James Worden & Michael Zuercher-Martinson, How Inverters Work, SOLARPRO 68, 69 (April/May 2009), http:// solar.gwu.edu/index_files/Resources_files/How-Solar-Inverters-Work-With-Solar-Panels.pdf.
95 BARBOSE ET AL., supra note 3, at 37.
96 Id. at 37, 38 fig. 31.
97 Microinverters are a type of inverter that attach to each solar panel, in contrast to a centralized inverter that converts the power from all the solar panels together. These microinverters allow each solar panel to function more independently, improving the system’s performance when part of it is shaded. See Central Inverter vs. Microinverters: The Pros and Cons, GOGREENSOLAR (June 6, 2012), http:// blog.gogreensolar.com/2012/06/central-inverter-vs-microinverters-pros-cons.html.
98 BARBOSE ET AL., supra note 3, at 29.
99 CHRIS DELINE ET AL., PARTIAL SHADE EVALUATION OF DISTRIBUTED POWER ELECTRONICS FOR
PHOTOVOLTAIC SYSTEMS 1 (NREL 2012), available at http://www.nrel.gov/docs/fy12osti/54039.pdf.

42
100 BARBOSE ET AL., supra note 3, at 38. The wide range here reflects differences between single-axis and double-axis tracking systems. The double-axis tracking systems, though more expensive, are also much more efficient. Id.
101 See ALEXANDER QUINN, CHRISTINE SAFRIET, & CHRISTOPHER CLEMENT, SUNRUN, ECONOMIC AND FISCAL
IMPACT ANALYSIS OF RESIDENTIAL SOLAR PERMITTING REFORM 7 (Sunrun 2011) (copy on file with author).
102 See State Sales Tax Rates, SALES TAX INSTITUTE (Jan. 1, 2014), http://www.salestaxinstitute.com/ resources/rates (describing state and local tax rates, which in Alabama ranges as high as 12.5%).
103 QUINN, SAFRIET, & CLEMENT, supra note 76, at 25–26.
104 Supra ¤ II(B) (discussing prior downward trends in solar PV prices).
105 NREL Soft Costs Roadmap, supra note 14, at 7, 12, 15, 19, 23, 26, 34, 39 (describing the Roadmap’s methodology as comparing recommended cost reductions to existing cost-reduction trends and depicting the contrast in graphs for the various categories of soft costs).
106 Id.
107 Id. at 8, 16, 20, 27.
108 E.g. id. at 22 (depicting a projection that the use of solar-ready homes is much more likely to achieve cost-reduction targets than is the development of integrated, “plug and play” solar PV systems).
109 E.g. id. at vi–vii (noting that attaining targets for PII costs will require “an undefined solution set É that may represent the combination of unknown regulatory mechanisms”).
110 Id. at 1.
111 Id.
112 Id.
113 Keith Martin, Chadbourne & Parke LLP, Drive to Reduce the Cost of Capital 1, PROJECT FINANCE
NEWSWIRE, April 2013, at 1, available at http://www.chadbourne.com/files/upload/Martin_Drive%20to %20Reduce%20the%20Cost%20of%20Capital_project_finance_april13.pdf (last accessed Jan. 7, 2014).
114 Id.
115 Id.
116 Id. at 1–2.
117 Id.
118 James Montgomery, SunEdison Launches YieldCo to Unearth, Leverage Solar Asset Values, RENEWABLE ENERGY WORLD (Feb. 19, 2014), http://www.renewableenergyworld.com/rea/news/article/ 2014/02/sunedison-launches-yieldco-to-unearth-leverage-solar-asset-values; see also Martin, supra
note 113, at 2 (noting that one wind developer utilized a business form like a yield co).
119 Will YieldCo Structure Change Energy Investments?, PRETI FLAHERTY (Nov. 4, 2013), http:// energypolicyupdate.blogspot.com/2013/11/will-yieldco-structure-change-energy.html
120 Martin, supra note 113, at 2.
121 Id.
122 Id.
123 Id.
124 Id. at 3.
125 Id.
126 Martin, supra note 113, at 3. Some geothermal projects can exist as MLPs, but other renewable energy companies cannot. Id.
127 Molly F. Sherlock & Mark P. Kneightly, Congressional Research Service, Master Limited Partnerships: A
Policy Option for the Renewable Energy Industry 5–7 (Congressional Research Service 2011), available at http://www.ieeeusa.org/policy/eyeonwashington/2011/documents/masterlmtdpartnerships.pdf (last accessed Jan. 13, 2014) (discussing the legislative history behind MLPs).
43
128 E.g. President Barack Obama, The President’s Climate Action Plan 4–8 (The White House 2013), available at http://www.whitehouse.gov/sites/default/files/image/president27sclimateactionplan.pdf (last accessed Jan. 13, 2014) (discussing deployment of clean energy as a national strategy to mitigate climate change); see also U.S. DEPARTMENT OF ENERGY, About the SunShot Initiative, http:// www1.eere.energy.gov/solar/sunshot/about.html (last visited Jan. 7, 2014).
129 Supra § III(C).
130 Id.
131 Average Mortgage Rates and Points in the Top 10 Metropolitan Markets, BANKRATE.COM, http:// www.bankrate.com/brm/news/mtg/top10_averages.asp (Jan. 4, 2013) (last accessed Jan. 7, 2013); Bankrate: Mortgage Rates Rebound Following Release of Fed Minutes, WALL STREET JOURNAL (Nov. 27, 2013), http://online.wsj.com/article/PR-CO-20131127-905195.html?dsk=y (last accessed Jan. 7, 2014).
132 Energy Efficient Mortgage Program, U.S. DEPARTMENT OF HOUSING AND URBAN DEVELOPMENT, http:// portal.hud.gov/hudportal/HUD?src=/program_offices/housing/sfh/eem/energy-r (last accessed Jan. 7, 2014).
133 E.g. Green Mortgage: Energy Efficient Mortgage Guide, MORTGAGELOAN.COM (Apr. 23, 2013), http://
www.mortgageloan.com/environment/ (last accessed Jan. 7, 2014).
134 Id. The property’s value is measured either by the lesser of the literal value of the property, 115% of the median area price of a single family home, or 150% of the conforming Freddie Mac limit. Id.
135 Id.
136 PACE Financing, DSIRE.ORG, http://www.dsireusa.org/solar/solarpolicyguide/?id=26 (last accessed Apr. 17, 2014). The Database of State Incentives for Renewables & Efficiency (DSIRE) is a
comprehensive source of information on state, local, utility, and federal incentives and policies that promote renewable energy and energy efficiency. Established in 1995 and funded by the U.S. Department of Energy, DSIRE is an ongoing project of the N.C. Solar Center and the Interstate Renewable Energy Council.
137 Id.; PACE Financing Map, DSIRE.ORG, http://www.dsireusa.org/documents/summarymaps/ PACE_Financing_Map.pdf (last accessed Apr. 17, 2014).
138 County of Sonoma v. Federal Housing Finance Agency, 710 F.3d 987, 990–92 (9th Cir. 2013).
139 County of Sonoma, 710 F.3d at 988–89.
140 County of Sonoma, 710 F.3d at 993–95.
141 See CONGRESSIONAL BUDGET OFFICE, FANNIE MAE, FREDDY MAC, AND THE FEDERAL ROLE IN THE
SECONDARY MORTGAGE MARKET ix (CBO 2010), available at
http://www.cbo.gov/sites/default/files/cbofiles/ ftpdocs/120xx/doc12032/12-23-fanniefreddie.pdf (last accessed Jan. 7, 2014) (noting that “more than 90 percent of new mortgages made in 2009 carried a federal guarantee” from Fannie Mae or Freddy Mac).
142 See, e.g., Julie Schmit, What’s Ahead for 2014 Housing Market, USA Today (Jan. 1, 2014), http:// www.usatoday.com/story/money/business/2014/01/01/home-prices-2014-housing-starts/4181021/ (describing the housing market’s recovery).
143 County of Sonoma, 710 F.3d at 990.
144 See NREL Soft Costs Roadmap, supra note 14, at 20 (noting that “it is difficult for installers to standardize processes and challenging for technology manufacturers to further integrate hardware without compromising needed system flexibility”).
145 Id. at 21 (noting that the average wage for electricians is roughly $60/hour, while the wage for roofers is roughly $40/hour).
146 SUNRUN, supra note 57, at 4.
147 ALEXANDER QUINN, CHRISTINE SAFRIET, & CHRISTOPHER CLEMENT, SUNRUN, ECONOMIC AND FISCAL
IMPACT ANALYSIS OF RESIDENTIAL SOLAR PERMITTING REFORM (Sunrun 2011) (copy on file with author).
148 Id. at 6, 21.
4 4
149 WISER & DONG, supra note 26, at 28.
150 Id. at 29.
151 NREL Soft Costs Roadmap, supra note 14, at 17.
152 STANFIELD, SCHROEDER, & CULLEY, supra note 62, at 3.
153 Id. at 8–22.
154 Id. at 8.
155 Id. at 11.
156 Id. at 29.
157 Id.
158 STANFIELD, SCHROEDER, & CULLEY, supra note 62, at 3.
159 Id. at 9.
160 Id.
161 NREL Soft Costs Roadmap, supra note 14, at 16.
162 Id.; STANFIELD, SCHROEDER, & CULLEY, supra note 62, at 9.
163 See supra § III(C).
164 WISER & DONG, supra note 26, at 29. Safety-related inspections may be particularly necessary in the solar PV industry, because there is some concern that solar panels may pose fire risks. Fires related to solar panels may be more difficult to extinguish and may pose greater risks to fire crews. See Timothy Kreis, The Impact of Solar Energy on Firefighting, FIREENGINEERING.COM (Jan. 1 2009), http:// www.fireengineering.com/articles/print/volume-162/issue-1/features/the-impact-of-solar-energy-on-firefighting.html (last accessed Jan. 7, 2014); Daniel Kelley, Rooftop Solar Panels Become New Enemy of U.S. Firefighters, REUTERS (Sept. 5, 2013), http://www.reuters.com/article/2013/09/05/usa-solar-fire-idUSL2N0H114420130905 (last accessed Jan. 7, 2014). In the interest of fairness, it is worth mentioning that solar panels themselves are not particularly dangerous. For example, a large study of fire risks associated with solar panels in Germany, a nation with the highest concentration of solar panels, concluded that solar panels were not likely to cause fires. FRAUNHOFER ISE, Fire Protection in Photovoltaic Systems—Facts Replace Fiction—Results of Expert Workshop (Feb. 12, 2013), http:// www.ise.fraunhofer.de/en/press-and-media/press-releases/presseinformationen-2013/fire-protection-in-photovoltaic-systems (last accessed Jan. 13, 2014). The risk is from solar panels that are themselves defective or are incorrectly installed. Kreis, supra this note.
165 STANFIELD, SCHROEDER, & CULLEY, supra note 62, at 12.
166 WISER & DONG, supra note 26, at 29.
167 STANFIELD, SCHROEDER, & CULLEY, supra note 62, at 1.
168 Id.
169 Supra § III(D).
170 Federal Energy Regulatory Commission (FERC) Order 792, 145 FERC ¶ 61,159 (Nov. 22, 2013), available at http://www.ferc.gov/whats-new/comm-meet/2013/112113/E-1.pdf (last accessed Jan. 7, 2014) [hereinafter FERC Order 792]. Procedurally, FERC promulgated this amended rule in response to a petition from the Solar Energy Industries Association in early 2012. Id. at 9.
171 Id. at 9, 11, 19.
172 Id. at 8.
173 Id. at 16–17
174 Id. at 11.
175 Id. at 20.
176 FERC Order 792, supra note 207, at 16.
177 Id.
4 5
178 Id. at 18.
179 Id. at 19.
180 Id. at 69.
181 FERC Order 792, supra note 207, at 142.
182 Id. at 150.
183 Id.
184 Id. at 82.
185 Id. at 85; Small Generator Interconnection Agreements and Procedures Notice of Proposed Rulemaking, 142 FERC ¶ 61,049, at Appendix C § 2.4.1.2, available at http://www.ferc.gov/whats-new/ comm-meet/2013/011713/E-1.pdf (last accessed Jan. 7, 2014) [hereinafter Interconnection NOPR].
186 FERC Order 792, supra note 207, at 88; Interconnection NOPR Appendix C § 2.4.1.3.
187 FERC Order 792, supra note 207, at 103.
188 Id. at 82.
189 Id. at 91.
190 Id.
191 Id. at 94.
192 FERC Order 792, supra note 207, at 22, 27–29.
193 Id. at 31–32.
194 Id. at 61 Table 3.
195 Id.
196 Id. at 88; Interconnection NOPR Appendix C § 2.4.1.3.1—2.4.1.3.6.
197 Interconnection NOPR 25 ¶ 37.
198 FERC Order 792, supra note 207, at 133–35.
199 Id. at 134.
200 See New York v. FERC, 535 U.S. 1, 21–24 (2002).
201 See Id. at 25 (upholding FERC’s regulatory choices).
202 See Southern California Edison Co. v. FERC, 603 F.3d 997, 999–1002 (D.C. Cir. 2010) (holding that FERC exceeded its authority by insisting that the netting period for retail sales, traditionally the subject of state jurisdiction, comport with federal netting periods for energy transmission).
203 FERC Order 792, supra note 207, at 22.
204 INTERSTATE RENEWABLE ENERGY COUNCIL, MODEL INTERCONNECTION PROCEDURES (IREC 2013), available at http://www.irecusa.org/wp-content/uploads/2013-IREC-Interconnection-Model-Procedures.pdf (last accessed Jan. 7, 2014)
205 Id. at 5–6.
206 Because this paper focuses on reducing soft costs, it by no means provides exhaustive coverage of the topic of solar mandates. For example, this paper does not discuss solar access rights at great length. Nor does it address whether a federal solar mandate might exceed Congressional authority under the Commerce Clause. More fundamentally, it does not thoroughly address the economic wisdom of mandating economic activity rather than taking a more laissez-faire approach to regulating the energy market, which is a contentious debate beyond the scope of this paper.
207 Herman K. Trabish, Lancaster, CA Becomes First U.S. City to Require Solar, GREENTECH MEDIA (Mar. 27, 2013), http://www.greentechmedia.com/articles/read/Lancaster-CA-Becomes-First-US-City-to-Require-Solar (last accessed Jan. 7, 2014); see also Lancaster City Council to Consider Revised Residential Zoning Ordinance Requiring New Residences to Produce Solar Energy, CITY OF LANCASTER, CA (Mar. 21, 2013), http://www.cityoflancasterca.org/index.aspx?page=20&recordid=3240&returnURL= %2findex.aspx (last accessed Jan. 7, 2014).

4 6
208 TRABISH, supra note 207.
209 Glenn Schainblatt, Building Official, City of Sebastopol, Mandatory Photovoltaic
System Requirements 1 (copy on file with author).
210 Id.
211 Id.
212 NHBC FOUNDATION, THE MERTON RULE: A REVIEW OF THE PRACTICAL, ENVIRONMENTAL, AND
ECONOMIC EFFECTS v (NHBC Foundation 2009) (copy on file with author).
213 TRABISH, supra note 207.
214 See Photovoltaic Installations Ð City of Sebastopol, 03/2003 to Current, Spreadsheet (copy on file with author).
215 Interview with City of Sebastopol Building Department, December 04, 2013.
216 NHBC, supra note 208, at 1.
217 Supra § III(F).
218 BARBOSE ET AL., supra note 3, at 34.
219 Id.
220 TROY A. RULE, SOLAR MANDATES FOR REAL ESTATE DEVELOPMENT: A GUIDE AND MODEL
ORDINANCE 6 (SolarTech May 2013).
221 Id. at 8.
222 Id. at 7.
223 Id. at 6Ð7.
224 Edna Sussman, Reshaping Municipal and County Laws to Foster Green Building, Energy
Efficiency, and Renewable Energy 16 N.Y.U. ENVTL. L.J. 1, 32 (2008).
225 See id. at 32–34 (discussing solar access rules in various jurisdictions).
226 Jonathan Remy Nash & Richard L Revesz, Grandfathering and Environmental Regulation: The
Law and Economics of New Source Review, 101 Nw. U. L. Rev. 1677, 1681–1705 (2007).
227 Id. at 1708–1712 (describing the “old plant effect” and noting that such grandfathering policies “prolong the existence of older, dirtier facilities and give polluters incentives to make undesirable investment decisions”).
228 Id.
229 E.g. Nathan Gilles, Coding for Quakes: Novick’s Ready to Fight for Seismically Safer Buildings—Will
it be Enough?, Portland Mercury (Oct. 16, 2013), http://www.portlandmercury.com/portland/coding-forquakes/Content?oid=10779474 (noting that property owners avoid retrofits in order to avoid triggering costly seismic retrofit mandates).
230 Schainblatt, supra note 209, at 1.
231 NHBC, supra note 212, at 1.
232 Id.
47
Table of Figures Figure 1: SOLAR ENERGY INDUSTRIES ASSOCIATION, Solar Energy Facts: 2013 Year in Review 1 (Mar. 5, 2014), available at http://www.seia.org/research-resources/solar-industry-data.
Figure 2: DAVID FELDMAN ET AL., NATIONAL RENEWABLE ENERGY LABORATORY, PHOTOVOLTAIC SYSTEM
PRICING TRENDS: HISTORICAL, RECENT, AND NEAR-TERM PROJECTIONS 2013 EDITION, PowerPoint Presentation July 16, 2013 slide 18, http://emp.lbl.gov/publications/photovoltaic-system-pricing-trends-historical-recentand-near-term-projections-2013-edi.
Figure 3: GALEN BARBOSE, NAIM DARGHOUTH, SAMANTHA WEAVER, AND RYAN WISER, LAWRENCE BERKELEY
NATIONAL LABORATORY, TRACKING THE SUN VI: AN HISTORICAL SUMMARY OF THE INSTALLED PRICE OF
PHOTOVOLTAICS IN THE UNITED STATES FROM 1998 TO 2012 13 (LBNL 2013), available at http://emp.lbl.gov/ publications/tracking-sun-vi-historical-summary-installed-price-photovoltaics-united-states-1998-201. Figure 4: KRISTEN ARDANI, NATIONAL RENEWABLE ENERGY LABORATORY, BENCHMARKING
SOFT COSTS FOR PV SYSTEMS IN THE UNITED STATES, Powerpoint Presentation May 17, 2012 slide 7, available at http:// www.nrel.gov/docs/fy12osti/54689.pdf.
Figure 5: BARBOSE ET AL., supra Figure 3, at 25.
Figure 6: JOACHIM SEEL, GALEN BARBOSE, & RYAN WISER, LAWRENCE BERKELEY NATIONAL LABORATORY, WHY ARE RESIDENTIAL PV PRICES IN GERMANY SO MUCH LOWER THAN IN THE UNITED STATES: A SCOPING
ANALYSIS, PowerPoint Presentation September 2012 slide 26, http://emp.lbl.gov/sites/all/files/german-us-pv-priceppt.pdf.
Figure 7: BARBOSE ET AL., supra Figure 3, at 17.
Figure 8: Id. at 11.
Figure 9: Id. at 15.
Figure 10: KRISTEN ARDANI ET AL., NATIONAL RENEWABLE ENERGY LABORATORY, NON-HARDWARE (“SOFT”)
COST-REDUCTION ROADMAP FOR RESIDENTIAL AND SMALL COMMERCIAL SOLAR PHOTOVOLTAICS, 2013–2020 12
(National Renewable Energy Laboratory 2013), available at http://www.nrel.gov/docs/fy13osti/59155.pdf.
Figure 11: Id. at 19.
Figure 12: Oregon Department of Transportation 2008, Creative Commons License.
Figure 13: Seel et al., supra Figure 6, at 33.
Figure 14: Leonard G. 2006, Creative Commons License.
Figure 15: DATABASE OF STATE INCENTIVES FOR RENEWABLES AND EFFICIENCY (DSIRE), Property Tax
Incentives for Renewables (Jan. 2013), available at http://www.dsireusa.org/summarymaps/index.cfm?ee=0&RE=0 (accessed Apr. 17, 2014). The Database of State Incentives for Renewables & Efficiency (DSIRE) is a comprehensive source of information on state, local, utility, and federal incentives and policies that promote renewable energy and energy efficiency. Established in 1995 and funded by the U.S. Department of Energy, DSIRE is an ongoing project of the N.C. Solar Center and the Interstate Renewable Energy Council.
Figure 16: Mathias Aarre Maehlum, The Real Lifespan of Solar Panels, ENERGY INFORMATIVE (Nov. 11,
2013), http://energyinformative.org/lifespan-solar-panels/.
Figure 17: MOLLY F. SHERLOCK & MARK P. KEIGHTLY, CONGRESSIONAL RESEARCH SERVICE, MASTER
LIMITED PARTNERSHIPS: A POLICY OPTION FOR THE RENEWABLE ENERGY INDUSTRY 13 (June 2011).
Figure 18: DSIRE, supra Figure 15, at http://www.dsireusa.org/summarymaps/index.cfm?ee=0&RE=0 (accessed Apr. 17, 2014).
Figure 19: MYSOLARPOD.COM, SolarPod Grid Tied (2014), http://www.mysolarpod.com/solarpodgridtied.
Figure 20: Photo courtesy of City of Lancaste