SHOW US THE SUBSIDIES
40
Transcript of SHOW US THE SUBSIDIES


SHOW US THE SUBSIDIES: An Evaluation of State Government Online Disclosure
of Economic Development Subsidies
by
Philip Mattera, Thomas Cafcas, Leigh McIlvaine, Caitlin Lacy, Elizabeth Williams and Sarah Gutschow
Good Jobs First 1616 P Street NW Suite 210
Washington, DC 20036 202-232-1616
www.goodjobsfirst.org
December 2010
© Copyright 2010 by Good Jobs First. All rights reserved.

Table of Contents
Executive Summary…………………………………………………………………………... i
State Subsidy Disclosure Scoring by Rank and Alphabetically……………………………….... iv
Chapter 1. Introduction & Methodology……………………………………………………... 1
Chronology of Recent Advances in Subsidy Disclosure………………………………………. 7
Chapter 2. Findings…………………………………………………………………………... 8
Chapter 3. Conclusions & Policy Recommendations…………………………………………. 23
Endnotes……………………………………………………………………………………..... 26
Acknowledgements…………………………………………………………………………… 27
Appendix A. Sample Scoring Sheet…………………………………………………………... A-1
Appendix B. State Subsidy Program Scores……………………………………………..…..... B-1
A table of all disclosure websites and appendices showing details of state transparency scores can be found online at www.goodjobsfirst.org/showusthesubsidies

SHOW US THE SUBSIDIES
- i -
Executive Summary
An increasing number of states are disclosing the names of companies that receive economic development subsidies, but there is wide variation in the quality of such reporting. A few states have created exemplary online disclosure systems, while many release recipient information only in obscure reports tucked away in remote corners of official websites. About a dozen states still keep taxpayers in the dark on the use of job subsidies, even though they cost taxpayers nationwide tens of billions of dollars each year in direct outlays and lost tax revenue. These are the broad findings of an updated review of state economic development transparency conducted by Good Jobs First.
Sunshine is, as the saying goes, the best antiseptic — the cornerstone to reform. Weighing the costs and benefits of job subsidies is possible only with company-specific recipient information. Disclosure enables all other analyses: of whether companies are delivering promised jobs; of fairness among companies and industries; of wages and benefits; of geographic distribution; and of other measures of accountability and equity.
In this study we examine the online reporting practices of key economic development programs in all 50 states and the District of Columbia – 245 programs in all. We rate each one based on the inclusion of data such as subsidy dollar amounts, job-creation numbers, wage levels in those jobs and the geographic location of the subsidized facility. We also evaluate each program in terms of how easy it is to find and use the online data.
Employing seven main criteria, we rate each program on a scale of 0 to 100; we also offer up to 25 “extra credit” points per program for including up to eight more advanced features. Our study thus includes a total of 3,675 separate scoring elements for the 245 programs.
Our key findings are as follows:
• Thirty-seven states provide online recipient disclosure for at least one key subsidy program. This is a significant improvement from our 2007 report, which found 23 states with disclosure, though changes in methodology prevent a direct comparison.
• Since 2005, half a dozen states have enacted legislation mandating subsidy recipient reporting in one or more program. Other states have moved toward transparency through administrative action alone. Massachusetts is the most recent state to enact disclosure legislation.

EXECUTIVE SUMMARY
- ii -
• Four states provide recipient reporting for all the key programs we examined: Missouri, North Carolina, Ohio, and Wisconsin. Seven have disclosure for all but one of those programs: Illinois, Indiana, Michigan, Pennsylvania, Rhode Island, Utah and Vermont.
• Thirteen states and the District of Columbia currently have no disclosure at all, although one of those states, Massachusetts, is slated to come online as enacted legislation takes effect. All our scoring is based on what was available online as of November 26, 2010.
• Of the 245 programs we examined, 104 of them (42 percent) have online recipient reporting.
• Based on our scoring system, the states with the best averages across their programs are: Illinois (82), Wisconsin (71), North Carolina (69) and Ohio (66). Nineteen states have an average of 30 or above; 18 have averages below 30 but above zero. See below for a complete list.
• For the country as a whole, the average program score is 25. Ignoring those with no disclosure, the average rises to 59. Nineteen programs are above 75, including three that score over 100, thanks to extra credit.
• We also provide the results in the form of letter grades, but in a way that diverges from the usual system used in schools. We limit the failing grade of F to those states with no disclosure at all, and we stretch out the ranges for the lower passing grades (see the table for details). Using this system, Illinois gets a B; Wisconsin gets a B-minus; North Carolina and Ohio get a C-plus; and Missouri gets a C. Seven states get a C-minus; seven get a D-plus; nine get a D; and nine get a D-minus.
These results tell two different stories. The first is one of the steady spread of transparency across the United States. A practice embraced a decade ago by only a handful of states is now present to some degree in more than two-thirds of the country – more, taking into account those states that have enacted recipient disclosure but not yet put it into effect.
The other story is that some states still inexplicably keep taxpayers in the dark about such basic information as which companies are benefiting from job-creation subsidies, not to mention any information about outcomes. Moreover, even in those states that do have some recipient disclosure, the reporting often does not cover all key programs or it omits vital information such as what happens to the deals over time. That is why our average score for states with disclosure is dismally low.

SHOW US THE SUBSIDIES
- iii -
The conclusion is clear: the accountability movement has made advances but still has a long way to go before job subsidies are as transparent as other categories of state spending, such as procurement. To aid that movement, we list what we believe to be the most important elements of online subsidy reporting. These include:
• Complete information on subsidy amounts.
• Full identifying information about the recipient company.
• The exact street-address location of the subsidized facility.
• Data on outcomes such as jobs created and wages paid.
• Information on steps, such as clawbacks (monies recaptured), taken by state agencies when recipients fail to meet job targets.
• Disclosure sites that are easy to find, easy to use and have current and archival data.
• The inclusion of subsidy data on open government (or “Google government”) sites that many states have created to make general fiscal data more available to the public.
• Additional forms of transparency such as mapping subsidies against patterns of economic need; linking subsidy recipient data to information on procurement contracts and campaign contributions; and disclosing the regulatory compliance records of subsidy recipients.
Note: In the course of researching this report, Good Jobs First also created two new features for our website (www.goodjobsfirst.org):
• Accountable USA is a set of webpages about each state plus the District of Columbia containing an overview of its subsidy practices, profiles of major subsidy deals and other related information.
• Subsidy Tracker, the first resource of its kind, brings together subsidy recipient data from numerous state programs into one searchable online database.
A summary of state scores and ranks is on the following page.

EXECUTIVE SUMMARY
- iv -
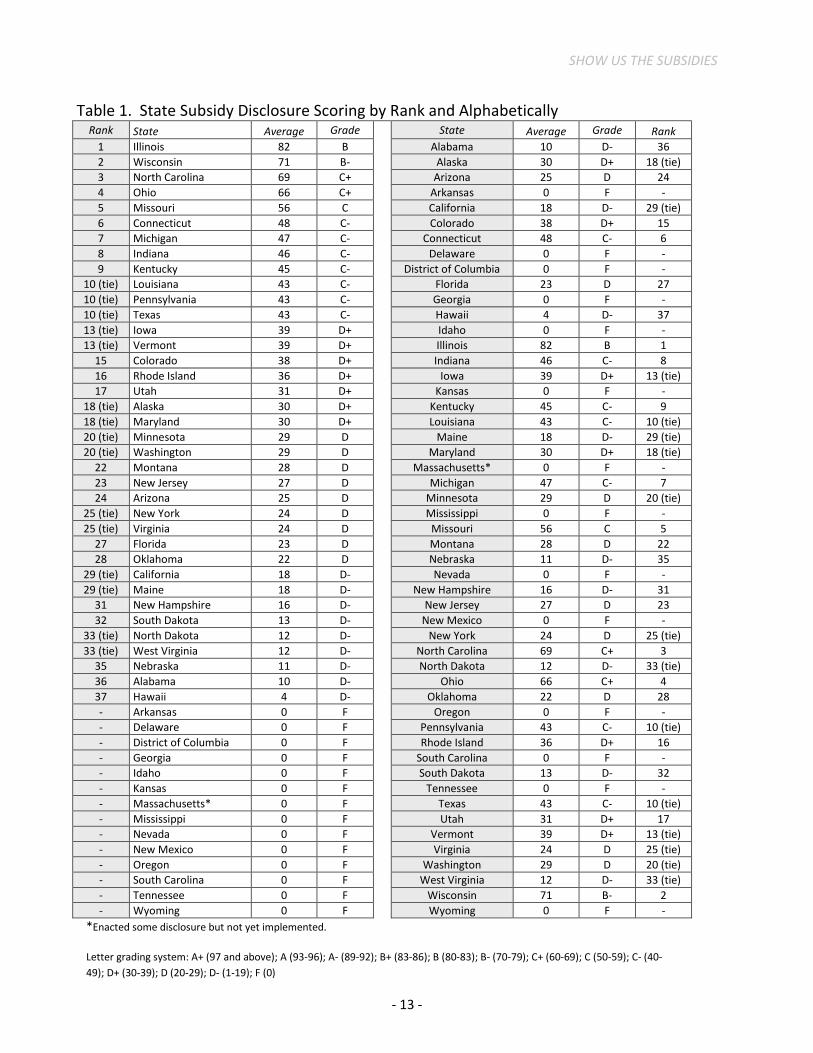
State Subsidy Disclosure Scoring by Rank and Alphabetically
Rank State Average Grade State Average Grade Rank 1 Illinois 82 B Alabama 10 D- 36 2 Wisconsin 71 B- Alaska 30 D+ 18 (tie) 3 North Carolina 69 C+ Arizona 25 D 24 4 Ohio 66 C+ Arkansas 0 F - 5 Missouri 56 C California 18 D- 29 (tie) 6 Connecticut 48 C- Colorado 38 D+ 15 7 Michigan 47 C- Connecticut 48 C- 6 8 Indiana 46 C- Delaware 0 F - 9 Kentucky 45 C- District of Columbia 0 F -
10 (tie) Louisiana 43 C- Florida 23 D 27 10 (tie) Pennsylvania 43 C- Georgia 0 F - 10 (tie) Texas 43 C- Hawaii 4 D- 37 13 (tie) Iowa 39 D+ Idaho 0 F - 13 (tie) Vermont 39 D+ Illinois 82 B 1
15 Colorado 38 D+ Indiana 46 C- 8 16 Rhode Island 36 D+ Iowa 39 D+ 13 (tie) 17 Utah 31 D+ Kansas 0 F -
18 (tie) Alaska 30 D+ Kentucky 45 C- 9 18 (tie) Maryland 30 D+ Louisiana 43 C- 10 (tie) 20 (tie) Minnesota 29 D Maine 18 D- 29 (tie) 20 (tie) Washington 29 D Maryland 30 D+ 18 (tie)
22 Montana 28 D Massachusetts* 0 F - 23 New Jersey 27 D Michigan 47 C- 7 24 Arizona 25 D Minnesota 29 D 20 (tie)
25 (tie) New York 24 D Mississippi 0 F - 25 (tie) Virginia 24 D Missouri 56 C 5
27 Florida 23 D Montana 28 D 22 28 Oklahoma 22 D Nebraska 11 D- 35
29 (tie) California 18 D- Nevada 0 F - 29 (tie) Maine 18 D- New Hampshire 16 D- 31
31 New Hampshire 16 D- New Jersey 27 D 23 32 South Dakota 13 D- New Mexico 0 F -
33 (tie) North Dakota 12 D- New York 24 D 25 (tie) 33 (tie) West Virginia 12 D- North Carolina 69 C+ 3
35 Nebraska 11 D- North Dakota 12 D- 33 (tie) 36 Alabama 10 D- Ohio 66 C+ 4 37 Hawaii 4 D- Oklahoma 22 D 28 - Arkansas 0 F Oregon 0 F - - Delaware 0 F Pennsylvania 43 C- 10 (tie) - District of Columbia 0 F Rhode Island 36 D+ 16 - Georgia 0 F South Carolina 0 F - - Idaho 0 F South Dakota 13 D- 32 - Kansas 0 F Tennessee 0 F - - Massachusetts* 0 F Texas 43 C- 10 (tie) - Mississippi 0 F Utah 31 D+ 17 - Nevada 0 F Vermont 39 D+ 13 (tie) - New Mexico 0 F Virginia 24 D 25 (tie) - Oregon 0 F Washington 29 D 20 (tie) - South Carolina 0 F West Virginia 12 D- 33 (tie) - Tennessee 0 F Wisconsin 71 B- 2 - Wyoming 0 F Wyoming 0 F -
*Enacted some disclosure but not yet implemented.
Letter grading system: A+ (97 and above); A (93-96); A- (89-92); B+ (83-86); B (80-83); B- (70-79); C+ (60-69); C (50-59); C- (40-49); D+ (30-39); D (20-29); D- (1-19); F (0)

SHOW US THE SUBSIDIES
- 1 -
Chapter 1. Introduction & Methodology
Wal-Mart does it, as do other big-box chains such as Target, Ikea, Home Depot, Cabela’s and Bass Pro. The same goes for major high-tech companies such as Intel and Google, financial behemoths such as Citigroup and Goldman Sachs, and aerospace giants such as Boeing and Northrop Grumman. Ditto for automakers, both Detroit’s Big Three and transplants from Asia and Europe. Not to mention professional sports teams seeking new stadiums throughout the country. And many other businesses. They have all taken economic development subsidies.1
Economic development subsidies are various forms of financial assistance given to companies by state and local governments to encourage the growth of business activity and job creation within their borders.
2
Most states have dozens of such programs; in the aggregate they cost taxpayers tens of billions of dollars per year.
Such growth takes place through the siting of new factories, distribution centers, office complexes, big-box stores or research facilities.
3
Among the main types of state subsidies are:
The annual costs of some states’ individual programs run to hundreds of millions of dollars. Localities often grant and administer subsidy programs, which are enabled and regulated by state law.
• Corporate income tax credits – dollar-for-dollar reductions in state taxes on corporate income linked to job creation, capital investment, research and development, film/television production or other measures. The most expensive of these are refundable credits: if a company’s credits exceed its tax bill, the state pays out the difference in cash.
• Enterprise zones – designated geographic areas in which companies making investments are entitled to multiple tax breaks (e.g., for taxes on property and equipment).
• Sales tax exemptions – exemption from or reimbursement for sales taxes on the purchase of construction materials and/or equipment for new or expanded facilities.
• Cash grants – direct payments to companies making new investments, often from “deal-closing” funds under the control of the governor’s office.
• Low-cost capital financing and loan guarantees – low-interest loans made cheap because the interest paid is tax-free income (loans may also be guaranteed or structured as forgivable if a company meets and sustains certain targets).
• Reimbursement for worker training expenses – direct payments to companies for training costs or payments to community colleges or other institutions that do the training for employees of specific firms.
INTRODUCTION & METHODOLOGY
- 2 -
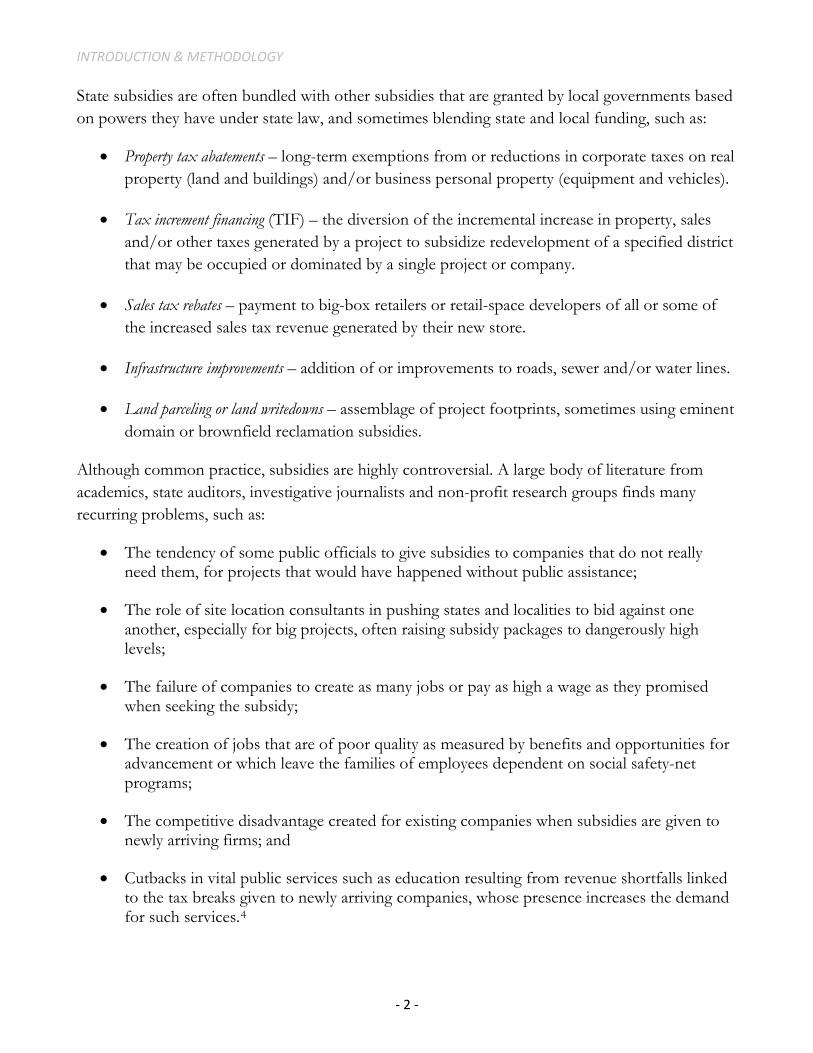
State subsidies are often bundled with other subsidies that are granted by local governments based on powers they have under state law, and sometimes blending state and local funding, such as:
• Property tax abatements – long-term exemptions from or reductions in corporate taxes on real property (land and buildings) and/or business personal property (equipment and vehicles).
• Tax increment financing (TIF) – the diversion of the incremental increase in property, sales and/or other taxes generated by a project to subsidize redevelopment of a specified district that may be occupied or dominated by a single project or company.
• Sales tax rebates – payment to big-box retailers or retail-space developers of all or some of the increased sales tax revenue generated by their new store.
• Infrastructure improvements – addition of or improvements to roads, sewer and/or water lines.
• Land parceling or land writedowns – assemblage of project footprints, sometimes using eminent domain or brownfield reclamation subsidies.
Although common practice, subsidies are highly controversial. A large body of literature from academics, state auditors, investigative journalists and non-profit research groups finds many recurring problems, such as:
• The tendency of some public officials to give subsidies to companies that do not really need them, for projects that would have happened without public assistance;
• The role of site location consultants in pushing states and localities to bid against one another, especially for big projects, often raising subsidy packages to dangerously high levels;
• The failure of companies to create as many jobs or pay as high a wage as they promised when seeking the subsidy;
• The creation of jobs that are of poor quality as measured by benefits and opportunities for advancement or which leave the families of employees dependent on social safety-net programs;
• The competitive disadvantage created for existing companies when subsidies are given to newly arriving firms; and
• Cutbacks in vital public services such as education resulting from revenue shortfalls linked to the tax breaks given to newly arriving companies, whose presence increases the demand for such services.4

SHOW US THE SUBSIDIES
- 3 -
For years, a movement for economic development accountability has been pushing to reform the subsidy system in many states.5
Yet the most fundamental reform is disclosure, i.e. the public reporting of which companies are receiving subsidies and how much they are getting. Taxpayers have a right to know about the ways in which their money is being diverted to private parties. Transparency is not an abstract principle; it helps to promote integrity and efficiency in the awarding of subsidies. If government officials know that information about each subsidy deal will be public information, they will be less likely to enter into questionable agreements.
Among these reforms are requirements that subsidy recipients create jobs with decent pay rates and adequate health benefits; the imposition of repayment requirements on recipients that fail to meet job creation or investment requirements; the targeting of subsidies to areas with true need for revitalization; and the denial of subsidies for projects in locations without access to public transit.
Show Us the Jobs (and the Wages)
The availability of the information also makes it easier for journalists, watchdog groups and others to analyze the functioning of subsidy programs. This is especially so if the reporting is not limited to company names and award amounts. Effective subsidy disclosure also requires the release of data on outcomes, especially job creation/retention as well as wage rates and benefit levels in those jobs. Information on the location of subsidized facilities is also valuable. Good Jobs First has used such data in several states to analyze the geographic distribution of subsidies in comparison to patterns of economic need and in relation to sprawl.
Compared to other ways government interacts with the private sector, such as public procurement, states have traditionally been more resistant to the disclosure of data on economic development subsidy recipients. Business groups have often claimed, with no empirical basis, that such transparency would result in the release of proprietary corporate information. Some public officials have worried, again without an empirical basis, that disclosure would cause their state or locality to be branded as unfriendly to business, causing a loss of deals.
Over time, these arguments have lost ground to right-to-know principles. There has been a steady movement by states to enact laws on subsidy disclosure, or in some cases to disclose through administrative action. The movement has been helped along by the spread of the internet. In an age when all sorts of government, commercial and personal information is available online, it is difficult to justify secrecy in the use of billions of dollars of public money.

INTRODUCTION & METHODOLOGY
- 4 -
This report evaluates the progress of state subsidy reporting practices through information dissemination that takes place online via readily available databases, webpages and posted reports. Making data available upon request, whether in paper or electronic form, is better than nothing, but it cannot qualify as true disclosure in our networked era. In this report, online disclosure is the only kind that counts.
This is an updated version of our 2007 study, The State of State Disclosure. In that report we compared the states’ subsidy reporting practices to those involving procurement contracts and lobbying activities. We showed that subsidies were very far behind the other two areas in terms of transparency. Having made that point to our satisfaction, this time we look solely at subsidy disclosure and the extent to which it is improving.
Another difference from 2007 is that our evaluation of the states is more rigorous this time around. Previously, we gave states credit for reporting on subsidies of any kind, regardless of how important or not the program was to the state’s overall subsidy portfolio.
A New Methodology
For this study, we first identified the most important economic development subsidy programs in each state and the District of Columbia, and then we looked for online recipient information for those programs. In order to make more valid comparisons, we included only those programs controlled by state agencies, even though local government giveaways – especially in forms such as property tax abatements and tax increment financing – are often more costly to taxpayers.
In many cases, importance was determined by cost, or by which programs figure most often in the “economic war among the states,” or both. We also made sure to include programs that have been particularly controversial, even if their cost had recently declined. If a program has been controversial, that may indicate flaws that merit heightened public interest; hence the need for disclosure data. The decision to examine a limited number of programs per state kept the scope of our research manageable. For most states and the District of Columbia, we chose five programs, but for ten states we could find only four subsidy programs of significance. We thus looked at a total of 245 programs.
We assembled preliminary lists of programs using Good Jobs First internal resources and our previously published reports, and by consulting the websites of state economic development agencies, which advertise their offerings to potential corporate investors. We also looked at state tax expenditure budgets and other official documents; reports published by state tax and budget watchdog groups; and subsidy compilations such as the State Business Finance & Incentives Resource Center website and the Incentives for Business 50 State Handbook published by State Capital

SHOW US THE SUBSIDIES
- 5 -
Group.6
Once we had our final lists, we set out to determine whether each program has recipient disclosure and how good it is; we also collected data, where available, on the cost of each program. We started with the results of our 2007 report and other Good Jobs First resources. We then scoured state government websites, both those of economic development agencies and the general fiscal reporting sites that some states have.
Finally, we asked our allies at those tax and budget watchdog groups to review our working lists and suggest additions and subtractions. (Good Jobs First, however, is responsible for the final choices).
Among the latter are the open government (sometimes called “Google government”) transparency sites that numerous states have created in recent years in response to pressure both from conservative groups such as Americans for Tax Reform and progressive ones such as the state PIRGs.7 It should be noted, however, that these sites often do not cover economic development subsidies when reporting on spending. Those that do usually provide only aggregate program costs, not individual recipient data. Among the few exceptions are the Missouri Accountability Portal and the Oklahoma OpenBook site, each of which has tax credit recipient data.8
Once we exhausted what we could find on websites and in reports, we phoned the state agencies that oversee the subsidy programs to check facts and make sure we had not overlooked any disclosure sites.
The vast majority of subsidy recipient reporting occurs via the websites of state economic development or commerce agencies.
Having identified the existing disclosure sources, we then rated them according to the quality of the data provided and the accessibility of the website providing the information.
For data quality, we looked at the availability of information on:
• the subsidy dollar amount gotten by each recipient; • the location of the facility for which the subsidy was awarded; • the number of jobs created or retained; • wage rates for those jobs; • identifying data on the recipient (industry code, Dun’s number, etc.); and • subsidy agreement documents and compliance reports.

INTRODUCTION & METHODOLOGY
- 6 -
For data accessibility, we looked at:
• the number of years covered by the data; • how easy it is to find the disclosure site; • the form in which the data are presented (database, downloadable spreadsheet, HTML
page, PDF document, etc.); and • whether the information is presented as part of an open government site that also provides
a wider range of fiscal data.
We assigned scores to each of the criteria and rated each of the programs on a scale of 0 to 100, with up to 25 points of extra credit possible for recipient disclosure in the more expensive programs (since more taxpayer money is at stake) and for those with certain features that we consider more advanced. The following section of this report contains more details on our scoring system and summarizes our overall findings. Scoring details on each state can be found online at www.goodjobsfirst.org/showusthesubsidies.
Note: In the course of researching this report, Good Jobs First also created two new features for our website (www.goodjobsfirst.org):
• Accountable USA is a set of webpages about each state containing an overview of its subsidy practices, profiles of major subsidy deals and other related information.
• Subsidy Tracker, the first resource of its kind, brings together subsidy recipient data from numerous state programs in one online database.

SHOW US THE SUBSIDIES
- 7 -
Chronology of Recent Advances in Subsidy Disclosure
September 2010 – Louisiana begins posting Board of Commerce & Industry Incentive Approvals for several major subsidy programs.
August 2010 - the California legislature gives final approval to a bill that would have required the creation of a public database containing the names of publicly-traded companies claiming tax credits of any kind; the legislation was later vetoed by Gov. Arnold Schwarzenegger.
June 2010 - Massachusetts passes a law that will require the disclosure of the names of recipients of refundable, salable, and transferable tax credits starting in 2011.
June 2010 – New York Gov. David Paterson signs a law that creates the new Excelsior Jobs Program and mandates disclosure of its recipients.
May 2010 – Colorado Gov. Bill Ritter signs an executive order directing the Economic Development Commission to include project-specific employment outcomes and wage information in its annual reports to the legislature.
July 2009 - Ohio passes House Bill 1, which mandates the creation of a public database with the names of the recipients of economic development tax credits.
January 2009 – Tax credit information is added to Oklahoma’s Open Books fiscal transparency site, which was launched in 2008 as a result of the Taxpayer Transparency Act of 2007.
July 2008 - Rhode Island passes law a requiring the online disclosure of recipients of several major tax credits.
June 2008 - Kentucky’s Cabinet for Economic Development creates the Financial Incentives Project Database.
May 2008 - Ohio passes House Bill 420, which requires the creation of a public database that discloses the names of economic development grant and loan recipients.
March 2008 – Wisconsin enacts a law requiring disclosure of all subsidy recipients receiving $100,000 or more.
November 2007 - New Jersey passes legislation requiring an annual unified economic development budget that discloses each company receiving more than $100,000 in subsidies; it has never been published. The state was already statutorily required to disclose the recipients of two major programs (BEIP and BRRAG).

- 8 -
Chapter 2. Findings
Disclosure of company-specific data on economic development subsidies is becoming an increasingly common practice among state governments. In an analysis of online reporting practices involving key subsidy programs in each of the states and the District of Columbia, we find that 37 states now provide such information on the web for at least one of those programs. Thirteen states and the District still fail to disclose, although one of those states, Massachusetts, is slated to come online as enacted legislation takes effect. Our evaluation is based on what was available online as of November 26, 2010.
This is a significant improvement from previous years. For example, in 2007 Good Jobs First found recipient reporting in only 23 states. In that report we counted disclosure for any subsidy program, whereas here we restrict our analysis to each state’s most important programs and to those that are under the control of state rather than local officials.
We credit this progress largely to the hard work of a diverse array of state tax and budget policy groups, good government advocates, community organizations, labor unions, and other grassroots activists who have mobilized around this issue. They have won a wider acceptance of disclosure among public officials.
In recent years, legislation mandating subsidy disclosure has been enacted in states such as Hawaii, Massachusetts, New Jersey, New York, Ohio, Oklahoma, Rhode Island and Wisconsin – sometimes for a single program, sometimes for multiple ones. Other states such as Kentucky, Louisiana, Missouri and Pennsylvania have adopted disclosure through administrative action. See the box on page 7 for more details.
This expansion is encouraging, but we find that there is still very wide variation among the disclosure states in terms of the scope and quality of the reporting.
Four states provide recipient reporting for all of the key programs we identified: Missouri, North Carolina, Ohio, and Wisconsin. Seven states have disclosure for all but one of their key programs: Illinois, Indiana, Michigan, Pennsylvania, Rhode Island, Utah and Vermont.
Of the universe of 245 programs we examined, recipient disclosure exists for 104, or 42 percent of the total.

SHOW US THE SUBSIDIES
- 9 -
To evaluate each state’s disclosure practices in more detail and to compare the states to one another, we developed a scoring system based on what we at Good Jobs First believe to be the most important elements of subsidy transparency. These include the inclusion of data such as subsidy amount, location of the subsidized facility, the number of jobs actually created or retained and the wage rates for those jobs. We also look at issues of data accessibility such as the number of years of subsidy data provided, how easy it is to find the disclosure information and the form in which the data are presented.
States With No Subsidy Recipient Reporting (Yet) Arkansas Delaware
District of Columbia Georgia Idaho
Kansas Massachusetts*
Mississippi Nevada
New Mexico
Oregon South Carolina
Tennessee Wyoming
*disclosure enacted but not yet implemented
Altogether, we looked at seven key criteria and used them to score each program on a scale of 0 to 100. We also awarded up to 25 extra credit points in eight categories for features that we consider advanced and for recipient disclosure in programs that are most costly to taxpayers. Our study thus includes a total of 3,675 separate scoring elements for the 245 programs. See Appendix A for a sample scoring sheet.
We then averaged the program scores in each state and the District of Columbia and ranked them according to those averages. Under this system, the average state score is 24, as is the median. Putting aside the 13 states and the District of Columbia with no recipient disclosure, the average state score is 34. Five states score above 50: Illinois (82), Wisconsin (71), North Carolina (69), Ohio (66) and Missouri (56). Nineteen states have an average of 30 or above, while 18 have averages below 30 but above zero. On page 13 is a table with each state’s score and rank.
We also provide the results in the form of letter grades, but in a way that diverges from the usual system used in schools. We limit the failing grade of F to those states with no disclosure at all, and we stretch out the ranges for the lower passing grades (see the table for details). Using this system, Illinois gets a B; Wisconsin gets a B-minus; North Carolina and Ohio get a C-plus; and Missouri gets a C. Seven states get a C-minus; seven get a D-plus; nine get a D; and nine get a D-minus.

FINDINGS
- 10 -
The states that score well are ones that have recipient disclosure in more programs and provide more complete and accessible data. The poorly scoring states are ones with few programs represented and/or mediocre reporting in those programs.
The states without recipient reporting are in some cases keeping the public in the dark about some very expensive programs. For example, the District of Columbia’s Tax Increment Financing program costs more than $400 million a year; South Carolina’s Job Tax Credit program costs about $196 million a year; and Idaho’s Production Equipment and Supplies Sales Tax Exemption costs about $165 million annually.
Figure 1. Missouri Accountability Portal
Missouri’s Accountability Portal website allows users to search for tax credit recipients by type of tax credit, recipient (customer) name, and legislative district. (http://mapyourtaxes.mo.gov/)

SHOW US THE SUBSIDIES
- 11 -
Snapshots of Top-Scoring States
Illinois
The subsidy disclosure system in Illinois is the result of accountability legislation passed in 2003 in response to Good Jobs First’s study A Better Deal for Illinois. It consists of a searchable database that provides access to PDF copies of reports submitted by recipient companies. It covers ten programs, including major ones such as EDGE tax credits. In addition to subsidy amounts, the reports contain job creation and retention data for full-time and part-time workers, including breakdowns by occupational categories with average salaries in each. The reports also require recipients to indicate whether they reduced employment at another site in the state. Four of the five Illinois programs we examine in this report score 100 or better (with extra credit). It is only because of the absence of disclosure in the state’s film tax credit program that Illinois does not receive an A+ grade.
Wisconsin
Wisconsin’s subsidy disclosure system, which includes all five of the key programs we examined plus numerous others, came about through 2008 legislation promoted by the Wisconsin Public Interest Research Group. It consists of a state Commerce Department database that displays a recipient’s subsidy amount as well as the number of jobs promised and the number actually created.
North Carolina
North Carolina’s system of subsidy reporting consists of a series of PDF reports issued by the Department of Commerce (for programs such as the Job Development Investment Grant and One NC) and by the Department of Revenue for several key tax credit programs. Four of the five key programs we examined have reporting on jobs, and the Job Development Investment Grant report also gives information on pay levels. The Commerce Department reports on the use of clawbacks in its main programs.
Ohio
Ohio’s system has two main parts: a database of grant and loan recipients created by 2008 legislation and a database of tax incentive recipients created by the legislature in 2009, both available on the website of the Department of Development. The grant/loan search engine displays recipient names, the amount received and the county in which the subsidized facility is located; the tax incentives site also shows job figures. Both sites allow users to download results to a spreadsheet. The Development Department has a separate webpage with links to Community Reinvestment Area data.
Although changes in our methodology prevent direct comparisons, we can say that some states have made substantial progress in their subsidy disclosure since the publication of our 2007 survey. Among the states that previously had no disclosure but are now reporting are Louisiana,

FINDINGS
- 12 -
Oklahoma and Rhode Island. Soon to be added to that list is Massachusetts, which enacted a disclosure system in 2010 that has not yet taken effect and thus could not be considered in this report. The California legislature also passed disclosure this year, but the bill was vetoed by Gov. Arnold Schwarzenegger.
States that had some disclosure in 2007 but now do a better job include Kentucky, Texas and Wisconsin. States that did well in 2007 compared to the national norm and continue to be ahead of the pack include: Connecticut, Illinois, Indiana, Missouri, North Carolina, Ohio and Pennsylvania.
Uneven Progress
Our findings show uneven progress not only among states but also within individual states. Thirty-two states have subsidy recipient disclosure for some of their key programs and nothing for others. In some states, there is also wide variation in the quality of the disclosure among programs. Here are the states with the greatest divergence between their highest and lowest-scoring programs (not including those with no disclosure):
• Texas (59 points of difference) • Maryland (54) • Rhode Island (52) • Utah (52)
Maryland’s inconsistency is especially surprising, given that the administration of Gov. Martin O’Malley has put an emphasis on high-quality performance reporting, as exemplified by its StateStat system.
At the other end of the spectrum, the greatest consistency is seen in Wisconsin. It has disclosure in all of its key programs, and the scores of those programs vary by no more than seven points. This is helped by the fact that the state uses a single disclosure website for all the programs.
Texas, Maryland and the others with the most uneven scores should finish the job and emulate Wisconsin with uniformly good disclosure across the board.
The following table has a summary of the state scores by rank and alphabetically by state name.
SHOW US THE SUBSIDIES
- 13 -
Table 1. State Subsidy Disclosure Scoring by Rank and Alphabetically
Rank State Average Grade State Average Grade Rank 1 Illinois 82 B Alabama 10 D- 36 2 Wisconsin 71 B- Alaska 30 D+ 18 (tie) 3 North Carolina 69 C+ Arizona 25 D 24 4 Ohio 66 C+ Arkansas 0 F - 5 Missouri 56 C California 18 D- 29 (tie) 6 Connecticut 48 C- Colorado 38 D+ 15 7 Michigan 47 C- Connecticut 48 C- 6 8 Indiana 46 C- Delaware 0 F - 9 Kentucky 45 C- District of Columbia 0 F -
10 (tie) Louisiana 43 C- Florida 23 D 27 10 (tie) Pennsylvania 43 C- Georgia 0 F - 10 (tie) Texas 43 C- Hawaii 4 D- 37 13 (tie) Iowa 39 D+ Idaho 0 F - 13 (tie) Vermont 39 D+ Illinois 82 B 1
15 Colorado 38 D+ Indiana 46 C- 8 16 Rhode Island 36 D+ Iowa 39 D+ 13 (tie) 17 Utah 31 D+ Kansas 0 F -
18 (tie) Alaska 30 D+ Kentucky 45 C- 9 18 (tie) Maryland 30 D+ Louisiana 43 C- 10 (tie) 20 (tie) Minnesota 29 D Maine 18 D- 29 (tie) 20 (tie) Washington 29 D Maryland 30 D+ 18 (tie)
22 Montana 28 D Massachusetts* 0 F - 23 New Jersey 27 D Michigan 47 C- 7 24 Arizona 25 D Minnesota 29 D 20 (tie)
25 (tie) New York 24 D Mississippi 0 F - 25 (tie) Virginia 24 D Missouri 56 C 5
27 Florida 23 D Montana 28 D 22 28 Oklahoma 22 D Nebraska 11 D- 35
29 (tie) California 18 D- Nevada 0 F - 29 (tie) Maine 18 D- New Hampshire 16 D- 31
31 New Hampshire 16 D- New Jersey 27 D 23 32 South Dakota 13 D- New Mexico 0 F -
33 (tie) North Dakota 12 D- New York 24 D 25 (tie) 33 (tie) West Virginia 12 D- North Carolina 69 C+ 3
35 Nebraska 11 D- North Dakota 12 D- 33 (tie) 36 Alabama 10 D- Ohio 66 C+ 4 37 Hawaii 4 D- Oklahoma 22 D 28 - Arkansas 0 F Oregon 0 F - - Delaware 0 F Pennsylvania 43 C- 10 (tie) - District of Columbia 0 F Rhode Island 36 D+ 16 - Georgia 0 F South Carolina 0 F - - Idaho 0 F South Dakota 13 D- 32 - Kansas 0 F Tennessee 0 F - - Massachusetts* 0 F Texas 43 C- 10 (tie) - Mississippi 0 F Utah 31 D+ 17 - Nevada 0 F Vermont 39 D+ 13 (tie) - New Mexico 0 F Virginia 24 D 25 (tie) - Oregon 0 F Washington 29 D 20 (tie) - South Carolina 0 F West Virginia 12 D- 33 (tie) - Tennessee 0 F Wisconsin 71 B- 2 - Wyoming 0 F Wyoming 0 F -
*Enacted some disclosure but not yet implemented.
Letter grading system: A+ (97 and above); A (93-96); A- (89-92); B+ (83-86); B (80-83); B- (70-79); C+ (60-69); C (50-59); C- (40-49); D+ (30-39); D (20-29); D- (1-19); F (0)
FINDINGS
- 14 -
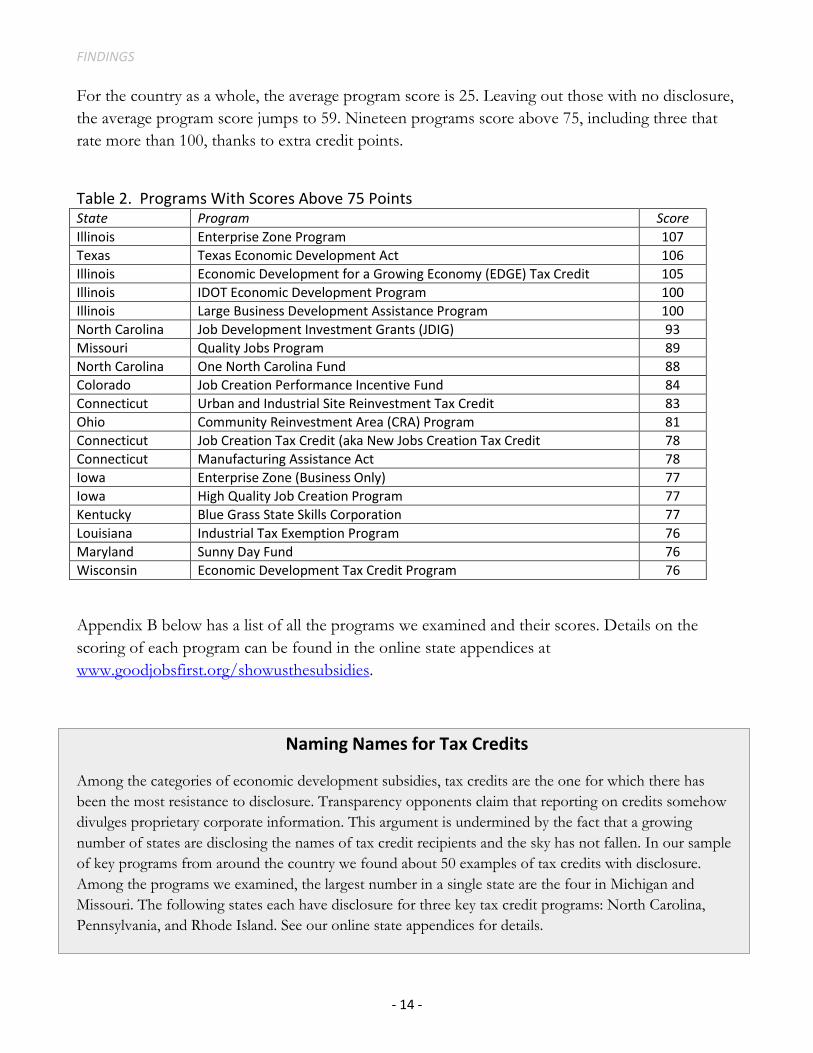
For the country as a whole, the average program score is 25. Leaving out those with no disclosure, the average program score jumps to 59. Nineteen programs score above 75, including three that rate more than 100, thanks to extra credit points.
Table 2. Programs With Scores Above 75 Points State Program Score Illinois Enterprise Zone Program 107 Texas Texas Economic Development Act 106 Illinois Economic Development for a Growing Economy (EDGE) Tax Credit 105 Illinois IDOT Economic Development Program 100 Illinois Large Business Development Assistance Program 100 North Carolina Job Development Investment Grants (JDIG) 93 Missouri Quality Jobs Program 89 North Carolina One North Carolina Fund 88 Colorado Job Creation Performance Incentive Fund 84 Connecticut Urban and Industrial Site Reinvestment Tax Credit 83 Ohio Community Reinvestment Area (CRA) Program 81 Connecticut Job Creation Tax Credit (aka New Jobs Creation Tax Credit 78 Connecticut Manufacturing Assistance Act 78 Iowa Enterprise Zone (Business Only) 77 Iowa High Quality Job Creation Program 77 Kentucky Blue Grass State Skills Corporation 77 Louisiana Industrial Tax Exemption Program 76 Maryland Sunny Day Fund 76 Wisconsin Economic Development Tax Credit Program 76
Appendix B below has a list of all the programs we examined and their scores. Details on the scoring of each program can be found in the online state appendices at www.goodjobsfirst.org/showusthesubsidies.
Naming Names for Tax Credits
Among the categories of economic development subsidies, tax credits are the one for which there has been the most resistance to disclosure. Transparency opponents claim that reporting on credits somehow divulges proprietary corporate information. This argument is undermined by the fact that a growing number of states are disclosing the names of tax credit recipients and the sky has not fallen. In our sample of key programs from around the country we found about 50 examples of tax credits with disclosure. Among the programs we examined, the largest number in a single state are the four in Michigan and Missouri. The following states each have disclosure for three key tax credit programs: North Carolina, Pennsylvania, and Rhode Island. See our online state appendices for details.

SHOW US THE SUBSIDIES
- 15 -
Hooray for Hollywood
A decade ago, the main challenge to California’s dominance in the movie industry came from north of the border. Toronto and Vancouver lured film shoots with the cheap Canadian dollar and government subsidies. Now Hollywood faces a domestic threat: More and more states have been providing lucrative subsidies for film companies.
Nearly all states now have film tax credits and other related financial incentives. In many states, these subsidies have become one of the costliest programs. In 24 states we included a film subsidy on our list of key programs. In seven of those states – California, Connecticut, Hawaii, Louisiana, Massachusetts, Michigan and New York – the annual cost of the program is estimated at $100 million or more. The high price tags in many states reflect the fact that the tax credits are transferable or refundable. That is, if a production company gets a tax credit in excess of its tax liability, it can sell the credit to another company (with a bigger tax liability) or get a cash refund for the difference from the state.
Despite the costs, many states are not providing recipient disclosure information for these programs. Of the 24 film programs on our list, only eight are transparent: in Alaska, Arizona, Michigan, Missouri, North Carolina, Pennsylvania, Rhode Island, and Wisconsin.
Results by Scoring Component
Subsidy Amounts
After recipient names, the inclusion of subsidy amounts is the most important feature of disclosure. For that reason, we award more points for this category of data than any other. Some disclosure sites provide the amount for which the company is approved, while others present the actual amount received. In many cases the two will ultimately be the same, but for some performance-based subsidies the final amount will depend on the exact number of jobs created or retained, the size of the capital investment or other variables. Preferably, a disclosure site would show both amounts. We award 30 points when either amount is provided, 40 points when both are.
Of the 104 programs with some form of disclosure, 73 in 32 states get 30 points and 20 in 13 states get 40 points. We found 11 programs that disclose company names but not individual amounts; they get zero points in this category.
Location
It is important for taxpayers to know not only which companies are receiving subsidies but also the location of the specific facility where jobs are being created. Residents may want to see whether their community is getting a fair share of the benefits, or they may want to apply for job

FINDINGS
- 16 -
opportunities. Our affiliate Good Jobs New York publishes Subsidy Snapshots that show the location of subsidized businesses in New York City and list the number of jobs those companies have promised to create. They are used by job training providers who seek to place their students.
Location is also crucial for researchers seeking to analyze the patterns of subsidy distribution to determine, for example, whether there is a spatial mismatch between the communities most in need and the areas getting the most money, whether jobs are accessible to workers who cannot afford a car, or whether subsidies are generally contributing to suburban sprawl. Good Jobs First has published several mapping studies to address such questions.
We give five points to programs that provide a general location (city, county, etc.) and 15 points to those that provide the locality plus the exact street addresses.
Of the 104 programs with disclosure, 50 in 25 states provide a general location only and 30 in 15 states give an exact street address for subsidized facilities. We found one state – Michigan – that uses an interactive map to show the locations of subsidized projects and to describe them.
Figure 2. Michigan Economic Development Corporation’s Subsidy Mapping Utility
The Michigan Economic Development Corporation website allows users to map subsidy use by type or industry. Project details included in the map display the number of jobs created, the facility address, and a link to project summaries.
(http://www.michiganadvantage.org/Reference/Projects/)
SHOW US THE SUBSIDIES
- 17 -
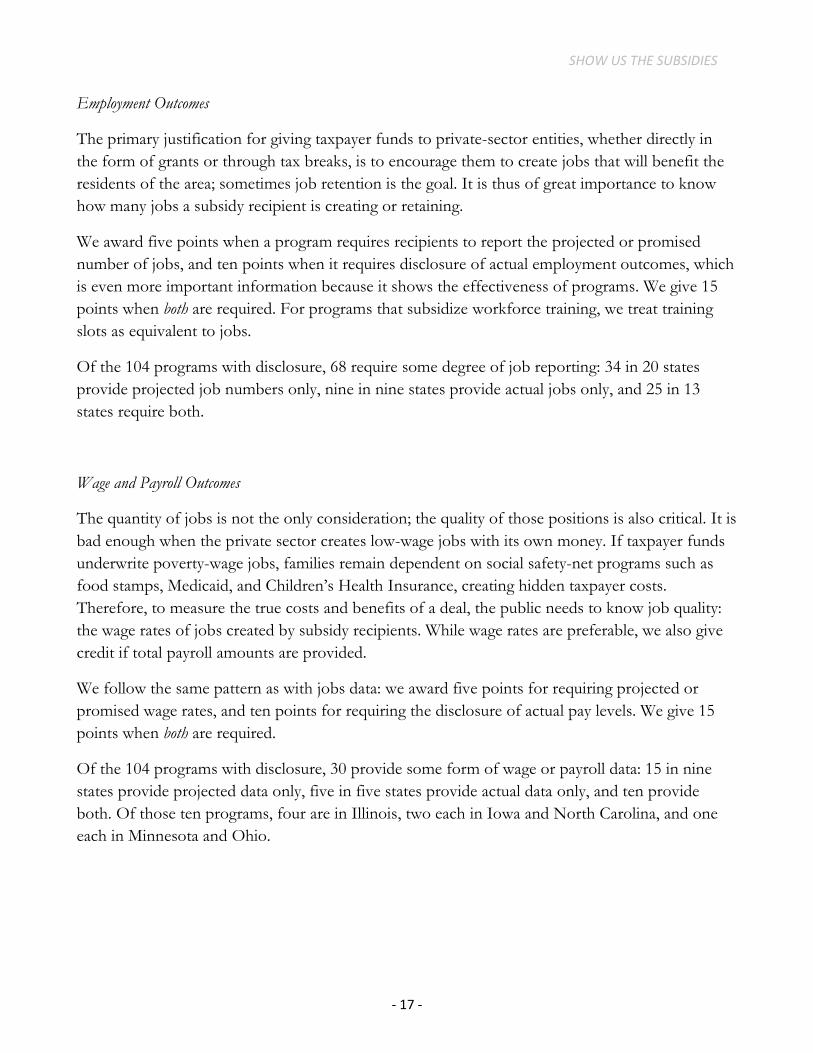
Employment Outcomes
The primary justification for giving taxpayer funds to private-sector entities, whether directly in the form of grants or through tax breaks, is to encourage them to create jobs that will benefit the residents of the area; sometimes job retention is the goal. It is thus of great importance to know how many jobs a subsidy recipient is creating or retaining.
We award five points when a program requires recipients to report the projected or promised number of jobs, and ten points when it requires disclosure of actual employment outcomes, which is even more important information because it shows the effectiveness of programs. We give 15 points when both are required. For programs that subsidize workforce training, we treat training slots as equivalent to jobs.
Of the 104 programs with disclosure, 68 require some degree of job reporting: 34 in 20 states provide projected job numbers only, nine in nine states provide actual jobs only, and 25 in 13 states require both.
Wage and Payroll Outcomes
The quantity of jobs is not the only consideration; the quality of those positions is also critical. It is bad enough when the private sector creates low-wage jobs with its own money. If taxpayer funds underwrite poverty-wage jobs, families remain dependent on social safety-net programs such as food stamps, Medicaid, and Children’s Health Insurance, creating hidden taxpayer costs. Therefore, to measure the true costs and benefits of a deal, the public needs to know job quality: the wage rates of jobs created by subsidy recipients. While wage rates are preferable, we also give credit if total payroll amounts are provided.
We follow the same pattern as with jobs data: we award five points for requiring projected or promised wage rates, and ten points for requiring the disclosure of actual pay levels. We give 15 points when both are required.
Of the 104 programs with disclosure, 30 provide some form of wage or payroll data: 15 in nine states provide projected data only, five in five states provide actual data only, and ten provide both. Of those ten programs, four are in Illinois, two each in Iowa and North Carolina, and one each in Minnesota and Ohio.

FINDINGS
- 18 -
Figure 3. Illinois Department of Commerce and Economic Opportunity Annual Project Program Report
The Illinois Department of Commerce and Economic Opportunity posts annual reports from recipients on their job creation and retention performance. (http://www.ilcorpacct.com/corpacct/ProgressReport)

SHOW US THE SUBSIDIES
- 19 -
Currency and Depth of Data
To get an accurate picture of the costs and benefits of a subsidy program overall, recipient disclosure data should be up to date. It is also helpful to have multiple years of data.
We award three points to programs that are currently disclosing recipient data from 2009 or 2010, and two points when it has disclosure for any year from 2005 to 2008. We give five points if the available disclosure covers years from both periods. If the only recipient data a program provides are older than 2005, it gets no points in this category. If a program came into existence after 2005 it is not penalized for failing to provide data prior to its effective date.
Of the 104 programs with disclosure, nine provide data for 2009 or 2010 only, 11 provide data for the period 2005-2008 only, and 84 provide data for years from both periods.
Searchability of Data
Users of subsidy recipient data are often looking for information relating to a particular company. If the information is presented in alphabetical order by firm name, that is a simple matter. Yet lists may be in chronological order or arranged by industry. In other cases the disclosure is not in list form at all, but rather as text within a larger report. It is thus essential that any disclosure list or document be searchable. The most searchable formats are online databases or downloadable spreadsheets.
We award two points to programs that provide data in HTML or PDF form that can be searched using a function such as CTRL-F. We give five points to programs with search engines or spreadsheets.
Of the 104 programs with disclosure, 64 provide HTML or PDF searchability, while 32 have databases or downloadable Excel spreadsheets. Eight programs provide disclosure data in PDFs that are not searchable via CTRL-F.
Ease of Access to Data
Transparency is of little value if users cannot find the information, or to put it another way: disclosure should not be a treasure hunt. Some states hide their subsidy recipient disclosure on obscure webpages or in hard-to-find PDF reports.

FINDINGS
- 20 -
We give two points when the reporting is contained in program annual reports or in obvious locations on agency websites. We award five points to those programs that have separate and clearly identifiable disclosure websites. Programs whose information is difficult to find get no points in this category.
Of the 104 programs with disclosure, 40 report through easy-to-find locations on agency websites, and 43 use dedicated disclosure sites. The states with the most programs using dedicated disclosure sites are Missouri and Wisconsin (both 5), and Illinois and Ohio (4 each). Twenty-one programs report in obscure places and thus get no points here.
Extra Credit 1: Costly Programs
Because more taxpayer money is involved, recipient disclosure in costly programs is especially important. We give seven extra credit points for disclosure by the most expensive program in the state among those we examine; five points for disclosure by the second most expensive. Twenty-three programs get seven points; 21 get five points. A total of 33 states have disclosure in one or both of their two most expensive programs in our list.
Extra Credit 2: Application and Agreement Forms
Subsidy amounts and job numbers don’t tell the whole story. The public should have easy access to copies of approved application forms (with any truly proprietary data redacted) or signed agreements. We give four extra credit points for this more advanced feature. Only two programs qualified: California’s Employment Training Panel and the Texas Economic Development Act.
Extra Credit 3: Compliance or Performance Reports
The more accountable subsidy programs require recipients to meet and maintain certain performance criteria (such as job creation targets and minimum pay levels). Reports on whether recipients have reached such goals – and whether the state is taking action when they fail to do so – should be part of any complete disclosure system. They speak to the very basic question: is the state watching the store? We award four extra credit points for this advanced feature. Twenty-one programs qualify: five in Wisconsin, four in Illinois, three in Connecticut, two in Texas and North Carolina, and one each in California, Maryland, Minnesota, Ohio and Virginia.

SHOW US THE SUBSIDIES
- 21 -
Extra Credit 4: Disaggregated Wage Data
It is important to know average wage rates for jobs created by subsidized companies, but averages can be skewed by a small number of high-paid employees. Recipients should be required to show the distribution of wage rates. This can be done either by showing wage ranges for all workers, or by dividing positions into occupational categories and showing the average for each. We award four extra credit points for this feature, but only seven programs in three states qualify. Four of them are in the exemplary disclosure system used by Illinois. The others are Minnesota’s JOBZ and Job Skills Partnership programs and Washington State’s Aircraft Pre-production Expenditures B&O Tax Credit.
Extra Credit 5: Disclosure Through Open Government Sites
Economic development subsidy disclosure is only one facet of a larger movement toward greater transparency in state government operations. Many states have created new open government (or “Google government”) websites that provide easy access to fiscal data. In most cases, these sites do not have any information on subsidies, but they should: subsidy costs are very much part of overall state finances. We award two points of extra credit to programs whose recipient information appears as part of a wider open government website (even if it is only as a link to an agency website). Only 14 programs in five states qualify: the five Missouri programs in our sample, which are all reported through the Missouri Accountability Portal; four Ohio programs whose disclosure pages are linked from the state’s transparency site; three Kentucky programs linked from the state’s Open Door website; the Oklahoma Investment/New Jobs Tax Credit, which is disclosed through the state’s Open Books site; and the Alabama Industrial Development Training program, whose disclosures are linked from the state’s Open.Alabama.gov site.9
Extra Credit 6: Dun’s or EIN
Researching the subsidies received by a specific company is made easier if states provide a unique identifier for recipients. The best ones are a Dun’s number or a federal Employer Identification Number (EIN). We award two points of extra credit for programs that provide this useful information. Only one does so far: the Texas Economic Development Act.
Extra Credit 7: NAICS Industry Codes
Analyzing the patterns of subsidy awards is also facilitated when states provide industry codes for the recipient companies. The system most often used by economists and other analysts is the
FINDINGS
- 22 -
federal government’s North American Industry Classification System (NAICS). We award two extra credit points to programs that display NAICS codes. Thirteen programs qualify: four in Illinois, three in Connecticut and Louisiana, two in Kentucky and one in Texas.
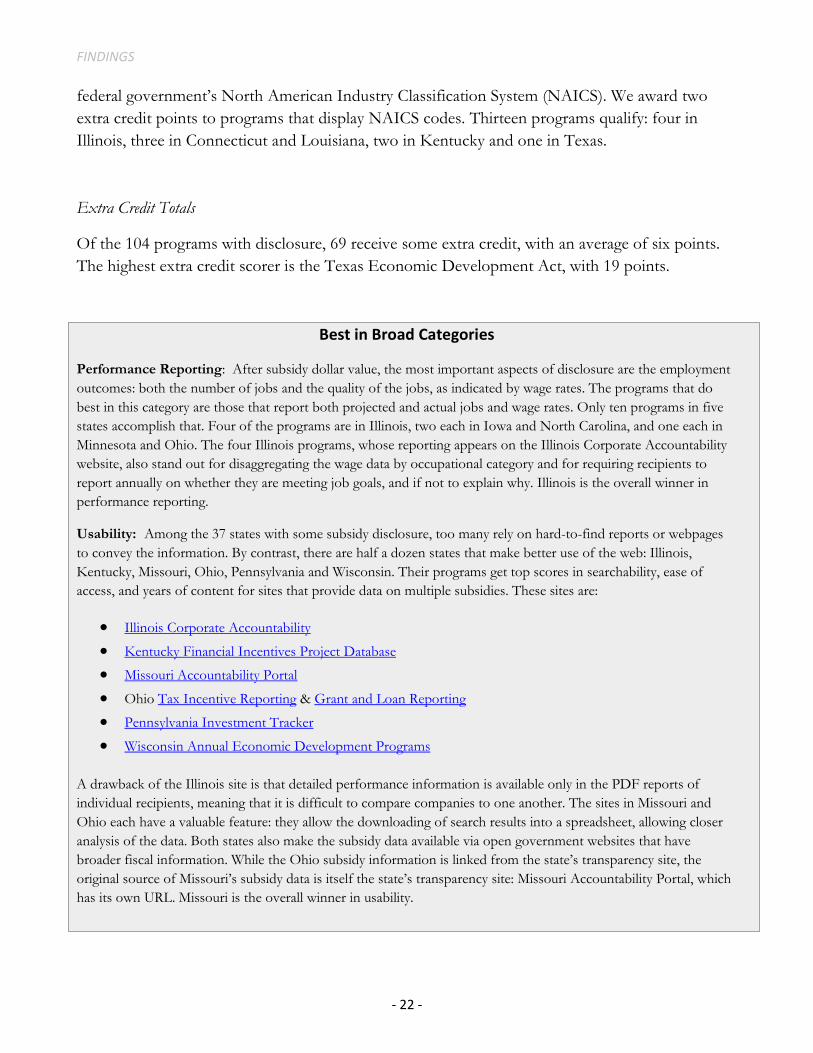
Extra Credit Totals
Of the 104 programs with disclosure, 69 receive some extra credit, with an average of six points. The highest extra credit scorer is the Texas Economic Development Act, with 19 points.
Best in Broad Categories
Performance Reporting: After subsidy dollar value, the most important aspects of disclosure are the employment outcomes: both the number of jobs and the quality of the jobs, as indicated by wage rates. The programs that do best in this category are those that report both projected and actual jobs and wage rates. Only ten programs in five states accomplish that. Four of the programs are in Illinois, two each in Iowa and North Carolina, and one each in Minnesota and Ohio. The four Illinois programs, whose reporting appears on the Illinois Corporate Accountability website, also stand out for disaggregating the wage data by occupational category and for requiring recipients to report annually on whether they are meeting job goals, and if not to explain why. Illinois is the overall winner in performance reporting.
Usability: Among the 37 states with some subsidy disclosure, too many rely on hard-to-find reports or webpages to convey the information. By contrast, there are half a dozen states that make better use of the web: Illinois, Kentucky, Missouri, Ohio, Pennsylvania and Wisconsin. Their programs get top scores in searchability, ease of access, and years of content for sites that provide data on multiple subsidies. These sites are:
• Illinois Corporate Accountability
• Kentucky Financial Incentives Project Database
• Missouri Accountability Portal
• Ohio Tax Incentive Reporting & Grant and Loan Reporting
• Pennsylvania Investment Tracker
• Wisconsin Annual Economic Development Programs A drawback of the Illinois site is that detailed performance information is available only in the PDF reports of individual recipients, meaning that it is difficult to compare companies to one another. The sites in Missouri and Ohio each have a valuable feature: they allow the downloading of search results into a spreadsheet, allowing closer analysis of the data. Both states also make the subsidy data available via open government websites that have broader fiscal information. While the Ohio subsidy information is linked from the state’s transparency site, the original source of Missouri’s subsidy data is itself the state’s transparency site: Missouri Accountability Portal, which has its own URL. Missouri is the overall winner in usability.

SHOW US THE SUBSIDIES
- 23 -
Chapter 3. Conclusions & Policy Recommendations
Our findings on state economic development subsidy reporting practices reveal two different stories. The first is one of the steady spread of transparency across the country. What a decade ago was a practice adopted by only a handful of states is now present to some degree in more than two-thirds of the country – actually a bit more, taking into account those states that have enacted recipient disclosure but not yet put it into effect.
The other story is the dozen or so states and the District of Columbia that still keep taxpayers in the dark about which companies are benefiting from subsidy spending. Some of these states – Nevada, for instance – not only fail to disclose recipient names; they do not even report the aggregate costs of their programs.
Moreover, even in those states that do have some recipient disclosure, the reporting often does not cover all key programs and omits vital pieces of information. That is why the average score among the states in our study with disclosure is dismally low.
The conclusion is clear: the accountability movement has made real advances but still has a long way to go before subsidies are as transparent as other categories of state finances. To aid that movement, we want to reiterate what we believe to be the most important elements of online subsidy reporting. Not surprisingly, these mirror our scoring system. We rated the states based on what we think ought to be disclosed.
Basic Subsidy Information
• For every company receiving subsidies, the public has the right to know how much it is receiving (both projected amounts and actual) from each program.
• The disclosure site should also contain copies of key documents such as approved applications (with truly proprietary data redacted) and signed agreements.
Identifying Information
• The public should be told the exact location of the subsidized facility, including street address and ZIP code.
• The full name of the recipient company should be presented, including an identifier such as a Dun’s number or a federal Employer Identification Number. An industry designation such as the federal government’s North American Industry Classification System (NAICS) is also helpful.

CONCLUSIONS & POLICY RECOMMENDATIONS
- 24 -
Employment Outcome Data
• The public needs to know how many jobs the recipient company proposed to create or retain and how many it actually did.
• There also needs to be information about the quality of those jobs. That means the projected wage rates of the positions and the actual pay levels achieved.
• In addition to broad average wage rates, which can be skewed by a few very highly paid employees, recipients should divide individual wage rates into ranges. Occupational breakdowns are also helpful.
Compliance Data
• Agencies that oversee subsidy programs should report on whether recipients have met job-creation and other targets. They should also report what the state agency has done (or not done) when recipients have failed to meet their projections. This is especially important when the agency has some kind of clawback policy that would permit the recoupment of funds, or a rescission policy for the cancellation of future subsidies.10
Currency and Depth of Data
• Ideally, agencies should be reporting new subsidies as they are approved. Otherwise, the information should be as up to date as possible. Reporting websites should not present only recent information; data from previous years should also be readily available.
Location and Form of Data
• Subsidy recipient disclosure should take place via websites that are easy to find and easy to use. The current practice by many states of burying data in obscure PDF reports is no longer acceptable.
• Agencies should make use of up-to-date web technology to create databases that allow users to search disclosure information from all of its programs in a single place. In addition to creating user-friendly search engines, agencies should make it possible to download search results into a spreadsheet, so users can do more detailed analysis.
• Subsidy data should also be made available through the open government (or “Google government”) sites that many states have created to make general fiscal information more readily available to the public.
SHOW US THE SUBSIDIES
- 25 -
New Directions
Once they achieve the level of transparency provided by the preceding recommendations, states should consider giving taxpayers even more information about the subsidies that are being given out and the companies that are receiving them.
For example, states could consider mapping the geographic distribution of subsidies to see if they match up with patterns of economic need, based on unemployment rates, business closures and other factors. In other words, are subsidies helping to bring economic activity and employment opportunities to communities that need them the most?
Also, taxpayers should be told more about subsidy recipients. For example, it would be useful to have access to consolidated data on whether a company is living up to its job-creation promises in all of the subsidy deals it has with the state. In addition, taxpayers should know about other dealings the company has with the state. One should be able to see, for example, data on state procurement contracts a subsidy recipient has received. There should also be links to data on state campaign contributions and lobbying expenditures by the company and its executives.
The public should also know about the track record of subsidy recipients regarding compliance with environmental, workplace and other government regulation. In some cases, individual companies are receiving hundreds of millions of dollars in state tax breaks or other subsidies. The public has a right to know whether these firms are law-abiding. Ideally, this information should also be reported when a company applies for a major discretionary subsidy, so the public can comment.
Secrecy in economic development is no longer acceptable. The use of job subsidies remains a highly controversial practice, and taxpayers have every right to see costs and benefits. This way, the public can reach informed views on the subject and seek to alter government policies as they see fit.

- 26 -
Endnotes
1. For profiles of more than 100 major subsidy deals, see the Accountable USA feature of the Good Jobs First website. A list of the profiles can be found at http://www.goodjobsfirst.org/deal-profile-index. 2. For profiles of each state’s subsidy practices, see the Accountable USA section of the Good Jobs First website at http://www.goodjobs.org/accountable-usa. 3. For an overview of which states have which types of subsidies, see the Site Selection magazine compilation at http://www.siteselection.com/issues/2009/nov/State-Incentives/0911IncentiveChartsNotes.pdf. There is no authoritative figure on the total cost of these subsidies. Estimates from about a decade ago put the amount at about $50 billion annually. See Kenneth Thomas, Competing for Capital: Europe and North America in a Global Era (Georgetown University Press, 2000) as well as Peter Fisher and Alan Peters, “The Failures of Economic Development Incentives,” Journal of the American Planning Association, Winter 2004. 4. For a wide-ranging critique of development subsidies, see Greg LeRoy, The Great American Jobs Scam: Corporate Tax Dodging and the Myth of Job Creation (Berrett-Koehler Publishers, 2005); http://www.greatamericanjobsscam.com/. 5. For an overview of these reforms, see the Good Jobs First Web site: http://www.goodjobsfirst.org. 6 . The State Business Finance & Incentives Resource Center can be found at http://www.stateincentives.org/; the State Capital Group’s Incentives for Business 50 State Handbook can be found at http://www.statecapitalgroup.org/newspublications/IncentivesforBusinesses.pdf 7. For an assessment of these Google government sites, see: U.S. PIRG, Following the Money: How the 50 States Rate in Providing Online Access to Government Spending Data (April 2010); http://www.uspirg.org/home/reports/report-archives/tax--budget-policy/tax--budget-policy--reports/following-the-money-how-the-50-states-rate-in-providing-online-access-to-government-spending-data 8. The Missouri Accountability Portal can be found at http://mapyourtaxes.mo.gov/MAP/TaxCredits/ and the Oklahoma OpenBook site at http://www.ok.gov/okaa/Search_OpenBooks/index.html. 9. Missouri: http://mapyourtaxes.mo.gov/MAP/Portal/Default.aspx; Ohio: http://Transparency.ohio.gov; Kentucky: http://opendoor.ky.gov/Pages/default.aspx; Oklahoma: http://www.ok.gov/okaa/index.html; Alabama: http://open.alabama.gov/ (click on Community Colleges) 10. Clawback use is spreading. See, for example, the Good Jobs First blog post at http://clawback.org/2009/12/15/clawback-enforcement-trend/ and the January 2010 Associated Press story that appeared in many newspapers, including http://www.theoaklandpress.com/articles/2010/01/04/news/doc4b400b24e9989158074696.txt?viewmode=fullstory Good Jobs First plans to produce a national survey of state clawback practices in 2011.
- 27 -
Acknowledgements
The research on which this report relies was supported by the Ford Foundation and Open Society Foundations.
We also thank the following organizations that provided valuable help in the preparation of this report and related material (but are not responsible for any remaining errors): Alabama Arise; Alaska Center for Public Policy; Alaska Common Ground; Arizona PIRG; Arkansas Advocates for Children and Families; California Budget Project; California Labor Federation; CALPIRG; Center for Public Policy Priorities; Center for Tax and Budget Accountability; Center on Policy Initiatives; Center on Wisconsin Strategy (COWS); Children's Action Alliance; Colorado Fiscal Policy Institute; Colorado Progressive Coalition; Common Cause Massachusetts; Common Cause Pennsylvania; The Commonwealth Institute for Fiscal Analysis; Connecticut Voices for Children; CoPIRG; EARN; Economic Opportunity Institute; Equality State Policy Center; Fiscal Policy Institute; Florida PIRG; FRESC/Good Jobs Strong Communities; Georgia Budget and Policy Institute; Good Jobs New York; Hawaii State AFL-CIO; Doug Hoffer; Idaho Center on Budget and Tax Policy; Illinois PIRG; Indiana Community Action Association; Institute for Wisconsin's Future; Institute on Taxation and Economic Policy; Iowa Policy Project/Iowa Fiscal Partnership; JOBS NOW Coalition; Kansas Action for Children; Kentuckians for the Commonwealth; Kentucky Youth Advocates; Keystone Research Center; LAANE; LANO/Louisiana Budget Project; Maine Center for Economic Policy; Maryland Budget and Tax Policy; Maryland PIRG; Massachusetts Budget and Policy Center; MASSPIRG; Michigan League for Human Services; Minnesota Budget Project; Minnesota Citizens for Tax Justice; Mississippi Economic Policy Center; Missouri Budget Project; Montana Budget and Policy Center; Mountain Association for Community Economic Development; Nebraska Appleseed Center for Law; Nebraskans for Peace; New Hampshire Fiscal Policy Institute; New Jersey Policy Perspective; New Mexico Voices for Children; North Carolina Institute for Constitutional Law; North Carolina Justice Center; North Dakota Center for Public Good; Oklahoma Policy Institute; One Massachusetts; Oregon Center for Public Policy; OSPIRG; PennPIRG; Policy Matters Ohio; Poverty Institute; Progressive Leadership Alliance of Nevada; Progressive States Network; Public Assets Institute; Research Institute on Social and Economic Policy; South Carolina Fair Share; South Carolina Progressive Network; SouthWest Organizing Project; Tax Fairness Oregon; Tennesseans for Fair Taxation; Tennessee AFL-CIO; Texans for Public Justice; TexPIRG; United for a Fair Economy; USPIRG; Voices for Children in Nebraska; Voices for Utah Children; Washington State Budget & Policy Center; Washington State Labor Council; West Virginia Center on Budget and Policy; Wisconsin Council on Children and Families; WISPIRG; Marty Wolfson.
We also thank the numerous public officials around the country who assisted us in our research for this report.

SHOW US THE SUBSIDIES
- A-1 -
Appendix A: Sample Scoring Sheet
Show Us the Subsidies: Scoring Details for State Programs
Maximum possible score for category
Program’s actual score for category
Score criteria
Subsidy Value
Not disclosed (0 pts)
40 Either amount approved OR actual amount disbursed/claimed (30 pts)
BOTH amount approved AND actual amount disbursed/claimed (40 pts) Location
of subsidized
facility
Not disclosed (0 pts)
15 ONLY locality (city/county/other political jurisdiction) (5 pts)
Locality AND street address (15 pts)
Jobs/ training
outcomes
Not disclosed (0 pts) 15 (if BOTH promised
and actual reported)
Number of jobs or training slots promised/projected (5 pts)
Actual number of jobs created/retained or trainings completed (10 pts) Wage rates/ payroll
outcomes
Not disclosed (0 pts) 15 (if BOTH promised
and actual reported)
Wage rates/payroll promised/projected (5 pts)
Actual wage rates/payroll (10 pts) Available year(s) of recipient
data
Earlier than 2005 only or unknown (0 pts) 5 (at least 1 year from
‘05-‘08 AND ‘09-‘10)
2005, 2006, 2007 and/or 2008 only (2 pts)
2009 and/or 2010 only (3 pts) Search-
ability of recipient
list
Unsearchable (0 pts)
5 CTRL-F searchable in HTML or PDF (2 pts)
Search engine or downloadable spreadsheet (5 pts)
Ease of access
Source difficult to find (0 pts)
5 Listed in annual report or other obvious location (2 pts)
Separate, clear disclosure site (5 pts)
Total before extra credit 100 Extra credit categories Maximum
possible Program is most costly among those reviewed (7 pts); second most costly (5 pts) 7 Copies of approved applications or signed agreements available on website 4 Compliance or performance reports available on website 4 Wage data disaggregated 4 Data contained in open government website providing wider fiscal data 2 Recipient Dun’s or Employer Identification Number (EIN) provided 2 Recipient NAICS industry code provided 2 Total extra credit 25 TOTAL AFTER EXTRA CREDIT 125
SHOW US THE SUBSIDIES
-B-1-
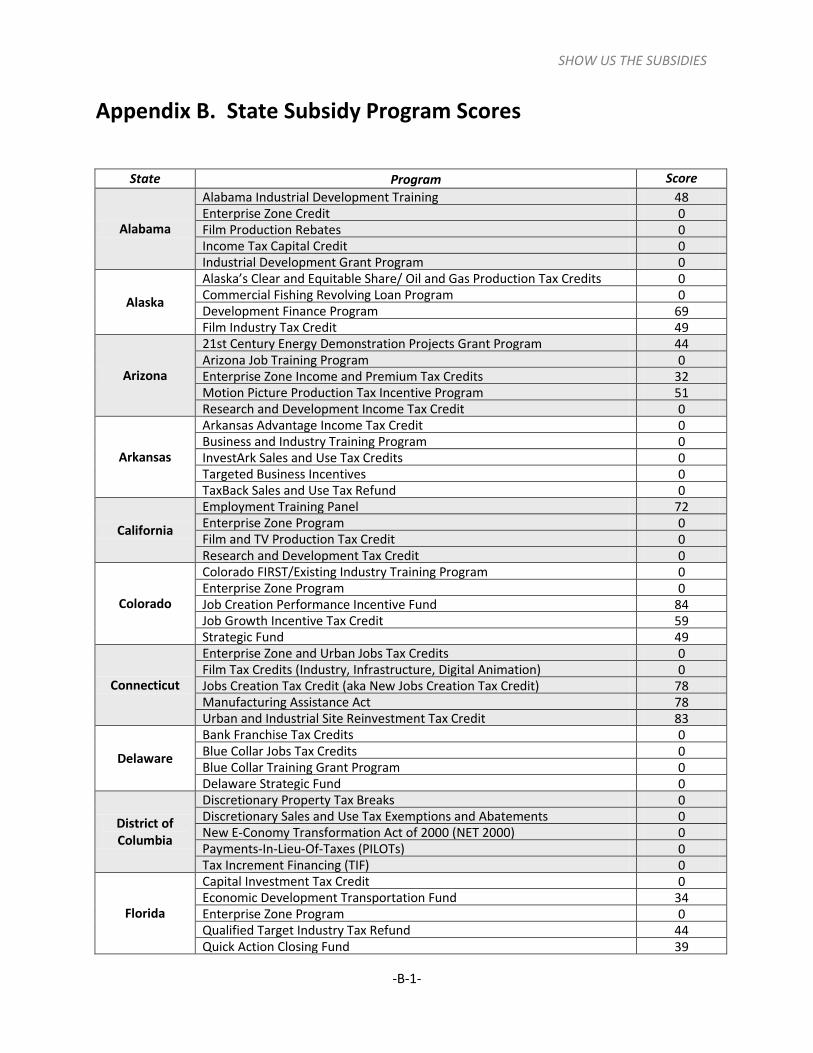
Appendix B. State Subsidy Program Scores
State Program Score
Alabama
Alabama Industrial Development Training 48 Enterprise Zone Credit 0 Film Production Rebates 0 Income Tax Capital Credit 0 Industrial Development Grant Program 0
Alaska
Alaska’s Clear and Equitable Share/ Oil and Gas Production Tax Credits 0 Commercial Fishing Revolving Loan Program 0 Development Finance Program 69 Film Industry Tax Credit 49
Arizona
21st Century Energy Demonstration Projects Grant Program 44 Arizona Job Training Program 0 Enterprise Zone Income and Premium Tax Credits 32 Motion Picture Production Tax Incentive Program 51 Research and Development Income Tax Credit 0
Arkansas
Arkansas Advantage Income Tax Credit 0 Business and Industry Training Program 0 InvestArk Sales and Use Tax Credits 0 Targeted Business Incentives 0 TaxBack Sales and Use Tax Refund 0
California
Employment Training Panel 72 Enterprise Zone Program 0 Film and TV Production Tax Credit 0 Research and Development Tax Credit 0
Colorado
Colorado FIRST/Existing Industry Training Program 0 Enterprise Zone Program 0 Job Creation Performance Incentive Fund 84 Job Growth Incentive Tax Credit 59 Strategic Fund 49
Connecticut
Enterprise Zone and Urban Jobs Tax Credits 0 Film Tax Credits (Industry, Infrastructure, Digital Animation) 0 Jobs Creation Tax Credit (aka New Jobs Creation Tax Credit) 78 Manufacturing Assistance Act 78 Urban and Industrial Site Reinvestment Tax Credit 83
Delaware
Bank Franchise Tax Credits 0 Blue Collar Jobs Tax Credits 0 Blue Collar Training Grant Program 0 Delaware Strategic Fund 0
District of Columbia
Discretionary Property Tax Breaks 0 Discretionary Sales and Use Tax Exemptions and Abatements 0 New E-Conomy Transformation Act of 2000 (NET 2000) 0 Payments-In-Lieu-Of-Taxes (PILOTs) 0 Tax Increment Financing (TIF) 0
Florida
Capital Investment Tax Credit 0 Economic Development Transportation Fund 34 Enterprise Zone Program 0 Qualified Target Industry Tax Refund 44 Quick Action Closing Fund 39

APPENDIX B: PROGRAM SCORES
-B-2-
State Program Score
Georgia
Investment Tax Credit 0 Job Tax Credit 0 Mega Project Tax Credit 0 OneGeorgia EDGE (Economic Development, Growth and Expansion) Fund 0 Quality Jobs Tax Credit 0
Hawaii
Capital Goods Excise Tax Credit 0 Employment and Training Fund Statewide Training Grants 0 Enterprise Zones 11 Film & Digital Media Income Tax Credit (Act 88) 0 High-Technology Tax Credits (Act 221/ACT 215) 10
Idaho
3% Investment Income Tax Credit 0 New Jobs Income Tax Credit 0 Production Equipment and Supplies Sales Tax Exemption 0 Research and Development Activity Income Tax Credit 0 Workforce Development Training Fund Program 0
Illinois
Economic Development for a Growing Economy (EDGE) Tax Credit 105 Enterprise Zone Program 107 Film Production Services Tax Credit 0 IDOT Economic Development Program 100 Large Business Development Assistance Program 100
Indiana
Economic Development for a Growing Economy (EDGE) Tax Credits 60 Enterprise Zone Program 0 Hoosier Business Investment Tax Credit (HBITC) 62 Skills Enhancement Fund (SEF) 55 Twenty-First Century Research and Technology Fund (21 Fund) 55
Iowa
Enterprise Zone (Business Only) 77 Film, Television, and Video Project Promotion Program 0 High Quality Job Creation Program 77 Industrial New Jobs Training Program (260E) 0 Research Activities Credit (RAC) 42
Kansas
Business Machinery and Equipment Credit 0 High Performance Incentive Program (HPIP) 0 Investments in Major Projects and Comprehensive Training Program
0
Kansas Economic Opportunity Initiatives Fund 0 Promoting Employment Across Kansas (PEAK) Program 0
Kentucky
Bluegrass State Skills Corporation 77 Coal Used in the Manufacture of Electricity 0 Kentucky Business Investment (KBI) Program 74 Kentucky Enterprise Initiative Act 74 Machinery for New and Expanded Industry and Certain Industrial
0
Louisiana
Enterprise Zones 69 Industrial Tax Exemption Program 76 Motion Picture Investor Tax Credit 0 Purchases of Manufacturing Machinery and Equipment Exemption 0 Quality Jobs Program 69
Maine
Business Equipment Tax Reimbursement Program 47 Employment TIF 0 Governor's Training Initiative 44 Pine Tree Development Zones 0 Research Expense Tax Credits and Super R&D Tax Credit 0

SHOW US THE SUBSIDIES
-B-3-
State Program Score
Maryland
Enterprise Zone - Real Property Tax Credits 0 Job Creation Tax Credit 22 Maryland Economic Development Assistance Authority Fund, MEDAAF 1 &
52 One Maryland Tax Credit 0 Sunny Day Fund 76
Massachusetts
Economic Development Incentive Program 0 Film Tax Credit 0 Investment Tax Credit 0 Job Creation Incentive Program (Jobs Incentive Payment for Biotechnology
0
Research Tax Credit 0
Michigan
Brownfield Redevelopment Credits (aka Brownfield Zone Credits) 58 Film Tax Credits 54 Michigan Economic Growth Authority (MEGA) Tax Credits 58 Michigan's Advanced Battery Credits (MABC) 65 Renaissance Zone Program 0
Minnesota
Business Development Public Infrastructure Grant Program 0 Job Opportunity Building Zones (JOBZ) 70 Job Skills Partnership Program 74 Minnesota Investment Fund 0 Research and Development Tax Credits 0
Mississippi
Advantage Jobs Incentive Program 0 Jobs Tax Credit 0 Major Economic Impact Act 0 Manufacturing Investment Tax Credit 0 Rural Economic Development (RED) Credits 0
Missouri
Business Use Incentives for Large-scale Development (BUILD) 52 Film Production Tax Credit 47 New Jobs Training 47 Quality Jobs Program 89 Rebuilding Communities 47
Montana
Big Sky Economic Development Trust Fund 54 Oil and Natural Gas Production Tax Exemptions 0 Primary Sector Workforce Training Grant 59 Qualified Research Credit 0
Nebraska
Customized Job Training 0 Employment and Investment Growth Act 26 Manufacturing Machinery and Equipment Exemption 0 Nebraska Advantage 19
Nevada
Modified Business Tax Abatement 0 Personal Property Tax Abatement 0 Sales and Use Tax Abatement 0 Train Employees Now 0
New Hampshire
Community Development Investment Program (Investment Tax Credit) 14 Economic Revitalization Zone Tax Credits 0 Job Training Fund 49 Research and Development Credit 0
New Jersey
Business Employment Incentive Program (BEIP) 74 Business Retention and Relocation Assistance Grant (BRRAG) 59 Economic Redevelopment Growth (ERG) Grant Program 0 Research and Development Tax Credits 0 Urban Enterprise Zone Program 0

APPENDIX B: PROGRAM SCORES
-B-4-
State Program Score
New Mexico
Film Tax Credit 0 High Wage Jobs Tax Credit 0 Industrial Revenue Bonds 0 Manufacturer's Investment Tax Credit 0 Tax Increment Development Districts 0
New York
Brownfield Cleanup Program 57 Empire State Film Production Credit 0 Empire Zone Program 0 Excelsior Jobs Program 0 Industrial Development Agencies 64
North Carolina
Credit for Qualifying Expenses of a Production Company 52 Job Development Investment Grants (JDIG) 93 One North Carolina Fund 88 Tax Credits for New and Expanding Businesses (Article 3J Credits) 49 William S. Lee Quality Jobs and Business Expansion Act (Article 3A) 64
North Dakota
Development Fund – PACE loans and Regional Rural Revolving Loan Fund 62 Income Tax Exemption for New or Expanding Businesses 0 New Jobs Training 0 Renaissance Zones 0 Wage and Salary Credit 0
Ohio
Community Reinvestment Area (CRA) Program 81 Job Creation Tax Credit 64 Job Retention Tax Credit 57 Ohio Workforce Guarantee 62 Rapid Outreach Program 67
Oklahoma
21st Century Quality Jobs 0 Investment/New Jobs Tax Credit 49 Opportunity Fund 0 Quality Jobs 59 Training for Industry 0
Oregon
Business Energy Tax Credit (BETC) 0 Employer Workforce Training Fund/Governor's Strategic Training Fund 0 Oregon Production Investment Fund 0 Research Tax Credit 0 Strategic Investment Program 0
Pennsylvania
Film Production Tax Credit 57 Job Creation Tax Credit 55 Keystone Opportunity Zone (KOZ) Program 0 Opportunity Grant Program 55 Research and Development Tax Credit 47
Rhode Island
Corporate Income Tax Rate Reduction for Job Creation 61 Enterprise Zone Tax Credits 54 Job Training Tax Credit 9 Manufacturing and High Performance Manufacturing Investment Tax
0
Motion Picture Production Tax Credit 54
South Carolina
Economic Impact Zone Investment Credit 0 Job Development Credits 0 Job Tax Credit 0 readySC 0 Research & Development Credit 0

SHOW US THE SUBSIDIES
-B-5-
State Program Score
South Dakota
Pooled Bond Program 0 Revolving Economic Development and Initiative (REDI) Fund 51 South Dakota Agricultural Processing and Export Loan Program (APEX) 0 Workforce Development Program 0
Tennessee
FastTrack Job Training Assistance 0 Headquarters Tax Credit 0 Jobs Tax Credit 0 Sales and Use Tax Credit for Qualified Facility to Support an Emerging
0
Tennessee Job Skills 0
Texas
Tax Refund for Economic Development 0 Texas Economic Development Act 106 Texas Emerging Technology Fund (ETF) 47 Texas Enterprise Fund (TEF) 61 Texas Moving Image Industry Incentive Program 0
Utah
Economic Development Tax Increment Financing 61 Industrial Assistance Fund 54 Motion Picture Incentive Fund (MPIF) & Other Film Incentives 0 Targeted Business Tax Credits 9
Vermont
Economic Advancement Tax Incentives (EATI) 41 Vermont Employment Growth Incentive (VEGI) 49 Vermont Training Program 0 VT Economic Development Authority loans 51 Workforce Education and Training Fund 54
Virginia
Enterprise Zone Real Property Investment Grant 0 Governor's Opportunity Fund (GOF) 71 Major Business Facility Job Tax Credit 0 Virginia Economic Development Incentive Grant (VEDIG) 0 Virginia Investment Partnership (VIP) & Major Eligible Employer Grant
47
Washington
Aircraft Pre-production Expenditures B&O Tax Credit 51 High Technology B&O Tax Credit for R&D Spending 47 High Technology Sales and Use Tax Deferral/Waiver 49 Motion Picture ‘Contributions’ B&O Tax Credit 0 New Jobs in Rural Counties and CEZ Tax Credit 0
West Virginia
Economic Opportunity Tax Credit 0 Film Industry Investment Act 0 Governor’s Guaranteed Workforce Training Fund 59 Manufacturing Investment Tax Credit 0 Strategic R&D Tax Credit 0
Wisconsin
Customized Labor Training Fund 69 Economic Development Tax Credit Program 76 Film Tax Credit Program (Film Production Services & Production Company
74
Major Economic Development Program (MED) 69 Transportation Economic Assistance Program (TEA) 69
Wyoming
Data Processing Center – Sales/Use Tax Exemption 0 Film Industry Financial Incentive 0 Sales and Use Tax Exemption for Purchases of Manufacturing Equipment 0 Workforce Development Training Fund 0