Shout NFA Build To Save Report Launch 17 June 2015
49
BUILDING NEW SOCIAL RENT HOMES Report launch 17 June 2015 Abbey Community Centre #BuildtoSave
-
Upload
tim-morton -
Category
Economy & Finance
-
view
2.241 -
download
0
Transcript of Shout NFA Build To Save Report Launch 17 June 2015

B U I L D I N GN E W S O C I A LR E N T H O M E S
Report launch
17 June 2015Abbey Community Centre
#BuildtoSave

W E L C O M E
Martin WheatleySHOUT

Report Launch
17 June 2015
Abbey Community Centre
#BuildtoSavewifi password: 2920b14e7c (case sensitive, 4th character is numeral zero)

Programme
Welcome Martin Wheatley, SHOUT
Presentation Mark Pragnell, Head of Commissioned Projects, Capital Economics
Panel Kate Allen, Property Correspondent, Financial TimesMark Winterburn, Researcher, Centre for Social JusticeOphelia Bobori, Board Member and resident, Lewisham HomesLigia Teixeira, Head of Research, Crisis
Discussion
Close Chloe Fletcher, Policy Director, National Federation of ALMOs

Report Sponsors
Bushbury Hill Estate Management BoardCampbell TickellCoast & CountryContour HomesEMH GroupEndeavour Housing Association/North Star GroupGrand Union Housing GroupHuman City Institute
Leeds and Yorkshire Housing AssociationLeicestershire & Rutland Tenant Participation ForumLiverpool Housing TrustLuminus GroupRiversideSoha HousingSouth Liverpool HomesSouth Yorkshire Housing AssociationThrive Homes Wellingborough Homes

Designer

Getting online
Wifi password: 2920b14e7c (case sensitive, 4th character is numeral zero)
Report url
http://www.4socialhousing.co.uk/research

P R E S E N T A T I O NO F T H E R E P O R T
Mark PragnellCapital Economics

Fiscal myopia and the housing crisis
Building new social rent homes report launchAbbey Community Centre, 17 June 2015

Fiscal myopia and the housing crisis
Justin Chaloner, Alexandra Dreisin & Mark PragnellAbbey Community Centre, 17 June 2015

Thanks
• SHOUT• National Federation of ALMOs• Creative Bridge

Objective
• To highlight some of the key themes and findings of our new report, Building new social rent homes

Agenda
• Back to basics on “investment”
• Fiscal arithmetic of Housing Benefit
• An opportunity to unlock new housing?

Agenda
• Back to basics on “investment”
• Fiscal arithmetic of Housing Benefit
• An opportunity to unlock new housing?


£0
£10
£20
£30
£40
£50
£60
£70
£80
£90
£100
0 1 2 3 4 5 6 7 8 9 10
Expected future profits without investment
Additional profit resulting from the investment
Businesses invest for direct financial benefit
Revenues
Costs
New costs

£0
£10
£20
£30
£40
£50
£60
£70
£80
£90
£100
0 1 2 3 4 5 6 7 8 9 10
Businesses invest for direct financial benefit
Revenues
Costs
New revenues


Public sector “investment” is less clear cut
Government investment doesn’t have to have a direct financial benefit for the government itself
• Assets that have a social benefit
• Assets that have an economic benefit
• Assets that have a fiscal benefit
Distinction is important to bond markets

Agenda
• Back to basics on “investment”
• Fiscal arithmetic of Housing Benefit
• An opportunity to unlock new housing?

Welfare bill is biggest chunk of public spending
Share of public sector expenditure on services by departmental group, 2013-14
Work and Pensions25%
NHS (Health)18%
Chancellor's Departments
14%Education
10%
Defence5%
Scotland5%
Business, Innovation and Skills
4%
Transport3%
Northern Ireland3%
Communities and Local Government
2%

And a third of ‘unprotected’ public expenditure
Share of unprotected departments public sector expenditure on services by largest fifteen unprotected departmental groups, 2013-14
05
10152025303540

With annual £24.4 billion bill for housing benefit
Nominal government expenditure on welfare, 2014-15 forecast (£ billions)
0
10
20
30
40
50
60
70
80
90
100
State pension Tax credits andchild benefit
Housing benefit Disabilitybenefits
Incapacitybenefits
Pension credit Unemploymentbenefits
Income support

Benefits increasingly paid to private landlords
Share of housing benefit claimants in Great Britain by tenure type and number of recipients in private rented sector (millions)
00.20.40.60.811.21.41.61.82
0%10%20%30%40%50%60%70%80%90%
100%
1995 2000 2005 2010 2014
Private rented sector tenants Registered social landlord tenantsLocal authority tenants Number of recipients in private rented sector
3331202024

Private tenants cost additional £1,100 a year
Real government expenditure on housing benefit in the United Kingdom, £ billions (2014-15 prices)
0123456789
10
1994-95 1999-00 2004-05 2009-10 2014-15
Private rented sector tenants Registered social landlord tenants Local authority tenants

Brent
Camden
OxfordMilton Keynes
Leeds
Leicester
North Devon
Gateshead
Allerdale

Leeds family could save Osborne £3k each year
Ultra-low income single parent with 3 children living in Leeds in a 3 bedroom home
£91 per week
Total annual savings to exchequer:
£2,966
Private rent
£152 per week
£511 per week
Rent
Total received benefits
Social rent
£454 per week
*Annual household income of £6,000

Savings in the south east generally higher
Zero income couple with 1 child living in Oxford in a 2 bedroom home
£111 per week
Total annual savings to exchequer:
£4,263
Private rent
£219 per week
£417 per week
Rent
Total received benefits
Social rent
£335 per week
*Annual household income of £0

And especially in London
Low income couple with 1 child living in Camden in a 2 bedroom home
£149 per week
Total annual savings to exchequer:
£7,988
Private rent
£390 per week
£384 per week
Rent
Total received benefits
Social rent
£231 per week
*Annual household income of £12,000

Although there are some counter examples
Ultra-low income single person aged 30 without children living in North Devon in a 1 bedroom home
£82 per week
Total annual savings to exchequer:
-£956
Private rent
£98 per week
£49 per week
Rent
Total received benefits
Social rent
£68 per week
*Annual household income of £6,000

Social homes would lower the welfare bill for 89 per cent of the
households claiming housing benefit in the private rented sector
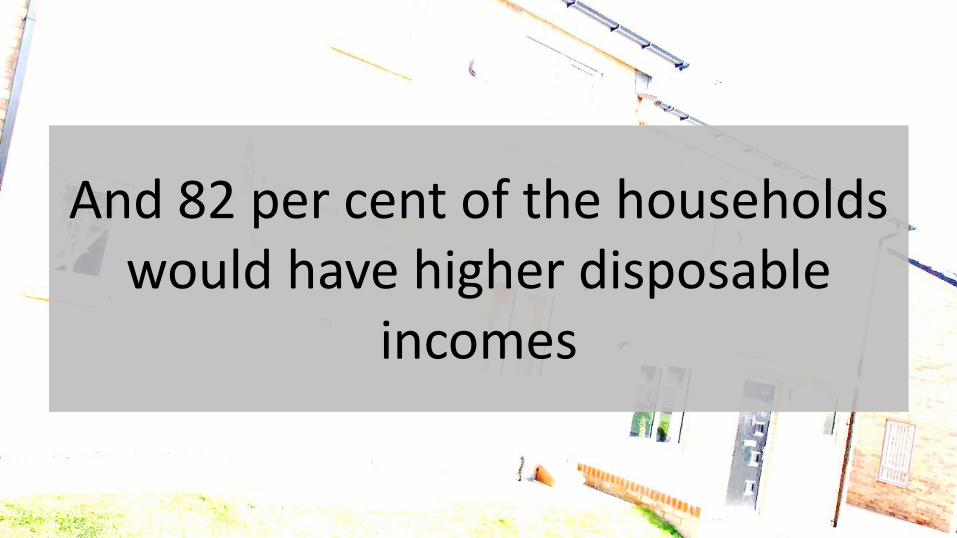
And 82 per cent of the households would have higher disposable
incomes

Agenda
• Back to basics on “investment”
• Fiscal arithmetic of Housing Benefit
• An opportunity to unlock new housing?

Around £150k to build a family home in Leeds
Building costs for a 3 bedroom home in Leeds, £ thousands
0
50
100
150
200
250
Construction Land

Social rent revenues leave a £40k funding gap
Building costs for a 3 bedroom home in Leeds, £ thousands
0
50
100
150
200
250
Construction Land
Potential sources of funding for a 3 bedroom home in Leeds, £ thousands
0
50
100
150
200
250
Social landlords Government
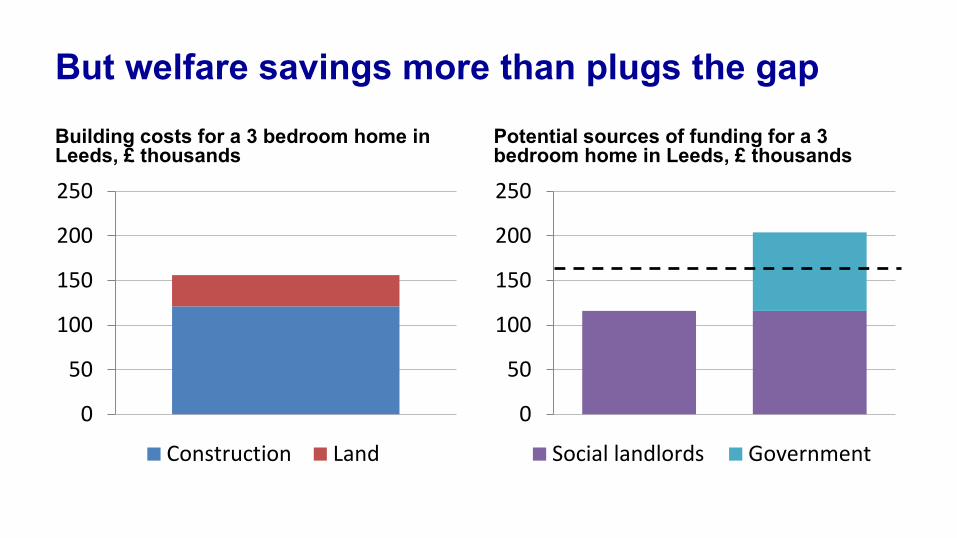
But welfare savings more than plugs the gap
Building costs for a 3 bedroom home in Leeds, £ thousands
0
50
100
150
200
250
Construction Land
Potential sources of funding for a 3 bedroom home in Leeds, £ thousands
0
50
100
150
200
250
Social landlords Government

Savings can change the arithmetic in the north .
Building costs for a 2 bedroom home in Gateshead, £ thousands
0
50
100
150
Construction Land
Potential sources of funding for a 2 bedroom home in Gateshead, £ thousands
0
50
100
150
Social landlords Government

as well as in the south of England
Building costs for a 3 bedroom home in Oxford, £ thousands
0
100
200
300
400
Construction Land
Potential sources of funding for a 3 bedroom home in Oxford, £ thousands
0
100
200
300
400
Social landlords Government

Welfare savings could be substantial in London
Building costs for a 4 bedroom home in Camden, £ thousands
0
100
200
300
400
500
Construction Land
Potential sources of funding for a 4 bedroom home in Camden, £ thousands
0
100
200
300
400
500
Social landlords Government

Welfare savings sufficient in 86% of cases
Building costs for a 4 bedroom home in Leicester, £ thousands
0
50
100
150
200
250
Construction Land
Potential sources of funding for a 4 bedroom home in Leicester, £ thousands
0
50
100
150
200
250
Social landlords Government

Of course, investment requires initial borrowing
-0.8
-0.6
-0.4
-0.2
0.0
0.2
0.4
Change in interest payments Reduced borrowing from increased tax revenuesWelfare savings Additional borrowing by local authorities and public corporationsAdditional borrowing by central government Net policy impact
Impact on annual public sector net borrowing as a percentage of nominal gross domestic product
Construction itself will boost economy and tax receipts

But City will recognise and appreciate the logic
Public sector net debt as a percentage of nominal gross domestic product
0102030405060708090
100
Current policy 100,000 pa policy
5.2 percentage points lower in 50 years
Only 0.5 percentage points higher in 2029-30
Lower in 2040-41

Agenda
• Back to basics on “investment”
• Fiscal arithmetic of Housing Benefit
• An opportunity to unlock new housing?

Conclusions
• Taxpayers’ money is being wasted keeping families in the most costly tenures
• Future savings in welfare spending are more than adequate to remunerate construction of social rent homes
• Basic arithmetic dictates investment in new homes today
• It is fiscal myopia to do otherwise

Fiscal myopia and the housing crisis
Justin Chaloner, Alexandra Dreisin & Mark PragnellAbbey Community Centre, 17 June 2015

P A N E L D I S C U S S I O N
Kate AllenProperty Correspondent, Financial Times
Mark WinterburnResearcher, Centre for Social Justice
Ophelia BoboriBoard Member and resident, Lewisham Homes
Ligia TeixeiraHead of Research, Crisis

F I N A L T H O U G H T S
Chloe FletcherPolicy Director
National Federation of ALMOs

B U I L D I N GN E W S O C I A LR E N T H O M E S
Report launch
17 June 2015Abbey Community Centre