Should Shrimp Farmers Pay Paddy Farmers? The Challenges of Examining Salinisation Externalities in...
21
Should Shrimp Farmers Pay Paddy Farmers? The Challenges of Examining Salinisation Externalities in South India L. Umamaheswari, K. Omar Hattab, P. Nasurudeen and P. Selvaraj Presented By Presented To Nusrat Jahan Mohammed Ziaul Haider, Ph.D Student No.: MSS 141503 Head Farhana Ferdousi Economics Discipline Student No.: MSS 141528 Khulna University Economics Discipline Khulna Khulna University Khulna
-
Upload
prudence-melton -
Category
Documents
-
view
224 -
download
1
Transcript of Should Shrimp Farmers Pay Paddy Farmers? The Challenges of Examining Salinisation Externalities in...
Should Shrimp Farmers Pay Paddy Farmers?The Challenges of Examining Salinisation
Externalities in South India L. Umamaheswari, K. Omar Hattab,
P. Nasurudeen and P. Selvaraj
Presented By Presented To
Nusrat Jahan Mohammed Ziaul Haider, Ph.D
Student No.: MSS 141503 Head
Farhana Ferdousi Economics Discipline
Student No.: MSS 141528 Khulna University
Economics Discipline Khulna
Khulna University
Khulna
Introduction
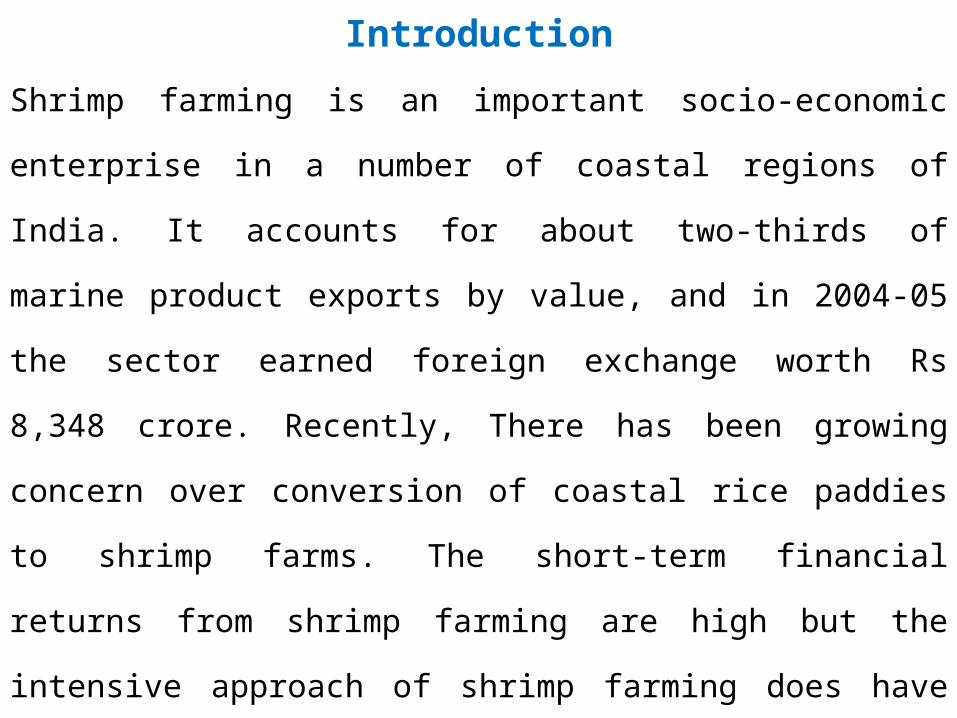
Shrimp farming is an important socio-economic enterprise in a number
of coastal regions of India. It accounts for about two-thirds of marine
product exports by value, and in 2004-05 the sector earned foreign
exchange worth Rs 8,348 crore. Recently, There has been growing
concern over conversion of coastal rice paddies to shrimp farms. The
short-term financial returns from shrimp farming are high but the
intensive approach of shrimp farming does have an environmental
impact which extends beyond the immediate farming zone. The use of
sea water along with freshwater for shrimp culture can cause salinisation
of land and groundwater and affect the productivity of agricultural crops.

Objective of the Study
This study examines whether there are major environmental externalities
associated with shrimp farms. In particular, the study asks:
What is the external cost of shrimp farm-induced salinisation of land
on paddy productivity?
This question is answered by carefully comparing paddy yields in two
similar villages in southern India, one affected by shrimp farms and the
other located further away from shrimp farms.
Study Area
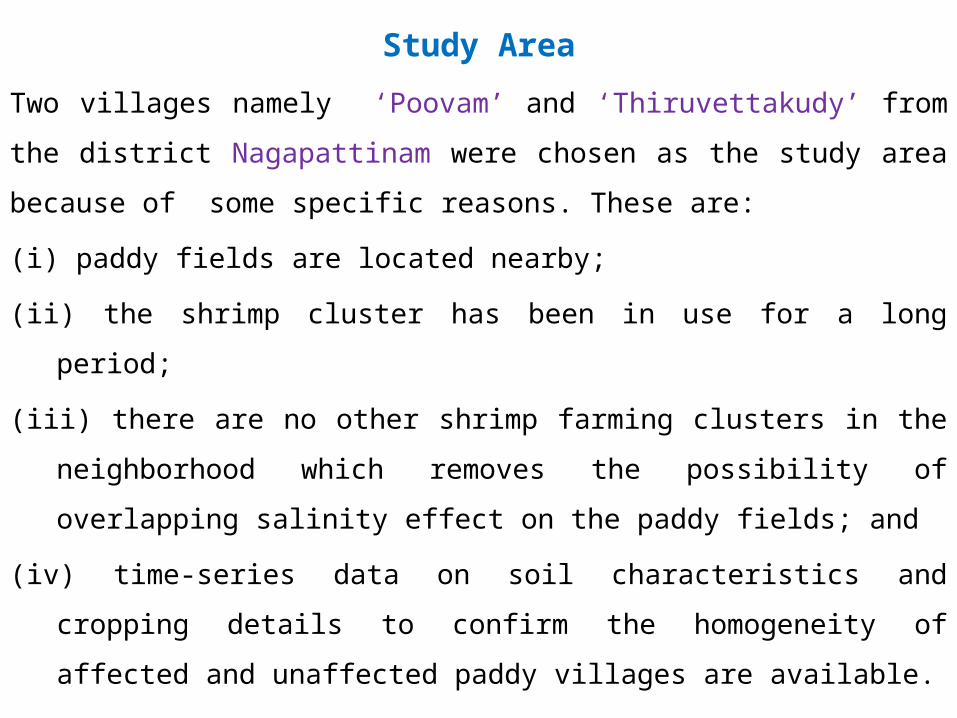
Two villages namely ‘Poovam’ and ‘Thiruvettakudy’ from the district
Nagapattinam were chosen as the study area because of some specific
reasons. These are:
(i) paddy fields are located nearby;
(ii) the shrimp cluster has been in use for a long period;
(iii) there are no other shrimp farming clusters in the neighborhood
which removes the possibility of overlapping salinity effect on the
paddy fields; and
(iv) time-series data on soil characteristics and cropping details to
confirm the homogeneity of affected and unaffected paddy villages
are available.
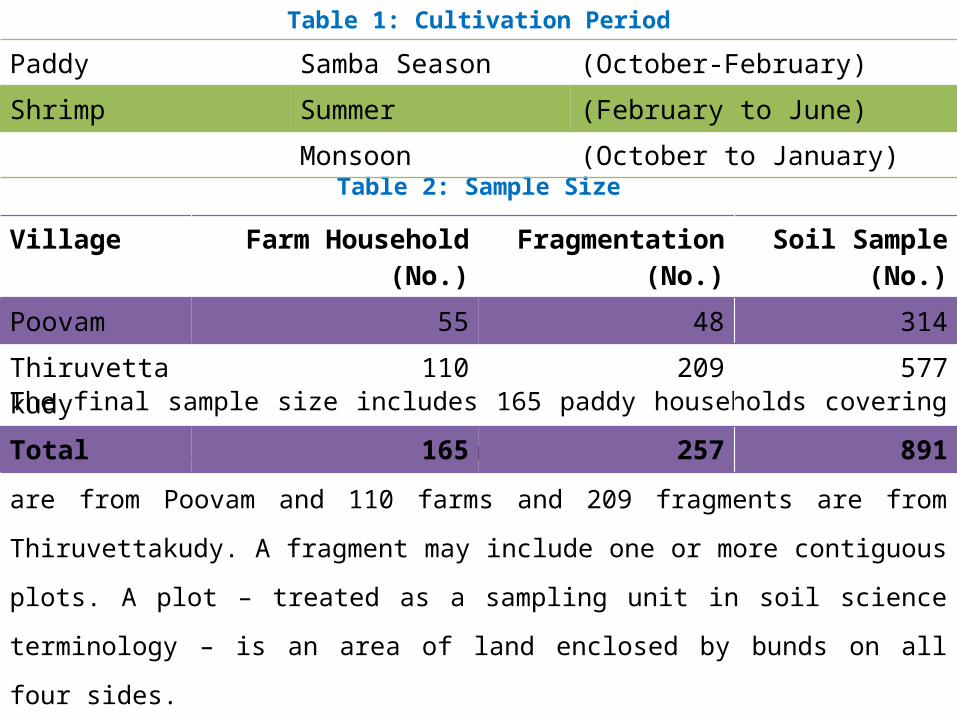
Table 1: Cultivation Period
Table 2: Sample Size
The final sample size includes 165 paddy households covering 257 fragments.
Of the total sample, 55 farms and 48 fragments are from Poovam and 110
farms and 209 fragments are from Thiruvettakudy. A fragment may include
one or more contiguous plots. A plot – treated as a sampling unit in soil
science terminology – is an area of land enclosed by bunds on all four sides.
Paddy Samba Season (October-February)
Shrimp Summer (February to June)
Monsoon (October to January)
Village Farm Household (No.) Fragmentation (No.) Soil Sample (No.)
Poovam 55 48 314
Thiruvettakudy 110 209 577
Total 165 257 891
Data CollectionThis study uses secondary data and survey data. Secondary data on
agro-climatic features, land use and cropping characteristics of the
study villages during the period 1990-91 to 2003-04 were collected to
confirm the homogeneity of paddy villages. Secondary data on soil
salinity in Poovam and Thiruvettakudy were collected from the Soil
Testing Laboratory to record the salinity during the pre-shrimp period
(1994-95) in the paddy villages. Soil salinity data for the post shrimp
period of 2002-03 for Thiruvettakudy were collected from the National
Agricultural Technology Project. Primary data from paddy farmers was
collected using a pre-tested interview schedule with questions on socio-
economic profile, input use, cost and returns from paddy cultivation,
and attitude towards shrimp farming.
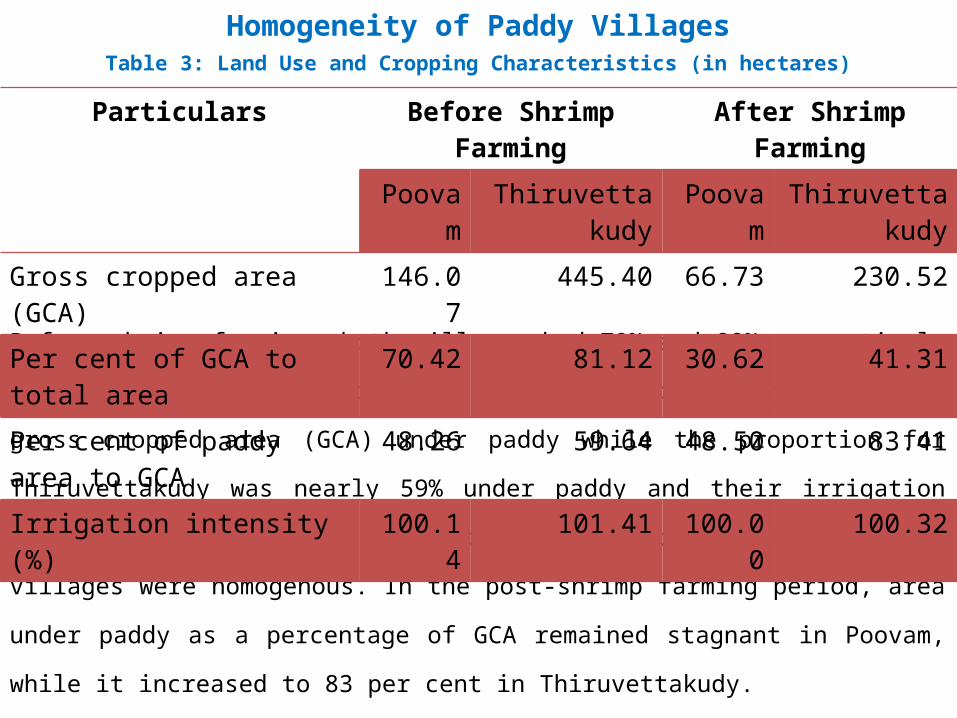
Homogeneity of Paddy VillagesTable 3: Land Use and Cropping Characteristics (in hectares)
Before shrimp farming, both villages had 70% and 80% respectively of
village lands under crops. Poovam had approximately 48% of its gross
cropped area (GCA) under paddy while the proportion for Thiruvettakudy
was nearly 59% under paddy and their irrigation intensity was similar. Thus
in terms of cropping pattern the two villages were homogenous. In the post-
shrimp farming period, area under paddy as a percentage of GCA remained
stagnant in Poovam, while it increased to 83 per cent in Thiruvettakudy.
Particulars Before Shrimp Farming After Shrimp Farming
Poovam Thiruvettakudy Poovam Thiruvettakudy
Gross cropped area (GCA) 146.07 445.40 66.73 230.52
Per cent of GCA to total area 70.42 81.12 30.62 41.31
Per cent of paddy area to GCA 48.26 59.64 48.50 83.41
Irrigation intensity (%) 100.14 101.41 100.00 100.32
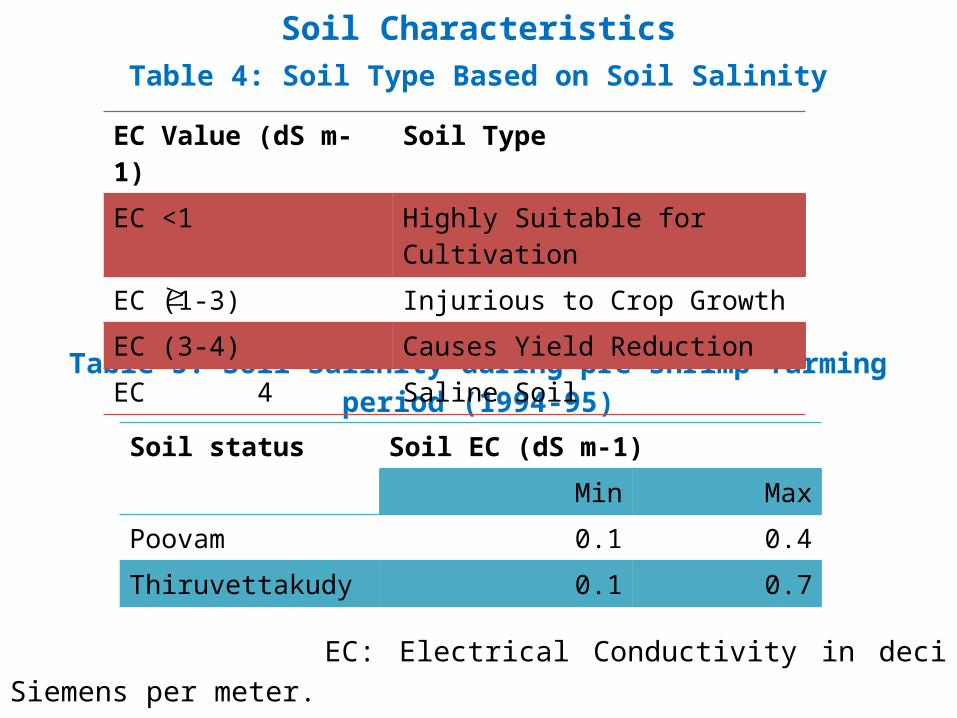
Soil CharacteristicsTable 4: Soil Type Based on Soil Salinity
Table 5: Soil Salinity during pre-shrimp farming period (1994-95)
EC: Electrical Conductivity in deci Siemens per meter.
Soil status Soil EC (dS m-1)
Min Max
Poovam 0.1 0.4
Thiruvettakudy 0.1 0.7
EC Value (dS m-1) Soil Type
EC <1 Highly Suitable for Cultivation
EC (1-3) Injurious to Crop Growth
EC (3-4) Causes Yield Reduction
EC 4 Saline Soil
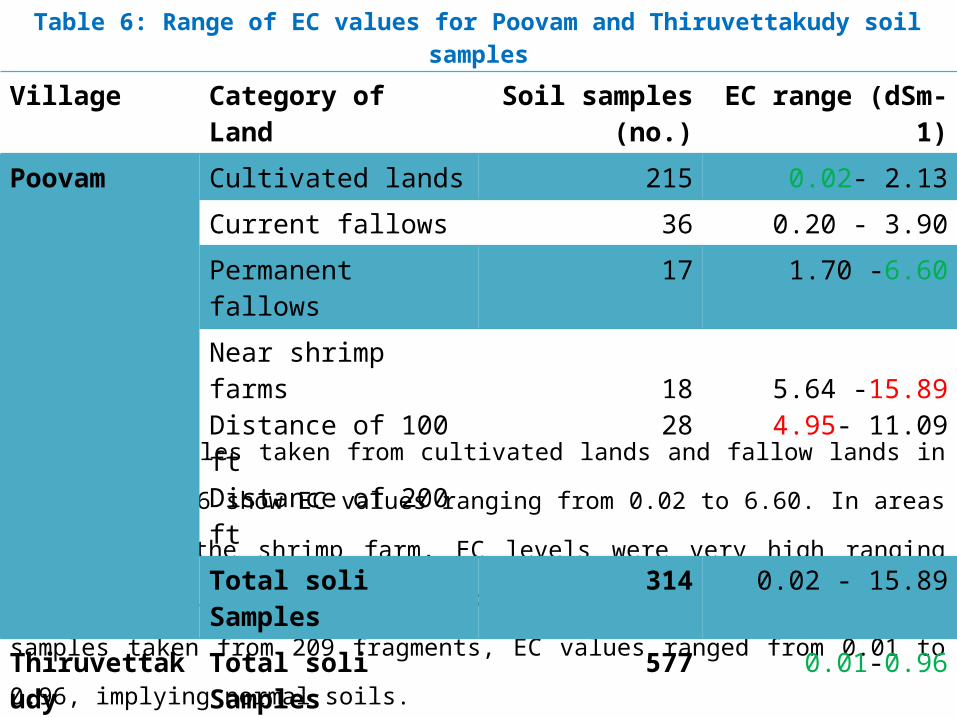
Table 6: Range of EC values for Poovam and Thiruvettakudy soil samples
The soil samples taken from cultivated lands and fallow lands in Poovam in
2006 show EC values ranging from 0.02 to 6.60. In areas adjacent to the
shrimp farm, EC levels were very high ranging from 4.95-15.89. In
Thiruvettakudy village, for the 577 soil samples taken from 209 fragments,
EC values ranged from 0.01 to 0.96, implying normal soils.
Village Category of Land Soil samples (no.) EC range (dSm-1)
Poovam Cultivated lands 215 0.02- 2.13
Current fallows 36 0.20 - 3.90
Permanent fallows 17 1.70 -6.60
Near shrimp farmsDistance of 100 ftDistance of 200 ft
1828
5.64 -15.894.95- 11.09
Total soli Samples 314 0.02 - 15.89
Thiruvettakudy
Total soli Samples 577 0.01-0.96
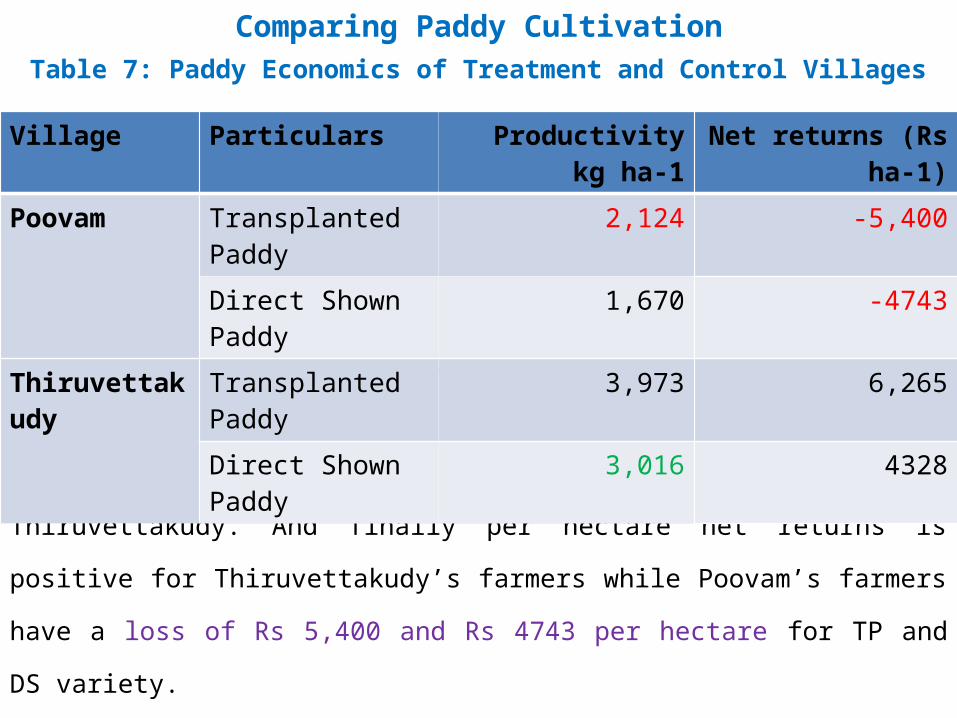
Comparing Paddy CultivationTable 7: Paddy Economics of Treatment and Control Villages
Productivity of both TP and DS is lower in Poovam comaperd to
Thiruvettakudy. Moreover, despite the significantly higher productivity
of TP variety, productivity of TP in Poovam is even lower than
productivity of DS in Thiruvettakudy. And finally per hectare net returns
is positive for Thiruvettakudy’s farmers while Poovam’s farmers have a
loss of Rs 5,400 and Rs 4743 per hectare for TP and DS variety.
Village Particulars Productivity kg ha-1 Net returns (Rs ha-1)
Poovam Transplanted Paddy 2,124 -5,400
Direct Shown Paddy
1,670 -4743
Thiruvettakudy
Transplanted Paddy 3,973 6,265
Direct Shown Paddy
3,016 4328
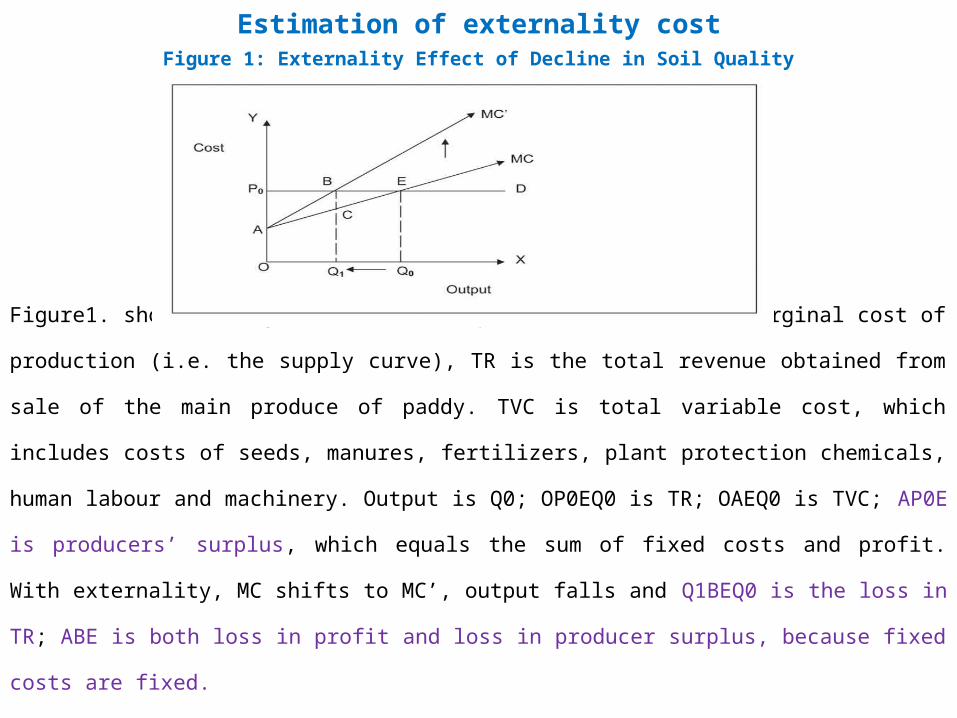
Estimation of externality costFigure 1: Externality Effect of Decline in Soil Quality
Figure1. shows that given the market price P0 and MC, the marginal cost of production
(i.e. the supply curve), TR is the total revenue obtained from sale of the main produce
of paddy. TVC is total variable cost, which includes costs of seeds, manures,
fertilizers, plant protection chemicals, human labour and machinery. Output is Q0;
OP0EQ0 is TR; OAEQ0 is TVC; AP0E is producers’ surplus, which equals the sum of
fixed costs and profit. With externality, MC shifts to MC’, output falls and Q1BEQ0 is
the loss in TR; ABE is both loss in profit and loss in producer surplus, because fixed
costs are fixed.
Factors Causing Soil Salinity
What is the link between salinity in soil and shrimp farming?
In general, the intensity of salinity is influenced by factors like soil type,
topography and location of fields. In the study area, the soil type varies from
sandy to sandy clay but the subsurface texture is sandy throughout.
To examine the link between soil salinity in the farm fragments and shrimp farms,
mean EC was regressed on distance variables and a village dummy. All the
distance variables were highly collinear, hence, in the final model, all distance
variables were dropped other than distance to shrimp farm. The salinity regression
analysis shows that mean EC is positively and significantly influenced by distance
from shrimp farms and the village dummy. The significance of the dummy
variable for Poovam suggests farms in Poovam are more saline than farms in
Thiruvettakudy.
Production Function Analysis
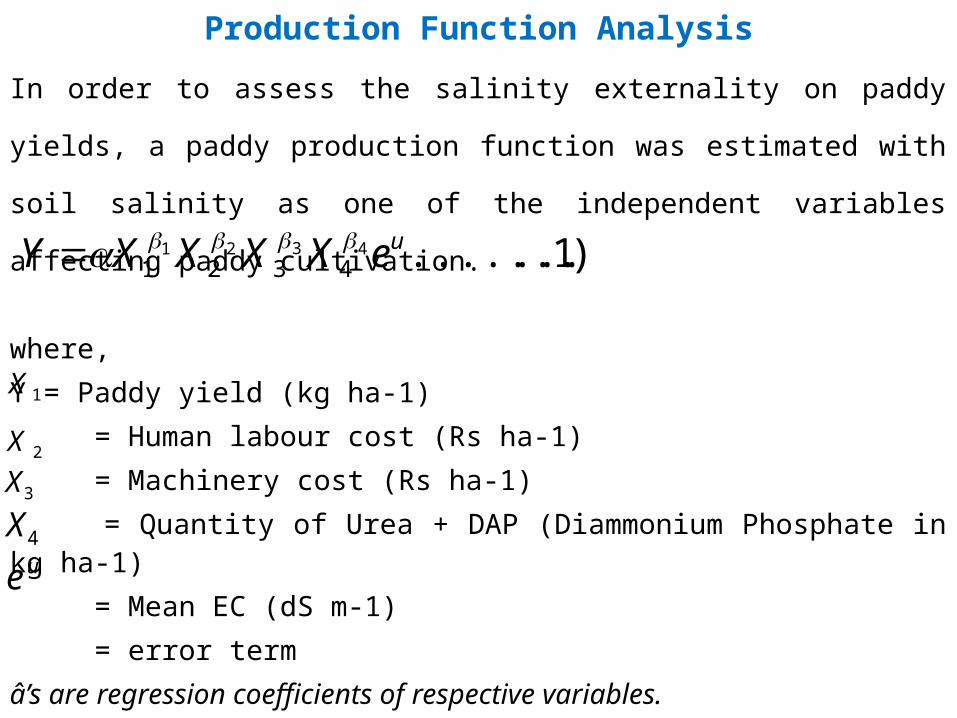
In order to assess the salinity externality on paddy yields, a paddy
production function was estimated with soil salinity as one of the
independent variables affecting paddy cultivation.
where,
Y = Paddy yield (kg ha-1)
= Human labour cost (Rs ha-1)
= Machinery cost (Rs ha-1)
= Quantity of Urea + DAP (Diammonium Phosphate in kg ha-1)
= Mean EC (dS m-1)
= error term
â’s are regression coefficients of respective variables.
)1...(..........43214321
ueXXXXY
1X
2X
3X
4Xue
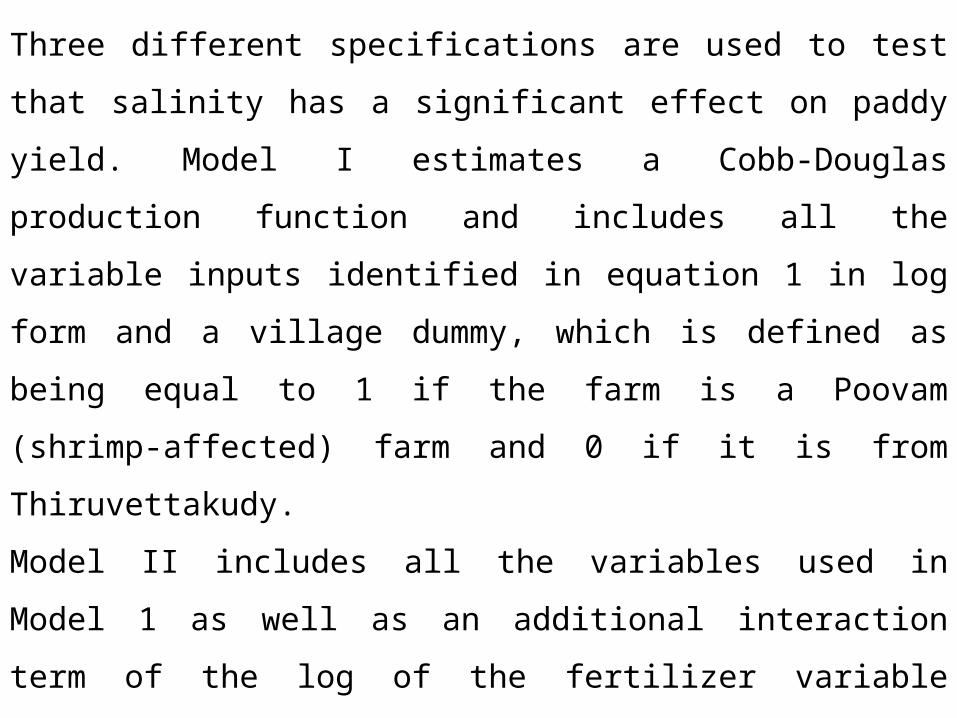
Three different specifications are used to test that salinity has a
significant effect on paddy yield. Model I estimates a Cobb-Douglas
production function and includes all the variable inputs identified in
equation 1 in log form and a village dummy, which is defined as being
equal to 1 if the farm is a Poovam (shrimp-affected) farm and 0 if it is
from Thiruvettakudy.
Model II includes all the variables used in Model 1 as well as an
additional interaction term of the log of the fertilizer variable interacted
with log mean EC to tests whether increased salinity in combination with
fertilizer use contributes to increased productivity. Model III includes a
possible exponential relationship between salinity and paddy production.
So, in this regression mean salinity is not logged.
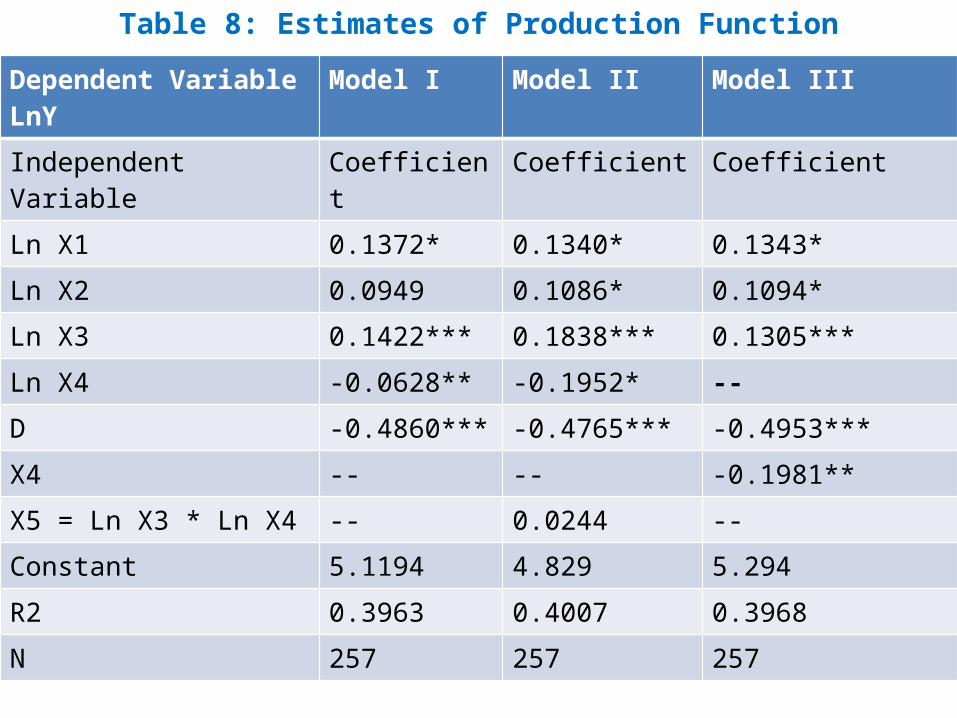
Table 8: Estimates of Production Function
Notes: *** , ** and * denote significance at 1 % level, 5 % and 10 % levels
Dependent Variable LnY Model I Model II Model III
Independent Variable Coefficient Coefficient Coefficient
Ln X1 0.1372* 0.1340* 0.1343*
Ln X2 0.0949 0.1086* 0.1094*
Ln X3 0.1422*** 0.1838*** 0.1305***
Ln X4 -0.0628** -0.1952* --
D -0.4860*** -0.4765*** -0.4953***
X4 -- -- -0.1981**
X5 = Ln X3 * Ln X4 -- 0.0244 --
Constant 5.1194 4.829 5.294
R2 0.3963 0.4007 0.3968
N 257 257 257
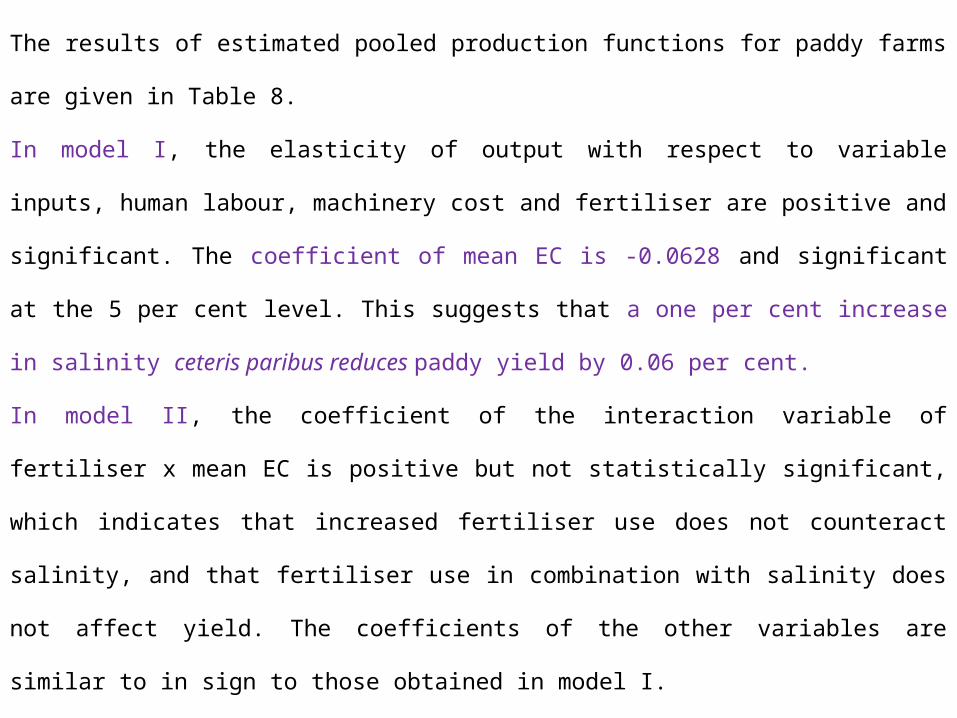
The results of estimated pooled production functions for paddy farms are
given in Table 8.
In model I, the elasticity of output with respect to variable inputs, human
labour, machinery cost and fertiliser are positive and significant. The
coefficient of mean EC is -0.0628 and significant at the 5 per cent level. This
suggests that a one per cent increase in salinity ceteris paribus reduces paddy
yield by 0.06 per cent.
In model II, the coefficient of the interaction variable of fertiliser x mean EC
is positive but not statistically significant, which indicates that increased
fertiliser use does not counteract salinity, and that fertiliser use in combination
with salinity does not affect yield. The coefficients of the other variables are
similar to in sign to those obtained in model I.
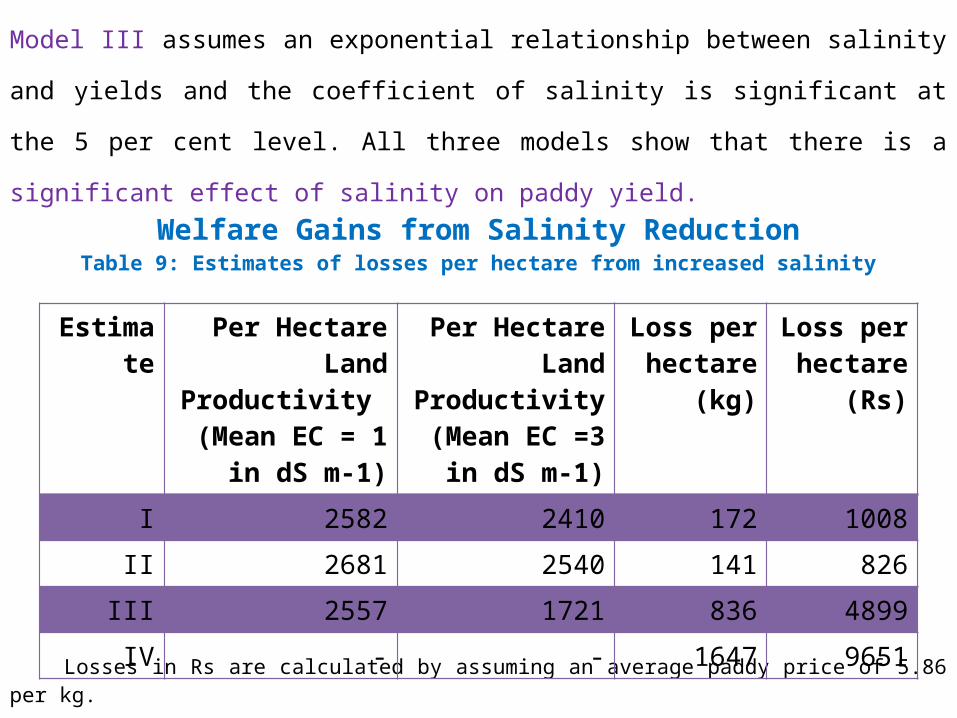
Model III assumes an exponential relationship between salinity and yields
and the coefficient of salinity is significant at the 5 per cent level. All three
models show that there is a significant effect of salinity on paddy yield. Welfare Gains from Salinity Reduction
Table 9: Estimates of losses per hectare from increased salinity
Losses in Rs are calculated by assuming an average paddy price of 5.86 per kg.
Estimate Per Hectare Land Productivity
(Mean EC = 1 in dS m-1)
Per Hectare Land
Productivity(Mean EC =3 in
dS m-1)
Loss per hectare
(kg)
Loss per hectare
(Rs)
I 2582 2410 172 1008
II 2681 2540 141 826
III 2557 1721 836 4899
IV - - 1647 9651
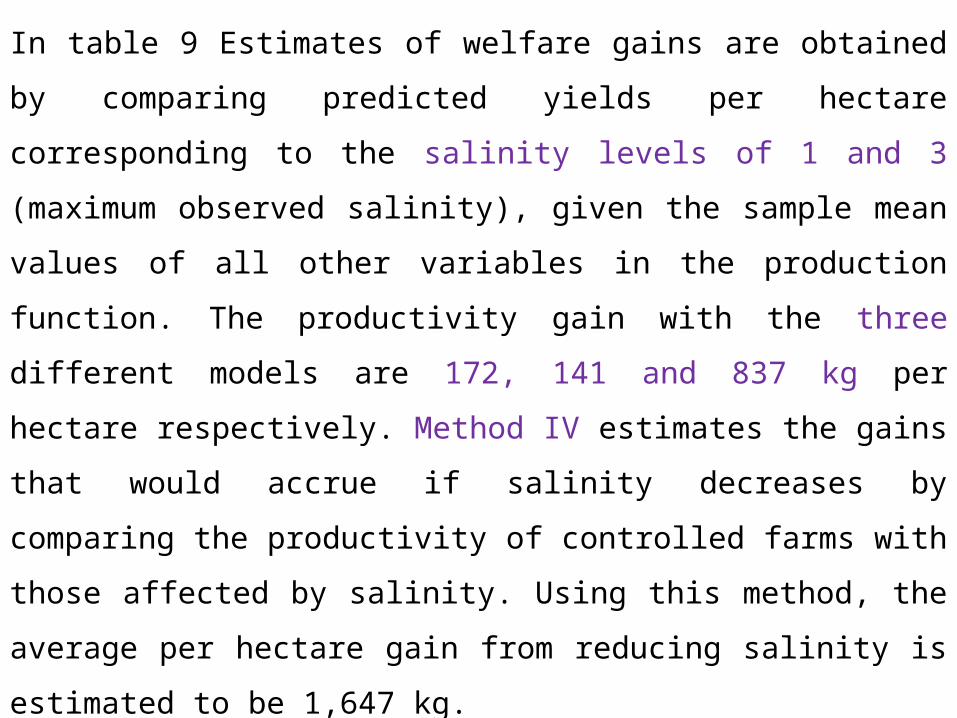
In table 9 Estimates of welfare gains are obtained by comparing predicted
yields per hectare corresponding to the salinity levels of 1 and 3 (maximum
observed salinity), given the sample mean values of all other variables in the
production function. The productivity gain with the three different models
are 172, 141 and 837 kg per hectare respectively. Method IV estimates the
gains that would accrue if salinity decreases by comparing the productivity
of controlled farms with those affected by salinity. Using this method, the
average per hectare gain from reducing salinity is estimated to be 1,647 kg.
So, the gains can range between Rs 1,000 and Rs 5,000 per hectare
depending on the specification of the production function. Conversely, an
examination of the controlled salinity level means in the affected and un-
affected villages suggests that the losses could be as high as Rs 10,000 per
hectare.
Conclusions
How have farmers responded to Problem of Salinity?
Shifting to direct sown paddy technology has emerged as a coping strategy
for dealing with salinity in Poovam. The analysis of farm budgets shows
that the returns in Poovam are negative: net losses of Rs 5,400 per hectare
and Rs 4,743 per hectare respectively for TP and DS. This situation has
forced a few farmers in Poovam to sell their lands. Maximum salinity level
is 3 in Poovam. No doubt many farms have not reached this level of salinity,
but if conditions do not change then continuous exposure to the effects of
being near shrimp farms may force to reach this level. in Thiruvettakudy,
Farmer’s Irrigation Society is working to reduce salinity problem .
Salinity control measures like rainwater harvesting, the maintenance
and regulation of sluice gates, leaching and drainage can all be
employed to lower salinity in Poovam. Regular monitoring is critical to
prevent an increase in salinity over the long term.
Is there a case for the region’s shrimp farmers to internalise the costs of
increased land and water salinity in their neighbourhood, which is an
externality they have generated?
A variety of economic instruments exist that can be used for reducing
such externalities. Direct compensation may not be feasible, but a
regulatory framework for taxing externalities can be developed which
will pull the farmers of Poovam out of a cycle of losses, and bring long-
term sustainability to their agricultural effort.

THANK YOU