

SHORT TERM LOAD FORECASTING - IIT Kanpur Training-2014/IITK - PPTs - 2014/Day... · Demand Forecast...
35
“Power Procurement Strategies and Power Exchanges” SHORT TERM LOAD FORECASTING Indian Institute of Technology Kanpur (IITK) and Indian Energy Exchange (IEX) are delighted to announce Training Program on "Power Procurement Strategy and Power Exchanges" 28-30 July, 2014
Transcript of SHORT TERM LOAD FORECASTING - IIT Kanpur Training-2014/IITK - PPTs - 2014/Day... · Demand Forecast...
“Power Procurement Strategies and Power Exchanges”
SHORT TERM LOAD FORECASTING
Indian Institute of Technology Kanpur (IITK) and Indian Energy Exchange (IEX) are delighted to announce
Training Program on"Power Procurement Strategy and Power Exchanges"
28-30 July, 2014

Agenda
Need for Load Forecasting Definition of Load Forecasting India Power Market Context Portfolio Management Types of Load Forecasting Short Term Load Forecasting Forecasting Process Forecasting Challenges
2

Agenda
Need for Load Forecasting Definition of Load Forecasting India Power Market Context Portfolio Management Types of Load Forecasting Short Term Load Forecasting Forecasting Process Forecasting Challenges
3
Load Forecasting is critical in Indian Scenario
4
Energy Deficit Market Significant Growth Continuous shift of growth pattern Technical and Commercial Losses Distribution Infrastructure Metering Infrastructure Nascent Market Mechanism Regulatory Policies Renewable / Distributed Generation

Benefits of Load Forecasting
Efficient Power Procurement Capacity Planning Selling of Excess Power Optimum Supply Schedule Network Planning Demand Side Management Fuel Mix Selection Renewable Planning
5
Agenda
Need for Load Forecasting Definition of Load Forecasting India Power Market Context Portfolio Management Types of Load Forecasting Short Term Load Forecasting Forecasting Challenges
6
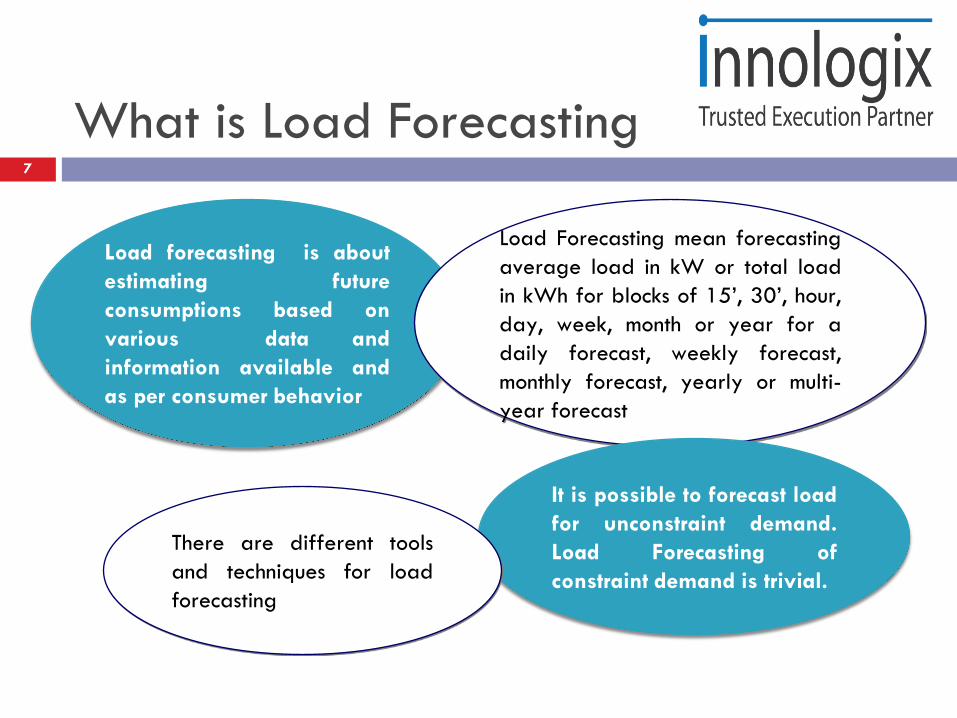
What is Load Forecasting7
Load forecasting is aboutestimating futureconsumptions based onvarious data andinformation available andas per consumer behavior
Load Forecasting mean forecastingaverage load in kW or total loadin kWh for blocks of 15’, 30’, hour,day, week, month or year for adaily forecast, weekly forecast,monthly forecast, yearly or multi-year forecast
It is possible to forecast loadfor unconstraint demand.Load Forecasting ofconstraint demand is trivial.
There are different toolsand techniques for loadforecasting
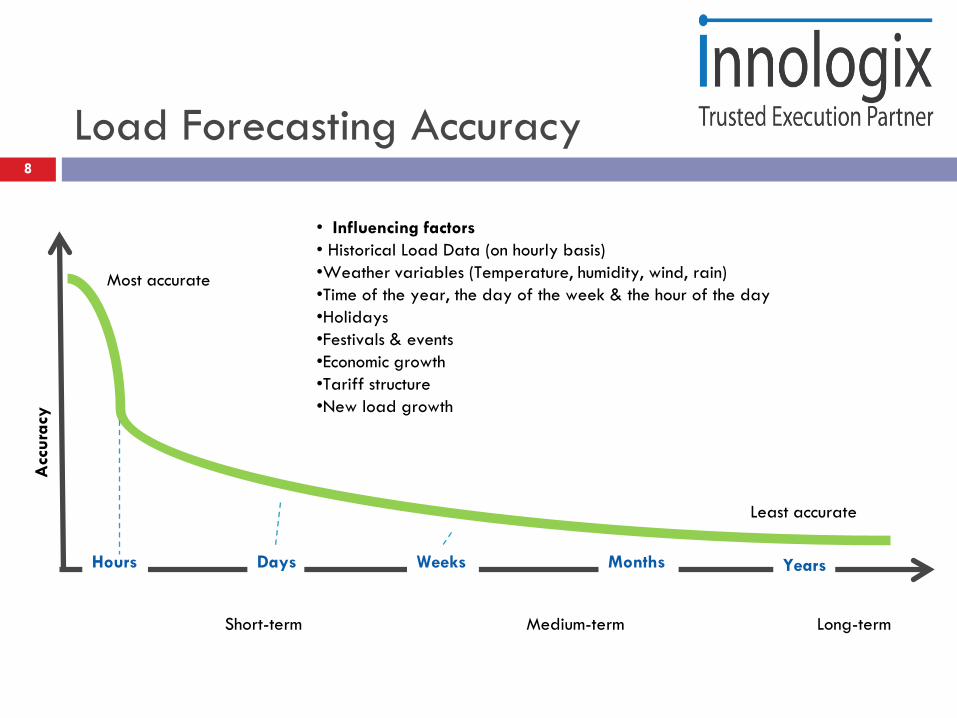
Load Forecasting Accuracy
Acc
urac
y
Hours Days Weeks Months
Short-term Medium-term Long-term
• Influencing factors• Historical Load Data (on hourly basis) •Weather variables (Temperature, humidity, wind, rain)•Time of the year, the day of the week & the hour of the day •Holidays •Festivals & events •Economic growth •Tariff structure •New load growth
Most accurate
Least accurate
Years
8
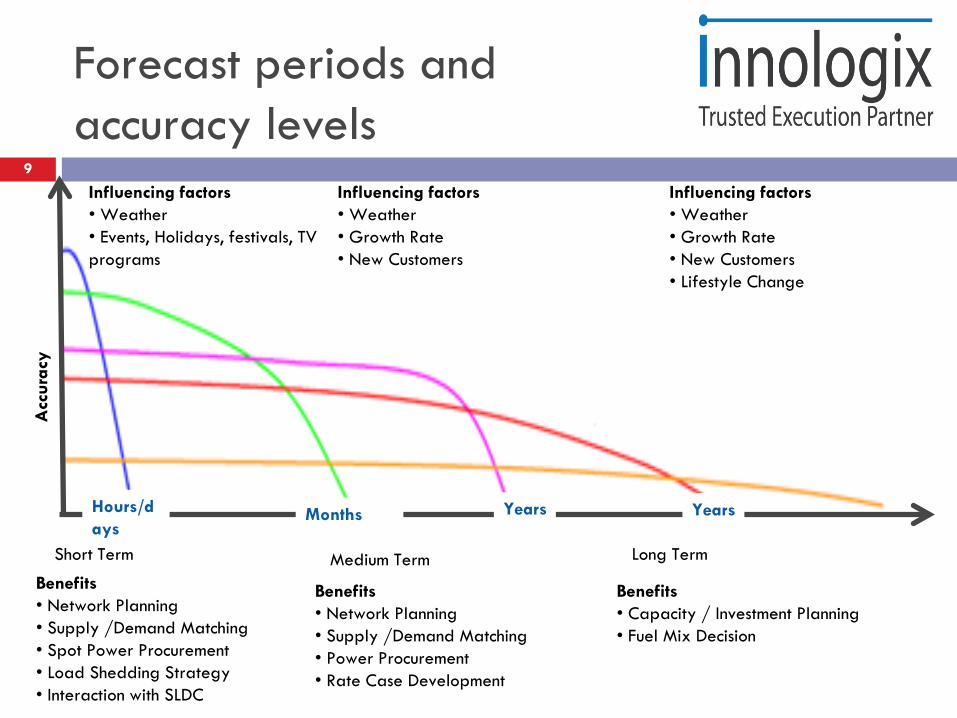
Forecast periods and accuracy levels
9
Acc
urac
y
Hours/days
Months Years Years
Short Term Medium Term Long Term
Influencing factors• Weather• Growth Rate• New Customers
Influencing factors• Weather• Growth Rate• New Customers• Lifestyle Change
Benefits• Network Planning• Supply /Demand Matching• Power Procurement• Rate Case Development
Benefits• Capacity / Investment Planning• Fuel Mix Decision
Benefits• Network Planning• Supply /Demand Matching• Spot Power Procurement• Load Shedding Strategy• Interaction with SLDC
Influencing factors• Weather• Events, Holidays, festivals, TV programs
9
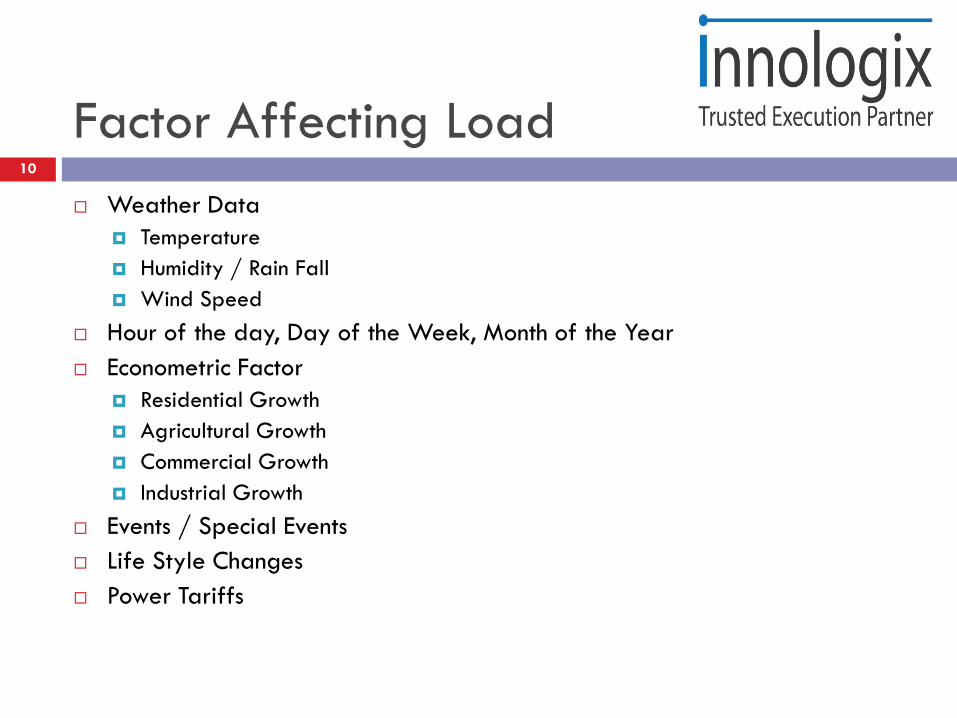
Factor Affecting Load Weather Data
Temperature Humidity / Rain Fall Wind Speed
Hour of the day, Day of the Week, Month of the Year Econometric Factor
Residential Growth Agricultural Growth Commercial Growth Industrial Growth
Events / Special Events Life Style Changes Power Tariffs
10
Agenda
Need for Load Forecasting Definition of Load Forecasting India Power Market Context Portfolio Management Types of Load Forecasting Short Term Load Forecasting Forecasting Process Forecasting Challenges
11
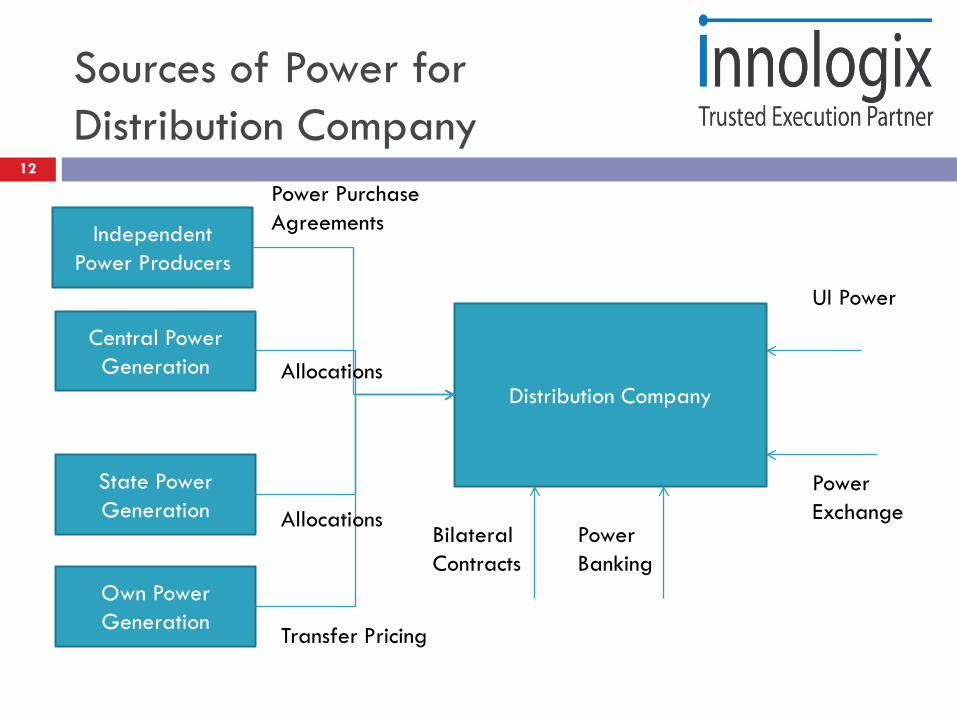
Sources of Power for Distribution Company
Distribution Company
Own Power Generation
State Power Generation
Central Power Generation
Independent Power Producers
Bilateral Contracts
Allocations
Allocations
Power Purchase Agreements
Power Banking
UI Power
Power Exchange
Transfer Pricing
12
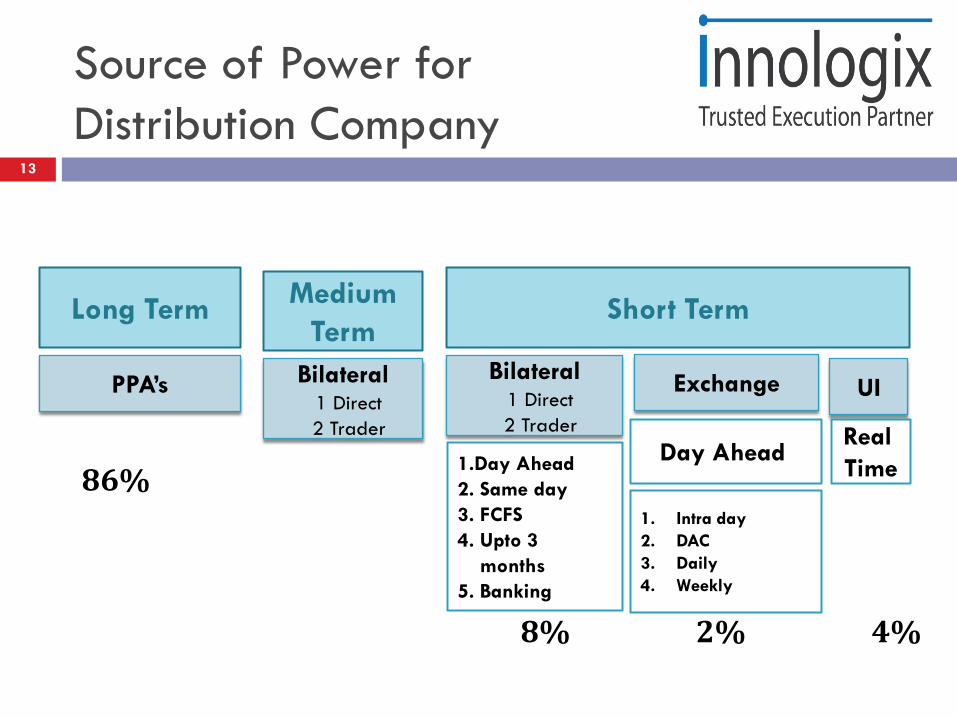
UI
Long Term Short Term
PPA’s Bilateral1 Direct2 Trader
Exchange
1.Day Ahead2. Same day3. FCFS4. Upto 3
months5. Banking
Day Ahead
1. Intra day2. DAC3. Daily4. Weekly
Real Time
MediumTerm
Bilateral1 Direct2 Trader
86%
8% 2% 4%
Source of Power for Distribution Company
13
Agenda
Need for Load Forecasting Definition of Load Forecasting India Power Market Context Portfolio Management Types of Load Forecasting Short Term Load Forecasting Forecasting Process Forecasting Challenges
14
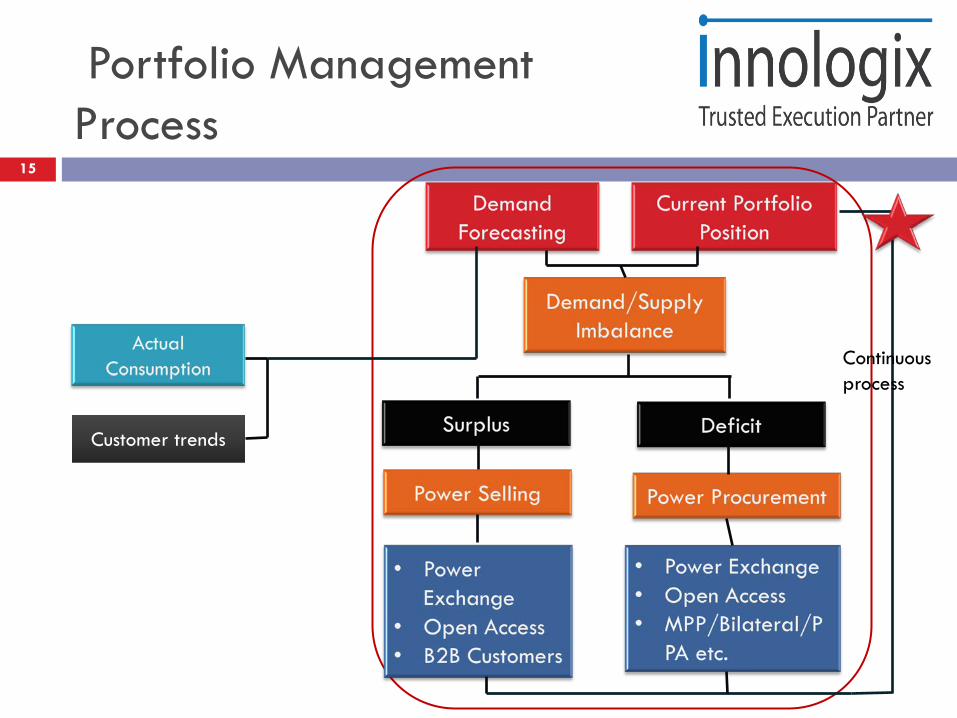
Portfolio Management Process
15
Customer trends
Continuous process
15

Agenda
Need for Load Forecasting Definition of Load Forecasting India Power Market Context Portfolio Management Types of Load Forecasting Short Term Load Forecasting Forecasting Process Forecasting Challenges
16
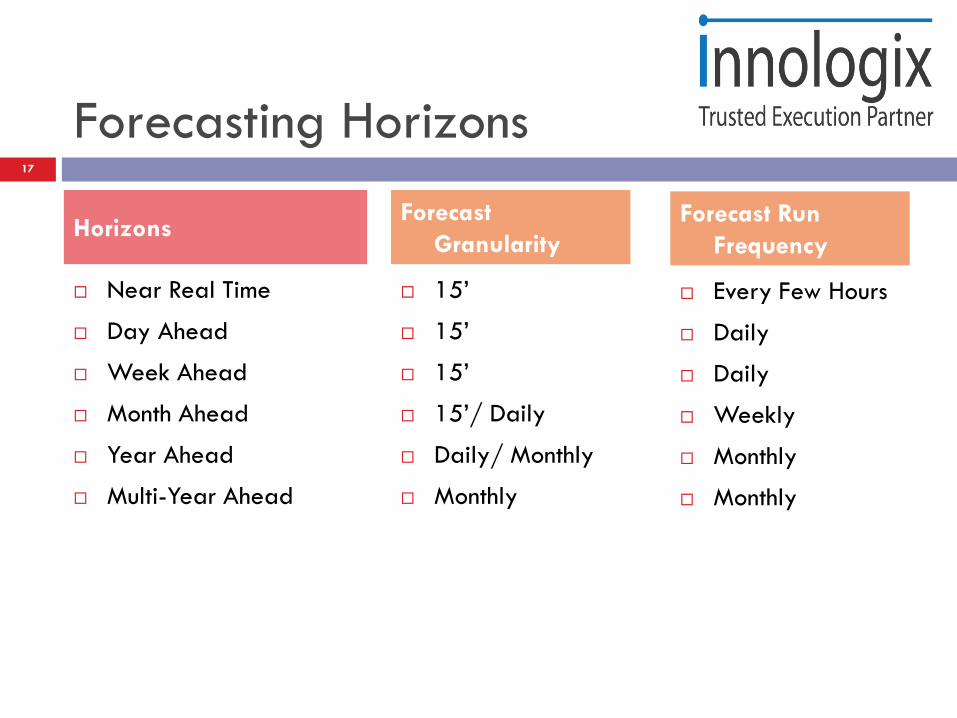
Forecasting Horizons
Near Real Time
Day Ahead
Week Ahead
Month Ahead
Year Ahead
Multi-Year Ahead
15’
15’
15’
15’/ Daily
Daily/ Monthly
Monthly
HorizonsForecast
Granularity
Every Few Hours
Daily
Daily
Weekly
Monthly
Monthly
Forecast Run Frequency
17
Agenda
Need for Load Forecasting Definition of Load Forecasting India Power Market Context Portfolio Management Types of Load Forecasting Short Term Load Forecasting Forecasting Process Forecasting Challenges
18
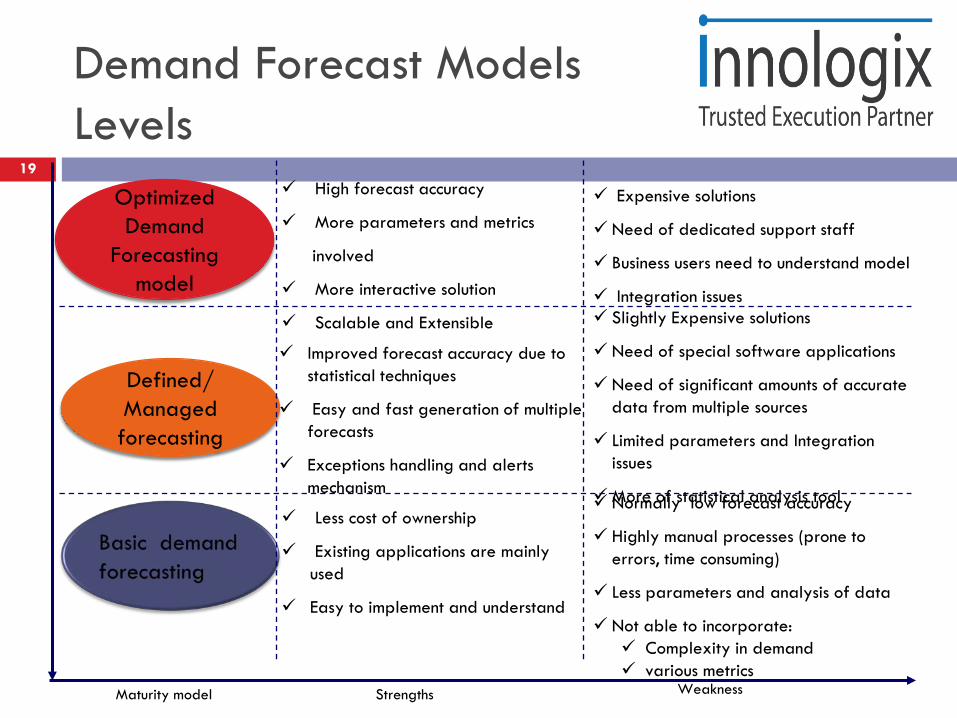
Demand Forecast Models Levels
19
Strengths
High forecast accuracy
More parameters and metrics
involved
More interactive solution
Scalable and Extensible
Expensive solutions
Need of dedicated support staff
Business users need to understand model
Integration issues
Optimized Demand
Forecasting model
WeaknessMaturity model
Defined/ Managed forecasting
Improved forecast accuracy due to statistical techniques
Easy and fast generation of multiple forecasts
Exceptions handling and alerts mechanism
Less cost of ownership
Existing applications are mainly used
Easy to implement and understand
Normally low forecast accuracy
Highly manual processes (prone to errors, time consuming)
Less parameters and analysis of data
Not able to incorporate: Complexity in demand various metrics
Slightly Expensive solutions
Need of special software applications
Need of significant amounts of accurate data from multiple sources
Limited parameters and Integration issues
More of statistical analysis tool
Forecasting Methodologies
Simple Time Series Models Regression Models Similar Day Approach/ Seasonal Neural Networks
20
Examples of Models
Moving Average Exponential Smoothening Trend Projection ARIMA (Auto Regressive Integrated Moving
Average)
21

Example of Similar Day Approach
22
Factors: Amongst several factors which impact consumption, there are two high level components which are highly significant: Seasonality Weather
These factors can be expressed as:
C = consumption,S = season/TODW= weatherε = error or residue
Seasonal Component23
ARIMA along with components such as AR, MA etc. is generally used to account for the seasonality
If the consumption is to be forecasted one year in advance on granularity such as 1 hr, ARIMA can not be used. Seasonality is accounted by finding the Normal Seasonal Curve.
The normal seasonal curve would reflect the consumption assuming that all weather parameters were at their normal values and that there are no other factors influencing the consumption. This normal curve reflects the periodic component of the consumption time series and covers the auto regressive components.
There are three major seasonal components considered: Time of the day Day of the week Day of the year
Shifting Peaks24
The moment of peak consumption may change with season The magnitude of the peak changes with season
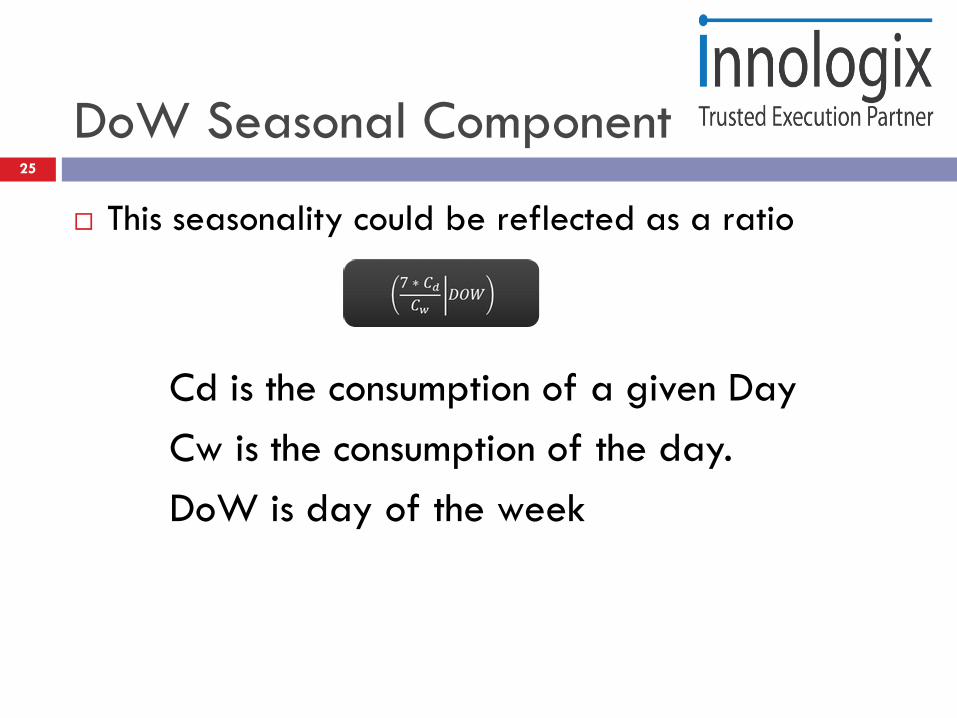
DoW Seasonal Component25
This seasonality could be reflected as a ratio
Cd is the consumption of a given DayCw is the consumption of the day.DoW is day of the week
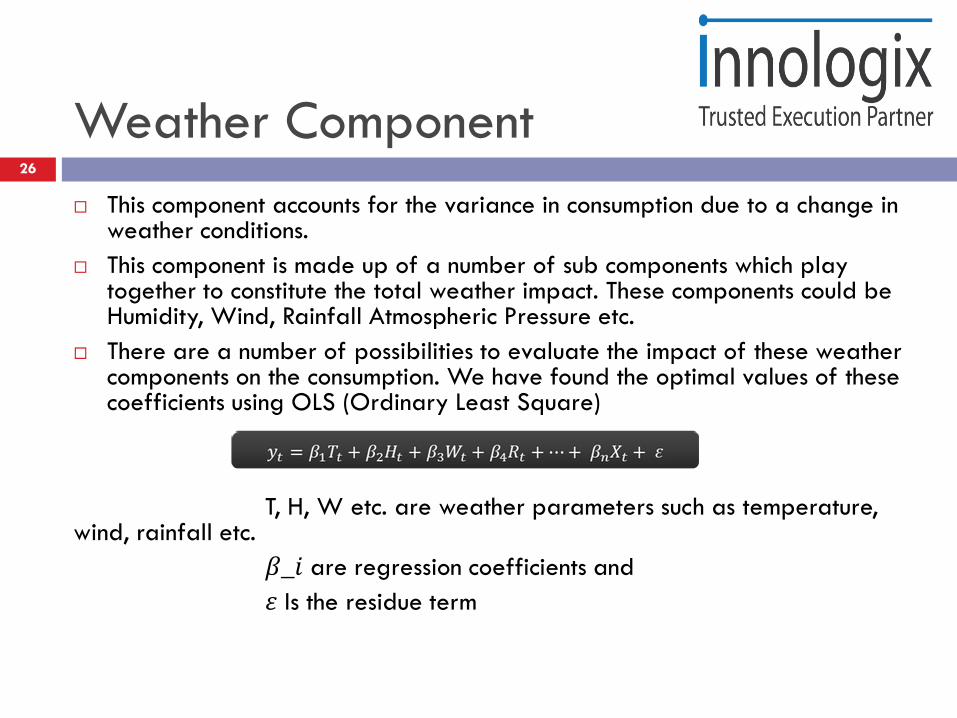
Weather Component26
This component accounts for the variance in consumption due to a change in weather conditions.
This component is made up of a number of sub components which play together to constitute the total weather impact. These components could be Humidity, Wind, Rainfall Atmospheric Pressure etc.
There are a number of possibilities to evaluate the impact of these weather components on the consumption. We have found the optimal values of these coefficients using OLS (Ordinary Least Square)
T, H, W etc. are weather parameters such as temperature, wind, rainfall etc.
𝛽𝛽_𝑖𝑖 are regression coefficients and 𝜀𝜀 Is the residue term
Events27
Certain events have significant impact on Consumption
For these events, the forecast adjust the forecast accordingly.
The events impact is calculated and automatically used in the forecast
Only the events are used where the impact standard deviation is less than 60% of the mean
Model Testing
There are various approaches of Model Testing: Scatter plot of the actual load versus the model. Correlation between the actual load and the model. R- square between the actual load and the model.
28

Agenda
Need for Load Forecasting Definition of Load Forecasting India Power Market Context Portfolio Management Types of Load Forecasting Short Term Load Forecasting Forecasting Process Forecasting Challenges
29
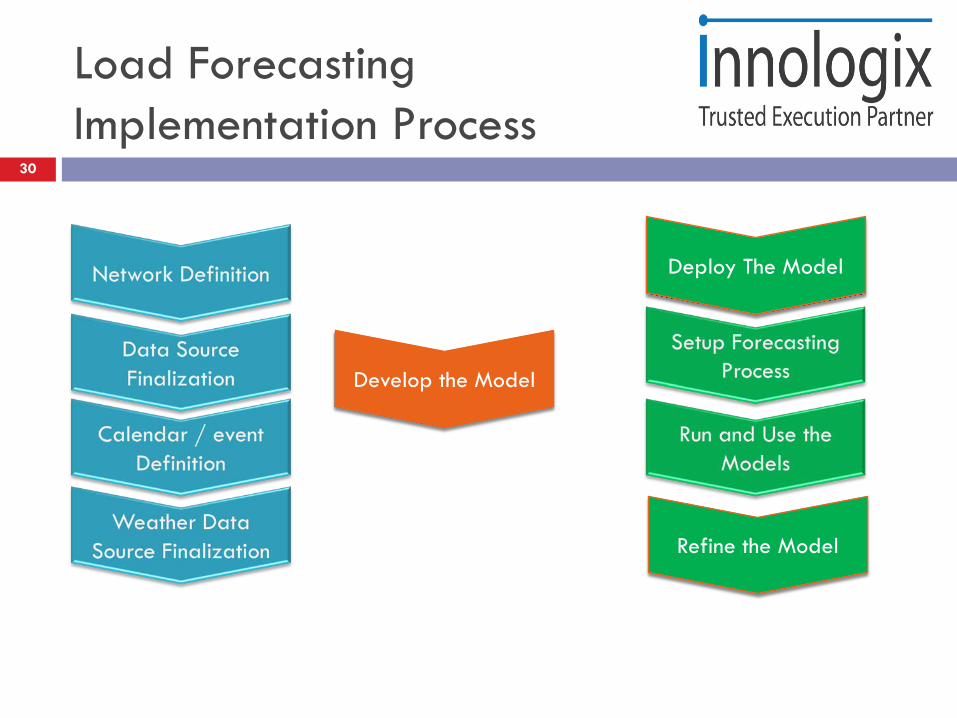
Load Forecasting Implementation Process
30
Deploy The Model
Develop the Model
Refine the Model
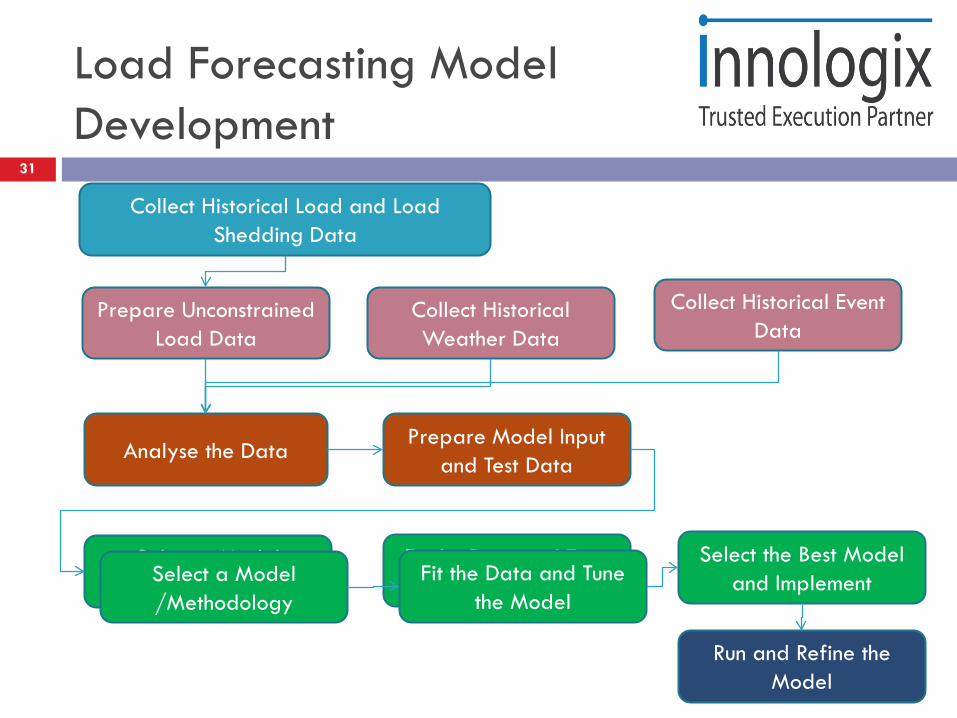
Load Forecasting Model Development
Collect Historical Load and Load Shedding Data
Collect Historical Weather Data
Prepare Unconstrained Load Data
Analyse the Data
Collect Historical Event Data
Prepare Model Input and Test Data
Select a Model /Methodology
Fit the Data and Tune the Model
Select the Best Model and Implement
Run and Refine the Model
Select a Model /Methodology
Fit the Data and Tune the Model
31

Agenda
Need for Load Forecasting Definition of Load Forecasting India Power Market Context Portfolio Management Types of Load Forecasting Short Term Load Forecasting Forecasting Process Forecasting Challenges
32
Forecasting Challenges
Data Related Challenges Lack of good data is the biggest challenge in load
forecasting Forecasting requires clean
Process and Methodology Challenges Governance Challenges Technology Challenges Eternal Data Challenges
33
Pitfalls in Forecasting Forecasting is a statistical process. It is not expected to forecast demand of
each consumer and then roll it up. Forecasting needs to be done of unconstrained load Forecasting involves both profile forecasting and total forecasting. Quite a
few times, the profile forecasting is done more accurately while total forecasting is done less accurately
The forecasting accuracy is a combination of good data, good process and good model. A good model alone or a good software alone can not give good accuracy
Accuracy Improvement is a gradual process and involves significant human intervention. An automated process does not provide good accuracy on regular basis
More data does not necessarily mean better forecast. It is important to select optimum data size
One model does not fit all
34