Short Term Energy Outlook_EIA
48
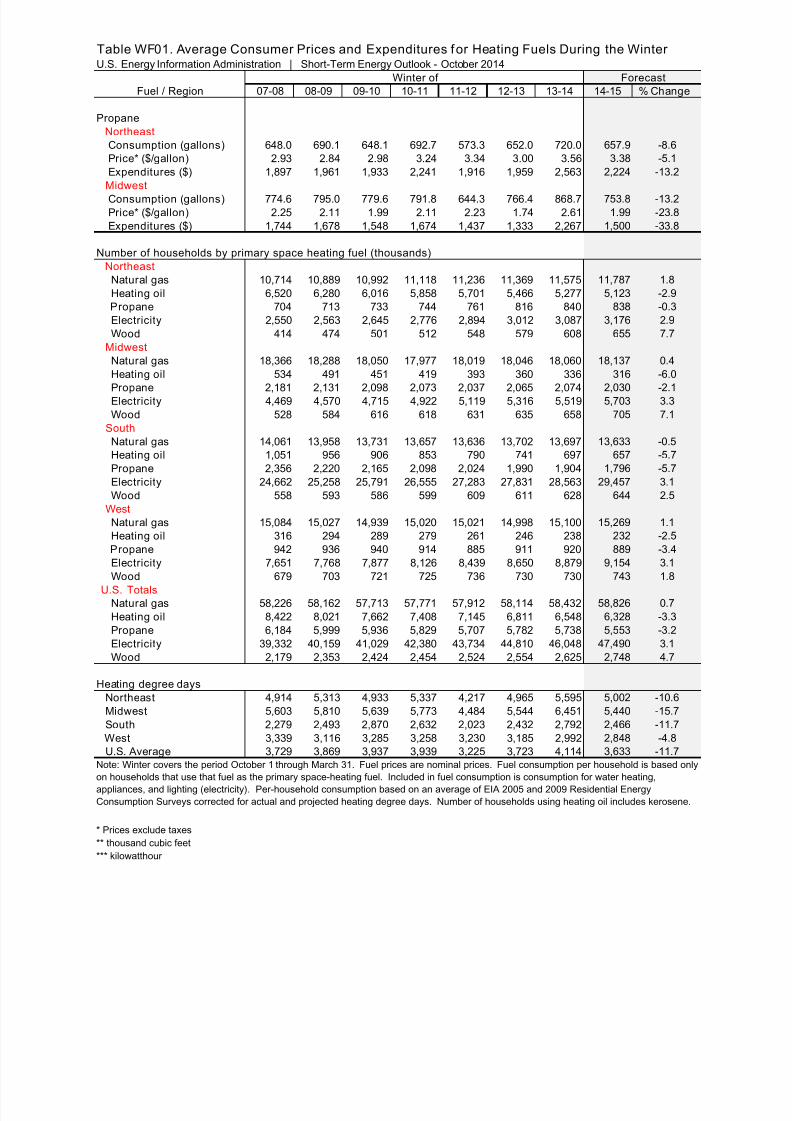
U.S. Energy Information Administration | Short‐Term Energy and Winter Fuels Outlook October 2014 1 October 2014 Short-Term Energy and Winter Fuels Outlook (STEO) Highlights EIA projects average U.S. household expenditures for natural gas, heating oil, electricity, and propane will decrease this winter heating season (October 1 through March 31) compared with last winter, which was 11% colder than the previous 10‐year average nationally. Projected average household expenditures for propane and heating oil are 27% and 15% lower, respectively, because of lower heating demand and prices. Lower heating demand and higher prices contribute to natural gas and electricity expenditures that are 5% and 2% lower than last winter (see EIA Short ‐Term Energy Outlook and Winter Fuels Outlook slideshow). Driven in large part by falling crude oil prices, U.S. regular gasoline retail prices fell to an average of $3.41/gallon (gal) in September, 29 cents below the June average. U.S. regular gasoline retail prices are projected to continue to decline to an average of $3.14/gal in December. EIA expects U.S. regular gasoline retail prices, which averaged $3.51/gal in 2013, to average $3.45/gal in 2014 and $3.38/gal in 2015. Weakening global demand helped North Sea Brent crude oil spot prices fall to an average of $97 per barrel (bbl) in September, the first month Brent prices have averaged below $100/bbl in more than two years. EIA projects that Brent crude oil prices will average $98/bbl in fourth‐quarter 2014 and $102/bbl in 2015. The WTI discount to Brent, which averaged $11/bbl in 2013, is expected to average $7/bbl in both 2014 and 2015. Total U.S. crude oil production averaged an estimated 8.7 million barrels per day (bbl/d) in September, the highest monthly production since July 1986. Total crude oil production, which averaged 7.4 million bbl/d in 2013, is expected to average 9.5 million bbl/d in 2015. If realized, the 2015 forecast would be the highest annual average crude oil production since 1970. Natural gas plant liquids production is expected to increase from an average of 2.6 million bbl/d in 2013 to 3.2 million bbl/d in 2015. Natural gas working inventories on September 26 totaled 3.10 trillion cubic feet (Tcf), 0.37 Tcf (11%) below the level at the same time a year ago and 0.40 Tcf (11%) below the previous five‐year average (2009‐13). Projected natural gas working inventories reach 3.53 Tcf at the end of October, 0.28 Tcf below the level at the same time last year. Despite the lower stocks at the start of this winter's heating season, EIA expects the Henry Hub natural gas
Transcript of Short Term Energy Outlook_EIA
8/10/2019 Short Term Energy Outlook_EIA
http://slidepdf.com/reader/full/short-term-energy-outlookeia 1/48
8/10/2019 Short Term Energy Outlook_EIA
http://slidepdf.com/reader/full/short-term-energy-outlookeia 2/48
U.S. Energy Information Administration | Short‐Term Energy and Winter Fuels Outlook October 2014 2
spot price to $4.00/million British thermal units (MMBtu) this winter compared with
$4.53/MMBtu last winter. This price forecast reflects both lower expected heating demand
and significantly higher natural gas production this winter.
Projected Winter Fuel Expenditures by Fuel and Region
The average household winter heating fuel expenditures discussed in this STEO provide a broad
guide to changes compared with last winter. However, fuel expenditures for individual
households are highly dependent on local weather conditions, market size, the size and energy
efficiency of individual homes and their heating equipment, and thermostat settings (see Winter
Fuels Outlook table). Forecast temperatures based on the latest forecasts from the National
Oceanic and Atmospheric Administration (NOAA) are much warmer than last winter east of the
Rocky Mountains, with the Midwest 16% warmer, the South 12% warmer, the Northeast 11%
warmer. However, last winter provides a reminder that weather can be unpredictable, and the
Winter Fuels Outlook includes forecasts for scenarios where heating degree days (HDD) in all
regions may
be
10%
higher
(colder)
or
10%
lower
(warmer)
than
forecast.
Natural Gas. About half of all U.S. households heat with natural gas, and the average household
may expect a 5% decrease in winter natural gas expenditures. EIA projects a 10% decline in
residential natural gas consumption this year as temperatures are expected to return to closer‐
to‐normal levels. The savings from lower consumption are partially offset by higher residential
prices. Although EIA forecasts lower Henry Hub prices this winter, current spot prices do not
directly translate into lower delivered residential prices. Utilities began buying gas in April for
the upcoming heating season, and prices in 2014 have averaged higher than last year. Plus, the
rates that utilities charge can be set by state utility commissions a year or more in advance.
Under a 10%‐colder scenario, EIA projects consumption will be 3% less than last year and
expenditures will be 6% greater than last year. Under a 10%‐warmer scenario, EIA expects a
decline of 17% in consumption and 12% in expenditures compared with last year.
Last winter, gas‐fired power plants in the Northeast had to compete for an increasingly limited
amount of available natural gas pipeline capacity from a system that was already constrained,
particularly in New England and New York. This caused natural gas spot prices and consequently
day‐ahead power prices to spike. Pipeline constraints still exist in the area, and day‐to‐day price
volatility is likely. The region has two important marginal sources of supply for times of very high
demand:
liquefied
natural
gas
(LNG)
imports
and
pipeline
imports
from
Canada.
Although
LNG
imports have declined dramatically in the past several years, GDF Suez still receives cargoes
from Trinidad under long‐term contracts at its LNG terminal near Boston. One of the terminal’s
customers is the adjacent Mystic Power Plant. LNG received at the Canaport LNG terminal in
New Brunswick, Nova Scotia, also comes to the United States via the Brunswick Pipeline.
Strong production growth this year contributed to a record inventory build. EIA projects
working natural gas inventories of 3,532 billion cubic feet (Bcf) at the end of October. EIA
8/10/2019 Short Term Energy Outlook_EIA
http://slidepdf.com/reader/full/short-term-energy-outlookeia 3/48
U.S. Energy Information Administration | Short‐Term Energy and Winter Fuels Outlook October 2014 3
expects working gas inventories to be drawn down to 1,534 Bcf at the end of March 2015. Even
in the event of another cold winter, EIA does not expect stocks to fall below 1,000 Bcf by the
end of this heating season.
Heating Oil. EIA expects households heating primarily with heating oil to spend an average of
$362 (15%)
less
this
winter
than
last
winter,
reflecting
prices
that
are
$0.25/gal
(6%)
lower
and
consumption that is 10% lower. Heating oil prices are expected to be lower in large part
because of lower crude oil prices, with Brent crude oil prices forecast to average $9/bbl
($0.22/gal) lower this winter than last. In the 10%‐colder‐weather scenario, projected
expenditures are $124 lower than last winter, with prices that are $0.16/gal lower than last
winter.
A number of factors contribute to uncertainty in this winter’s heating oil market, including
weather and oil price volatility, the adequacy of inventories, and changes in fuel specifications.
Distillate stocks in the Northeast totaled 29.3 million barrels on September 26, 0.2 million
barrels below
the
same
time
last
year
and
the
lowest
level
for
this
time
of
year
since
2000.
However, unless severe weather in the Northeast coincides with severe weather in Europe,
demand should be readily met via supplies from the Atlantic Basin market.
Reliance on heating oil is highest in the Northeast, where about 23% of households depend on
heating oil for space heating. Nationwide, only 5% of households use heating oil. The state of
New York, which accounts for about one‐third of the region’s heating oil market, has required
the use of ultra‐low sulfur heating oil since July 2012. Five states (Connecticut, Massachusetts,
New Jersey, Rhode Island, and Vermont) lowered their heating oil maximum sulfur specification
on July 1 from 2,000 parts per million (ppm) (and higher) to 500 ppm. No major impact is
expected
as
suppliers
will
either
blend
high‐
sulfur
distillate
with
ultra‐
low
sulfur
diesel
(ULSD)
or
deliver ULSD, which is a readily available fuel.
In January 2015, new regulations will limit marine vessel fuel sulfur levels in certain coastal
waters to 1,000 ppm. Some vessels are expected to switch from using residual fuel oil to
distillate because of its lower sulfur content. However, the effect on the Northeast heating oil
market should be limited because marine fuel demand in this region is relatively small.
Propane. About 5% of all U.S. households heat with propane. EIA expects households heating
primarily with propane to spend less this winter, but the projected decrease varies across
regions. EIA expects that households heating with propane in the Midwest will spend an
average of $767 (34%) less this winter than last winter, reflecting prices that are about 24%
lower and consumption that is 13% lower than last winter. Households in the Northeast are
expected to spend an average of $340 (13%) less this winter, with average prices that are about
5% lower and consumption that is 9% lower than last winter.
Heading into the winter months, primary propane stocks in the Gulf Coast (PADD 3) and the
Midwest (PADD 2) at the end of September were 6.6 million barrels (18%) and 3.7 million
8/10/2019 Short Term Energy Outlook_EIA
http://slidepdf.com/reader/full/short-term-energy-outlookeia 4/48
U.S. Energy Information Administration | Short‐Term Energy and Winter Fuels Outlook October 2014 4
barrels (15%) higher, respectively, than at the same time last year. Propane spot prices at the
Mont Belvieu, Texas and Conway, Kansas delivery points in early October were close to prices at
the same time last year. The outlook for propane demand is uncertain given volatility in winter
temperatures and another expected record corn crop, which could draw down propane stocks
for crop drying. The Cochin Pipeline, which previously delivered propane from Canada to the
Midwest, was
reversed
in
early
2014.
While
this
reversal
will
limit
the
ability
to
deliver
propane
into the region, higher propane production from gas plants in the Midwest and new and
expanded rail terminals should help to supply propane to the region this winter.
Electricity. Households heating primarily with electricity can expect to spend an average of $17
(2%) less this winter, with 3% higher prices but 5% less consumption than last winter. About
39% of all U.S. households rely on electricity as their primary heating source, ranging regionally
from 15% in the Northeast to 63% in the South.
Under a 10% colder scenario, EIA estimates that U.S. residential electricity consumption this
winter
would
be
1.8%
higher
than
during
the
winter
of
2013‐
14.
Residential
electricity
prices
would not rise immediately, but the effect of colder temperatures would pass through to retail
electricity rates over the succeeding months of 2015. For a 10% colder scenario, the average
U.S. residential price would rise by 2.7% in 2015 in contrast to the baseline forecast of 1.7%
growth. The effect would be greatest in New England where residential prices would rise by
6.0% next year if there’s a cold winter, in contrast to the baseline forecast of a 3.6% increase.
Wholesale electricity prices in the Northeast region spiked last winter because of a winter freeze
and constraints on supplying natural gas to power generators. As a result, retail electricity
customers in that area have experienced increases averaging up to 12% so far this year. The
natural gas pipeline constraints in New England still exist and deliveries into the region are near
capacity. If
colder
‐than
‐expected
temperatures
occur
this
winter,
there
is
the
possibility
that
wholesale electricity prices could rise again. Electricity traders are already factoring in this
uncertainty through higher forward market prices for wholesale electricity in the Northeast
Independent System Operators.
Wood. The use of cord wood and wood pellets as the primary residential space heating fuel has
increased by 38% since 2004, to about 2.5 million households in 2013. About 8% of households
use wood as a secondary source of heat, making wood second only to electricity as a
supplemental heating fuel. About 20% of New England homes (1.1 million) used wood for space
heating, water heating, or cooking in 2009 (EIA, Residential Energy Consumption Survey, 2009),
which is
nearly
twice
the
national
rate.
Almost
half
of
all
rural
households
in
New
England
used
wood, compared with only 12% of the area’s urban households.
Global Petroleum and Other Liquids
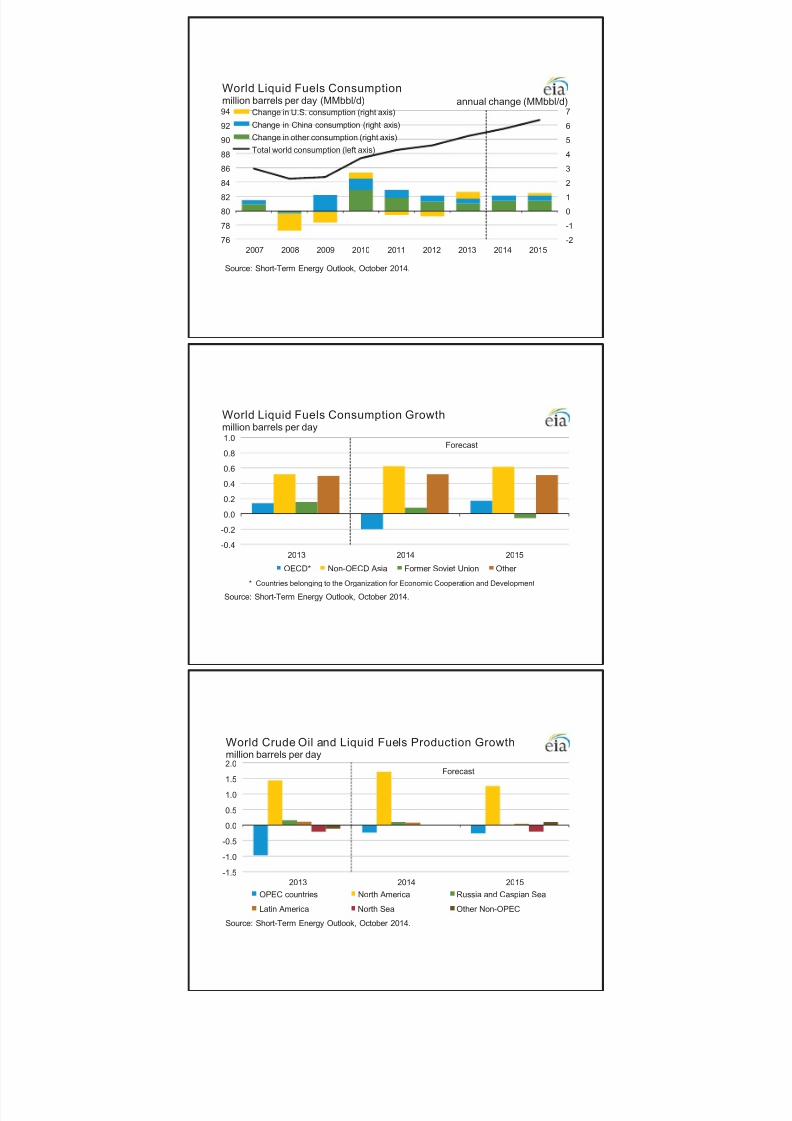
EIA projects world petroleum and other liquids supply to increase by 1.6 million bbl/d in 2014
and by 0.9 million bbl/d in 2015, with most of the growth coming from countries outside of the
8/10/2019 Short Term Energy Outlook_EIA
http://slidepdf.com/reader/full/short-term-energy-outlookeia 5/48
U.S. Energy Information Administration | Short‐Term Energy and Winter Fuels Outlook October 2014 5
Organization of the Petroleum Exporting Countries (OPEC). Forecast non‐OPEC supply grows by
1.9 million bbl/d in 2014 and 1.2 million bbl/d in 2015. The United States and Canada account
for much of this growth. Projected world liquid fuels consumption grows by an annual average
of 1.0 million bbl/d in 2014 and 1.2 million bbl/d in 2015.
Global disruptions
to
near
‐term
supply
have
abated
since
June,
when
Libya's
production
and
exports were at a minimal level, and violence in northern Iraq escalated, causing northern
production (outside of Iraqi Kurdistan) to come nearly to halt. Iraq's southern crude oil exports
still remain unaffected by the unrest in northern Iraq. In Libya, production averaged 0.8 million
bbl/d in September, its highest level in more than 1 year. However, the security situation in
Libya is still precarious, with a significant possibility of intermittent disruptions.
Global Petroleum and Other Liquids Consumption. EIA estimates that global consumption grew
by 1.3 million bbl/d (1.5%) in 2013, averaging 90.4 million bbl/d for the year. EIA expects global
consumption to grow by 1.0 million bbl/d in 2014 and 1.2 million bbl/d in 2015. Projected global
oil‐
consumption‐
weighted
real
GDP,
which
increased
by
an
estimated
2.7%
in
2013,
grows
by
2.7% and 3.3% in 2014 and 2015, respectively.
Consumption outside of the Organization for Economic Cooperation and Development (OECD) is
projected to grow by 1.2 million bbl/d in 2014 and 1.1 million bbl/d in 2015, accounting for
nearly all forecast global consumption growth during that period. China is the leading
contributor to projected global consumption growth, with consumption increasing by 0.37
million bbl/d in both 2014 and 2015.
EIA expects a 0.20‐million‐bbl/d decline in OECD consumption in 2014. Japan and Europe are
expected to account for much of the projected OECD consumption declines. EIA expects Japan's
consumption, which fell by 0.16 million bbl/d in 2013, to continue to decline by an annual
average of 0.13 million bbl/d in 2014 and 0.14 million bbl/d in 2015. Japan’s oil consumption is
expected to fall as the country continues to reduce its share of oil used in the electricity sector,
replacing it with natural gas, coal, and nuclear power as the country returns some nuclear
power plants to service in 2015. EIA projects that OECD Europe's consumption, which fell by
0.15 million bbl/d in 2013, will decline by 0.13 million bbl/d in 2014 and by a further 0.02 million
bbl/d in 2015. U.S. consumption, which increased by 0.47 million bbl/d in 2013, is expected to
decline by 0.04 million bbl/d in 2014 and then increase by 0.17 million bbl/d in 2015.
Non‐OPEC Petroleum and Other Liquids Supply. EIA estimates that non‐OPEC production grew
by 1.4
million
bbl/d
in
2013,
averaging
54.1
million
bbl/d
for
the
year.
EIA
expects
non
‐OPEC
production to grow by 1.9 million bbl/d in 2014 and 1.2 million bbl/d in 2015. The United States
is the leading contributor to forecast non‐OPEC supply growth, increasing by 1.48 million bbl/d
in 2014 and 1.23 million bbl/d in 2015. EIA estimates that Eurasia's production will rise by an
annual average of 0.08 million bbl/d in 2014 and 0.02 million bbl/d in 2015. This forecast
assumes the current economic sanctions on Russia do not affect Russian oil production in the
short term.
8/10/2019 Short Term Energy Outlook_EIA
http://slidepdf.com/reader/full/short-term-energy-outlookeia 6/48
U.S. Energy Information Administration | Short‐Term Energy and Winter Fuels Outlook October 2014 6
Unplanned supply disruptions among non‐OPEC producers averaged nearly 0.6 million bbl/d in
September, down slightly from the previous month. South Sudan, Syria, and Yemen accounted
for more than 90% of total non‐OPEC supply disruptions. EIA does not assume a disruption to oil
supply or demand as a result of ongoing events in Ukraine.
OPEC Petroleum and Other Liquids Supply. EIA estimates that OPEC crude oil production
averaged 29.9 million bbl/d in 2013, a decline of 0.99 million bbl/d from the previous year,
primarily reflecting increased outages in Libya, Nigeria, and Iraq, along with strong non‐OPEC
supply growth. EIA expects OPEC crude oil production to fall by 0.2 million bbl/d in 2014 and by
more than 0.4 million bbl/d in 2015 to accommodate growing production in non‐OPEC
countries.
Unplanned crude oil supply disruptions among OPEC producers averaged 2.2 million bbl/d in
September 2014, 0.2 million bbl/d lower than the previous month because of decreased outages
in Libya.
Libya’s
production
increased
to
0.8
million
bbl/d
in
September,
0.3
million
bbl/d
higher
than the previous month, but still well below the 1.4 million bbl/d the country produced before
the major blockades started in mid‐2013. Libya still faces a considerable challenge in ramping up
production to its full capacity or even sustaining it at the current level. Despite the recent
production increase, the security situation has deteriorated in parts of the country, and the
evacuation of foreign workers is inhibiting production levels from reaching capacity at some
fields. As a result, EIA does not expect Libya's oil production to recover to its pre‐blockade level
over the forecast period.
EIA expects OPEC surplus crude oil production capacity, which is concentrated in Saudi Arabia,
to average
2.2
million
bbl/d
in
2014
and
3.0
million
bbl/d
in
2015.
These
estimates
do
not
include additional capacity that may be available in Iran but is offline because of the effects of
U.S. and European Union sanctions on Iran's ability to sell its oil.
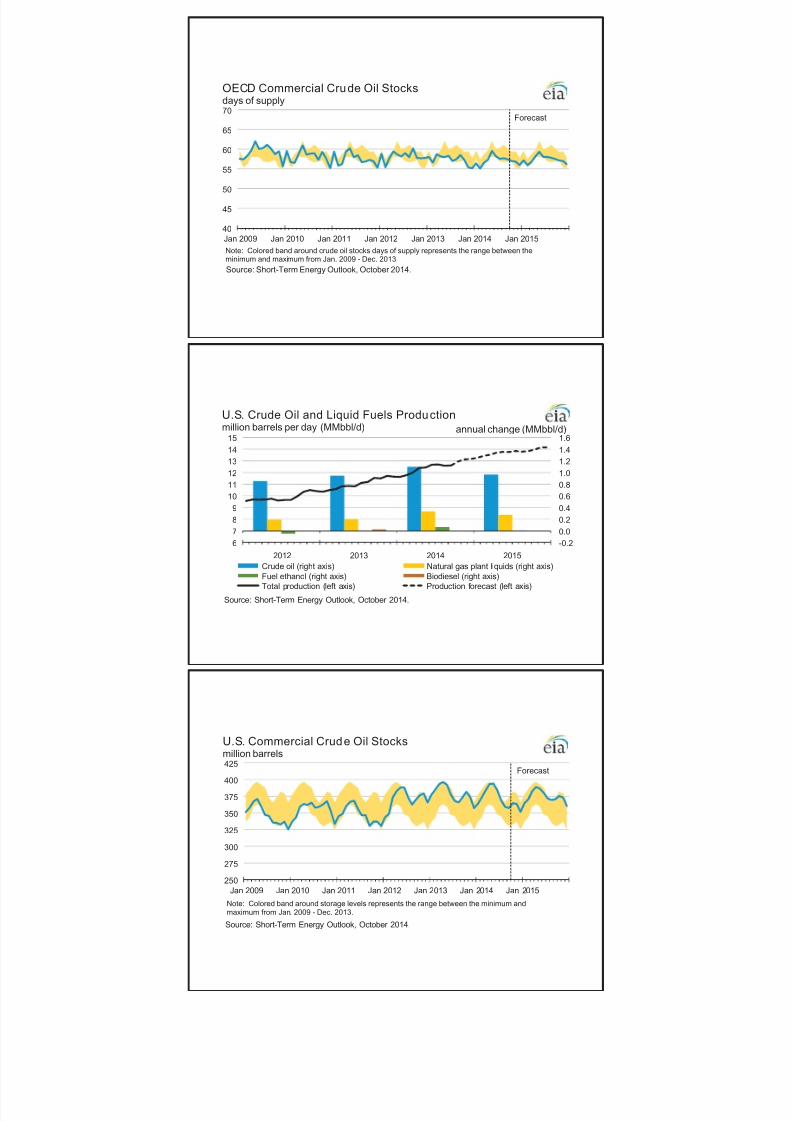
OECD Petroleum Inventories. EIA estimates that OECD commercial oil inventories totaled 2.55
billion barrels at the end of 2013, equivalent to roughly 55 days of consumption. Projected OECD
oil inventories rise to 2.62 billion barrels at the end of 2014.
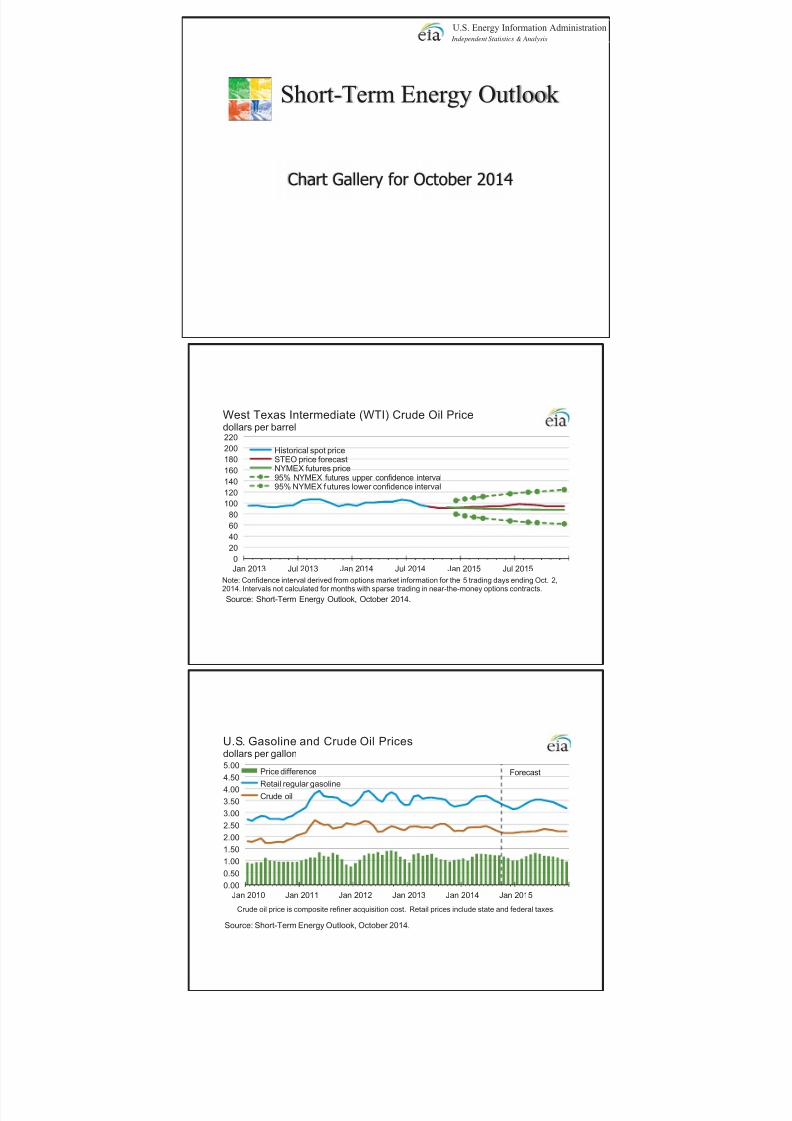
Crude Oil Prices. North Sea Brent crude oil spot prices averaged $97/bbl in September, a
decrease of $5/bbl from August and the first month Brent crude oil prices have averaged below
$100/bbl since June 2012. Brent crude oil prices were driven downward in large part because of
weakening global oil demand and higher Libyan oil exports (EIA, This Week in Petroleum,
September 24, 2014). The forecast Brent crude oil price averages $104/bbl in 2014 and
$102/bbl in 2015, $2/bbl lower and $1/bbl lower than projected in last month's STEO,
respectively.
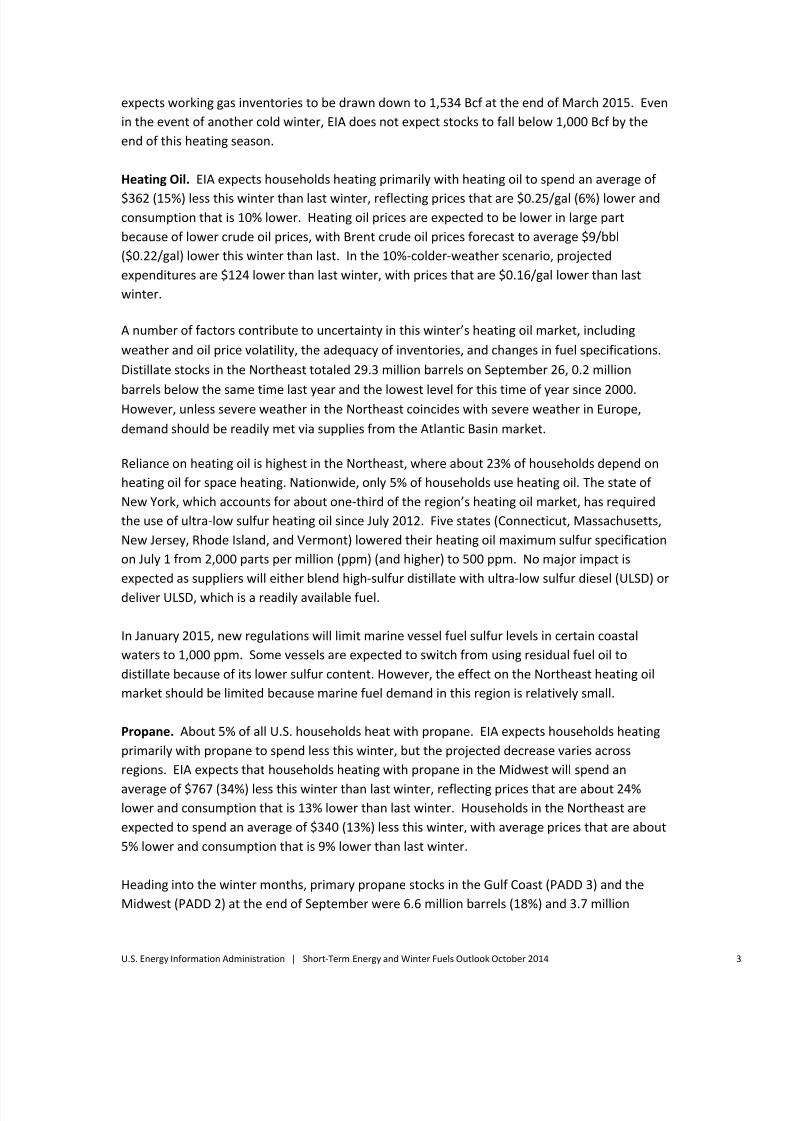
The monthly average WTI crude oil spot price fell from an average of $97/bbl in August to
$93/bbl in September. High refinery runs contributed to the discount of WTI crude oil to Brent
8/10/2019 Short Term Energy Outlook_EIA
http://slidepdf.com/reader/full/short-term-energy-outlookeia 7/48
U.S. Energy Information Administration | Short‐Term Energy and Winter Fuels Outlook October 2014 7
crude oil falling from an average of $8/bbl during the first half of this year to an average of
$4/bbl in the third quarter. EIA now expects WTI crude oil prices to average $91/bbl in the
fourth quarter of 2014 and $95/bbl in 2015. The discount of WTI to Brent crude oil is forecast to
widen from current levels, averaging $7/bbl in the fourth quarter of 2014 and in 2015.
Energy price
forecasts
are
highly
uncertain,
and
the
current
values
of
futures
and
options
contracts suggest that prices could differ significantly from the forecast levels (Market Prices
and Uncertainty Report ). WTI futures contracts for January 2015 delivery, traded during the
five‐day period ending October 2, averaged $91/bbl. Implied volatility averaged 19%,
establishing the lower and upper limits of the 95% confidence interval for the market's
expectations of monthly average WTI prices in January 2015 at $76/bbl and $107/bbl,
respectively. Last year at this time, WTI for January 2014 delivery averaged $102/bbl and
implied volatility averaged 20%. The corresponding lower and upper limits of the 95%
confidence interval were $85/bbl and $121/bbl.
U.S. Petroleum
and
Other
Liquids
Liquid Fuels Consumption. Total U.S. liquid fuels consumption rose by 470,000 bbl/d (2.5%) in
2013, the largest increase since 2004. Consumption of all the major liquid fuels rose, except
residual fuel oil. Consumption of hydrocarbon gas liquids (HGL) registered the largest gain,
increasing by 190,000 bbl/d (8.5%). In 2014, total liquid fuels consumption is expected to fall by
40,000 bbl/d (0.2%), with declines in the consumption of motor gasoline, HGL, residual fuel oil,
and other oils offsetting increases in distillate fuel and unfinished oils consumption. Total
consumption grows by 170,000 bbl/d in 2015, with HGL consumption accounting for three‐
fourths of the increase.
Motor gasoline consumption grew by 160,000 bbl/d (1.9%) in 2013, the largest increase since
2004. But consumption of that fuel falls by 20,000 bbl/d (0.2%) in 2014 and by a further 20,000
bbl/d in 2015 as improving fuel economy in new vehicles offsets highway travel growth.
Distillate fuel consumption increases by 150,000 bbl/d (3.9%) in 2014, reflecting colder‐than‐
average first‐quarter weather and economic growth. Consumption of that fuel rises by a more
moderate 70,000 bbl/d (1.9%) in 2015 under assumptions of normal winter weather.
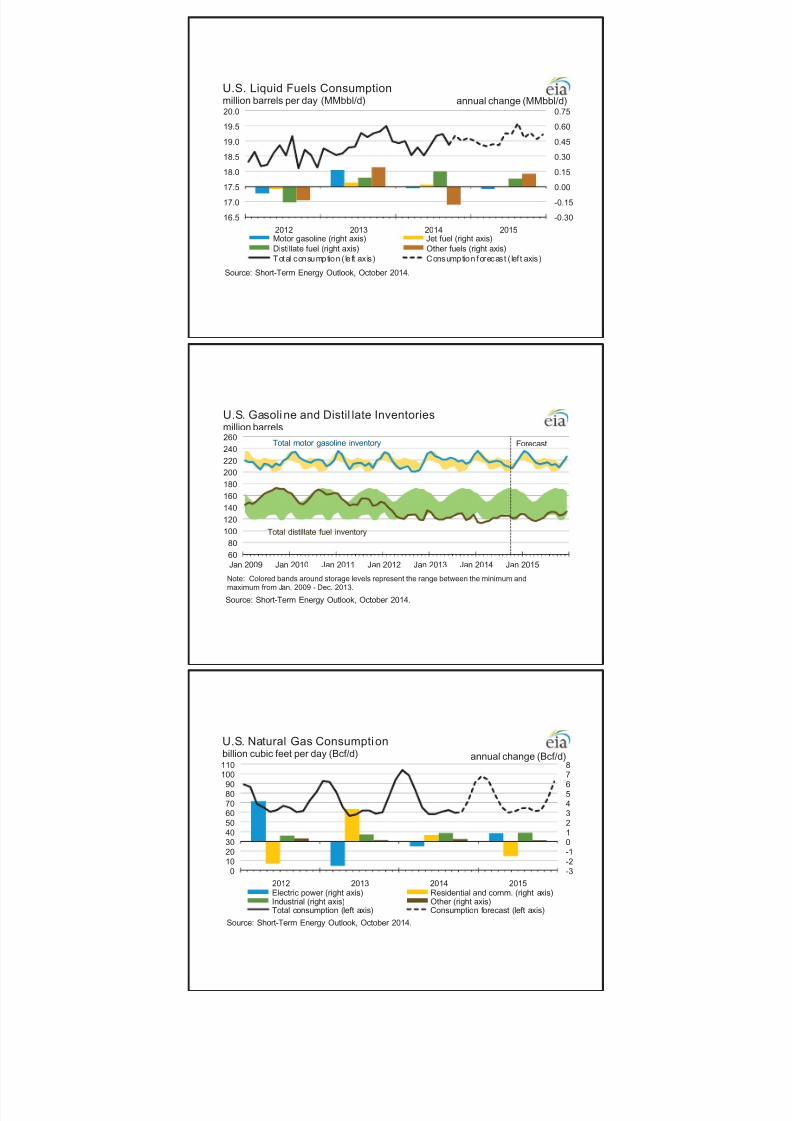
Liquid Fuels Supply. The forecast for total U.S. crude oil production increases from 7.4 million
bbl/d in 2013 to 8.5 million bbl/d in 2014 and 9.5 million bbl/d in 2015. The highest previous
annual
average
U.S.
production
level
was
9.6
million
bbl/d
in
1970.
Oil
production
from
the
Gulf
of Mexico is expected to increase from 1.3 million bbl/d in 2013 to 1.6 million bbl/d in 2015,
with 11 projects starting this year. Six projects began production in the first half of 2014: Na
Kika Phase 3, Mars B, Dalmatian, Entrada, Atlantis Phase 2, and Tubular Bells. Additional wells
are expected to come online in the fourth quarter of 2014 from the Cardamom Deep, South
Deimos/West Boreas, Hadrian South, Jack/St. Malo, and Lucius projects.
8/10/2019 Short Term Energy Outlook_EIA
http://slidepdf.com/reader/full/short-term-energy-outlookeia 8/48
U.S. Energy Information Administration | Short‐Term Energy and Winter Fuels Outlook October 2014 8
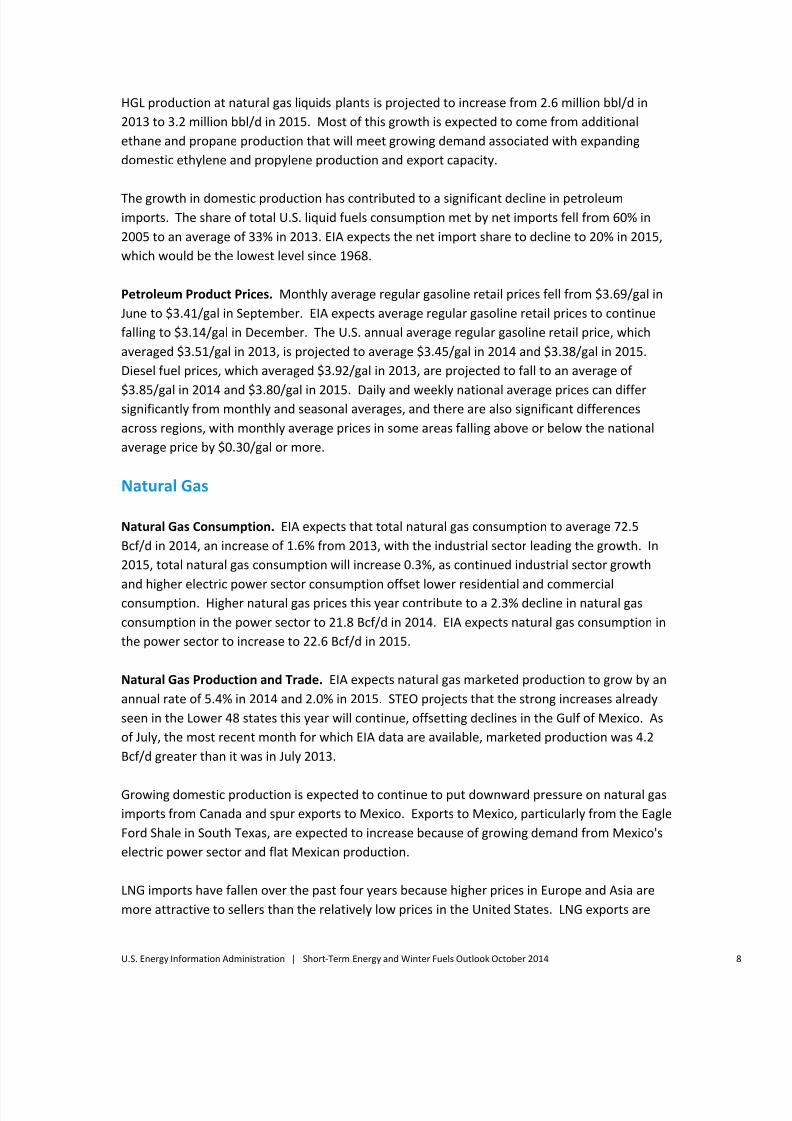
HGL production at natural gas liquids plants is projected to increase from 2.6 million bbl/d in
2013 to 3.2 million bbl/d in 2015. Most of this growth is expected to come from additional
ethane and propane production that will meet growing demand associated with expanding
domestic ethylene and propylene production and export capacity.
The growth
in
domestic
production
has
contributed
to
a significant
decline
in
petroleum
imports. The share of total U.S. liquid fuels consumption met by net imports fell from 60% in
2005 to an average of 33% in 2013. EIA expects the net import share to decline to 20% in 2015,
which would be the lowest level since 1968.
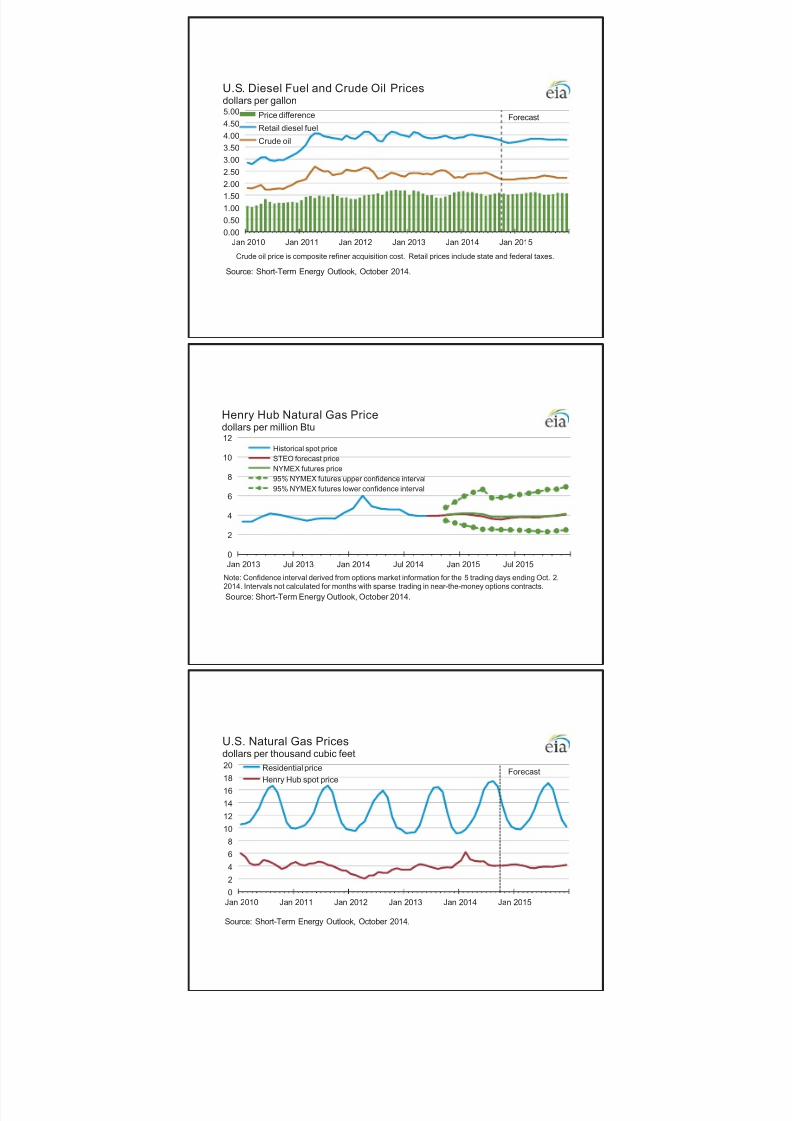
Petroleum Product Prices. Monthly average regular gasoline retail prices fell from $3.69/gal in
June to $3.41/gal in September. EIA expects average regular gasoline retail prices to continue
falling to $3.14/gal in December. The U.S. annual average regular gasoline retail price, which
averaged $3.51/gal in 2013, is projected to average $3.45/gal in 2014 and $3.38/gal in 2015.
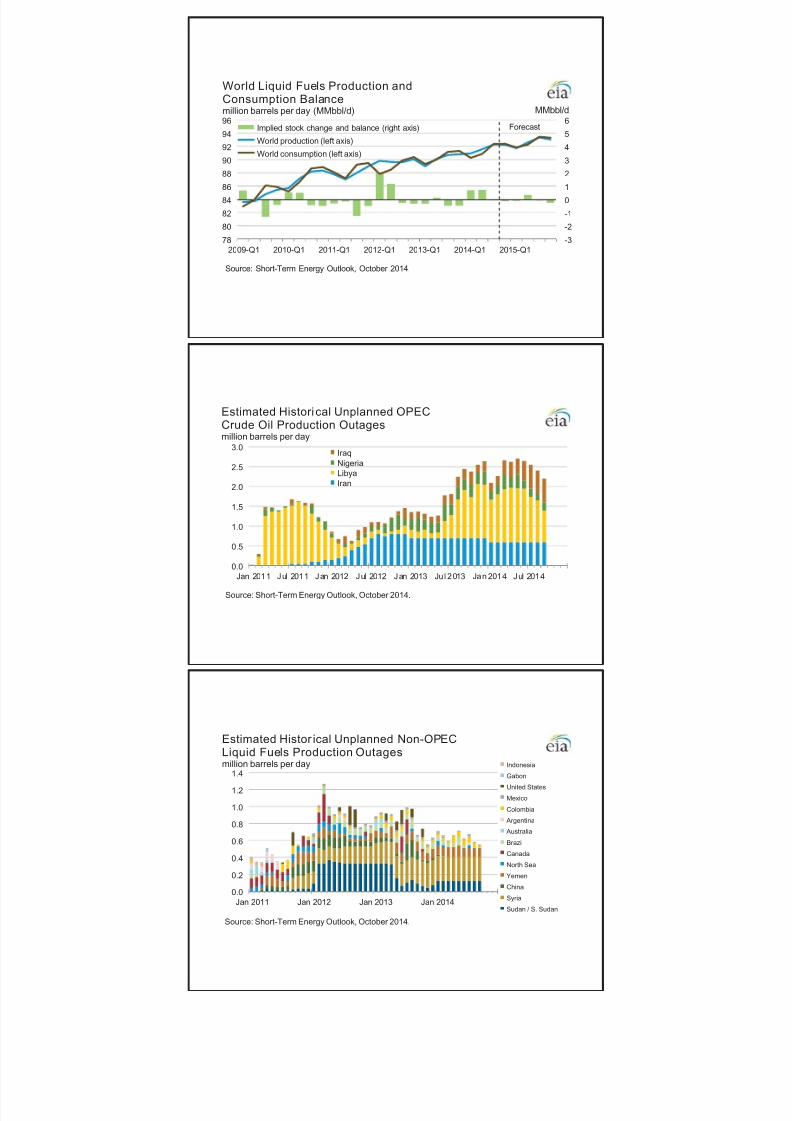
Diesel fuel prices, which averaged $3.92/gal in 2013, are projected to fall to an average of
$3.85/gal in
2014
and
$3.80/gal
in
2015.
Daily
and
weekly
national
average
prices
can
differ
significantly from monthly and seasonal averages, and there are also significant differences
across regions, with monthly average prices in some areas falling above or below the national
average price by $0.30/gal or more.
Natural Gas
Natural Gas Consumption. EIA expects that total natural gas consumption to average 72.5
Bcf/d in 2014, an increase of 1.6% from 2013, with the industrial sector leading the growth. In
2015, total natural gas consumption will increase 0.3%, as continued industrial sector growth
and higher
electric
power
sector
consumption
offset
lower
residential
and
commercial
consumption. Higher natural gas prices this year contribute to a 2.3% decline in natural gas
consumption in the power sector to 21.8 Bcf/d in 2014. EIA expects natural gas consumption in
the power sector to increase to 22.6 Bcf/d in 2015.
Natural Gas Production and Trade. EIA expects natural gas marketed production to grow by an
annual rate of 5.4% in 2014 and 2.0% in 2015. STEO projects that the strong increases already
seen in the Lower 48 states this year will continue, offsetting declines in the Gulf of Mexico. As
of July, the most recent month for which EIA data are available, marketed production was 4.2
Bcf/d greater than it was in July 2013.
Growing domestic production is expected to continue to put downward pressure on natural gas
imports from Canada and spur exports to Mexico. Exports to Mexico, particularly from the Eagle
Ford Shale in South Texas, are expected to increase because of growing demand from Mexico's
electric power sector and flat Mexican production.
LNG imports have fallen over the past four years because higher prices in Europe and Asia are
more attractive to sellers than the relatively low prices in the United States. LNG exports are
8/10/2019 Short Term Energy Outlook_EIA
http://slidepdf.com/reader/full/short-term-energy-outlookeia 9/48
U.S. Energy Information Administration | Short‐Term Energy and Winter Fuels Outlook October 2014 9
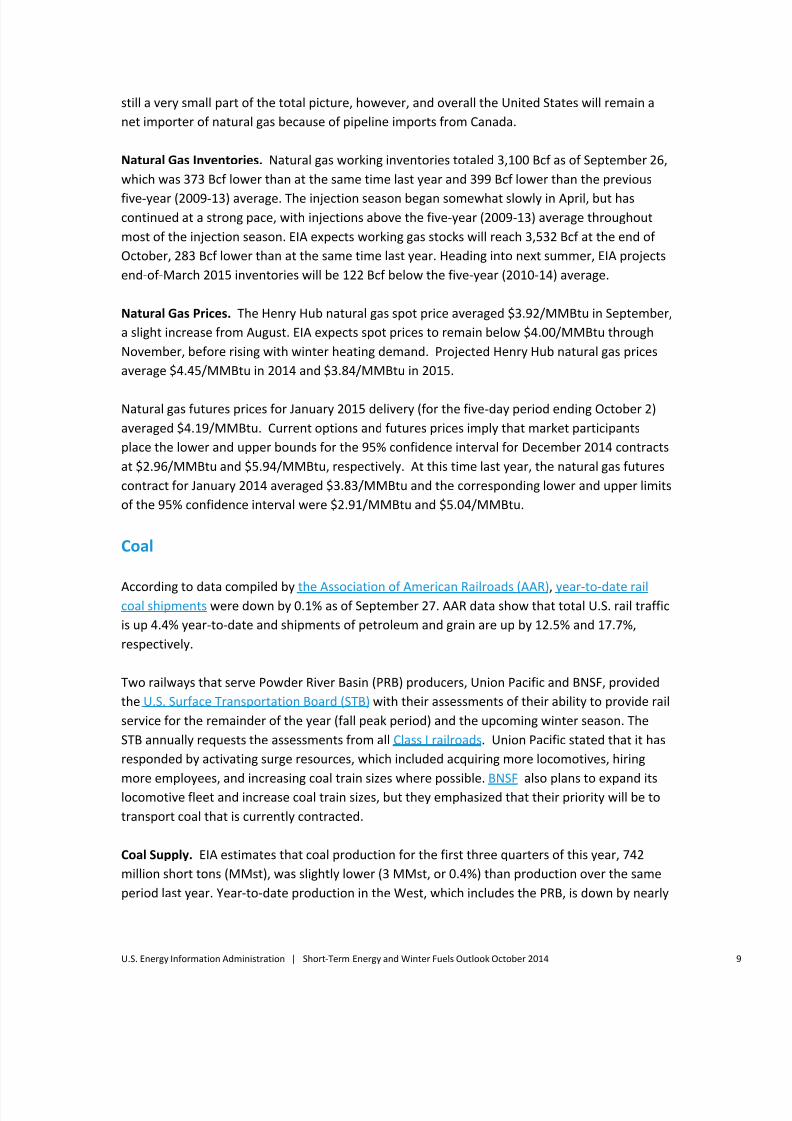
still a very small part of the total picture, however, and overall the United States will remain a
net importer of natural gas because of pipeline imports from Canada.
Natural Gas Inventories. Natural gas working inventories totaled 3,100 Bcf as of September 26,
which was 373 Bcf lower than at the same time last year and 399 Bcf lower than the previous
five‐year
(2009
‐13)
average.
The
injection
season
began
somewhat
slowly
in
April,
but
has
continued at a strong pace, with injections above the five‐year (2009‐13) average throughout
most of the injection season. EIA expects working gas stocks will reach 3,532 Bcf at the end of
October, 283 Bcf lower than at the same time last year. Heading into next summer, EIA projects
end‐of ‐March 2015 inventories will be 122 Bcf below the five‐year (2010‐14) average.
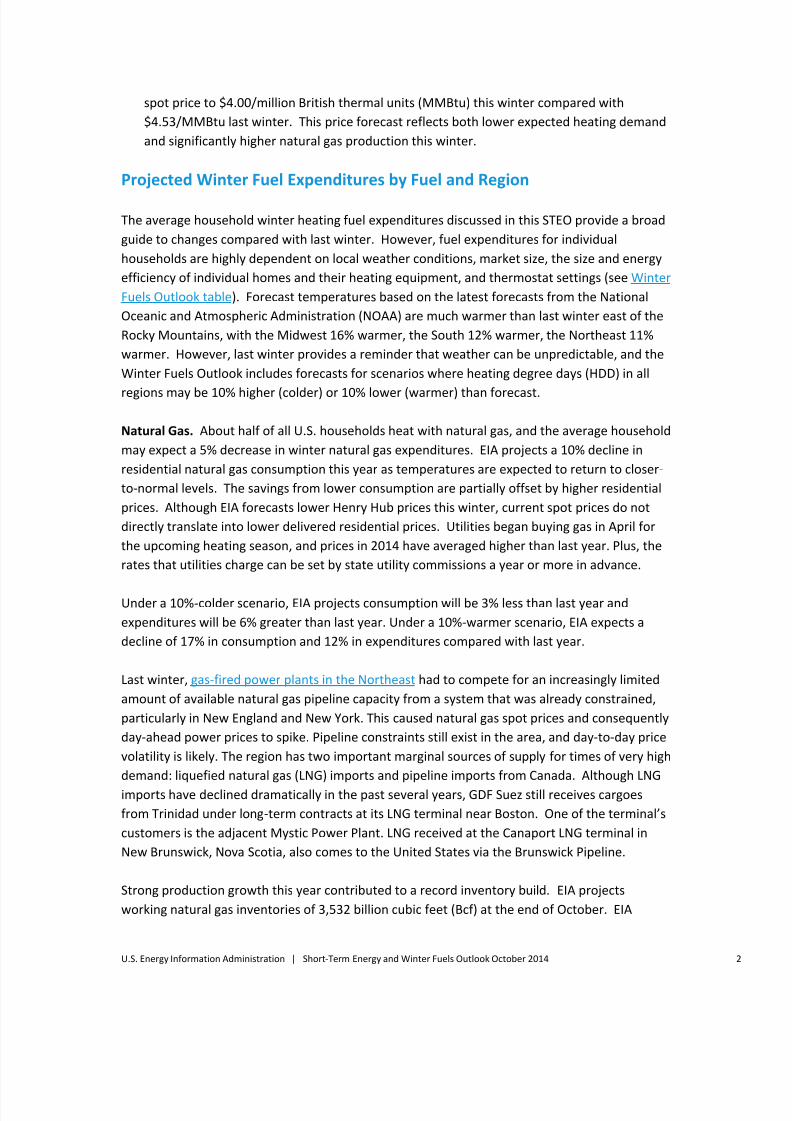
Natural Gas Prices. The Henry Hub natural gas spot price averaged $3.92/MMBtu in September,
a slight increase from August. EIA expects spot prices to remain below $4.00/MMBtu through
November, before rising with winter heating demand. Projected Henry Hub natural gas prices
average $4.45/MMBtu in 2014 and $3.84/MMBtu in 2015.
Natural gas futures prices for January 2015 delivery (for the five‐day period ending October 2)
averaged $4.19/MMBtu. Current options and futures prices imply that market participants
place the lower and upper bounds for the 95% confidence interval for December 2014 contracts
at $2.96/MMBtu and $5.94/MMBtu, respectively. At this time last year, the natural gas futures
contract for January 2014 averaged $3.83/MMBtu and the corresponding lower and upper limits
of the 95% confidence interval were $2.91/MMBtu and $5.04/MMBtu.
Coal
According to
data
compiled
by
the
Association
of
American
Railroads
(AAR),
year
‐to
‐date
rail
coal shipments were down by 0.1% as of September 27. AAR data show that total U.S. rail traffic
is up 4.4% year‐to‐date and shipments of petroleum and grain are up by 12.5% and 17.7%,
respectively.
Two railways that serve Powder River Basin (PRB) producers, Union Pacific and BNSF, provided
the U.S. Surface Transportation Board (STB) with their assessments of their ability to provide rail
service for the remainder of the year (fall peak period) and the upcoming winter season. The
STB annually requests the assessments from all Class I railroads. Union Pacific stated that it has
responded by activating surge resources, which included acquiring more locomotives, hiring
more employees,
and
increasing
coal
train
sizes
where
possible.
BNSF
also
plans
to
expand
its
locomotive fleet and increase coal train sizes, but they emphasized that their priority will be to
transport coal that is currently contracted.
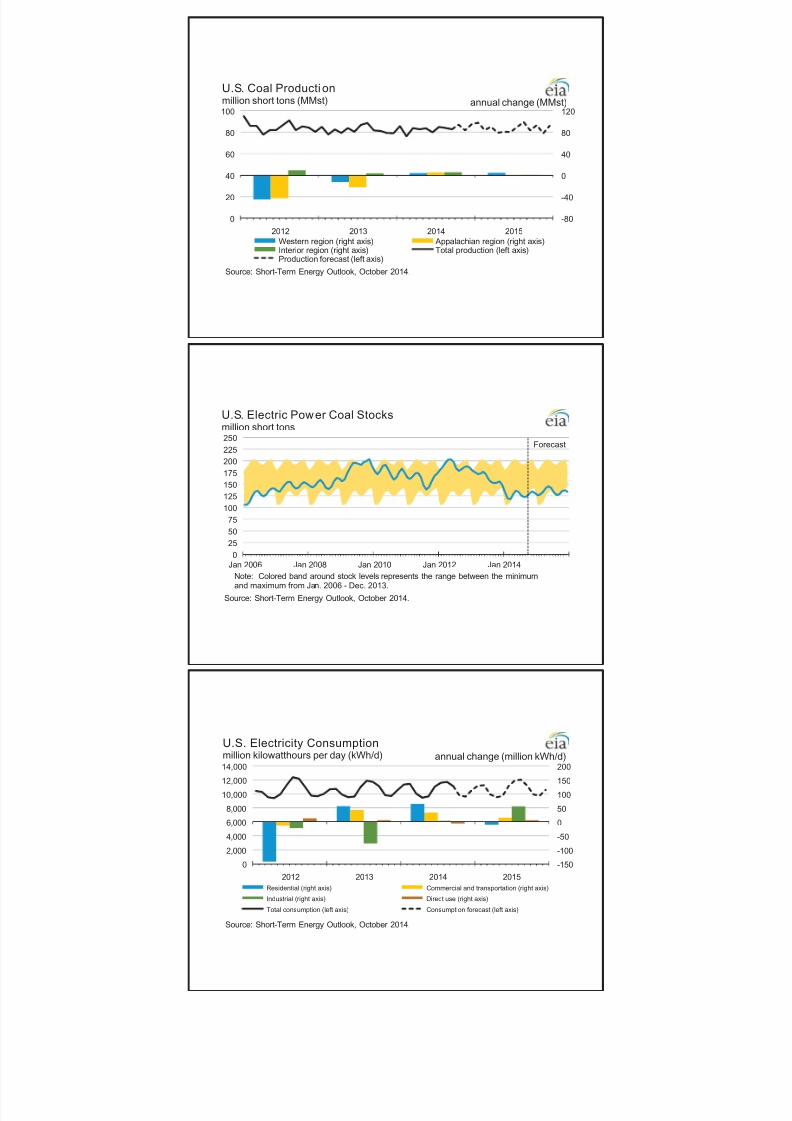
Coal Supply. EIA estimates that coal production for the first three quarters of this year, 742
million short tons (MMst), was slightly lower (3 MMst, or 0.4%) than production over the same
period last year. Year‐to‐date production in the West, which includes the PRB, is down by nearly
8/10/2019 Short Term Energy Outlook_EIA
http://slidepdf.com/reader/full/short-term-energy-outlookeia 10/48
U.S. Energy Information Administration | Short‐Term Energy and Winter Fuels Outlook October 2014 10
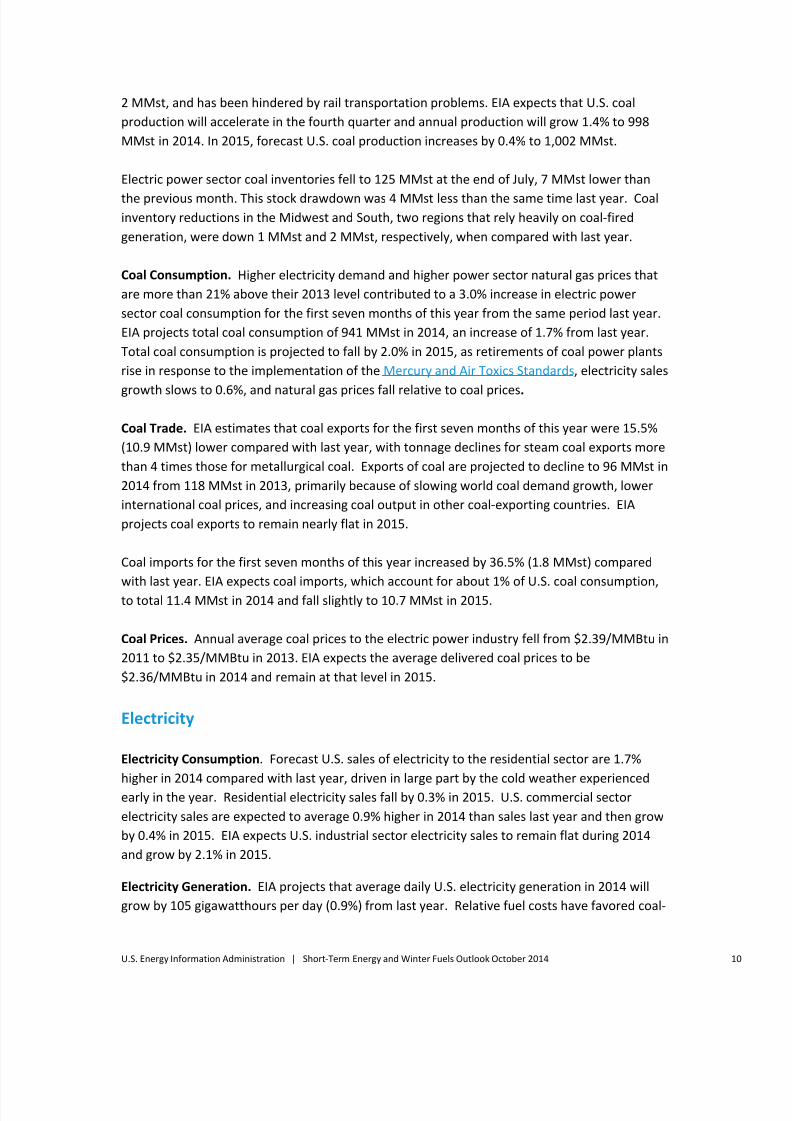
2 MMst, and has been hindered by rail transportation problems. EIA expects that U.S. coal
production will accelerate in the fourth quarter and annual production will grow 1.4% to 998
MMst in 2014. In 2015, forecast U.S. coal production increases by 0.4% to 1,002 MMst.
Electric power sector coal inventories fell to 125 MMst at the end of July, 7 MMst lower than
the previous
month.
This
stock
drawdown
was
4 MMst
less
than
the
same
time
last
year.
Coal
inventory reductions in the Midwest and South, two regions that rely heavily on coal‐fired
generation, were down 1 MMst and 2 MMst, respectively, when compared with last year.
Coal Consumption. Higher electricity demand and higher power sector natural gas prices that
are more than 21% above their 2013 level contributed to a 3.0% increase in electric power
sector coal consumption for the first seven months of this year from the same period last year.
EIA projects total coal consumption of 941 MMst in 2014, an increase of 1.7% from last year.
Total coal consumption is projected to fall by 2.0% in 2015, as retirements of coal power plants
rise in response to the implementation of the Mercury and Air Toxics Standards, electricity sales
growth slows
to
0.6%,
and
natural
gas
prices
fall
relative
to
coal
prices.
Coal Trade. EIA estimates that coal exports for the first seven months of this year were 15.5%
(10.9 MMst) lower compared with last year, with tonnage declines for steam coal exports more
than 4 times those for metallurgical coal. Exports of coal are projected to decline to 96 MMst in
2014 from 118 MMst in 2013, primarily because of slowing world coal demand growth, lower
international coal prices, and increasing coal output in other coal‐exporting countries. EIA
projects coal exports to remain nearly flat in 2015.
Coal imports for the first seven months of this year increased by 36.5% (1.8 MMst) compared
with last
year.
EIA
expects
coal
imports,
which
account
for
about
1%
of
U.S.
coal
consumption,
to total 11.4 MMst in 2014 and fall slightly to 10.7 MMst in 2015.
Coal Prices. Annual average coal prices to the electric power industry fell from $2.39/MMBtu in
2011 to $2.35/MMBtu in 2013. EIA expects the average delivered coal prices to be
$2.36/MMBtu in 2014 and remain at that level in 2015.
Electricity
Electricity Consumption. Forecast U.S. sales of electricity to the residential sector are 1.7%
higher in
2014
compared
with
last
year,
driven
in
large
part
by
the
cold
weather
experienced
early in the year. Residential electricity sales fall by 0.3% in 2015. U.S. commercial sector
electricity sales are expected to average 0.9% higher in 2014 than sales last year and then grow
by 0.4% in 2015. EIA expects U.S. industrial sector electricity sales to remain flat during 2014
and grow by 2.1% in 2015.
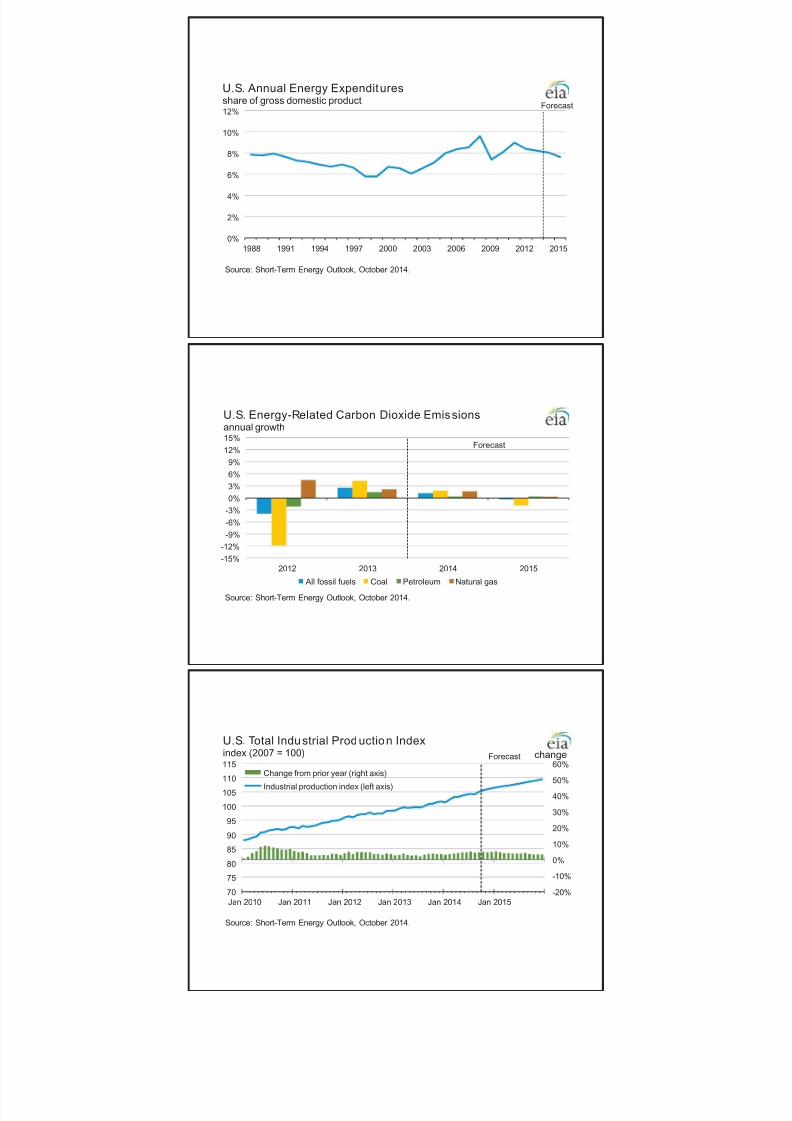
Electricity Generation. EIA projects that average daily U.S. electricity generation in 2014 will
grow by 105 gigawatthours per day (0.9%) from last year. Relative fuel costs have favored coal‐

8/10/2019 Short Term Energy Outlook_EIA
http://slidepdf.com/reader/full/short-term-energy-outlookeia 11/48
U.S. Energy Information Administration | Short‐Term Energy and Winter Fuels Outlook October 2014 11
fired generation over natural gas this year, leading to an expected increase in coal’s share of
total generation from 39.1% in 2013 to 39.8% this year, while the share supplied by natural gas
falls from 27.4% to 26.8%. In 2015, EIA expects that natural gas' fuel share will rise to 27.6% and
coal's fuel share will decline to 38.7%.
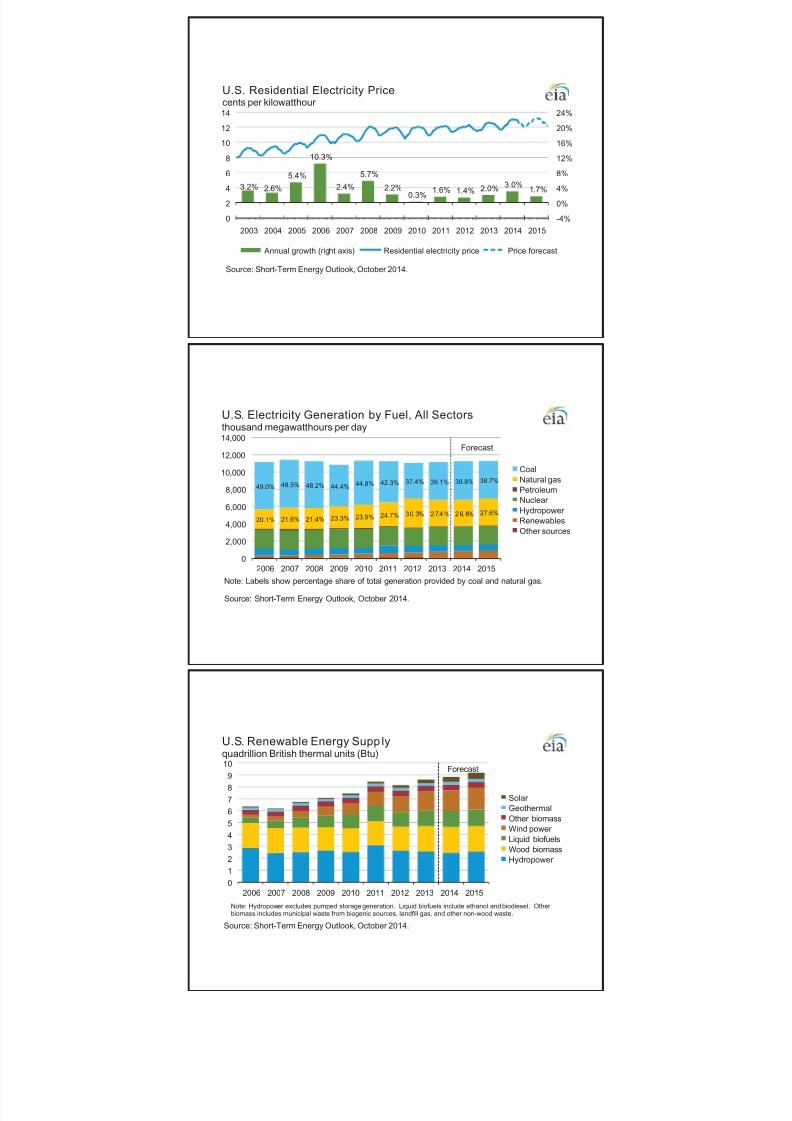
Electricity Retail
Prices.
EIA
expects
the
U.S.
residential
price
to
average
12.5
cents
per
kilowatthour in 2014, which is 3.0% higher than the average last year. Prices increase in all
regions of the country except along the Pacific Coast. Average U.S. residential electricity prices
grow at a slower rate of 1.7% in 2015.
Renewables and Carbon Dioxide Emissions
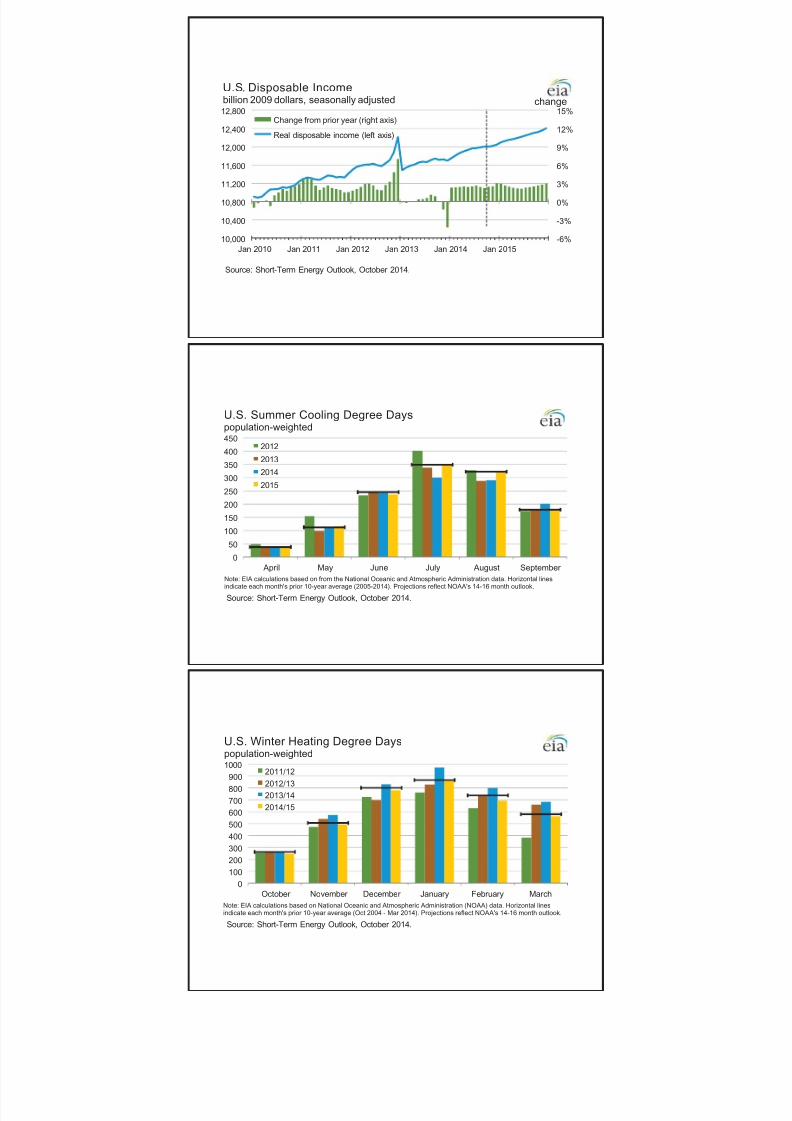
Electricity and Heat Generation from Renewables. EIA projects that total renewables used for
electricity and heat generation will grow by 2.2% in 2014. Conventional hydropower generation
is projected to fall by 4.2%, while nonhydropower renewables rise by 5.6%. Nonhydropower
renewables generation
surpasses
hydropower
on
an
annual
basis
for
the
first
time
in
2014.
In
2015, total renewables consumption for electric power and heat generation increases by 4.6%,
as a result of a 4.3% increase in hydropower and a 4.7% increase in nonhydropower renewables.
EIA projects that wind power capacity will increase by 8.8% in 2014 and 16.2% in 2015.
Electricity generation from wind is projected to contribute 4.7% of total electricity generation in
2015.
EIA expects continued robust growth in solar electricity generation, although the amount of
utility‐scale generation remains a small share of total U.S. generation at about 0.6% in 2015.
While solar
growth
has
historically
been
concentrated
in
customer
‐sited
distributed
generation
installations, utility‐scale solar capacity slightly more than doubled in 2013. EIA expects that
utility‐scale solar capacity will about double again between the end of 2013 and the end of
2015; about two‐thirds of this new capacity is being built in California. However, customer‐sited
photovoltaic capacity growth, which the STEO does not forecast, is expected to exceed utility‐
scale solar growth between 2013 and 2015, according to EIA's Annual Energy Outlook 2014.
Liquid Biofuels. Ethanol production in June matched the monthly average production record of
959,000 bbl/d set in December 2011, and then fell back to an average of 909,000 bbl/d in
September. EIA expects ethanol production to average 927,000 bbl/d in 2014 and 933,000 bbl/d
in
2015.
Biodiesel
production
averaged
89,000
bbl/d
in
2013
and
is
forecast
to
average
81,000
bbl/d in 2014 and 84,000 bbl/d in 2015.
Energy‐Related Carbon Dioxide Emissions. EIA estimates that carbon dioxide emissions from
fossil fuels increased by 2.5% in 2013 from the previous year. Emissions are forecast to rise by
1.1% in 2014, and then to decline by 0.4% in 2015. The increase in total emissions in 2013 and
2014 reflects increases in emissions from coal of 4.2% and 1.8%, respectively. The price of
natural gas to electric power generators was $0.91/MMBtu above its 2012 level in 2013 and is
8/10/2019 Short Term Energy Outlook_EIA
http://slidepdf.com/reader/full/short-term-energy-outlookeia 12/48
U.S. Energy Information Administration | Short‐Term Energy and Winter Fuels Outlook October 2014 12
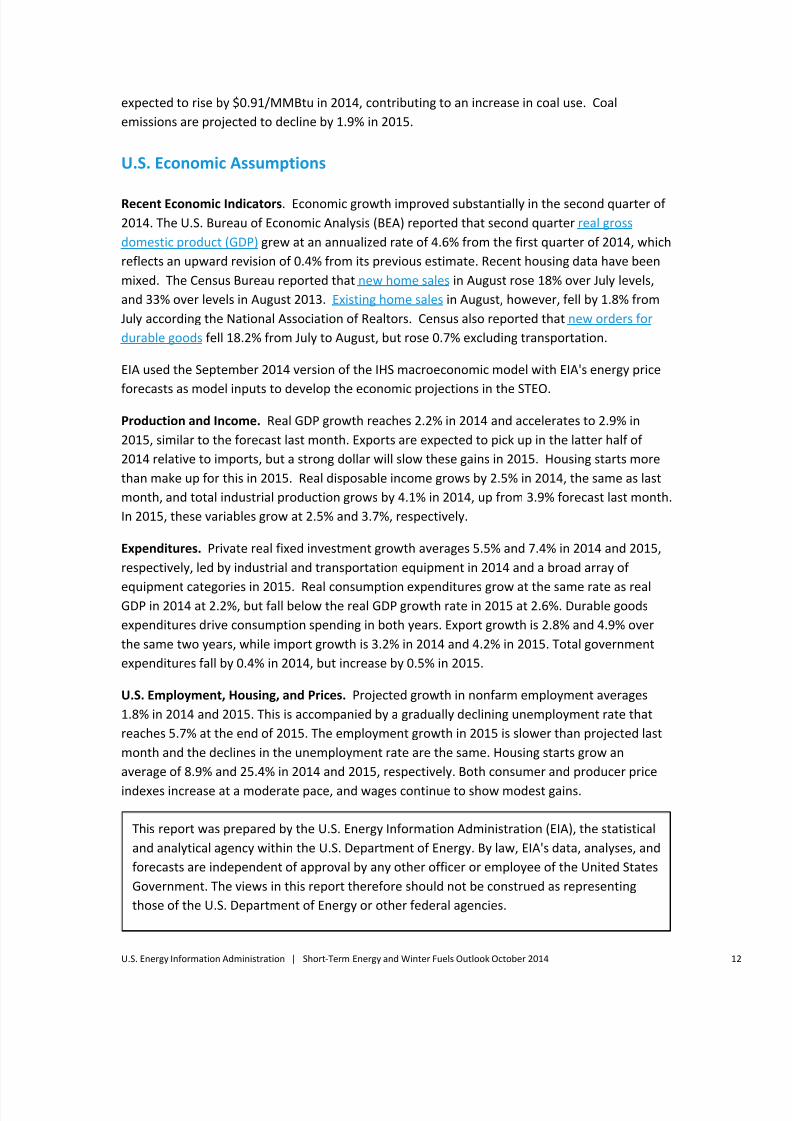
expected to rise by $0.91/MMBtu in 2014, contributing to an increase in coal use. Coal
emissions are projected to decline by 1.9% in 2015.
U.S. Economic Assumptions
Recent Economic Indicators. Economic growth improved substantially in the second quarter of
2014. The U.S. Bureau of Economic Analysis (BEA) reported that second quarter real gross
domestic product (GDP) grew at an annualized rate of 4.6% from the first quarter of 2014, which
reflects an upward revision of 0.4% from its previous estimate. Recent housing data have been
mixed. The Census Bureau reported that new home sales in August rose 18% over July levels,
and 33% over levels in August 2013. Existing home sales in August, however, fell by 1.8% from
July according the National Association of Realtors. Census also reported that new orders for
durable goods fell 18.2% from July to August, but rose 0.7% excluding transportation.
EIA used the September 2014 version of the IHS macroeconomic model with EIA's energy price
forecasts as
model
inputs
to
develop
the
economic
projections
in
the
STEO.
Production and Income. Real GDP growth reaches 2.2% in 2014 and accelerates to 2.9% in
2015, similar to the forecast last month. Exports are expected to pick up in the latter half of
2014 relative to imports, but a strong dollar will slow these gains in 2015. Housing starts more
than make up for this in 2015. Real disposable income grows by 2.5% in 2014, the same as last
month, and total industrial production grows by 4.1% in 2014, up from 3.9% forecast last month.
In 2015, these variables grow at 2.5% and 3.7%, respectively.
Expenditures. Private real fixed investment growth averages 5.5% and 7.4% in 2014 and 2015,
respectively, led by industrial and transportation equipment in 2014 and a broad array of
equipment categories
in
2015.
Real
consumption
expenditures
grow
at
the
same
rate
as
real
GDP in 2014 at 2.2%, but fall below the real GDP growth rate in 2015 at 2.6%. Durable goods
expenditures drive consumption spending in both years. Export growth is 2.8% and 4.9% over
the same two years, while import growth is 3.2% in 2014 and 4.2% in 2015. Total government
expenditures fall by 0.4% in 2014, but increase by 0.5% in 2015.
U.S. Employment, Housing, and Prices. Projected growth in nonfarm employment averages
1.8% in 2014 and 2015. This is accompanied by a gradually declining unemployment rate that
reaches 5.7% at the end of 2015. The employment growth in 2015 is slower than projected last
month and the declines in the unemployment rate are the same. Housing starts grow an
average of 8.9% and 25.4% in 2014 and 2015, respectively. Both consumer and producer price
indexes increase at a moderate pace, and wages continue to show modest gains.
This report was prepared by the U.S. Energy Information Administration (EIA), the statistical
and analytical agency within the U.S. Department of Energy. By law, EIA's data, analyses, and
forecasts are independent of approval by any other officer or employee of the United States
Government. The views in this report therefore should not be construed as representing
those of the U.S. Department of Energy or other federal agencies.
8/10/2019 Short Term Energy Outlook_EIA
http://slidepdf.com/reader/full/short-term-energy-outlookeia 13/48
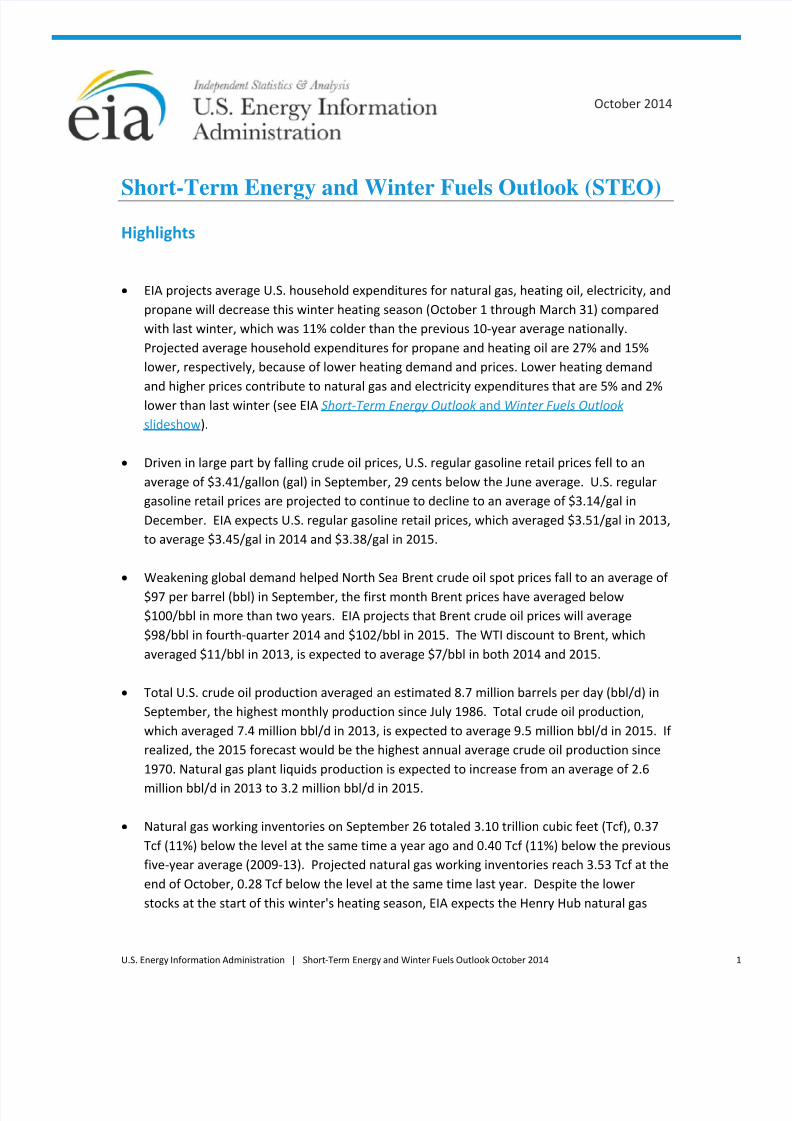
Chart Gallery for October 2014
Short-Term Energy Outlook
U.S. Energy Information Administration Independent Statistics & Analysis
0
20
40
60
80
100
120
140
160
180
200
220
Jan 2013 Jul 2013 Jan 2014 Jul 2014 Jan 2015 Jul 2015
West Texas Intermediate (WTI) Crude Oil Pricedollars per barrel
Historical spot priceSTEO price forecastNYMEX futures price95% NYMEX futures upper confidence interval95% NYMEX futures lower confidence interval
Source: Short-Term Energy Outlook, October 2014.
Note: Confidence interval derived from options market information for the 5 trading days ending Oct. 2,2014. Intervals not calculated for months with sparse trading in near-the-money options contracts.
Forecast
0.00
0.50
1.00
1.50
2.00
2.50
3.00
3.50
4.004.50
5.00
Jan 2010 Jan 2011 Jan 2012 Jan 2013 Jan 2014 Jan 2015
U.S. Gasoline and Crude Oil Pricesdollars per gallon
Price difference
Retail regular gasoline
Crude oil
Source: Short-Term Energy Outlook, October 2014.
Crude oil price is composite refiner acquisition cost. Retail prices include state and federal taxes.
8/10/2019 Short Term Energy Outlook_EIA
http://slidepdf.com/reader/full/short-term-energy-outlookeia 14/48
Forecast
0.00
0.50
1.00
1.50
2.00
2.50
3.00
3.50
4.00
4.50
5.00
Jan 2010 Jan 2011 Jan 2012 Jan 2013 Jan 2014 Jan 2015
U.S. Diesel Fuel and Crude Oil Pricesdollars per gallon
Price difference
Retail diesel fuel
Crude oil
Source: Short-Term Energy Outlook, October 2014.
Crude oil price is composite refiner acquisition cost. Retail prices include state and federal taxes.
0
2
4
6
8
10
12
Jan 2013 Jul 2013 Jan 2014 Jul 2014 Jan 2015 Jul 2015
Henry Hub Natural Gas Pricedollars per million Btu
Historical spot price
STEO forecast price
NYMEX futures price
95% NYMEX futures upper confidence interval
95% NYMEX futures lower confidence interval
Source: Short-Term Energy Outlook, October 2014.
Note: Confidence interval derived from options market information for the 5 trading days ending Oct. 2,
2014. Intervals not calculated for months with sparse trading in near-the-money options contracts.
Forecast
0
2
4
6
8
10
12
14
1618
20
Jan 2010 Jan 2011 Jan 2012 Jan 2013 Jan 2014 Jan 2015
U.S. Natural Gas Pricesdollars per thousand cubic feet
Residential price
Henry Hub spot price
Source: Short-Term Energy Outlook, October 2014.
8/10/2019 Short Term Energy Outlook_EIA
http://slidepdf.com/reader/full/short-term-energy-outlookeia 15/48
Forecast
-3
-2
-1
0
1
2
3
4
5
6
78
80
82
84
86
88
90
92
94
96
2009-Q1 2010-Q1 2011-Q1 2012-Q1 2013-Q1 2014-Q1 2015-Q1
World Liquid Fuels Production andConsumption Balancemillion barrels per day (MMbbl/d)
Implied stock change and balance (right axis)
World production (left axis)
World consumption (left axis)
Source: Short-Term Energy Outlook, October 2014.
MMbbl/d
0.0
0.5
1.0
1.5
2.0
2.5
3.0
Jan 2011 Jul 2011 Jan 2012 Jul 2012 Jan 2013 Ju l 2013 Jan 2014 Jul 2014
Estimated Historical Unplanned OPECCrude Oil Production Outagesmillion barrels per day
Iraq
Nigeria
Libya
Iran
Source: Short-Term Energy Outlook, October 2014.
0.0
0.2
0.4
0.6
0.8
1.0
1.2
1.4
Jan 2011 Jan 2012 Jan 2013 Jan 2014
Estimated Histor ical Unplanned Non-OPECLiquid Fuels Production Outagesmillion barrels per day Indonesia
Gabon
United States
Mexico
Colombia
Argentina
Australia
Brazil
Canada
North Sea
Yemen
China
Syria
Sudan / S. Sudan
Source: Short-Term Energy Outlook, October 2014.
8/10/2019 Short Term Energy Outlook_EIA
http://slidepdf.com/reader/full/short-term-energy-outlookeia 16/48
-2
-1
0
1
2
3
4
5
6
7
76
78
80
82
84
86
88
90
92
94
2007 2008 2009 2010 2011 2012 2013 2014 2015
World Liquid Fuels Consumptionmillion barrels per day (MMbbl/d)
Change in U.S. consumption (right axis)
Change in China consumption (right axis)
Change in other consumption (right axis)
Total world consumption (left axis)
annual change (MMbbl/d)
Source: Short-Term Energy Outlook, October 2014.
-0.4
-0.2
0.0
0.2
0.4
0.6
0.8
1.0
2013 2014 2015
World Liquid Fuels Consumption Growthmillion barrels per day
OECD* Non-OECD Asia Former Soviet Union Other
Source: Short-Term Energy Outlook, October 2014.* Countries belonging to the Organization for Economic Cooperation and Development
Forecast
-1.5
-1.0
-0.5
0.0
0.5
1.0
1.5
2.0
2013 2014 2015
OPEC countries North America Russia and Caspian Sea
Latin America North Sea Other Non-OPEC
World Crude Oil and Liquid Fuels Production Growthmillion barrels per day
Source: Short-Term Energy Outlook, October 2014.
Forecast

8/10/2019 Short Term Energy Outlook_EIA
http://slidepdf.com/reader/full/short-term-energy-outlookeia 17/48
-1.0-0.50.00.51.01.52.02.53.03.54.04.5
U n i t e d S t a t e s
C a n a d a
C h i n a
R u s s i a
B r a z i l
S u d a n / S .
S u d a n
K a z a k h s t a n
O m a n
C o l o m b i a
M a l a y s i a
I n d i a
V i e t n a m
G a b o n
O t h e r N o r t h S e a
A u s t r a l i a
E g y p t
N o r w a y
A z e r b a i j a n
S y r i a
M e x i c o
U n i t e d K i n g d o m
2015
2014
2013
Non-OPEC Crude Oil and Liquid Fuels Production Growthmillion barrels per day
Source: Short-Term Energy Outlook, October 2014.
Forecast
-100
-80
-60
-40
-20
0
20
40
60
80
2011-Q1 2012-Q1 2013-Q1 2014-Q1 2015-Q1-1
0
1
2
3
4
5
6
7
8 World oil consumption growth (left axis)
Non-OPEC production growth (left axis)
Change in WTI price (right axis)
World Consumption and Non-OPEC Production Growthmillion barrels per day dollars per barrel
Source: Short-Term Energy Outlook, October 2014.
0
1
2
3
4
5
6
2003 2004 2005 2006 2007 2008 2009 2010 2011 2012 2013 2014 2015
OPEC surplus crude oil production capacitymillion barrels per day
Source: Short-Term Energy Outlook, October 2014.
Note: Shaded area represents 2003-2013 average (2.2 million barrels per day).
Forecast
8/10/2019 Short Term Energy Outlook_EIA
http://slidepdf.com/reader/full/short-term-energy-outlookeia 18/48
Forecast
40
45
50
55
60
65
70
Jan 2009 Jan 2010 Jan 2011 Jan 2012 Jan 2013 Jan 2014 Jan 2015
OECD Commercial Crude Oil Stocksdays of supply
Source: Short-Term Energy Outlook, October 2014.
Note: Colored band around crude oil stocks days of supply represents the range between theminimum and maximum from Jan. 2009 - Dec. 2013.
-0.2
0.0
0.2
0.4
0.6
0.8
1.0
1.2
1.4
1.6
2012 2013 2014 2015
6
7
8
9
10
11
12
13
14
15
U.S. Crude Oil and Liquid Fuels Productionmillion barrels per day (MMbbl/d)
Crude oil (right axis) Natural gas plant liquids (right axis)
Fuel ethanol (right axis) Biodiesel (right axis)
Total production (left axis) Production forecast (left axis)
annual change (MMbbl/d)
Source: Short-Term Energy Outlook, October 2014.
Forecast
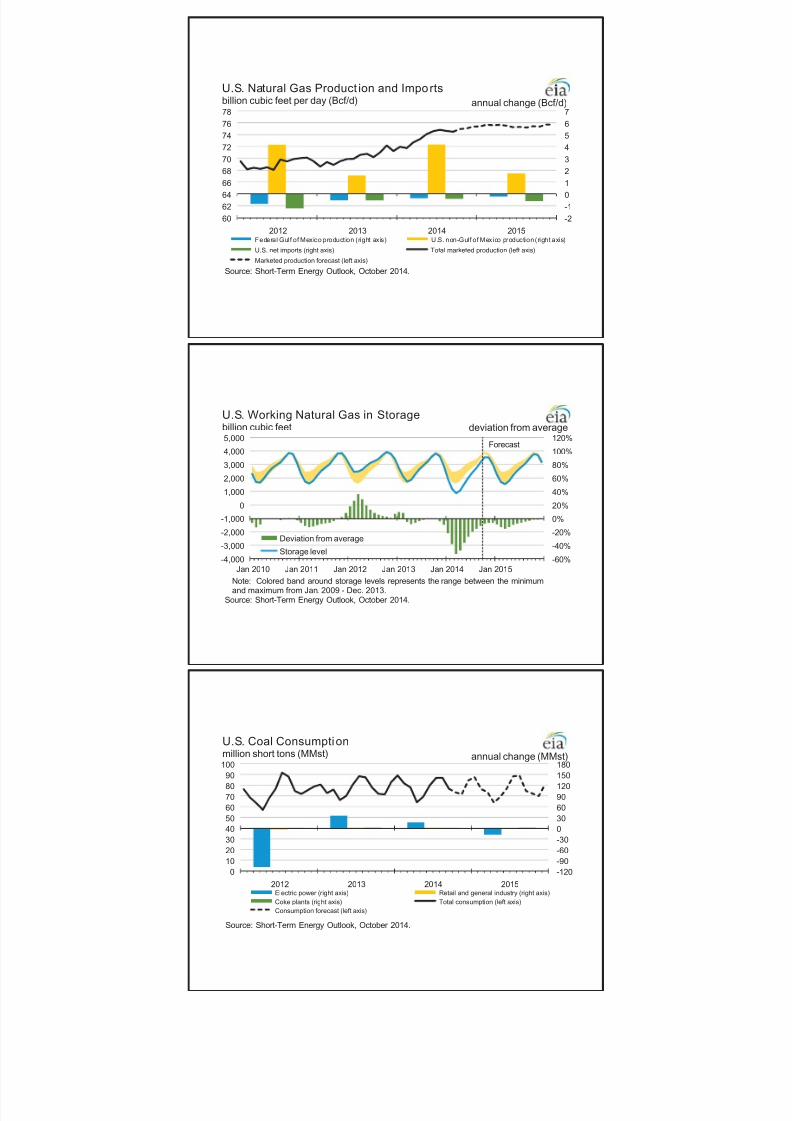
250
275
300
325
350
375
400
425
Jan 2009 Jan 2010 Jan 2011 Jan 2012 Jan 2013 Jan 2014 Jan 2015
U.S. Commercial Crude Oil Stocksmillion barrels
Source: Short-Term Energy Outlook, October 2014.
Note: Colored band around storage levels represents the range between the minimum andmaximum from Jan. 2009 - Dec. 2013.
8/10/2019 Short Term Energy Outlook_EIA
http://slidepdf.com/reader/full/short-term-energy-outlookeia 19/48
-0.30
-0.15
0.00
0.15
0.30
0.45
0.60
0.75
2012 2013 2014 2015
16.5
17.0
17.5
18.0
18.5
19.0
19.5
20.0
U.S. Liquid Fuels Consumptionmillion barrels per day (MMbbl/d)
Motor gasoline (right axis) Jet fuel (right axis)
Distillate fuel (right axis) Other fuels (right axis)
Total consumption ( le ft ax is) Consumption forecast ( lef t axis)
annual change (MMbbl/d)
Source: Short-Term Energy Outlook, October 2014.
Forecast
60
80
100
120
140
160
180
200
220
240
260
Jan 2009 Jan 2010 Jan 2011 Jan 2012 Jan 2013 Jan 2014 Jan 2015
U.S. Gasoline and Distil late Inventoriesmillion barrels
Source: Short-Term Energy Outlook, October 2014.
Note: Colored bands around storage levels represent the range between the minimum and
maximum from Jan. 2009 - Dec. 2013.
Total motor gasoline inventory
Total distillate fuel inventory
-3-2-1012345678
2012 2013 2014 2015
0102030405060708090
100110
U.S. Natural Gas Consumptionbillion cubic feet per day (Bcf/d)
Electric power (right axis) Residential and comm. (right axis)Industrial (right axis) Other (right axis)Total consumption (left axis) Consumption forecast (left axis)
annual change (Bcf/d)
Source: Short-Term Energy Outlook, October 2014.
8/10/2019 Short Term Energy Outlook_EIA
http://slidepdf.com/reader/full/short-term-energy-outlookeia 20/48
-2
-10
1
2
3
4
5
6
7
2012 2013 2014 2015
60
6264
66
68
70
72
74
76
78
U.S. Natural Gas Product ion and Importsbillion cubic feet per day (Bcf/d)
Federal Gulf of Mexico production (right axis) U.S. non-Gulf of Mexico production (right axis)
U.S. net imports (right axis) Total marketed production (left axis)
Marketed production forecast (left axis)
annual change (Bcf/d)
Source: Short-Term Energy Outlook, October 2014.
Forecast
-60%
-40%
-20%
0%
20%
40%
60%
80%
100%
120%
-4,000
-3,000
-2,000
-1,000
0
1,000
2,000
3,000
4,000
5,000
Jan 2010 Jan 2011 Jan 2012 Jan 2013 Jan 2014 Jan 2015
U.S. Working Natural Gas in Storagebillion cubic feet
Deviation from average
Storage level
deviation from average
Source: Short-Term Energy Outlook, October 2014.
Note: Colored band around storage levels represents the range between the minimumand maximum from Jan. 2009 - Dec. 2013.
-120
-90
-60
-30
0
30
60
90
120150
180
2012 2013 2014 2015
0
10
20
30
40
50
60
70
8090
100
U.S. Coal Consumptionmillion short tons (MMst)
Electric power (right axis) Retail and general industry (right axis)
Coke plants (right axis) Total consumption (left axis)
Consumption forecast (left axis)
annual change (MMst)
Source: Short-Term Energy Outlook, October 2014.
8/10/2019 Short Term Energy Outlook_EIA
http://slidepdf.com/reader/full/short-term-energy-outlookeia 21/48
-80
-40
0
40
80
120
2012 2013 2014 2015
0
20
40
60
80
100
U.S. Coal Producti onmillion short tons (MMst)
Western region (right axis) Appalachian region (right axis)Interior region (right axis) Total production (left axis)Production forecast (left axis)
annual change (MMst)
Source: Short-Term Energy Outlook, October 2014.
Forecast
0
25
50
75
100
125
150
175
200
225
250
Jan 2006 Jan 2008 Jan 2010 Jan 2012 Jan 2014
U.S. Electric Power Coal Stocksmillion short tons
Source: Short-Term Energy Outlook, October 2014.
Note: Colored band around stock levels represents the range between the minimum
and maximum from Jan. 2006 - Dec. 2013.
-150
-100
-50
0
50
100
150
200
2012 2013 2014 2015
0
2,000
4,000
6,000
8,000
10,000
12,000
14,000
U.S. Electricity Consumptionmillion kilowatthours per day (kWh/d)
Residential (right axis) Commercial and transportation (right axis)
Industrial (right axis) Direct use (right axis)
Total consumption (left axis) Consumption forecast (left axis)
annual change (million kWh/d)
Source: Short-Term Energy Outlook, October 2014.
8/10/2019 Short Term Energy Outlook_EIA
http://slidepdf.com/reader/full/short-term-energy-outlookeia 22/48
3.2% 2.6%
5.4%
10.3%
2.4%
5.7%
2.2%
0.3%1.6%
1.4%
2.0%3.0%
1.7%
-4%
0%
4%
8%
12%
16%
20%
24%
2003 2004 2005 2006 2007 2008 2009 2010 2011 2012 2013 2014 2015
0
2
4
6
8
10
12
14
U.S. Residential Electricity Pricecents per kilowatthour
Annual growth (right axis) Residential electricity price Price forecast
Source: Short-Term Energy Outlook, October 2014.
20.1% 21.6% 21.4% 23.3% 23.9% 24.7% 30. 3% 27.4% 26. 8% 27.6%
49.0% 48.5% 48.2% 44.4% 44.8% 42.3% 37.4% 39.1% 39.8% 38.7%
Forecast
0
2,000
4,000
6,000
8,000
10,000
12,000
14,000
2006 2007 2008 2009 2010 2011 2012 2013 2014 2015
U.S. Electricity Generation by Fuel, All Sectorsthousand megawatthours per day
Coal
Natural gas
Petroleum
Nuclear
Hydropower
Renewables
Other sources
Source: Short-Term Energy Outlook, October 2014.
Note: Labels show percentage share of total generation provided by coal and natural gas.
Forecast
0
1
2
3
4
5
6
7
89
10
2006 2007 2008 2009 2010 2011 2012 2013 2014 2015
U.S. Renewable Energy Supp lyquadrillion British thermal units (Btu)
Solar
Geothermal
Other biomass
Wind power
Liquid biofuels
Wood biomass
Hydropower
Source: Short-Term Energy Outlook, October 2014.
Note: Hydropower excludes pumped storage generation. Liquid biofuels include ethanol and biodiesel. Otherbiomass includes municipal waste from biogenic sources, landfill gas, and other non-wood waste.
8/10/2019 Short Term Energy Outlook_EIA
http://slidepdf.com/reader/full/short-term-energy-outlookeia 23/48
Forecast
0%
2%
4%
6%
8%
10%
12%
1988 1991 1994 1997 2000 2003 2006 2009 2012 2015
U.S. Annual Energy Expendituresshare of gross domestic product
Source: Short-Term Energy Outlook, October 2014.
Forecast
-15%
-12%
-9%
-6%
-3%
0%
3%
6%
9%
12%
15%
2012 2013 2014 2015
U.S. Energy-Related Carbon Dioxide Emissionsannual growth
All fossil fuels Coal Petroleum Natural gasSource: Short-Term Energy Outlook, October 2014.
Forecast
-20%
-10%
0%
10%
20%
30%
40%
50%
60%
70
75
80
85
90
95
100
105110
115
Jan 2010 Jan 2011 Jan 2012 Jan 2013 Jan 2014 Jan 2015
U.S. Total Industrial Production Indexindex (2007 = 100)
Change from prior year (right axis)
Industrial production index (left axis)
Source: Short-Term Energy Outlook, October 2014.
change
8/10/2019 Short Term Energy Outlook_EIA
http://slidepdf.com/reader/full/short-term-energy-outlookeia 24/48
-6%
-3%
0%
3%
6%
9%
12%
15%
10,000
10,400
10,800
11,200
11,600
12,000
12,400
12,800
Jan 2010 Jan 2011 Jan 2012 Jan 2013 Jan 2014 Jan 2015
U.S. Disposable Incomebillion 2009 dollars, seasonally adjusted
Change from prior year (right axis)
Real disposable income (left axis)
Source: Short-Term Energy Outlook, October 2014.
change
0
50
100
150
200
250
300
350
400
450
April May June July August September
U.S. Summer Cooling Degree Dayspopulation-weighted
2012
2013
2014
2015
Source: Short-Term Energy Outlook, October 2014.
Note: EIA calculations based on from the National Oceanic and Atmospheric Administration data. Horizontal lines
indicate each month's prior 10-year average (2005-2014). Projections reflect NOAA's 14-16 month outlook.
0
100
200
300
400
500
600
700
800900
1000
October November December January February March
U.S. Winter Heating Degree Dayspopulation-weighted
2011/12
2012/13
2013/14
2014/15
Source: Short-Term Energy Outlook, October 2014.
Note: EIA calculations based on National Oceanic and Atmospheric Administration (NOAA) data. Horizontal linesindicate each month's prior 10-year average (Oct 2004 - Mar 2014). Projections reflect NOAA's 14-16 month outlook.

8/10/2019 Short Term Energy Outlook_EIA
http://slidepdf.com/reader/full/short-term-energy-outlookeia 25/48
U.S. Census Regions and Divisi ons
Source: Short-Term Energy Outlook, October 2014.
8/10/2019 Short Term Energy Outlook_EIA
http://slidepdf.com/reader/full/short-term-energy-outlookeia 26/48
07-08 08-09 09-10 10-11 11-12 12-13 13-14 14-15 % Change
Natural Gas
Northeast
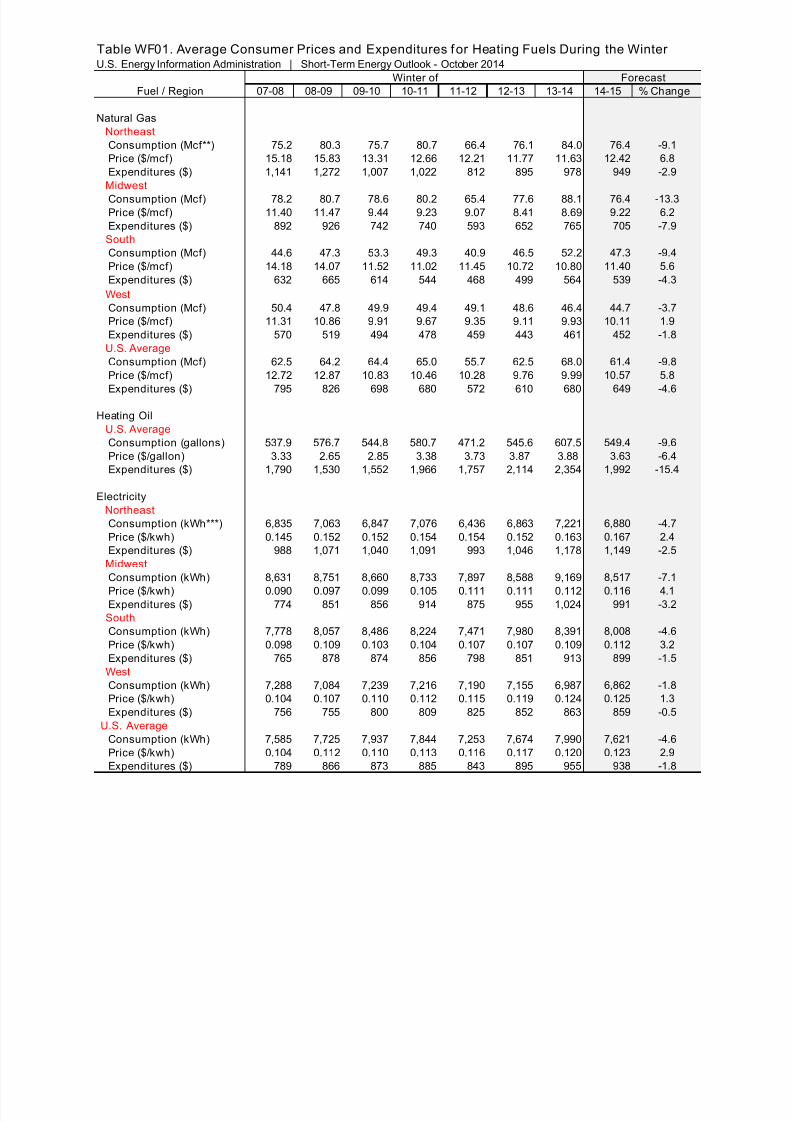
Consumption (Mcf**) 75.2 80.3 75.7 80.7 66.4 76.1 84.0 76.4 -9.1
Price ($/mcf) 15.18 15.83 13.31 12.66 12.21 11.77 11.63 12.42 6.8
Expenditures ($) 1,141 1,272 1,007 1,022 812 895 978 949 -2.9
Midwest
Consumption (Mcf) 78.2 80.7 78.6 80.2 65.4 77.6 88.1 76.4 -13.3 Price ($/mcf) 11.40 11.47 9.44 9.23 9.07 8.41 8.69 9.22 6.2
Expenditures ($) 892 926 742 740 593 652 765 705 -7.9
South
Consumption (Mcf) 44.6 47.3 53.3 49.3 40.9 46.5 52.2 47.3 -9.4
Price ($/mcf) 14.18 14.07 11.52 11.02 11.45 10.72 10.80 11.40 5.6
Expenditures ($) 632 665 614 544 468 499 564 539 -4.3
West
Consumption (Mcf) 50.4 47.8 49.9 49.4 49.1 48.6 46.4 44.7 -3.7
Price ($/mcf) 11.31 10.86 9.91 9.67 9.35 9.11 9.93 10.11 1.9
Expenditures ($) 570 519 494 478 459 443 461 452 -1.8
U.S. Average
Consumption (Mcf) 62.5 64.2 64.4 65.0 55.7 62.5 68.0 61.4 -9.8
Price ($/mcf) 12.72 12.87 10.83 10.46 10.28 9.76 9.99 10.57 5.8
Expenditures ($) 795 826 698 680 572 610 680 649 -4.6
Heating Oil
U.S. Average
Consumption (gallons) 537.9 576.7 544.8 580.7 471.2 545.6 607.5 549.4 -9.6
Price ($/gallon) 3.33 2.65 2.85 3.38 3.73 3.87 3.88 3.63 -6.4
Expenditures ($) 1,790 1,530 1,552 1,966 1,757 2,114 2,354 1,992 -15.4
Electricity
Northeast
Consumption (kWh***) 6,835 7,063 6,847 7,076 6,436 6,863 7,221 6,880 -4.7
Price ($/kwh) 0.145 0.152 0.152 0.154 0.154 0.152 0.163 0.167 2.4
Expenditures ($) 988 1,071 1,040 1,091 993 1,046 1,178 1,149 -2.5
Midwest
Consumption (kWh) 8,631 8,751 8,660 8,733 7,897 8,588 9,169 8,517 -7.1
Price ($/kwh) 0.090 0.097 0.099 0.105 0.111 0.111 0.112 0.116 4.1
Expenditures ($) 774 851 856 914 875 955 1,024 991 -3.2
South
Consumption (kWh) 7,778 8,057 8,486 8,224 7,471 7,980 8,391 8,008 -4.6
Price ($/kwh) 0.098 0.109 0.103 0.104 0.107 0.107 0.109 0.112 3.2
Expenditures ($) 765 878 874 856 798 851 913 899 -1.5
West
Consumption (kWh) 7,288 7,084 7,239 7,216 7,190 7,155 6,987 6,862 -1.8
Price ($/kwh) 0.104 0.107 0.110 0.112 0.115 0.119 0.124 0.125 1.3
Expenditures ($) 756 755 800 809 825 852 863 859 -0.5
U.S. Average
Consumption (kWh) 7,585 7,725 7,937 7,844 7,253 7,674 7,990 7,621 -4.6
Price ($/kwh) 0.104 0.112 0.110 0.113 0.116 0.117 0.120 0.123 2.9
Expenditures ($) 789 866 873 885 843 895 955 938 -1.8
Table WF01. Average Consumer Prices and Expenditures for Heating Fuels During the Winter U.S. Energy Information Administration | Short-Term Energy Outlook - October 2014
Fuel / RegionForecastWinter of
8/10/2019 Short Term Energy Outlook_EIA
http://slidepdf.com/reader/full/short-term-energy-outlookeia 27/48
07-08 08-09 09-10 10-11 11-12 12-13 13-14 14-15 % Change
Table WF01. Average Consumer Prices and Expenditures for Heating Fuels During the Winter U.S. Energy Information Administration | Short-Term Energy Outlook - October 2014
Fuel / RegionForecastWinter of
Propane
Northeast
Consumption (gallons) 648.0 690.1 648.1 692.7 573.3 652.0 720.0 657.9 -8.6
Price* ($/gallon) 2.93 2.84 2.98 3.24 3.34 3.00 3.56 3.38 -5.1
Expenditures ($) 1,897 1,961 1,933 2,241 1,916 1,959 2,563 2,224 -13.2
Midwest
Consumption (gallons) 774.6 795.0 779.6 791.8 644.3 766.4 868.7 753.8 -13.2 Price* ($/gallon) 2.25 2.11 1.99 2.11 2.23 1.74 2.61 1.99 -23.8
Expenditures ($) 1,744 1,678 1,548 1,674 1,437 1,333 2,267 1,500 -33.8
Number of households by primary space heating fuel (thousands)
Northeast
Natural gas 10,714 10,889 10,992 11,118 11,236 11,369 11,575 11,787 1.8
Heating oil 6,520 6,280 6,016 5,858 5,701 5,466 5,277 5,123 -2.9
Propane 704 713 733 744 761 816 840 838 -0.3
Electricity 2,550 2,563 2,645 2,776 2,894 3,012 3,087 3,176 2.9
Wood 414 474 501 512 548 579 608 655 7.7
Midwest
Natural gas 18,366 18,288 18,050 17,977 18,019 18,046 18,060 18,137 0.4
Heating oil 534 491 451 419 393 360 336 316 -6.0
Propane 2,181 2,131 2,098 2,073 2,037 2,065 2,074 2,030 -2.1 Electricity 4,469 4,570 4,715 4,922 5,119 5,316 5,519 5,703 3.3
Wood 528 584 616 618 631 635 658 705 7.1
South
Natural gas 14,061 13,958 13,731 13,657 13,636 13,702 13,697 13,633 -0.5
Heating oil 1,051 956 906 853 790 741 697 657 -5.7
Propane 2,356 2,220 2,165 2,098 2,024 1,990 1,904 1,796 -5.7
Electricity 24,662 25,258 25,791 26,555 27,283 27,831 28,563 29,457 3.1
Wood 558 593 586 599 609 611 628 644 2.5
West
Natural gas 15,084 15,027 14,939 15,020 15,021 14,998 15,100 15,269 1.1
Heating oil 316 294 289 279 261 246 238 232 -2.5
Propane 942 936 940 914 885 911 920 889 -3.4
Electricity 7,651 7,768 7,877 8,126 8,439 8,650 8,879 9,154 3.1
Wood 679 703 721 725 736 730 730 743 1.8
U.S. Totals Natural gas 58,226 58,162 57,713 57,771 57,912 58,114 58,432 58,826 0.7
Heating oil 8,422 8,021 7,662 7,408 7,145 6,811 6,548 6,328 -3.3
Propane 6,184 5,999 5,936 5,829 5,707 5,782 5,738 5,553 -3.2
Electricity 39,332 40,159 41,029 42,380 43,734 44,810 46,048 47,490 3.1
Wood 2,179 2,353 2,424 2,454 2,524 2,554 2,625 2,748 4.7
Heating degree days
Northeast 4,914 5,313 4,933 5,337 4,217 4,965 5,595 5,002 -10.6
Midwest 5,603 5,810 5,639 5,773 4,484 5,544 6,451 5,440 -15.7
South 2,279 2,493 2,870 2,632 2,023 2,432 2,792 2,466 -11.7
West 3,339 3,116 3,285 3,258 3,230 3,185 2,992 2,848 -4.8
U.S. Average 3,729 3,869 3,937 3,939 3,225 3,723 4,114 3,633 -11.7
*** kilowatthour
* Prices exclude taxes
** thousand cubic feet
Note: Winter covers the period October 1 through March 31. Fuel prices are nominal prices. Fuel consumption per household is based only
on households that use that fuel as the primary space-heating fuel. Included in fuel consumption is consumption for water heating,appliances, and lighting (electricity). Per-household consumption based on an average of EIA 2005 and 2009 Residential Energy
Consumption Surveys corrected for actual and projected heating degree days. Number of households using heating oil includes kerosene.
8/10/2019 Short Term Energy Outlook_EIA
http://slidepdf.com/reader/full/short-term-energy-outlookeia 28/48
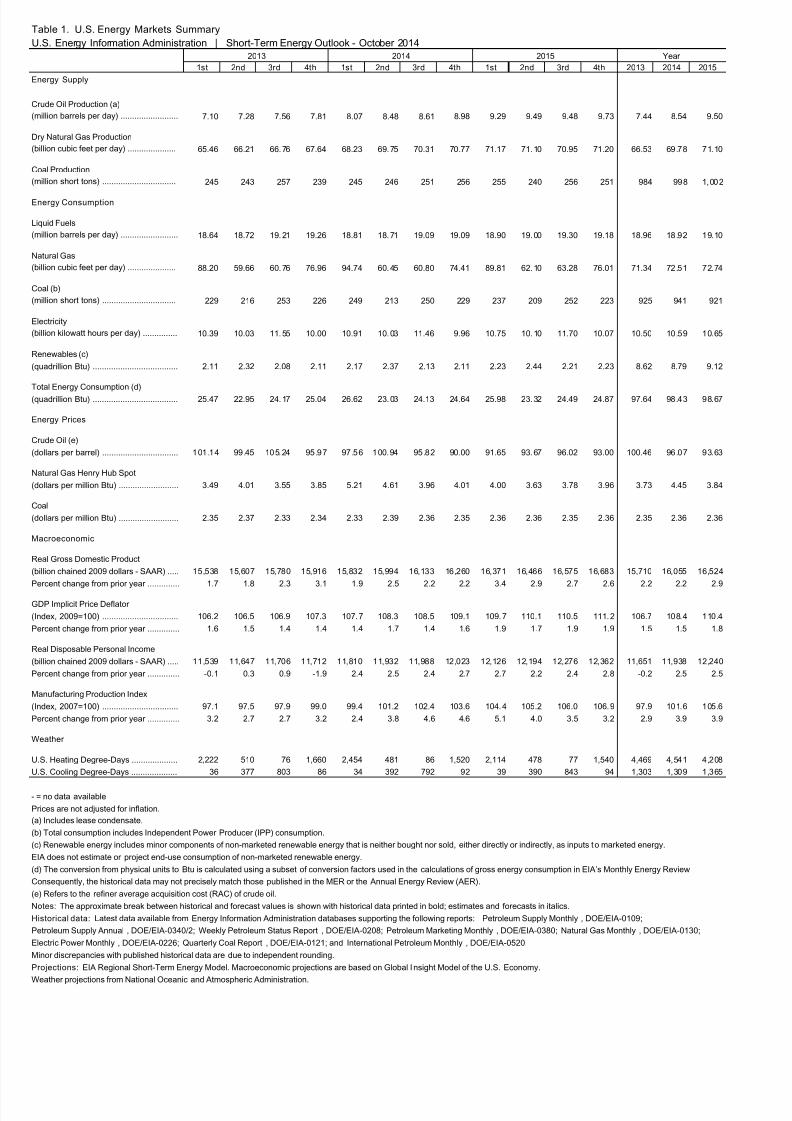
1st 2nd 3rd 4th 1st 2nd 3rd 4th 1st 2nd 3rd 4th 2013 2014 2015
Energy Supply
Crude Oil Production (a)
million barrels per day) ......................... 7.10 7.28 7.56 7.81 8.07 8.48 8.61 8.98 9.29 9.49 9.48 9.73 7.44 8.54 9.50
Dry Natural Gas Production
billion cubic feet per day) ..................... 65.46 66.21 66.76 67.64 68.23 69.75 70.31 70.77 71.17 71.10 70.95 71.20 66.53 69.78 71.10
Coal Production
million short tons) ................................ 245 243 257 239 245 246 251 256 255 240 256 251 984 998 1,002
Energy Consumption
iquid Fuels
million barrels per day) ......................... 18.64 18.72 19.21 19.26 18.81 18.71 19.09 19.09 18.90 19.00 19.30 19.18 18.96 18.92 19.10
Natural Gas
billion cubic feet per day) ..................... 88.20 59.66 60.76 76.96 94.74 60.45 60.80 74.41 89.81 62.10 63.28 76.01 71.34 72.51 72.74
Coal (b)
million short tons) ................................ 229 216 253 226 249 213 250 229 237 209 252 223 925 941 921
Electricity
billion kilowatt hours per day) ............... 10.39 10.03 11.55 10.00 10.91 10.03 11.46 9.96 10.75 10.10 11.70 10.07 10.50 10.59 10.65
Renewables (c)
quadrillion Btu) ..................................... 2.11 2.32 2.08 2.11 2.17 2.37 2.13 2.11 2.23 2.44 2.21 2.23 8.62 8.79 9.12
Total Energy Consumption (d)quadrillion Btu) ..................................... 25.47 22.95 24.17 25.04 26.62 23.03 24.13 24.64 25.98 23.32 24.49 24.87 97.64 98.43 98.67
Energy Prices
Crude Oil (e)
dollars per barrel) ................................. 101.14 99.45 105.24 95.97 97.56 100.94 95.82 90.00 91.65 93.67 96.02 93.00 100.46 96.07 93.63
Natural Gas Henry Hub Spot
dollars per million Btu) .......................... 3.49 4.01 3.55 3.85 5.21 4.61 3.96 4.01 4.00 3.63 3.78 3.96 3.73 4.45 3.84
Coal
dollars per million Btu) .......................... 2.35 2.37 2.33 2.34 2.33 2.39 2.36 2.35 2.36 2.36 2.35 2.36 2.35 2.36 2.36
Macroeconomic
Real Gross Domestic Product
billion chained 2009 dollars - SAAR) ..... 15,538 15,607 15,780 15,916 15,832 15,994 16,133 16,260 16,371 16,466 16,575 16,683 15,710 16,055 16,524
Percent change from prior year .............. 1.7 1.8 2.3 3.1 1.9 2.5 2.2 2.2 3.4 2.9 2.7 2.6 2.2 2.2 2.9
GDP Implicit Price Deflator
ndex, 2009=100) ................................. 106.2 106.5 106.9 107.3 107.7 108.3 108.5 109.1 109.7 110.1 110.5 111.2 106.7 108.4 110.4
Percent change from prior year .............. 1.6 1.5 1.4 1.4 1.4 1.7 1.4 1.6 1.9 1.7 1.9 1.9 1.5 1.5 1.8
Real Disposable Personal Income
billion chained 2009 dollars - SAAR) ..... 11,539 11,647 11,706 11,712 11,810 11,932 11,988 12,023 12,126 12,194 12,276 12,362 11,651 11,938 12,240
Percent change from prior year .............. -0.1 0.3 0.9 -1.9 2.4 2.5 2.4 2.7 2.7 2.2 2.4 2.8 -0.2 2.5 2.5
Manufacturing Production Index
ndex, 2007=100) ................................. 97.1 97.5 97.9 99.0 99.4 101.2 102.4 103.6 104.4 105.2 106.0 106.9 97.9 101.6 105.6
Percent change from prior year .............. 3.2 2.7 2.7 3.2 2.4 3.8 4.6 4.6 5.1 4.0 3.5 3.2 2.9 3.9 3.9
Weather
U.S. Heating Degree-Days .................... 2,222 510 76 1,660 2,454 481 86 1,520 2,114 478 77 1,540 4,469 4,541 4,208
U.S. Cooling Degree-Days .................... 36 377 803 86 34 392 792 92 39 390 843 94 1,303 1,309 1,365
Table 1. U.S. Energy Markets Summary
U.S. Energy Information Administration | Short-Term Energy Outlook - October 20142013 2014 2015 Year
Petroleum Supply Annual , DOE/EIA-0340/2; Weekly Petroleum Status Report , DOE/EIA-0208; Petroleum Marketing Monthly , DOE/EIA-0380; Natural Gas Monthly , DOE/EIA-0130;
= no data available
Prices are not adjusted for inflation.
a) Includes lease condensate.
b) Total consumption includes Independent Power Producer (IPP) consumption.
c) Renewable energy includes minor components of non-marketed renewable energy that is neither bought nor sold, either directly or indirectly, as inputs to marketed energy.
EIA does not estimate or project end-use consumption of non-marketed renewable energy.
d) The conversion from physical units to Btu is calculated using a subset of conversion factors used in the calculations of gross energy consumption in EIA’s Monthly Energy Review
Consequently, the historical data may not precisely match those published in the MER or the Annual Energy Review (AER).
e) Refers to the refiner average acquisition cost (RAC) of crude oil.
Notes: The approximate break between historical and forecast values is shown with historical data printed in bold; estimates and forecasts in italics.
Historical data: Latest data available from Energy Information Administration databases supporting the following reports: Petroleum Supply Monthly , DOE/EIA-0109;
Electric Power Monthly , DOE/EIA-0226; Quarterly Coal Report , DOE/EIA-0121; and International Petroleum Monthly , DOE/EIA-0520.
Minor discrepancies with published historical data are due to independent rounding.
Projections: EIA Regional Short-Term Energy Model. Macroeconomic projections are based on Global Insight Model of the U.S. Economy.
Weather projections from National Oceanic and Atmospheric Administration.
8/10/2019 Short Term Energy Outlook_EIA
http://slidepdf.com/reader/full/short-term-energy-outlookeia 29/48
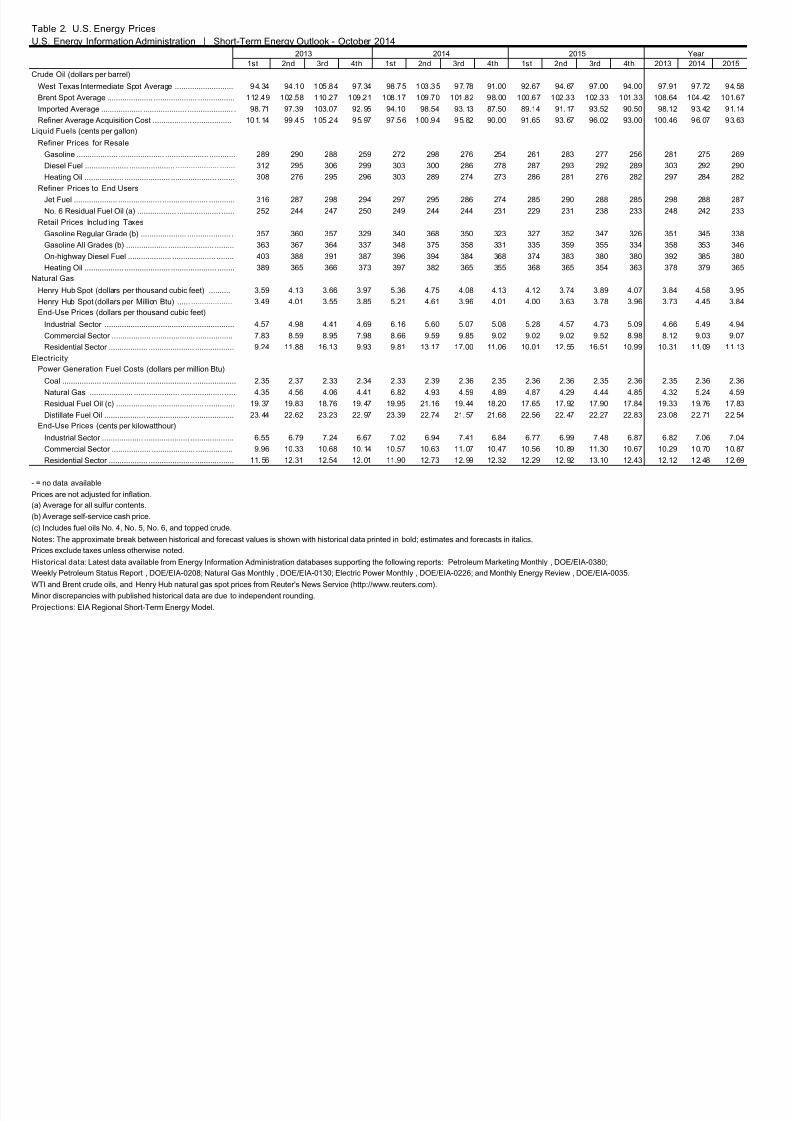
1st 2nd 3rd 4th 1st 2nd 3rd 4th 1st 2nd 3rd 4th 2013 2014 2015
Crude Oil (dollars per barrel)
West Texas Intermediate Spot Average ........................... 94.34 94.10 105.84 97.34 98.75 103.35 97.78 91.00 92.67 94.67 97.00 94.00 97.91 97.72 94.5
Brent Spot Average ..................... .................... ................. 112.49 102.58 110.27 109.21 108.17 109.70 101.82 98.00 100.67 102.33 102.33 101.33 108.64 104.42 101.6
Imported Average ................... .................... ..................... . 98.71 97.39 103.07 92.95 94.10 98.54 93.13 87.50 89.14 91.17 93.52 90.50 98.12 93.42 91.1
Refiner Average Acquisition Cost .................. .................. 101.14 99.45 105.24 95.97 97.56 100.94 95.82 90.00 91.65 93.67 96.02 93.00 100.46 96.07 93.6
iquid Fuels (cents per gallon)
Refiner Prices for Resale
Gasoline ................... ..................... .................... ............ 289 290 288 259 272 298 276 254 261 283 277 256 281 275 26
Diesel Fuel .................... ..................... .................... ....... 312 295 306 299 303 300 286 278 287 293 292 289 303 292 29
Heating Oil .................. ..................... ..................... ........ 308 276 295 296 303 289 274 273 286 281 276 282 297 284 28
Refiner Prices to End Users
Jet Fuel .................... .................... ..................... ............ 316 287 298 294 297 295 286 274 285 290 288 285 298 288 28
No. 6 Residual Fuel Oil (a) .................. .................... ...... 252 244 247 250 249 244 244 231 229 231 238 233 248 242 23
Retail Prices Includ ing Taxes
Gasoline Regular Grade (b) ..................... .................... . 357 360 357 329 340 368 350 323 327 352 347 326 351 345 33
Gasoline All Grades (b) ................... ..................... ......... 363 367 364 337 348 375 358 331 335 359 355 334 358 353 34
On-highway Diesel Fuel .................... .................... ........ 403 388 391 387 396 394 384 368 374 383 380 380 392 385 38
Heating Oil .................. ..................... ..................... ........ 389 365 366 373 397 382 365 355 368 365 354 363 378 379 36
Natural Gas
Henry Hub Spot (dollars per thousand cubic feet) .......... 3.59 4.13 3.66 3.97 5.36 4.75 4.08 4.13 4.12 3.74 3.89 4.07 3.84 4.58 3.9
Henry Hub Spot (dollars per Million Btu) ...... ................... 3.49 4.01 3.55 3.85 5.21 4.61 3.96 4.01 4.00 3.63 3.78 3.96 3.73 4.45 3.8
End-Use Prices (dollars per thousand cubic feet)
Industrial Sector ............................................................ 4.57 4.98 4.41 4.69 6.16 5.60 5.07 5.08 5.28 4.57 4.73 5.09 4.66 5.49 4.9
Commercial Sector .................. .................... ................. 7.83 8.59 8.95 7.98 8.66 9.59 9.85 9.02 9.02 9.02 9.52 8.98 8.12 9.03 9.0
Residential Sector .................. ..................... .................. 9.24 11.88 16.13 9.93 9.81 13.17 17.00 11.06 10.01 12.55 16.51 10.99 10.31 11.09 11.1
Electricity
Power Generation Fuel Costs (dollars per million Btu)
Coal .................. .................... ..................... .................... 2.35 2.37 2.33 2.34 2.33 2.39 2.36 2.35 2.36 2.36 2.35 2.36 2.35 2.36 2.3
Natural Gas .................... ..................... .................... ..... 4.35 4.56 4.06 4.41 6.82 4.93 4.59 4.89 4.87 4.29 4.44 4.85 4.32 5.24 4.5
Residual Fuel Oil (c) ................... ..................... .............. 19.37 19.83 18.76 19.47 19.95 21.16 19.44 18.20 17.65 17.92 17.90 17.84 19.33 19.76 17.8
Distillate Fuel Oil ................... .................... .................... 23.44 22.62 23.23 22.97 23.39 22.74 21.57 21.68 22.56 22.47 22.27 22.83 23.08 22.71 22.5
End-Use Prices (cents per kilowatthour)
Industrial Sector ................... ..................... .................... 6.55 6.79 7.24 6.67 7.02 6.94 7.41 6.84 6.77 6.99 7.48 6.87 6.82 7.06 7.0
Commercial Sector .................. .................... ................. 9.96 10.33 10.68 10.14 10.57 10.63 11.07 10.47 10.56 10.89 11.30 10.67 10.29 10.70 10.8
Residential Sector .................. ..................... .................. 11.56 12.31 12.54 12.01 11.90 12.73 12.99 12.32 12.29 12.92 13.10 12.43 12.12 12.48 12.6
c) Includes fuel oils No. 4, No. 5, No. 6, and topped crude.
Table 2. U.S. Energy Prices
U.S. Energy Information Administration | Short-Term Energy Outlook - October 2014
2013 2014 2015 Year
= no data available
Prices are not adjusted for inflation.
a) Average for all sulfur contents.
b) Average self-service cash price.
Projections: EIA Regional Short-Term Energy Model.
Notes: The approximate break between historical and forecast values is shown with historical data printed in bold; estimates and forecasts in italics.
Prices exclude taxes unless otherwise noted.
Historical data: Latest data available from Energy Information Administration databases supporting the following reports: Petroleum Marketing Monthly , DOE/EIA-0380;
Weekly Petroleum Status Report , DOE/EIA-0208; Natural Gas Monthly , DOE/EIA-0130; Electric Power Monthly , DOE/EIA-0226; and Monthly Energy Review , DOE/EIA-0035.
WTI and Brent crude oils, and Henry Hub natural gas spot prices from Reuter's News Service (http://www.reuters.com).Minor discrepancies with published historical data are due to independent rounding.
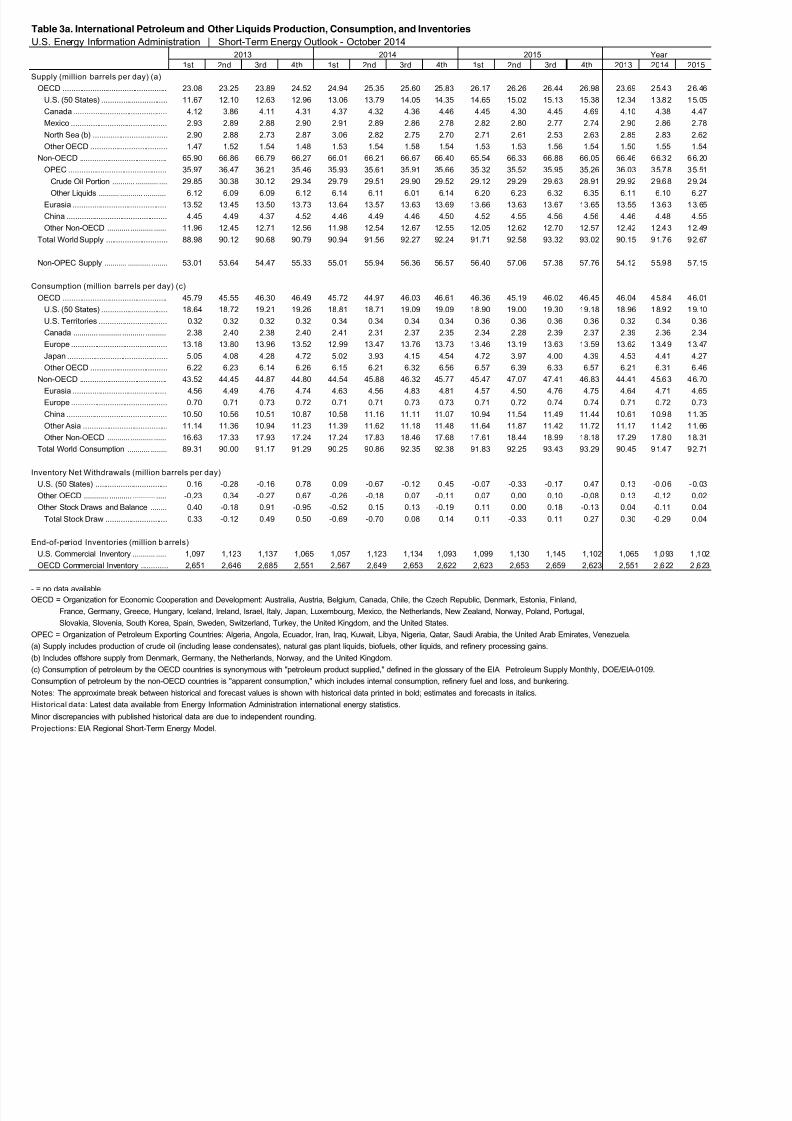
8/10/2019 Short Term Energy Outlook_EIA
http://slidepdf.com/reader/full/short-term-energy-outlookeia 30/48
1st 2nd 3rd 4th 1st 2nd 3rd 4th 1st 2nd 3rd 4th 2013 2014 2015
upply (million barrels per day) (a)
OECD ................................................. 23.08 23.25 23.89 24.52 24.94 25.35 25.60 25.83 26.17 26.26 26.44 26.98 23.69 25.43 26.46
U.S. (50 States) ............................... 11.67 12.10 12.63 12.96 13.06 13.79 14.05 14.35 14.65 15.02 15.13 15.38 12.34 13.82 15.05
Canada ............................................ 4.12 3.86 4.11 4.31 4.37 4.32 4.36 4.46 4.45 4.30 4.45 4.69 4.10 4.38 4.47
Mexico ............................................. 2.93 2.89 2.88 2.90 2.91 2.89 2.86 2.78 2.82 2.80 2.77 2.74 2.90 2.86 2.78
North Sea (b) ................................... 2.90 2.88 2.73 2.87 3.06 2.82 2.75 2.70 2.71 2.61 2.53 2.63 2.85 2.83 2.62
Other OECD .................................... 1.47 1.52 1.54 1.48 1.53 1.54 1.58 1.54 1.53 1.53 1.56 1.54 1.50 1.55 1.54
Non-OECD ......................................... 65.90 66.86 66.79 66.27 66.01 66.21 66.67 66.40 65.54 66.33 66.88 66.05 66.46 66.32 66.20
OPEC .............................................. 35.97 36.47 36.21 35.46 35.93 35.61 35.91 35.66 35.32 35.52 35.95 35.26 36.03 35.78 35.51
Crude Oil Portion ........... ........... .... 29.85 30.38 30.12 29.34 29.79 29.51 29.90 29.52 29.12 29.29 29.63 28.91 29.92 29.68 29.24
Other Liquids .......... ........... ........... 6.12 6.09 6.09 6.12 6.14 6.11 6.01 6.14 6.20 6.23 6.32 6.35 6.11 6.10 6.27Eurasia ............................................ 13.52 13.45 13.50 13.73 13.64 13.57 13.63 13.69 13.66 13.63 13.67 13.65 13.55 13.63 13.65
China ............................................... 4.45 4.49 4.37 4.52 4.46 4.49 4.46 4.50 4.52 4.55 4.56 4.56 4.46 4.48 4.55
Other Non-OECD ........... ........... ...... 11.96 12.45 12.71 12.56 11.98 12.54 12.67 12.55 12.05 12.62 12.70 12.57 12.42 12.43 12.49
Total World Supply ............................. 88.98 90.12 90.68 90.79 90.94 91.56 92.27 92.24 91.71 92.58 93.32 93.02 90.15 91.76 92.67
Non-OPEC Supply ........... ........... ........ 53.01 53.64 54.47 55.33 55.01 55.94 56.36 56.57 56.40 57.06 57.38 57.76 54.12 55.98 57.15
Consumption (million barrels per day) (c)
OECD ................................................. 45.79 45.55 46.30 46.49 45.72 44.97 46.03 46.61 46.36 45.19 46.02 46.45 46.04 45.84 46.01
U.S. (50 States) ............................... 18.64 18.72 19.21 19.26 18.81 18.71 19.09 19.09 18.90 19.00 19.30 19.18 18.96 18.92 19.10
U.S. Territories ................................ 0.32 0.32 0.32 0.32 0.34 0.34 0.34 0.34 0.36 0.36 0.36 0.36 0.32 0.34 0.36
Canada ............ ........... ........... .......... 2.38 2.40 2.38 2.40 2.41 2.31 2.37 2.35 2.34 2.28 2.39 2.37 2.39 2.36 2.34
Europe ............................................. 13.18 13.80 13.96 13.52 12.99 13.47 13.76 13.73 13.46 13.19 13.63 13.59 13.62 13.49 13.47
Japan ............................................... 5.05 4.08 4.28 4.72 5.02 3.93 4.15 4.54 4.72 3.97 4.00 4.39 4.53 4.41 4.27
Other OECD .................................... 6.22 6.23 6.14 6.26 6.15 6.21 6.32 6.56 6.57 6.39 6.33 6.57 6.21 6.31 6.46
Non-OECD ......................................... 43.52 44.45 44.87 44.80 44.54 45.88 46.32 45.77 45.47 47.07 47.41 46.83 44.41 45.63 46.70
Eurasia ............................................ 4.56 4.49 4.76 4.74 4.63 4.56 4.83 4.81 4.57 4.50 4.76 4.75 4.64 4.71 4.65
Europe ............................................. 0.70 0.71 0.73 0.72 0.71 0.71 0.73 0.73 0.71 0.72 0.74 0.74 0.71 0.72 0.73
China ............................................... 10.50 10.56 10.51 10.87 10.58 11.16 11.11 11.07 10.94 11.54 11.49 11.44 10.61 10.98 11.35
Other Asia ........................................ 11.14 11.36 10.94 11.23 11.39 11.62 11.18 11.48 11.64 11.87 11.42 11.72 11.17 11.42 11.66
Other Non-OECD ........... ........... ...... 16.63 17.33 17.93 17.24 17.24 17.83 18.46 17.68 17.61 18.44 18.99 18.18 17.29 17.80 18.31
Total World Consumption ........... ........ 89.31 90.00 91.17 91.29 90.25 90.86 92.35 92.38 91.83 92.25 93.43 93.29 90.45 91.47 92.71
nventory Net Withdrawals (million barrels per day)
U.S. (50 States) .................................. 0.16 -0.28 -0.16 0.78 0.09 -0.67 -0.12 0.45 -0.07 -0.33 -0.17 0.47 0.13 -0.06 -0.03
Other OECD ............ ........... ........... ..... -0.23 0.34 -0.27 0.67 -0.26 -0.18 0.07 -0.11 0.07 0.00 0.10 -0.08 0.13 -0.12 0.02
Other Stock Draws and Balance ........ 0.40 -0.18 0.91 -0.95 -0.52 0.15 0.13 -0.19 0.11 0.00 0.18 -0.13 0.04 -0.11 0.04
Total Stock Draw ............................. 0.33 -0.12 0.49 0.50 -0.69 -0.70 0.08 0.14 0.11 -0.33 0.11 0.27 0.30 -0.29 0.04
nd-of-period Inventories (million b arrels)
U.S. Commercial Inventory ........... ..... 1,097 1,123 1,137 1,065 1,057 1,123 1,134 1,093 1,099 1,130 1,145 1,102 1,065 1,093 1,102
OECD Commercial Inventory ............. 2,651 2,646 2,685 2,551 2,567 2,649 2,653 2,622 2,623 2,653 2,659 2,623 2,551 2,622 2,623
a) Supply includes production of crude oil (including lease condensates), natural gas plant liquids, biofuels, other liquids, and refinery processing gains.
Table 3a. International Petroleum and Other Liquids Production, Consumption, and Inventories
U.S. Energy Information Administration | Short-Term Energy Outlook - October 20142013 2014 2015 Year
= no data available
OECD = Organization for Economic Cooperation and Development: Australia, Austria, Belgium, Canada, Chile, the Czech Republic, Denmark, Estonia, Finland,
France, Germany, Greece, Hungary, Iceland, Ireland, Israel, Italy, Japan, Luxembourg, Mexico, the Netherlands, New Zealand, Norway, Poland, Portugal,
Slovakia, Slovenia, South Korea, Spain, Sweden, Switzerland, Turkey, the United Kingdom, and the United States.
OPEC = Organization of Petroleum Exporting Countries: Algeria, Angola, Ecuador, Iran, Iraq, Kuwait, Libya, Nigeria, Qatar, Saudi Arabia, the United Arab Emirates, Venezuela.
Projections: EIA Regional Short-Term Energy Model.
b) Includes offshore supply from Denmark, Germany, the Netherlands, Norway, and the United Kingdom.
c) Consumption of petroleum by the OECD countries is synonymous with "petroleum product supplied," defined in the glossary of the EIAPetroleum Supply Monthly , DOE/EIA-0109.
Consumption of petroleum by the non-OECD countries is "apparent consumption," which includes internal consumption, refinery fuel and loss, and bunkering.
Notes: The approximate break between historical and forecast values is shown with historical data printed in bold; estimates and forecasts in italics.
Historical data: Latest data available from Energy Information Administration international energy statistics.
Minor discrepancies with published historical data are due to independent rounding.
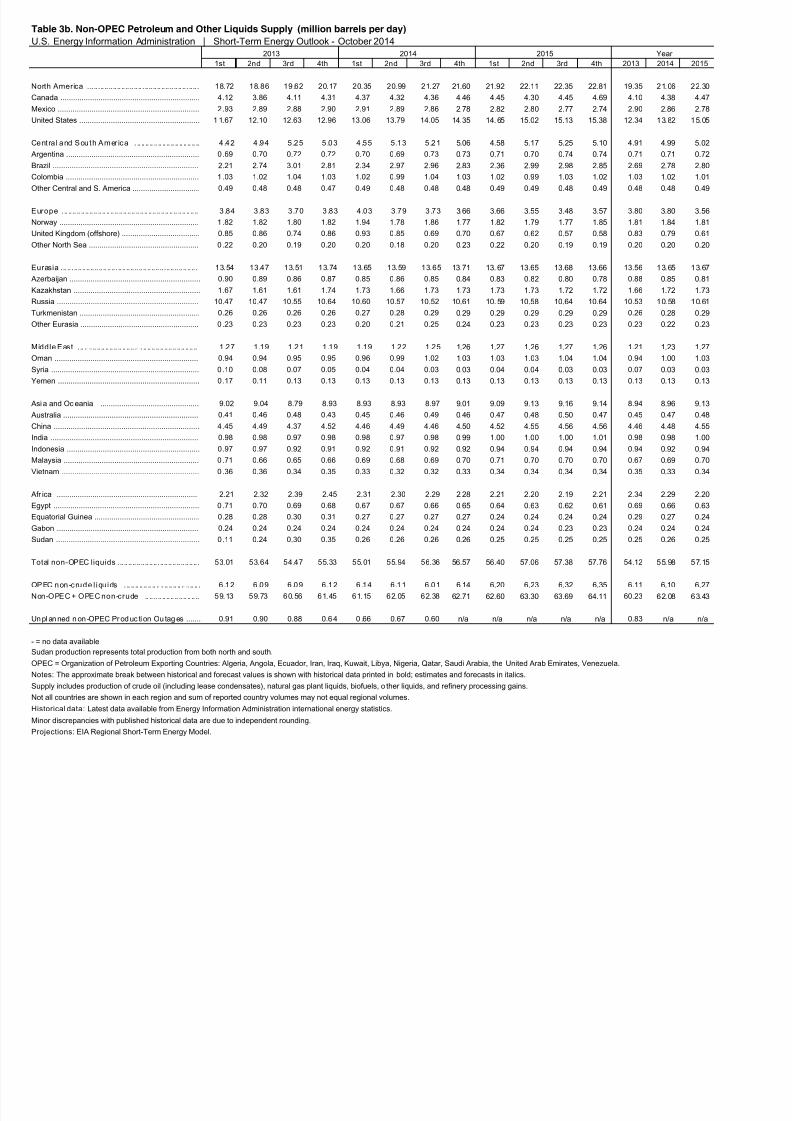
8/10/2019 Short Term Energy Outlook_EIA
http://slidepdf.com/reader/full/short-term-energy-outlookeia 31/48
1st 2nd 3rd 4th 1st 2nd 3rd 4th 1st 2nd 3rd 4th 2013 2014 2015
North America ..................................................... 18.72 18.86 19.62 20.17 20.35 20.99 21.27 21.60 21.92 22.11 22.35 22.81 19.35 21.06 22.30
Canada .................................................................. 4.12 3.86 4.11 4.31 4.37 4.32 4.36 4.46 4.45 4.30 4.45 4.69 4.10 4.38 4.47
Mexico ................................................................... 2.93 2.89 2.88 2.90 2.91 2.89 2.86 2.78 2.82 2.80 2.77 2.74 2.90 2.86 2.78
United States ......................................................... 1 1.67 12.10 12.63 12.96 13.06 13.79 14.05 14.35 14.65 15.02 15.13 15.38 12.34 13.82 15.05
Centra l and South Amer ica . .. .. .. .. .. .. .. .. .. .. .. .. .. .. .. 4 .42 4.94 5.25 5.03 4.55 5.13 5.21 5.06 4.58 5.17 5.25 5.10 4.91 4.99 5.02
Argentina ............................................................... 0.69 0.70 0.72 0.72 0.70 0.69 0.73 0.73 0.71 0.70 0.74 0.74 0.71 0.71 0.72
razil ..................................................................... 2.21 2.74 3.01 2.81 2.34 2.97 2.96 2.83 2.36 2.99 2.98 2.85 2.69 2.78 2.80
Colombia ............................................................... 1 .03 1.02 1.04 1.03 1.02 0.99 1.04 1.03 1.02 0.99 1.03 1.02 1.03 1.02 1.01
Other Central and S. America ................................ 0.49 0.48 0.48 0.47 0.49 0.48 0.48 0.48 0.49 0.49 0.48 0.49 0.48 0.48 0.49
urope ... .. .. .. .. .. .. .. .. .. .. .. .. .. .. .. .. .. .. .. .. .. .. .. .. .. .. .. .. .. .. .. 3.84 3.83 3.70 3.83 4.03 3.79 3.73 3.66 3.66 3.55 3.48 3.57 3.80 3.80 3.56
Norway .................................................................. 1 .82 1.82 1.80 1.82 1.94 1.78 1.86 1.77 1.82 1.79 1.77 1.85 1.81 1.84 1.81
United Kingdom (offshore) ..................................... 0.85 0.86 0.74 0.86 0.93 0.85 0.69 0.70 0.67 0.62 0.57 0.58 0.83 0.79 0.61
Other North Sea .................................................... 0 .22 0.20 0.19 0.20 0.20 0.18 0.20 0.23 0.22 0.20 0.19 0.19 0.20 0.20 0.20
urasia ................................................................. 13.54 13.47 13.51 13.74 13.65 13.59 13.65 13.71 13.67 13.65 13.68 13.66 13.56 13.65 13.67
Azerbaijan .............................................................. 0.90 0.89 0.86 0.87 0.85 0.86 0.85 0.84 0.83 0.82 0.80 0.78 0.88 0.85 0.81
Kazakhstan ............................................................ 1.67 1.61 1.61 1.74 1.73 1.66 1.73 1.73 1.73 1.73 1.72 1.72 1.66 1.72 1.73
Russia ................................................................... 10.47 10.47 10.55 10.64 10.60 10.57 10.52 10.61 10.59 10.58 10.64 10.64 10.53 10.58 10.61
urkmenistan ......................................................... 0.26 0.26 0.26 0.26 0.27 0.28 0.29 0.29 0.29 0.29 0.29 0.29 0.26 0.28 0.29
Other Eurasia ........................................................ 0 .23 0.23 0.23 0.23 0.20 0.21 0.25 0.24 0.23 0.23 0.23 0.23 0.23 0.22 0.23
Middle East . .. .. .. .. .. .. .. .. .. .. .. .. .. .. .. .. .. .. .. .. .. .. .. .. .. .. .. .. 1.27 1.19 1.21 1.19 1.19 1.22 1.25 1.26 1.27 1.26 1.27 1.26 1.21 1.23 1.27
Oman .................................................................... 0.94 0.94 0.95 0.95 0.96 0.99 1.02 1.03 1.03 1.03 1.04 1.04 0.94 1.00 1.03
yria ...................................................................... 0 .10 0.08 0.07 0.05 0.04 0.04 0.03 0.03 0.04 0.04 0.03 0.03 0.07 0.03 0.03
Yemen ................................................................... 0.17 0.11 0.13 0.13 0.13 0.13 0.13 0.13 0.13 0.13 0.13 0.13 0.13 0.13 0.13
Asi a and Oc eania ............................................... 9.02 9.04 8.79 8.93 8.93 8.93 8.97 9.01 9.09 9.13 9.16 9.14 8.94 8.96 9.13
Australia ................................................................ 0.41 0.46 0.48 0.43 0.45 0.46 0.49 0.46 0.47 0.48 0.50 0.47 0.45 0.47 0.48
China ..................................................................... 4.45 4.49 4.37 4.52 4.46 4.49 4.46 4.50 4.52 4.55 4.56 4.56 4.46 4.48 4.55
ndia ...................................................................... 0.98 0.98 0.97 0.98 0.98 0.97 0.98 0.99 1.00 1.00 1.00 1.01 0.98 0.98 1.00
ndonesia ............................................................... 0.97 0.97 0.92 0.91 0.92 0.91 0.92 0.92 0.94 0.94 0.94 0.94 0.94 0.92 0.94
Malaysia ................................................................ 0 .71 0.66 0.65 0.66 0.69 0.68 0.69 0.70 0.71 0.70 0.70 0.70 0.67 0.69 0.70
Vietnam ................................................................. 0 .36 0.36 0.34 0.35 0.33 0.32 0.32 0.33 0.34 0.34 0.34 0.34 0.35 0.33 0.34
Afr ica ................................................................... 2.21 2.32 2.39 2.45 2.31 2.30 2.29 2.28 2.21 2.20 2.19 2.21 2.34 2.29 2.20
gypt ..................................................................... 0 .71 0.70 0.69 0.68 0.67 0.67 0.66 0.65 0.64 0.63 0.62 0.61 0.69 0.66 0.63
quatorial Guinea .................................................. 0.28 0.28 0.30 0.31 0.27 0.27 0.27 0.27 0.24 0.24 0.24 0.24 0.29 0.27 0.24
Gabon ................................................................... 0.24 0.24 0.24 0.24 0.24 0.24 0.24 0.24 0.24 0.24 0.23 0.23 0.24 0.24 0.24
udan .................................................................... 0.11 0.24 0.30 0.35 0.26 0.26 0.26 0.26 0.25 0.25 0.25 0.25 0.25 0.26 0.25
otal non-OPEC liquids ....................................... 53.01 53.64 54.47 55.33 55.01 55.94 56.36 56.57 56.40 57.06 57.38 57.76 54.12 55.98 57.15
OPEC non-crude l iqu ids . .. .. .. .. .. .. .. .. .. .. .. .. .. .. .. .. .. . 6 .12 6.09 6.09 6.12 6.14 6.11 6.01 6.14 6.20 6.23 6.32 6.35 6.11 6.10 6.27
Non-OPEC + OPEC non-crude .. .. .. .. .. .. .. .. .. .. .. .. .. 59.13 59.73 60.56 61.45 61.15 62.05 62.38 62.71 62.60 63.30 63.69 64.11 60.23 62.08 63.43
Unpl anned non -OPEC Pr oduc ti on Ou tages ....... 0.91 0.90 0.88 0.64 0 .66 0.67 0.60 n/a n/a n/a n/a n/a 0.83 n/a n/a
Table 3b. Non-OPEC Petroleum and Other Liquids Supply (million barrels per day)
U.S. Energy Information Administration | Short-Term Energy Outlook - October 20142013 2014 2015 Year
Historical data: Latest data available from Energy Information Administration international energy statistics.
Minor discrepancies with published historical data are due to independent rounding.
rojections: EIA Regional Short-Term Energy Model.
= no data available
udan production represents total production from both north and south.
OPEC = Organization of Petroleum Exporting Countries: Algeria, Angola, Ecuador, Iran, Iraq, Kuwait, Libya, Nigeria, Qatar, Saudi Arabia, the United Arab Emirates, Venezuela.
Notes: The approximate break between historical and forecast values is shown with historical data printed in bold; estimates and forecasts in italics.
upply includes production of crude oil (including lease condensates), natural gas plant liquids, biofuels, o ther liquids, and refinery processing gains.
Not all countries are shown in each region and sum of reported country volumes may not equal regional volumes.
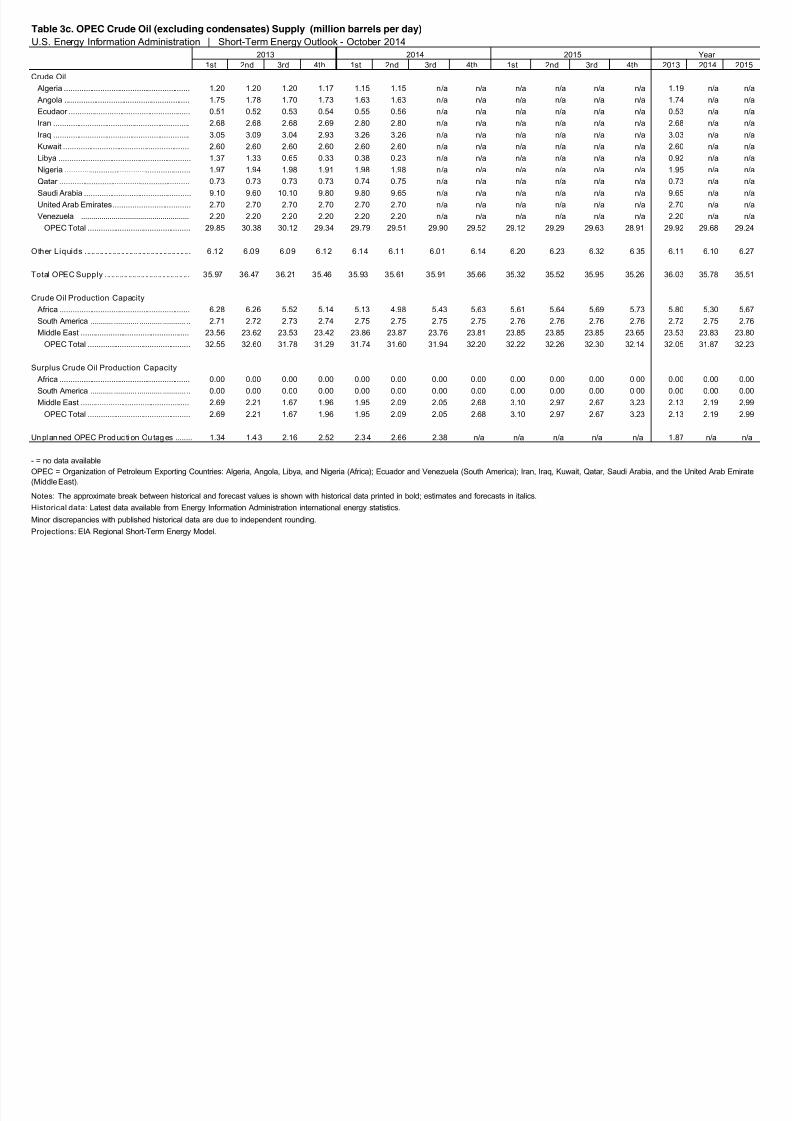
8/10/2019 Short Term Energy Outlook_EIA
http://slidepdf.com/reader/full/short-term-energy-outlookeia 32/48
1st 2nd 3rd 4th 1st 2nd 3rd 4th 1st 2nd 3rd 4th 2013 2014 2
Crude Oil
Algeria ........................................................... 1.20 1.20 1.20 1.17 1.15 1.15 n/a n/a n/a n/a n/a n/a 1.19 n/a
Angola ........................................................... 1.75 1.78 1.70 1.73 1.63 1.63 n/a n/a n/a n/a n/a n/a 1.74 n/a
Ecudaor ......................................................... 0.51 0.52 0.53 0.54 0.55 0.56 n/a n/a n/a n/a n/a n/a 0.53 n/a
Iran ................................................................ 2.68 2.68 2.68 2.69 2.80 2.80 n/a n/a n/a n/a n/a n/a 2.68 n/a
Iraq ................................................................ 3.05 3.09 3.04 2.93 3.26 3.26 n/a n/a n/a n/a n/a n/a 3.03 n/a
Kuwait ........................................................... 2.60 2.60 2.60 2.60 2.60 2.60 n/a n/a n/a n/a n/a n/a 2.60 n/a
Libya .............................................................. 1.37 1.33 0.65 0.33 0.38 0.23 n/a n/a n/a n/a n/a n/a 0.92 n/a
Nigeria ........................................................... 1.97 1.94 1.98 1.91 1.98 1.98 n/a n/a n/a n/a n/a n/a 1.95 n/a
Qatar ............................................................. 0.73 0.73 0.73 0.73 0.74 0.75 n/a n/a n/a n/a n/a n/a 0.73 n/a
Saudi Arabia .................................................. 9.10 9.60 10.10 9.80 9.80 9.65 n/a n/a n/a n/a n/a n/a 9.65 n/a United Arab Emirates .................................... 2.70 2.70 2.70 2.70 2.70 2.70 n/a n/a n/a n/a n/a n/a 2.70 n/a
Venezuela ..................................................... 2.20 2.20 2.20 2.20 2.20 2.20 n/a n/a n/a n/a n/a n/a 2.20 n/a
OPEC Total ................................................ 29.85 30.38 30.12 29.34 29.79 29.51 29.90 29.52 29.12 29.29 29.63 28.91 29.92 29.68 2
Other Liquids . .. .. .. .. .. .. .. .. .. .. .. .. .. .. .. .. .. .. .. .. .. .. .. .. . 6.12 6.09 6.09 6.12 6.14 6.11 6.01 6.14 6.20 6.23 6.32 6.35 6.11 6.10
otal OPEC Supply ........................................ 35.97 36.47 36.21 35.46 35.93 35.61 35.91 35.66 35.32 35.52 35.95 35.26 36.03 35.78 3
Crude Oil Production Capacity
Africa ............................................................. 6.28 6.26 5.52 5.14 5.13 4.98 5.43 5.63 5.61 5.64 5.69 5.73 5.80 5.30
South America ........... ............ ........... ........... .. 2.71 2.72 2.73 2.74 2.75 2.75 2.75 2.75 2.76 2.76 2.76 2.76 2.72 2.75
Middle East ................................................... 23.56 23.62 23.53 23.42 23.86 23.87 23.76 23.81 23.85 23.85 23.85 23.65 23.53 23.83 2
OPEC Total ................................................ 32.55 32.60 31.78 31.29 31.74 31.60 31.94 32.20 32.22 32.26 32.30 32.14 32.05 31.87 3
urplus Crude Oil Production Capacity
Africa ............................................................. 0.00 0.00 0.00 0.00 0.00 0.00 0.00 0.00 0.00 0.00 0.00 0.00 0.00 0.00
South America ........... ........... ............ ........... .. 0.00 0.00 0.00 0.00 0.00 0.00 0.00 0.00 0.00 0.00 0.00 0.00 0.00 0.00
Middle East ................................................... 2.69 2.21 1.67 1.96 1.95 2.09 2.05 2.68 3.10 2.97 2.67 3.23 2.13 2.19
OPEC Total ................................................ 2.69 2.21 1.67 1.96 1.95 2.09 2.05 2.68 3.10 2.97 2.67 3.23 2.13 2.19
Unplanned OPEC Produc tion Outages ........ 1.34 1.43 2.16 2.52 2.34 2.66 2.38 n/a n/a n/a n/a n/a 1.87 n/a
Projections: EIA Regional Short-Term Energy Model.
Table 3c. OPEC Crude Oil (excluding condensates) Supply (million barrels per day)
U.S. Energy Information Administration | Short-Term Energy Outlook - October 20142013 2014 2015 Year
= no data available
OPEC = Organization of Petroleum Exporting Countries: Algeria, Angola, Libya, and Nigeria (Africa); Ecuador and Venezuela (South America); Iran, Iraq, Kuwait, Qatar, Saudi Arabia, and the United Arab E
Middle East).
Notes: The approximate break between historical and forecast values is shown with historical data printed in bold; estimates and forecasts in italics.
Historical data: Latest data available from Energy Information Administration international energy statistics.
Minor discrepancies with published historical data are due to independent rounding.
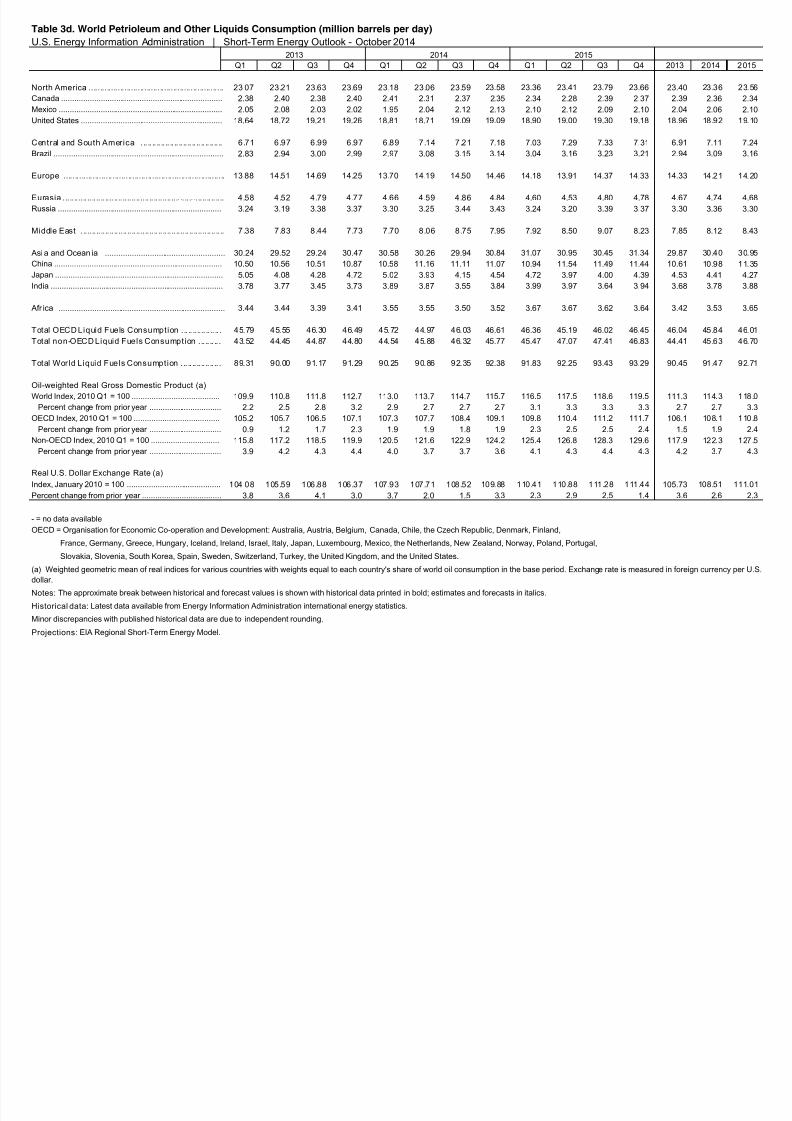
8/10/2019 Short Term Energy Outlook_EIA
http://slidepdf.com/reader/full/short-term-energy-outlookeia 33/48
Q1 Q2 Q3 Q4 Q1 Q2 Q3 Q4 Q1 Q2 Q3 Q4 2013 2014 2
North America ............................................................. 23.07 23.21 23.63 23.69 23.18 23.06 23.59 23.58 23.36 23.41 23.79 23.66 23.40 23 .3 6
Canada .......................................................................... 2.38 2.40 2.38 2.40 2.41 2.31 2.37 2.35 2.34 2.28 2.39 2.37 2.39 2.36
Mexico ........................................................................... 2.05 2.08 2.03 2.02 1.95 2.04 2.12 2.13 2.10 2.12 2.09 2.10 2.04 2.06
United States ................................................................. 18.64 18.72 19.21 19.26 18.81 18.71 19.09 19.09 18.90 19.00 19.30 19.18 18.96 18 .9 2
Central and South America ... .. .. .. .. .. .. .. .. .. .. .. .. .. .. .. .. .. 6.71 6.97 6.99 6.97 6.89 7.14 7.21 7.18 7.03 7.29 7.33 7.31 6.91 7.11
Brazil .............................................................................. 2.83 2.94 3.00 2.99 2.97 3.08 3.15 3.14 3.04 3.16 3.23 3.21 2.94 3.09
Europe ......................................................................... 13.88 14.51 14.69 14.25 13.70 14.19 14.50 14.46 14.18 13.91 14.37 14.33 14.33 14 .2 1
Eurasia ......................................................................... 4.58 4.52 4.79 4.77 4.66 4.59 4.86 4.84 4.60 4.53 4.80 4.78 4.67 4.74
Russia ........................................................................... 3.24 3.19 3.38 3.37 3.30 3.25 3.44 3.43 3.24 3.20 3.39 3.37 3.30 3.36
Middle East ................................................................. 7.38 7.83 8.44 7.73 7.70 8.06 8.75 7.95 7.92 8.50 9.07 8.23 7.85 8.12
Asi a and Ocean ia ...................................................... 30.24 29.52 29.24 30.47 30.58 30.26 29.94 30.84 31.07 30.95 30.45 31.34 29.87 30 .4 0
China ............................................................................. 10.50 10.56 10.51 10.87 10.58 11.16 11.11 11.07 10.94 11.54 11.49 11.44 10.61 10 .9 8
apan ............................................................................. 5.05 4.08 4.28 4.72 5.02 3.93 4.15 4.54 4.72 3.97 4.00 4.39 4.53 4.41
ndia ............................................................................... 3.78 3.77 3.45 3.73 3.89 3.87 3.55 3.84 3.99 3.97 3.64 3.94 3.68 3.78
Afr ica ........................................................................... 3.44 3.44 3.39 3.41 3.55 3.55 3.50 3.52 3.67 3.67 3.62 3.64 3.42 3.53
Total OECD Liquid Fuels Consumption ... .. .. .. .. .. .. .. . 45.79 45.55 46.30 46.49 45.72 44.97 46.03 46.61 46.36 45.19 46.02 46.45 46.04 45 .8 4
Total non-OECD Liquid Fuels Consumption ... .. .. .. . 43.52 44.45 44.87 44.80 44.54 45.88 46.32 45.77 45.47 47.07 47.41 46.83 44.41 45 .6 3
Total World Liquid Fuels Consumption ... .. .. .. .. .. .. .. . 89.31 90.00 91.17 91.29 90.25 90.86 92.35 92.38 91.83 92.25 93.43 93.29 90.45 91 .4 7
World Index, 2010 Q1 = 100 ........................................ 109.9 110.8 111.8 112.7 113.0 113.7 114.7 115.7 116.5 117.5 118.6 119.5 111.3 11 4. 3
Percent change from prior year ................................. 2.2 2.5 2.8 3.2 2.9 2.7 2.7 2.7 3.1 3.3 3.3 3.3 2.7 2.7
OECD Index, 2010 Q1 = 100 ....................................... 105.2 105.7 106.5 107.1 107.3 107.7 108.4 109.1 109.8 110.4 111.2 111.7 106.1 10 8. 1
Percent change from prior year ................................. 0.9 1.2 1.7 2.3 1.9 1.9 1.8 1.9 2.3 2.5 2.5 2.4 1.5 1.9
Non-OECD Index, 2010 Q1 = 100 ............................... 115.8 117.2 118.5 119.9 120.5 121.6 122.9 124.2 125.4 126.8 128.3 129.6 117.9 12 2. 3
Percent change from prior year ................................. 3.9 4.2 4.3 4.4 4.0 3.7 3.7 3.6 4.1 4.3 4.4 4.3 4.2 3.7
Real U.S. Dollar Exchange Rate (a)
ndex, January 2010 = 100 ........................................... 104.08 105.59 106.88 106.37 107.93 107.71 108.52 10 9. 88 1 10 .4 1 1 10 .8 8 1 11 .2 8 1 11 .4 4 105.73 108.51 1
Percent change from prior year .................................... 3.8 3.6 4.1 3.0 3.7 2.0 1.5 3.3 2.3 2.9 2.5 1.4 3.6 2.6
Table 3d. World Petrioleum and Other Liquids Consumption (million barrels per day)
U.S. Energy Information Administration | Short-Term Energy Outlook - October 20142013 2014 2015
Notes: The approximate break between historical and forecast values i s shown with historical data printed in bold; estimates and forecasts in italics.
Historical data: Latest data available from Energy Information Administration international energy statistics.
Minor discrepancies with published historical data are due to independent rounding.
Projections: EIA Regional Short-Term Energy Model.
Oil-weighted Real Gross Domestic Product (a)
= no data available
OECD = Organisation for Economic Co-operation and Development: Australia, Austria, Belgium, Canada, Chile, the Czech Republic, Denmark, Finland,
France, Germany, Greece, Hungary, Iceland, Ireland, Israel, Italy, Japan, Luxembourg, Mexico, the Netherlands, New Zealand, Norway, Poland, Portugal,
Slovakia, Slovenia, South Korea, Spain, Sweden, Switzerland, Turkey, the United Kingdom, and the United States.
a) Weighted geometric mean of real indices for various countries with weights equal to each country's share of world oil consumption in the base period. Exchange rate is measured in foreign currency
ollar.
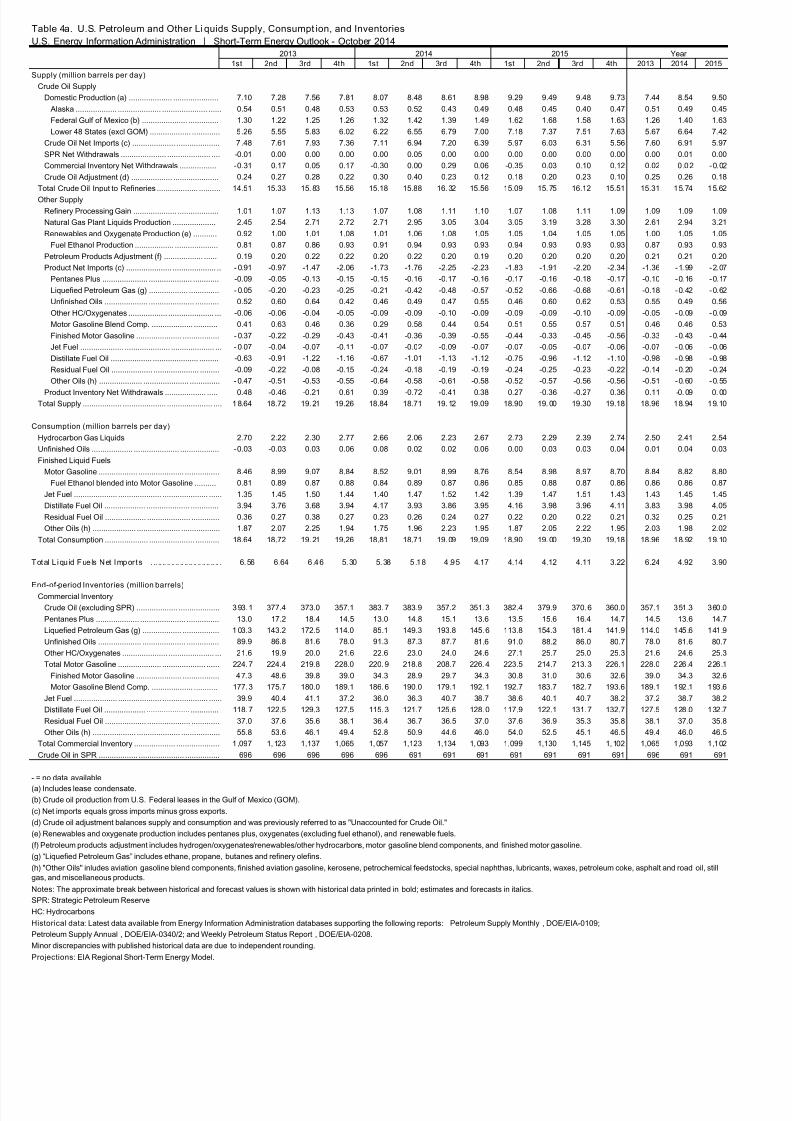
8/10/2019 Short Term Energy Outlook_EIA
http://slidepdf.com/reader/full/short-term-energy-outlookeia 34/48
1st 2nd 3rd 4th 1st 2nd 3rd 4th 1st 2nd 3rd 4th 2013 2014 2015
Supply (million barrels per day)
Crude Oil Supply
Domestic Production (a) .................... ..................... 7.10 7.28 7.56 7.81 8.07 8.48 8.61 8.98 9.29 9.49 9.48 9.73 7.44 8.54 9.50
Alaska ................... .................... ..................... ...... 0.54 0.51 0.48 0.53 0.53 0.52 0.43 0.49 0.48 0.45 0.40 0.47 0.51 0.49 0.45
Federal Gulf of Mexico (b) ..................... .............. 1.30 1.22 1.25 1.26 1.32 1.42 1.39 1.49 1.62 1.68 1.58 1.63 1.26 1.40 1.63
Lower 48 States (excl GOM) ................... ............. 5.26 5.55 5.83 6.02 6.22 6.55 6.79 7.00 7.18 7.37 7.51 7.63 5.67 6.64 7.42
Crude Oil Net Imports (c) .................... .................... 7 .48 7.61 7.93 7.36 7.11 6.94 7.20 6.39 5.97 6.03 6.31 5.56 7.60 6.91 5.97
SPR Net Withdrawals ..................... .................... .... -0.01 0.00 0.00 0.00 0.00 0.05 0.00 0.00 0.00 0.00 0.00 0.00 0.00 0.01 0.00
Commercial Inventory Net Withdrawals ................. -0.31 0.17 0.05 0.17 -0.30 0.00 0.29 0.06 -0.35 0.03 0.10 0.12 0.02 0 .02 -0.02
Crude Oil Adjustment (d) ................... ..................... 0.24 0.27 0.28 0.22 0.30 0.40 0.23 0.12 0.18 0.20 0.23 0.10 0.25 0.26 0.18
Total Crude Oil Input to Refineries ................... .......... 14.51 15.33 15.83 15.56 15.18 15.88 16.32 15.56 15.09 15.75 16.12 15.51 15.31 15.74 15.62
Other Supply
Refinery Processing Gain .................... ................... 1.01 1.07 1.13 1.13 1.07 1.08 1.11 1.10 1.07 1.08 1.11 1.09 1.09 1.09 1.09
Natural Gas Plant Liquids Production .................... 2.45 2.54 2.71 2.72 2.71 2.95 3.05 3.04 3.05 3.19 3.28 3.30 2.61 2.94 3.21
Renewables and Oxygenate Production (e) ........... 0.92 1.00 1.01 1.08 1.01 1.06 1.08 1.05 1.05 1.04 1.05 1.05 1.00 1.05 1.05
Fuel Ethanol Production .................. .................... 0.81 0.87 0.86 0.93 0.91 0.94 0.93 0.93 0.94 0.93 0.93 0.93 0.87 0.93 0.93
Petroleum Products Adjustment (f) .................. ...... 0.19 0.20 0.22 0.22 0.20 0.22 0.20 0.19 0.20 0.20 0.20 0.20 0.21 0.21 0.20
Product Net Imports (c) ..................... .................... .. - 0.91 -0.97 -1.47 -2.06 -1.73 -1.76 -2.25 -2.23 -1.83 -1.91 -2.20 -2.34 -1.36 -1.99 -2.07
Pentanes Plus ..................... .................... ............ -0.09 -0.05 -0.13 -0.15 -0.15 -0.16 -0.17 -0.16 -0.17 -0.16 -0.18 -0.17 -0.10 -0.16 -0.17
Liquefied Petroleum Gas (g) .................. .............. - 0.05 -0.20 -0.23 -0.25 -0.21 -0.42 -0.48 -0.57 -0.52 -0.66 -0.68 -0.61 -0.18 -0.42 -0.62
Unfinished Oils .................... ..................... ........... 0.52 0.60 0.64 0.42 0.46 0.49 0.47 0.55 0.46 0.60 0.62 0.53 0.55 0.49 0.56
Other HC/Oxygenates .................. ..................... ... -0.06 -0.06 -0.04 -0.05 -0.09 -0.09 -0.10 -0.09 -0.09 -0.09 -0.10 -0.09 -0.05 -0.09 -0.09
Motor Gasoline Blend Comp. ................... ........... 0.41 0.63 0.46 0.36 0.29 0.58 0.44 0.54 0.51 0.55 0.57 0.51 0.46 0.46 0.53
Finished Motor Gasoline ..................... ................. - 0.37 -0.22 -0.29 -0.43 -0.41 -0.36 -0.39 -0.55 -0.44 -0.33 -0.45 -0.56 -0.33 -0.43 -0.44
Jet Fuel .................... ..................... .................... ... - 0.07 -0.04 -0.07 -0.11 -0.07 -0.02 -0.09 -0.07 -0.07 -0.05 -0.07 -0.06 -0.07 -0.06 -0.06
Distillate Fuel Oil ................... ..................... ......... -0.63 -0.91 -1.22 -1.16 -0.67 -1.01 -1.13 -1.12 -0.75 -0.96 -1.12 -1.10 -0.98 -0.98 -0.98
Residual Fuel Oil ................... ..................... ......... -0.09 -0.22 -0.08 -0.15 -0.24 -0.18 -0.19 -0.19 -0.24 -0.25 -0.23 -0.22 -0.14 -0.20 -0.24
Other Oils (h) .................... ..................... .............. - 0.47 -0.51 -0.53 -0.55 -0.64 -0.58 -0.61 -0.58 -0.52 -0.57 -0.56 -0.56 -0.51 -0.60 -0.55
Product Inventory Net Withdrawals ................... ..... 0.48 -0.46 -0.21 0.61 0.39 -0.72 -0.41 0.38 0.27 -0.36 -0.27 0.36 0.11 -0.09 0.00
Total Supply .................. .................... ..................... .... 18.64 18.72 19.21 19.26 18.84 18.71 19.12 19.09 18.90 19.00 19.30 19.18 18.96 18.94 19.10
Consumption (million barrels per day)
Hydrocarbon Gas Liquids 2.70 2.22 2.30 2.77 2.66 2.06 2.23 2.67 2.73 2.29 2.39 2.74 2.50 2.41 2.54
Unfinished Oils ................... ..................... .................. -0.03 -0.03 0.03 0.06 0.08 0.02 0.02 0.06 0.00 0.03 0.03 0.04 0.01 0.04 0.03
Finished Liquid Fuels
Motor Gasoline .................. ..................... ................ 8.46 8.99 9.07 8.84 8.52 9.01 8.99 8.76 8.54 8.98 8.97 8.70 8.84 8.82 8.80
Fuel Ethanol blended into Motor Gasoline .......... 0.81 0.89 0.87 0.88 0.84 0.89 0.87 0.86 0.85 0.88 0.87 0.86 0.86 0.86 0.87
Jet Fuel .................... .................... ..................... ...... 1.35 1.45 1.50 1.44 1.40 1.47 1.52 1.42 1.39 1.47 1.51 1.43 1.43 1.45 1.45
Distillate Fuel Oil ................... .................... ............. 3.94 3.76 3.68 3.94 4.17 3.93 3.86 3.95 4.16 3.98 3.96 4.11 3.83 3.98 4.05
Residual Fuel Oil ................... .................... ............. 0.36 0.27 0.38 0.27 0.23 0.26 0.24 0.27 0.22 0.20 0.22 0.21 0.32 0.25 0.21
Other Oils (h) .................... .................... .................. 1.87 2.07 2.25 1.94 1.75 1.96 2.23 1.95 1.87 2.05 2.22 1.95 2.03 1.98 2.02
Total Consumption .................... ..................... ........... 18.64 18.72 19.21 19.26 18.81 18.71 19.09 19.09 18.90 19.00 19.30 19.18 18.96 18.92 19.10
otal L iqu id Fue ls Net Impor ts . .. .. .. .. .. .. .. .. .. .. .. .. .. .. .. . 6.56 6 .64 6 .46 5.30 5.38 5 .18 4 .95 4.17 4.14 4.12 4.11 3.22 6.24 4.92 3.90
End-of-period Inventories (million barrels)Commercial Inventory
Crude Oil (excluding SPR) ................... ................... 393.1 377.4 373.0 357.1 383.7 383.9 357.2 351.3 382.4 379.9 370.6 360.0 357.1 351.3 360.0
Pentanes Plus .................... ..................... ............... 13.0 17.2 18.4 14.5 13.0 14.8 15.1 13.6 13.5 15.6 16.4 14.7 14.5 13.6 14.7
Liquefied Petroleum Gas (g) .................. ................. 1 03.3 143.2 172.5 114.0 85.1 149.3 193.8 145.6 113.8 154.3 181.4 141.9 114.0 145.6 141.9
Unfinished Oils .................... .................... ............... 89.9 86.8 81.6 78.0 91.3 87.3 87.7 81.6 91.0 88.2 86.0 80.7 78.0 81.6 80.7
Other HC/Oxygenates ..................... ..................... ... 21.6 19.9 20.0 21.6 22.6 23.0 24.0 24.6 27.1 25.7 25.0 25.3 21.6 24.6 25.3
Total Motor Gasoline .................... .................... ...... 224.7 224.4 219.8 228.0 220.9 218.8 208.7 226.4 223.5 214.7 213.3 226.1 228.0 226.4 226.1
Finished Motor Gasoline ..................... ................. 47.3 48.6 39.8 39.0 34.3 28.9 29.7 34.3 30.8 31.0 30.6 32.6 39.0 34.3 32.6
Motor Gasoline Blend Comp. ................... ........... 177.3 175.7 180.0 189.1 186.6 190.0 179.1 192.1 192.7 183.7 182.7 193.6 189.1 192.1 193.6
Jet Fuel .................... .................... ..................... ...... 39.9 40.4 41.1 37.2 36.0 36.3 40.7 38.7 38.6 40.1 40.7 38.2 37.2 38.7 38.2
Distillate Fuel Oil ................... .................... ............. 118.7 122.5 129.3 127.5 115.3 121.7 125.6 128.0 117.9 122.1 131.7 132.7 127.5 128.0 132.7
Residual Fuel Oil ................... .................... ............. 37.0 37.6 35.6 38.1 36.4 36.7 36.5 37.0 37.6 36.9 35.3 35.8 38.1 37.0 35.8
Other Oils (h) .................... .................... .................. 55.8 53.6 46.1 49.4 52.8 50.9 44.6 46.0 54.0 52.5 45.1 46.5 49.4 46.0 46.5
Total Commercial Inventory ................... .................... 1 ,097 1,123 1,137 1,065 1,057 1,123 1,134 1,093 1,099 1,130 1,145 1,102 1,065 1,093 1,102
Crude Oil in SPR .................. ..................... ................ 696 696 696 696 696 691 691 691 691 691 691 691 696 691 691
e) Renewables and oxygenate production includes pentanes plus, oxygenates (excluding fuel ethanol), and renewable fuels.
Table 4a. U.S. Petroleum and Other Li quids Supply, Consumpt ion, and Inventories
U.S. Energy Information Administration | Short-Term Energy Outlook - October 2014
2013 2014 2015 Year
= no data availablea) Includes lease condensate.
b) Crude oil production from U.S. Federal leases in the Gulf of Mexico (GOM).
c) Net imports equals gross imports minus gross exports.
d) Crude oil adjustment balances supply and consumption and was previously referred to as "Unaccounted for Crude Oil."
Historical data: Latest data available from Energy Information Administration databases supporting the following reports: Petroleum Supply Monthly , DOE/EIA-0109;
Petroleum Supply Annual , DOE/EIA-0340/2; and Weekly Petroleum Status Report , DOE/EIA-0208.
Minor discrepancies with published historical data are due to independent rounding.
Projections: EIA Regional Short-Term Energy Model.
f) Petroleum products adjustment includes hydrogen/oxygenates/renewables/other hydrocarbons, motor gasoline blend components, and finished motor gasoline.
g) “Liquefied Petroleum Gas” includes ethane, propane, butanes and refinery olefins.
h) "Other Oils" inludes aviation gasoline blend components, finished aviation gasoline, kerosene, petrochemical feedstocks, special naphthas, lubricants, waxes, petroleum coke, asphalt and road oil, stillas, and miscellaneous products.
Notes: The approximate break between historical and forecast values is shown with historical data printed in bold; estimates and forecasts in italics.
SPR: Strategic Petroleum Reserve
HC: Hydrocarbons

8/10/2019 Short Term Energy Outlook_EIA
http://slidepdf.com/reader/full/short-term-energy-outlookeia 35/48
1st 2nd 3rd 4th 1st 2nd 3rd 4th 1st 2nd 3rd 4th 2013 2014 201
HGL Production
Natural Gas Processin g Plants
Ethane ............................................................. 0.94 0.92 0.99 1.04 1.03 1.09 1.10 1.17 1.19 1.19 1.22 1.28 0.97 1.10 1
Propane ........................................................... 0.76 0.81 0.85 0.86 0.87 0.95 1.01 0.96 0.99 1.06 1.10 1.09 0.82 0.95 1
Butanes/Butylenes .......................................... 0.43 0.46 0.49 0.48 0.48 0.52 0.53 0.53 0.51 0.53 0.54 0.54 0.47 0.52 0
Natural Gasoline (Pentanes Plus) ................... 0.31 0.35 0.38 0.35 0.33 0.39 0.40 0.37 0.37 0.41 0.42 0.40 0.35 0.37 0
Refinery and Blender Net Product ion
Ethane/Ethylene .............................................. 0.01 0.01 0.01 0.01 0.01 0.01 0.01 0.01 0.01 0.01 0.01 0.01 0.01 0.01 0
Propane/Propylene ......................................... 0.55 0.57 0.58 0.57 0.57 0.60 0.59 0.58 0.56 0.58 0.58 0.56 0.56 0.58 0
Butanes/Butylenes .......................................... -0.04 0.27 0.19 -0.21 -0.04 0.27 0.19 -0.17 -0.04 0.25 0.17 -0.16 0.05 0.06 0
Renewable Fuels and Oxygenate Plant Net Product ion
Natural Gasoline (Pentanes Plus) ................... - 0.02 -0.02 -0.02 -0.02 -0.02 -0.02 -0.02 -0.02 -0.02 -0.02 -0.02 -0.02 -0.02 -0.02 -0
HGL Net Imports
Ethane ................................................................ 0.00 0.00 0.00 0.00 -0.01 -0.02 -0.06 -0.08 -0.09 -0.09 -0.11 -0.11 0.00 -0.04 -0
Propane .............................................................. -0.05 -0.19 -0.21 -0.25 -0.17 -0.34 -0.35 -0.39 -0.35 -0.45 -0.47 -0.43 -0.18 -0.31 -0
Butanes/Butylenes ............................................. -0.01 -0.01 -0.02 0.00 -0.03 -0.06 -0.07 -0.10 -0.08 -0.11 -0.10 -0.07 -0.01 -0.06 -0
Natural Gasoline (Pentanes Plus) ...................... - 0.09 -0.05 -0.13 -0.15 -0.15 -0.16 -0.17 -0.16 -0.17 -0.16 -0.18 -0.17 -0.10 -0.16 -0
HGL Refinery and Blender Net Inputs
Butanes/Butylenes ............................................. 0.34 0.26 0.30 0.43 0.37 0.28 0.29 0.41 0.34 0.27 0.30 0.43 0.33 0.33 0
Natural Gasoline (Pentanes Plus) ...................... 0.18 0.15 0.17 0.16 0.14 0.15 0.16 0.18 0.16 0.17 0.17 0.18 0.17 0.16 0
HGL Consumption
Ethane/Ethylene ................................................. 0.96 0.92 1.00 1.09 1.01 0.97 1.05 1.12 1.11 1.09 1.14 1.18 0.99 1.04 1
Propane/Propylene ............................................ 1.56 1.03 1.08 1.43 1.46 0.89 1.00 1.35 1.44 0.99 1.05 1.35 1.28 1.17 1
Butanes/Butylenes ............................................. 0.15 0.18 0.17 0.19 0.16 0.17 0.14 0.16 0.16 0.18 0.15 0.16 0.17 0.16 0
Natural Gasoline (Pentanes Plus) ...................... 0.03 0.08 0.05 0.06 0.03 0.03 0.05 0.04 0.02 0.04 0.05 0.05 0.06 0.04 0
HGL Inventories (milli on barrels)
Ethane/Ethylene ................................................. 3 4.26 35.18 34.46 32.79 29.90 37.06 40.62 39.36 38.13 40.25 39.00 38.26 34.17 36.77 38Propane/Propylene ............................................ 40.68 55.31 68.10 45.08 28.32 57.12 80.04 61.37 39.18 57.13 71.81 59.68 45.08 61.37 59
Butanes/Butylenes ............................................. 2 7.94 52.84 69.60 38.06 25.95 52.24 73.58 45.76 35.96 56.51 70.99 44.44 38.06 45.76 44
Natural Gasoline (Pentanes Plus) ...................... 1 3.05 17.23 18.36 14.47 13.04 14.82 15.10 13.63 13.49 15.56 16.38 14.70 14.47 13.63 14
Refinery and Blender Net Inputs
Crude OIl .............................................................. 14.51 15.33 15.83 15.56 15.18 15.88 16.32 15.56 15.09 15.75 16.12 15.51 15.31 15.74 15
Hydrocarbon Gas Liquids .................................... 0.51 0.41 0.48 0.58 0.52 0.43 0.45 0.58 0.50 0.44 0.46 0.62 0.50 0.49 0
Other Hydrocarbons/Oxygenates ........................ 1.04 1.12 1.15 1.15 1.08 1.16 1.13 1.10 1.09 1.13 1.12 1.11 1.12 1.12 1
Unfinished Oils ..................................................... 0.47 0.66 0.67 0.40 0.24 0.51 0.45 0.55 0.35 0.60 0.61 0.55 0.55 0.44 0
Motor Gasoline Blend Components ..................... 0.52 0.72 0.46 0.50 0.71 1.06 0.92 0.56 0.69 0.83 0.75 0.56 0.55 0.81 0
Aviation Gasoline Blend Components ................. 0.00 0.00 0.00 0.00 0.00 0.00 0.00 0.00 0.00 0.00 0.00 0.00 0.00 0.00 0
Total Refinery and Blender Net Inputs .................... 17.05 18.24 18.58 18.19 17.73 19.04 19.27 18.36 17.72 18.75 19.06 18.35 18.02 18.60 18
Ref inery Processing Gain .. .. .. .. ... .. ... .. .. .. ... .. .. .. ... 1 .01 1.07 1.13 1.13 1.07 1.08 1.11 1.10 1.07 1.08 1.11 1.09 1.09 1.09 1
Refinery and Blender Net Production
Hydrocarbon Gas Liquids .................................... 0.51 0.84 0.77 0.37 0.54 0.87 0.79 0.42 0.52 0.84 0.75 0.41 0.62 0.65 0Finished Motor Gasoline ...................................... 8.87 9.27 9.30 9.49 9.26 9.82 9.76 9.52 9.12 9.49 9.57 9.44 9.23 9.59 9
Jet Fuel ................................................................. 1.43 1.50 1.57 1.50 1.45 1.49 1.65 1.47 1.46 1.53 1.59 1.47 1.50 1.52 1
Distillate Fuel ........................................................ 4.35 4.66 4.92 4.99 4.66 4.96 4.98 5.04 4.74 4.93 5.13 5.17 4.73 4.91 4
Residual Fuel ....................................................... 0.49 0.49 0.44 0.45 0.46 0.44 0.42 0.46 0.47 0.45 0.43 0.43 0.47 0.45 0
Other Oils (a) ........................................................ 2.42 2.55 2.70 2.53 2.43 2.52 2.78 2.54 2.48 2.60 2.71 2.52 2.55 2.57 2
Total Refinery and Blender Net Production ............ 18.06 19.31 19.71 19.32 18.80 20.11 20.38 19.46 18.79 19.83 20.18 19.44 19.11 19.69 19
Refinery Distillation Inputs ................................ 14.80 15.77 16.31 15.99 15.51 16.17 16.65 15.94 15.42 16.06 16.47 15.89 15.72 16.07 15
Refinery Operable Distil lation Capacity ... .. .. .. .. 17.82 17.81 17.82 17.82 17.93 17.89 17.86 17.83 17.83 17.83 17.83 17.83 17.82 17.88 17
Ref inery Disti l lat ion Ut i lization Factor . .. .. .. .. ... .. 0 .83 0.89 0.92 0.90 0.87 0.90 0.93 0.89 0.86 0.90 0.92 0.89 0.88 0.90 0
Table 4b. U.S. Hydrocarb on Gas Liquids (HGL) and Petroleum Refinery Balances (million barrels per day, except inventories and utilization factor)
U.S. Energy Information Administration | Short-Term Energy Outlook - October 20142013 2014 2015 Year
Projections: EIA Regional Short-Term Energy Model.
= no data available
a) "Other Oils" includes aviation gasoline blend components, finished aviation gasoline, kerosene, petrochemical feedstocks, special naphthas, lubricants, waxes, petroleum coke, asphalt and road oil, s
as, and miscellaneous products.
Notes: The approximate break between historical and forecast values i s shown with historical data printed in bold; estimates and forecasts in italics.
Historical data: Latest data available from Energy Information Administration databases supporting the following reports:Petroleum Supply Monthly , DOE/EIA-0109;
Petroleum Supply Annual , DOE/EIA-0340/2; Weekly Petroleum Status Report , DOE/EIA-0208.
Minor discrepancies with published historical data are due to independent rounding.
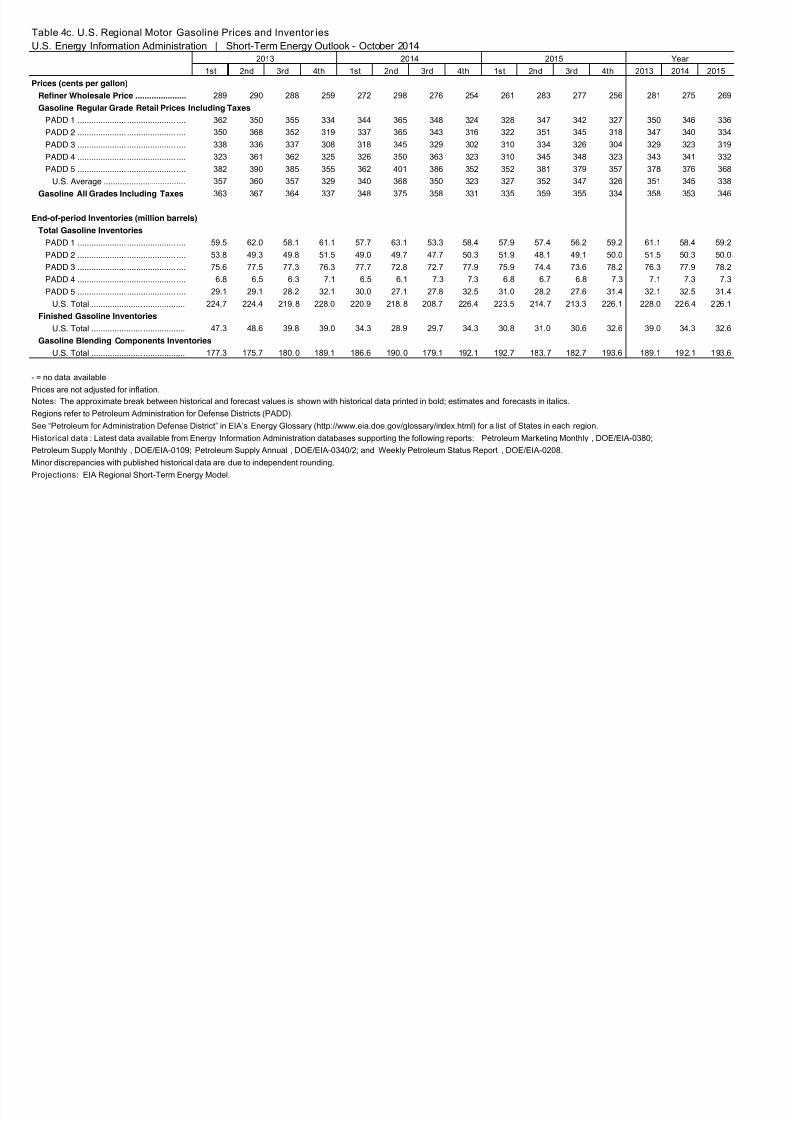
8/10/2019 Short Term Energy Outlook_EIA
http://slidepdf.com/reader/full/short-term-energy-outlookeia 36/48
1st 2nd 3rd 4th 1st 2nd 3rd 4th 1st 2nd 3rd 4th 2013 2014 2015
Prices (cents per gallon)
Refiner Wholesale Price ...................... 289 290 288 259 272 298 276 254 261 283 277 256 281 275 269
Gasoline Regular Grade Retail Prices Including Taxes
PADD 1 ..................... ..................... .... 362 350 355 334 344 365 348 324 328 347 342 327 350 346 336
PADD 2 ..................... ..................... .... 350 368 352 319 337 365 343 316 322 351 345 318 347 340 334
PADD 3 ..................... ..................... .... 338 336 337 308 318 345 329 302 310 334 326 304 329 323 319
PADD 4 ..................... ..................... .... 323 361 362 325 326 350 363 323 310 345 348 323 343 341 332
PADD 5 ..................... ..................... .... 382 390 385 355 362 401 386 352 352 381 379 357 378 376 368
U.S. Average .................... ............... 357 360 357 329 340 368 350 323 327 352 347 326 351 345 338
Gasoline All Grades Including Taxes 363 367 364 337 348 375 358 331 335 359 355 334 358 353 346
End-of-period Inventories (million barrels)
Total Gasoline Inventories
PADD 1 ..................... ..................... .... 59.5 62.0 58.1 61.1 57.7 63.1 53.3 58.4 57.9 57.4 56.2 59.2 61.1 58.4 59.2
PADD 2 ..................... ..................... .... 53.8 49.3 49.8 51.5 49.0 49.7 47.7 50.3 51.9 48.1 49.1 50.0 51.5 50.3 50.0
PADD 3 ..................... ..................... .... 75.6 77.5 77.3 76.3 77.7 72.8 72.7 77.9 75.9 74.4 73.6 78.2 76.3 77.9 78.2
PADD 4 ..................... ..................... .... 6.8 6.5 6.3 7.1 6.5 6.1 7.3 7.3 6.8 6.7 6.8 7.3 7.1 7.3 7.3
PADD 5 ..................... ..................... .... 29.1 29.1 28.2 32.1 30.0 27.1 27.8 32.5 31.0 28.2 27.6 31.4 32.1 32.5 31.4
U.S. Total ...................... .................. 224.7 224.4 219.8 228.0 220.9 218.8 208.7 226.4 223.5 214.7 213.3 226.1 228.0 226.4 226.1
Finished Gasoline Inventories
U.S. Total ...................... .................. 47.3 48.6 39.8 39.0 34.3 28.9 29.7 34.3 30.8 31.0 30.6 32.6 39.0 34.3 32.6
Gasoline Blending Components Inventories
U.S. Total ...................... .................. 177.3 175.7 180.0 189.1 186.6 190.0 179.1 192.1 192.7 183.7 182.7 193.6 189.1 192.1 193.6
Table 4c. U.S. Regional Motor Gasoline Prices and Inventor ies
U.S. Energy Information Administration | Short-Term Energy Outlook - October 20142013 2014 2015 Year
Petroleum Supply Monthly , DOE/EIA-0109; Petroleum Supply Annual , DOE/EIA-0340/2; and Weekly Petroleum Status Report , DOE/EIA-0208.
Minor discrepancies with published historical data are due to independent rounding.
Projections: EIA Regional Short-Term Energy Model.
= no data available
Prices are not adjusted for inflation.Notes: The approximate break between historical and forecast values is shown with historical data printed in bold; estimates and forecasts in italics.
Regions refer to Petroleum Administration for Defense Districts (PADD).
See “Petroleum for Administration Defense District” in EIA’s Energy Glossary (http://www.eia.doe.gov/glossary/index.html) for a list of States in each region.
Historical data : Latest data available from Energy Information Administration databases supporting the following reports: Petroleum Marketing Monthly , DOE/EIA-0380;
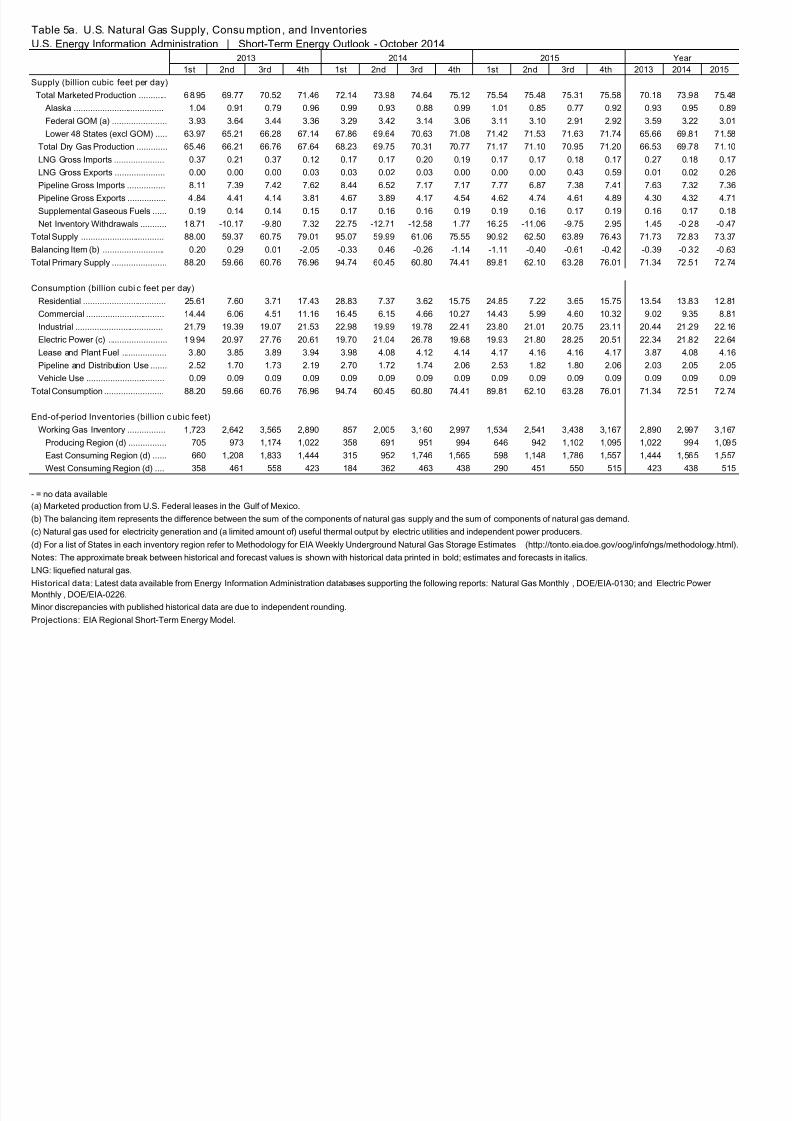
8/10/2019 Short Term Energy Outlook_EIA
http://slidepdf.com/reader/full/short-term-energy-outlookeia 37/48
1st 2nd 3rd 4th 1st 2nd 3rd 4th 1st 2nd 3rd 4th 2013 2014 2015
Supply (billion cubic feet per day)
Total Marketed Production ............ 6 8.95 69.77 70.52 71.46 72.14 73.98 74.64 75.12 75.54 75.48 75.31 75.58 70.18 73.98 75.48
Alaska ...................................... 1.04 0.91 0.79 0.96 0.99 0.93 0.88 0.99 1.01 0.85 0.77 0.92 0.93 0.95 0.89
Federal GOM (a) ....................... 3.93 3.64 3.44 3.36 3.29 3.42 3.14 3.06 3.11 3.10 2.91 2.92 3.59 3.22 3.01
Lower 48 States (excl GOM) ..... 63.97 65.21 66.28 67.14 67.86 69.64 70.63 71.08 71.42 71.53 71.63 71.74 65.66 69.81 71.58
Total Dry Gas Production ............. 65.46 66.21 66.76 67.64 68.23 69.75 70.31 70.77 71.17 71.10 70.95 71.20 66.53 69.78 71.10
LNG Gross Imports ..................... 0.37 0.21 0.37 0.12 0.17 0.17 0.20 0.19 0.17 0.17 0.18 0.17 0.27 0.18 0.17
LNG Gross Exports ..................... 0.00 0.00 0.00 0.03 0.03 0.02 0.03 0.00 0.00 0.00 0.43 0.59 0.01 0.02 0.26
Pipeline Gross Imports ................ 8.11 7.39 7.42 7.62 8.44 6.52 7.17 7.17 7.77 6.87 7.38 7.41 7.63 7.32 7.36
Pipeline Gross Exports ................ 4.84 4.41 4.14 3.81 4.67 3.89 4.17 4.54 4.62 4.74 4.61 4.89 4.30 4.32 4.71
Supplemental Gaseous Fuels ...... 0.19 0.14 0.14 0.15 0.17 0.16 0.16 0.19 0.19 0.16 0.17 0.19 0.16 0.17 0.18
Net Inventory Withdrawals ........... 18.71 -10.17 -9.80 7.32 22.75 -12.71 -12.58 1 .77 16.25 -11.06 -9.75 2.95 1.45 -0.28 -0.47
Total Supply ................................... 88.00 59.37 60.75 79.01 95.07 59.99 61.06 75.55 90.92 62.50 63.89 76.43 71.73 72.83 73.37
Balancing Item (b) .......................... 0.20 0.29 0.01 -2.05 -0.33 0.46 -0.26 -1.14 -1.11 -0.40 -0.61 -0.42 -0.39 -0.32 -0.63
Total Primary Supply ....................... 88.20 59.66 60.76 76.96 94.74 60.45 60.80 74.41 89.81 62.10 63.28 76.01 71.34 72.51 72.74
Consumption (billion cubi c feet per day)
Residential ................................... 25.61 7.60 3.71 17.43 28.83 7.37 3.62 15.75 24.85 7.22 3.65 15.75 13.54 13.83 12.81
Commercial ................................. 14.44 6.06 4.51 11.16 16.45 6.15 4.66 10.27 14.43 5.99 4.60 10.32 9.02 9.35 8.81
Industrial ..................................... 21.79 19.39 19.07 21.53 22.98 19.99 19.78 22.41 23.80 21.01 20.75 23.11 20.44 21.29 22.16
Electric Power (c) ......................... 1 9.94 20.97 27.76 20.61 19.70 21.04 26.78 19.68 19.93 21.80 28.25 20.51 22.34 21.82 22.64
Lease and Plant Fuel ................... 3.80 3.85 3.89 3.94 3.98 4.08 4.12 4.14 4.17 4.16 4.16 4.17 3.87 4.08 4.16
Pipeline and Distribution Use ....... 2.52 1.70 1.73 2.19 2.70 1.72 1.74 2.06 2.53 1.82 1.80 2.06 2.03 2.05 2.05
Vehicle Use ................................. 0.09 0.09 0.09 0.09 0.09 0.09 0.09 0.09 0.09 0.09 0.09 0.09 0.09 0.09 0.09
Total Consumption ......................... 88.20 59.66 60.76 76.96 94.74 60.45 60.80 74.41 89.81 62.10 63.28 76.01 71.34 72.51 72.74
End-of-period Inventories (billion c ubic feet)
Working Gas Inventory ................ 1,723 2,642 3,565 2,890 857 2,005 3,160 2,997 1,534 2,541 3,438 3,167 2,890 2,997 3,167
Producing Region (d) ................ 705 973 1,174 1,022 358 691 951 994 646 942 1,102 1,095 1,022 994 1,095
East Consuming Region (d) ...... 660 1,208 1,833 1,444 315 952 1,746 1,565 598 1,148 1,786 1,557 1,444 1,565 1,557
West Consuming Region (d) .... 358 461 558 423 184 362 463 438 290 451 550 515 423 438 515
Table 5a. U.S. Natural Gas Supply, Consumption , and Inventories
U.S. Energy Information Administration | Short-Term Energy Outlook - October 2014
2013 2014 2015 Year
NG: liquefied natural gas.
Historical data: Latest data available from Energy Information Administration databases supporting the following reports:Natural Gas Monthly , DOE/EIA-0130; and Electric PowerMonthly , DOE/EIA-0226.
Minor discrepancies with published historical data are due to independent rounding.
Projections: EIA Regional Short-Term Energy Model.
= no data available
a) Marketed production from U.S. Federal leases in the Gulf of Mexico.
b) The balancing item represents the difference between the sum of the components of natural gas supply and the sum of components of natural gas demand.
c) Natural gas used for electricity generation and (a limited amount of) useful thermal output by electric utilities and independent power producers.
d) For a list of States in each inventory region refer toMethodology for EIA Weekly Underground Natural Gas Storage Estimates (http://tonto.eia.doe.gov/oog/info/ngs/methodology.html)
Notes: The approximate break between historical and forecast values is shown with historical data printed in bold; estimates and forecasts in italics.
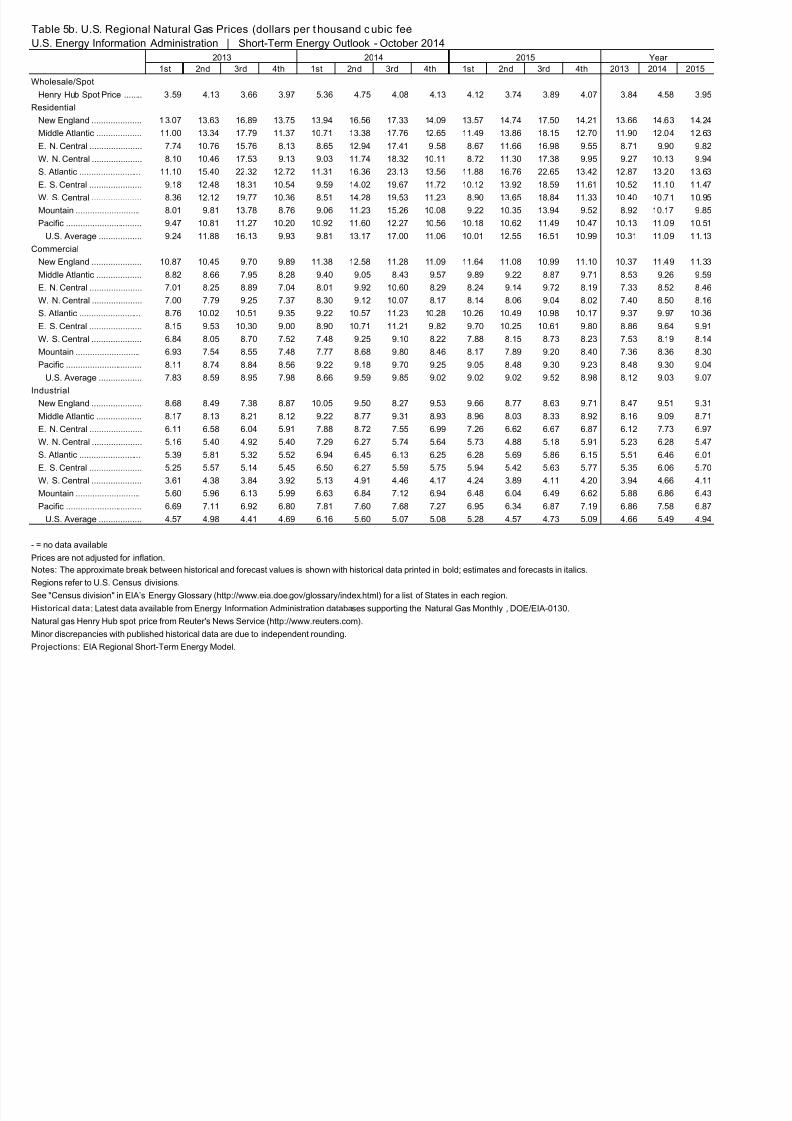
8/10/2019 Short Term Energy Outlook_EIA
http://slidepdf.com/reader/full/short-term-energy-outlookeia 38/48
1st 2nd 3rd 4th 1st 2nd 3rd 4th 1st 2nd 3rd 4th 2013 2014 2015
Wholesale/Spot
Henry Hub Spot Price ........ 3.59 4.13 3.66 3.97 5.36 4.75 4.08 4.13 4.12 3.74 3.89 4.07 3.84 4.58 3.95
Residential
New England ..................... 1 3.07 13.63 16.89 13.75 13.94 16.56 17.33 14.09 13.57 14.74 17.50 14.21 13.66 14.63 14.24
Middle Atlantic ................... 11.00 13.34 17.79 11.37 10.71 13.38 17.76 12.65 11.49 13.86 18.15 12.70 11.90 12.04 12.63
E. N. Central ...................... 7.74 10.76 15.76 8.13 8.65 12.94 17.41 9.58 8.67 11.66 16.98 9.55 8.71 9.90 9.82
W. N. Central ..................... 8.10 10.46 17.53 9.13 9.03 11.74 18.32 10.11 8.72 11.30 17.38 9.95 9.27 10.13 9.94
S. Atlantic .......................... 11.10 15.40 22.32 12.72 11.31 16.36 23.13 13.56 11.88 16.76 22.65 13.42 12.87 13.20 13.63
E. S. Central ...................... 9.18 12.48 18.31 10.54 9.59 14.02 19.67 11.72 10.12 13.92 18.59 11.61 10.52 11.10 11.47
W. S. Central ..................... 8.36 12.12 19.77 10.36 8.51 14.28 19.53 11.23 8.90 13.65 18.84 11.33 10.40 10.71 10.95
Mountain ........................... 8.01 9.81 13.78 8.76 9.06 11.23 15.26 10.08 9.22 10.35 13.94 9.52 8.92 10.17 9.85
Pacific ................................ 9.47 10.81 11.27 10.20 10.92 11.60 12.27 10.56 10.18 10.62 11.49 10.47 10.13 11.09 10.51
U.S. Average .................. 9.24 11.88 16.13 9.93 9.81 13.17 17.00 11.06 10.01 12.55 16.51 10.99 10.31 11.09 11.13
Commercial
New England ..................... 10.87 10.45 9.70 9.89 11.38 12.58 11.28 11.09 11.64 11.08 10.99 11.10 10.37 11.49 11.33
Middle Atlantic ................... 8.82 8.66 7.95 8.28 9.40 9.05 8.43 9.57 9.89 9.22 8.87 9.71 8.53 9.26 9.59
E. N. Central ...................... 7.01 8.25 8.89 7.04 8.01 9.92 10.60 8.29 8.24 9.14 9.72 8.19 7.33 8.52 8.46
W. N. Central ..................... 7.00 7.79 9.25 7.37 8.30 9.12 10.07 8.17 8.14 8.06 9.04 8.02 7.40 8.50 8.16
S. Atlantic .......................... 8.76 10.02 10.51 9.35 9.22 10.57 11.23 10.28 10.26 10.49 10.98 10.17 9.37 9.97 10.36
E. S. Central ...................... 8.15 9.53 10.30 9.00 8.90 10.71 11.21 9.82 9.70 10.25 10.61 9.80 8.86 9.64 9.91
W. S. Central ..................... 6.84 8.05 8.70 7.52 7.48 9.25 9.10 8.22 7.88 8.15 8.73 8.23 7.53 8.19 8.14
Mountain ........................... 6.93 7.54 8.55 7.48 7.77 8.68 9.80 8.46 8.17 7.89 9.20 8.40 7.36 8.36 8.30
Pacific ................................ 8.11 8.74 8.84 8.56 9.22 9.18 9.70 9.25 9.05 8.48 9.30 9.23 8.48 9.30 9.04
U.S. Average .................. 7.83 8.59 8.95 7.98 8.66 9.59 9.85 9.02 9.02 9.02 9.52 8.98 8.12 9.03 9.07
ndustrialNew England ..................... 8.68 8.49 7.38 8.87 10.05 9.50 8.27 9.53 9.66 8.77 8.63 9.71 8.47 9.51 9.31
Middle Atlantic ................... 8.17 8.13 8.21 8.12 9.22 8.77 9.31 8.93 8.96 8.03 8.33 8.92 8.16 9.09 8.71
E. N. Central ...................... 6.11 6.58 6.04 5.91 7.88 8.72 7.55 6.99 7.26 6.62 6.67 6.87 6.12 7.73 6.97
W. N. Central ..................... 5.16 5.40 4.92 5.40 7.29 6.27 5.74 5.64 5.73 4.88 5.18 5.91 5.23 6.28 5.47
S. Atlantic .......................... 5.39 5.81 5.32 5.52 6.94 6.45 6.13 6.25 6.28 5.69 5.86 6.15 5.51 6.46 6.01
E. S. Central ...................... 5.25 5.57 5.14 5.45 6.50 6.27 5.59 5.75 5.94 5.42 5.63 5.77 5.35 6.06 5.70
W. S. Central ..................... 3.61 4.38 3.84 3.92 5.13 4.91 4.46 4.17 4.24 3.89 4.11 4.20 3.94 4.66 4.11
Mountain ........................... 5.60 5.96 6.13 5.99 6.63 6.84 7.12 6.94 6.48 6.04 6.49 6.62 5.88 6.86 6.43
Pacific ................................ 6.69 7.11 6.92 6.80 7.81 7.60 7.68 7.27 6.95 6.34 6.87 7.19 6.86 7.58 6.87
U.S. Average .................. 4.57 4.98 4.41 4.69 6.16 5.60 5.07 5.08 5.28 4.57 4.73 5.09 4.66 5.49 4.94
Table 5b. U.S. Regional Natural Gas Prices (dollars per t housand cubic fee
U.S. Energy Information Administration | Short-Term Energy Outlook - October 2014
2013 2014 2015 Year
Natural gas Henry Hub spot price from Reuter's News Service (http://www.reuters.com).
Minor discrepancies with published historical data are due to independent rounding.
Projections: EIA Regional Short-Term Energy Model.
= no data available
Prices are not adjusted for inflation.
Notes: The approximate break between historical and forecast values is shown with historical data printed in bold; estimates and forecasts in italics.
Regions refer to U.S. Census divisions.See "Census division" in EIA’s Energy Glossary (http://www.eia.doe.gov/glossary/index.html) for a list of States in each region.
Historical data: Latest data available from Energy Information Administration databases supporting the Natural Gas Monthly , DOE/EIA-0130.
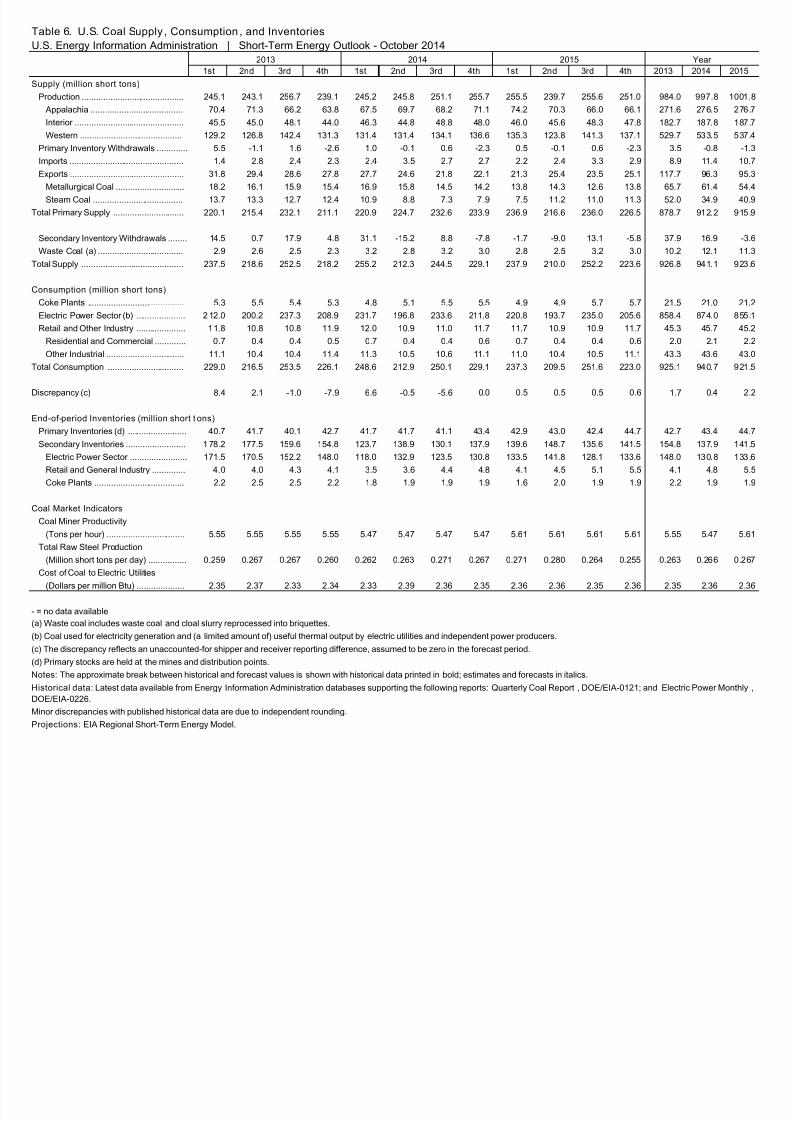
8/10/2019 Short Term Energy Outlook_EIA
http://slidepdf.com/reader/full/short-term-energy-outlookeia 39/48
1st 2nd 3rd 4th 1st 2nd 3rd 4th 1st 2nd 3rd 4th 2013 2014 20
Supply (million short tons)
Production ........................................... 245.1 243.1 256.7 239.1 245.2 245.8 251.1 255.7 255.5 239.7 255.6 251.0 984.0 997.8 10
Appalachia ....................................... 70.4 71.3 66.2 63.8 67.5 69.7 68.2 71.1 74.2 70.3 66.0 66.1 271.6 276.5 2
Interior .............................................. 45.5 45.0 48.1 44.0 46.3 44.8 48.8 48.0 46.0 45.6 48.3 47.8 182.7 187.8 1
Western ........................................... 129.2 126.8 142.4 131.3 131.4 131.4 134.1 136.6 135.3 123.8 141.3 137.1 529.7 533.5 5
Primary Inventory Withdrawals ............. 5.5 -1.1 1.6 -2.6 1.0 -0.1 0.6 -2.3 0.5 -0.1 0.6 -2.3 3.5 -0.8
Imports ................................................ 1.4 2.8 2.4 2.3 2.4 3.5 2.7 2.7 2.2 2.4 3.3 2.9 8.9 11.4
Exports ................................................ 31.8 29.4 28.6 27.8 27.7 24.6 21.8 22.1 21.3 25.4 23.5 25.1 117.7 96.3
Metallurgical Coal ............................. 18.2 16.1 15.9 15.4 16.9 15.8 14.5 14.2 13.8 14.3 12.6 13.8 65.7 61.4
Steam Coal ...................................... 13.7 13.3 12.7 12.4 10.9 8.8 7.3 7.9 7.5 11.2 11.0 11.3 52.0 34.9
Total Primary Supply .............................. 220.1 215.4 232.1 211.1 220.9 224.7 232.6 233.9 236.9 216.6 236.0 226.5 878.7 912.2 9
Secondary Inventory Withdrawals ........ 14.5 0.7 17.9 4.8 31.1 -15.2 8.8 -7.8 -1.7 -9.0 13.1 -5.8 37.9 16.9
Waste Coal (a) .................................... 2.9 2.6 2.5 2.3 3.2 2.8 3.2 3.0 2.8 2.5 3.2 3.0 10.2 12.1
Total Supply ........................................... 237.5 218.6 252.5 218.2 255.2 212.3 244.5 229.1 237.9 210.0 252.2 223.6 926.8 941.1 9
Consumption (million short tons)
Coke Plants ......................................... 5.3 5.5 5.4 5.3 4.8 5.1 5.5 5.5 4.9 4.9 5.7 5.7 21.5 21.0
Electric Power Sector (b) ..................... 2 12.0 200.2 237.3 208.9 231.7 196.8 233.6 211.8 220.8 193.7 235.0 205.6 858.4 874.0 8
Retail and Other Industry ..................... 11.8 10.8 10.8 11.9 12.0 10.9 11.0 11.7 11.7 10.9 10.9 11.7 45.3 45.7
Residential and Commercial ............. 0.7 0.4 0.4 0.5 0.7 0.4 0.4 0.6 0.7 0.4 0.4 0.6 2.0 2.1
Other Industrial ................................. 11.1 10.4 10.4 11.4 11.3 10.5 10.6 11.1 11.0 10.4 10.5 11.1 43.3 43.6
Total Consumption ................................ 229.0 216.5 253.5 226.1 248.6 212.9 250.1 229.1 237.3 209.5 251.6 223.0 925.1 940.7 9
Discrepancy (c) 8.4 2.1 -1.0 -7.9 6.6 -0.5 -5.6 0.0 0.5 0.5 0.5 0.6 1.7 0.4
End-of-period Inventories (million short t ons)
Primary Inventories (d) ......................... 40.7 41.7 40.1 42.7 41.7 41.7 41.1 43.4 42.9 43.0 42.4 44.7 42.7 43.4
Secondary Inventories ......................... 1 78.2 177.5 159.6 154.8 123.7 138.9 130.1 137.9 139.6 148.7 135.6 141.5 154.8 137.9 1
Electric Power Sector ........................ 171.5 170.5 152.2 148.0 118.0 132.9 123.5 130.8 133.5 141.8 128.1 133.6 148.0 130.8 1
Retail and General Industry .............. 4.0 4.0 4.3 4.1 3.5 3.6 4.4 4.8 4.1 4.5 5.1 5.5 4.1 4.8
Coke Plants ...................................... 2.2 2.5 2.5 2.2 1.8 1.9 1.9 1.9 1.6 2.0 1.9 1.9 2.2 1.9
Coal Market Indicators
Coal Miner Productivity
(Tons per hour) ................................. 5.55 5.55 5.55 5.55 5.47 5.47 5.47 5.47 5.61 5.61 5.61 5.61 5.55 5.47
Total Raw Steel Production
(Million short tons per day) ................ 0.259 0.267 0.267 0.260 0.262 0.263 0.271 0.267 0.271 0.280 0.264 0.255 0.263 0.266 0
Cost of Coal to Electric Utilities
(Dollars per million Btu) .................... 2.35 2.37 2.33 2.34 2.33 2.39 2.36 2.35 2.36 2.36 2.35 2.36 2.35 2.36
Table 6. U.S. Coal Supply , Consumption , and Inventories
U.S. Energy Information Administration | Short-Term Energy Outlook - October 2014
2013 2014 2015 Year
Historical data: Latest data available from Energy Information Administration databases supporting the following reports:Quarterly Coal Report , DOE/EIA-0121; and Electric Power Mont
DOE/EIA-0226.
Minor discrepancies with published historical data are due to independent rounding.
Projections: EIA Regional Short-Term Energy Model.
= no data available
a) Waste coal includes waste coal and cloal slurry reprocessed into briquettes.
b) Coal used for electricity generation and (a limited amount of) useful thermal output by electric utilities and independent power producers.
c) The discrepancy reflects an unaccounted-for shipper and receiver reporting difference, assumed to be zero in the forecast period.
d) Primary stocks are held at the mines and distribution points.
Notes: The approximate break between historical and forecast values is shown with historical data printed in bold; estimates and forecasts in italics.
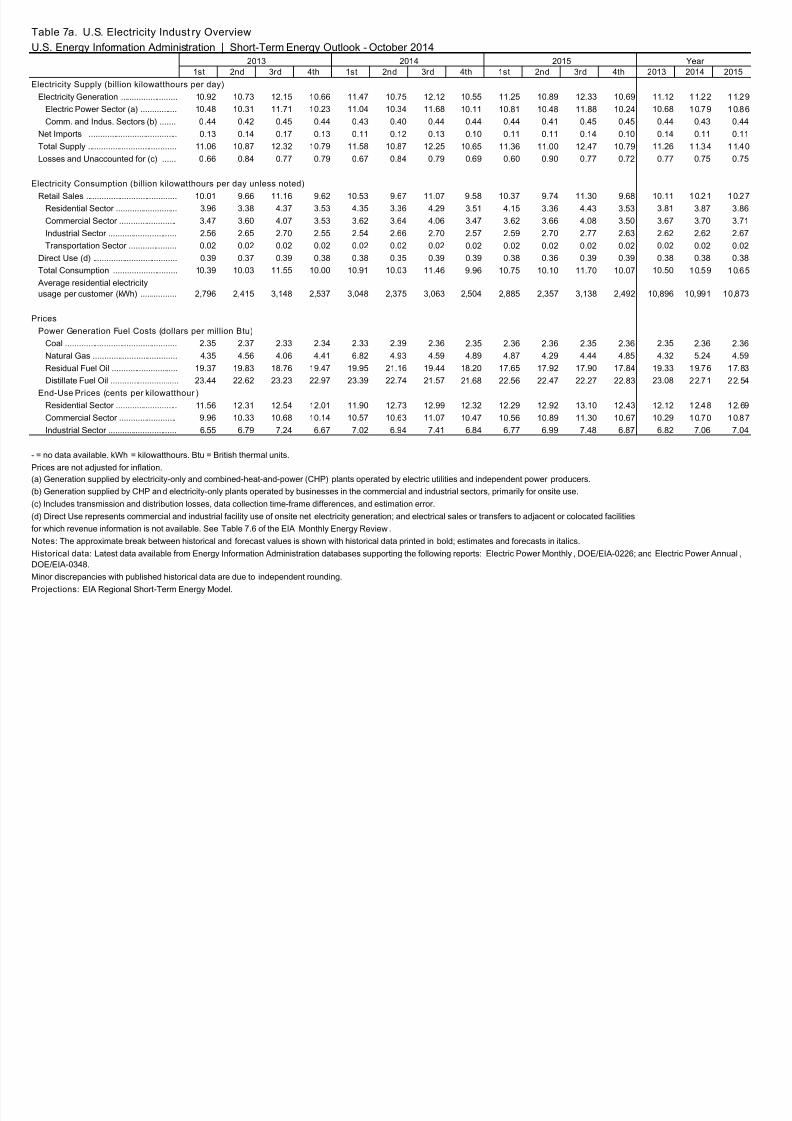
8/10/2019 Short Term Energy Outlook_EIA
http://slidepdf.com/reader/full/short-term-energy-outlookeia 40/48
1st 2nd 3rd 4th 1st 2nd 3rd 4th 1st 2nd 3rd 4th 2013 2014 201
Electricity Generation ......................... 10.92 10.73 12.15 10.66 11.47 10.75 12.12 10.55 11.25 10.89 12.33 10.69 11.12 11.22 11
Electric Power Sector (a) ................ 10.48 10.31 11.71 10.23 11.04 10.34 11.68 10.11 10.81 10.48 11.88 10.24 10.68 10.79 10
Comm. and Indus. Sectors (b) ....... 0.44 0.42 0.45 0.44 0.43 0.40 0.44 0.44 0.44 0.41 0.45 0.45 0.44 0.43 0
Net Imports ....................................... 0.13 0.14 0.17 0.13 0.11 0.12 0.13 0.10 0.11 0.11 0.14 0.10 0.14 0.11 0
Total Supply ....................................... 11.06 10.87 12.32 10.79 11.58 10.87 12.25 10.65 11.36 11.00 12.47 10.79 11.26 11.34 11
Losses and Unaccounted for (c) ...... 0.66 0.84 0.77 0.79 0.67 0.84 0.79 0.69 0.60 0.90 0.77 0.72 0.77 0.75 0
Retail Sales ........................................ 10.01 9.66 11.16 9.62 10.53 9.67 11.07 9.58 10.37 9.74 11.30 9.68 10.11 10.21 10
Residential Sector ........................... 3.96 3.38 4.37 3.53 4.35 3.36 4.29 3.51 4.15 3.36 4.43 3.53 3.81 3.87 3
Commercial Sector ......................... 3.47 3.60 4.07 3.53 3.62 3.64 4.06 3.47 3.62 3.66 4.08 3.50 3.67 3.70 3
Industrial Sector .............................. 2.56 2.65 2.70 2.55 2.54 2.66 2.70 2.57 2.59 2.70 2.77 2.63 2.62 2.62 2
Transportation Sector ..................... 0.02 0.02 0.02 0.02 0.02 0.02 0.02 0.02 0.02 0.02 0.02 0.02 0.02 0.02 0
Direct Use (d) ..................................... 0.39 0.37 0.39 0.38 0.38 0.35 0.39 0.39 0.38 0.36 0.39 0.39 0.38 0.38 0
Total Consumption ............................ 10.39 10.03 11.55 10.00 10.91 10.03 11.46 9.96 10.75 10.10 11.70 10.07 10.50 10.59 10
Average residential electricity
usage per customer (kWh) ................ 2,796 2,415 3,148 2,537 3,048 2,375 3,063 2,504 2,885 2,357 3,138 2,492 10,896 10,991 10,8
Prices
Coal ................................................. 2.35 2.37 2.33 2.34 2.33 2.39 2.36 2.35 2.36 2.36 2.35 2.36 2.35 2.36 2
Natural Gas ..................................... 4.35 4.56 4.06 4.41 6.82 4.93 4.59 4.89 4.87 4.29 4.44 4.85 4.32 5.24 4
Residual Fuel Oil ............................. 19.37 19.83 18.76 19.47 19.95 21.16 19.44 18.20 17.65 17.92 17.90 17.84 19.33 19.76 17
Distillate Fuel Oil .............................. 23.44 22.62 23.23 22.97 23.39 22.74 21.57 21.68 22.56 22.47 22.27 22.83 23.08 22.71 22
Residential Sector ........................... 11.56 12.31 12.54 12.01 11.90 12.73 12.99 12.32 12.29 12.92 13.10 12.43 12.12 12.48 12
Commercial Sector ......................... 9.96 10.33 10.68 10.14 10.57 10.63 11.07 10.47 10.56 10.89 11.30 10.67 10.29 10.70 10
Industrial Sector .............................. 6.55 6.79 7.24 6.67 7.02 6.94 7.41 6.84 6.77 6.99 7.48 6.87 6.82 7.06 7
Prices are not adjusted for inflation.
Table 7a. U.S. Electricity Indust ry Overview
U.S. Energy Information Administration | Short-Term Energy Outlook - October 20142013 2014 2015 Year
Electricity Supply (billion kilowatthours per day)
Electricity Consumption (billion kilowatthours per day unless noted)
Power Generation Fuel Costs (dollars per million Btu)
End-Use Prices (cents per kilowatthour )
= no data available. kWh = kilowatthours. Btu = British thermal units.
Historical data: Latest data available from Energy Information Administration databases supporting the following reports: Electric Power Monthly, DOE/EIA-0226; and Electric Power Annual
DOE/EIA-0348.
Minor discrepancies with published historical data are due to independent rounding.
Projections: EIA Regional Short-Term Energy Model.
a) Generation supplied by electricity-only and combined-heat-and-power (CHP) plants operated by electric utilities and independent power producers.
b) Generation supplied by CHP and electricity-only plants operated by businesses in the commercial and industrial sectors, primarily for onsite use.
c) Includes transmission and distribution losses, data collection time-frame differences, and estimation error.
d) Direct Use represents commercial and industrial facility use of onsite net electricity generation; and electrical sales or transfers to adjacent or colocated facilities
or which revenue information is not available. See Table 7.6 of the EIA Monthly Energy Review.
Notes: The approximate break between historical and forecast values is shown with historical data printed in bold; estimates and forecasts in italics.

8/10/2019 Short Term Energy Outlook_EIA
http://slidepdf.com/reader/full/short-term-energy-outlookeia 41/48
1st 2nd 3rd 4th 1st 2nd 3rd 4th 1st 2nd 3rd 4th 2013 2014 2015
Residential Sector
New England ............... 144 115 146 122 154 111 135 124 147 113 136 124 132 131 130
Middle Atlantic ............. 390 324 416 330 423 315 387 331 398 316 409 333 365 364 364
E. N. Central ................ 562 447 553 495 616 446 513 487 569 438 554 488 514 515 512
W. N. Central ............... 322 247 310 275 352 246 293 268 326 244 314 269 288 290 288
S. Atlantic .................... 962 846 1,075 873 1,081 858 1,095 880 1,042 856 1,131 888 939 978 979
E. S. Central ................ 344 280 366 294 404 278 369 292 374 279 382 291 321 335 331
W. S. Central ............... 529 517 755 517 641 501 741 508 603 518 742 509 580 598 593
Mountain ...................... 253 248 328 227 239 242 325 228 246 241 344 232 264 259 266Pacific contiguous ....... 436 346 412 385 421 347 420 384 426 340 406 380 395 393 388
AK and HI .................... . 14 12 12 13 14 11 12 13 14 12 12 13 13 13 13
Total .................... ...... 3,955 3,384 4,373 3,531 4,345 3,355 4,289 3,514 4,146 3,357 4,430 3,526 3,811 3,875 3,865
Commercial Sector
New England ............... 121 118 135 117 153 138 156 134 151 137 157 134 123 145 145
Middle Atlantic ............. 427 414 474 412 442 413 465 402 440 414 462 402 432 431 429
E. N. Central ................ 492 490 539 489 510 490 524 475 506 496 537 478 503 500 504
W. N. Central ............... 270 266 298 271 284 273 293 264 279 277 297 268 277 278 280
S. Atlantic .................... 781 832 918 799 803 842 924 778 800 842 917 784 833 837 836
E. S. Central ................ 228 243 288 231 239 237 281 223 240 236 286 225 248 245 247
W. S. Central ............... 462 514 610 504 495 522 610 491 496 529 616 496 523 530 535
Mountain ...................... 237 262 287 243 239 257 289 242 243 263 290 244 257 257 260
Pacific contiguous ....... 430 448 500 444 438 447 507 446 443 449 501 447 456 459 460
AK and HI .................... . 17 16 17 17 17 16 17 17 17 16 17 17 17 17 17
Total .................... ...... 3,466 3,604 4,066 3,527 3,620 3,636 4,064 3,472 3,615 3,660 4,081 3,496 3,667 3,699 3,713ndustrial Sector
New England ............... 72 73 78 71 49 49 51 49 49 49 54 49 74 50 50
Middle Atlantic ............. 188 186 193 188 201 198 197 192 198 199 205 198 189 197 200
E. N. Central ................ 533 534 539 513 525 532 534 512 533 541 551 527 530 526 538
W. N. Central ............... 230 239 251 238 234 240 253 246 245 253 269 257 240 243 256
S. Atlantic .................... 367 388 397 373 372 397 390 381 373 401 405 386 381 385 391
E. S. Central ................ 317 312 286 277 279 287 286 279 287 292 290 287 298 283 289
W. S. Central ............... 407 435 448 422 431 465 472 437 440 466 462 443 428 451 453
Mountain ...................... 210 235 246 217 213 239 255 225 223 246 264 230 227 233 241
Pacific contiguous ....... 224 235 251 234 226 240 246 236 226 242 257 241 236 237 241
AK and HI .................... . 13 14 14 14 13 14 14 14 14 14 15 14 14 14 14
Total .................... ...... 2,563 2,650 2,703 2,546 2,543 2,660 2,700 2,570 2,587 2,703 2,771 2,633 2,616 2,619 2,674
Total All Sectors (a)
New England ............... 339 308 360 311 357 300 344 308 349 300 350 308 330 327 327
Middle Atlantic ............. 1,017 935 1,095 940 1,078 936 1,060 936 1,049 941 1,087 946 997 1,002 1,006
E. N. Central ................ 1 ,589 1,473 1,632 1,497 1,654 1,469 1,572 1,475 1,609 1,476 1,644 1,495 1,548 1,542 1,556
W. N. Central ............... 823 752 859 784 870 760 840 777 850 774 881 793 805 811 825
S. Atlantic .................... 2,114 2,070 2,393 2,049 2,260 2,100 2,412 2,043 2,219 2,103 2,457 2,062 2,157 2,204 2,210
E. S. Central ................ 890 836 940 801 922 803 936 794 901 807 958 804 867 864 868
W. S. Central ............... 1,399 1,467 1,813 1,443 1,567 1,488 1,823 1,437 1,540 1,513 1,820 1,448 1,531 1,579 1,581
Mountain ...................... 700 745 862 686 692 739 869 695 713 751 898 707 749 749 767
Pacific contiguous ....... 1,092 1,031 1,165 1,066 1,087 1,037 1,176 1,067 1,097 1,034 1,166 1,071 1,088 1,092 1,092
AK and HI .................... . 43 42 43 44 44 41 43 44 44 42 43 45 43 43 43
Total .................... ...... 10,006 9,658 11,163 9,623 10,531 9,673 11,074 9,577 10,370 9,741 11,304 9,677 10,114 10,213 10,274
Table 7b. U.S. Regional Electri city Retail Sales (Million Ki lowatthours per Day)
U.S. Energy Information Administration | Short-Term Energy Outlook - October 20142013 2014 2015 Year
Historical data: Latest data available from Energy Information Administration databases supporting the following reports: Electric Power Monthly , DOE/EIA-0226; and Electric
Power Annual , DOE/EIA-0348.
Minor discrepancies with published historical data are due to independent rounding.
Projections: EIA Regional Short-Term Energy Model.
= no data available
a) Total retail sales to all sectors includes residential, commercial, industrial, and transportation sector sales.
Notes: The approximate break between historical and forecast values is shown with historical data printed in bold; estimates and forecasts in italics.
Retail Sales represents total retail electricity sales by electric utilities and power marketers.
Regions refer to U.S. Census divisions.
See "Census division" in EIA’s Energy Glossary (http://www.eia.doe.gov/glossary/index.html) for a list of States in each region.
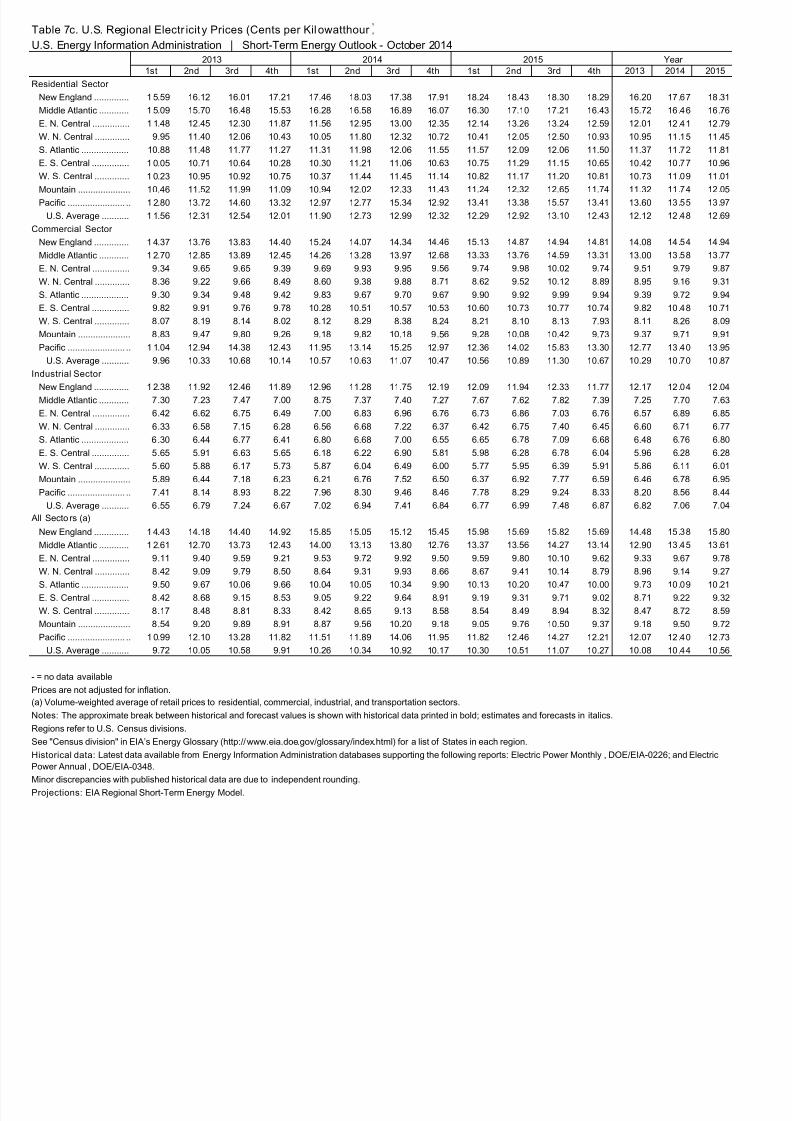
8/10/2019 Short Term Energy Outlook_EIA
http://slidepdf.com/reader/full/short-term-energy-outlookeia 42/48
1st 2nd 3rd 4th 1st 2nd 3rd 4th 1st 2nd 3rd 4th 2013 2014 2015
Residential Sector
New England .............. 1 5.59 16.12 16.01 17.21 17.46 18.03 17.38 17.91 18.24 18.43 18.30 18.29 16.20 17.67 18.31
Middle Atlantic ............ 1 5.09 15.70 16.48 15.53 16.28 16.58 16.89 16.07 16.30 17.10 17.21 16.43 15.72 16.46 16.76
E. N. Central ............... 1 1.48 12.45 12.30 11.87 11.56 12.95 13.00 12.35 12.14 13.26 13.24 12.59 12.01 12.41 12.79
W. N. Central .............. 9.95 11.40 12.06 10.43 10.05 11.80 12.32 10.72 10.41 12.05 12.50 10.93 10.95 11.15 11.45
S. Atlantic ................... 10.88 11.48 11.77 11.27 11.31 11.98 12.06 11.55 11.57 12.09 12.06 11.50 11.37 11.72 11.81
E. S. Central ............... 1 0.05 10.71 10.64 10.28 10.30 11.21 11.06 10.63 10.75 11.29 11.15 10.65 10.42 10.77 10.96
W. S. Central .............. 1 0.23 10.95 10.92 10.75 10.37 11.44 11.45 11.14 10.82 11.17 11.20 10.81 10.73 11.09 11.01
Mountain ..................... 10.46 11.52 11.99 11.09 10.94 12.02 12.33 11.43 11.24 12.32 12.65 11.74 11.32 11.74 12.05
Pacific ....................... .. 1 2.80 13.72 14.60 13.32 12.97 12.77 15.34 12.92 13.41 13.38 15.57 13.41 13.60 13.55 13.97
U.S. Average ........... 1 1.56 12.31 12.54 12.01 11.90 12.73 12.99 12.32 12.29 12.92 13.10 12.43 12.12 12.48 12.69
Commercial Sector
New England .............. 1 4.37 13.76 13.83 14.40 15.24 14.07 14.34 14.46 15.13 14.87 14.94 14.81 14.08 14.54 14.94
Middle Atlantic ............ 1 2.70 12.85 13.89 12.45 14.26 13.28 13.97 12.68 13.33 13.76 14.59 13.31 13.00 13.58 13.77
E. N. Central ............... 9.34 9.65 9.65 9.39 9.69 9.93 9.95 9.56 9.74 9.98 10.02 9.74 9.51 9.79 9.87
W. N. Central .............. 8.36 9.22 9.66 8.49 8.60 9.38 9.88 8.71 8.62 9.52 10.12 8.89 8.95 9.16 9.31
S. Atlantic ................... 9.30 9.34 9.48 9.42 9.83 9.67 9.70 9.67 9.90 9.92 9.99 9.94 9.39 9.72 9.94
E. S. Central ............... 9.82 9.91 9.76 9.78 10.28 10.51 10.57 10.53 10.60 10.73 10.77 10.74 9.82 10.48 10.71
W. S. Central .............. 8.07 8.19 8.14 8.02 8.12 8.29 8.38 8.24 8.21 8.10 8.13 7.93 8.11 8.26 8.09
Mountain ..................... 8.83 9.47 9.80 9.26 9.18 9.82 10.18 9.56 9.28 10.08 10.42 9.73 9.37 9.71 9.91
Pacific ....................... .. 1 1.04 12.94 14.38 12.43 11.95 13.14 15.25 12.97 12.36 14.02 15.83 13.30 12.77 13.40 13.95
U.S. Average ........... 9.96 10.33 10.68 10.14 10.57 10.63 11.07 10.47 10.56 10.89 11.30 10.67 10.29 10.70 10.87
ndustrial Sector
New England .............. 1 2.38 11.92 12.46 11.89 12.96 11.28 11.75 12.19 12.09 11.94 12.33 11.77 12.17 12.04 12.04Middle Atlantic ............ 7.30 7.23 7.47 7.00 8.75 7.37 7.40 7.27 7.67 7.62 7.82 7.39 7.25 7.70 7.63
E. N. Central ............... 6.42 6.62 6.75 6.49 7.00 6.83 6.96 6.76 6.73 6.86 7.03 6.76 6.57 6.89 6.85
W. N. Central .............. 6.33 6.58 7.15 6.28 6.56 6.68 7.22 6.37 6.42 6.75 7.40 6.45 6.60 6.71 6.77
S. Atlantic ................... 6.30 6.44 6.77 6.41 6.80 6.68 7.00 6.55 6.65 6.78 7.09 6.68 6.48 6.76 6.80
E. S. Central ............... 5.65 5.91 6.63 5.65 6.18 6.22 6.90 5.81 5.98 6.28 6.78 6.04 5.96 6.28 6.28
W. S. Central .............. 5.60 5.88 6.17 5.73 5.87 6.04 6.49 6.00 5.77 5.95 6.39 5.91 5.86 6.11 6.01
Mountain ..................... 5.89 6.44 7.18 6.23 6.21 6.76 7.52 6.50 6.37 6.92 7.77 6.59 6.46 6.78 6.95
Pacific ....................... .. 7.41 8.14 8.93 8.22 7.96 8.30 9.46 8.46 7.78 8.29 9.24 8.33 8.20 8.56 8.44
U.S. Average ........... 6.55 6.79 7.24 6.67 7.02 6.94 7.41 6.84 6.77 6.99 7.48 6.87 6.82 7.06 7.04
All Secto rs (a)
New England .............. 1 4.43 14.18 14.40 14.92 15.85 15.05 15.12 15.45 15.98 15.69 15.82 15.69 14.48 15.38 15.80
Middle Atlantic ............ 1 2.61 12.70 13.73 12.43 14.00 13.13 13.80 12.76 13.37 13.56 14.27 13.14 12.90 13.45 13.61
E. N. Central ............... 9.11 9.40 9.59 9.21 9.53 9.72 9.92 9.50 9.59 9.80 10.10 9.62 9.33 9.67 9.78
W. N. Central .............. 8.42 9.09 9.79 8.50 8.64 9.31 9.93 8.66 8.67 9.41 10.14 8.79 8.96 9.14 9.27
S. Atlantic ................... 9.50 9.67 10.06 9.66 10.04 10.05 10.34 9.90 10.13 10.20 10.47 10.00 9.73 10.09 10.21E. S. Central ............... 8.42 8.68 9.15 8.53 9.05 9.22 9.64 8.91 9.19 9.31 9.71 9.02 8.71 9.22 9.32
W. S. Central .............. 8.17 8.48 8.81 8.33 8.42 8.65 9.13 8.58 8.54 8.49 8.94 8.32 8.47 8.72 8.59
Mountain ..................... 8.54 9.20 9.89 8.91 8.87 9.56 10.20 9.18 9.05 9.76 10.50 9.37 9.18 9.50 9.72
Pacific ....................... .. 1 0.99 12.10 13.28 11.82 11.51 11.89 14.06 11.95 11.82 12.46 14.27 12.21 12.07 12.40 12.73
U.S. Average ........... 9.72 10.05 10.58 9.91 10.26 10.34 10.92 10.17 10.30 10.51 11.07 10.27 10.08 10.44 10.56
Table 7c. U.S. Regional Electr icit y Prices (Cents per Kilowatthour
U.S. Energy Information Administration | Short-Term Energy Outlook - October 20142013 2014 2015 Year
Historical data: Latest data available from Energy Information Administration databases supporting the following reports: Electric Power Monthly , DOE/EIA-0226; and Electric
Power Annual , DOE/EIA-0348.
Minor discrepancies with published historical data are due to independent rounding.Projections: EIA Regional Short-Term Energy Model.
= no data available
Prices are not adjusted for inflation.
a) Volume-weighted average of retail prices to residential, commercial, industrial, and transportation sectors.
Notes: The approximate break between historical and forecast values is shown with historical data printed in bold; estimates and forecasts in italics.
Regions refer to U.S. Census divisions.
See "Census division" in EIA’s Energy Glossary (http://www.eia.doe.gov/glossary/index.html) for a list of States in each region.
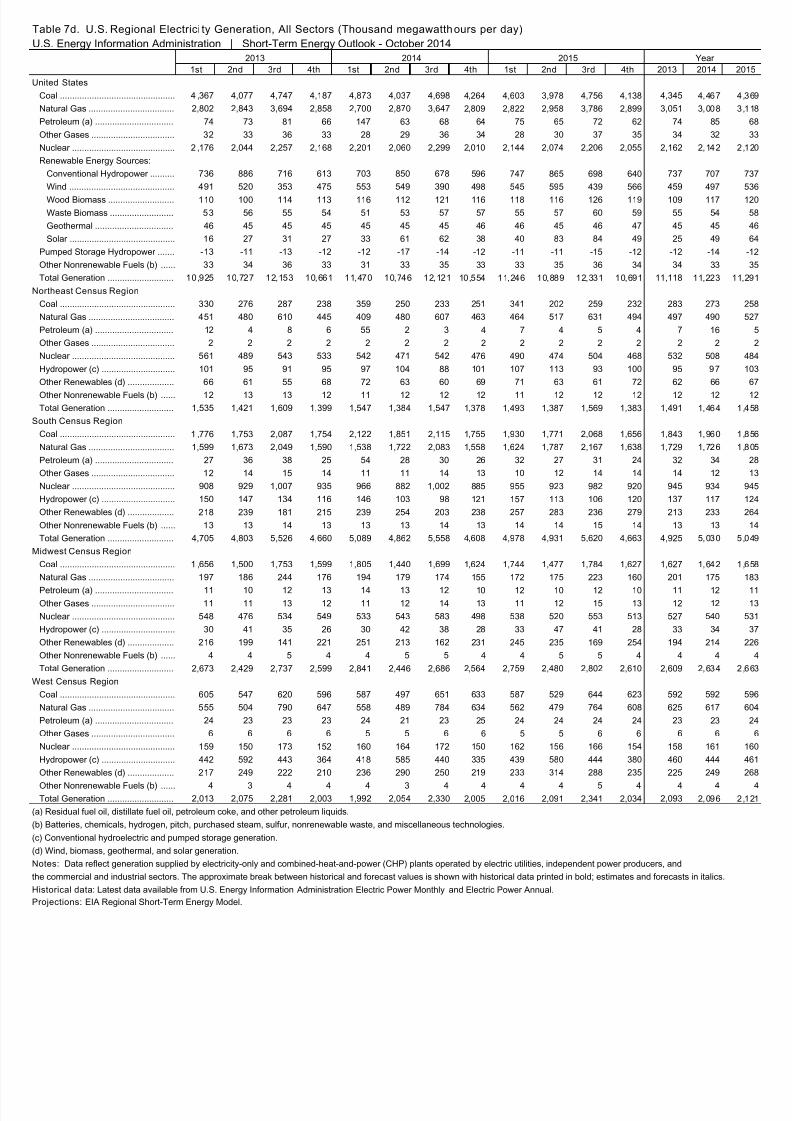
8/10/2019 Short Term Energy Outlook_EIA
http://slidepdf.com/reader/full/short-term-energy-outlookeia 43/48
1st 2nd 3rd 4th 1st 2nd 3rd 4th 1st 2nd 3rd 4th 2013 2014 2
United States
Coal ............................................... 4 ,367 4,077 4,747 4,187 4,873 4,037 4,698 4,264 4,603 3,978 4,756 4,138 4,345 4,467 4
Natural Gas ................................... 2,802 2,843 3,694 2,858 2,700 2,870 3,647 2,809 2,822 2,958 3,786 2,899 3,051 3,008 3
Petroleum (a) ................................ 74 73 81 66 147 63 68 64 75 65 72 62 74 85
Other Gases .................................. 32 33 36 33 28 29 36 34 28 30 37 35 34 32
Nuclear .......................................... 2 ,176 2,044 2,257 2,168 2,201 2,060 2,299 2,010 2,144 2,074 2,206 2,055 2,162 2,142 2
Renewable Energy Sources:
Conventional Hydropower .......... 736 886 716 613 703 850 678 596 747 865 698 640 737 707
Wind ........................................... 491 520 353 475 553 549 390 498 545 595 439 566 459 497
Wood Biomass ........................... 110 100 114 113 116 112 121 116 118 116 126 119 109 117
Waste Biomass .......................... 53 56 55 54 51 53 57 57 55 57 60 59 55 54
Geothermal ................................ 46 45 45 45 45 45 45 46 46 45 46 47 45 45
Solar ........................................... 16 27 31 27 33 61 62 38 40 83 84 49 25 49
Pumped Storage Hydropower ....... -13 -11 -13 -12 -12 -17 -14 -12 -11 -11 -15 -12 -12 -14
Other Nonrenewable Fuels (b) ...... 33 34 36 33 31 33 35 33 33 35 36 34 34 33
Total Generation ........................... 10,925 10,727 12,153 10,661 11,470 10,746 12,121 10,554 11,246 10,889 12,331 10,691 11,118 11,223 1
Northeast Census Region
Coal ............................................... 330 276 287 238 359 250 233 251 341 202 259 232 283 273
Natural Gas ................................... 451 480 610 445 409 480 607 463 464 517 631 494 497 490
Petroleum (a) ................................ 12 4 8 6 55 2 3 4 7 4 5 4 7 16
Other Gases .................................. 2 2 2 2 2 2 2 2 2 2 2 2 2 2
Nuclear .......................................... 561 489 543 533 542 471 542 476 490 474 504 468 532 508
Hydropower (c) .............................. 101 95 91 95 97 104 88 101 107 113 93 100 95 97
Other Renewables (d) ................... 66 61 55 68 72 63 60 69 71 63 61 72 62 66
Other Nonrenewable Fuels (b) ...... 12 13 13 12 11 12 12 12 11 12 12 12 12 12
Total Generation ........................... 1,535 1,421 1,609 1,399 1,547 1,384 1,547 1,378 1,493 1,387 1,569 1,383 1,491 1,464
South Census Region
Coal ............................................... 1 ,776 1,753 2,087 1,754 2,122 1,851 2,115 1,755 1,930 1,771 2,068 1,656 1,843 1,960
Natural Gas ................................... 1,599 1,673 2,049 1,590 1,538 1,722 2,083 1,558 1,624 1,787 2,167 1,638 1,729 1,726
Petroleum (a) ................................ 27 36 38 25 54 28 30 26 32 27 31 24 32 34
Other Gases .................................. 12 14 15 14 11 11 14 13 10 12 14 14 14 12
Nuclear .......................................... 908 929 1,007 935 966 882 1,002 885 955 923 982 920 945 934
Hydropower (c) .............................. 150 147 134 116 146 103 98 121 157 113 106 120 137 117
Other Renewables (d) ................... 218 239 181 215 239 254 203 238 257 283 236 279 213 233
Other Nonrenewable Fuels (b) ...... 13 13 14 13 13 13 14 13 14 14 15 14 13 13
Total Generation ........................... 4,705 4,803 5,526 4,660 5,089 4,862 5,558 4,608 4,978 4,931 5,620 4,663 4,925 5,030 5
Midwest Census Region
Coal ............................................... 1 ,656 1,500 1,753 1,599 1,805 1,440 1,699 1,624 1,744 1,477 1,784 1,627 1,627 1,642
Natural Gas ................................... 197 186 244 176 194 179 174 155 172 175 223 160 201 175
Petroleum (a) ................................ 11 10 12 13 14 13 12 10 12 10 12 10 11 12
Other Gases .................................. 11 11 13 12 11 12 14 13 11 12 15 13 12 12
Nuclear .......................................... 548 476 534 549 533 543 583 498 538 520 553 513 527 540
Hydropower (c) .............................. 30 41 35 26 30 42 38 28 33 47 41 28 33 34
Other Renewables (d) ................... 216 199 141 221 251 213 162 231 245 235 169 254 194 214
Other Nonrenewable Fuels (b) ...... 4 4 5 4 4 5 5 4 4 5 5 4 4 4
Total Generation ........................... 2,673 2,429 2,737 2,599 2,841 2,446 2,686 2,564 2,759 2,480 2,802 2,610 2,609 2,634 2
West Census Region
Coal ............................................... 605 547 620 596 587 497 651 633 587 529 644 623 592 592
Natural Gas ................................... 555 504 790 647 558 489 784 634 562 479 764 608 625 617
Petroleum (a) ................................ 24 23 23 23 24 21 23 25 24 24 24 24 23 23
Other Gases .................................. 6 6 6 6 5 5 6 6 5 5 6 6 6 6
Nuclear .......................................... 159 150 173 152 160 164 172 150 162 156 166 154 158 161
Hydropower (c) .............................. 442 592 443 364 418 585 440 335 439 580 444 380 460 444
Other Renewables (d) ................... 217 249 222 210 236 290 250 219 233 314 288 235 225 249
Other Nonrenewable Fuels (b) ...... 4 3 4 4 4 3 4 4 4 4 5 4 4 4
Total Generation ........................... 2,013 2,075 2,281 2,003 1,992 2,054 2,330 2,005 2,016 2,091 2,341 2,034 2,093 2,096 2
Table 7d. U.S. Regional Electrici ty Generation, All Sectors (Thousand megawatthours per day)
U.S. Energy Information Administration | Short-Term Energy Outlook - October 2014
2013 2014 2015 Year
Historical data: Latest data available from U.S. Energy Information Administration Electric Power Monthly and Electric Power Annual.
Projections: EIA Regional Short-Term Energy Model.
a) Residual fuel oil, distillate fuel oil, petroleum coke, and other petroleum liquids.
b) Batteries, chemicals, hydrogen, pitch, purchased steam, sulfur, nonrenewable waste, and miscellaneous technologies.
c) Conventional hydroelectric and pumped storage generation.
d) Wind, biomass, geothermal, and solar generation.
Notes: Data reflect generation supplied by electricity-only and combined-heat-and-power (CHP) plants operated by electric utilities, independent power producers, and
he commercial and industrial sectors. The approximate break between historical and forecast values is shown with historical data printed in bold; estimates and forecasts in italics.
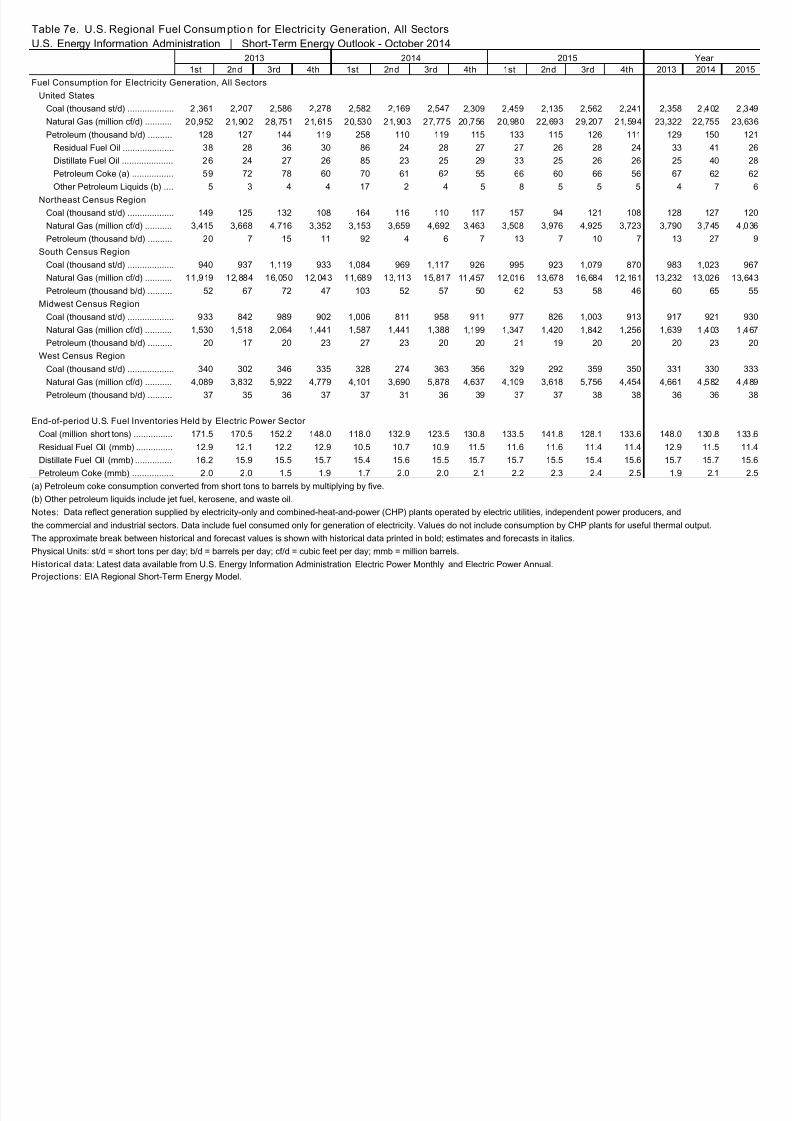
8/10/2019 Short Term Energy Outlook_EIA
http://slidepdf.com/reader/full/short-term-energy-outlookeia 44/48
1st 2nd 3rd 4th 1st 2nd 3rd 4th 1st 2nd 3rd 4th 2013 2014 2
Fuel Consumption for Electricity Generation, All Sectors
United States
Coal (thousand st/d) ................... 2 ,361 2,207 2,586 2,278 2,582 2,169 2,547 2,309 2,459 2,135 2,562 2,241 2,358 2,402 2
Natural Gas (million cf/d) ........... 20,952 21,902 28,751 21,615 20,530 21,903 27,775 20,756 20,980 22,693 29,207 21,594 23,322 22,755 23
Petroleum (thousand b/d) .......... 128 127 144 119 258 110 119 115 133 115 126 111 129 150
Residual Fuel Oil ..................... 38 28 36 30 86 24 28 27 27 26 28 24 33 41
Distillate Fuel Oil ..................... 26 24 27 26 85 23 25 29 33 25 26 26 25 40
Petroleum Coke (a) ................. 59 72 78 60 70 61 62 55 66 60 66 56 67 62
Other Petroleum Liquids (b) .... 5 3 4 4 17 2 4 5 8 5 5 5 4 7
Northeast Census Region
Coal (thousand st/d) ................... 149 125 132 108 164 116 110 117 157 94 121 108 128 127
Natural Gas (million cf/d) ........... 3,415 3,668 4,716 3,352 3,153 3,659 4,692 3,463 3,508 3,976 4,925 3,723 3,790 3,745 4
Petroleum (thousand b/d) .......... 20 7 15 11 92 4 6 7 13 7 10 7 13 27
South Census Region
Coal (thousand st/d) ................... 940 937 1,119 933 1,084 969 1,117 926 995 923 1,079 870 983 1,023
Natural Gas (million cf/d) ........... 11,919 12,884 16,050 12,043 11,689 13,113 15,817 11,457 12,016 13,678 16,684 12,161 13,232 13,026 13
Petroleum (thousand b/d) .......... 52 67 72 47 103 52 57 50 62 53 58 46 60 65
Midwest Census Region
Coal (thousand st/d) ................... 933 842 989 902 1,006 811 958 911 977 826 1,003 913 917 921
Natural Gas (million cf/d) ........... 1,530 1,518 2,064 1,441 1,587 1,441 1,388 1,199 1,347 1,420 1,842 1,256 1,639 1,403 1
Petroleum (thousand b/d) .......... 20 17 20 23 27 23 20 20 21 19 20 20 20 23
West Census Region
Coal (thousand st/d) ................... 340 302 346 335 328 274 363 356 329 292 359 350 331 330
Natural Gas (million cf/d) ........... 4,089 3,832 5,922 4,779 4,101 3,690 5,878 4,637 4,109 3,618 5,756 4,454 4,661 4,582 4
Petroleum (thousand b/d) .......... 37 35 36 37 37 31 36 39 37 37 38 38 36 36
End-of-period U.S. Fuel Inventories Held by Electric Power Sector
Coal (million short tons) ................ 171.5 170.5 152.2 148.0 118.0 132.9 123.5 130.8 133.5 141.8 128.1 133.6 148.0 130.8 1
Residual Fuel Oil (mmb) ............... 12.9 12.1 12.2 12.9 10.5 10.7 10.9 11.5 11.6 11.6 11.4 11.4 12.9 11.5
Distillate Fuel Oil (mmb) ............... 16.2 15.9 15.5 15.7 15.4 15.6 15.5 15.7 15.7 15.5 15.4 15.6 15.7 15.7
Petroleum Coke (mmb) ................. 2.0 2.0 1.5 1.9 1.7 2.0 2.0 2.1 2.2 2.3 2.4 2.5 1.9 2.1
Table 7e. U.S. Regional Fuel Consumption for Electrici ty Generation, All Sectors
U.S. Energy Information Administration | Short-Term Energy Outlook - October 2014
2013 2014 2015 Year
Historical data: Latest data available from U.S. Energy Information Administration Electric Power Monthly and Electric Power Annual.
Projections: EIA Regional Short-Term Energy Model.
a) Petroleum coke consumption converted from short tons to barrels by multiplying by five.
b) Other petroleum liquids include jet fuel, kerosene, and waste oil.
Notes: Data reflect generation supplied by electricity-only and combined-heat-and-power (CHP) plants operated by electric utilities, independent power producers, and
he commercial and industrial sectors. Data include fuel consumed only for generation of electricity. Values do not include consumption by CHP plants for useful thermal output.
The approximate break between historical and forecast values is shown with historical data printed in bold; estimates and forecasts in italics.
Physical Units: st/d = short tons per day; b/d = barrels per day; cf/d = cubic feet per day; mmb = million barrels.
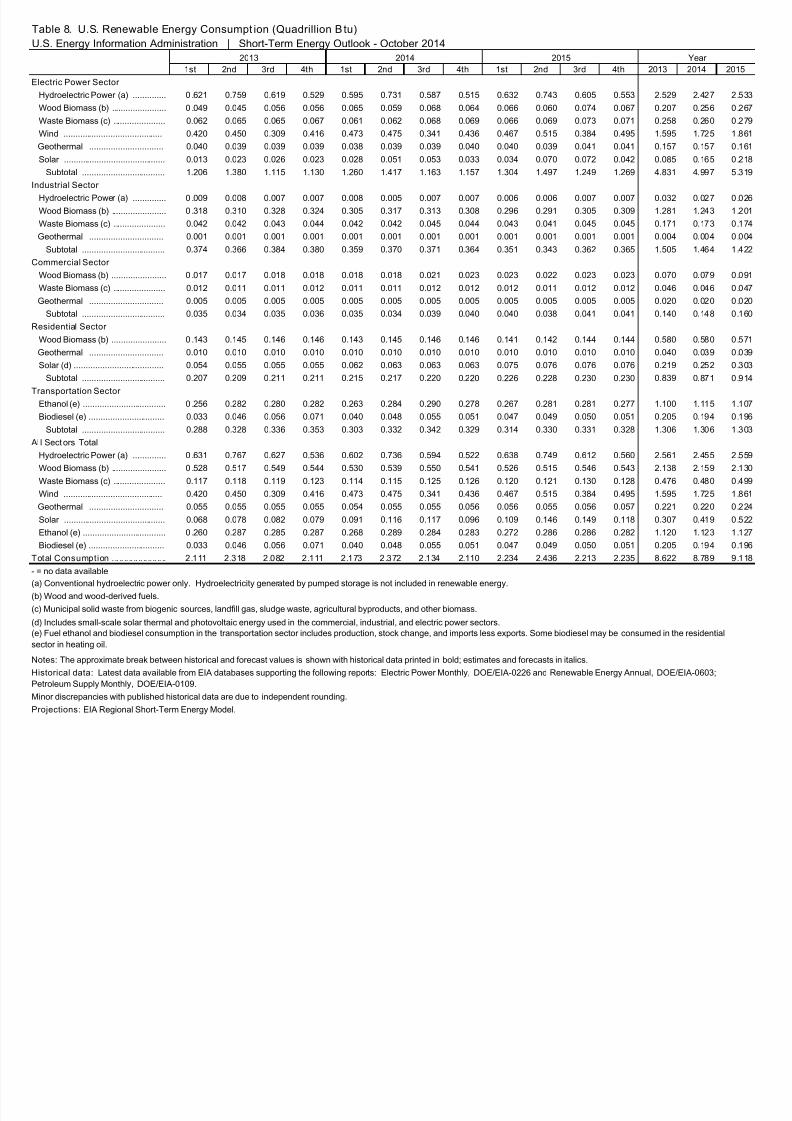
8/10/2019 Short Term Energy Outlook_EIA
http://slidepdf.com/reader/full/short-term-energy-outlookeia 45/48
1st 2nd 3rd 4th 1st 2nd 3rd 4th 1st 2nd 3rd 4th 2013 2014 20
Electric Power Sector
Hydroelectric Power (a) .............. 0 .621 0.759 0.619 0.529 0.595 0.731 0.587 0.515 0.632 0.743 0.605 0.553 2.529 2.427 2
Wood Biomass (b) ....................... 0 .049 0.045 0.056 0.056 0.065 0.059 0.068 0.064 0.066 0.060 0.074 0.067 0.207 0.256 0
Waste Biomass (c) ...................... 0.062 0.065 0.065 0.067 0.061 0.062 0.068 0.069 0.066 0.069 0.073 0.071 0.258 0.260 0
Wind .......................................... 0.420 0.450 0.309 0.416 0.473 0.475 0.341 0.436 0.467 0.515 0.384 0.495 1.595 1.725 1
Geothermal ............................... 0.040 0.039 0.039 0.039 0.038 0.039 0.039 0.040 0.040 0.039 0.041 0.041 0.157 0.157 0
Solar ........................................... 0.013 0.023 0.026 0.023 0.028 0.051 0.053 0.033 0.034 0.070 0.072 0.042 0.085 0.165 0
Subtotal ................................... 1.206 1.380 1.115 1.130 1.260 1.417 1.163 1.157 1.304 1.497 1.249 1.269 4.831 4.997 5
ndustrial Sector
Hydroelectric Power (a) .............. 0 .009 0.008 0.007 0.007 0.008 0.005 0.007 0.007 0.006 0.006 0.007 0.007 0.032 0.027 0
Wood Biomass (b) ....................... 0 .318 0.310 0.328 0.324 0.305 0.317 0.313 0.308 0.296 0.291 0.305 0.309 1.281 1.243 1
Waste Biomass (c) ...................... 0.042 0.042 0.043 0.044 0.042 0.042 0.045 0.044 0.043 0.041 0.045 0.045 0.171 0.173 0
Geothermal ............................... 0.001 0.001 0.001 0.001 0.001 0.001 0.001 0.001 0.001 0.001 0.001 0.001 0.004 0.004 0
Subtotal ................................... 0.374 0.366 0.384 0.380 0.359 0.370 0.371 0.364 0.351 0.343 0.362 0.365 1.505 1.464 1
Commercial Sector
Wood Biomass (b) ....................... 0 .017 0.017 0.018 0.018 0.018 0.018 0.021 0.023 0.023 0.022 0.023 0.023 0.070 0.079 0
Waste Biomass (c) ...................... 0.012 0.011 0.011 0.012 0.011 0.011 0.012 0.012 0.012 0.011 0.012 0.012 0.046 0.046 0
Geothermal ............................... 0.005 0.005 0.005 0.005 0.005 0.005 0.005 0.005 0.005 0.005 0.005 0.005 0.020 0.020 0
Subtotal ................................... 0.035 0.034 0.035 0.036 0.035 0.034 0.039 0.040 0.040 0.038 0.041 0.041 0.140 0.148 0
Residential Sector
Wood Biomass (b) ....................... 0 .143 0.145 0.146 0.146 0.143 0.145 0.146 0.146 0.141 0.142 0.144 0.144 0.580 0.580 0
Geothermal ............................... 0.010 0.010 0.010 0.010 0.010 0.010 0.010 0.010 0.010 0.010 0.010 0.010 0.040 0.039 0
Solar (d) ...................................... 0.054 0.055 0.055 0.055 0.062 0.063 0.063 0.063 0.075 0.076 0.076 0.076 0.219 0.252 0
Subtotal ................................... 0.207 0.209 0.211 0.211 0.215 0.217 0.220 0.220 0.226 0.228 0.230 0.230 0.839 0.871 0
Transportation Sector
Ethanol (e) ................................... 0 .256 0.282 0.280 0.282 0.263 0.284 0.290 0.278 0.267 0.281 0.281 0.277 1.100 1.115 1
Biodiesel (e) ................................ 0.033 0.046 0.056 0.071 0.040 0.048 0.055 0.051 0.047 0.049 0.050 0.051 0.205 0.194 0
Subtotal ................................... 0.288 0.328 0.336 0.353 0.303 0.332 0.342 0.329 0.314 0.330 0.331 0.328 1.306 1.306 1
Al l Sect ors Total
Hydroelectric Power (a) .............. 0 .631 0.767 0.627 0.536 0.602 0.736 0.594 0.522 0.638 0.749 0.612 0.560 2.561 2.455 2
Wood Biomass (b) ....................... 0 .528 0.517 0.549 0.544 0.530 0.539 0.550 0.541 0.526 0.515 0.546 0.543 2.138 2.159 2
Waste Biomass (c) ...................... 0.117 0.118 0.119 0.123 0.114 0.115 0.125 0.126 0.120 0.121 0.130 0.128 0.476 0.480 0
Wind .......................................... 0.420 0.450 0.309 0.416 0.473 0.475 0.341 0.436 0.467 0.515 0.384 0.495 1.595 1.725 1
Geothermal ............................... 0.055 0.055 0.055 0.055 0.054 0.055 0.055 0.056 0.056 0.055 0.056 0.057 0.221 0.220 0
Solar ........................................... 0.068 0.078 0.082 0.079 0.091 0.116 0.117 0.096 0.109 0.146 0.149 0.118 0.307 0.419 0
Ethanol (e) ................................... 0 .260 0.287 0.285 0.287 0.268 0.289 0.284 0.283 0.272 0.286 0.286 0.282 1.120 1.123 1
Biodiesel (e) ................................ 0.033 0.046 0.056 0.071 0.040 0.048 0.055 0.051 0.047 0.049 0.050 0.051 0.205 0.194 0
Total Consumption ....................... 2.111 2.318 2.082 2.111 2.173 2.372 2.134 2.110 2.234 2.436 2.213 2.235 8.622 8.789 9
Table 8. U.S. Renewable Energy Consumpt ion (Quadrillion B tu)
U.S. Energy Information Administration | Short-Term Energy Outlook - October 2014
2013 2014 2015 Year
Notes: The approximate break between historical and forecast values is shown with historical data printed in bold; estimates and forecasts in italics.
Historical data: Latest data available from EIA databases supporting the following reports: Electric Power Monthly, DOE/EIA-0226 and Renewable Energy Annual, DOE/EIA-0603;
Petroleum Supply Monthly, DOE/EIA-0109.
Minor discrepancies with published historical data are due to independent rounding.
Projections: EIA Regional Short-Term Energy Model.
= no data available
a) Conventional hydroelectric power only. Hydroelectricity generated by pumped storage is not included in renewable energy.b) Wood and wood-derived fuels.
c) Municipal solid waste from biogenic sources, landfill gas, sludge waste, agricultural byproducts, and other biomass.
d) Includes small-scale solar thermal and photovoltaic energy used in the commercial, industrial, and electric power sectors.e) Fuel ethanol and biodiesel consumption in the transportation sector includes production, stock change, and imports less exports. Some biodiesel may be consumed in the residential
ector in heating oil.
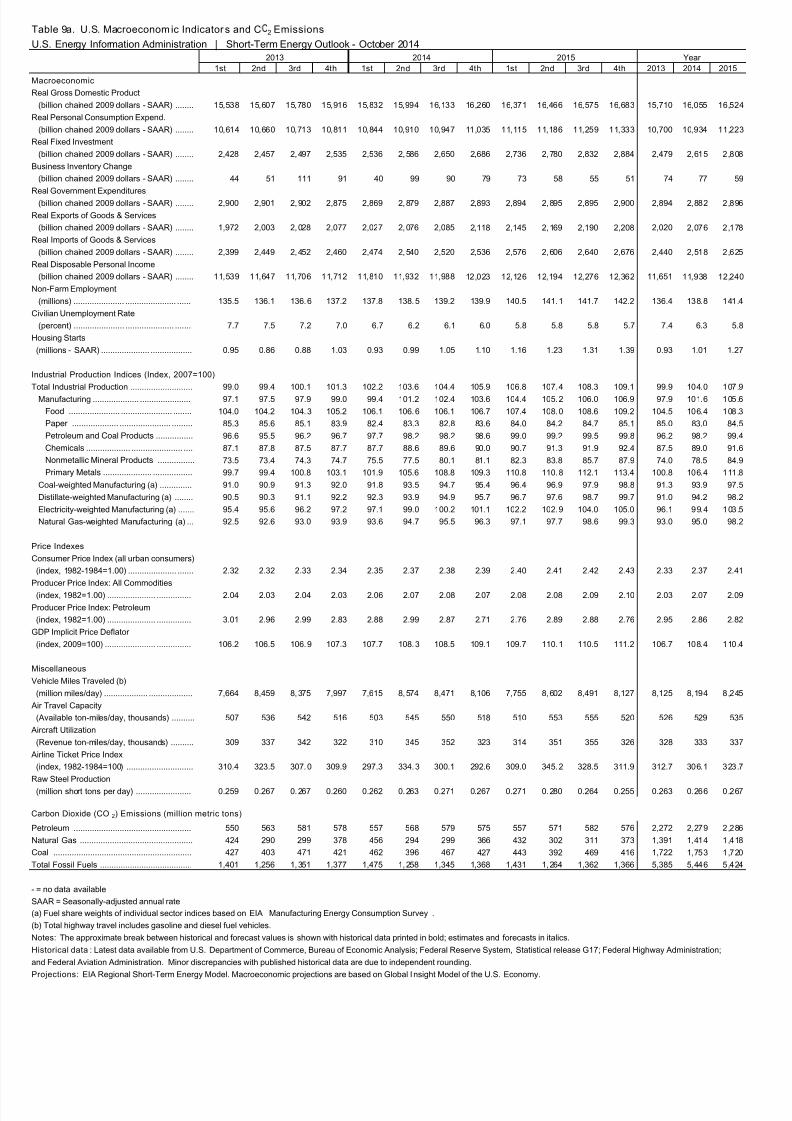
8/10/2019 Short Term Energy Outlook_EIA
http://slidepdf.com/reader/full/short-term-energy-outlookeia 46/48
1st 2nd 3rd 4th 1st 2nd 3rd 4th 1st 2nd 3rd 4th 2013 2014 2015
Macroeconomic
Real Gross Domestic Product
(billion chained 2009 dollars - SAAR) ........ 15,538 15,607 15,780 15,916 15,832 15,994 16,133 16,260 16,371 16,466 16,575 16,683 15,710 16,055 16,52
Real Personal Consumption Expend.
(billion chained 2009 dollars - SAAR) ........ 10,614 10,660 10,713 10,811 10,844 10,910 10,947 11,035 11,115 11,186 11,259 11,333 10,700 10,934 11,22
Real Fixed Investment
(billion chained 2009 dollars - SAAR) ........ 2,428 2,457 2,497 2,535 2,536 2,586 2,650 2,686 2,736 2,780 2,832 2,884 2,479 2,615 2,80
Business Inventory Change
(billion chained 2009 dollars - SAAR) ........ 44 51 111 91 40 99 90 79 73 58 55 51 74 77 5
Real Government Expenditures(billion chained 2009 dollars - SAAR) ........ 2,900 2,901 2,902 2,875 2,869 2,879 2,887 2,893 2,894 2,895 2,895 2,900 2,894 2,882 2,89
Real Exports of Goods & Services
(billion chained 2009 dollars - SAAR) ........ 1,972 2,003 2,028 2,077 2,027 2,076 2,085 2,118 2,145 2,169 2,190 2,208 2,020 2,076 2,17
Real Imports of Goods & Services
(billion chained 2009 dollars - SAAR) ........ 2,399 2,449 2,452 2,460 2,474 2,540 2,520 2,536 2,576 2,606 2,640 2,676 2,440 2,518 2,62
Real Disposable Personal Income
(billion chained 2009 dollars - SAAR) ........ 11,539 11,647 11,706 11,712 11,810 11,932 11,988 12,023 12,126 12,194 12,276 12,362 11,651 11,938 12,24
Non-Farm Employment
(millions) ...................... ...................... ...... 135.5 136.1 136.6 137.2 137.8 138.5 139.2 139.9 140.5 141.1 141.7 142.2 136.4 138.8 141
Civilian Unemployment Rate
(percent) ...................... ..................... ....... 7.7 7.5 7.2 7.0 6.7 6.2 6.1 6.0 5.8 5.8 5.8 5.7 7.4 6.3 5.
Housing Starts
(millions - SAAR) ..................... .................. 0.95 0.86 0.88 1.03 0.93 0.99 1.05 1.10 1.16 1.23 1.31 1.39 0.93 1.01 1.2
ndustrial Production Indices (Index, 2007=100)
Total Industrial Production ........................... 99.0 99.4 100.1 101.3 102.2 103.6 104.4 105.9 106.8 107.4 108.3 109.1 99.9 104.0 107Manufacturing .................... ...................... 97.1 97.5 97.9 99.0 99.4 101.2 102.4 103.6 104.4 105.2 106.0 106.9 97.9 101.6 105
Food ...................... ...................... ........ 104.0 104.2 104.3 105.2 106.1 106.6 106.1 106.7 107.4 108.0 108.6 109.2 104.5 106.4 108
Paper .................... ...................... ......... 85.3 85.6 85.1 83.9 82.4 83.3 82.8 83.6 84.0 84.2 84.7 85.1 85.0 83.0 84.
Petroleum and Coal Products ................ 96.6 95.5 96.2 96.7 97.7 98.2 98.2 98.6 99.0 99.2 99.5 99.8 96.2 98.2 99.
Chemicals ................... ...................... .... 87.1 87.8 87.5 87.7 87.7 88.6 89.6 90.0 90.7 91.3 91.9 92.4 87.5 89.0 91.
Nonmetallic Mineral Products ................ 73.5 73.4 74.3 74.7 75.5 77.5 80.1 81.1 82.3 83.8 85.7 87.9 74.0 78.5 84.
Primary Metals ..................... ................. 99.7 99.4 100.8 103.1 101.9 105.6 108.8 109.3 110.8 110.8 112.1 113.4 100.8 106.4 111
Coal-weighted Manufacturing (a) .............. 91.0 90.9 91.3 92.0 91.8 93.5 94.7 95.4 96.4 96.9 97.9 98.8 91.3 93.9 97.
Distillate-weighted Manufacturing (a) ........ 90.5 90.3 91.1 92.2 92.3 93.9 94.9 95.7 96.7 97.6 98.7 99.7 91.0 94.2 98.
Electricity-weighted Manufacturing (a) ....... 95.4 95.6 96.2 97.2 97.1 99.0 100.2 101.1 102.2 102.9 104.0 105.0 96.1 99.4 103
Natural Gas-weighted Manufacturing (a) ... 92.5 92.6 93.0 93.9 93.6 94.7 95.5 96.3 97.1 97.7 98.6 99.3 93.0 95.0 98.
Price Indexes
Consumer Price Index (all urban consumers)
(index, 1982-1984=1.00) ..................... ....... 2.32 2.32 2.33 2.34 2.35 2.37 2.38 2.39 2.40 2.41 2.42 2.43 2.33 2.37 2.4
Producer Price Index: All Commodities(index, 1982=1.00) ..................... ............... 2.04 2.03 2.04 2.03 2.06 2.07 2.08 2.07 2.08 2.08 2.09 2.10 2.03 2.07 2.0
Producer Price Index: Petroleum
(index, 1982=1.00) ..................... ............... 3.01 2.96 2.99 2.83 2.88 2.99 2.87 2.71 2.76 2.89 2.88 2.76 2.95 2.86 2.8
GDP Implicit Price Deflator
(index, 2009=100) ...................... ............... 106.2 106.5 106.9 107.3 107.7 108.3 108.5 109.1 109.7 110.1 110.5 111.2 106.7 108.4 110
Miscellaneous
Vehicle Miles Traveled (b)
(million miles/day) ................... ................... 7,664 8,459 8,375 7,997 7,615 8,574 8,471 8,106 7,755 8,602 8,491 8,127 8,125 8,194 8,24
Air Travel Capacity
(Available ton-miles/day, thousands) .......... 507 536 542 516 503 545 550 518 510 553 555 520 526 529 53
Aircraft Utilization
(Revenue ton-miles/day, thousands) .......... 309 337 342 322 310 345 352 323 314 351 355 326 328 333 33
Airline Ticket Price Index
(index, 1982-1984=100) ............................. 310.4 323.5 307.0 309.9 297.3 334.3 300.1 292.6 309.0 345.2 328.5 311.9 312.7 306.1 323
Raw Steel Production(million short tons per day) ........................ 0.259 0.267 0.267 0.260 0.262 0.263 0.271 0.267 0.271 0.280 0.264 0.255 0.263 0.266 0.26
Carbon Dioxide (CO 2) Emissions (million metric tons)
Petroleum ................................................... 550 563 581 578 557 568 579 575 557 571 582 576 2,272 2,279 2,28
Natural Gas ................................................. 424 290 299 378 456 294 299 366 432 302 311 373 1,391 1,414 1,41
Coal ............................................................ 427 403 471 421 462 396 467 427 443 392 469 416 1,722 1,753 1,72
Total Fossil Fuels ........................................ 1,401 1,256 1,351 1,377 1,475 1,258 1,345 1,368 1,431 1,264 1,362 1,366 5,385 5,446 5,42
SAAR = Seasonally-adjusted annual rate
Table 9a. U.S. Macroeconom ic Indicator s and C 2 Emissions
U.S. Energy Information Administration | Short-Term Energy Outlook - October 2014
2013 2014 2015 Year
Projections: EIA Regional Short-Term Energy Model. Macroeconomic projections are based on Global Insight Model of the U.S. Economy.
= no data available
a) Fuel share weights of individual sector indices based on EIA Manufacturing Energy Consumption Survey .
b) Total highway travel includes gasoline and diesel fuel vehicles.
Notes: The approximate break between historical and forecast values is shown with historical data printed in bold; estimates and forecasts in italics.
Historical data : Latest data available from U.S. Department of Commerce, Bureau of Economic Analysis; Federal Reserve System, Statistical release G17; Federal Highway Administration;
nd Federal Aviation Administration. Minor discrepancies with published historical data are due to independent rounding.
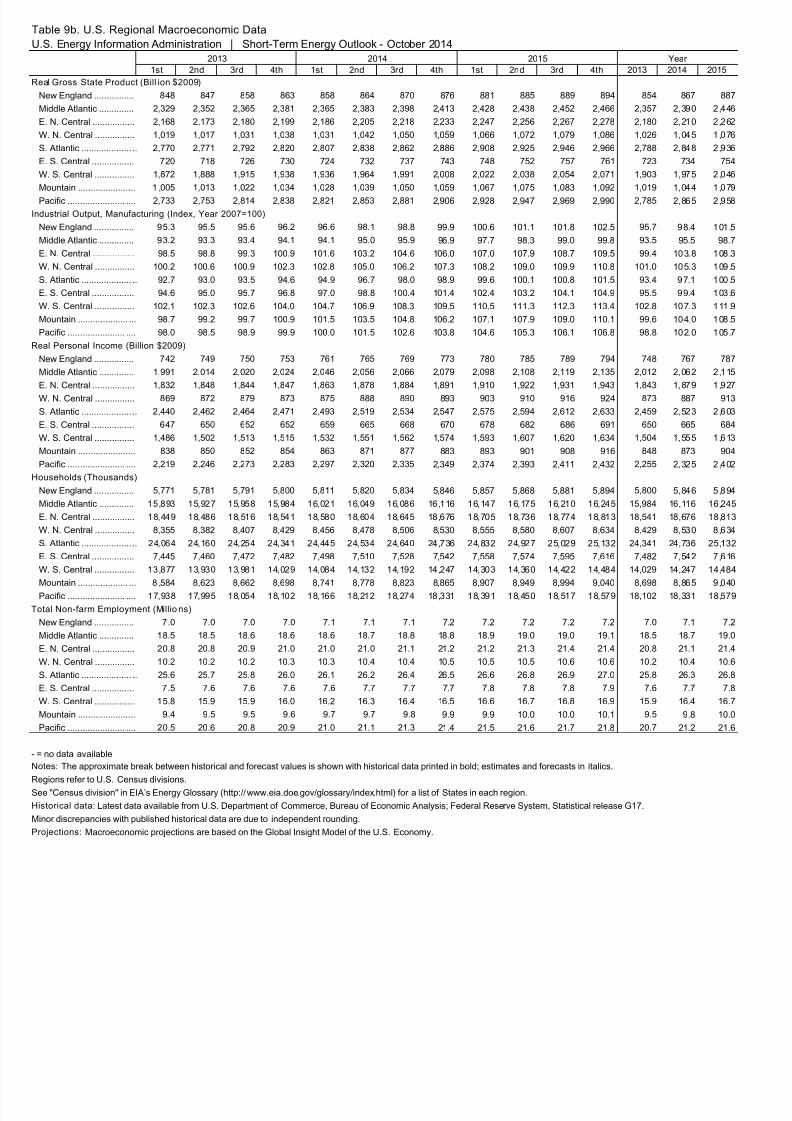
8/10/2019 Short Term Energy Outlook_EIA
http://slidepdf.com/reader/full/short-term-energy-outlookeia 47/48
1st 2nd 3rd 4th 1st 2nd 3rd 4th 1st 2nd 3rd 4th 2013 2014 2015
Real Gross State Product (Bill ion $2009)
New England ................ 848 847 858 863 858 864 870 876 881 885 889 894 854 867 887
Middle Atlantic .............. 2,329 2,352 2,365 2,381 2,365 2,383 2,398 2,413 2,428 2,438 2,452 2,466 2,357 2, 39 0 2 ,4 46
E. N. Central ................. 2,168 2,173 2,180 2,199 2,186 2,205 2,218 2,233 2,247 2,256 2,267 2,278 2,180 2, 21 0 2 ,2 62
W. N. Central ................ 1,019 1,017 1,031 1,038 1,031 1,042 1,050 1,059 1,066 1,072 1,079 1,086 1,026 1, 04 5 1 ,0 76
S. Atlantic .................... .. 2,770 2,771 2,792 2,820 2,807 2,838 2,862 2,886 2,908 2,925 2,946 2,966 2,788 2, 84 8 2 ,9 36
E. S. Central ................. 720 718 726 730 724 732 737 743 748 752 757 761 723 734 754
W. S. Central ................ 1,872 1,888 1,915 1,938 1,936 1,964 1,991 2,008 2,022 2,038 2,054 2,071 1,903 1, 97 5 2 ,0 46
Mountain ....................... 1 ,005 1,013 1,022 1,034 1,028 1,039 1,050 1,059 1,067 1,075 1,083 1,092 1,019 1, 04 4 1 ,0 79
Pacific ....................... .... 2,733 2,753 2,814 2,838 2,821 2,853 2,881 2,906 2,928 2,947 2,969 2,990 2,785 2, 86 5 2 ,9 58
ndustrial Output, Manufacturing (Index, Year 2007=100)
New England ................ 95.3 95.5 95.6 96.2 96.6 98.1 98.8 99.9 100.6 101.1 101.8 102.5 95.7 9 8.4 1 01 .5
Middle Atlantic .............. 93.2 93.3 93.4 94.1 94.1 95.0 95.9 96.9 97.7 98.3 99.0 99.8 93.5 95.5 98.7
E. N. Central ................. 98.5 98.8 99.3 100.9 101.6 103.2 104.6 106.0 107.0 107.9 108.7 109.5 99.4 10 3. 8 1 08 .3
W. N. Central ................ 100.2 100.6 100.9 102.3 102.8 105.0 106.2 107.3 108.2 109.0 109.9 110.8 101.0 10 5. 3 1 09 .5
S. Atlantic .................... .. 92.7 93.0 93.5 94.6 94.9 96.7 98.0 98.9 99.6 100.1 100.8 101.5 93.4 9 7.1 1 00 .5
E. S. Central ................. 94.6 95.0 95.7 96.8 97.0 98.8 100.4 101.4 102.4 103.2 104.1 104.9 95.5 9 9.4 1 03 .6
W. S. Central ................ 102.1 102.3 102.6 104.0 104.7 106.9 108.3 109.5 110.5 111.3 112.3 113.4 102.8 10 7. 3 1 11 .9
Mountain .................... ... 98.7 99.2 99.7 100.9 101.5 103.5 104.8 106.2 107.1 107.9 109.0 110.1 99.6 10 4. 0 1 08 .5
Pacific ....................... .... 98.0 98.5 98.9 99.9 100.0 101.5 102.6 103.8 104.6 105.3 106.1 106.8 98.8 10 2. 0 1 05 .7
Real Personal Income (Billion $2009)
New England ................ 742 749 750 753 761 765 769 773 780 785 789 794 748 767 787
Middle Atlantic .............. 1,991 2,014 2,020 2,024 2,046 2,056 2,066 2,079 2,098 2,108 2,119 2,135 2,012 2, 06 2 2 ,1 15
E. N. Central ................. 1,832 1,848 1,844 1,847 1,863 1,878 1,884 1,891 1,910 1,922 1,931 1,943
1,843 1, 87 9 1 ,9 27
W. N. Central ................ 869 872 879 873 875 888 890 893 903 910 916 924 873 887 913
S. Atlantic .................... .. 2,440 2,462 2,464 2,471 2,493 2,519 2,534 2,547 2,575 2,594 2,612 2,633 2,459 2, 52 3 2 ,6 03
E. S. Central ................. 647 650 652 652 659 665 668 670 678 682 686 691 650 665 684
W. S. Central ................ 1,486 1,502 1,513 1,515 1,532 1,551 1,562 1,574 1,593 1,607 1,620 1,634 1,504 1, 55 5 1 ,6 13
Mountain ....................... 838 850 852 854 863 871 877 883 893 901 908 916 848 873 904
Pacific ....................... .... 2,219 2,246 2,273 2,283 2,297 2,320 2,335 2,349 2,374 2,393 2,411 2,432 2,255 2, 32 5 2 ,4 02
Households (Thousands)
New England ................ 5,771 5,781 5,791 5,800 5,811 5,820 5,834 5,846 5,857 5,868 5,881 5,894 5,800 5, 84 6 5 ,8 94
Middle Atlantic .............. 15,893 15,927 15,958 15,984 16,021 16,049 16,086 16,116 16, 147 16, 175 16, 210 16, 245 15,984 16,116 16,245
E. N. Central ................. 18,449 18,486 18,516 18,541 18,580 18,604 18,645 18,676 18, 705 18, 736 18, 774 18, 813 18,541 18,676 18,813
W. N. Central ................ 8,355 8,382 8,407 8,429 8,456 8,478 8,506 8,530 8,555 8,580 8,607 8,634 8,429 8, 53 0 8 ,6 34
S. Atlantic .................... .. 24,064 24,160 24,254 24,341 24,445 24,534 24,640 24,736 24, 832 24, 927 25, 029 25, 132 24,341 24,736 25,132
E. S. Central ................. 7,445 7,460 7,472 7,482 7,498 7,510 7,528 7,542 7,558 7,574 7,595 7,616 7,482 7, 54 2 7 ,6 16
W. S. Central ................ 13,877 13,930 13,981 14,029 14,084 14,132 14,192 14,247 14, 303 14, 360 14, 422 14, 484 14,029 14,247 14,484
Mountain .................... ... 8 ,584 8,623 8,662 8,698 8,741 8,778 8,823 8,865 8,907 8,949 8,994 9,040 8,698 8, 86 5 9 ,0 40Pacific ....................... .... 17,938 17,995 18,054 18,102 18,166 18,212 18,274 18,331 18, 391 18, 450 18, 517 18, 579 18,102 18,331 18,579
Total Non-farm Employment (Millio ns)
New England ................ 7.0 7.0 7.0 7.0 7.1 7.1 7.1 7.2 7.2 7.2 7.2 7.2 7.0 7.1 7.2
Middle Atlantic .............. 18.5 18.5 18.6 18.6 18.6 18.7 18.8 18.8 18.9 19.0 19.0 19.1 18.5 18.7 19.0
E. N. Central ................. 20.8 20.8 20.9 21.0 21.0 21.0 21.1 21.2 21.2 21.3 21.4 21.4 20.8 21.1 21.4
W. N. Central ................ 10.2 10.2 10.2 10.3 10.3 10.4 10.4 10.5 10.5 10.5 10.6 10.6 10.2 10.4 10.6
S. Atlantic .................... .. 25.6 25.7 25.8 26.0 26.1 26.2 26.4 26.5 26.6 26.8 26.9 27.0 25.8 26.3 26.8
E. S. Central ................. 7.5 7.6 7.6 7.6 7.6 7.7 7.7 7.7 7.8 7.8 7.8 7.9 7.6 7.7 7.8
W. S. Central ................ 15.8 15.9 15.9 16.0 16.2 16.3 16.4 16.5 16.6 16.7 16.8 16.9 15.9 16.4 16.7
Mountain ....................... 9.4 9.5 9.5 9.6 9.7 9.7 9.8 9.9 9.9 10.0 10.0 10.1 9.5 9.8 10.0
Pacific ....................... .... 20.5 20.6 20.8 20.9 21.0 21.1 21.3 21.4 21.5 21.6 21.7 21.8 20.7 21.2 21.6
Table 9b. U.S. Regional Macroeconomic Data
U.S. Energy Information Administration | Short-Term Energy Outlook - October 20142013 2014 2015 Year
Projections: Macroeconomic projections are based on the Global Insight Model of the U.S. Economy.
= no data available
Notes: The approximate break between historical and forecast values is shown with historical data printed in bold; estimates and forecasts in italics.
Regions refer to U.S. Census divisions.See "Census division" in EIA’s Energy Glossary (http://www.eia.doe.gov/glossary/index.html) for a list of States in each region.
Historical data: Latest data available from U.S. Department of Commerce, Bureau of Economic Analysis; Federal Reserve System, Statistical release G17.
Minor discrepancies with published historical data are due to independent rounding.
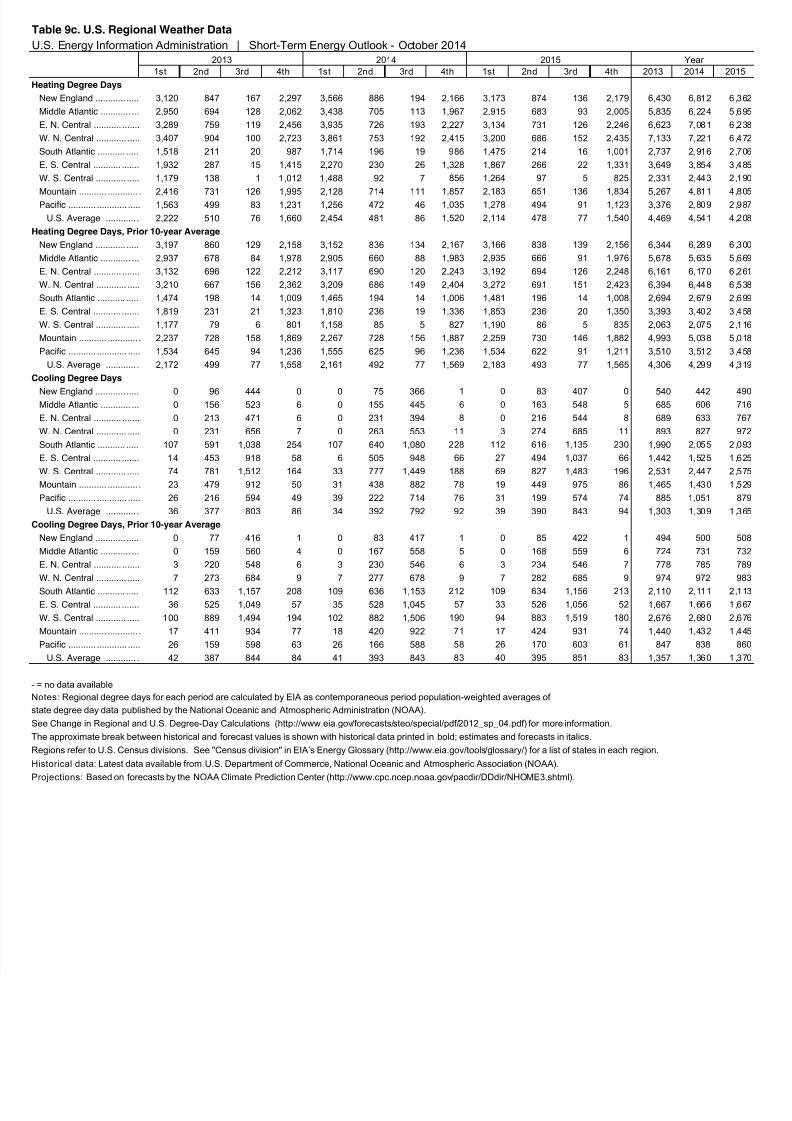
8/10/2019 Short Term Energy Outlook_EIA
http://slidepdf.com/reader/full/short-term-energy-outlookeia 48/48
1st 2nd 3rd 4th 1st 2nd 3rd 4th 1st 2nd 3rd 4th 2013 2014 201
Heating Degree Days
New England ............ ..... 3,120 847 167 2,297 3,566 886 194 2,166 3,173 874 136 2,179 6,430 6,812 6,
Middle Atlantic ............ ... 2,950 694 128 2,062 3,438 705 113 1,967 2,915 683 93 2,005 5,835 6,224 5,
E. N. Central ........... ....... 3,289 759 119 2,456 3,935 726 193 2,227 3,134 731 126 2,246 6,623 7,081 6,2
W. N. Central ............ ..... 3,407 904 100 2,723 3,861 753 192 2,415 3,200 686 152 2,435 7,133 7,221 6,4
South Atlantic ........... ..... 1,518 211 20 987 1,714 196 19 986 1,475 214 16 1,001 2,737 2,916 2,
E. S. Central ........... ....... 1,932 287 15 1,415 2,270 230 26 1,328 1,867 266 22 1,331 3,649 3,854 3,4
W. S. Central ............ ..... 1,179 138 1 1,012 1,488 92 7 856 1,264 97 5 825 2,331 2,443 2,
Mountain ........... ............ . 2,416 731 126 1,995 2,128 714 111 1,857 2,183 651 136 1,834 5,267 4,811 4,Pacific ........... ............ ..... 1,563 499 83 1,231 1,256 472 46 1,035 1,278 494 91 1,123 3,376 2,809 2,
U.S. Average ............ . 2,222 510 76 1,660 2,454 481 86 1,520 2,114 478 77 1,540 4,469 4,541 4,2
Heating Degree Days, Prior 10-year Average
New England ............ ..... 3,197 860 129 2,158 3,152 836 134 2,167 3,166 838 139 2,156 6,344 6,289 6,
Middle Atlantic ............ ... 2,937 678 84 1,978 2,905 660 88 1,983 2,935 666 91 1,976 5,678 5,635 5,
E. N. Central ........... ....... 3,132 696 122 2,212 3,117 690 120 2,243 3,192 694 126 2,248 6,161 6,170 6,2
W. N. Central ............ ..... 3,210 667 156 2,362 3,209 686 149 2,404 3,272 691 151 2,423 6,394 6,448 6,
South Atlantic ........... ..... 1,474 198 14 1,009 1,465 194 14 1,006 1,481 196 14 1,008 2,694 2,679 2,
E. S. Central ........... ....... 1,819 231 21 1,323 1,810 236 19 1,336 1,853 236 20 1,350 3,393 3,402 3,4
W. S. Central ............ ..... 1,177 79 6 801 1,158 85 5 827 1,190 86 5 835 2,063 2,075 2,
Mountain ........... ............ . 2,237 728 158 1,869 2,267 728 156 1,887 2,259 730 146 1,882 4,993 5,038 5,
Pacific ........... ............ ..... 1,534 645 94 1,236 1,555 625 96 1,236 1,534 622 91 1,211 3,510 3,512 3,4
U.S. Average ............ . 2,172 499 77 1,558 2,161 492 77 1,569 2,183 493 77 1,565 4,306 4,299 4,
Cooling Degree Days
New England ............ ..... 0 96 444 0 0 75 366 1 0 83 407 0 540 442 4
Middle Atlantic ............ ... 0 156 523 6 0 155 445 6 0 163 548 5 685 606 7
E. N. Central ........... ....... 0 213 471 6 0 231 394 8 0 216 544 8 689 633 7
W. N. Central ............ ..... 0 231 656 7 0 263 553 11 3 274 685 11 893 827 9
South Atlantic ........... ..... 107 591 1,038 254 107 640 1,080 228 112 616 1,135 230 1,990 2,055 2,
E. S. Central ........... ....... 14 453 918 58 6 505 948 66 27 494 1,037 66 1,442 1,525 1,
W. S. Central ............ ..... 74 781 1,512 164 33 777 1,449 188 69 827 1,483 196 2,531 2,447 2,
Mountain ........... ............ . 23 479 912 50 31 438 882 78 19 449 975 86 1,465 1,430 1,
Pacific ........... ............ ..... 26 216 594 49 39 222 714 76 31 199 574 74 885 1,051 8
U.S. Average ............ . 36 377 803 86 34 392 792 92 39 390 843 94 1,303 1,309 1,
Cooling Degree Days, Prior 10-year Average
New England ............ ..... 0 77 416 1 0 83 417 1 0 85 422 1 494 500 5
Middle Atlantic ............ ... 0 159 560 4 0 167 558 5 0 168 559 6 724 731 7
E. N. Central ........... ....... 3 220 548 6 3 230 546 6 3 234 546 7 778 785 7
W. N. Central ............ ..... 7 273 684 9 7 277 678 9 7 282 685 9 974 972 9
South Atlantic ........... ..... 112 633 1,157 208 109 636 1,153 212 109 634 1,156 213 2,110 2,111 2,
E. S. Central ........... ....... 36 525 1,049 57 35 528 1,045 57 33 526 1,056 52 1,667 1,666 1,
W. S. Central ............ ..... 100 889 1,494 194 102 882 1,506 190 94 883 1,519 180 2,676 2,680 2,
Mountain ........... ............ . 17 411 934 77 18 420 922 71 17 424 931 74 1,440 1,432 1,4
Pacific ........... ............ ..... 26 159 598 63 26 166 588 58 26 170 603 61 847 838 8
U.S. Average ............ . 42 387 844 84 41 393 843 83 40 395 851 83 1,357 1,360 1,
Table 9c. U.S. Regional Weather Data
U.S. Energy Information Administration | Short-Term Energy Outlook - October 20142013 2014 2015 Year
Historical data: Latest data available from U.S. Department of Commerce, National Oceanic and Atmospheric Association (NOAA).
Projections: Based on forecasts by the NOAA Climate Prediction Center (http://www.cpc.ncep.noaa.gov/pacdir/DDdir/NHOME3.shtml).
= no data available
Notes: Regional degree days for each period are calculated by EIA as contemporaneous period population-weighted averages of
tate degree day data published by the National Oceanic and Atmospheric Administration (NOAA).
See Change in Regional and U.S. Degree-Day Calculations (http://www.eia.gov/forecasts/steo/special/pdf/2012_sp_04.pdf) for more information.
The approximate break between historical and forecast values is shown with historical data printed in bold; estimates and forecasts in italics.
Regions refer to U.S. Census divisions. See "Census division" in EIA’s Energy Glossary (http://www.eia.gov/tools/glossary/) for a list of states in each region.