SHORT-TERM AND EPISODIC BEACH CHARACTERIZATION … Jones.pdf · SHORT-TERM AND EPISODIC BEACH...
16
SHORT-TERM AND EPISODIC BEACH CHARACTERIZATION ALONG THE ALABAMA GULF COAST Stephen C. Jones Geological Survey of Alabama 420 Hackberry Lane Tuscaloosa, Alabama 35486 ABSRACT Shoreline change analysis is part of the “Gulf-fronting Shoreline Monitoring Program” a cooperative project by the Alabama Department of Natural Resources, Lands Division, Coastal Section and the Geological Survey of Alabama (GSA). Within the past few years, Alabama’s border with the Gulf of Mexico has experienced significant impacts from both natural and anthropogenic processes. Hurricane Ivan made landfall on the Alabama coastline on September 16, 2004, resulting in catastrophic storm-induced beach erosion. Prior to this, two large-scale beach nourishment projects, the Gulf Shores, Alabama Beach Restoration Project and the West Beach Gulf Shores Emergency Beach Fill Project were completed in 2001 and 2003, respectively. In order to quantify short-term shoreline change, over ten years of aerial data were statistically examined by integrating linear regression and Analysis of Variance (ANOVA). Recession rates from the Alabama-Florida state boundary to the area of Little Lagoon Pass range between 2 ft/yr to 10 ft/yr. The highest rates of shoreline change were found on the western end of Morgan Peninsula (- 16.8 ft/yr) and the eastern end of Dauphin Island (-14.5 ft/yr). Shoreline recession is highly influenced by the setting: beaches influenced by an inlet, beaches buffered from updrift littoral resources, or areas influenced by wave propagation and energy. Data used to evaluate episodic shoreline change from Hurricane Ivan included pre- and post-storm topographic surveys and airborne laser altimetry. The Beach Morphology Analysis Package, Version 2.0, was used to quantify beach loss and shoreline change from topographic surveys. Dry beach loss averaged 23 yd 3 /ft for Baldwin County and 6 yd 3 /ft for Dauphin Island. Maximum calculated values of shoreline recession (87.3 ft) and volume loss (44.6 yd 3 /ft) were found in Gulf Shores, Alabama. Beach sand losses are accounted for in both the formation of large overwash fans and deposition seaward of the longshore bar. Airborne laser altimetry data for Florida Point (east Perdido Pass) and the eastern boundary of Bon Secour National Wildlife Refuge were evaluated with ArcGIS 3D Analyst. Including areas of both volume loss and gain, at least 280,000 yd 3 of sand eroded from 78 acres at Florida Point. A maximum elevation loss of 26 feet occurred where the breach intersected with the relic dune field at the Bon Secour site. Beach scouring, deposition, and other effects were also observed within the backshore environment.
Transcript of SHORT-TERM AND EPISODIC BEACH CHARACTERIZATION … Jones.pdf · SHORT-TERM AND EPISODIC BEACH...

SHORT-TERM AND EPISODIC BEACH CHARACTERIZATION ALONG THE ALABAMA GULF COAST
Stephen C. Jones Geological Survey of Alabama
420 Hackberry Lane Tuscaloosa, Alabama 35486
ABSRACT
Shoreline change analysis is part of the “Gulf-fronting Shoreline Monitoring Program” a cooperative project by the Alabama Department of Natural Resources, Lands Division, Coastal Section and the Geological Survey of Alabama (GSA). Within the past few years, Alabama’s border with the Gulf of Mexico has experienced significant impacts from both natural and anthropogenic processes. Hurricane Ivan made landfall on the Alabama coastline on September 16, 2004, resulting in catastrophic storm-induced beach erosion. Prior to this, two large-scale beach nourishment projects, the Gulf Shores, Alabama Beach Restoration Project and the West Beach Gulf Shores Emergency Beach Fill Project were completed in 2001 and 2003, respectively.
In order to quantify short-term shoreline change, over ten years of aerial
data were statistically examined by integrating linear regression and Analysis of Variance (ANOVA). Recession rates from the Alabama-Florida state boundary to the area of Little Lagoon Pass range between 2 ft/yr to 10 ft/yr. The highest rates of shoreline change were found on the western end of Morgan Peninsula (-16.8 ft/yr) and the eastern end of Dauphin Island (-14.5 ft/yr). Shoreline recession is highly influenced by the setting: beaches influenced by an inlet, beaches buffered from updrift littoral resources, or areas influenced by wave propagation and energy.
Data used to evaluate episodic shoreline change from Hurricane Ivan
included pre- and post-storm topographic surveys and airborne laser altimetry. The Beach Morphology Analysis Package, Version 2.0, was used to quantify beach loss and shoreline change from topographic surveys. Dry beach loss averaged 23 yd3/ft for Baldwin County and 6 yd3/ft for Dauphin Island. Maximum calculated values of shoreline recession (87.3 ft) and volume loss (44.6 yd3/ft) were found in Gulf Shores, Alabama. Beach sand losses are accounted for in both the formation of large overwash fans and deposition seaward of the longshore bar. Airborne laser altimetry data for Florida Point (east Perdido Pass) and the eastern boundary of Bon Secour National Wildlife Refuge were evaluated with ArcGIS 3D Analyst. Including areas of both volume loss and gain, at least 280,000 yd3 of sand eroded from 78 acres at Florida Point. A maximum elevation loss of 26 feet occurred where the breach intersected with the relic dune field at the Bon Secour site. Beach scouring, deposition, and other effects were also observed within the backshore environment.
INTRODUCTION
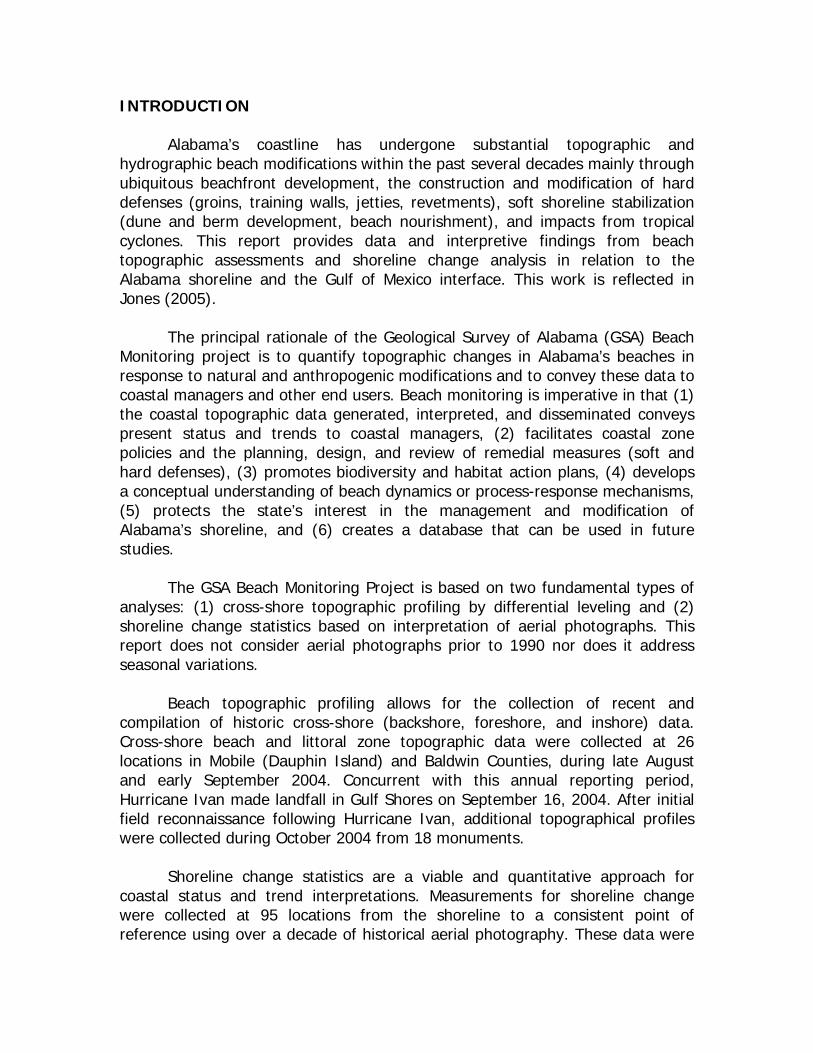
Alabama’s coastline has undergone substantial topographic and hydrographic beach modifications within the past several decades mainly through ubiquitous beachfront development, the construction and modification of hard defenses (groins, training walls, jetties, revetments), soft shoreline stabilization (dune and berm development, beach nourishment), and impacts from tropical cyclones. This report provides data and interpretive findings from beach topographic assessments and shoreline change analysis in relation to the Alabama shoreline and the Gulf of Mexico interface. This work is reflected in Jones (2005).
The principal rationale of the Geological Survey of Alabama (GSA) Beach Monitoring project is to quantify topographic changes in Alabama’s beaches in response to natural and anthropogenic modifications and to convey these data to coastal managers and other end users. Beach monitoring is imperative in that (1) the coastal topographic data generated, interpreted, and disseminated conveys present status and trends to coastal managers, (2) facilitates coastal zone policies and the planning, design, and review of remedial measures (soft and hard defenses), (3) promotes biodiversity and habitat action plans, (4) develops a conceptual understanding of beach dynamics or process-response mechanisms, (5) protects the state’s interest in the management and modification of Alabama’s shoreline, and (6) creates a database that can be used in future studies.
The GSA Beach Monitoring Project is based on two fundamental types of
analyses: (1) cross-shore topographic profiling by differential leveling and (2) shoreline change statistics based on interpretation of aerial photographs. This report does not consider aerial photographs prior to 1990 nor does it address seasonal variations.
Beach topographic profiling allows for the collection of recent and
compilation of historic cross-shore (backshore, foreshore, and inshore) data. Cross-shore beach and littoral zone topographic data were collected at 26 locations in Mobile (Dauphin Island) and Baldwin Counties, during late August and early September 2004. Concurrent with this annual reporting period, Hurricane Ivan made landfall in Gulf Shores on September 16, 2004. After initial field reconnaissance following Hurricane Ivan, additional topographical profiles were collected during October 2004 from 18 monuments.
Shoreline change statistics are a viable and quantitative approach for
coastal status and trend interpretations. Measurements for shoreline change were collected at 95 locations from the shoreline to a consistent point of reference using over a decade of historical aerial photography. These data were

statistically evaluated using linear regression coupled with Analysis of Variance (ANOVA). Storm-induced erosion was evaluated using geographic information system technology on airborne laser altimetry data and topographic profile data were assessed with the Beach Morphology Analysis Package, Version 2 (BMAP).
STUDY AREA
Coastal and littoral Alabama are within the East Gulf Coastal Plain section of the Coastal Plain physiographic province and the Mississippi-Alabama shelf section of the Continental Shelf province (Copeland, 1982) (fig. 1).
Figure 1: Location diagram illustrating local geology, physiographic districts, bathymetry, and the extents of coastal study in Baldwin and Mobile Counties, Alabama.
The depositional history and stratigraphy of the Coastal Plain are directly related to past cyclic recessions and transgressions (Johnson and others, 2002). The study area is within the Coastal Lowlands district (Sapp and Emplaincourt, 1975), characterized by gently undulating to flat topography and parallel to the shoreline of the Gulf of Mexico and Mobile, Perdido, and Bon Secour Bays. Mobile Bay, a large submerged river valley, is the most prominent geomorphic feature along the coastline. Alabama has approximately 53 statute miles of general coastline and 607 statute miles of tidal shoreline (National Atlas of the United States, 2005).
Short-term Shoreline Change
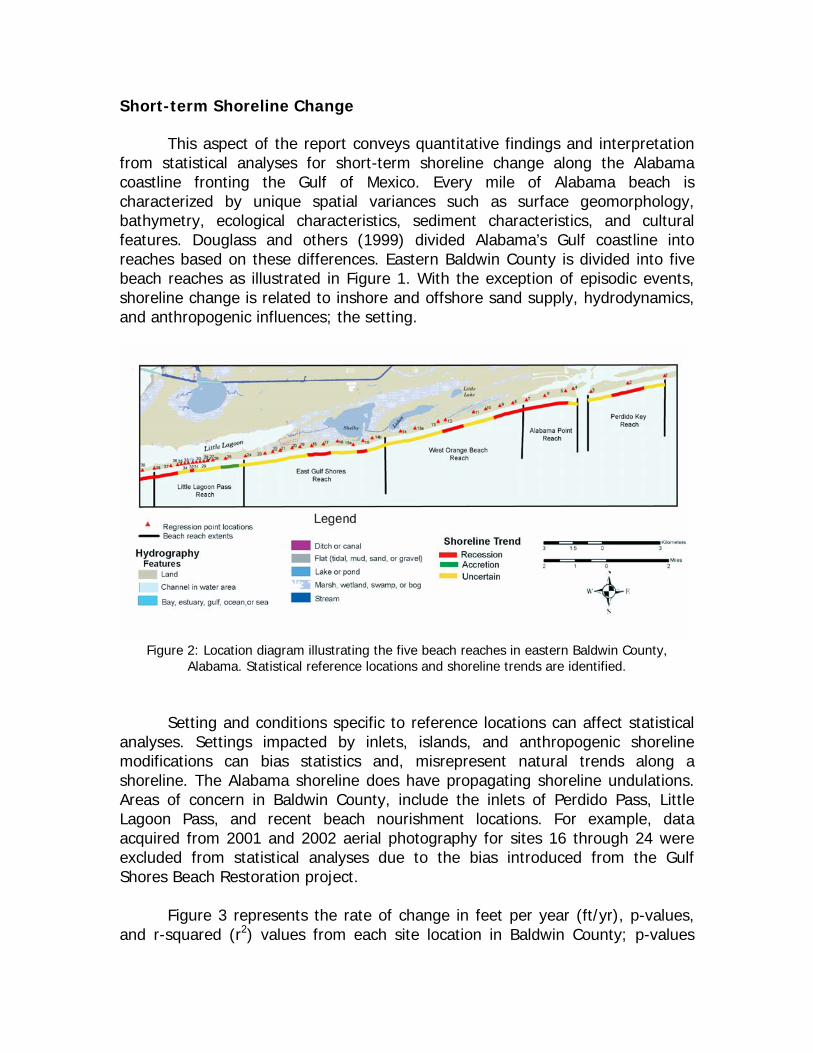
This aspect of the report conveys quantitative findings and interpretation from statistical analyses for short-term shoreline change along the Alabama coastline fronting the Gulf of Mexico. Every mile of Alabama beach is characterized by unique spatial variances such as surface geomorphology, bathymetry, ecological characteristics, sediment characteristics, and cultural features. Douglass and others (1999) divided Alabama’s Gulf coastline into reaches based on these differences. Eastern Baldwin County is divided into five beach reaches as illustrated in Figure 1. With the exception of episodic events, shoreline change is related to inshore and offshore sand supply, hydrodynamics, and anthropogenic influences; the setting.
Figure 2: Location diagram illustrating the five beach reaches in eastern Baldwin County,
Alabama. Statistical reference locations and shoreline trends are identified.
Setting and conditions specific to reference locations can affect statistical
analyses. Settings impacted by inlets, islands, and anthropogenic shoreline modifications can bias statistics and, misrepresent natural trends along a shoreline. The Alabama shoreline does have propagating shoreline undulations. Areas of concern in Baldwin County, include the inlets of Perdido Pass, Little Lagoon Pass, and recent beach nourishment locations. For example, data acquired from 2001 and 2002 aerial photography for sites 16 through 24 were excluded from statistical analyses due to the bias introduced from the Gulf Shores Beach Restoration project.
Figure 3 represents the rate of change in feet per year (ft/yr), p-values,
and r-squared (r2) values from each site location in Baldwin County; p-values

greater than 0.1 suggest no significant evidence to accept a rate of change, p-values between 0.05 and 0.1 suggesting weak evidence, p-values less than or equal to 0.05 suggest strong evidence. A correlation coefficient (r2) describes the strength of the association between two variables in a linear relationship.
ID
Number of Data Years
Rate of change (ft/year) p-value r2 ID
Number of Data Years
Rate of change (ft/year) p-value r2
1 11 1.4 0.484 0.056 34 11 3.7 0.303 0.110 2 11 -5.8 0.002 0.679 35 11 1.2 0.597 0.020 3 10 -3.8 0.165 0.255 36 11 -5.6 0.040 0.389 4 10 -9.6 0.347 0.111 37 11 -5.4 0.036 0.402 5 11 -19.9 0.036 0.403 38 11 -3.8 0.060 0.339 6 11 -3.3 0.155 0.257 39 11 -3.5 0.043 0.382 7 11 -4.0 0.026 0.441 40 11 -9.1 0.003 0.648 8 11 -6.0 0.008 0.566 41 11 -5.1 0.237 0.151 9 11 -4.0 0.098 0.275 42 11 -1.9 0.210 0.158
10 11 -0.6 0.686 0.019 43 11 -9.9 0.001 0.698 11 11 -2.9 0.181 0.190 44 11 -3.4 0.055 0.35 12 11 -4.6 0.017 0.486 45 11 -4.2 0.021 0.453 13 11 0.8 0.479 0.057 46 11 -7.8 0.001 0.728
13a 11 -0.7 0.677 0.020 47 11 -0.8 0.769 0.010 14 11 -3.2 0.234 0.153 48 11 -3.5 0.179 0.191
14b 9 -1.7 0.513 0.151 49 11 -4.8 0.028 0.433 15 10 -5.3 0.091 0.315 50 11 -3.9 0.163 0.204
15b 10 -3.5 0.141 0.21 51 11 -1.6 0.280 0.128 16 9 -0.3 0.929 0.001 52 11 0.4 0.920 0.001 17 9 -6.1 0.109 0.324 53 11 -1.4 0.272 0.132 18 9 -8.5 0.025 0.535 54 11 1.8 0.519 0.048 19 9 -4.4 0.285 0.161 55 11 -5.9 0.000 0.822 20 9 -4.6 0.104 0.332 56 11 -3.7 0.129 0.232 21 9 -1.7 0.447 0.085 57 11 -2.5 0.094 0.281 22 9 -0.7 0.847 0.006 58 11 0.7 0.770 0.010 23 9 -3.7 0.186 0.235 59 11 1.3 0.559 0.039 24 9 0.7 0.762 0.014 60 11 -6.3 0.041 0.386 25 11 4.7 0.048 0.368 61 11 -3.4 0.109 0.250 26 11 0.7 0.573 0.037 62 11 -3.7 0.019 0.473 27 11 -0.3 0.893 0.002 63 10 -12.6 0.007 0.619 28 11 -0.9 0.679 0.020 64 11 -16.8 0.000 0.962 29 11 -2.7 0.153 0.213 65 10 -39.3 0.499 0.309 30 11 -1.9 0.225 0.159 66 10 -9.9 0.082 0.331 31 11 -2.7 0.200 0.175 67 8 -4.8 0.437 0.103 32 11 -5.5 0.048 0.368 68 5 -29.6 0.433 0.214 33 11 2.2 0.385 0.085
Figure 3: Tabulated data representing the rate of change in feet per year (ft/yr), p-values, and r-squared (r2) values from each site location in Baldwin County. Shaded rows represent sites where p-values represent acceptable rate of change values. ID = site.
The Perdido Key Reach adjoins the Florida state line to the east and contains the Florida Point Unit of Gulf State Park to the west which adjoins Perdido Pass. Perdido Pass is maintained by jetties and periodic dredging. The eastern jetty contains a weir section to promote deposition. The shoreline is susceptible to artificial demands on the littoral system from the pass. One valid

recession rate (5.9 ft/yr) was documented. Although p-values and r2 values render this statistically questionable, the receding trend is continuous west to Perdido Pass.
The first notable area of recession in eastern Baldwin County, adjoins
Perdido Pass to the west. This includes both the Alabama Point Reach (adjoins the inlet) and the West Orange Beach Reach. Fluctuations in the data collected were expected due to periodic sand bypassing and position relative to Perdido Pass (downdrift). The maximum recession rate was quantified at Station 5 at 19.9 ft/yr. The western half of this reach is receding at 3 to 4 ft/yr. The recessive trend of Alabama Point Reach is continuous through site 9 in West Orange Beach Reach with a rate of about 6 ft/yr. Although the only other statistically validated location is at site 12 (-4.5 ft/yr), statistics indicate an uncertain trend throughout most of this reach. The recessive nature of this reach is related to an interrupted updrift sand budget. Retrogradation (shoreline erosion due to wave energy) is probably a minor factor because wave action is interrupted by the updrift jetty and predominant southeastern wave approach. Sites 14b through 24 represent the East Gulf Shores Reach. The trend for much of this reach is uncertain. However, sites 15, 17, and 18 have valid recession rates of 5.3 ft/yr, 6.1 ft/yr, and 8.5 ft/yr, respectively. The slightly seaward convex nature of this shoreline reach render it susceptible to retrogradation processes. Migrating shoreline undulations were observed and thus, effect statistics. The large, relatively undeveloped area of Gulf State Park is located in eastern portion of East Gulf Shores Reach. The second notable area of negative shoreline change occurs in western Little Lagoon Pass Reach. This beach area is represented in part by sites 26 through 36. Little Lagoon inlets ebb and tidal flow regime and associated shoal and the interruption of natural littoral processes by updrift beach nourishment activities contribute to dynamic statistics. Outlying sites within this reach include 25, 37, and 38. Updrift beach nourishment began to impact this area in 2001 as the modified shoreline began to re-establish a “stable” position. Bypassing of material from the maintenance of Little Lagoon inlet affect the downdrift beaches; the pass is maintained by the Alabama Department of Transportation (ALDOT). Documentation has been provided from the ALDOT that indicates over 40 dredge events occurred to maintain the pass in less than 8 years. Shoreline progradation was indicated in the area of site 25 with a 4.7 ft/yr rate or change. Minimal accretion values were also quantified for sites 24 and 26; statistics do not validate these positive trends. A trend of uncertain statistical validity was established for sites 26 through 31 and 33 through 35. Validated findings were quantified at sites 32, 36, 37, and 38 with recessional rates ranging from about 5.5 ft/yr at site 32 to 3.8 ft/yr at site 38. Although not statistically valid, accretion values were calculated for sites that were updrift of the pass through site 27,
and recession values were generated for site locations that were downdrift of the pass (sites 33, 34, and 35). Sand deposition east of the inlet and starvation west of the inlet would be expected with a predominant east to west littoral drifting process and basic inlet morphology (shoaling).
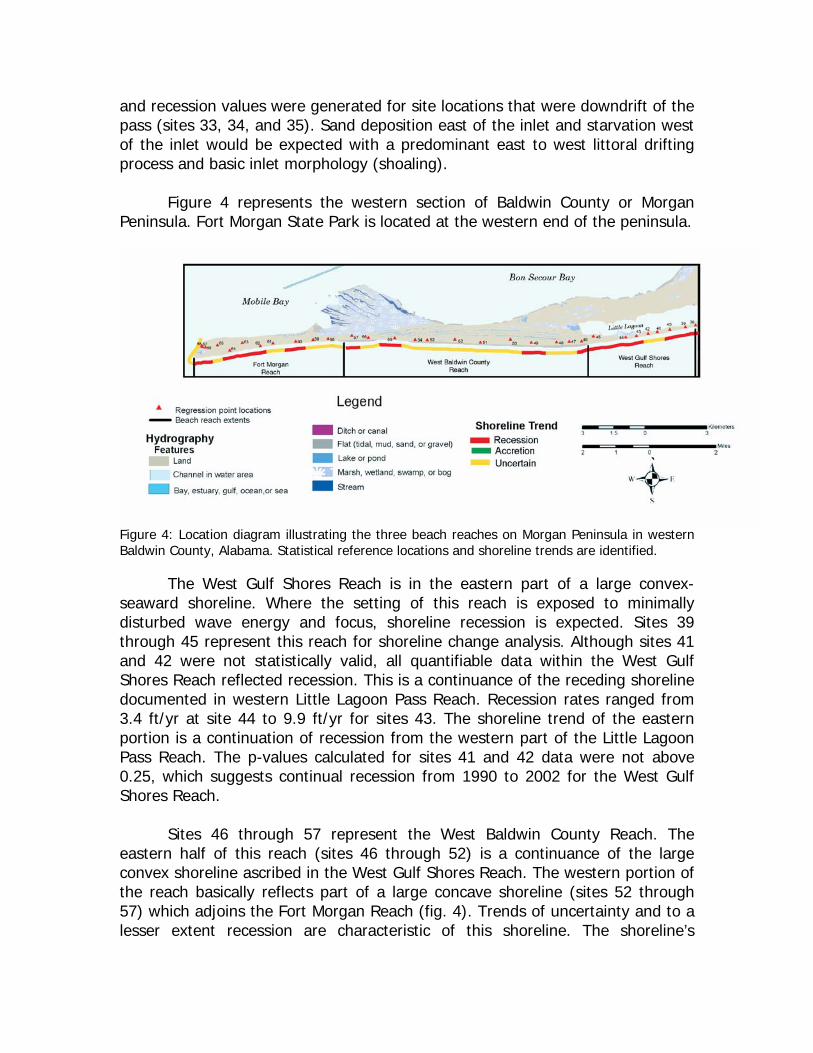
Figure 4 represents the western section of Baldwin County or Morgan Peninsula. Fort Morgan State Park is located at the western end of the peninsula.
Figure 4: Location diagram illustrating the three beach reaches on Morgan Peninsula in western Baldwin County, Alabama. Statistical reference locations and shoreline trends are identified. The West Gulf Shores Reach is in the eastern part of a large convex-seaward shoreline. Where the setting of this reach is exposed to minimally disturbed wave energy and focus, shoreline recession is expected. Sites 39 through 45 represent this reach for shoreline change analysis. Although sites 41 and 42 were not statistically valid, all quantifiable data within the West Gulf Shores Reach reflected recession. This is a continuance of the receding shoreline documented in western Little Lagoon Pass Reach. Recession rates ranged from 3.4 ft/yr at site 44 to 9.9 ft/yr for sites 43. The shoreline trend of the eastern portion is a continuation of recession from the western part of the Little Lagoon Pass Reach. The p-values calculated for sites 41 and 42 data were not above 0.25, which suggests continual recession from 1990 to 2002 for the West Gulf Shores Reach. Sites 46 through 57 represent the West Baldwin County Reach. The eastern half of this reach (sites 46 through 52) is a continuance of the large convex shoreline ascribed in the West Gulf Shores Reach. The western portion of the reach basically reflects part of a large concave shoreline (sites 52 through 57) which adjoins the Fort Morgan Reach (fig. 4). Trends of uncertainty and to a lesser extent recession are characteristic of this shoreline. The shoreline’s
convex-seaward apex is located at about site 46 and is regressing at 7.8 ft/yr. Trends are uncertain at sites 50 through 54. A p-value of 0 and an r2 value of 0.822 indicate a high level of certainty for the -5.9 ft/yr rate of change trend at site 55. Other recessive values are 4.8 ft/yr for the shoreline at site 49 and -2.5 ft/yr for the shoreline at site 57. Although sections of receding shoreline exist within the West Baldwin County Reach, the overall shoreline change trend is uncertain. Further study is needed to identify the processes that control the areas of recession within this reach. The rate of change for the Fort Morgan Reach was quantified for sites 58 through 68. The apex of the concave nature of the shoreline is at about site 58. Facing west and into the inlet of Mobile Bay, the terminus of Morgan Peninsula is at sites 67 and 68. A retrograding shoreline was validated for sites 60, 62-64 and 66, this area of shoreline faces south-southeast and is susceptible to the predominant wave direction. Recession ranged from 3.7 ft/yr to 16.8 ft/yr at sites 62 and 64, respectively. With p-values less than 0.007 and r2 values greater than 0.6, a high level of certainty is placed on the rate of change calculated for sites 63 and 64. The basic shoreline change trend for the Fort Morgan Reach facing the open gulf is recession.
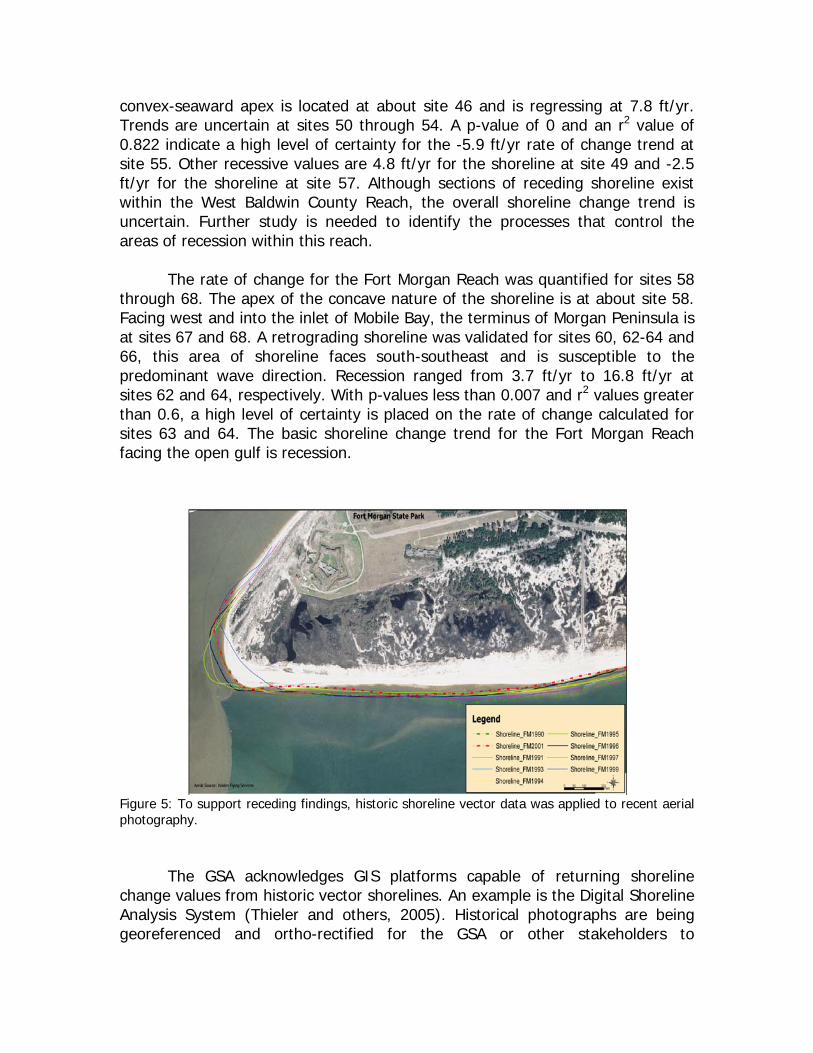
Figure 5: To support receding findings, historic shoreline vector data was applied to recent aerial photography.
The GSA acknowledges GIS platforms capable of returning shoreline change values from historic vector shorelines. An example is the Digital Shoreline Analysis System (Thieler and others, 2005). Historical photographs are being georeferenced and ortho-rectified for the GSA or other stakeholders to

implement this technology in the future. Morton and others (2004) reported a relatively stable shoreline at Perdido Key and the Morgan Peninsula due to an adequate updrift sand budget and beach nourishment efforts. Although submergence affects many beaches fronting the Gulf of Mexico, Morton and others determined that beach loss in Alabama is primarily caused by beach erosion and presented that the short-term recession rate for the western half of Dauphin Island was about -4.7 m/yr. Our present findings indicate shoreline recession is applicable downdrift of Perdido Pass, Little Lagoon inlet, and the end of Morgan Peninsula.
Dauphin Island, as presented, is divided into two distinct areas: East Dauphin Island Reach and West Dauphin Island Reach (fig. 6). The Dauphin Island shoreline is strongly affected by engineered modifications and a complex natural setting. Factors include the Mobile Bay channel, periodic bypassing and hard shoreline armoring at the eastern end of Dauphin Island, and the close proximity of Pelican Island. Sites directly impacted by these include sites 3 through 22 and thus, most of the Eastern Dauphin Island Reach.
Figure 6: Location diagram illustrating the two beach reaches presented for Dauphin Island, Mobile County. Statistical reference locations and shoreline trends are identified.
Rate of change values, p-values, and r2 values for each site on Dauphin Island, Mobile County are provided in Figure 7. Excellent values were quantified for 68% of measured locations for Dauphin Island. A much less percentage (38%) was collected for Baldwin County locations.
East Dauphin Island Reach is represented by sites 3 through 19, a convex
shoreline influenced by the previously identified factors. Within this reach, p-values of or approaching 0 and corresponding high r2 values suggest a high level of certainty for the rate of change calculations for sites 5-9, 11, and 15-17.
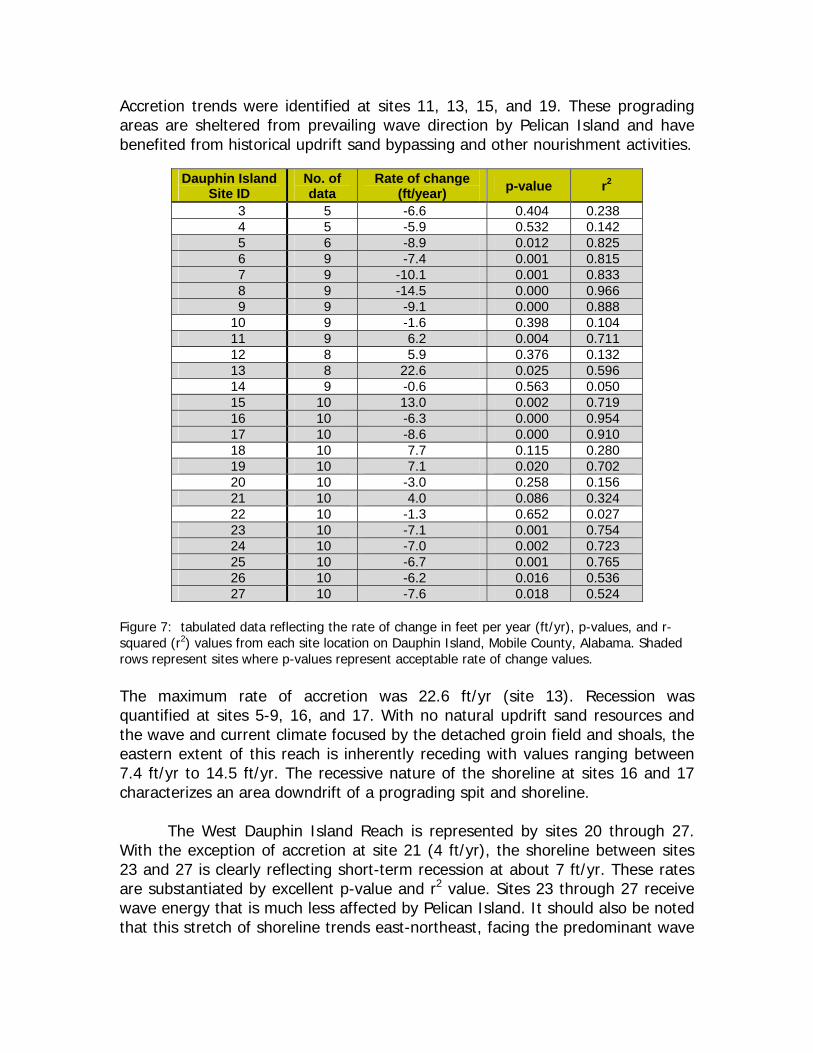
Accretion trends were identified at sites 11, 13, 15, and 19. These prograding areas are sheltered from prevailing wave direction by Pelican Island and have benefited from historical updrift sand bypassing and other nourishment activities.
Dauphin Island Site ID
No. of data
Rate of change (ft/year) p-value r2
3 5 -6.6 0.404 0.238 4 5 -5.9 0.532 0.142 5 6 -8.9 0.012 0.825 6 9 -7.4 0.001 0.815 7 9 -10.1 0.001 0.833 8 9 -14.5 0.000 0.966 9 9 -9.1 0.000 0.888
10 9 -1.6 0.398 0.104 11 9 6.2 0.004 0.711 12 8 5.9 0.376 0.132 13 8 22.6 0.025 0.596 14 9 -0.6 0.563 0.050 15 10 13.0 0.002 0.719 16 10 -6.3 0.000 0.954 17 10 -8.6 0.000 0.910 18 10 7.7 0.115 0.280 19 10 7.1 0.020 0.702 20 10 -3.0 0.258 0.156 21 10 4.0 0.086 0.324 22 10 -1.3 0.652 0.027 23 10 -7.1 0.001 0.754 24 10 -7.0 0.002 0.723 25 10 -6.7 0.001 0.765 26 10 -6.2 0.016 0.536 27 10 -7.6 0.018 0.524
Figure 7: tabulated data reflecting the rate of change in feet per year (ft/yr), p-values, and r-squared (r2) values from each site location on Dauphin Island, Mobile County, Alabama. Shaded rows represent sites where p-values represent acceptable rate of change values. The maximum rate of accretion was 22.6 ft/yr (site 13). Recession was quantified at sites 5-9, 16, and 17. With no natural updrift sand resources and the wave and current climate focused by the detached groin field and shoals, the eastern extent of this reach is inherently receding with values ranging between 7.4 ft/yr to 14.5 ft/yr. The recessive nature of the shoreline at sites 16 and 17 characterizes an area downdrift of a prograding spit and shoreline. The West Dauphin Island Reach is represented by sites 20 through 27. With the exception of accretion at site 21 (4 ft/yr), the shoreline between sites 23 and 27 is clearly reflecting short-term recession at about 7 ft/yr. These rates are substantiated by excellent p-value and r2 value. Sites 23 through 27 receive wave energy that is much less affected by Pelican Island. It should also be noted that this stretch of shoreline trends east-northeast, facing the predominant wave
direction. The lack of a longshore bar in this reach is indicative of an environment exposed to minimal littoral supply and significant hydrodynamics.
EPISODIC SHORELINE CHANGE
The eyewall of Hurricane Ivan made landfall along the coastline on September 16, 2004, east of Mobile Bay near the city of Gulf Shores. This storm event immediately followed the 2004 topographic data acquisition effort. Dune and berm destruction from surge, beach planing, cuspate bars, ridge and runnel systems, beach and infrastructure breaching, and significant overwash deposits were observed by surveying and field reconnaissance. Loss of backshore vegetation was extensive; stressed vegetation was observed throughout the beach-front coastal zone.
Data used to evaluate episodic shoreline change (storm-induced erosion)
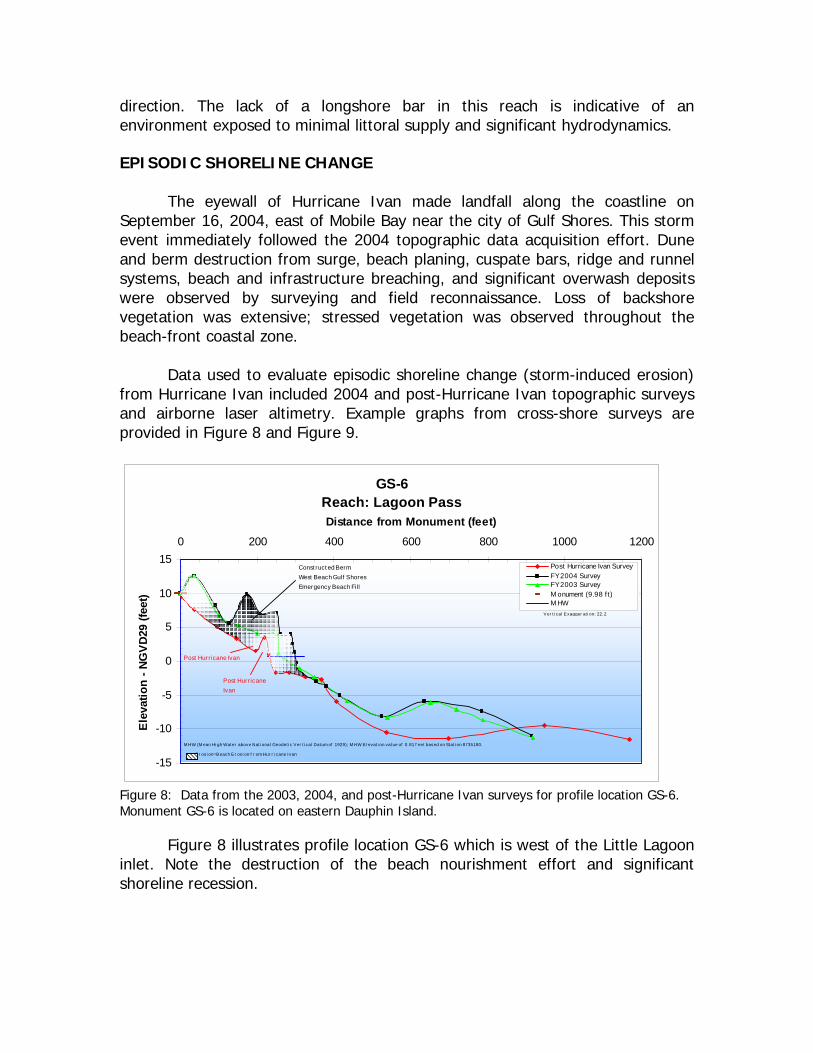
from Hurricane Ivan included 2004 and post-Hurricane Ivan topographic surveys and airborne laser altimetry. Example graphs from cross-shore surveys are provided in Figure 8 and Figure 9.
GS-6Reach: Lagoon Pass
-15
-10
-5
0
5
10
150 200 400 600 800 1000 1200
Distance from Monument (feet)
Elev
atio
n - N
GVD
29 (f
eet)
Post Hurricane Ivan SurveyFY2004 SurveyFY2003 SurveyM onument (9.98 f t )M HW
M HW (M ean Hi gh Water above Nat i onal Geodet i c Ver t i cal Datum of 1929); M HW E l evat i on val ue of 0.81 f eet based on Stat i on 8735180.
E r osi on=Beach E r osi on f r om Hur r i cane Ivan
Const ruct ed Berm West Beach Gulf Shores Emergency Beach Fill
Ver t i cal Exagg
Post Hurr icane Ivan
Post Hurr icane Ivan
er at i on: 22.2
Figure 8: Data from the 2003, 2004, and post-Hurricane Ivan surveys for profile location GS-6. Monument GS-6 is located on eastern Dauphin Island.
Figure 8 illustrates profile location GS-6 which is west of the Little Lagoon inlet. Note the destruction of the beach nourishment effort and significant shoreline recession.
DI-27Reach: East Dauphin Island
-15
-10
-5
0
5
100 200 400 600 800 1000 1200
Distance from Monument (feet)E
leva
tion
- NG
VD
29 (f
eet)
Post Hurricane Ivan SurveyFY2004 SurveyFY2003 SurveyM onument (7.2 f t )M HW
M HW (M ean Hi gh Water above Nat i onal Geodet i c V er t i cal Datum of 1929);
M HW El evat i on val ue of 0.81 f eet based on Stat i on 8735180.
Er osi on=B each E r osi on f r om Hur r i cane Ivan;
Deposi t i on=B each Deposi t i on f r om Hur r i cane Ivan
V er t i cal E xagger at i on:
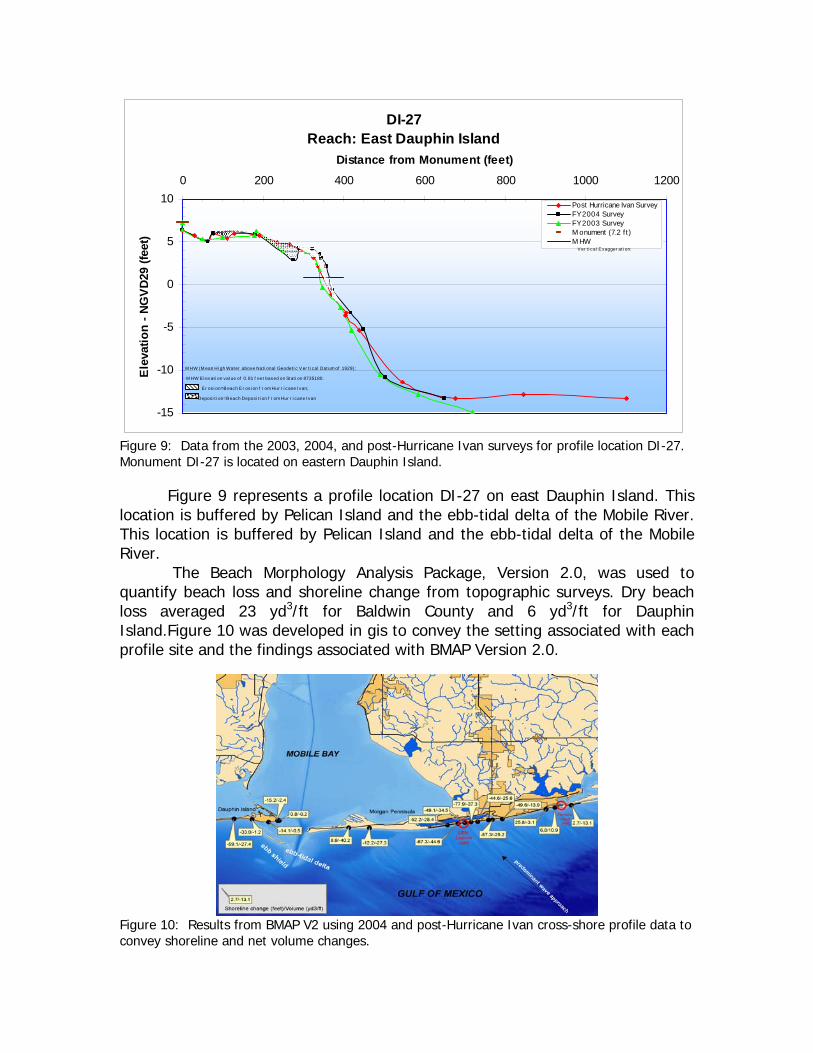
Figure 9: Data from the 2003, 2004, and post-Hurricane Ivan surveys for profile location DI-27. Monument DI-27 is located on eastern Dauphin Island.
Figure 9 represents a profile location DI-27 on east Dauphin Island. This location is buffered by Pelican Island and the ebb-tidal delta of the Mobile River. This location is buffered by Pelican Island and the ebb-tidal delta of the Mobile River.
The Beach Morphology Analysis Package, Version 2.0, was used to quantify beach loss and shoreline change from topographic surveys. Dry beach loss averaged 23 yd3/ft for Baldwin County and 6 yd3/ft for Dauphin Island.Figure 10 was developed in gis to convey the setting associated with each profile site and the findings associated with BMAP Version 2.0.
Figure 10: Results from BMAP V2 using 2004 and post-Hurricane Ivan cross-shore profile data to convey shoreline and net volume changes.

Maximum calculated values of shoreline recession (87.3 ft) and volume loss (44.6 yd3/ft) were found in Gulf Shores. Beach sand losses are accounted for in both the formation of large overwash fans and deposition seaward of the longshore bar. Volume loss estimates appear to be directly related to the beach setting (for example the buffering effects of Pelican Island), the proximity of development to the shoreline, and the availability of dry beach material. In addition to volume estimates, the BMAP model quantified shoreline change. Not surprisingly, high values for storm-induced shoreline recession and net volume loss are clearly related to recently renourished beaches.
Three-dimensional analysis (ESRI® ArcMap™ 8.3 ArcInfo 8.3) on pre-existing (NOAA CSC, 2003) and preliminary post-Hurricane Ivan (USGS, unpub. data, 2004) airborne laser altimetry data was assessed within the western extent of Perdido Key between BC-41 to Perdido Pass and for the western extent of the West Gulf Shores Reach (east boundary of the Bon Secour National Wildlife Refuge). Figure 11 represent the western extent of Perdido Key.
Figure 11: Florida Point (west Perdido Key) digital elevation models derived using 1998 and post-Hurricane Ivan airborne laser altimetry survey data and a volumetric change map using cut/fill functionality of the ESRI® ArcMap™ 8.3 ArcInfo 8.3 3D Analyst.
At Perdido Pass, about 78 acres of surface area was analyzed as briefly described above. Although a minimum of 280,000 yd3 of dry beach volume loss was quantified, areas of net volume loss and deposition were calculated. Other observations included the storm-induced detachment of the eastern jetty and complete destruction of critical dune habitat.

On the eastern boundary of Bon Secour National Wildlife Refuge, a large breach developed between the Gulf of Mexico and Little Lagoon. Elevation loss estimates, indicated in Figure 12, were as high as about 26 feet where the breach intersected relic dune structures.
Figure 12: Digital elevation models derived using 1998 and post-Hurricane Ivan airborne laser altimetry survey data for the eastern boundary of the Bon Secour National Wildlife Refuge. and resulting geospatial change map using the ESRI® ArcMap™ 8.3 ArcInfo 8.3 3D Analyst and Spatial Analyst Map Algebra.
Other observations included breach and beach scouring, an elevation gain within the far backshore environment, and habitat destruction. Beach renourishment immediately followed Hurricane Ivan in Baldwin County by mechanical placement of screened overwash deposits, beach nourishment by hydraulic dredging from Gulf of Mexico borrow pits, and dune development from the “uppassing” of Perdido Pass deposits at Florida Point (west Perdido Key).
For the northern Gulf of Mexico, the hurricane season of 2005 was much more costly than the 2004 season. The GSA is in the initial phase of interpreting 2005 data associated with Hurricane Katrina and Hurricane Rita. Pre- and post-Hurricane Katrina aerial photography of Dauphin Island are compared in Figure 13. Although storm-induced beach loss from Hurricane Katrina occurred all along the Alabama coastline, the gulf fronting shoreline on Dauphin Island saw the greatest destruction of structure and utility and transportation infrastructure and loss of gulf-fronting property tracts through breaching and over-washing.

Figure 13: A comparison of pre- and post-Hurricane Katrina aerial photographs the western extent for development on Dauphin Island. CONCLUSIONS
Shoreline recession mainly occurs in reaches that contain or are adjoined by bay channels or passes, areas deprived of or buffered from updrift littoral resources, or areas highly influenced by wave propagation and energy. Thus, Alabama beach trends and rates of change are highly influenced by the physical setting of the shoreline, its geometric shape, and bathymetric characterists. Present findings indicate shoreline recession is applicable downdrift of Perdido Pass, Little Lagoon Pass, and the end of Morgan Peninsula in Baldwin County and west of the detached groin field and the developing spit and the West Dauphin Island Reach in Mobile County.
Profile and airborne laser altimetry data indicate that high values for storm-induced shoreline recession and net volume loss are clearly related to recently renourished beaches. Hurricane Ivan destroyed beach restoration efforts and natural beach features, breached infrastructure and beaches, lost sand resources upland and stored sand resources in overwash deposits and inshore.
ACKNOWLEDGMENTS
This investigation is made possible through support provided by the Alabama Department of Conservation and Natural Resources, State Lands Division, Coastal Section, which supports the provisions and directives of the Coastal Zone Management Act of 1972. Yukio Nara (University of Alabama, Dept. of Engineering). Abby Sallenger and Karen Morgan (USGS) provided post-

Hurricane Ivan airborne laser altimetry data. Dr. Brain Batten (USACE ERDC, CIRP) provided BMAP Version 2.0. REFERENCES Copeland, C. W., 1982, Geology, in O’Neil P. E. and Mettee, M. F., eds., Alabama Coastal Region Ecological Characterization: 2. A Synthesis of Environmental Data: Alabama Geological Survey Information Series 61, p. 3-29. Douglass, S. L., Sanchez, T. A., and Jenkins, Scott, 1999, Mapping erosion hazard areas in Baldwin County, Alabama and the use of confidence intervals in shoreline change analysis: Journal of Coastal Research, special issue, no. 28, p. 95-105. Johnson, G. C., Kidd, R. E., Journey, C. A., Zappia, Humbert, and Atkins, J. B., 2002, Environmental setting and water-quality issues of the Mobile River Basin, Alabama, Georgia, Mississippi, and Tennessee: U.S. Geological Survey Water-Resources Investigations Report 02-4162, 61 p. Jones, Stephen C., 2005, Beach topographic monitoring for 2004-2005, short-term shoreline change analyses for 1990-2002, and episodic change and erosion from Hurricane Ivan, 2004, Mobile and Baldwin Counties, Alabama: GSA Open File Report 05-17, 88 p. Morton, R. A., Miller, T. L., and Moore, L. J., 2004, National assessment of shoreline change: Part 1; Historical shoreline changes and associated coastal land loss along the U.S. Gulf of Mexico: U. S. Geological Survey OFR 2004-1043, 42 p. National Atlas of the United States, 2005, Profile of the people and land of the United States, http://nationalatlas.gov/articles/mapping/a_general.html, Reston, Virginia, accessed May 4, 2005, http://nationalatlas.gov . NOAA, Coastal Services Center, 2003, LiDAR Data, Fall 1998, Topographic data Charleston, South Carolina, accessed May 11, 2005, http://www.csc.noaa.gov/crs/tcm/missions.html http://www.csc.noaa.gov/ Sapp, C. D., and Emplaincourt, Jacques, 1975, Physiographic regions of Alabama: Alabama Geological Survey Special Map 168, 48 p. Thieler, E.R., Himmelstoss, E.A., Zichichi, J.L., and Miller, T.L., 2005, Digital Shoreline Analysis System (DSAS) version 3.0: an ArcGIS extension for calculating shoreline change: U.S. Geological Survey Open-File Report 2005-1304.