GeoTrends 2017 report - Geospatial industry trends, forecasts and predictions
date post
19-Dec-2015Category
view
215download
0
Short-Term Air Quality Forecasts for the Pacific Northwest and Long-Range Global
Change Predictions for the US
Jack Chen
Committee Members: Brian Lamb, Hal Westberg, George Mount, and Alex Guenther
Washington State UniversityMay 4th 2007

• Exposures to elevated levels of ozone (O3) and fine particulate matters increase respiratory illnesses, premature deaths, cardiovascular problems
• Regional haze, degrade visibility
• National Ambient Air Quality Standards (NAAQS):O3, CO, Pb, SO2, NO2, PM10, PM2.5,
Pollutant Concentration Units Averaging Period
O3 80 ppbv 8-hour
PM2.5
15 µg/m3 Annual Mean
35 µg/m3 24-hour
Air Quality Standards

US Regional Air QualityCounties Designated Non-attainment or Maintenance
Most populated areas are in non-attainment or maintenance
“Brown cloud” in Seattle
US EPA (2006)5 NAAQS Pollutants
4 NAAQS Pollutants3 NAAQS Pollutants2 NAAQS Pollutants1 NAAQS Pollutant

Numerical Air Quality Forecasts
• Short-Range Forecasts – hourly air quality predictions for the next 24 hours
• Long-Range Predictions – general air quality conditions 50 years in the future from influence of global change

Air Pollution Chemistry
Clean Air Photochemistry
Urban Pollution Increase Ozone Production
(1) NO2 + hv NO + O
(2) O + O2 O3
(3) O3 + NO NO2 + O2
(4) RH + OH. RO2. + HO2
. + R’CHO
(5) RO2. + NO NO2 + RO.
(6) HO2. + NO NO2 + HO.
NOx + VOC + sunlight O3
NOx (NO+NO2): Combustion sources, soils, lightening
VOC: Combustion sources, solvents, trees, etc

Air Pollution Chemistry
• Primary Emissions:
– Smoke, dust, flyash, pollens, etc.
• Secondary formation:SO2 + [OH., O3, H2O] H2SO4
NO2 + OH. HNO3
N2O5 + H2O 2 HNO3
NH4HSO4, (NH4)3H(SO4)2, (NH4)2SO4
NH4NO3
Aromatic HC or HC-8 + [OH·, NO3·, O3]
SOA
NH3
NOx
VOC
SO2

Numerical Grid Model
Forecast Meteorological Model
Chemical Transport Model
Gridded Biogenic / Anthropogenic Emissions
Forecast Air Quality Conditions
Evaluate with Observational data

California Air Resources Board (1989)
EPA:MCIP CMAQ
Short-Range Air Quality Forecast System: AIRPACT-3
• AIRPACT has been providing hourly air quality forecasts for the Pacific Northwest since May 2001
• O3
• CO
• NO2
• Primary PM tracers • Secondary PM2.5
• PSO4, PNO3, PNH4, PEC, POC
AIRPACT-1/2AIRPACT-3
• State-of-science knowledge in atmospheric chemistry and physics
• Cloud effect on atmospheric chemistry
• Multiphase chemistry (gas, aqueous, aerosol) and aerosol dynamics
• CMAQ has a wide user community with active development and support from the public and EPA
Gridded Emissions
US EPA: (1999)
Forecast Meteorology (MM5)
CALMET/MCIP CALGRID

Short-Range Air Quality Forecast System: AIRPACT-3
Dynamic Initial Conditions
Dynamic Boundary Conditions
2005 Anthropogenic Emissions (SMOKE)
Wild and Prescribed Fire Emissions
Gridded Emissions
EPA Biogenic Emission Model (BEIS3)
EPACMAQ
WSU Dairy NH3 Emissions Module
Anthropogenic NOx Emissions
Biogenic VOC Emissions

Short-Range Air Quality Forecast System: AIRPACT-3
AIRPACT-1, AIRPACT-2• AIRPACT-1: 62 x 67 at 4-km• AIRPACT-2: 81 x 138 at 4-km• 13 vertical layers
AIRPACT-3• AIRPACT-3: 95 x 95 at 12-km• 21 vertical layers
(first layer height at 16m)
Elevation

Dairy NH3 Emission Module
WA Dairy NH3 (ton/yr)
Housing 8,634
Storage 5,441
Application 4,364
Total 18,439
OR Dairy NH3 (ton/yr)
Housing 9,469
Storage 5,079
Application 3,420
Total 17,967

Wild and Prescribed Fire Emission from the Forest Service BlueSky System
MODIS Image for Sept 5 2006
BlueSky System at Forest Service
Observed Fire Events
AIRPACT retrieves: fire location, fire size, heat flux, emissions (CO, PM2.5, TOG)
Predicted 24-hr PM2.5 for Aug. 2006
WSU Pullman

AIRPACT-3 Evaluation
Monitor Network # Station
EPA-AQS O3 30
EPA-AQS PM2.5 (Speciated PM)
37(8)
IMPROVE PM2.5 18
SWCAA PM2.5 4
• August – November 2004
• Covers both ozone and PM2.5 pollution seasons

Daily Max 8-hr O3 Performance
P/O vs Observed
Timing errors (running 8-hr means)
0.1
2
4
6
1
2
4
6
10
Mo
de
led
/ M
ea
su
red
Ra
tio
806040200Measured (ppbv)
30
25
20
15
10
5
Pe
rce
nta
ge
Co
un
t (%
)
121086420Hour Difference Between Observed and Measured O3 Peak Time

Overall Daily Max 8-hr O3 Performance
Obs. Avg. 42.9 ppbv
Mod. Avg. 43.0 ppbv
MB 2.7 ppbv
ME 7.2 ppbv
R 0.55
1
1MB
N
i ii
Mod ObsN
1
1ME
N
i ii
Mod ObsN

Ranked Daily Max 8-hr O3 Performance

Overall 24-hr PM2.5 Performance
EPA-AQS Stations
Obs. Avg. 11 (μg/m3)
Mod. Avg. 13 (μg/m3)
MB 2.0 (μg/m3)
ME 8.0 (μg/m3)
R 0.46
IMPROVE Stations
Obs. Avg. 6.0 (μg/m3)
Mod. Avg. 8.0 (μg/m3)
MB 2.2 (μg/m3)
ME 5.5 (μg/m3)
R 0.53
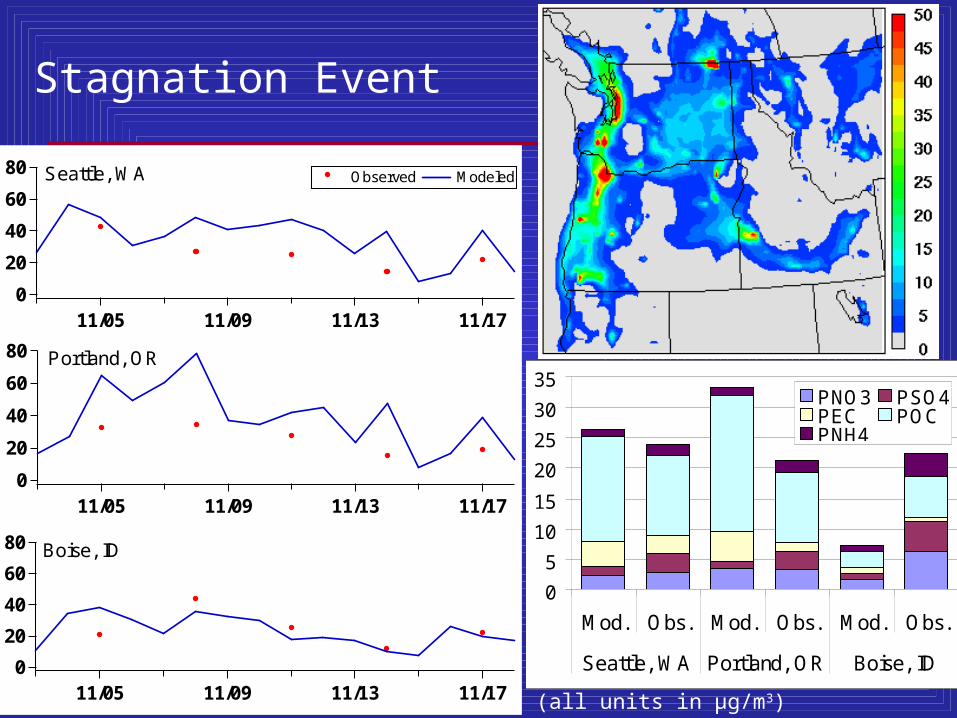
Stagnation Event
80
60
40
20
0
PM
2.5
(µg
/m3 )
11/05 11/09 11/13 11/17
Observed ModeledSeattle, WA
80
60
40
20
0
PM
2.5
(µg
/m3 )
11/05 11/09 11/13 11/17
Portland, OR
80
60
40
20
0PM
2.5
(µg
/m3 )
11/05 11/09 11/13 11/17
Boise, ID
0
5
10
15
20
25
30
35
Mod. Obs. Mod. Obs. Mod. Obs.
Seattle, WA Portland, OR Boise, ID
PNO3 PSO4PEC POCPNH4
(all units in μg/m3)

Long Range Air QualityPredictions for the US
• general air quality conditions 50 years in the future from influence of global change

Impact of Global Change on Regional Air Quality
Forecast Meteorology MM5
EPACMAQ
GriddedEmissions• Anthropogenic• Biogenic• Wild Fire
Simulate two 10-year periodsCurrent case (1990-1999) vs Future case (2045-2054)
• O3
• CO
• NO2
• Primary PM tracers • Secondary PM2.5
Global Climate Model(NCAR-PCM)
Global Chemistry Model (NCAR-MOZART2 )
Global Scale

Long Range Predictions – Domain
Right: Regional Meteorology (MM5) and Air Quality (CMAQ) model domain.
Left: Global Climate (PCM) and Chemistry (MOZART2) model domain.

Global Scenario on Future Air Quality?IPCC Global Emission Scenarios: A2—"Business as usual”
11 billion
230 Mt/yr
+1.5oC
70 Mt/yr

1000
800
600
400
200
pre
ssu
re [m
b]
0.1 1 10 100mixing ratio [ppbv]
O3
NOX
NOY
VOC
Western
1000
800
600
400
200
pre
ssu
re [m
b]
0.1 1 10 100
mixing ratio [ppbv]
Eastern
Western BC [ppbv]
Current Future
O3 38 50 35%
NOX 0.03 0.04 44%
NOY 0.28 0.47 69%
VOC 1.1 2.1 87%
Eastern BC [ppbv]
Current Future
O3 46 59 30%
NOX 0.14 0.22 63%
NOY 0.78 1.16 49%
VOC 5.0 7.3 47%
up to 500 mb

Future Regional Anthropogenic NOx
Current Decade Future Difference
current emissions (percent increase)
USA (1000 ton/day)
anthropogenic NOX 60 (6%)

Future Regional Biogenic VOC
Current DecadeFuture Difference
current emissions (percent change)
USA (1000 ton C/day)
anthropogenic VOC 51 (+50%)
biogenic VOC 160 (-38%)

Current decade: comparison of observed and simulated ozone distributions
EPA – AQS ozone data for 1994-2003 Summer
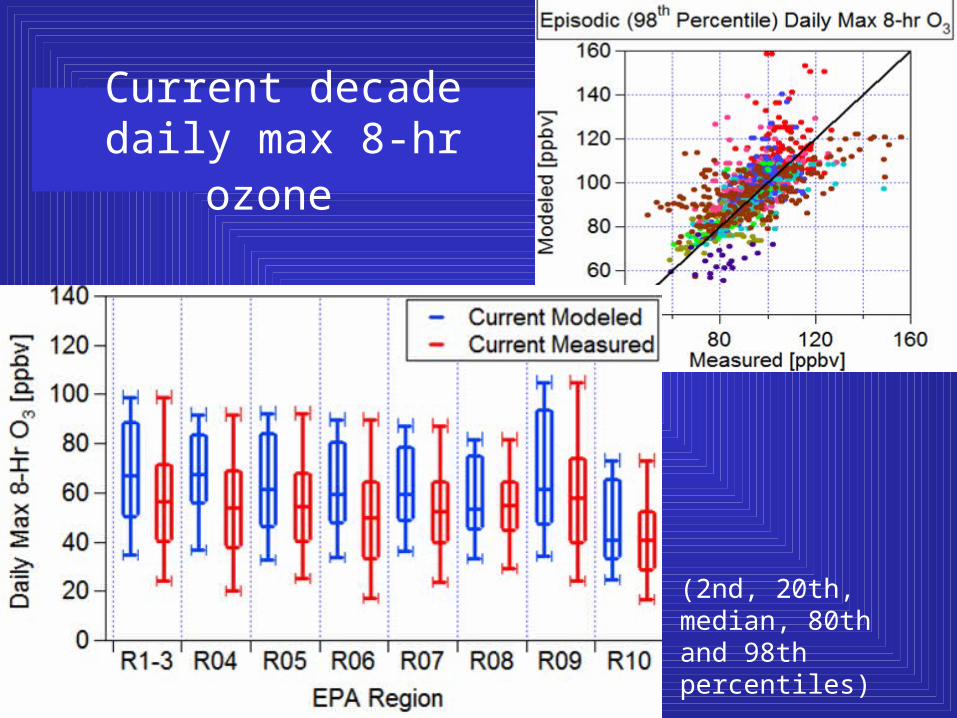
Current decade daily max 8-hr ozone
(2nd, 20th, median, 80th and 98th percentiles)

Current decade episodic ozone conditions (98th percentile daily max 8-hr ozone)
Model [ppbv] Measured

Mean summer daily max 2-m temperature Current vs Future
Current Future
Difference

(2nd, 20th, median, 80th and 98th percentiles)
Future changes in daily
max 8-hr ozone

Future Changes
daily max 8-Hr ozone (Episodic Condition - 98th Percentile) [ppbv]
Current
Difference
Future

Future ozone changes at select sites
Eight sites across US with 98th percentile observed daily max. 8-hr O3 exceed the EPA 80 ppbv standard

Future Changes in Episodic Ozone Season
20
15
10
5
0Da
ys O
3 >
80
ppb
v
Mar Apr May Jun Jul Aug Sep Oct
20151050
Da
ys Tem
p >
30
oC
Current Future
Average days per months across the eight sites.

Future Changes in Ozone Episode Duration
-20%
-15%
-10%
-5%
0%
5%
10%
15%
20%
1 2 3 4 5 6 7 8 9 10
Winslow, NJ GtSmokyMt, TNWilmington, OH Denton, TXAlton, MO ChatfieldLake, COCrestline, CA Canby, OR
Consecutive days 8-hr daily max O3 exceed 80 ppbv
% c
han
ge
from
cu
rrent d
eca
de

Summary
• Short-Term air quality forecasts– AIRPACT-3 with One-Atmosphere approach for PNW air quality– Includes dynamic treatment of anthropogenic, biogenic, dairy NH3 and
wildfire emissions– Evaluation showed good forecast performances – Peak ozone values correctly predicted, but over-estimated low levels– PM2.5 concentrations were better captured in urban areas than rural
regions– Good match with PNO3, PNH4 observations but underestimated PSO4
• Long-Range air quality predictions– Coupled global and regional AQ modeling system for the US– System reproduced current observed episodic ozone conditions– Under IPCC-A2 scenario, future 8-hr ozone increase by 5 to 10 ppbv– Larger areas of the US are impacted by ozone >80ppbv– Longer episodic ozone seasons and longer ozone episodes– Future land use have significant impact on biogenic emissions

Acknowledgements
• Advisor: Dr. Brian Lamb
• Committee: Drs. Hal Westberg, George Mount, Alex Guenther
• Funding from NW-AIRQUEST for the AIRPACT project
• Funding from EPA STAR for the long-term AQ predictions project
• Collaborating agencies: WA ECY, SWCAA, NCAR, USDA-FS, UW, EPA-R10
• Staff at the CE department office– Maureen Clausen, Lola Gillespie, Vicki Ruddick, Tom Weber,
and Cyndi Whitmore.

Acknowledgements
• Past and present LAR graduate students– Dr. Mike Barna, Dr. Susan O’Neill, Dr. Guangfeng Jiang– Dr. Joe Vaughan, Dr. Shelley Pressley– Jeremy Avise, Tara Strand, Ying Xie, Farren Thorpe, Matt Porter,
Charleston Ramos, Brian Rumburg, Obie Cambaliza …
• Friends and Family

Questions?
Thank you!


Presentation Outline
• Background
• Short-term air quality forecasts:– Modeling approach– Results
• Long-term air quality predictions:– Modeling approach– Results
• Summary and conclusion
• Acknowledgement and questions

Conservation Equation in an Eulerian Framework
SDRz
CK
zy
CK
yx
CK
xz
CW
y
CV
x
CU
t
C iz
iy
ix
iiii
(1) (2a) (2b) (2c) (3a) (3b) (3c) (4) (5) (6)
(1) Change of pollutant concentration(2a,b) Horizontal Advection(2c) Vertical Advection(3a,b) Horizontal Dispersion(3c) Vertical Diffusion(4) Chemical Reaction(5) Deposition(6) Emission/Source Term
Chemical Transport Model
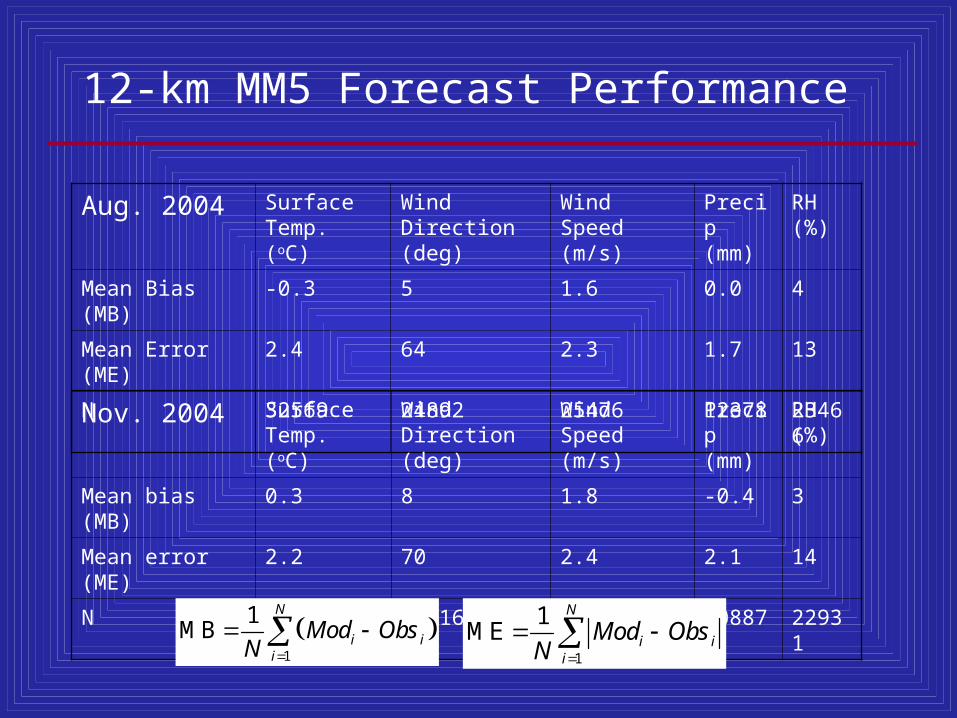
Aug. 2004 Surface Temp. (oC)
Wind Direction (deg)
Wind Speed (m/s)
Precip (mm)
RH (%)
Mean Bias (MB) -0.3 5 1.6 0.0 4
Mean Error (ME) 2.4 64 2.3 1.7 13
N 32569 24892 25476 12378 23466
Nov. 2004 Surface Temp. (oC)
Wind Direction (deg)
Wind Speed (m/s)
Precip (mm)
RH (%)
Mean bias (MB) 0.3 8 1.8 -0.4 3
Mean error (ME) 2.2 70 2.4 2.1 14
N 32956 24416 24978 10887 22931
12-km MM5 Forecast Performance
1
1MB
N
i ii
Mod ObsN
1
1ME
N
i ii
Mod ObsN

8
6
4
2
0
Mo
de
led
(µ
g/m
3)
86420
Measured (µg/m3)
EPA_AQS IMPROVE SWCAA
PEC50
40
30
20
10
0
Mo
de
led
(µ
g/m
3)
50403020100
Measured (µg/m3)
EPA_AQS IMPROVE SWCAA
POC
10
8
6
4
2
0M
od
ele
d (
µg
/m3 )
1086420
Measured (µg/m3)
EPA_AQS SWCAA
PNO35
4
3
2
1
0
Mo
de
led
(µ
g/m
3 )
543210
Measured (µg/m3)
EPA_AQS SWCAA
PNH420
15
10
5
0
Mo
de
led
(µ
g/m
3 )
20151050
Measured (µg/m3)
EPA_AQS SWCAA
PSO4

POC
15
10
5
0
PO
C (
µg
/m3 )
11/01 11/06 11/11 11/16 11/21 11/26 12/01
Observed Modeled
PEC
PSO4
4
3
2
1
0
PE
C (
µg
/m3 )
11/01 11/06 11/11 11/16 11/21 11/26 12/01
Observed Modeled
10
8
6
4
2
0
PS
O4
(µ
g/m
3 )
11/01 11/06 11/11 11/16 11/21 11/26 12/01
Observed Modeled
Columbia River Gorge (Bonneville Dam)

US Regional EmissionsCurrent (1000 tons/day) & future/current ratio
Area Mobile Off-road Point Fire Biogenic
CO 45 1.31
184 0.99
61 1.14
11 1.00
1.5 1.25
14 0.97
NOx 5 1.57
23 0.99
11 1.11
23 1.00
N/A 4.0 1.02
VOC 24 2.00
15 0.98
7 1.36
5
1.00
0.1 1.24
160 0.62

Average daily max 8-hr ozone and 98th percentile daily max 8-hr ozone

Future changes in average daily max 8-hr ozone and 98th percentile daily max 8-hr ozone

Future Biogenic Emissions from Land Use, Land Cover Changes
• Simulated future July months with different vegetation distributions
Case 1 Current decade
Case 2 Future with current vegetation
Case 3 Future decade
Case 4 Future with afforestation
Case 2 – Case 1 Case 4 – Case 1
Isoprene Emission Difference

Change LULC on Future Biogenic Emissions
40
30
20
10
Mo
note
rpen
e [G
gC
da
y-1]
Case1 Case2 Case3 Case4
120
100
80
60
40
20
Isop
ren
e [G
g d
ay-1
]
Case1 Case2 Case3 Case4
Total Continental Emissions

Change LULC on Future Ozone and BSOA
1.0
0.8
0.6
0.4
0.2
0.0B
SO
A [µ
g/m
3 ]Case1 Case2 Case3 Case4
90
80
70
60
50
40
30
Ozo
ne [
ppb
v]
Case1 Case2 Case3 Case4
Average Continental Concentrations

Long Range Forecast – Current Status
40
35
30
25
20
15
10
de
g C
WA
_S
po
ka
ne
WA
_B
ell
ing
ha
m
WA
_O
lym
pia
WA
_S
ea
Ta
c
OR
_P
ort
lan
d
OR
_E
ug
en
e
OR
_S
ale
m
OR
_P
en
dle
ton
ID_
Bo
ise
ID_
Le
wis
ton
1284
Da
ys
Current Decade MM5 Future Decade MM5
Summer Daily Max Temperature Range and Days Per Year Temp > 30 degC
Average temperature across PNW showed 2oC increase