Short Introduction to Spectral Clustering€¦Short Introduction to Spectral Clustering MLSS 2007...
23
Short Introduction to Spectral Clustering MLSS 2007 Practical Session on Graph Based Algorithms for Machine Learning Matthias Hein and Ulrike von Luxburg August 2007
Transcript of Short Introduction to Spectral Clustering€¦Short Introduction to Spectral Clustering MLSS 2007...

Short Introduction to Spectral ClusteringMLSS 2007
Practical Session on Graph Based Algorithms for MachineLearning
Matthias Hein and Ulrike von Luxburg
August 2007

Matt
hia
sH
ein
and
Ulrik
evo
nLuxb
urg
:Short
Intr
oduct
ion
toSpec
tralClu
ster
ing
August
2007
1
What is clustering, intuitively?
Given:
• Data set of “objects”• Some relations between those objects (similarities, distances,
neighborhoods, connections, ... )
Intuitive goal: Find meaningful groups of objects such that
• objects in the same group are “similar”
• objects in different groups are “dissimilar”
Reason to do this:
• exploratory data analysis
• reducing the complexity of the data
• many more

Matt
hia
sH
ein
and
Ulrik
evo
nLuxb
urg
:Short
Intr
oduct
ion
toSpec
tralClu
ster
ing
August
2007
2
Example: Clustering gene expression data
Ulr
ike v
on L
uxburg
20
Clustering Gene Expression Data
M. Eisen et al., PNAS, 1998

Matt
hia
sH
ein
and
Ulrik
evo
nLuxb
urg
:Short
Intr
oduct
ion
toSpec
tralClu
ster
ing
August
2007
3
Example: Social networks
Corporate email communication (Adamic and Adar, 2005)

Matt
hia
sH
ein
and
Ulrik
evo
nLuxb
urg
:Short
Intr
oduct
ion
toSpec
tralClu
ster
ing
August
2007
4
Example: Image segmentation
Figure 6: Automatic image segmentation. Fully automatic intensity based image segmen-tation results using our algorithm.
More experiments and results on real data sets can be found on our web-pagehttp://www.vision.caltech.edu/lihi/Demos/SelfTuningClustering.html
5 Discussion & Conclusions
Spectral clustering practitioners know that selecting good parameters to tune the cluster-ing process is an art requiring skill and patience. Automating spectral clustering was themain motivation for this study. The key ideas we introduced are three: (a) using a localscale, rather than a global one, (b) estimating the scale from the data, and (c) rotating theeigenvectors to create the maximally sparse representation. We proposed an automatedspectral clustering algorithm based on these ideas: it computes automatically the scale andthe number of groups and it can handle multi-scale data which are problematic for previousapproaches.
Some of the choices we made in our implementation were motivated by simplicity and areperfectible. For instance, the local scale ! might be better estimated by a method whichrelies on more informative local statistics. Another example: the cost function in Eq. (3) isreasonable, but by no means the only possibility (e.g. the sum of the entropy of the rowsZi might be used instead).
Acknowledgments:
Finally, we wish to thank Yair Weiss for providing us his code for spectral clustering.This research was supported by the MURI award number SA3318 and by the Center ofNeuromorphic Systems Engineering award number EEC-9402726.
References
[1] G. H. Golub and C. F. Van Loan “Matrix Computation”, John Hopkins University Press, 1991,Second Edition.
[2] V. K. Goyal and M. Vetterli “Block Transform by Stochastic Gradient Descent” IEEE DigitalSignal Processing Workshop, 1999, Bryce Canyon, UT, Aug. 1998
[3] R. Kannan, S. Vempala and V.Vetta “On Spectral Clustering – Good, Bad and Spectral” In Pro-ceedings of the 41st Annual Symposium on Foundations of Computer Sceince, 2000.
[4] M. Meila and J. Shi “Learning Segmentation by Random Walks” In Advances in Neural Infor-mation Processing Systems 13, 2001
[5] A. Ng, M. Jordan and Y. Weiss “On spectral clustering: Analysis and an algorithm” In Advancesin Neural Information Processing Systems 14, 2001
[6] P. Perona and W. T. Freeman “A Factorization Approach to Grouping” Proceedings of the 5thEuropean Conference on Computer Vision, Volume I, pp. 655–670 1998.
[7] M. Polito and P. Perona “Grouping and dimensionality reduction by locally linear embedding”Advances in Neural Information Processing Systems 14, 2002
[8] G.L. Scott and H.C. Longuet-Higgins “Feature grouping by ‘relocalisation’ of eigenvectors ofthe proximity matrix” In Proc. British Machine Vision Conference, Oxford, UK, pages 103–108,1990.
(from Zelnik-Manor/Perona, 2005)

Matt
hia
sH
ein
and
Ulrik
evo
nLuxb
urg
:Short
Intr
oduct
ion
toSpec
tralClu
ster
ing
August
2007
5
Spectral clustering on one slide
• Given: data points X1, ..., Xn, pairwise similarities wij = s(Xi , Xj)
• Build similarity graph: vertices = data points, edges = similarities
• clustering = find a cut through the graph
◦ define a cut objective function
◦ solve it
; spectral clustering

Matt
hia
sH
ein
and
Ulrik
evo
nLuxb
urg
:Short
Intr
oduct
ion
toSpec
tralClu
ster
ing
August
2007
6
Graph notation
• W = (wij) adjacency matrix of the graph
• di =∑
j wij degree of a vertex
• D = diag(d1, . . . , dn) degree matrix
• |A| = number of vertices in A
• vol(A) =∑
i∈A di
In the following: vector f = (f1, ..., fn) interpreted as function onthe graph with f (Xi) = fi .

Matt
hia
sH
ein
and
Ulrik
evo
nLuxb
urg
:Short
Intr
oduct
ion
toSpec
tralClu
ster
ing
August
2007
7
Clustering using graph cuts
Clustering: within-similarity high, between similarity lowminimize cut(A, B) :=
∑i∈A,j∈B wij
Balanced cuts:RatioCut(A, B) := cut(A, B)( 1
|A| + 1|B|)
Ncut(A, B) := cut(A, B)( 1vol(A)
+ 1vol(B)
)
Mincut can be solved efficiently, but RatioCut or Ncut is NP hard.Spectral clustering: relaxation of RatioCut or Ncut, respectively.

Matt
hia
sH
ein
and
Ulrik
evo
nLuxb
urg
:Short
Intr
oduct
ion
toSpec
tralClu
ster
ing
August
2007
8
Unnormalized graph Laplacian
Defined asL = D −W
Key property: for all f ∈ Rn
f ′Lf = f ′Df − f ′Sf
=∑
i
di f2i −
∑i ,j
fi fjwij
=1
2
(∑i
(∑
j
wij)f2i − 2
∑ij
fi fjwij +∑
j
(∑
i
wij)f2j
)
=1
2
∑ij
wij(fi − fj)2

Matt
hia
sH
ein
and
Ulrik
evo
nLuxb
urg
:Short
Intr
oduct
ion
toSpec
tralClu
ster
ing
August
2007
9
Unnormalized graph Laplacian (2)Spectral properties:• L is symmetric (by assumption) and positive semi-definite (by
key property)
• Smallest eigenvalue of L is 0, corresponding eigenvector is 1
• Thus eigenvalues 0 = λ1 ≤ λ2 ≤ ... ≤ λn.
First relation between spectrum and clusters:• Multiplicity of eigenvalue 0 = number k of connected
components A1, ..., Ak of the graph.
• eigenspace is spanned by the characteristic functions 1A1 , ..., 1Ak
of those components (so all eigenvectors are piecewise constant).
Proof: Exercise

Matt
hia
sH
ein
and
Ulrik
evo
nLuxb
urg
:Short
Intr
oduct
ion
toSpec
tralClu
ster
ing
August
2007
10
Normalized graph Laplacians
Row sum (random walk) normalization:
Lrw = D−1L = I − D−1S
Symmetric normalization:
Lsym = D−1/2LD−1/2 = I − D−1/2SD−1/2
Spectral properties similar to the ones of L

Matt
hia
sH
ein
and
Ulrik
evo
nLuxb
urg
:Short
Intr
oduct
ion
toSpec
tralClu
ster
ing
August
2007
11
Solving Balanced Cut Problems
Relaxation for simple balanced cuts:
minA,B cut(A, B) s.t. |A| = |B|
Choose f = (f1, ..., fn)′ with fi =
{1 if Xi ∈ A
−1 if Xi ∈ B
• cut(A, B) =∑
i∈A,j∈B wij = 14
∑i ,j wij(fi − fj)
2 = 14f ′Lf
• |A| = |B| =⇒∑
i fi = 0 =⇒ f t1 = 0 =⇒ f ⊥ 1
• ‖f ‖ =√
n ∼ const.
minf f ′Lf s.t. f ⊥ 1, fi = ±1, ‖f ‖ =√
n
Relaxation: allow fi ∈ R
By Rayleigh: solution f is the second eigenvector of LReconstructing solution: Xi ∈ A ⇐⇒ fi >= 0, Xi ∈ B otherwise
Matt
hia
sH
ein
and
Ulrik
evo
nLuxb
urg
:Short
Intr
oduct
ion
toSpec
tralClu
ster
ing
August
2007
12
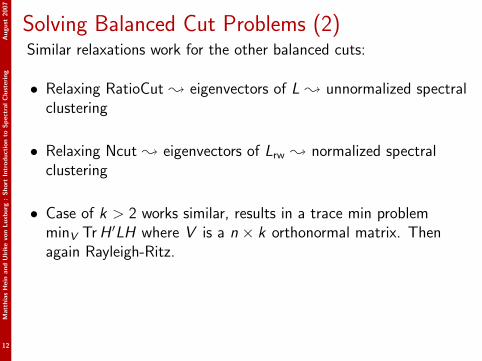
Solving Balanced Cut Problems (2)Similar relaxations work for the other balanced cuts:
• Relaxing RatioCut ; eigenvectors of L ; unnormalized spectralclustering
• Relaxing Ncut ; eigenvectors of Lrw ; normalized spectralclustering
• Case of k > 2 works similar, results in a trace min problemminV Tr H ′LH where V is a n × k orthonormal matrix. Thenagain Rayleigh-Ritz.

Matt
hia
sH
ein
and
Ulrik
evo
nLuxb
urg
:Short
Intr
oduct
ion
toSpec
tralClu
ster
ing
August
2007
13
Spectral clustering - main algorithms
Input: Similarity matrix S , number k of clusters to construct
• Build similarity graph
• Compute the first k eigenvectors v1, . . . , vk of the matrix{L for unnormalized spectral clustering
Lrw for normalized spectral clustering
• Build the matrix V ∈ Rn×k with the eigenvectors as columns
• Interpret the rows of V as new data points Zi ∈ Rk
v1 v2 v3
Z1 v11 v12 v13...
......
...Zn vn1 vn2 vn3
• Cluster the points Zi with the k-means algorithm in Rk .

Matt
hia
sH
ein
and
Ulrik
evo
nLuxb
urg
:Short
Intr
oduct
ion
toSpec
tralClu
ster
ing
August
2007
14
DemoSpectralClustering
Exploring Spectral Clustering
• Lowest number of noise dimensions
• Symmetric kNN graph with k = 10
• Number of clusters = 2
• Play around with data sets Two moons balanced and ThreeGaussians (first pick reasonable σ!)
• Try to understand the plots concerning the eigenvectors and theembedding in R
d
• Increase the number of clusters. Can you predict which clustersspectral clustering is going to choose, just by looking at theeigenvector plots?

Matt
hia
sH
ein
and
Ulrik
evo
nLuxb
urg
:Short
Intr
oduct
ion
toSpec
tralClu
ster
ing
August
2007
15
DemoSpectralClustering (2)Exploring Spectral Clustering
• Lowest number of noise dimensions
• Symmetric kNN graph with k = 10
• Number of clusters = 2
• Play around with data sets Two moons balanced and ThreeGaussians (first pick reasonable σ!)
• Try to understand the plots concerning the eigenvectors and theembedding in R
d
• Increase the number of clusters. Can you predict which clustersspectral clustering is going to choose, just by looking at theeigenvector plots?
Result: Spectral clustering works pretty well ,

Matt
hia
sH
ein
and
Ulrik
evo
nLuxb
urg
:Short
Intr
oduct
ion
toSpec
tralClu
ster
ing
August
2007
16
DemoSpectralClustering (3)Low parameters K in the context of spectral clustering
• Data set two gaussians different variance
• Lowest number of noise dimensions
• Mutual kNN graph
• Number of clusters = 2
Vary the number of neighbors between 3 and 15. What can youobserve? Can you explain the result?

Matt
hia
sH
ein
and
Ulrik
evo
nLuxb
urg
:Short
Intr
oduct
ion
toSpec
tralClu
ster
ing
August
2007
17
DemoSpectralClustering (4)Low parameters K in the context of spectral clustering
• Data set two gaussians different variance
• Lowest number of noise dimensions
• Mutual kNN graph
• Number of clusters = 2
Vary the number of neighbors between 3 and 15. What can youobserve? Can you explain the result?
• Many connected components lead to trivial or undesirableresults!
• Always choose the connectivity parameter of the graph so thatthe graph only has one connected component!
Matt
hia
sH
ein
and
Ulrik
evo
nLuxb
urg
:Short
Intr
oduct
ion
toSpec
tralClu
ster
ing
August
2007
18
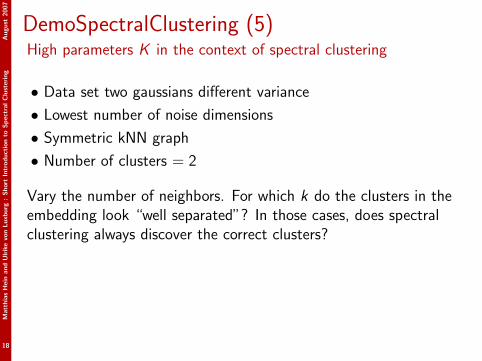
DemoSpectralClustering (5)High parameters K in the context of spectral clustering
• Data set two gaussians different variance
• Lowest number of noise dimensions
• Symmetric kNN graph
• Number of clusters = 2
Vary the number of neighbors. For which k do the clusters in theembedding look “well separated”? In those cases, does spectralclustering always discover the correct clusters?

Matt
hia
sH
ein
and
Ulrik
evo
nLuxb
urg
:Short
Intr
oduct
ion
toSpec
tralClu
ster
ing
August
2007
19
DemoSpectralClustering (6)High parameters K in the context of spectral clustering
• Data set two gaussians different variance
• Lowest number of noise dimensions
• Symmetric kNN graph
• Number of clusters = 2
Vary the number of neighbors from low to high. For which k do theclusters in the embedding look “well separated”? In those cases,does spectral clustering always discover the correct clusters?
High values of k usually don’t add useful information (can even bemisleading) but increase the complexity. Try to choose rather lowvalues of K .

Matt
hia
sH
ein
and
Ulrik
evo
nLuxb
urg
:Short
Intr
oduct
ion
toSpec
tralClu
ster
ing
August
2007
20
DemoSpectralClustering (7)High number of noise dimensions
• Data set two gaussians balanced
• Noise dimensions 50
• σ = 0.5
• Mutual kNN graph, k = 200
What happens?

Matt
hia
sH
ein
and
Ulrik
evo
nLuxb
urg
:Short
Intr
oduct
ion
toSpec
tralClu
ster
ing
August
2007
21
DemoSpectralClustering (8)High number of noise dimensions
• Data set two gaussians balanced
• Noise dimensions 50
• σ = 0.5
• Mutual kNN graph, k = 200
What happens?
Even though have one connected component, result is unreliable.Reason: similarity function is not informative, σ is too small!
If we pick a better σ, then spectral clustering works quite well, evenin the presence of noise!

Matt
hia
sH
ein
and
Ulrik
evo
nLuxb
urg
:Short
Intr
oduct
ion
toSpec
tralClu
ster
ing
August
2007
22
Some selected literature on spectral clusteringOf course I recommend the following ,• U.von Luxburg. A tutorial on spectral clustering. Statistics and Computing, to appear.
On my homepage.
The three articles which are most cited:
I Meila, M. and Shi, J. (2001). A random walks view of spectral segmentation.AISTATS.
I Ng, A., Jordan, M., and Weiss, Y. (2002). On spectral clustering: analysis and analgorithm. NIPS 14.
I Shi, J. and Malik, J. (2000). Normalized cuts and image segmentation.IEEETransactions on Pattern Analysis and Machine Intelligence, 22(8), 888 - 905.
Nice historical overview on spectral clustering; and how relaxation can go wrong:• Spielman, D. and Teng, S. (1996). Spectral partitioning works: planar graphs and finite
element meshes. In FOCS, 1996