Short and long-term impacts of famines: The case of the ...
29
HAL Id: halshs-01321939 https://halshs.archives-ouvertes.fr/halshs-01321939 Preprint submitted on 26 May 2016 HAL is a multi-disciplinary open access archive for the deposit and dissemination of sci- entific research documents, whether they are pub- lished or not. The documents may come from teaching and research institutions in France or abroad, or from public or private research centers. L’archive ouverte pluridisciplinaire HAL, est destinée au dépôt et à la diffusion de documents scientifiques de niveau recherche, publiés ou non, émanant des établissements d’enseignement et de recherche français ou étrangers, des laboratoires publics ou privés. Short and long-term impacts of famines: The case of the siege of Paris 1870-1871 Denis Cogneau, Lionel Kesztenbaum To cite this version: Denis Cogneau, Lionel Kesztenbaum. Short and long-term impacts of famines: The case of the siege of Paris 1870-1871 . 2016. halshs-01321939
Transcript of Short and long-term impacts of famines: The case of the ...

HAL Id: halshs-01321939https://halshs.archives-ouvertes.fr/halshs-01321939
Preprint submitted on 26 May 2016
HAL is a multi-disciplinary open accessarchive for the deposit and dissemination of sci-entific research documents, whether they are pub-lished or not. The documents may come fromteaching and research institutions in France orabroad, or from public or private research centers.
L’archive ouverte pluridisciplinaire HAL, estdestinée au dépôt et à la diffusion de documentsscientifiques de niveau recherche, publiés ou non,émanant des établissements d’enseignement et derecherche français ou étrangers, des laboratoirespublics ou privés.
Short and long-term impacts of famines: The case of thesiege of Paris 1870-1871
Denis Cogneau, Lionel Kesztenbaum
To cite this version:Denis Cogneau, Lionel Kesztenbaum. Short and long-term impacts of famines: The case of the siegeof Paris 1870-1871 . 2016. �halshs-01321939�

WORKING PAPER N° 2016 – 11
Short and long-term impacts of famines: The case of the siege of Paris 1870-1871
Denis Cogneau Lionel Kesztenbaum
JEL Codes: Keywords: Height, Famine, Excess mortality, Health, Malnutrition, France
PARIS-JOURDAN SCIENCES ECONOMIQUES
48, BD JOURDAN – E.N.S. – 75014 PARIS TÉL. : 33(0) 1 43 13 63 00 – FAX : 33 (0) 1 43 13 63 10
www.pse.ens.fr
CENTRE NATIONAL DE LA RECHERCHE SCIENTIFIQUE – ECOLE DES HAUTES ETUDES EN SCIENCES SOCIALES
ÉCOLE DES PONTS PARISTECH – ECOLE NORMALE SUPÉRIEURE – INSTITUT NATIONAL DE LA RECHERCHE AGRONOMIQUE

Short and long-term impacts of famines: The case of the siege of Paris 1870-1871
Denis Cogneau1 and Lionel Kesztenbaum2 1 Paris School of Economics – IRD – EHESS. [email protected] 2 Institut National d’Etudes Démographiques (INED) and Paris School of Economics (PSE). [email protected] Abstract
From September 1870 to February 1871, the Prussian army’s siege of Paris resulted in a harsh famine. Using original data from vital records and military registers, we investigate the impact of the siege in terms of both mortality and the height stature of survivors in one of the poorest areas of the city. We first estimate that deaths more than doubled at all ages during the 6-month siege and that child mortality rates increased by more than 25% (10 percentage points) for children born in 1869 or 1870. Second, we find little impact of famine on the height of individuals less than 5 years old during the siege, but a rather large deficit exists at ages 6 to 10. After having examined selection effects linked to mortality, fertility and migration, we argue that the siege was short-lived enough that many early-age survivors were able to catch up in stature. Keywords Height, Famine, Excess mortality, Health, Malnutrition, France Acknowledgements This work was supported by INED and by the PSE research fund. We are grateful to Dora Costa and Gilles Postel-Vinay for comments and suggestions, as well as to the participants at the Population Association of America annual conference of 2015; Ined; the XXVII IUSSP International Population Conference (Busan 2013); and the 17th World Economic History Congress (Kyoto 2015).

2
“Paris n’a succombé ni sous l’effort de l’artillerie prussienne, ni été vaincu par la supériorité militaire de l’assiégeant. Il a cédé devant un ennemi que personne ne peut dompter, ni seulement combattre : devant la famine; et encore il l’a supportée gaîment, il l’a presque défiée, jusqu’au moment où la disette absolue vint faire tomber le fusil des mains défaillantes de nos soldats.”1
Arnold Henryot (1871)
1/ Introduction
It is quite well known that nutrition has a strong impact on health. Robert Fogel (1994; 2004) attributes almost all 19th-century European decreases in mortality to improvements in net nutrition. Yet, for historical Europe and beyond, the role of alternative factors like public health, hygiene, vaccines and medical technology are still very much debated (Johansson 2005; Deaton 2006). Indeed, the precise relationship between net nutrition and health remains difficult to identify because of the multiplicity of channels and lagged effects involved. Following Fogel, adult height stature is often used as an intermediate variable that first captures the life conditions during childhood or adolescence (nutrition, diseases and work), and that is secondly correlated with survival chances later in life. In fact, anthropometrics have become a sub-field of economic history (see, e.g., Baten and Komlos 1998; Steckel 2008; Moradi 2010;).
Regarding the first relationship, particularly variations in diet being reflected in height, other factors may interfere and make it rather complex or less mechanical: the duration and timing of variations, age at exposure, and selection effects from mortality, migration, or fertility. In fact, household coping strategies and public policy responses will also affect how an ex-ante shock on food availability and on income translate into variations in nutrition at the individual level. Short-lived shocks on nutrition might not have long-lasting effects on physiological growth if children are able to catch up in the aftermath. But other dimensions of child development may be more affected, like cognition (see experimental evidence in Barham, Macours, and Maluccio 2013). Many works tend to suggest that very early ages (in the womb or during infancy) are the most critical periods, which is in line with the so-called "fetal hypothesis" (Barker 1990). However, the context and the nature of the shock may matter, as well as intra-household distribution of resources. Agricultural income shortfalls due to droughts in late 20th c. Indonesia (Maccini and Yang 2008) and to the phylloxera pest in late 19th c. France (Banerjee et al. 2010) indeed point to in utero growth as the most critical period. However, with the fall in the producer price of cocoa in late 20th c. Côte d'Ivoire, Cogneau and Jedwab (2012) rather find that only 2- to 5-year-olds (and mostly girls) are affected. Using migrants to Sweden, van den Berg et al. (2011) find effects at even later ages (5/6 and 9 years).
Selection effects are also a great concern, whether they be exogenous or endogenous to nutrition. In particular, samples where height stature is measured are often not representative of the population at risk and may suffer from large selection bias (Bodenhorn, Guinnane, and Mroz 2014). Furthermore, if children who would have ended up shorter die more, then height developments may be very much misleading in high mortality contexts (Bozzoli, Deaton, and Quintana-Domeque 2009; Rouanet 2015). Famines like the 1944 Dutch “Hunger Winter” (Scholte, van den Berg, and Lindeboom 2012), in the aftermath of the Chinese Great Leap
1 “Paris did not bow to Prussian canons, neither was it vanquished by the military superiority of the opponent. Paris lost in front of an enemy that cannot be tamed nor fought: hunger; and yet, it endured it joyfully, it almost defied it, up until the moment when absolute famine made the failing hands of our soldiers drop their rifles” (translated by the authors).
3
Forward (Almond et al. 2010), or during the siege of Leningrad (Sparen et al. 2004) are typically extreme cases where under-nutrition and child mortality reach high levels together. They can also result in lower fertility, and possible migration out of famine stricken areas, so that great effort is needed to isolate the nutritional channel from selection effects that potentially confound it (on the Chinese case, see Meng and Qian 2009; Gørgens, Meng, and Vaithianathan 2012)
Regarding the second relationship, i.e., low height (as a proxy for early nutrition failures) being linked to bad health and mortality later in life, evidence is also difficult to gather, given the many disturbances that occur between early and later life and the potential confounders that may explain both early-life and later-life conditions. A negative correlation between height and mortality risks at adult age has been found by many epidemiological studies, such as the one by Waaler (1984), which actually focused more on the correlation with weight and was also extensively used by Robert Fogel (see also, for instance, Kemkes-Grottenthaler's 2005 use of skeletal remains). However, this correlation may be coincidental and does not necessarily testify to a causal link running from early life diet to adult health and mortality. For some studies, part of the correlation is explained by early shrinkage resulting potentially from prior illnesses (Leon et al. 1995). Short height also correlates with lower socioeconomic status and hence worse living (or work) conditions at adult age (e.g., Jousilahti et al. 2000 on cause-specific mortality in Finland). Over the long-run, the reduced burden of infections and inflammation rather than an improved diet may account for why cohorts born in late 19th century Northern Europe both ended up taller after childhood and experienced less cardiovascular diseases at old age (Crimmins and Finch 2006).
This paper documents some short-term and long-term consequences of the famine that
resulted from the siege of Paris by the Prussian army between September 1870 and February 1871. We focus on the 19th district of the French capital city, as this is a poor, working-class area and we expect the effect of famine to have a greater effect on the poorest.
We do three things. First, we combine data from vital records with population census figures in order to estimate the increase in mortality during the siege. Second, we use first-hand individual data from military conscription files to analyse height developments in cohorts of Parisians born between 1850 and 1880, who were exposed to the famine at different ages; cohorts born in Lyon, the second largest French city, are also used as a comparison group. Third, military files allow us to track individual conscripts from 20 to 45 years old and analyse differential adult mortality according to their age during the siege.
Therefore, we are able to provide new evidence on the relationship between nutrition, mortality and physical growth. We discuss catching-up processes, critical age issues, and the selection effects involved. We find that total deaths were multiplied by a factor of two or three for all cohorts during the 6 months of the siege. Then we estimate that individuals who were between 0 and 2 years of age experienced a large drop in the probability of surviving until 20 – by almost 10 percentage points compared to unaffected cohorts. We also spot a dramatic drop in fertility, resulting in a 25% birth deficit for the year 1871 compared to 1869.
However, surprisingly enough, we do not identify any impact of famine on the adult height of survivors who were in utero or below 3 years old during the siege (born 1868-1871). This can only be accounted for by rather extreme assumptions on selection that are linked to mortality and fertility, with the possible exception of the very youngest in the 1870 and 1871 cohorts. Further, the stature of children who were between 3 and 6 (born 1865-67) is also unaffected. However, individuals born 1860-1864 exhibit a very large and significant height deficit. Our analysis of the former cohorts suggests that improved living conditions before and after a short-lived famine allowed survivors to go through it without any visible fall in stature. In contrast, the latter cohorts were too old to benefit from the improvement in living conditions that accelerated after 1866, too young for their physical growth to be immune from famine, and too old again to be able to catch-up after 1871. We conclude that the way a large famine shock translates into short-term
4
variations in stature is complex and depends on the duration of the shock itself as well as the general living conditions before and after the shock, which themselves interact with critical age windows for physiological growth.
Finally, in comparing survivors from the 1870 and 1871 birth cohorts to cohorts born before or after, we find that that the survivors display 10 to 20% higher adult mortality rates between 23 and 46 years of age. Hence, we cannot exclude that the rather tall survivors of these cohorts incurred other kinds of organ damage leading to higher mortality in later life. In that case, height stature would not be a good mediating variable for how early childhood shocks impact the chances of adult survival.
The remainder of the paper is organized as follows. Section 2 describes the historical context of the Paris siege and provides qualitative accounts of the famine. Section 3 presents our estimates of the mortality increase. Section 4 analyzes height stature developments in cohorts exposed to the famine. Section 5 presents suggestive evidence on adult mortality for the same cohorts. Section 6 concludes.
2/ Context: the two sieges and the famine episode
In a context of general tension in Europe and the growing power of German states and Prussia, the Prussian chancellor Otto von Bismark wrote a telegram (the Dépêche d’Ems) with the intention of humiliating the French and triggering them to declare war on Prussia. Falling into the trap, the French did so on July 19th, 1870. After brief preparations, Prussian troops and their German allies invaded France at the beginning of August. From that moment on, the war was a succession of French defeats; and a month after the beginning of the invasion, on September 2nd, the French Emperor, Napoleon the Third, surrendered in Sedan with a large chunk of the French army (Howard 2001; Wawro 2003). This swift defeat was completely unexpected by many in France, especially in the capital city of Paris, where a new government formed and prepared for defence as the Prussian army rushed toward the city. On September 14th – ten days after the news of the surrender reached Paris – all movement into and out of the city was forbidden. The next day Prussian armies cut all railway lines from the city, and two days later Paris was completely surrounded. The move was so swift and so unexpected that few people were able to flee the city, with most of them being among the wealthiest segments of the population. Contemporary reports estimate that at most 300,000 people escaped, out of 1.9 million (Sueur 1872 p. 9 for instance).
It was the beginning of a long and painful siege. The Prussians surrounded the city and blocked all exits, preventing both people and food from entering the city. Again, due to the swiftness of the defeat and the level of surprise in the face of it, very little preparation had been made for the siege. Everyone thought France would win the war or, at worst, that casualties would be limited to the border areas. As a result, food started to run short quite early. The winter turned particularly harsh due to low temperatures (which fell to as low as minus 10 degrees around Christmas), lack of heating (wood and coal soon became depleted), Prussian bombings (starting December 27th after 100 days of siege), and food shortages (by mid-December there was no more meat and bread, while wheat and potatoes were soon rationed). By the end of January, the city was overwhelmed and forced to surrender, negotiating a ceasefire for January 26th, 1871. The subsequent peace talks acknowledged the defeat of France in early March 1871.
But the end of the siege was not the end of difficulties for the city: a revolution – the Commune de Paris – soon broke out as a direct result of the defeat (Tombs 1999). The Paris Commune resulted in another siege, this time by French government forces (who were called “Versaillais”, because the temporary government was located in Versailles). That siege was even fiercer, as it had a strong class-related background and the Commune was viewed as a threat not only to the dominant French group but also to the whole European Bourgeoisie (Rougerie 2004). On the opposite side, the Commune remained for decades a symbol of the resistance of the

5
working class in its myths, its songs, and its heroes. That siege was much shorter but ended at the end of spring 1871 in a bloodbath known infamously as Semaine sanglante (“bloody week”).
All in all, the city was plagued by war for almost nine months, although in two phases. It was entirely shut down from mid-September 1870 to the end of January 1871, and then again besieged from mid-March to the end of May 1871. Though the two sieges were consecutive, they were very different in nature.
As contemporary testimonies make clear, food shortages and very harsh living conditions were characteristic of the Prussian siege and resulted in high mortality. For instance, Henryot (1871) describes in great detail the intake of animal calories over the course of the siege (first beef, then horse, then smoked fish, then whatever could be found). Already in the beginning of October, meat was rationed and city butcheries were organized. By early November, proper meat ran short and butchers started to sell dog, cat and sparrow; an open air rat market opened in front of the town hall. At the end of December, the two elephants in the zoo were shot down and sold. Henryot details the prices of various sources of meat at the end of December 1870: chicken and goose was very expensive, but dog, rat, sparrow and crow were also available. By mid-January, bread (already of poor quality) began to become scarce and various ways to supplement it were developed, which included adding ground bones from local catacombs. More indicative, perhaps, is the huge rise in the prices of basic food that has been widely documented by both contemporary accounts and historical works. Hence, in the three months between the end of September and the end of December, the price of a dozen eggs multiplied by 13, that of a measure of potatoes rose tenfold, and ham seven times. Henryot also describes people queuing day and night for food that was less and less nutritious and seemed less and less to actually have been food. Finally, he provides, as do others, various accounts of the high mortality: epidemics, especially smallpox, which claimed many lives; hospitals without heat by mid-December for lack of coal (herbal tea froze in the cups); and young children lacking milk.
The food constraint seems to have been much less important during the Commune, and neither contemporary accounts (Lissagaray 2004) nor historians mention any famine or additional deaths linked to the lack of food. The main reason for this is probably that the mobility constraint was less severe during the Commune, and there are numerous accounts of people getting in and out of the city during that period. Overall, there were far fewer food shortages, but more people were killed from fighting during the Commune than during the Prussian siege.
For our study, several issues matter here. First, the progression of the Prussian armies was so
swift that few people had the time to leave the city before the city became completely surrounded. This limits the selection effect from migration of those in the population who bore the burden of the siege. Second, the limited extension of the siege – both in space and in time – means that the population under study is quite limited but easy to identify. Last, the six-month siege undoubtedly resulted in a generalized famine that was the main cause of death, either directly or indirectly through diseases breaking out due to hunger; at the same time, war-related casualties remained very limited. Below, we will use “the siege” for the Prussian siege, “the Commune” for the second siege, and “the crisis” for the whole nine-month period.
3/ Mortality during the Siege
Total mortality in Paris
Paris was already quite a deadly place even in normal times, with mortality significantly higher than the rest of the country. By combining Paris statistical yearbooks and the two population censuses of 1866 and 1872, we are able to estimate mortality in the years preceding the siege: the total number of deaths in Paris is around 45,000, at a mortality rate of 24‰, with higher figures for cholera in the years 1865 and 1866. As is usual in past populations, mortality is concentrated among early ages, with children below one year accounting for almost a fifth of the deaths, and

6
children between one and ten another fifth. The mortality rates for children were approximately 150‰ for infants, 65‰ for 1- to 4-year-olds, and 10‰ for 5 to 9. This is in line with the results of Preston and van de Walle (1974) for the Paris region (Seine département, i.e., Paris city and surroundings), who estimate mortality quotients (probability to die) for the girls in the birth cohorts 1866-1870: 197‰ between 0 and 1, 206‰ between 1 and 5, and 49‰ between 5 and 10 (see also Appendix 1).
Official publications record deaths in 1870 up until the end of August. For January to August 1870, they report a little less than 40,000 deaths, which already puts the first eight months rather high in terms of mortality when compared to the previous years (for instance, 45,800 for the year 1869). For the siege, various accounts provide a figure for the total number of deaths, and sometimes break it down further by week, sex or age: Sueur (1872), Sheppard (1877), Du Camp (1881), and D'Alméras (1925). Sueur (1872) compiled various vital statistics to assess the number of deaths for each week from early September 1870 to mid-March 1871 (28 weeks). Other estimates are actually consistent with Sueur, probably because they rely on the same sources or borrow figures from one another. Sueur finds around 32,000 deaths between September and December, thus bringing to 72,000 the estimated total of deaths for 1870.
For 1871, published yearbooks point to around 30,000 deaths between June 1st and the end of the year. From the beginning of the year to March 14th, Sueur finds around 42,000 deaths. For the Commune period (mid-March to late May), mortality figures were not reported and it is therefore unclear whether mortality remained high or quickly returned to standard levels. We thereafter provide some suggestive evidence in favour of the latter possibility. To sum up, using the figures for 1869 to account for the missing two months and a half indicates that the number of deaths for the year 1871 reaches 83,000 in total. For the Semaine Sanglante (May 21st to 28th), the two different reports of général Appert for the army and of Lissagaray for the insurgents agree on the high figure of 17,000 deaths, while Tombs (1994) has a much lower figure of 10,000 deaths. To be sure, the figure of 90,000 deaths makes a lower bound for the year 1871.
Taken together, these figures reveal an impressive toll: given that the total number of deaths for an average year preceding the siege is around 45,000, we estimate 70,000 additional deaths for the two years 1870 and 1871, i.e., more than a 75% average annual increase. From Sueur, the first two months of the year 1871 counted 37,169 deaths, reaching four or five times the usual levels, and hence weighted at around 40% of the increase.
We may ask whether these very high mortality figures for 1870 and 1871 hide a variation in population. We would underestimate the mortality rate if a large number of inhabitants escaped from the city. In fact, if anything, the population did probably rise before the start of the Prussian siege: whereas part of the population from the wealthiest neighbourhoods managed to flee, inhabitants of nearby municipalities moved to the city to find shelter. Vacher (1871) quotes different censuses made by the military to organize the besieged population: one in October counts 2,116,000 inhabitants, another one the next month counts 2,095,700 inhabitants. In both cases, this represents a pretty large increase (16%) compared to the 1866 census figure of 1.8 million inhabitants; however, it is far from sufficient to absorb the mortality outburst. As for the population during the Commune period, it is harder to comprehend. As the city borders were much more porous than during the siege, a larger share of the wealthy had left the city. Merriman (2014) mentions that the population of Versailles increased by 200,000 when the government moved to that city. Finally, if we compare the 1866 and 1872 censuses, the total population increased only very slightly, from 1.8 to 1.85 million inhabitants. The variation is almost three times lower than the increase for the previous quinquennial period (1861-1866), pointing to a deficit of around 100,000 people that corresponds to excess mortality, reduced fertility, and outmigration.

7
Mortality and Fertility in the 19th district
First-hand data for the 19th district (“arrondissement”) of Paris allow us to go beyond these aggregate figures. We collected all individual death records for the year preceding the crisis (September 1869 to August 1870), for the crisis itself (September 1870 to May 1871), and for the following months (June 1870 to August 1871). In addition, we collected a 50% sample for the subsequent two years (September 1871 to August 1873). During the Commune period, deaths were still recorded by the administration; however, due to disarray in public services, they might not be as reliable as the rest. After the squash of the Commune, these records were treated as illegitimate and crossed off ("bâtonné" was the formal word used in French), even though they remained readable and we can have them inputted.
In the 1866 population census, the 19th district counted 88,930 inhabitants, representing 4.9% of the total Paris population – hence around one–twentieth, given that Paris counted 20 districts since 1860. Figure 1 shows that the monthly variation of death records in that district is very similar to that of Paris as a whole. Furthermore, the effect of the crisis is rather short-lived, with mortality higher than normal between October 1870 and May 1871 (and much higher in the winter) but returning to standard levels as early as June 1871. We can roughly extrapolate the total number of deaths in the 19th district for 1869 from the four last months of that year we recorded, meaning around 1,200 deaths in a year. In that case, 1870 is above 1869 by 61% (1,937) and above 1871 by 88% (2,273); hence, again, a 75% average increase in mortality.
Figure 1 - Deaths in each month, 19th district and Paris
Coverage: deaths in the 19th arrondissement and in Paris as a whole. Source: Vital records of the 19th arrondissement. Bulletin de Statistique Municipale, various years. Note: Data for Paris as a whole only cover September 1870 to December 1871 and are missing for the Commune period (March to May 1871).
The siege and the Commune also resulted in lower fertility. Figure 2 shows that recorded births dropped between March 1871 and February 1872, meaning a lack of conceptions since the beginning of the siege in September 1870 up until the end of the Commune, the largest deficit being observed in the worst months of the siege (December to February). Surprisingly, no catch-up in fertility is observed in the months afterwards, not even in 1872 or 1873.
0
4000
8000
12000
16000
20000
0
100
200
300
400
500
600
700
800
900
1000
juil.-69 mai-70 mars-71 janv.-72 oct.-72 août-73
De
ath
s fo
r P
aris
as
a w
ho
le
De
ath
s fo
r th
e 1
9th
Dis
tric
t
Month of Death
19th district Paris

8
Figure 2 - Monthly births in 19th district
Coverage: Total births in the 19th arrondissement. Source: Vital records of the 19th arrondissement. Bulletin de Statistique Municipale, various years. Note: missing data for the months March to May 1871 have been linearly extrapolated.
Individual age and place of birth were collected only for men, as we wish to relate the age profile of mortality to height developments across birth cohorts as observed from military data. We can nonetheless take advantage of male death records to study in more detail mortality during the crisis. We distinguish four periods: the siege (September 1870 - February 1871); the Commune (March-May 1871); and two post-crisis periods, from September 1871 to May 1872 and from September 1872 to May 1873. We consider mortality between September 1869 to May 1870 as a benchmark, and from it we compute relative mortality as the ratio of the recorded number of deaths in a given month to the number of deaths in the corresponding benchmark month.
Table 1 - Relative number of deaths during and after the crisis, compared to before it.
Age at death Siege Commune 1871-72 1872-73
Up to 1 month(a) 2.53 0.85 0.83 0.98
1 to 11 months 2.36 1.08 0.66 0.79
12 to 23 months 2.16 2.00 0.58 0.47
2 to 4 years old 3.39 1.51 0.99 0.59
5 to 19 years old 2.57 1.93 0.40 0.74
20 to 39 years old 3.26 2.54 0.53 0.75
40 to 59 years old 2.35 1.72 0.72 0.67
60 years old or more 2.77 2.04 0.77 0.81
Overall 2.61 1.66 0.70 0.74
Coverage: Deaths of men in the 19th arrondissement. Source: Vital records of the 19th arrondissement. Reading: There are on average 2.36 times more deaths of male children 1 to 11 months old in the months of the siege period compared with September 1869 to February 1870. (a): including still births.
According to this indicator, excess mortality was very high during the siege. The total number
of deaths is more than twice (2.61) the benchmark level and rather evenly distributed across ages, with figures ranging from 2.16 to 3.39. After the siege, as many already died, it is expected that absolute levels of mortality would decline and even reverse when contrasted with the benchmark.
50
100
150
200
250
300
350
400
août-67 sept.-68 oct.-69 nov.-70 janv.-72 févr.-73 mars-74
Nu
mb
er
of
Bir
ths
Month of Birth

9
During the Commune, all ratios fall when compared to the siege, with neonatal and infant deaths especially returning to pre-crisis levels. The highest relative mortality is observed for men 20 to 39 years old, even though we do not record deaths from the “bloody week” (Semaine Sanglante). In the two post-crisis sub-periods, the number of deaths falls by more than 25% but, again, some of those who would have died at that time under standard conditions happened to have died earlier. The figures are pretty much the same when restricted to men born in Paris. Unfortunately, death records do not mention the district of birth; hence, we cannot restrict the analysis to men born in the 19th district.
To get a better sense of excess mortality, especially at early ages, we need to estimate mortality
rates for the birth cohorts who were the most exposed to the crisis. We first compute a pre-crisis benchmark for under-five mortality quotients in the 19th district, and we do so using individual death records data for the 1865 to 1869 cohorts. As we only collected death records from September 1869, we need to make a few assumptions (see Appendix A1). The estimates we obtain are already high: infant mortality reaches 25% and under-five mortality 37.2%. Again, they are consistent with Preston and Van de Walle (1974) for girls’ mortality in Paris 1866-1869. For mortality between 5 and 10, we follow these latter authors.
For each cohort between 1866 and 1871, we extract the total number of deaths of children born in Paris for the age window that is fully observed in our database from September 1869 to August 1873: 4 to 6 years old for the 1866 cohort, 3 to 5 years old for 1867, 2 to 4 years old for 1868, 1 to 3 years old for 1869, 0 to 2 years old for 1870, and only 0 to 1 years old for 1871. We also extract the number of deaths for 8-month cohorts (January to August) so as to get one additional age interval: the deaths of children born in Paris between January and August 1866 are observed between 6 and 7, and so on and so forth; this also allows us to estimate infant mortality for the birth year 1872. We then estimate the number of survivors at the beginning of each age window by applying the benchmark mortality quotients to the total number of births in the 19th arrondissement for each cohort. This amounts to making one of two assumptions: either that children born in Paris who died between 0 and 7 years old in the 19th district were, for the vast majority, also born in that district; or that there were few differences in mortality between out-migrants and in-migrants while also zero net migration between the 19th district and the rest of Paris at low ages.
Table 2 reports the estimates of infant and under-five mortality quotients for the birth cohorts 1866 to 1872. Let's first note that estimated infant mortality (1q0) in 1872 is very close to the pre-crisis benchmark level, so it therefore seems that children born in 1872 were already enjoying post-crisis living conditions. Children born in 1866 and 1867 seem to have suffered from a slight increase in mortality between 3 and 5, but the first cohort really impacted by the famine is that of 1868. For those born in 1868, 1- to 5-year-old mortality climbs to 25%, against 16% for the pre-crisis estimate. In particular, the mortality quotient between 2 and 3 years of age is more than tripled (from 3% to 10%, not reported).
Table 2 - Infant and under-five mortality quotients for the 1866-72 cohorts (in %)
Mortality Pre-crisis 1866 1867 1868 1869 1870 1871 1872
1q0 25.2 25.2 25.2 25.2 25.2 36.5 32.2 24.1
4q1 16.5 17.1 19.8 25.1 32.0 17.5 14.4 16.5
5q0 37.5 38.0 40.0 44.0 49.2 47.6 42.0 36.6
Source: Vital records of the 19th arrondissement. Note: Estimated from death records in the 19th arrondissement, see text and Appendix A1.
In the birth cohort 1869, very few children were actually exposed to the crisis before age 1; thus, the infant mortality quotient (1q0) is safely estimated by the pre-crisis benchmark. For the children born in Paris in 1869, mortality then peaks between 1 and 2 years old (1q1=22%) and
10
remains high between 2 and 3 (8%), resulting in an estimate as high as 32% for mortality between 1 and 5, which is twice the benchmark level.
For the cohort born in 1870, infant mortality is of course the highest (36.5%). However, and perhaps surprisingly, mortality at later ages falls to standard levels, such that under-five mortality ends up being slightly lower than in the former cohort (47.6 compared to 49.2%). This suggests that the famine was short-lived enough that those who survived the siege were saved.
Children born in 1871 were less numerous, due to fertility decline, and were mainly exposed to the siege when in utero. Their infant mortality is higher than the 1869 or 1872 cohorts, but their mortality after one year old is standard, as living conditions in 1872 were back to normal. In the end, under-five mortality for the 1871 cohort lies in between the levels for the 1870 and the 1872 cohorts.
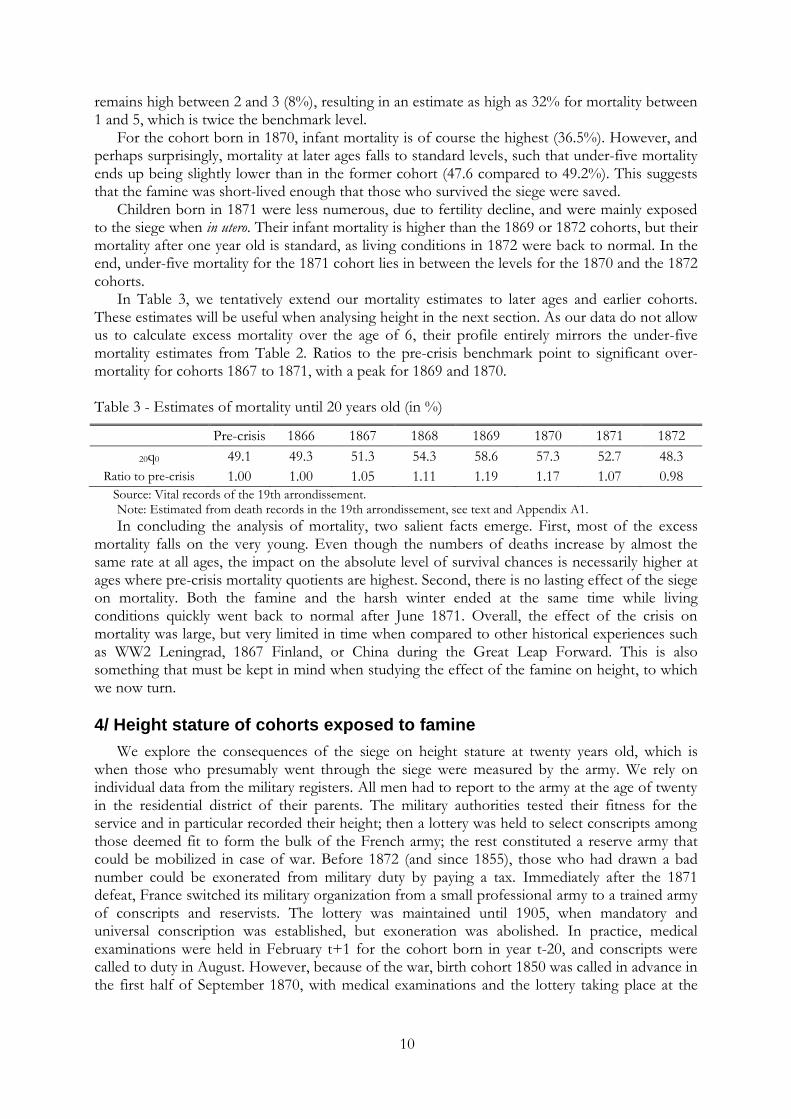
In Table 3, we tentatively extend our mortality estimates to later ages and earlier cohorts. These estimates will be useful when analysing height in the next section. As our data do not allow us to calculate excess mortality over the age of 6, their profile entirely mirrors the under-five mortality estimates from Table 2. Ratios to the pre-crisis benchmark point to significant over-mortality for cohorts 1867 to 1871, with a peak for 1869 and 1870.
Table 3 - Estimates of mortality until 20 years old (in %)
Pre-crisis 1866 1867 1868 1869 1870 1871 1872
20q0 49.1 49.3 51.3 54.3 58.6 57.3 52.7 48.3
Ratio to pre-crisis 1.00 1.00 1.05 1.11 1.19 1.17 1.07 0.98
Source: Vital records of the 19th arrondissement. Note: Estimated from death records in the 19th arrondissement, see text and Appendix A1.
In concluding the analysis of mortality, two salient facts emerge. First, most of the excess mortality falls on the very young. Even though the numbers of deaths increase by almost the same rate at all ages, the impact on the absolute level of survival chances is necessarily higher at ages where pre-crisis mortality quotients are highest. Second, there is no lasting effect of the siege on mortality. Both the famine and the harsh winter ended at the same time while living conditions quickly went back to normal after June 1871. Overall, the effect of the crisis on mortality was large, but very limited in time when compared to other historical experiences such as WW2 Leningrad, 1867 Finland, or China during the Great Leap Forward. This is also something that must be kept in mind when studying the effect of the famine on height, to which we now turn.
4/ Height stature of cohorts exposed to famine
We explore the consequences of the siege on height stature at twenty years old, which is when those who presumably went through the siege were measured by the army. We rely on individual data from the military registers. All men had to report to the army at the age of twenty in the residential district of their parents. The military authorities tested their fitness for the service and in particular recorded their height; then a lottery was held to select conscripts among those deemed fit to form the bulk of the French army; the rest constituted a reserve army that could be mobilized in case of war. Before 1872 (and since 1855), those who had drawn a bad number could be exonerated from military duty by paying a tax. Immediately after the 1871 defeat, France switched its military organization from a small professional army to a trained army of conscripts and reservists. The lottery was maintained until 1905, when mandatory and universal conscription was established, but exoneration was abolished. In practice, medical examinations were held in February t+1 for the cohort born in year t-20, and conscripts were called to duty in August. However, because of the war, birth cohort 1850 was called in advance in the first half of September 1870, with medical examinations and the lottery taking place at the

11
same time. Birth cohort 1851 was also called in advance in 1871, but only in some parts of France and not in Paris, where it was examined and called in 1872.
To explore the effects of the crisis on height, we collected individual data on all cohorts enlisted in the 19th district that were born between 1850 (aged 20 at the time of the siege) and 1880 (born 10 years after the siege). Of course, we could not collect data for all Paris, as there were 10,000 conscripts each year; likewise, neither could we search for all 19th district natives who had migrated elsewhere in France before age 20. For comparison purposes, we collected the same data from military registers in Lyon. At that time, Lyon was France’s second largest city and, just like Paris, it was quite industrialized. To make the comparison as close as possible, we focus on a working-class district, the 4th district (it was established in 1852 in the north of the city, replacing what was previously an independent municipality, La Croix Rousse). We consider Lyon to have been immune from the war and the crisis; although it might have suffered indirect effects from the country’s state of war, there was nothing comparable to the great famine that struck Paris. The Prussian army did not go that far south, so Lyon wasn’t directly affected by the war. There were two attempts there in September 1870 and March 1871 to launch a Commune (revolutionary uprising related to the events in Paris). Yet, despite being led by a key anarchist figure (Mikhail Bakounine), the attempts were stopped before they could take root.
Last, we also exploit aggregated height data for recruits residing in the Paris region (“département de la Seine”), which we compare to our first-hand data on the 19th district natives as well as to other counties in metropolitan France.
Selection linked to out-migration
We observe only people whose parents were living in the 19th district when they were 20 years old. Among those, we can credibly assume that the great majority of recruits who were born in Paris were exposed to the siege. Indeed, as we already argued, few people were able to leave Paris just before the beginning of the siege, and these few were mainly from upper social classes, whereas the 19th district was a working class neighbourhood.
Post-war out-migration raises a more difficult issue. Among recruits born between 1852 and 1880 and drafted in the 19th district, 64% were born in Seine county and 63% in Paris city or bordering municipalities. These shares are lower in the early years because of large inflows of refugees from Alsace-Lorraine after 1871. Furthermore, the borders of Paris city changed in 1860, and many recruits born before 1860 were not able to report their district of birth within Paris. So, we recode as natives from Paris recruits born in the municipalities which were almost entirely absorbed after 1860: Bercy, Grenelle, Vaugirard, Auteuil, Passy, Batignolles, La Chapelle, Montmartre, La Villette, Belleville, and Charonne. The 19th district itself did not exist before 1860 and was formed as a merger of La Villette and the northern part of Belleville. We also treat Ivry, Gentilly, Montrouge, and Saint-Mandé as Paris city, because the largest part of these municipalities was absorbed to form the 12th, 13th and 14th districts.
For cohorts enlisted in the 19th district and born after 1860, 31% were born there (in the 19th district) while another 21% were born in neighbouring districts or municipalities (10th, 11th, 18th and 20th districts, Aubervilliers, les Lilas, Pantin, or Pré-Saint-Gervais); this shows intense short-distance migration. Using the mortality quotients of Table 3 as well as our data on births, we estimate that between 30 and 40% of 19th district natives having survived until 20 years old are listed at this age in the 19th district. These figures point to very high out-migration between 0 and 20 years old, most often towards other districts of Paris or to surrounding suburban areas. We do not find that out-migration rates display any specific variation across years of birth; therefore, we believe that selection linked to migration should not be of great concern.
In order to avoid selection linked to the capacity of reporting birth district and also in order to maximize sample size, we choose to focus on a sample of “greater Paris” natives, including all bordering municipalities of Paris. In all cases, these municipalities were also subject to the Prussian siege and experienced the same dreadful living conditions as Paris. To sum up, we

12
analyse height stature on a sample of 20-year-old males enlisted in the 19th district and born in Paris or its immediate surroundings. In fact, 95% of these recruits were actually born within the 1860 borders of urban Paris. Furthermore, Pearson’s correlation coefficient between mean height of 19th district natives and mean height of natives from greater Paris is 0.86.
Height developments of Paris natives from the 19th district
We start by computing average height at 20 years old for conscripts listed in the 19th district and born in greater Paris between 1850 and 1880. Again, we have cohorts who were old enough during the 1870-1871 crisis to have been affected very little and cohorts born after. Figure 3 shows the variation of average stature across birth years. Mean height exhibits a large range of variation, reaching a minimum of 163.6 cm for the birth cohort 1862 and a maximum of 166.9 cm for the birth cohort 1874.
Among the 1850 to 1880 cohorts, the shortest conscripts are those born between 1860 and 1864, i.e., those who were between 6 and 10 years old in 1870. In contrast, the 1868 to 1871 cohorts, who were afflicted the most by famine-driven mortality at their young ages (see Tables 2 and 3 above), appear taller on average than earlier cohorts, and only slightly shorter than cohorts born after the crisis, i.e., from 1872 to 1880. If living conditions are improving over time, this ordering is expected, irrespectively of epidemiological or nutritional shocks. Indeed, observed mean heights for the 1865 to 1871 cohorts do not significantly deviate from a linear time trend. In contrast, the 1860-1864 cohorts lie significantly below the trend. The same results hold if we adjust a cubic polynomial time trend instead.
Figure 3 - Mean height of conscripts from 19th district born in wide Paris
Source: Conscription records of the 19th district of Paris. Coverage: Draft of 19th district; conscripts born in Paris city and neighbouring municipalities
Decisions on fitness exhibit the same time patterns: less than 70% of potential recruits are declared fit in the 1860-1863 cohorts, whereas the proportion of fit individuals always lies above 75% after birth year 1865, and even above 80% after 1872 (Figure 4). Fitness for military service was assessed after the medical examination, when height was measured and unfit individuals could be either adjourned, allocated to auxiliary services that did not require good physical health, or simply exempted. Figure 4 shows that the proportion of fit individuals each year is rather well correlated with height stature (correlation coefficient of 0.57).
163
164
165
166
167
1850 1855 1860 1865 1870 1875 1880
Me
an H
eig
ht
Year of Birth

13
Figure 4 - Mean height and proportion of fit recruits
Source: Conscription records of the 19th district of Paris. Coverage: Draft of 19th district; conscripts born in Paris city and neighbouring municipalities
As a comparison, we can estimate mean height for recruits in Lyon’s 4th district. This enables us to test if the large variations observed for the Parisian conscripts are specific to them or related to broader French evolutions. In contrast with Paris, mean height of recruits from Lyon exhibits a narrower range of variation and seems to oscillate around a steady-state level at 164.5 centimetres (Figure 5). The two series are little correlated with each other: Pearson's correlation coefficient is equal to 0.33 and 0.20 when linearly detrended. This suggests that Paris height developments do not capture nationwide shocks that apply to other comparable urban areas.
Figure 5 - Mean height in Paris 19th and Lyon 4th
Source: Conscription records of the 19th district of Paris and of the 4th district of Lyon. Coverage: Drafts of 19th and 4th district, Paris and Lyon natives, birth year from 1855 to 1875.
We then implement statistical tests based on the deviations to the time trends of cohorts born in Paris between 1860 and 1871, both for the fitness decision and the height distribution. It should be noted that our military data are exhaustive samples of 20-year-old conscripts. As a result, reported standard errors do not come out of a sampling model but should be thought of as stemming from the stochastic processes that make birth cohorts’ mean height, as selected by
0,65
0,7
0,75
0,8
0,85
163
164
165
166
167
1850 1855 1860 1865 1870 1875 1880
Pro
po
rtio
n o
f Fi
t
Me
an H
eig
ht
Year of Birth
Mean Height Proportion of fit
163
164
165
166
167
1855 1860 1865 1870 1875
Me
an H
eig
ht
Year of Birth
Born in Lyon Born in Greater Paris

14
“Nature” or “History”, deviate from deterministic trends. We compute regression estimates and standard errors on mean height data for a given place and a given birth year, weighted by the square root of number of individuals in each place-year. Our target cohorts were between 0 and 10 years old or even in the womb at the time of the siege. We believe it is safe to assume that older cohorts were little affected by the siege (and we actually checked that birth years 1859 and 1858 came out with small and insignificant coefficients).
More specifically, we estimate the very simple following equation:
(1)
For the cohort born in year t, is either the proportion of fit individuals, the overall mean height, the mean height of the shortest 25% (1st quartile) or of the tallest 25% (4th quartile), and
is a function of t. Table 4 reports estimates obtained with a linear time trend ( ). We also estimated a cubic polynomial form (
), but it makes
little difference (results not shown). In contrast with Figure 3, only non-target cohorts (i.e., 1847 to 1859 and 1872 to 1880) contribute to the estimation of the time trend. This trend is assumed to provide a counterfactual mean height (absent the siege), to which observed values can be compared. Table 4 – Mean height of 1860 to 1871 birth cohorts: deviations from time trend
Proportion
Fit (%) Mean height
Mean height 1st quartile
Mean height 4th quartile
p-value K-S test(a)
compared to 1872
p-value K-S test(a)
compared to 1872-75
(1) (2) (3) (4) (5) (6)
1860 -8.8 ** (3.2) -1.2*** (.39) -1.3** (.56) -1.5** (.62) 0.000 0.000
1861 -10.9*** (3.1) -.71* (.39) -1.6** (.56) -.22 (.66) 0.007 0.000
1862 -9.2** (3.2) -2.2*** (.39) -2.0*** (.53) -2.0*** (.67) 0.000 0.000
1863 -12.7*** (3.2) -1.6*** (.39) -1.3** (.54) -2.2*** (.62) 0.000 0.000
1864 -0.6 (3.3) -.95** (.41) -.77 (.56) -1.2* (.66) 0.013 0.000
1865 -7.4** (3.1) -.27 (.39) -1.2* (.56) -.56 (.68) 0.201 0.063
1866 +0.3 (3.1) +.24 (.38) +.67 (.54) -.09 (.63) 0.981 0.459
1867 -0.8 (3.1) +.57 (.38) +1.2** (.51) +.82 (.66) 0.611 0.993
1868 -3.3 (3.3) -.09 (.41) -.06 (.57) -.51 (.66) 0.942 0.772
1869 +1.6 (3.2) +.06 (.39) +.15 (.54) +.22 (.63) 1.000 0.596
1870 -2.4 (3.2) -.06 (.39) -.18 (.55) -.28 (.65) 0.572 0.097
1871 -1.5 (3.4) -.57 (.42) -.52 (.57) -.20 (.67) 0.203 0.017
Time trend +.22*** (.07) +.05*** (.01) +.05*** (.01) +.02* (.01) - -
N 31 7,241(b) 9,296(b)
Source: Conscription records of the 19th district of Paris. Coverage: Draft of 19th district; conscripts born in Paris city and neighbouring municipalities (see footnote 9) Notes: In columns 1 to 4, observations are weighted by square root of number of individuals in each birthplace-birthyear (and in the corresponding quartile for quartile means). (a): Kolmogorov-Smirnov test for the equality of the height distribution for the birth year in the row with the 1872 birth year height distribution. The p-value is the risk of mistakenly rejecting equality. (b): Total number of observations for birth cohorts 1860 to 1872 (col. 5) or 1860 to 1875 (col. 6). Each individual test actually relies on the observations for a given birth year (n=549 on average) and the observations for the comparison group, either birth year 1872 (n=670) or 1872-1875 pooled (n=2,725). Standard errors in parentheses (see footnote 10). *: p<.10; **: p<.05; ***: p<.01

15
Regarding the proportion of fit, 1866 to 1871 birth years do not significantly deviate from time trends (column 1). Likewise, no significant anomaly is found for the adult height of conscripts who were under five years old at the time of the siege (columns 2 to 4). For individuals born in 1871 and who were for the most part in their mothers’ wombs during the siege, estimates point to a height deficit of around 5 millimetres on average, mainly at the bottom of the distribution (first quartile of height, column 3); however, this is not statistically significant.
Column (5) reports Kolmogorov-Smirnov tests for the equality of each birth year height distribution in the 1872 post-crisis distribution. Again, the height distribution for years 1865 to 1871 cannot be distinguished from that of 1872. However, when instead taking 1872-1875 cohorts pooled together as a comparison group, one cannot exclude that 1870 and especially 1871 cumulative distributions for height stature lie slightly above those of post-crisis birth years.
In all cases, estimates suggest that cohorts born between 1860 and 1864 lie significantly below the time trend: either for fitness, with 8 to 12 percentage points of those who were more unfit (excepting 1864); or for height, with a height deficit of more than one centimetre. The 1862 and 1863 cohorts are especially affected. Height distributions for these years are very significantly different from 1872, if only for the mean.
Could the apparent absence of a height deficit for the youngest cohorts be due to selective mortality or selective fertility? Should we attribute the height losses of the oldest cohorts to the impact of siege-induced famine? Let us successively address those two questions.
Selection linked to over-mortality and under-fertility
If famine disproportionately kills children whose physical growth potential is lowest, survivors will appear to be taller than they would have in the absence of over-mortality. Likewise, we may consider that fertility patterns for 1871 are disproportionately biased against children with the lowest growth potential, whether it be for biological or social reasons; for instance, the poorest families may refrain from having babies (see for instance the results for the Dutch Hunger Winter in Hart 1993). If this is the case, then born individuals will appear to be taller than they would have in a standard year. Hence, selective mortality or fertility could hide any indication that even the survivors’ height was impacted (e.g., Bozzoli, Deaton, and Quintana-Domeque 2009).
Selective mortality or fertility should skew height distributions to the left by decreasing the statistical weight of the shortest individuals. Meng and Qian (2009) propose examining quantiles of the height distribution in order to detect selection. In the presence of selection based on height potential, the bottom quantiles of the adult height distribution will be shifted upward; and the top quantiles will also increase, although to a lesser extent. Then, if the nutritional shock is uniform across the height distribution, it should better reveal itself in the top quantiles. This is not what is found in Table 4 (see columns 3 and 4): deviations from the trend are no different when looking at first or fourth quartiles; the same is true when comparing instead first and tenth deciles (not shown). Figure 6 reports mean height evolutions in the first and fourth quartiles; both seem very much parallel all along the three decades of analysis. Likewise, Kolmogorov-Smirnov tests (Table 4 - column 5) show that height distributions in birth years 1868 to 1870 are not more skewed than in 1872. Yet, if famine impact on survivors is also highest in bottom height quantiles while mitigated in top quantiles, then its effect would be to skew the height distribution back to the right, such that the mortality effect and the scarring effect of famine could cancel each other out and result in blurred height distributions, which would be indistinguishable from pre- or post-crisis distributions.

16
Figure 6 - Mean height in 1st and 4th quartiles
Source: Conscription records of the 19th district of Paris. Coverage: Draft of 19th district; conscripts born in Paris city and neighbouring municipalities (see footnote 9)
Lastly, in the spirit of non-parametric bounds for treatment variables, as elaborated on by Lee
(2009), we ask whether extreme assumptions on the extent of selection by mortality could generate the observed variations in height. The computation of a lower bound for height amounts to assuming that over-mortality killed all the children that would have ended up being the shortest at adult ages. Then, under monotonicity conditions (children who die in low mortality periods would also die when mortality is high, and vice-versa for survivors), when mortality changes between two birth cohorts, a lower bound for the counterfactual variation in the height of 'always survivors' is obtained by computing a truncated mean of the height variable in the birth year with the lowest mortality. More formally, the lower bound for the mean height
of always survivors in a year τ of over-mortality, compared to benchmark year , is:
(2)
where is the qth percentile of height in , q being the increase in mortality between τ and
, in percentage points. Again we choose 1872 as the post-crisis benchmark year and use estimated mortality
quotients between 0 and 20 years old from Table 3 to compute a lower bound for counterfactual mean height, absent over-mortality or under-fertility, for each birth year before 1872.
170
171
172
173
174
175
176
156
157
158
159
160
1850 1855 1860 1865 1870 1875 1880
Me
an F
ou
rth
Qu
arti
le
Me
an F
irst
Qu
arti
le
Year of Birth
Mean First Quartile Mean Fourth Quartile

17
Figure 7 – Lower bounds for birth year effects on height for always survivors and always born
Source: Conscription records of the 19th district of Paris. Coverage: Draft of 19th district; conscripts born in Paris city and neighbouring municipalities (see footnote 9) Note: 1872 is taken as the benchmark year for standard mortality. The dashed line displays how mean height
evolution could have appeared “at its worst” in the absence of over-mortality, particularly if mortality maximally selects the shortest and if the bottom of 1872 height distribution is a good estimate for the missing part of each year. The dotted line considers 1871 under-fertility, assuming that children not born were also the shortest. Vertical bars are for 1868 and 1871.
This computation suggests that selective mortality could indeed account for the rather high
mean height of birth cohorts 1868-1870, as lower bounds corresponding to maximal selection always lie below observed values by more than one centimetre. In contrast, for the cohorts 1865-1867 (i.e., for children between 3 to 5 years during the siege), over-mortality is not high enough to have any impact. These lower bounds are, however, obtained under the very extreme assumption that only the shortest die. If instead we assume that survival chances decrease smoothly from the tallest to the shortest, for instance linearly, simulations (available on request) show that selection then has a very limited impact on height variations. For instance, over-mortality in 1869 compared to 1872 reaches 10.4 percentage points (see Table 3). If we assume that these 10.4 points are linearly distributed across the 1872 height distribution such that the tallest always survives and the shortest is 17.6% likely to die, then the spurious height gain associated with over-mortality is estimated at only 0.15 cm. When running the same simulation for 1871, where both over-mortality and under-fertility are taken into account, a 0.22 cm difference is produced. This correction is enough for the deviation from trend for this year to reach a statistically significant level in Table 4 estimates, around -0.75 cm.
This, added to the absence of significant impact on quantiles, causes us to deem it unlikely that there was a very significant effect on the height of those who were at early ages during the siege and survived. Just as we argued for the preceding cohorts 1865-1867, we believe that most children in those early-age cohorts were able to catch-up in physical growth in the aftermath of the siege. But we cannot definitively exclude that selection effects are able to blur the famine impact if it is limited enough in magnitude; this is especially true of the very youngest in the 1870 and 1871 birth cohorts.
The 1860-1864 height deficit
The last issue concerning the evolution of height for the birth cohorts who went through the siege is the remarkable drop experienced by the 1860-1864 cohorts, who were between 6 and 10 years old at the time of the siege. Were they young enough to be affected by famine but too old
162
163
164
165
166
167
1850 1855 1860 1865 1870 1875 1880
Me
an H
eig
ht
Year of BirthMean Height 1871 underfertility Lower bound without overmortality

18
to catch up? Or can the large height deficit observed for them be attributed to other determinants – whether nationwide or local – or even merely to measurement errors?
Until now, we have only considered conscripts listed in the 19th district and born in greater Paris. But we also have many conscripts listed in the 19th district and who were born elsewhere in France. We know they arrived in Paris before 20 years old, but we don’t know exactly at what age. If we are to believe what little evidence is available, the share of migrants increases linearly by age, from around 3% of the total population before 1 year old to 65% at 20 years old. This is what we get from mortality statistics not only in the 1870s (Bulletins de statistique municipale, various years), but also from the 1901 census that details Paris denizens by 5-year age groups and place of birth. Both datasets are limited and not exactly in the time period we’d like to have them, but they are consistent and point to a regular arrival of migrants between birth and 20 years old.
In addition, we can distinguish from among the non-native recruits that migrants from “Alsace-Lorraine” comprised 25% of migrants to the 19th district over the period. They almost certainly arrived in Paris after 1871 while fleeing Germany’s annexation of their region, which was a direct consequence of the war. Their share is actually highest in the 1851 birth cohort (drafted in 1871) and then gradually declines.
In Figure 8, we look at whether the 1860-1864 height losses are also observed for migrants to Paris who were also recruited and measured in the 19th district. Conscripts born outside of Paris start out taller on average, but then Paris natives gradually catch up. Yet, when considering migrants from all places except Alsace-Lorraine, the correlation coefficient with mean height of Paris natives reaches 0.68, or 0.63 when linearly de-trended. It is surprising, then, that the pattern for those born in greater Paris and those born far away is rather close. This is certainly due to the fact that, indeed, many of those born outside of Paris grew up there.
However, that correlation might also – even partially – stem from common measurement errors associated with the 19th district recruitment bureau. Nevertheless, no correlation is found between the Alsace-Lorraine mean height series and the two others. Furthermore, we incidentally collected additional data on recruits born in Paris and examined for service in the 3rd and 13th districts of Paris (for the years 1860, 1868, 1870 and 1873), and they suggest that the 19th district data pretty well mirror the experience of poor neighbourhoods inside Paris. In particular, the difference in mean height between the 1860 birth cohort and the three others is very similar (see Appendix 2 for details). We conclude that the 1860-1864 cohorts’ height anomaly is not due to measurement error.
As can be seen in Figure 8, this height deficit is also observed for conscripts born outside of Paris, although it is between half and two-thirds that of Paris natives. The magnitude of attenuation is consistent with a rather large share of non-native children having migrated to Paris before they reached 6 or 10. Many of them should indeed have arrived when their parents were in their twenties or thirties. Consistently enough, migrants from Alsace-Lorraine, who for the great majority arrived in Paris after 1871, do not display any height deficit in birth years 1860 to 1864.
Other explanations may be advanced at a broader level. For instance, 1859 and 1861 were years of crop failure in France; however, in the following years (i.e., 1862 onward), agricultural output resumed at high levels (Lévy-Leboyer 1968). Along the same lines, 1865 and 1866 were cholera years that resulted in a general increase in mortality, although to a much lesser extent than previous episodes in 1832, 1849 and 1854 (Bourdelais, Demonet, and Raulot 1978); furthermore, cholera spells are rather short and not known to have a long-term impact on height. In the end, we find it difficult to attribute the 1860-1864 height losses to any determinants other than the siege.
After 1866, living conditions in Paris quickly improved, causing Paris natives to catch up in height with migrants. If instead of a linear time trend we estimate a linear spline with a kink-point at birth year 1865, we conclude that mean height gains show up only in the second period, at a high rate of 0.11 cm per year. Appendix 3 shows that same feature is reflected in Seine county

19
data (Appendix 3). According to Lévy-Leboyer, the growth of French industry is high between 1865 and 1869, reaching an annual average rate of 3%, which is twice the rate for 1860-1865. Cholera did not come back. Additionally, the Dhuis aqueduct was completed in 1865 and began supplying Paris city with clean water, even though buildings were only gradually connected to the new water network.
Figure 8 - Mean height of conscripts born outside Paris
Source: Conscription records of the 19th district of Paris. Coverage: Draft of 19th district. Note: Vertical bars are for 1860 and 1864. Alsace-Lorraine corresponds to the 4 following départements: Meurthe,
Moselle, Haut Rhin and Bas Rhin, all of which were either entirely or partially annexed by Germany in 1871.
At the end of the day, a plausible story concerning the 1860-1864 birth cohorts could be the
following. All cohorts born before 1866 were exposed to bad health conditions at early ages, whereas living conditions strongly improved after this date. This makes cohorts born before 1866 pretty much shorter than cohorts born afterwards. Among those unlucky cohorts, children born between 1860 and 1864 were young and frail enough to be affected by famine at ages 6 to 10, especially when living in a poor urban neighbourhood like the 19th district. In contrast with younger cohorts, they were too old both to benefit from post-1866 improvements and to catch-up in height after 1872. This story is consistent with the attenuated height deficit for cohorts born outside of Paris but living in the 19th district at age 20: around half of them had already migrated to Paris between ages 6 and 10 at the time of the siege. It is also consistent with the absence of the 1860-64 effect for the Alsace-Lorraine migrants who arrived in Paris after 1871.
The main challenge to this narrative actually comes from the fact that the 1860-1864 cohorts’ height deficit is not found in county-level data for the Paris region (Appendix 3). However, this discrepancy could be explained by the fact that the Paris region data include a lot of migrants and, furthermore, they mix up the poor and rich neighbourhoods, whereas the 6- to 10-year-old shock would only hold in sufficiently poor contexts.
5/ Adult mortality between 20 and 45 years of age after the siege
After the defeat, Republican France imported the Prussian military model and, in particular, introduced reserve time. Starting in 1872, a typical conscript would be examined at 20 years old, sent into active military service for three years and then put in the reserve army until he reached
163
164
165
166
167
168
169
1850 1855 1860 1865 1870 1875 1880
Me
an H
eig
ht
Year of Birth
Born Outside (except A.-L.) Born in Alsace-Lorraine Born in Greater Paris

20
46. As the army wanted to know the whereabouts of all reservists, they were asked to declare changes in residence and, in addition, city mayors were required to report deaths. In practice, this means we can observe conscripts until they left the army (at 46 years old), died or were discharged for medical reasons, whatever happened first.
This allows us to look at adult mortality in relation to age at the time of the siege. Indeed famines are a primary case for observing later age effects on mortality, for instance, in the cases of the Dutch 1846-47 Potato famine (Lindeboom, Portrait, and van den Berg 2010), the 1866-68 Finnish famine (Kannisto, Christensen, and Vaupel 1997; Doblhammer, van den Berg, and Lumey 2013), and the Great Leap Forward Famine (Song 2009). In practice we compute mortality rates by birth cohort, controlling for time at risk. Figure 9 plots death rates of conscripts born in Paris between the end of active military service (23 years old for the average conscript) and the end of the reserve period (46 years old). Mortality is higher for the 1870 and 1871 cohorts, with a death rate of around 18‰ as compared with 15‰ for those born in the 1860s. This over-mortality at adult age correlates with that of child age, especially for the 1870 cohort.
Figure 9 - Adult mortality rate by cohort of birth
Source: Conscription records of the 19th district of Paris. Coverage: Draft of 19th district, N = 5220.
The difference in adult mortality is not statistically significant from one year to the next; but if
we take birth years 1870 and 1871 together in order to contrast them with all other years, the resulting hazard ratio is both pretty high (20% excess mortality for those born during the famine) and statistically significant at the 99% confidence level. The effect is lower but still significant if we omit cohorts 1860 and 1861, which display lower mortality (17% excess mortality significant at 95% level). The same is true when we add reservists excluded for medical reasons to the deceased (13% significant at 95%). Survival analysis allows us to control for the premature exit of the reservists excluded for medical reasons, assuming they are no more likely to die than those who remain under observation. Obviously they are more at risk of dying precisely because they suffer from some kind of medical condition that makes them unfit for military service. However, it should be noted that these conditions are quite diverse: tuberculosis is certainly related to much higher mortality, but nearsightedness (the two most frequent reasons for dismissal) is certainly not. In that view, considering all medical exits as deaths is a rather extreme hypothesis to use just for testing the robustness of our results.
Overall, it seems safe to conclude that those who were born or were very young during the famine episode were at higher risk of adult mortality. In contrast, the 1860 to 1864 cohorts do
10
12
14
16
18
20
22
1860 1862 1864 1866 1868 1870 1872

21
not display over-mortality at adult age, despite their shorter height. These results put in perspective both the impact of the famine on stature and the possible selection of famine survivors. First, the youngest children who survived the famine were still affected by it, although this did not reflect very much in their height. Second, those who ended up shorter did not come out with lower survival chances. In this respect, height is not necessarily a good indicator of health status.
Another way to look at long-term effects of the famine would be to investigate the cognitive
abilities of those most affected by it (born in 1870 or 1871). Unfortunately, individual data on the education and occupation of conscripts are not very informative. Education is collected in six groups, from illiterate to university graduate; yet 90% of the sample belongs to the literate category (i.e., can read, write and count). Education improves over time and, if anything, the last two cohorts (1871 and 1872) have a higher rate of literacy. Regarding occupation, we built a simple categorization in three groups (unskilled workers, skilled workers and white collar) so as to measure qualification and human capital. Again, no effect of the siege can be discerned, although this might be only because the scope of our observations is too limited.
6/ Conclusion
This paper investigates the impact of the Prussian siege of Paris from September 1870 to March 1871 on both mortality and height stature of survivors from one of the poorest area of the city (19th arrondissement). The siege was responsible for a harsh but short-lived famine that occurred during a very cold winter. It was followed by a revolutionary attempt (Paris Commune) that ended up in a bloodbath.
Using original data on individual death records, we calculate that mortality more than doubled – and even tripled over short periods – for almost all age ranges, with 10- to 39-year-olds being a bit less affected. Given the age profile of mortality risks, this means that the bulk of excess mortality concerned children aged 0 to 5 years old. Among the children born in 1869 or 1870, we estimate that only a little more than 40% reached the age of 20, compared with more than 50% under mortality conditions that prevailed before or after the siege. We also identify a large fall in fertility for the year 1871.
Using military conscription data, we find the 20-year-old height stature of children born 1865 to 1871 to be little different on average from children born 1872 to 1875. Tests on height distribution and simulations of selection effects from over-mortality and under-fertility suggest that selection could partly account for the relatively tall height of survivors in the youngest cohorts, especially the 1870 and 1871 cohorts who were below 1 year old or still in the womb at the time of the siege. For the others, the six-month siege was short-lived enough that they could catch-up in stature afterwards. Since the mid-1860s, living conditions in Paris had started to improve quickly, thanks in particular to the development of sanitation, and this gradual improvement carried on and even accelerated after the post-crisis, allowing Paris natives to achieve taller and taller stature compared both to natives from other regions and to migrants. Surprisingly enough, we find that 1860-1864 birth cohorts, who were 6 to 10 years of age during the siege, ended up much shorter than all the others. We argue that they were already too old to significantly benefit from the improvements of the mid-1860s, but too young for their physical growth to be immune from famine, and too old again to be able to catch-up after 1871.
Finally, we find that survivors from the 1870 and 1871 birth cohorts display 10 to 20% higher adult mortality rates between 23 and 46 years of age, specifically when compared to cohorts born before (from 1860 to 1869) or after (1872).
This case study might offer a few methodological lessons to be drawn, especially for the literature concerning issues of early childhood development, nutrition as it relates to famine, anthropometrics and economic history.

22
Changes in height stature over the long-term, a still ongoing process nowadays (Cavelaars et al. 2000), have proven to easily trace long-lasting improvements in nutrition and health as it relates to economic and social development, provided that height data are representative enough and not too contaminated by selection. In contrast, short-term variations in height stature, even in the case of a circumscribed and large famine shock, may be not as easy to read. Measurement errors and data noisiness are of course involved, but these are not the only obstacles.
First, the way a nutrition shock translates into short-term variations in stature is complex, and it depends on the duration of the shock itself as well as on general living conditions before and after the shock, which themselves interact with selection effects and critical age windows for physiological growth. Second, height is not necessarily a good indicator of survival chances at adult age. Although rather tall, the youngest children who survived the famine could have incurred other kinds of organ damage leading to higher mortality in later life, which is in contrast with older children who ended up shorter but do not come out with lower survival chances.
References
Alméras (d’), Henri. 1925. La Vie Parisienne Pendant Le Siège de Paris et Sous La Commune. Paris: Cercle du bibliophile.
Almond, Douglas, Lena Edlund, Hongbin Li, and Junsen Zhang. 2010. “Long-Term Effects of Early-Life Development: Evidence from the 1959 to 1961 China Famine.” In The
Economic Consequences of Demographic Change in East Asia, by Takatoshi Ito and Andrew Rose, 321–45. NBER--East Asia Seminar on Economics, v. 17. Chicago: University of Chicago Press.
Banerjee, Abhijit, Esther Duflo, Gilles Postel-Vinay, and Tim Watts. 2010. “Long-Run Health Impacts of Income Shocks: Wine and Phylloxera in Nineteenth-Century France.” Review of Economics and Statistics 92 (4): 714–28.
Barham, Tania, Karen Macours, and John A Maluccio. 2013. “Boys’ Cognitive Skill Formation and Physical Growth: Long-Term Experimental Evidence on Critical Ages for Early Childhood Interventions.” American Economic Review 103 (3): 467–71. doi:10.1257/aer.103.3.467.
Barker, David J. 1990. “The Fetal and Infant Origins of Adult Disease.” British Medical Journal 301 (6761): 1111.
Baten, J. rg, and John Komlos. 1998. “Height and the Standard of Living.” Journal of Economic History 58 (03): 866–70. doi:10.1017/S0022050700021239.
Berg (van den), Gerard J., Petter Lundborg, Paul Nystedt, and Dan-Olof Rooth. 2011. “Critical Periods during Childhood and Adolescence: A Study of Adult Height among Immigrant Siblings.” Working Paper Series 2011:5, IFAU - Institute for Evaluation of Labour Market and Education Policy.
Bodenhorn, Howard, Timothy W. Guinnane, and Thomas A. Mroz. 2014. “Caveat Lector: Sample Selection in Historical Heights and the Interpretation of Early Industrializing Economies.” SSRN Scholarly Paper ID 2406757. Rochester, NY: Social Science Research Network. http://papers.ssrn.com/abstract=2406757.
Bourdelais, Patrice, Michel Demonet, and Jean-Yves Raulot. 1978. “La marche du choléra en
France : 1832-1854.” Annales. Histoire, Sciences Sociales 33 (1): 125–42. doi:10.3406/ahess.1978.293912.
Bozzoli, Carlos, Angus Deaton, and Climent Quintana-Domeque. 2009. “Adult Height and Childhood Disease.” Demography 46 (4): 647–69. doi:10.1353/dem.0.0079.
Cavelaars, A. E., A. E. Kunst, J. J. Geurts, R. Crialesi, L. Grötvedt, U. Helmert, E. Lahelma, et al. 2000. “Persistent Variations in Average Height between Countries and between Socio-Economic Groups: An Overview of 10 European Countries.” Annals of Human Biology 27 (4): 407–21.

23
Cogneau, Denis, and Rémi Jedwab. 2012. “Commodity Price Shocks and Child Outcomes: The 1990 Cocoa Crisis in Côte d’Ivoire.” Economic Development and Cultural Change 60 (3): 507–34.
Crimmins, Eileen M., and Caleb E. Finch. 2006. “Infection, Inflammation, Height, and Longevity.” Proceedings of the National Academy of Sciences of the United States of America 103 (2): 498–503. doi:10.1073/pnas.0501470103.
Deaton, Angus. 2006. “The Great Escape: A Review of Robert Fogel’s The Escape from Hunger and Premature Death, 1700–2100.” Journal of Economic Literature 44 (1): 106–14. doi:10.1257/002205106776162672.
Doblhammer, Gabriele, Gerard J. van den Berg, and L. H. Lumey. 2013. “A Re-Analysis of the Long-Term Effects on Life Expectancy of the Great Finnish Famine of 1866–68.” Population Studies 67 (3): 309–22. doi:10.1080/00324728.2013.809140.
Du Camp, Maxime. 1881. Les Convulsions de Paris. Tome Premier Les Prisons Pendant La Commune. Paris: Hachette. http://gallica.bnf.fr/ark:/12148/bpt6k5470576r.
Farcy, Jean-Claude, and Alain Faure. 2003. La Mobilité D’une Génération de Français : Recherche Sur Les Migrations et Les Déménagements Vers et Dans Paris à La Fin Du XIXe Siècle. Les Cahiers de l’INED. Paris: INED.
Fogel, Robert W. 1994. “Economic Growth, Population Theory, and Physiology: The Bearing of Long-Term Processes on the Making of Economic Policy.” The American Economic Review 84 (3): 369–95.
———. 2004. The Escape from Hunger and Premature Death, 1700-2100 Europe, America and the Third World. Cambridge New York: Cambridge University Press.
Gørgens, Tue, Xin Meng, and Rhema Vaithianathan. 2012. “Stunting and Selection Effects of Famine: A Case Study of the Great Chinese Famine.” Journal of Development Economics 97 (1): 99–111.
Hart, Nicky. 1993. “Famine, Maternal Nutrition and Infant Mortality: A Re-Examination of the Dutch Hunger Winter.” Population Studies 47 (1): 27–46.
Henryot, Arnold. 1871. Paris Pendant Le Siège, 1870-1871. Paris: Armand Le Chevalier. Howard, Michael. 2001. The Franco-Prussian War. [1st Edition 1961]. Abingdon: Routledge. Humphries, Jane, and Tim Leunig. 2009. “Was Dick Whittington Taller than Those He Left
behind? Anthropometric Measures, Migration and the Quality of Life in Early Nineteenth Century London?” Explorations in Economic History 46 (1): 120–31.
Johansson, Sheila Ryan. 2005. “Fogel and the History of Mortality.” Population Studies 59 (2): 247–53.
Jousilahti, P., J. Tuomilehto, E. Vartiainen, J. Eriksson, and P. Puska. 2000. “Relation of Adult Height to Cause-Specific and Total Mortality: A Prospective Follow-up Study of 31,199 Middle-Aged Men and Women in Finland.” American Journal of Epidemiology 151 (11): 1112–20.
Kannisto, V., K. Christensen, and J. W. Vaupel. 1997. “No Increased Mortality in Later Life for Cohorts Born during Famine.” American Journal of Epidemiology 145 (11): 987–94.
Kemkes-Grottenthaler, Ariane. 2005. “The Short Die Young: The Interrelationship between Stature and Longevity-Evidence from Skeletal Remains.” American Journal of Physical Anthropology 128 (2): 340–47. doi:10.1002/ajpa.20146.
Lee, David S. 2009. “Training, Wages, and Sample Selection: Estimating Sharp Bounds on Treatment Effects.” The Review of Economic Studies 76 (3): 1071–1102. doi:10.1111/j.1467-937X.2009.00536.x.
Leon, D A, G D Smith, M Shipley, and D Strachan. 1995. “Adult Height and Mortality in London: Early Life, Socioeconomic Confounding, or Shrinkage?” Journal of Epidemiology and Community Health 49 (1): 5–9.

24
Lévy-Leboyer, Maurice. 1968. “La croissance économique en France au XIXe siècle. Résultats préliminaires.” Annales. Histoire, Sciences Sociales 23 (4): 788–807. doi:10.3406/ahess.1968.421960.
Lindeboom, Maarten, France Portrait, and Gerard J. van den Berg. 2010. “Long-Run Effects on Longevity of a Nutritional Shock Early in Life: The Dutch Potato Famine of 1846-1847.” Journal of Health Economics 29 (5): 617–29. doi:10.1016/j.jhealeco.2010.06.001.
Lissagaray, Prosper-Olivier. 2004. Histoire de La Commune de 1871. Paris: La Découverte. Maccini, Sharon L., and Dean Yang. 2008. “Under the Weather: Health, Schooling and
Economic Consequences of Early-Life Rainfall.” American Economic Review 99 (3): 1006–26.
Meng, Xin, and Nancy Qian. 2009. “The Long Term Consequences of Famine on Survivors: Evidence from a Unique Natural Experiment Using China’s Great Famine.” NBER working paper. http://www.nber.org/papers/w14917.pdf.
Merriman, John M. 2014. Massacre: The Life and Death of the Paris Commune of 1871. New Haven, CT: Yale University.
Moradi, Alexander. 2010. “Nutritional Status and Economic Development in Sub-Saharan Africa, 1950-1980.” Economics & Human Biology 8 (1): 16–29.
Preston, Samuel H., and Etienne van de Walle. 1974. “Mortalité de L’enfance Au XIXe Siècle à Paris et Dans Le Département de La Seine.” Population 29 (1): 89–107.
Rougerie, Jacques. 2004. Paris Libre 1871. Paris: Seuil. Scholte, Robert, Gerard J. Berg (van den), and Maarten Lindeboom. 2012. “Long-Run Effects of
Gestation During the Dutch Hunger Winter Famine on Labor Market and Hospitalization Outcomes.” IZA Discussion Papers 6307, Institute for the Study of Labor (IZA).
Sheppard, Nathan. 1877. Enfermé Dans Paris: Journal Du Siège Du 2 Septembre 1870 Au 28 Janvier 1871. Paris: Darantière.
Song, Shige. 2009. “Does Famine Have a Long-Term Effect on Cohort Mortality? Evidence from the 1959-1961 Great Leap Forward Famine in China.” Journal of Biosocial Science 41 (04): 469. doi:10.1017/S0021932009003332.
Sparen, P., Denny Vågerö, Dimitri Shestov, Svetlana Plavinskaja, and Nina Parfenova. 2004. “Long Term Mortality after Severe Starvation during the Siege of Leningrad: Prospective Cohort Study.” BMJ 328 (7430): 11–0. doi:10.1136/bmj.37942.603970.9A.
Steckel, Richard H. 2008. “Biological Measures of the Standard of Living.” Journal of Economic Perspectives 22 (1): 129–52.
Sueur, Henri. 1872. Etude sur la mortalité à Paris pendant le siège. Sandoz et Fischbacher (Paris). http://gallica.bnf.fr/ark:/12148/bpt6k81348p.
Tombs, Robert. 1994. “Victimes et Bourreaux de La Semaine Sanglante.” Revue D’histoire Du XIXe Siècle 10.
———. 1999. The Paris Commune, 1871. London: Longman. Vacher. 1871. “La Mortalité à Paris En 1870.” Gazette Médicale de Paris 26: 9–12. Waaler, H. T. 1984. “Height, Weight and Mortality. The Norwegian Experience.” Acta Medica
Scandinavica. Supplementum 679: 1–56. Wawro, Geoffrey. 2003. The Franco-Prussian War: The German Conquest of France in 1870-1871.
Cambridge, UK ; New York: Cambridge University Press.

25
Appendix 1: Estimation of pre-crisis benchmark mortality quotients
Our vital records data for the 19th arrondissement cover the period from September 1869 to August 1873. While our mortality data distinguish males from females, data on births do not; therefore, we estimate male births at half of total births. We then assume that children who died between 0 and 48 months in the 19th district and who were recorded as being born in Paris were for the vast majority also born in that district. The alternative assumption is that net migration between the 19th and the rest of Paris is close to zero, and that mortality quotients are no different between out-migrants and in-migrants.
For infant mortality (1q0), we use recorded deaths before age 1 and between September 1869 and August 1870 for the 4-month cohort born in Paris between September and December 1869. We do not include deaths between September 1870 and December 1870, because this period corresponds to the beginning of the siege. However, we then miss a few deaths for babies between 8 and 12 months. Hence, we complement our estimate using recorded deaths before age 1 in the same months of 1869 (Sept. to Dec.), and for the cohort born between September and December 1868.
Wet-nursing was a rather customary practice at that time: many Parisians used to send their children to nearby areas in the south and west of Paris during the first year of life. For the whole Paris county (département de la Seine), Van de Walle and Preston (1974) estimate wet-nursing concerned one in ten babies. However, this was more of a middle-class practice; the upper classes could afford a nurse at home, while the lower classes were too poor to afford any. As a result, wet-nursing was probably limited in the 19th district, even outside of the siege period; thus, we make no correction for it.
For the next mortality quotient (1q1), we similarly use recorded deaths between ages 1 and 2, and between September 1869 and August 1870 for the 4-month cohort born between September and December 1868. Once again, we use the preceding cohort (Sept. to Dec. 1867) to complete our estimate. We collected births only on a monthly basis for the years 1868 to 1873. For years before 1868, we compute an estimate of the 4-month cohorts' sizes by applying the average of the shares for 1868 and 1869 to the total number of births. We assume that the benchmark estimate for 1q0 applies. For 1q2 and 1q3 we repeat the same procedure. According to our computations using the 1869 yearbook and the 1866 population census, the mortality rate between 5 and 20 years of age was around 1.35% for the whole of Paris in 1869. For 1q4 to 1q19, we then adopt a fixed quotient of 1.35%. This assumption results in a probability of death of 6.6% between 5 and 10 years of age, a slightly higher figure than the one (4.9%) that Van de Walle and Preston obtained for girls born in the Paris county and who belong to the 1866-1870 cohorts.
Table A1.1 - Estimated pre-crisis mortality rates for males born in the 19th arrondissement
Pre-crisis Benchmark
Van de Walle & Preston(a)
1q0 25.2 19.7
1q1 10.7 -
1q2 3.1 -
1q3 2.1 -
1q4 1.4 -
4q1 16.2 20.6
5q0 37.5 36.2
5q5 6.6 4.9
15q5 18.4 -
20q0 49.1 - (a): Girls in Paris county (“Seine”) for the 1866-1870 cohort

26
Appendix 2: Data on two other districts in Paris
Trials and errors in the data collection process led us to start collecting a few data points on conscripts born in Paris and examined for military service in two other rather poor districts of Paris outside of the 19th, specifically: the 3rd and the 13th districts. We can restrict ourselves to recruits born in Paris, but not to district natives, as the district of birth was not inputted. The figures we obtain for average height are rather in line with height developments in the 19th district. Compared to the 1860 birth year cohort, both the 1868 and 1870 cohorts are much taller in all three districts and not much shorter than the 1873 cohort (only the 3rd district here).
Figure A2.1 - Mean height of Paris natives recruited in 3rd and 13th districts compared to 19th
Source: Conscription records of the 3rd, 13th and 19th districts of Paris. Farcy and Faure (2003) database for 1860. Coverage: Recruits born in Paris examined for military service in the 3rd, 13th and 19th districts.
163
164
165
166
167
1850 1855 1860 1865 1870 1875 1880
Me
an H
eig
ht
Year of Birth
Drafted in 19th 3rd 13th

27
Appendix 3: Height developments in Paris region
War Ministry reports on conscription provide data on height stature distributions for each county (“département”) from 1872 to 1912 (Ministère de la Guerre 1872-1912), and in particular for the Seine county, including Paris. For each year and each county in metropolitan France, the frequency distribution of height is reported in eleven bins. In order to estimate mean height, we fit a normal distribution to the frequency data; we can also abstract from the normality assumption by analyzing cumulative distribution coordinates from the raw data, like proportion of conscripts shorter than 163 cm or taller than 170 cm.
In contrast with our individual data for the 19th district, coverage was limited before 1886. The young men who had been exempted for medical reasons (15% of total) or for family reasons (25% of total) were not included in published height tables. Banerjee et al. (2010) argue that this should not lead to significant biases. In the case of the 19th district, we checked that withdrawing the two kinds of exemptions brought little change to the main features of mean height evolutions.
We compare the 19th district with Seine and also with the average of 12 counties surrounding Seine (Figure A3.1). In the case of large and selective out- or in-migrations between ages 0 and 20, recruits’ mean height could differ from natives. Like London (Humphries and Leunig 2009), Paris indeed received large migration inflows, and half of the conscripts recruited at 20 years old in Seine were not born there (Farcy and Faure 2003). Yet, as shown in Figure A3.1, the time profiles of height stature for Paris natives and for Seine display rather high correlations, with a Pearson coefficient reaching 0.78; when linearly de-trended, the series are still correlated at 0.67. Height developments for Seine are also correlated with those of neighbouring counties at 0.92 (de-trended 0.83). In contrast, de-trended correlations with Rhône (Lyon region) or metropolitan France averages are, respectively, -0.09 and 0.12.
Figure A3.1 - Mean height in Paris county
Source: Conscription records of the 19th district of Paris and War Ministry reports 1872-1912.
All three series tell the story of a great improvement in living conditions through an acceleration of
height gains after the year 1866. Cohorts born between 1868 and 1871 do not exhibit any height anomalies in the Seine series. This is confirmed when looking at deviations from a linear time trend, and as well at double-differences with other groups of counties: (i) 12 counties around Seine, (ii) Rhône (Lyon region), (iii) average of Rhône, Bouches-du-Rhône and Nord, all major industrial regions (Lyon, Marseille and Lille), and (iv) the whole of metropolitan France (results not shown).
Yet, in contrast with the 19th district, no anomaly is detected here for cohorts born 1860 to 1864. In particular, the very large height deficit for cohorts 1862 and 1863 is no longer observed. Two main factors may explain this difference: (i) Seine data mixes poor neighbourhoods like the 19th district of Paris with rich ones like the 8th; (ii) Seine data is composed for about half of migrants, and between one-half and two-thirds of the 1860-1864 cohorts were not yet in Seine during the siege. Furthermore, the absence of exempted recruits (for birth years before 1866) also adds a source of uncertainty.
163
164
165
166
167
1850 1855 1860 1865 1870 1875 1880
Born in Paris (19th) Drafted in Seine
Drafted in 12 counties around Seine