Shoreline Processes near Barrow, Alaska: A Comparison of the...
18
Shoreline Processes near Barrow, Alaska: A Comparison of the Normal and the Catastrophic JAMES D. HUME1 AND MARSHALL SCHALK2 ABSTRACT. Studies of sediment movement between 1948 and 1962 along the Alaska coast westof Point Barrow indicate a normal average yearly net transport to the northeast of 10,000 cubic yards. Net transport east of Point Barrow, based on surveys begun in 1958, indicate a normal annual southeastward movement there of 9,500 cubic yards. On 3 October 1963, a storm with gusts of up to 75 miles per hour blew over an ice- free ocean and attacked the coast. Wave heights, estimated at IO feet, combined with a storm surge of I I to 12 feet caused coastal flooding and over $3 million damage. The 1963 storm, probably a “two hundred year storm,” moved over 200,000 cubic yards of sediments, which is equivalent to 20 years’ normal transport. If the climate is becoming warmer, such storms can be expected more frequently. Construction adjoin- ing the shore should be planned accordingly. RkSUMÉ. iuolution du rivageprès de Borrow, Alaska: comparaisonentre le normal et le catastro- phique. Entre 1948 et 0952, des études sur le mouvement des stdiments le long de la cSte de l’Alaska, à l’ouest de Point Barrow, ont indique un transport annuel moyen normal vers le nord-est de 10,000 yards cubes (7645 m3). Des 6tudes analogues entre- prises en 1958 indiquaient un mouvement vers le sud-est de 9,500 yards cubes (7263 m3). Le 3 octobre 1963, une temp&te, accompagnke de rafales atteignant 75 millesà l’heure (120 kmh) souffla sur l’océan libre de glace et vint frapper la c h . Des vagues estimtes à IO pieds (2,05 m). renforctes d’une vague de fond causée par la tempête et haute de I I à 12 pieds (3,35-3,65 m), inondèrent les regions ci3tières et causèrent pour plus de 3 millions de dollars de dtggts. Cette tempete - probablement une tenpete de “deux siècles” - dtplaça plus de 200,000 yards cubes (152,900 ma) de stdiments, soit le transport normal de vingt anntes. Si le climat est vtritablement en train de se rtchauffer, il faut s’attendre ce que de telles tempetes se produisent plus frkquemment. Les constructions voisines de la c h devront donc être prtvues en consé- quence. LGeology Department, Tufts University, Medford, Mass. 2Geology Department, Smith College, Northampton. Mass. 86
Transcript of Shoreline Processes near Barrow, Alaska: A Comparison of the...
Shoreline Processes near Barrow, Alaska: A Comparison of the Normal and the Catastrophic
JAMES D. HUME1 AND MARSHALL SCHALK2
ABSTRACT. Studies of sediment movement between 1948 and 1962 along the Alaska coast west of Point Barrow indicate a normal average yearly net transport to the northeast of 10,000 cubic yards. Net transport east of Point Barrow, based on surveys begun in 1958, indicate a normal annual southeastward movement there of 9,500 cubic yards.
On 3 October 1963, a storm with gusts of up to 75 miles per hour blew over an ice- free ocean and attacked the coast. Wave heights, estimated at IO feet, combined with a storm surge of I I to 12 feet caused coastal flooding and over $3 million damage. The 1963 storm, probably a “two hundred year storm,” moved over 200,000 cubic yards of sediments, which is equivalent to 20 years’ normal transport. If the climate is becoming warmer, such storms can be expected more frequently. Construction adjoin- ing the shore should be planned accordingly.
RkSUMÉ. iuolution du rivageprès de Borrow, Alaska: comparaison entre le normal et le catastro- phique. Entre 1948 et 0952, des études sur le mouvement des stdiments le long de la cSte de l’Alaska, à l’ouest de Point Barrow, ont indique un transport annuel moyen normal vers le nord-est de 10,000 yards cubes (7645 m3). Des 6tudes analogues entre- prises en 1958 indiquaient un mouvement vers le sud-est de 9,500 yards cubes (7263 m3).
Le 3 octobre 1963, une temp&te, accompagnke de rafales atteignant 75 millesà l’heure (120 kmh) souffla sur l’océan libre de glace et vint frapper la c h . Des vagues estimtes à IO pieds (2,05 m). renforctes d’une vague de fond causée par la tempête et haute de I I à 12 pieds (3,35-3,65 m), inondèrent les regions ci3tières et causèrent pour plus de 3 millions de dollars de dtggts. Cette tempete - probablement une tenpete de “deux siècles” - dtplaça plus de 200,000 yards cubes (152,900 ma) de stdiments, soit le transport normal de vingt anntes. Si le climat est vtritablement en train de se rtchauffer, il faut s’attendre ce que de telles tempetes se produisent plus frkquemment. Les constructions voisines de la c h devront donc être prtvues en consé- quence.
LGeology Department, Tufts University, Medford, Mass. 2Geology Department, Smith College, Northampton. Mass.
86
SHORELINE PROCESSES NEAR BARROW 87
INTRODUCTION
During the summers of I 960-62, studies of the shoreline and of the nearshore areas were made near Barrow, Alaska. The different processes were studied and efforts were made to measure the quantities of sediment which were transported by each. As part of the program, it was desired to see how these sedimentary processes were similar or dissimilar to those operating in temperate regions. It was found necessary to record measurements of winds, waves, currents, and tides. Sea-ice conditions were also noted.
The project was believed completed in 1962. On 3 October 1963, how- ever, a storm of much greater intensity than any previously known struck the northern Alaskan coast. The shoreline changes were greater than the cumulative changes that had occurred between I 948 and I 962, including those which resulted from the major storm of 4-6 October I 954. Over three million dollars damage was done in the sparsely settled region.
Previous workers in the Barrow area include Leffingwell ( ~ g ~ g ) , who mapped the coast of Alaska between Barrow and Barter Island under extremely difficult conditions; in addition to mapping, he also studied the geology of the region, particularly the Canning River area. Ray (1885) gives some information about the beaches, but he was chiefly concerned with other observations. More recent investigators include: McCarthy (1953), who measured rates of beach erosion and growth; Rex and Taylor (1953); Rex ( I 964), who made a study of the yearly beach cycle; and Schalk ( I 957, 1963), who has reported on the nearshore profiles off certain beaches between Point Lay and Tangent Point.
DESCRIPTION OF THE AREA
Point Barrow, Alaska (Fig. I ) , is the northernmost tip of Alaska, on the shores of the Arctic Ocean. The area, part of the Alaskan coastal plain, consists of unconsolidated Recent and Pleistocene sediments. Southwest of Barrow Village for a distance of 40 miles the coast consists of a narrow beach backed by 30-foot bluffs. Between Barrow Village and a point % mile northeast of the airport, gravel and sand beaches occur in front of low tundra. From there, northeastward to Point Barrow, low sand and gravel beaches have been named the Barrow spit. Southeast from Point Barrow, a low sandy strip, locally called Eluitkak spit, extends for about 3 miles to Eluitkak Pass. Beyond the Pass is a chain of sandy, barrier islands. The head of a submarine canyon, the Barrow Sea Valley, is just north of Point Barrow (Beal I 957). Government installations, which are locally called the Camp, and which include the Arctic Research Laboratory, are about 4 miles northeast of Barrow Village.
Detailed observations of the environmental factors were made 3 to 5 times daily during the summers of 1961 and I 962 (Hume I 963). Winds near Barrow usually come from easterly or westerly directions (Carson and Hussey 1962, I 963). When ice is not present, these winds develop waves which tend to approach the Barrow beaches from either the west or north, the waves from the north being built by the east winds and refracted around

SHORELINE PROCESSES NEAR BARROW
FIG. I Index map of Barrow, Alaska
Point Barrow. These waves develop a longshore current. A southeast- flowing current is developed by waves from the north, and a northeast current by waves from the west. This wave-generated current is superim- posed on a northeast-moving current of non-local origin (U.S. Hydro- graphic Office I 958). During the period covered by the observations, about 60 per cent of the currents flowed southwest and 40 per cent northeast. However, as the period of the observations does not include the fall storm season, when the strongest winds come from the west, these figures give a false picture. The net effective longshore transport, proved by growth on the southwest side of Point Barrow, is towards the northeast.
To the east of Point Barrow, environmental observations were made on only a few occasions. The pattern seems to be similar, however. Waves approach the shore from the east or north, the north waves being refracted around the point. These waves set up longshore currents flowing northwest or southeast. The non-local currents, which are again a factor, are not as well known as are those west of Point Barrow. The United States Hydro- graphic Office atlas of the Arctic (1958) states that “currents depend on local winds and may set in either direction along the coast.” Swithinbank (1960) shows the currents moving southeastward. Probably the non-local currents are neither regular nor strong. Our observations, based on growth of the spit southeastward, show that the predominant current flows towards the southeast.
Waves and ice erode the bluffs southwest of Barrow. The sediment
SHORELINE PKOCESSES NEAR BARROW 89
resulting from this erosion is transported both by wave swash and by longshore currents northeast to Point Barrow, where it is deposited on the west side of the Point. Some of the fine sediment bypasses the Point and can be seen as a muddy flow of water moving out to sea, where it finally settles, possibly in the Barrow Sea Valley (Rex 1964). Erosion of the low bluffs at Point Barrow, near the old Eskimo site of Nuwuk, provides the sediment which is building Eluitkak spit to the southeast. Again, some of the fine material must bypass the end of the spit.
Tides are not a very important factor at Barrow, except during times of storm. The normal daily tide is about 6 inches and an additional monthly variation of about 5 inches exists (Beal 1957). In addition to these astro- nomical variations, storms cause rises of sea level of several feet. This change of sea level, called storm surge or storm tide, is the result of two factors: a rise of sea level under an atmospheric low pressure area, and a rise of sea level caused by wind blowing onshore. At Barrow, winds from the west blow water against the Barrow coast and raise sea level. Winds from the east lower the sea level. Schalk ( I 957, I 963) discusses these storm tides and mentions cases ranging from a few feet to g feet.
Probably the most important factor in the shallow water environment at Barrow is the ice. I t can stop the entire process of beach erosion, transpor- tation, and deposition. It limits the size of waves, it affects the pattern of currents, and it may even affect sea level for a short time, as suggested by Rex ( I 964).
The United States Hydrographic Office ( I 958) has compiled ice data for many arctic areas. They found that break-up at Barrow has been as early as 15 June and as late as 22 August. The average break-up, based on 24 observations, occurred between I 7 and 23 July. Freeze-up has occurred between 2 September and 19 December. On the basis of 26 observations, they place the average time of freeze-up between I and 5 October. Our observations ( I 963) were made mostly during the period of “open” ocean. The chief conclusion was that the position of the ice was extremely variable. I t could drift out of sight of land one day and be back on shore the next. As a result, one day there might be a strong current and waves 2 feet high, whereas the next day the waves would be damped and the current entirely changed, possibly even slack near shore. Most years the ice probably stays near enough to land to affect the waves and shore processes all the time. On a few occasions, however, there has been as much as 200 miles of open ocean off Barrow (M. C. Brewer I 964, personal communication).
With the ocean relatively free of ice for less than an average of three months a year, the shoreline processes at Barrow can be expected to trans- port less than that moved along temperate coasts similarly placed in rela- tion to the ocean. The truth of this statement is emphasized when it is realized that the water near Barrow, even when considered “open” and navigable by ships, may have scattered ice present and sea ice a few miles offshore. This ice would still act, to some extent, as a damper of waves and wave-generated currents.

90 SHORELINE PROCESSES NEAR BARROW
SHORELINE PROCESSES
Our studies at Barrow indicate that the same processes of erosion, transportation, and deposition which are found in temperate regions operate in the Arctic. Of more relative importance are those processes associated with lower temperatures. These include the movement of sedi- ments by ice-push and ice-rafting. Sediment transport by surface tension or flotation, while of little importance quantitatively, may be more common in the Arctic than elsewhere.
At Barrow, as in warmer climates, most of the sediment is carried by the longshore currents and swash of the waves. Of these two, swash is probably much more important at Barrow because the beach sediments are mostly too large to be readily carried in suspension. This load will be referred to as the longshore load or longshore transport. Attempts to determine a value for
FIG. z Map of western part of Point Barrow, Alaska. The shoreline of 1948 was taken from an air photograph. Circles indicate beach ridges. Black circles locate base stations.
the annual longshore transport were made by repeated surveys of growing areas. Two areas were selected: one on the southwest side of Point Barrow (Fig. 2 ) and the other at the tip of Eluitkak spit. Both areas were surveyed at intervals by plane-table methods, and calculations of the approximate volume changes were made. Between 1948 and 1960, this southwest side of Point Barrow grew about 250 feet. This growth was the result of deposi- tion both from swash and from the northeastward-moving currents. The volume of sediment added was approximately 6 I ,000 cubic yards over the

SHORELINE PROCESSES NEAR BARROW 9'
twelve-year period of observation, or 5,060 cubic yards per year. This figure is low because a dredged channel was maintained across the spit for several years prior to 1954. The tailings were dumped on the beach and were later washed into the lagoon. In addition, the catchment area is not completely effective because currents flowing northward carry fine sus- pended sediment past the Point. An estimate of the total net longshore transport, allowing for these imperfections in the catchment area, would be about 10,000 cubic yards yearly. The gross transport, or movement of sediment back and forth along the beach as currents and waves changed, would be considerably more.
The tip of Eluitkak spit was also surveyed in I 958, I 960, and I 962. Between 1958 and 1962 the spit grew in volume 19,250 cubic yards, or approximately 4,500 cubic yards per year. The sediment deposited at the end of Eluitkak spit is very noticeably different in size distribution from that found at Point Barrow. This difference suggested a means of estima- ting the quantity of sediment which was either bypassing or not arriving at the growth areas. Composite samples from the eroding bluffs at Point Barrow and from the tip of Eluitkak spit were collected, sieved, and the
100
80
c c c
60 L al a - I- P7: BARROW I '3 40 w 3
20
ELUITKAK SPIT
0 1 01
FIG. 3 Cumulative curves for composite samples from Point Barrow, the end of Eluitkak spit, and the bluffs southwest of Barrow
DIAMETER (millimetres)
results plotted as cumulative curves (Fig. 3). Approximately go per cent of the Eluitkak sediment lies between 2 and 5 mm. Only 40 per cent of the Point Barrow sediment, having larger quantities of fine material, falls between the same limits. This suggests the possibility that it takes about 2 units of the sediment from Point Barrow to supply I unit of the sediment found at the end of the spit. If this is true, then the figure of 4,500 cubic yards per year for the net growth of Eluitkak spit becomes g,ooo cubic yards per year for the longshore transport. The finer sediment, found at Point Barrow but not at Eluitkak spit, washes into the lagoon and into deeper ocean waters. A similar calculation for the system west of Point Barrow suggests that 15 per cent of the finer sediment derived from the

92 SHORELINE PROCESSES NEAR BARROW
bluffs southwest of Barrow Village never reaches the area of accumulation or else bypasses it.
Ice-push and ice-rafting are common phenomena in the Arctic. These processes of sedimentation are also found in temperate regions but are not as prevalent. Ice-push along the Alaskan arctic coast was discussed by Hume and Schalk (1964). While the effect is very readily seen, it is not important as a major transporting agent. The quantity of sediment added to the beaches is normally about I or 2 per cent of the total and does not exceed I O per cent. Ice-rafting is not a major factor in sedimentation near Barrow because the agents which transport the sediment onto the ice are not quantitatively effective. Glacial ice, probably the most important carrier of rafted sediment in some areas, does not reach the sea within hundreds of miles of Barrow and has only rarely been observed near shore. The streams which might deposit sediment on the ice are all small and are frozen during most of the time that the ocean is frozen. Collapse of material onto the ice from the bluffs southwest of Barrow is also thought to be unimportant because little or no retreat of the bluffs could be detected between I 959 and I 962. In addition, the ice on which sediment might slide will probably melt on the beach, not in the sea. An attempt was made to estimate the quantity of ice-rafted sediment using 35 bottom samples col- lected in water from 5 to 18 feet in depth. The samples were sieved and cumulative curves drawn. Examination of these curves showed that 15 of them had noticeable amounts of abnormally coarse material. This sediment, amounting to 2.9 per cent, was presumed to be ice-rafted. In addition to the coarse material, some samples showed large quantities of clay-sized sediment. T his fine material may have been blown onto the ice or into the water, ice-rafted, or deposited by some unrecognized process.
Flotation is admittedly of little importance as a method of transporting sediment. Yet it should be of relatively greater importance in the Arctic because the process depends on surface tension (Hume I 964). Surface tension increases both with an increase in salinity and with a decrease in temperature, and as both an increase in salinity and decrease in tem- perature can be expected in arctic waters, surface tension is bound to be greater there.
STORM OF 3 OCTOBER 1963
The storm of 3 October I 963 was the worst in the memory of the Eskimo people. In modern records it was unique in that winds of up to 55 m.p.h. (U.S. Weather Bureau's one-minute wind), with gusts of up to '75 m.p.h., were able to blow over an open ocean. Winds approaching but not reaching these velocities have been recorded at Barrow on other occasions; what made this storm different was a combination of open water and high winds. Normally, high winds cannot build high waves, because of the interference of sea ice. In addition, sea ice would also interfere with the development of a storm surge. Instead of the winds being able to blow against a fluid, thus pushing it ahead, the winds would blow against a
SHORELINE PROCESSES NEAR BARROW 93
rigid solid: the ice. If the wind were powerful enough to move the ice horizontally, that movement would finally be taken up by the building of pressure ridges when the ice buckled. If the ocean were only partly frozen, a wind-generated rise of sea level might start to develop. As the scattered sea ice was blown against the coast, however, a continuous ice cover would develop and again pressure ridges would form. Atmospheric changes in sea level might exist, but these would be minor compared with the effect of the wind. In 1963 at Barrow, no such subduing factor was present and the land took the force of the storm, much as the New England coast might take a northeaster. Because the Barrow natives do not have any recollections of a storm of this magnitude, it should probably be considered a “two hundred year storm’’ for the area.
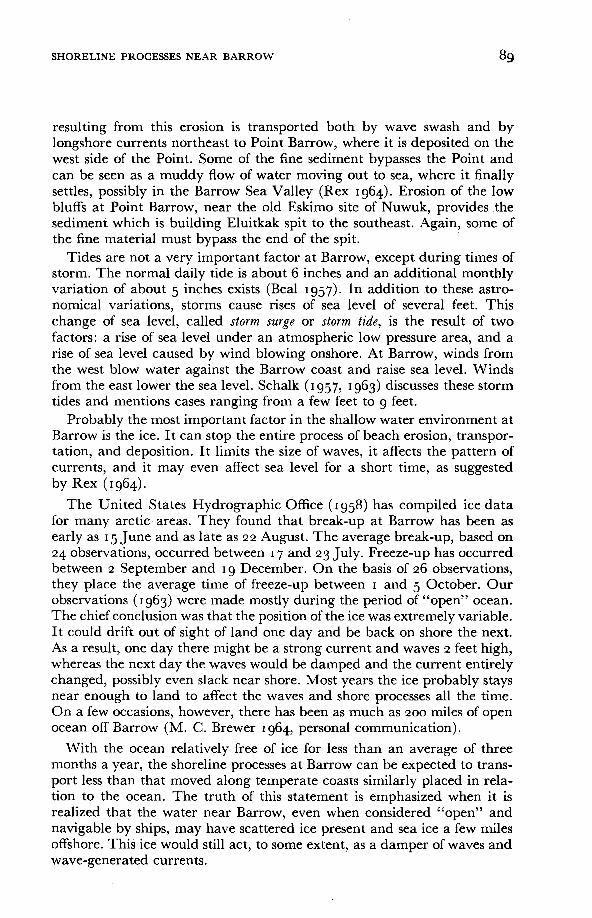
No attempt to describe the storm from a meteorological standpoint will be made because P. J. Schafer ( I 966) has done this. ‘I he progress of the storm at Barrow and its effects on coastal regions are, however, pertinent to this paper. Photographs taken from the Arctic Research Laboratory by Jerry Brown at about noon on 3 October, prior to the peak of the storm, are reproduced in Figs. 4, 5, and 6.

94 SHORELINE PROCESSES NEAR BARROW
FIG. 6 View landward showing flooded area. The D-4 tractor was used in attempting to save the research animals.
Probably the best description of the storm in action comes from the Arctic Research Laboratory Progress Report for October 1963 (pp. I 2-1 7), part of which is quoted below. Fresh Lake, which is referred to, is imme- diately northeast of the Camp; it was the fresh water supply for the region. The Liz Maru, Iuik, and Natchik are boats.
TIME-AST REMARKS
0000-0600 Although winds were high, no damage was sustained during this early period;
0600-0800 The ocean began to rise and show the first manifestation of the coming wind tide. Water and wave action reworked the beach but did not enter camp;
0800-0930 Water undermined the tower at COz and began under- mining the CO2 wanigan. The wanigan was pulled further back up the beach. The runway was closed to aircraft. Water began to cross the road between the airport and Camp. The amount was minor at this time, it was still thought that Fresh Lake could be saved, and much of the camp effort was expended trying to save it;
0930-1 I O O Water approached the first row of buildings in camp, covered the runway, and' was about I-foot deep flowing into Fresh Lake. Wave action moved the LCM (LIZ MARU), anchored with a D-8 Cat and TD-24 tractor, and the IVIK. The fate of Micromet and NATCHIK were unknown at this time:

SHORELINE PROCESSES NEAR BARROW 95
I 100-1 300 Water was entering Camp during this period but still not enough to cause alarm for the Camp. Fresh Lake was now beyond saving;
I 300-1 400 Winds increased and power lines were breaking too fast to be safely cut individually. Camp power was shut off to prevent fire. Water entered Camp, pounded all the beach buildings, and entered the Boiler House. The steam plant was shut down. About one foot of water was flowing over the main street of Camp. George Riedel’s plane was swept away. The Lodestar was turned around by the force of the water;
1400-1 600 The peak of the storm occurred during this period. Water rushed through Camp reaching a depth of twenty-four inches in front of the main ARL Laboratory complex and as deep as 3% feet in other areas. Building 161, the beach- master’s hut, the theater, and F-5, were moved off their foundations and the 40 x IOO foot gym collapsed. Building 161 came to rest out on the tundra behind building 355. Salt water poured into Fresh Lake in a two-foot deep stream as wide as the distance between the Camp and the airport. All women and children were evacuated from the Camp to the DEW line site. Most of the damage in the area occurred at this time. The force of the current through Camp was so strong that only Cats could safely be driven through the streets. A wolf, two wolverines, and three foxes drowned early in this period. One weasel and one D-4 cat were sunk trying to save the animals. Folk’s wanigan was swept over the Gas line;
I 600-1 700 Water level dropping; walking possible but hazardous; I 700-1 goo Water receded rapidly; Camp essentially empty of water by
As mentioned before, the storm of 3 October 1963 was the worst ever recorded by the US. Weather Bureau at Barrow, and the worst in the memory of the natives or in their folklore. Prior to 1963, one of a series of fall storms in 1954 (Schalk 1957) made that year remembered as the worst storm year ever known. Nevertheless, the 1954 storm had maximum winds of only 42 m.p.h. (one-minute wind), compared with a maximum of 55 m.p.h. in 1963. The 1954 storm was strong enough to cause water to wash over the beach and into the Camp; debris was thrown on the beaches for miles. But the storm of 1963 washed debris all the way over the beaches and left them almost free of the oil drums and seal carcasses found in I 954. The 1954 storm moved a helium tank from Barrow Village almost to the Point, but the 1963 storm washed barges from the Barrow spit to Cooper Island, 2 0 miles to the southeast. If winds should be compared using the cube of their velocities (Price 1963), the I 963 storm was about three times as powerful as the 1954 storm.
I 830.
96 SHORELINE PROCESSES NEAR BARROW
The storm tide or surge in 1963 was estimated during the peak of the storm to have been about 1 2 feet. This estimate was based on the fact that water 2 feet deep was seen flowing over a beach which had been I O feet high. This estimate seemed reasonable, but verification was needed. In order of decreasing reliability, water level during a storm can be determined by: tide gauges; still-water lines preserved in places such as buildings; and finally, debris lines (United States Army Corps of Engineers 1962). KO tide gauges were in operation near Barrow, but one still-water line of 9.2 feet above sea level was preserved in the radio shack behind the Arctic Research Laboratory. Unfortunately, this area is below and landward of the beach crest and as a result the water line marked a flooded lake level but did not show what the ocean level was. Levels run with a transit to flood lines well marked by debris showed elevations of I I .7 and I 2 . I feet above sea level. Although these lines are clear and show that water definitely reached these elevations, it must be remembered that the highest debris may have been deposited by swash. Sea level was probably somewhere between I I or I 2 feet above normal for a short time at the peak of the storm. Schafer ( I 966) calculated the height of storm surge based on weather observations and felt that agreement between the observed and computed heights was satis- factory. The I 954 storm had a maximum surge of g to I O feet (Schalk I 957).
Wave height was also estimated by observers during the storm and was thought to have been about I O feet. Wave-height estimates are notoriously exaggerated so checks were attempted. Trigonometric calculations based on photographs taken at about noon suggest a wave height of about 6 feet. This figure is certainly low because the photographs were taken before the peak of the storm. Again, theoretical calculations were made by Hume (1965). He found that assuming a fetch of about 75 miles, winds of 35 to 40 knots could have built waves 1 2 feet high. It would seem, therefore, that the estimate of I O feet which was made during the storm was probably a good one.
As a result of the high water and waves, low-lying areas were flooded (Fig. I ) . Near the Camp, the water flowed over the beach and down the back slope into the Camp area. A temporary lake was created which had an elevation of 9.2 feet above sea level. The lake extended about % of a mile inland directly behind the Camp. This lake might have grown deeper if an outlet into Elson Lagoon had not been created by the erosion of a road landward of the airport. The entire Barrow spit was under water except for a few high areas, chiefly on the tip of Point Barrow itself. In general, the water landward from the Camp was from I to 3 feet deep, although deeper pockets must have existed. Areas near the village were not flooded as badly because the beaches there are backed by higher tundra.
Damage to government installations at the Camp was estimated at about $3 million; the village estimate was $250,000. As repairs are made, these estimates are shown to be close to the actual loss (J. Schindler 1964, personal communication). Major damage to the Camp consisted of
SHORELINE PROCESSES NEAR BARROW 97
contamination of the water supply, destruction of 70 per cent of the air- strip, and loss of 6 buildings, two with scientific equipment. Supplies and stores were floated away and damaged by salt water. The roads were eroded badly and a timber bridge, located just southwest of the Camp, floated back onto the tundra. In addition, the foundations of almost all the buildings were eroded, a process which usually resulted in structural damage. Three buildings, one a large quonset, were actually floated away (Brewer I 963). In all likelihood, more buildings would have been rafted if the water level had remained high for a greater period of time.
In the village, the chief items of loss were: 32 homes, 15 of which were totally destroyed; 250,000 gallons of fuel; and 3 small airplanes (Brewer
The damage was caused by wave action and by a combination of high water and current. Exposure to salt water, of course, was also a factor. Most of the buildings that were lost were within direct reach of the storm waves or were built on bluffs which were eroded. Of possible significance is the fact that many were also in areas where the beach had been robbed of gravel for construction and fill.
During the I 964 field season, reconnaissance flights were made for several hundred miles along the coast both southeast and southwest of Barrow. Several selected sites were visited on the ground (Hume 1965). The area between Wainwright and Barrow had suffered the strongest attack. The effects of the storm decreased gradually in both directions from this zone. Damage had occurred as far east as Barter Island, where a storm surge of 5% feet occurred. To the southwest, a surge of about g feet was noted near Point Lay. In general, the observations showed that the storm effects were worst west of Point Barrow. This is to be expected because that part of the coast is exposed to the west storm winds. To the east of Point Barrow, the barrier islands between it and Cape Simpson had been drastically altered by erosion and breaching. Near Cape Simpson, some ice must have been present and, though sea level had risen 7 to 8 feet, little damage had occurred because waves were damped by the ice. From there eastward, the storm surge decreased, although the difference along the coast does not seem to have been great. Locally, exposure on the west side of points made the flooding and beach changes greater.
1963).
STORM EFFECTS COMPARED WITH EFFECTS OF NORMAL PROCESSES
It was fortunate that the storm occurred shortly after the completion of detailed measurements of some of the key coastal areas. I t was equally fortunate that freeze-up followed shortly after the storm and preserved, relatively unchanged, the alterations in the beaches. Resurveys permit a comparison of the effects of the normal year-to-year processes with those caused by the greatest storm ever known in the area.
Probably the most obvious change was that on Barrow spit, where breaches were formed, turning Point Barrow into an island. In past times, waves have been seen to break over the spit (Ray 1885; Schalk 1963), but

98 SHORELINE PROCESSES NEAR BARROW
,101 Alllll .*OIOUL.**
FIG. 7 Map of the Barrow spit showing breached zone and areas of growth. Data from air photo- graphy contracted for by the U.S. Army Cold Regions Research and Engineering Laboratory.
no breaches were ever reported. On July 1964, when the area was first visited after the melting of the ice and snow, it was found that three main breaks or guts existed in the Barrow spit (Fig. 7). The first gut was northeast of the airport and was about 200 €eet wide and up to 4 feet deep. Beyond this gap was a series of islands extending 1,500 feet to the northeast. The second major break was about 400 feet wide with a maximum depth of slightly over 4 feet. Beyond this gap to the northeast was another series of islands. Several minor breaks a few feet wide and up to I foot deep were found. I t is very likely that these were above water at times of low tide. The northeastern gut was 1200 feet across with a maximum depth of 5 feet. What had been the widest section of the old Barrow spit extended beyond the gap to Point Barrow.
In 1962, new plane-table maps had been completed of the western side of Point Barrow and the tip of Eluitkak spit. Resurvey of these two areas in I 964 showed the immense quantity of material that had been carried by the longshore transport of the 3 October 1963 storm. At Point Barrow (Fig. 2) average yearly transport had been approximately 10,000 cubic yards per year. An isopach map made of the sediment added to the south- west side of Point Barrow between 1962 and 1964 showed that approxim- ately 200,000 cubic yards of sediment had been deposited. Most of this can be attributed to the 3 October 1963 storm because no other ma-jor storm occurred between the surveying dates in I 962 and 1964. In addition to the 200,000 cubic yards, some material must have bypassed the Point. After the breaks in the spit were formed, and to some extent before, it can also be assumed that much material was washed through the gaps or over the beaches into the lagoon and never reached the point. The storm of 1963 would appear to have added to the Point the sediment of at least 20 years of normal longshore transport. Similar data for the tip of Eluitkak spit is not quite so startling. Approximately 22,000 cubic yards of coarse sand were added to the tip, an extension southeastward of about 45 feet. In addition to growing wider and longer, the highest elevations at the end of the spit were increased from 4 feet to about 7 feet above sea level. As might be expected, this growth was less than that on the west side of Point Barrow, because the area was partially sheltered by Point Barrow and the Barrow spit.

SHORELINE PROCESSES NEAR BARROW 99
FIG. 8 The beach southwest of Camp. Government buildings just visible in the background. The steep slope is the result of the 1963 storm. Eroded remnants of sediments under the old beach are
visible.
Changes caused by the storm of 1963 to the beaches were also extreme; in most cases they were increased in elevation from I to 2 feet. They also tended to be steepened in slope and this was often accompanied by a shore- line retreat (Fig. 8). Northeast of the breaks in the Barrow spit, the shore- line retreat averaged about 30 feet. This area, however, faced into the storm more directly than others. The bluffs southwest of Barrow were found to have retreated approximately I O feet. This retreat is not consi- dered complete because large ice masses were found exposed in the bluffs. As these ice masses melt, the sediments above will collapse.
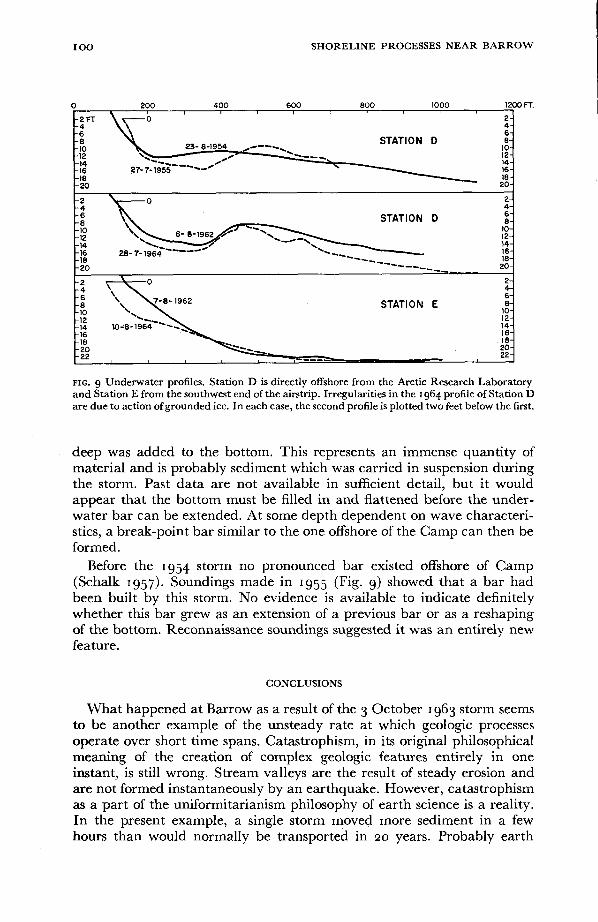
Underwater changes were not noticeable, although they were also large compared with yearly variations. The most obvious change was found in the underwater bar (Fig. 9) which is about 400 feet offshore from the Arctic Research Laboratory. This bar was found to have grown 1000 to I 200 feet to the northeast. Between I 960 and I 961, an average year, the bar grew 300 to 400 feet. Thus, the storm of 1963 resulted in a net growth equivalent to that normally occuring over a period of from 3 to 4 years. A less noticeable change was also found in the area opposite the southwestern end of the airport (Fig. 9). Here a blanket deposit of fine silt about I?/Z feet
I O 0 SHORELINE PROCESSES NEAR BARROW
0 200 400 600 800 1000 1200 FT. 1 I
-2 FT -4 4-
2-
-8 STATION D 6-
- 10 23- 84954 /c---. 8-
10-
6
-12 -14 -16 -18 - 20
"_ 12- /- \ 14- 16-
18- 20-
2- 4- 6- 8- 10- 12- 14- 16- 18- 20-
2- 4- 6-
10-
14- 12-
16- 18- 20- 22-
STATION D
- 20
STATION E 8-
-18 - 20
FIG. g Underwater profiles. Station D is directly offshore from the Arctic Research Laboratory and Station E from the southwest end of the airstrip. Irregularities in the I 964 profile of Station D are due to action of grounded ice. In each case, the second profile is plotted two feet below the first.
deep was added to the bottom. This represents an immense quantity of material and is probably sediment which was carried in suspension during the storm. Past data are not available in sufficient detail, but it would appear that the bottom must be filled in and flattened before the under- water bar can be extended. At some depth dependent on wave characteri- stics, a break-point bar similar to the one offshore of the Camp can then be formed.
Before the 1954 storm no pronounced bar existed offshore of Camp (Schalk 1957). Soundings made in I 955 (Fig. 9) showed that a bar had been built by this storm. No evidence is available to indicate definitely whether this bar grew as an extension of a previous bar or as a reshaping of the bottom. Reconnaissance soundings suggested it was an entirely new feature.
CONCLUSIONS
What happened at Barrow as a result of the 3 October 1963 storm seems to be another example of the unsteady rate at which geologic processes operate over short time spans. Catastrophism, in its original philosophical meaning of the creation of complex geologic features entirely in one instant, is still wrong. Stream valleys are the result of steady erosion and are not formed instantaneously by an earthquake. However, catastrophism as a part of the uniformitarianism philosophy of earth science is a reality. In the present example, a single storm moved more sediment in a few hours than would normally be transported in 20 years. Probably earth
I O 1
science processes should be considered as slow and steady over long time spans, but highly variable over short time spans. The shoreline constantly changes, but'suddenly one storm picks up the entire coastal fringe and, a few hours later, deposits it miles away. Then the slow but irregular long- shore transport continues.
A practical consideration also arises from this study. If, as has been suggested, the climate is becoming warmer as a result of the addition of carbon dioxide to the atmosphere (Plass 1956; Callender I 958; Kaplan 1960; Mitchell I 965), the likelihood of an open ocean and strong winds coinciding to produce such a storm in the future is constantly increasing. Another such storm can be expected, and care should be exercised in the selection of building sites and construction methods. The best sites would be at least 30 feet above sea level and either inland or along a coast which is not eroding. If a site which is low and near the ocean must be used, then a protected position leeward of a point or island would be best. The buildings should be built on the highest points available, away from areas of rapid erosion, and should be erected on piles to put them above the reach of the water. Finally, borrowing from the beaches should be kept to a minimum. The best protection that such an installation can have is a naturally high, coarse beach. Building of groins, beakwaters, and other structures will never be an economical substitute where strong ice action is found. In northern Alaska, the coast is one of transgression, with the recent dominant action being coastal submergence. The gravel along the beaches is a concentration of the coarse sediment from a large mass of material over a long period of time. It cannot be replaced by natural processes without a large amount of erosion. It should, as much as possible, be left in place as protection. Where need and economics dictate that borrowing must be done. it should be recognized that the protective nature of the beach is being reduced.
j
ACKNOWLEDGEMENTS
Support has been provided by the Arctic Institute of North America under contractual arrangements with the Office of Naval Research. Field support was provided by the Arctic Research Laboratory. The director, Max Brewer, the assistant director, .John Schindler, the staff, and investigators were all very helpful. Patricia W. Hume helped immen- sely in both field and laboratory work. Donald B. Biederman, Geoffrey W. Smith, George Denton, and Bonnie Ann McGregor have served ably as assistants. Jerry Brown provided the photographs for Figs. 4, 5 , and 6, and helped otherwise. Nancy A. Case assisted with the manuscript. The U.S. Army Cold Regions Research and Engineering Laboratory provided the negatives from which Figure 7 was made. C. Ray Bane, F. E. Durham, J. Hefner, B. Meyer, H. Hunton, and H. Olson provided information about storm damage in areas other than Barrow.
SHORELINE PROCESSES NEAR BARROW
REFERENCES
ARCTIC RESEARCH LABORATORY, BARROW, ALASKA, 1963. Progress report f o r month of October, 1963. 3' PP.
REAL, M. A., 1957. Barrow Sea Valley study and tide gage installations. Arctic Institute of North America Project ONR-165. Final Report. University of California, Scripps Institution of Oceanography 57-36. 22 pp.
CALLENDAR, G. s., 1958. On the amount of carbon dioxide in the atmosphere. Tellus, I O :
243-48. CARSON, c. E., and K. M. HUSSEY, I 962. The oriented lakes of Arctic Alaska. Journal of Geology,
70: 4'7-39. and __ , 1963. The oriented lakes of Arctic Alaska: a reply. Journal of
Geology, 71 : 530-3 I .
HUME, J. D., 1963. Sediment transportation near Barrow, Alaska. Arctic Institute of North America Project ONR-259, 282, 309. Final Report. 76 1. Unpublished manuscript.
, 1964. Floating sand and pebbles near Barrow, Alaska. Journal of Sedimentary Petrology, 34:'532-36.
, 1965. Shoreline changes near Barrow, Alaska, caused by the storm of October 3, 1963. Arctic Institute of North America Project ONR-343. Final Report. Unpublished manu- script, 63 pp.
and M. SCHALK, I 964. The effects of ice-push on Arctic beaches. American Journal of Science, 262: 267-73.
KAPLAN, L. D., 1960. The influence of carbon dioxide variations on the atmospheric heat balance. Tellus, 12: 243-48.
LEFFINGWELL, E. deK., 1919. The Canning River region, northern Alaska. U S . Geological Survey Professional Paper 109. 251 pp.
MCCARTHY, G. R., 1953. Recent changes in the shoreline near Point Barrow, Alaska. Arctic, 6: 45-51.
MITCHELL, J. M., JR., 1965. Theoretical paleoclimatology. H. E. Wright and D. G . Frey, ed. T h e Quaternary of the United States. Princeton: Princeton University Press, pp. 881-901.
PLASS, G. N., 1956. The carbon dioxide theory of climate change. Tellus, 8: 140-54.
PRICE, w. A,, 1963. The oriented lakes of Arctic Alaska: a discussion. Journal of Geology, 71: 530-31.
RAY, P. n., I 885. Report of the international polar expedition to Point Barrow, Alaska in response to the resolution o f the House o f Representatives of December 11, 1884. Washington: Government Printing Office. 695 pp.
REX, R. w., 1964. Arctic Beaches, Barrow, Alaska, in Papers in Marine Geology, R. L. Miller, ed., pp. 384-400. New York: The Macmillan Company.
and E. J. TAYLOR, 1953. Littoral sedimentation and the annual beach cycle of the Barrow, Alaska, area. Stanford University Office of Naval Research, Final Report, sec. 2, Contract NONR 225 (09). 67 pp.
SCHAFER, P. J., 1966. Computation of a storm surge a t Barrow, Alaska. Archiv f u r Meteoro- logic, Geophysik und Bioklimatologie, Serie A: Meteorologie und Geophysik, 15: 372-93.

SHORELINE PROCESSES NEAR BARROW
SCHALK, M., 1957. Beach and nearshore studies, Point B~rrow, A laska , conducted during the period 3.5~ 1g54-January 1957. Woods Hole OceancJgraphic Institution Reference No. 5 7 - 4 3 .
Unpublished manuscript, 57 pp.
"- , 1963. Study of nearshore bottom projiles east and southwest o f Point Barrow, Alaska: comparison of projiles in the Point Lay and Plover Island areas. Arctic Institute of North America Projects ONR-217, 2 4 1 . Final Report. 16 1. Unpublished manuscript.
SWITHINBANK, c. , 1960. Ice atlas of Arctic Canada. Ottawa: Defence Research Board. 67 pp.
us . ARMY CORPS OF ENGINEERS, 1962. Report on hurricane Carla, September 9 - 1 2 , 1961. 29 PP.
U.S. HYDROGRAPHIC OFFICE, 1958. Oceanographic atlas of the polar seas, Part 2 Arctic, H. 0. Publication No. 705. 149 pp.
U.S. WEATHER BUREAU, 1963. Local climatological data, Airport Station, Barrow, Alaska. Unpublished.