Shopper tribesb2de0febdea80fa78eb4-5cad31df697fe43d78c0459eba68b1d4.r36.c… · 2015-09-09 ·...
13
Shopper tribes
Transcript of Shopper tribesb2de0febdea80fa78eb4-5cad31df697fe43d78c0459eba68b1d4.r36.c… · 2015-09-09 ·...

Shopper trib
es

Shopp
er tribes
Shopp
er tribes
02
01
For a third consecutive year, we have partnered with retail specialists, Conlumino, to uncover the latest consumer shopping patterns. Our inaugural ‘Reshaping of Retail’ report in 2013 identified the Considered Consumer; the shopper who thinks more carefully about purchasing, takes time to research the best bargains and cares more about value than pure acquisition. Last year we looked at how the Considered Consumer approaches the buying process, with browsing, researching and comparing products taking an ever greater proportion of the overall shopping mission.
This year, with major economic indicators pointing to a sustained recovery, we revisit the Considered Consumer. The research reveals that, whilst the green shoots of recovery are finally feeding through to consumer spending, frugal habits adopted during the recession die hard. Shoppers have developed an array of tools to enable them to hunt down the best bargains, waste less and prioritise quality and value. A rapid proliferation of shopping channels and fulfilment options have impacted different groups of consumers in interesting – and often surprising – ways. Within this report we identify three broad shopper tribes:
• Channel surfing enthusiasts• Time-stretched value hunters• Focused functional spenders
Our research indicates that attitudes towards evolving retail trends such as multichannel shopping, promotions including Black Friday, and ethical sourcing not only differ between tribes but often within them, providing real insight for retailers.
Armed with a host of new research tools, consumers are far more informed than ever before. They want a more personal experience from their shopping trip, where they curate the ‘how’, the ‘when’ and the ‘where’. As ever, there will be winners and losers across the sector. Retailers that have identified and understand their customer, articulating a clear proposition and incorporating a seamless multichannel offer, will succeed.
It’s arguably one of the most challenging – yet exciting – times to be in retail.
Foreword
David AtkinsChief Executive

Shopp
er tribes
Shopp
er tribes
02
03
The ConsideredConsumer revisited
Chapter 1
Old habits die hard
In this year’s survey, shoppers revealed to us that they are still focused on: bargain hunting, trading down, cutting back and thinking more/buying higher quality. With almost two thirds of people bargain hunting since the downturn and close to 84% of those planning to continue shopping around for the best deals
Shopping around?
In their drive to hunt down the best bargains, consumers are widening the net of potential retailers. The younger consumers tend to be the least loyal to any particular brand, with a fifth of 18-34 year olds shopping at more retailers than they were pre-recession. Interestingly, the number of shops visited typically decreases with each advancing age group, with close to half of the over 55s shopping regularly at 3 or fewer retailers.
of 18-34 year olds shop at 9+ retailers
17.1%
The age of the Considered Consumer is well established. The days of frivolous, debt-fuelled consumption that accompanied the boom years are long gone. But even with the economic recovery now firmly on track and retail spend on the rise, many consumers remain firmly wedded to the habits they adopted during the recession.
Bargain hunting Cutting backTrading down Thinking more/ Buying higher quality
62.6
83
.9
78.7
68.5 7
7.0
48.2
45.5
44
.6
when the economy recovers, it is unlikely that the popularity of the discount sector will dissipate any time soon. Whilst all four shopping patterns are now deeply ingrained in the Considered Consumer’s psyche, cutting back is most likely to be relaxed as disposable income recovers and consumers loosen the purse-strings.
And when buying non-grocery products, are you regularly shopping at more or fewer different retailers throughout the year now compared to before the economic downturn started?
More retailersAbout the sameFewer retailers
1-3 retailers4-8 retailers 9+ retailers
Have been doing since the downturn Will carry on after downturn
How many different retailers do you regularly use throughout the year when buying non-grocery products?
Post recession shopping habits
20.0 74.6
73.4
79.8 10.4
9.748.941.555+
55+
10.0
11.652.336.135-54
35-54
5.4
17.145.937.118-34
18-34
16.7
9.8

Shopp
er tribes
Shopp
er tribes
04
05The keenest shopper tribe
They spend a long time browsing
The tribe surf a variety of retailers and devices/channels
The pack shops regularly
Price and product range is of primary importance
Despite being amongst the hardest hit by the recession, they have been more reluctant to cut back than other tribes
Most of this tribe enjoy shopping but don’t get to do it much
They spend most as a group in terms of broad contribution to retail spend
But exhibit most characteristics of the modern Considered Consumer
The tribe are frugal, with the sharpest focus on price
Zoning in on a good deal, they are the most promotion driven bunch
The fastest growing tribe and forecast to be the biggest contributors to growth in non-food retail spend over the coming years
Most likely to regard shopping as a chore, with tribal men particularly averse
Convenience, quality and service are more important for this group than others
Highly focused, this tribe are efficient shoppers
They show loyalty to a smaller range of trusted retail brands
The tribe is ethically minded, although least keen to pay a premium
New shopper tribesChapter 2
Channel surfing enthusiasts18-34 years old
Time-stretchedvalue hunters35-54years old
Focused functionalspenders55+ years old
46
.8
63
.3 70.1
Convenience
71.0
79.
8
77.
2
Price
29.
0
31.2
40.6
Service/experience
47.8
58.6
74.2
Range
19.8
28.6
37.3
Facilities
26
.3
44
.9
62.4
Quality
11.8
12.8 17
Others
13.8
20.7 2
8.4
Online
Which factors are important to our three tribes?
Shopp
er tribes
Shopp
er tribes
06
07
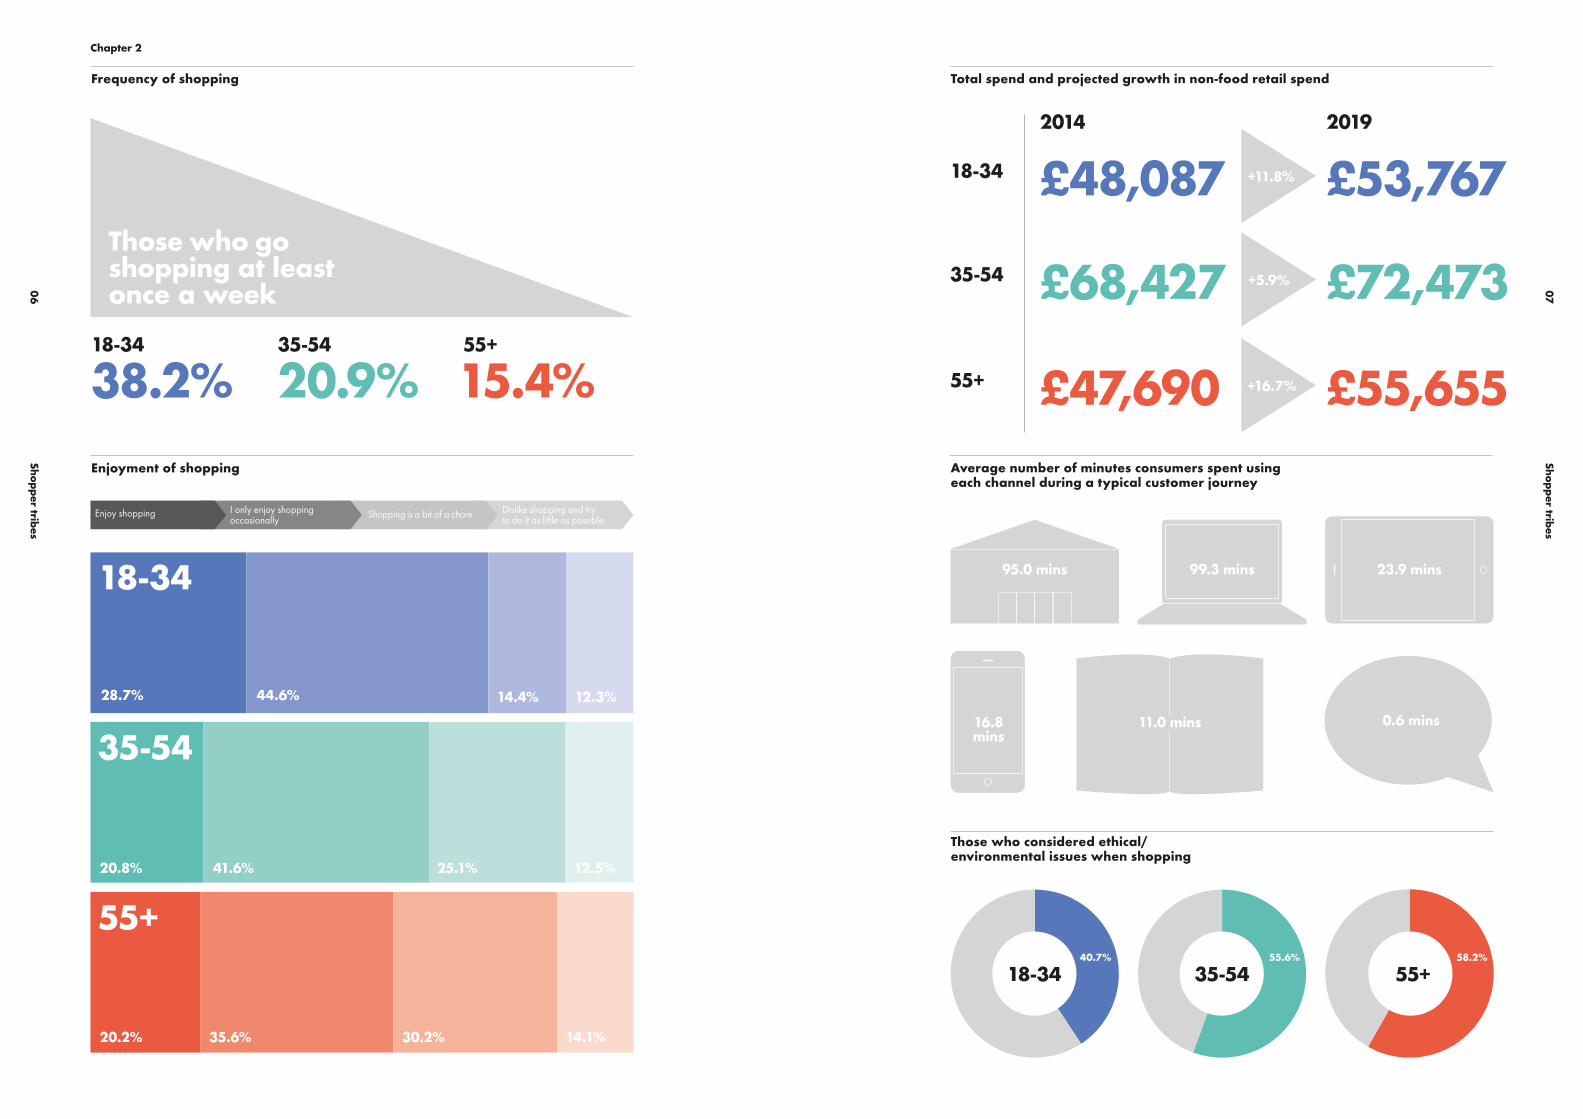
35-54 55+18-3440.7% 55.6% 58.2%
18-34
38.2%
28.7%
Enjoy shopping
44.6%
I only enjoy shoppingoccasionally
20.8%
20.2% 35.6% 30.2% 14.1%
41.6% 25.1% 12.5%
35-54
20.9% 55+
15.4%
£68,427
£47,690
£48,087
£72,473
£55,655
£53,767Those who go shopping at least once a week
18-34
35-54
55+
+5.9%
+16.7%
+11.8%18-34
2014 2019
35-54
55+
Enjoyment of shopping
Frequency of shopping
Average number of minutes consumers spent using each channel during a typical customer journey
Total spend and projected growth in non-food retail spend
Those who considered ethical/environmental issues when shopping
Chapter 2
99.3 mins95.0 mins
16.8mins
11.0 mins 0.6 mins
23.9 mins
14.4%
Shopping is a bit of a chore
12.3%
Dislike shopping and try to do it as little as possible

Shopp
er tribes
Shopp
er tribes
10 11
Discounting is losing its impact as more and more retailers are having sales all year round
I like to wait until a product I want is discounted or on offer before purchasing
Retailers sometimes exaggerate the levels of discounting that they offer
For some product types, I very rarely purchase at full price
Promotions arehere to stay
Chapter 3
40.2
51.9
70.8
57.1
42.9
57.4
62.5
54.9
35.3
59.1
72.6
57.7
43.1
40.8
75.8
58.4
Avg.
Views on promotions
18-34 45-54 55+ Values in %
It comes as little surprise in the era of the Considered Consumer that planned purchasing represents the largest portion of consumer spending across all shopper tribes, but it’s the Focused functional spenders out in front with more than half of non-food spending dedicated to this category. The Time stretched value hunters are most drawn to promotions, whilst the Channel surfing enthusiasts are most likely to splash out on luxury items (with men noticeably more flashy than their female counterparts!)
Half price deals are the most effective form of promotion, with over three-quarters of consumers surveyed finding them either appealing or very appealing. They resonate particularly well with the Focused functional spenders, as opposed to limited time or online only offers which appeal most to Channel surfing enthusiasts.
Promotional fatigue – but half price deals too good to resist
Promotional activity increased significantly in the wake of the downturn and is now a mainstream feature of the retail environment. However, with a growing number of retailers offering all year round sales, a significant majority of consumers now rarely purchase items at full price and feel that discounting is losing its impact.
18-34 35-54 55+
35.2 43.1 51.6
17.1 19.5 17.3
11.1 8.3 8.3
17.1
14.0
11.0
20.2 15.4 13.0
Luxury spendfor 18-34’s
How appealing is each type of promotion to consumers?
What drives the purchasing decision?
Store only promotions
8.2 34.2 45.2 8.4
Online only promotions
7.7 30.1 39.5 13.8 8.9
23.3 38.7 19.3 12.76.0
Limited time promotions
Money-off everything promotions
19.3 47.9 28.41.2
3.2
1.1
Half-price promotions
38.9 37.8 21.2
0.9
13.2
%
9.5%
Very appealingAppealingNeutral
ImpulseBrowse & PurchasePlanned/researched
UnappealingVery unappealing
Promotion drivenLuxury spend
4.0
Shopp
er tribes
Shopp
er tribes
12 13
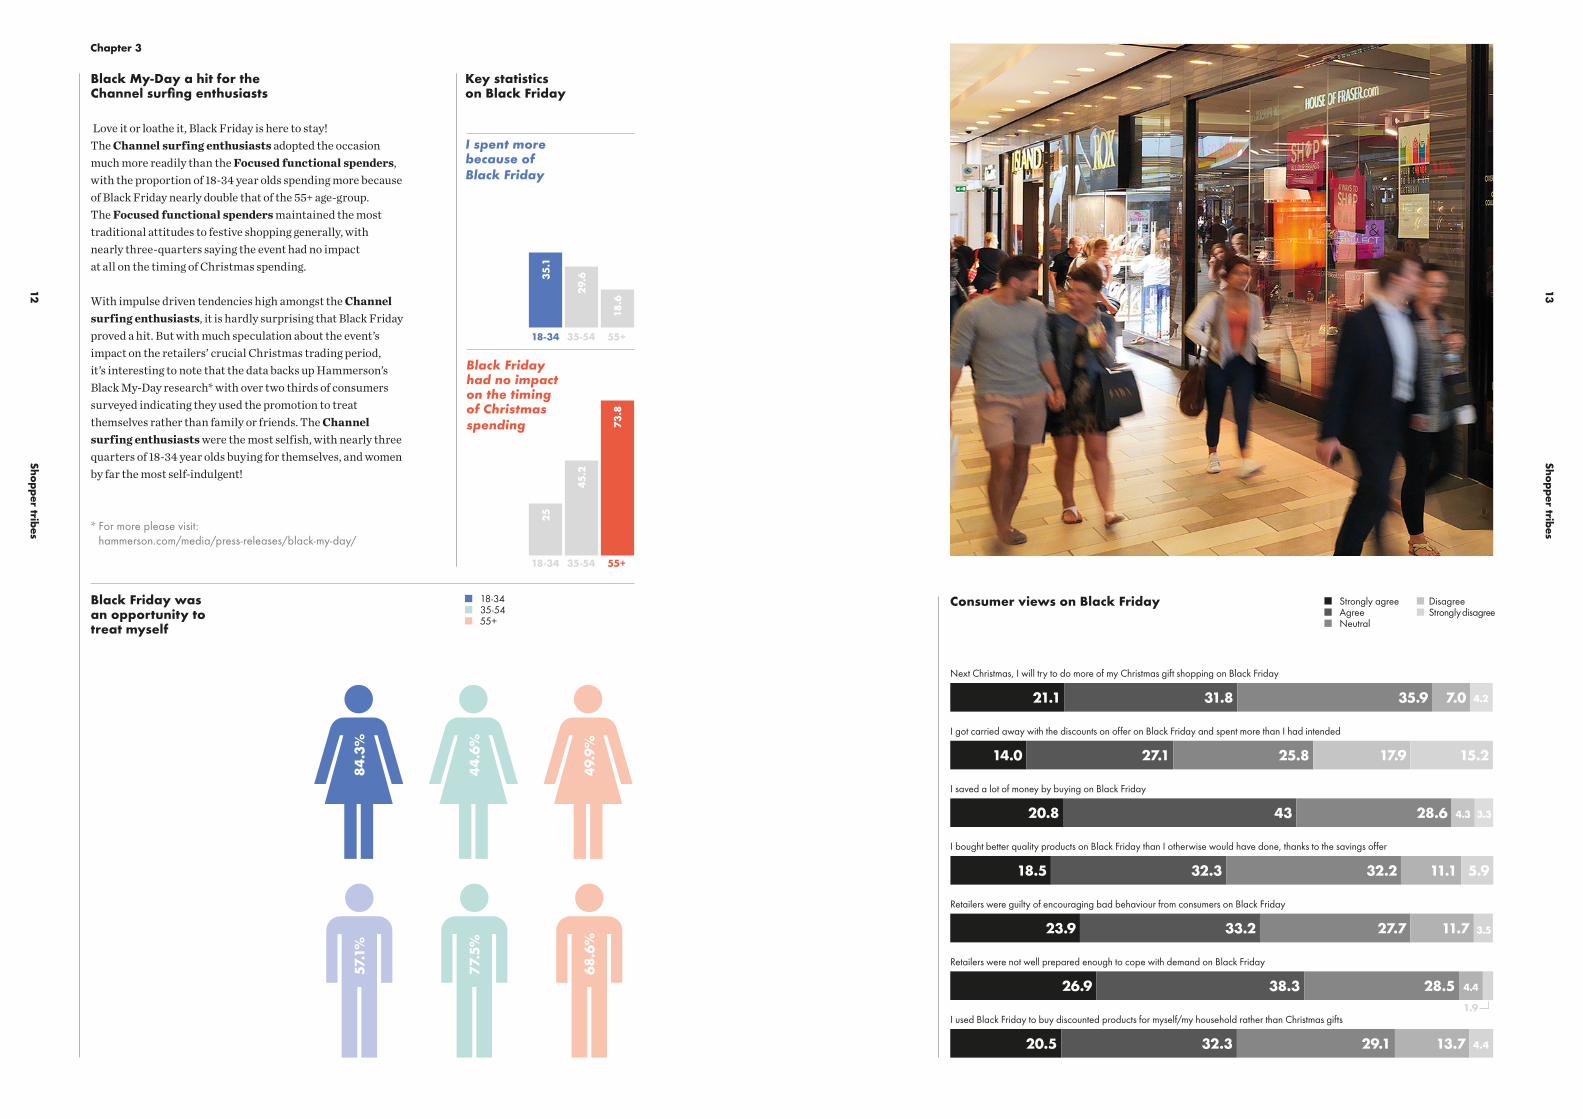
I got carried away with the discounts on offer on Black Friday and spent more than I had intended
Retailers were guilty of encouraging bad behaviour from consumers on Black Friday
I saved a lot of money by buying on Black Friday
Retailers were not well prepared enough to cope with demand on Black Friday
I used Black Friday to buy discounted products for myself/my household rather than Christmas gifts
21.1
18.5 32.3
14.0
23.9
20.8
26.9
20.5
27.1
43
38.3
32.3
25.8
33.2
28.6
28.5
29.1 13.7
17.9
27.7
15.2
11.7
31.8
32.2
35.9
11.1
7.0
5.9
4.3
4.4
3.3
3.5
1.9
4.4
4.2
Next Christmas, I will try to do more of my Christmas gift shopping on Black Friday
I bought better quality products on Black Friday than I otherwise would have done, thanks to the savings offer
Black My-Day a hit for the Channel surfing enthusiasts
Love it or loathe it, Black Friday is here to stay! The Channel surfing enthusiasts adopted the occasion much more readily than the Focused functional spenders, with the proportion of 18-34 year olds spending more because of Black Friday nearly double that of the 55+ age-group. The Focused functional spenders maintained the most traditional attitudes to festive shopping generally, with nearly three-quarters saying the event had no impact at all on the timing of Christmas spending.
With impulse driven tendencies high amongst the Channel surfing enthusiasts, it is hardly surprising that Black Friday proved a hit. But with much speculation about the event’s impact on the retailers’ crucial Christmas trading period, it’s interesting to note that the data backs up Hammerson’s Black My-Day research* with over two thirds of consumers surveyed indicating they used the promotion to treat themselves rather than family or friends. The Channel surfing enthusiasts were the most selfish, with nearly three quarters of 18-34 year olds buying for themselves, and women by far the most self-indulgent!
* For more please visit: hammerson.com/media/press-releases/black-my-day/
Black Friday was an opportunity to treat myself
Key statistics on Black Friday
Consumer views on Black Friday
18-34
18-34
35-54
35-54
55+
55+
I spent more because of Black Friday
Black Friday had no impact on the timing of Christmas spending
35.1
25
29.
645.2
18.6
73.8
Strongly agreeAgreeNeutral
DisagreeStrongly disagree
Chapter 3
18-3435-5455+
57.1
%
77.
5%
68.6
%
84.3
%
44.6
%
49.9
%
Shopp
er tribes
Shopp
er tribes
14 15
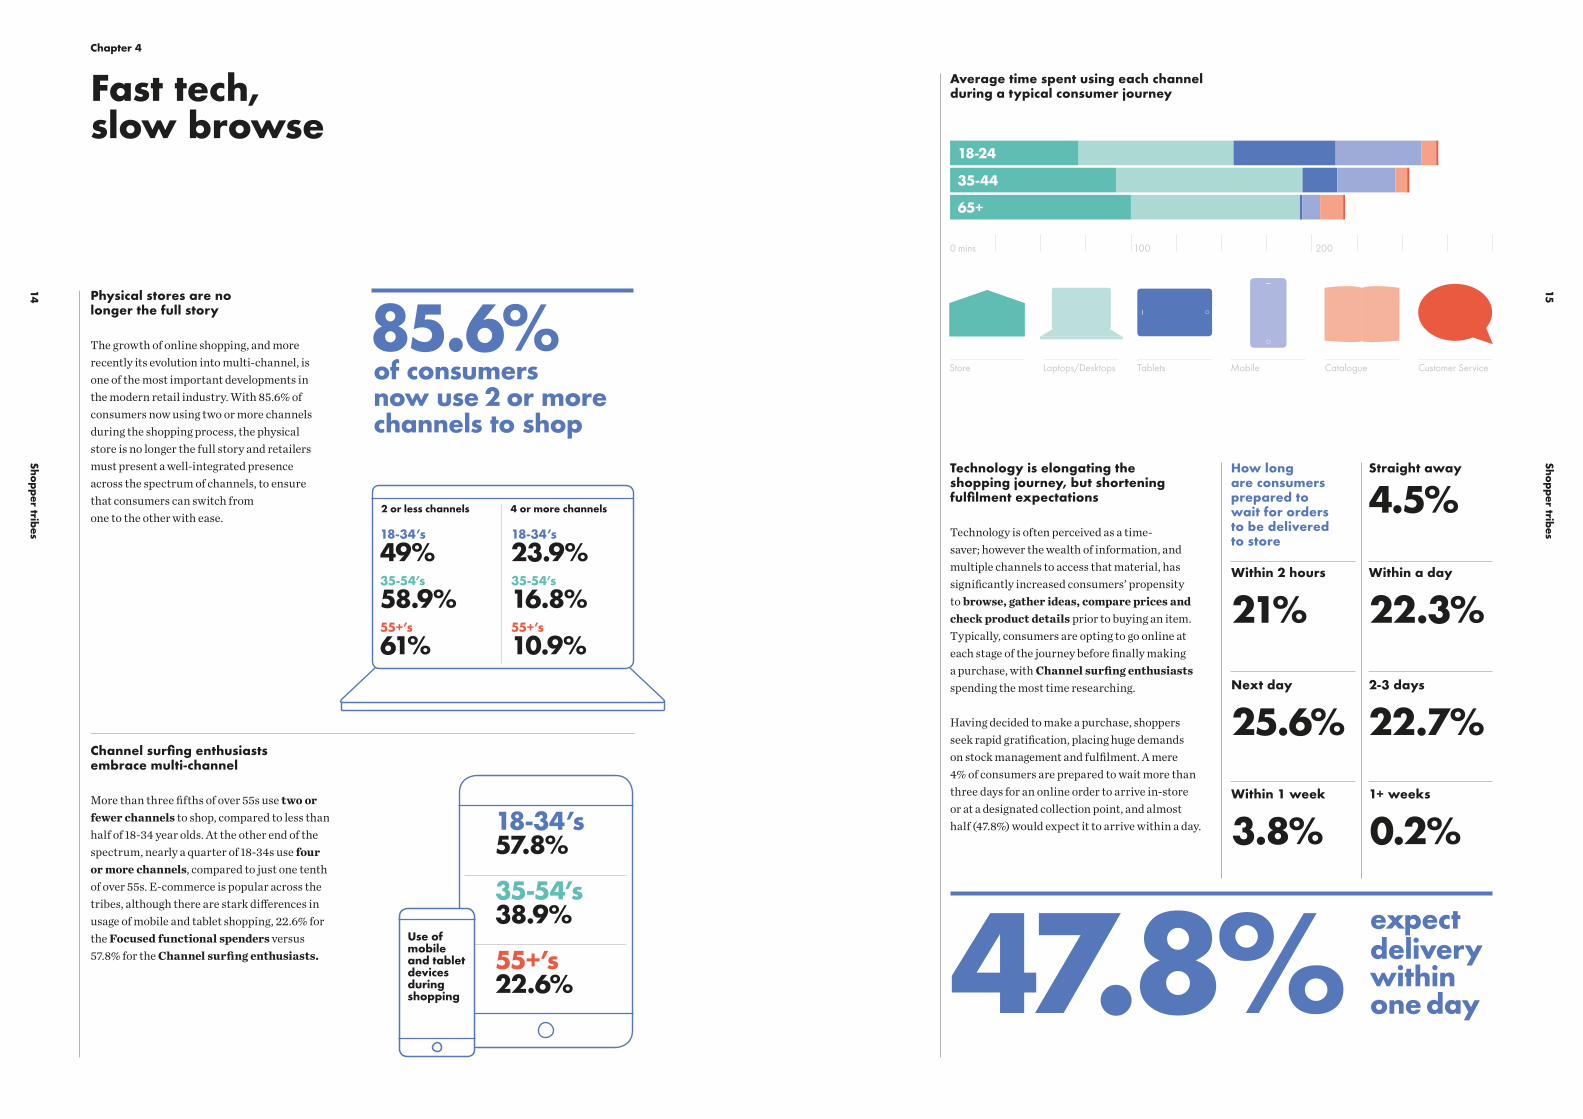
Fast tech, slow browse
Chapter 4
Physical stores are no longer the full story
The growth of online shopping, and more recently its evolution into multi-channel, is one of the most important developments in the modern retail industry. With 85.6% of consumers now using two or more channels during the shopping process, the physical store is no longer the full story and retailers must present a well-integrated presence across the spectrum of channels, to ensure that consumers can switch from one to the other with ease.
Channel surfing enthusiasts embrace multi-channel
More than three fifths of over 55s use two or fewer channels to shop, compared to less than half of 18-34 year olds. At the other end of the spectrum, nearly a quarter of 18-34s use four or more channels, compared to just one tenth of over 55s. E-commerce is popular across the tribes, although there are stark differences in usage of mobile and tablet shopping, 22.6% for the Focused functional spenders versus 57.8% for the Channel surfing enthusiasts. 47.8% expect
delivery within one day
How long are consumers prepared to wait for orders to be deliveredto store
Straight away
Within a day
2-3 days
1+ weeks
Within 2 hours
Next day
Within 1 week
4.5%
22.3%
22.7%
0.2%
21%
25.6%
3.8%
18-34’s
49%35-54’s
58.9%55+’s
61%
18-34’s
23.9%35-54’s
16.8%55+’s
10.9%
18-34’s57.8%
35-54’s38.9%
55+’s22.6%
2 or less channels 4 or more channels
Use of mobile and tablet devices during shopping
Average time spent using each channel during a typical consumer journey
0 mins 100 200
18-24
Store Laptops/Desktops Tablets Mobile Catalogue Customer Service
35-44
65+
Technology is elongating the shopping journey, but shortening fulfilment expectations
Technology is often perceived as a time-saver; however the wealth of information, and multiple channels to access that material, has significantly increased consumers’ propensity to browse, gather ideas, compare prices and check product details prior to buying an item. Typically, consumers are opting to go online at each stage of the journey before finally making a purchase, with Channel surfing enthusiasts spending the most time researching.
Having decided to make a purchase, shoppers seek rapid gratification, placing huge demands on stock management and fulfilment. A mere 4% of consumers are prepared to wait more than three days for an online order to arrive in-store or at a designated collection point, and almost half (47.8%) would expect it to arrive within a day.
of consumers now use 2 or more channels to shop
85.6%
Shopp
er tribes
Shopp
er tribes
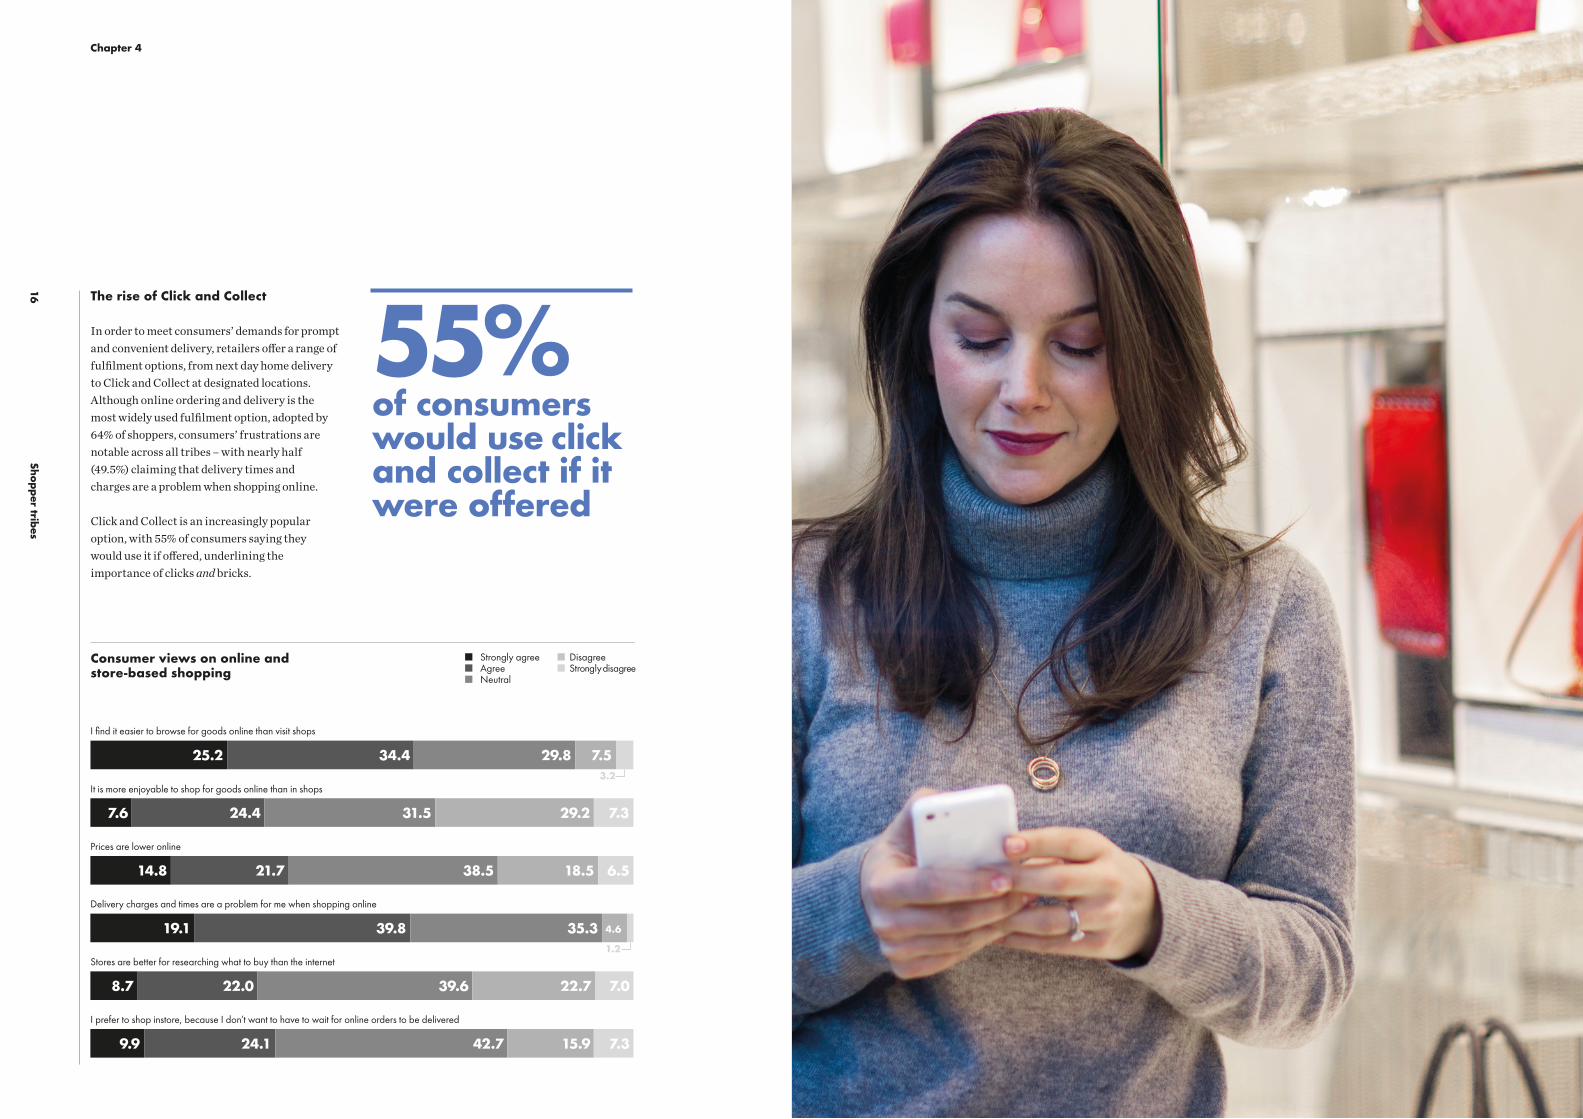
16 17The rise of Click and Collect
In order to meet consumers’ demands for prompt and convenient delivery, retailers offer a range of fulfilment options, from next day home delivery to Click and Collect at designated locations.Although online ordering and delivery is the most widely used fulfilment option, adopted by 64% of shoppers, consumers’ frustrations are notable across all tribes – with nearly half (49.5%) claiming that delivery times and charges are a problem when shopping online.
Click and Collect is an increasingly popular option, with 55% of consumers saying they would use it if offered, underlining the importance of clicks and bricks.
It is more enjoyable to shop for goods online than in shops
Stores are better for researching what to buy than the internet
Prices are lower online
I prefer to shop instore, because I don’t want to have to wait for online orders to be delivered
25.2
19.1 39.8
7.6
8.7 22.0
14.8 21.7
24.19.9
24.4
38.5
42.7 15.9
31.5
39.6
18.5 6.5
7.3
29.2
22.7 7.0
7.3
34.4 29.8 7.5
35.31.2
4.6
3.2
I find it easier to browse for goods online than visit shops
Delivery charges and times are a problem for me when shopping online
Consumer views on online and store-based shopping
of consumers would use click and collect if it were offered
55%
Strongly agreeAgreeNeutral
DisagreeStrongly disagree
Chapter 4
Shopp
er tribes
Shopp
er tribes
18 19Chapter 5
Ethical intentions vs reality
With over three quarters of consumers expressing concern over ethical and environmental issues and half reporting that they regularly take these into account when shopping, the ethical shopper is increasingly becoming a mainstream phenomenon…
…But on closer inspection, there appears to be a discrepancy between consumers’ principles and ultimate shopping habits.
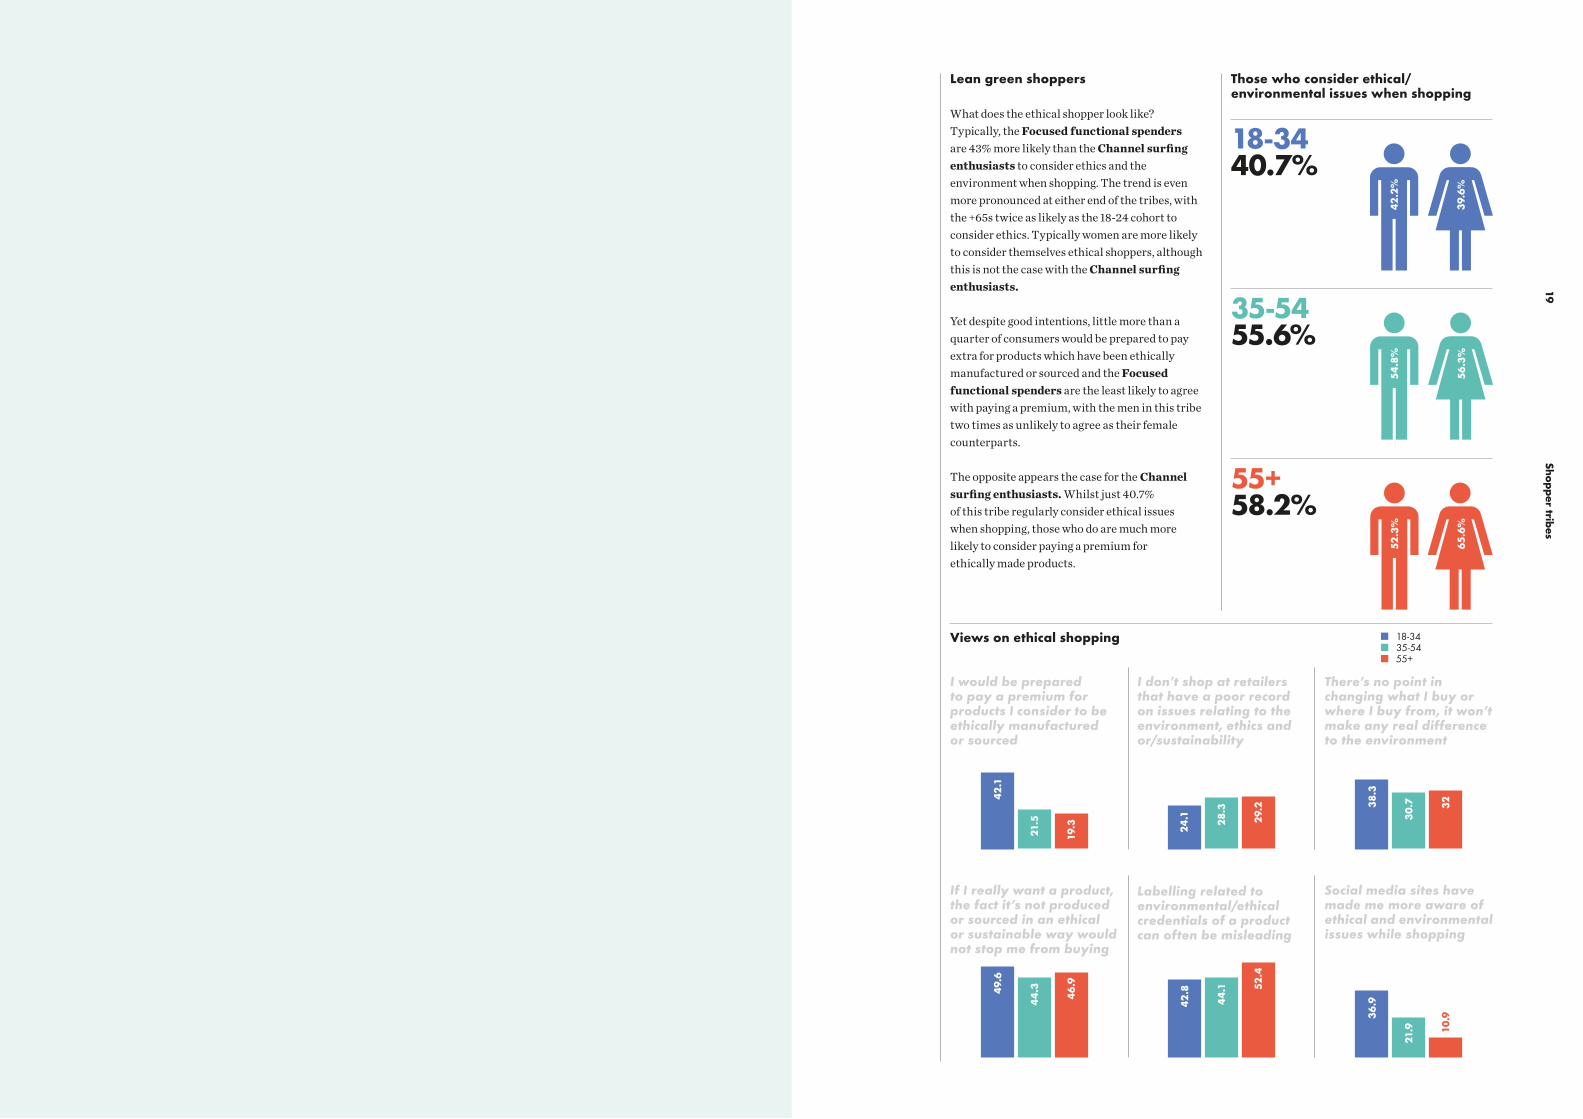
Those who consider ethical/environmental issues when shopping
Lean green shoppers
What does the ethical shopper look like? Typically, the Focused functional spenders are 43% more likely than the Channel surfing enthusiasts to consider ethics and the environment when shopping. The trend is even more pronounced at either end of the tribes, with the +65s twice as likely as the 18-24 cohort to consider ethics. Typically women are more likely to consider themselves ethical shoppers, although this is not the case with the Channel surfing enthusiasts. Yet despite good intentions, little more than a quarter of consumers would be prepared to pay extra for products which have been ethically manufactured or sourced and the Focused functional spenders are the least likely to agree with paying a premium, with the men in this tribe two times as unlikely to agree as their female counterparts. The opposite appears the case for the Channel surfing enthusiasts. Whilst just 40.7% of this tribe regularly consider ethical issues when shopping, those who do are much more likely to consider paying a premium for ethically made products.
Concerned about ethical/environmental issues
Consider ethical/environmental issues when shopping
Have started shopping at certain retailers because of their record on ethical/environmental issues
Have stopped shopping at certain retailers because of their record on ethical/environmental issues
77.5%
52.2%
23.6%
14.8%
18-3440.7%
35-5455.6%
55+58.2%
42.2
%54
.8%
52.3
%
39.
6%56
.3%
65.6
%
Views on ethical shopping
42.1
21.5
19.3 24
.1 28.3
29.
2 38.3
30.7 32
49.6
44
.3
46
.9
42.8
44
.1 52.4
36
.9
21.9 10
.9
I don’t shop at retailers that have a poor record on issues relating to the environment, ethics and or/sustainability
I would be prepared to pay a premium for products I consider to be ethically manufactured or sourced
There’s no point in changing what I buy or where I buy from, it won’t make any real difference to the environment
If I really want a product, the fact it’s not produced or sourced in an ethical or sustainable way would not stop me from buying
Labelling related to environmental/ethical credentials of a product can often be misleading
Social media sites have made me more aware of ethical and environmental issues while shopping
18-3435-54 55+

Shopp
er tribes
21
Shopp
er tribes
20 If knowledge is power, then
the Tribal Shopper is King of the modern retail world. The proliferation of research tools and digital innovations continue to elongate the shopping journey, with those undertaking each stage of the process – browsing just for fun; gathering ideas; checking prices; buying products – now spending more than four hours (246.6 minutes) on their shopping mission.
With nearly 40% of this time spent in store, there is a real opportunity for retailers to showcase the very best retail proposition, offering an experience unmatched in the online world. And landlords must also work hard to capture and extend dwell-time, providing experiences beyond pure retail that entertain and excite the whole family; put simply: where more happens.
For Hammerson this means developing properties that bring together the best in physical and digital retail destinations, where more happens for consumers and retailers, specifically:
– Developing iconic destinations– Offering the best@retail– Developing shopping centres that
are entertaining & exciting– Offering an interactive & engaging
experience for shoppers– Providing convenient & easy shopping solutions– Creating positive places for communities
Our research also confirms that habits adopted during the downturn are increasingly worn as a badge of pride across tribes, with 84% of bargain
hunters planning to continue shopping around for the best deals when the economy recovers. But with an over-saturation of special deals and one-off events, promotions are no longer packing the punch they once did. Consumers now expect a constant stream of promotional activity, with some – notably the Time-stretched value hunters – prepared to wait until an item is discounted before making a purchase. Events such as Black Friday are now firmly entrenched in the retail calendar, but with lessons learnt from 2014 it will be interesting to see what adjustments are made this year. Retailers must avoid following others into an irrational spiral of discounting by engaging tactically to protect brand value and margins.
In many ways the willingness to shop around and hunt down the best bargains has democratised shopping, giving retailers numerous opportunities to reach consumers and engage with them along the journey. The Tribal Shopper is more promiscuous, with a quarter of those at the youngest end of the Channel surfing enthusiasts now regularly shopping at nine or more retailers for non-food purchases.
Although the research demonstrates a notable disconnect between ethical concerns and ultimate purchasing decisions, it’s clear from recent media headlines and the growing influence of social networking that the spotlight on supply chain transparency, corporate taxation and fair working practices will only increase. Reputations are hard won and easily lost. Whilst retailers must continually strive for excellence and work hard to build trust, there is also a need to collaborate with landlords to better promote the sector’s immense economic and social contribution.
This report highlights the constantly evolving nature of the retail sector. To continue to succeed we need to focus on delivering destinations that combine the best in physical and digital retailing: destinations where more happens for customers, retailers and communities.
Conclusion
Report methodology:
Consumer Research in this report is based on a UK-nationally representative survey of 2,000 shoppers. All numbers relating to expenditure and forecast expenditure are taken from Conlumino’s own retail model. This is updated on an ongoing basis with inputs from official sources (such as the BRC and ONS), retailers’ results and trading updates, industry sources and other secondary sources. Unless otherwise stated all sources are derived from Conlumino’s and Hammerson’s own research and should be referenced to Hammerson/Conlumino.

hammerson.com
At Hammerson, we create destinations that excite shoppers, attract and support retailers, reward investors and serve communities;destinations where more happens.