Shoaib Adnan - BRAC University
72
Antibacterial Resistance: A Comparative Study between Clinical and Environmental Isolates Based on Whole Cell Protein Profiling by SDS-PAGE A DISSERTATION SUBMITTED TO BRAC UNIVERSITY IN PARTIAL FULFILLMENT OF THE REQUIREMENTS FOR THE DEGREE OF BACHELOR OF SCIENCE IN MICROBIOLOGY Submitted by Shoaib Adnan August, 2015 Microbiology Program Department of Mathematics and Natural Sciences BRAC University Dhaka, Bangladesh
Transcript of Shoaib Adnan - BRAC University

Antibacterial Resistance: A Comparative Study between Clinical and Environmental Isolates Based on Whole Cell Protein Profiling by SDS-PAGE
A DISSERTATION SUBMITTED TO BRAC UNIVERSITY IN PARTIAL
FULFILLMENT OF THE REQUIREMENTS FOR THE DEGREE OF BACHELOR OF SCIENCE IN MICROBIOLOGY
Submitted by
Shoaib Adnan
August, 2015
Microbiology Program
Department of Mathematics and Natural Sciences
BRAC University
Dhaka, Bangladesh

Dedicated to
My Mother
DECLARATION
I hereby declare that the thesis project titled “Antibacterial Resistance: A Comparative Study between Clinical and Environmental Isolates Based on Whole Cell Protein Profiling by SDS-PAGE” is my own work and the research work presented here is based on the actual and original work carried out by me. All the research work has been carried out under the supervision of Fahareen-Binta-Mosharraf, Lecturer, Microbiology Program, Department of Mathematics and Natural Sciences, BRAC University, Dhaka. Any reference to work done by any other person or institution or any material obtained from other sources have been duly cited and referenced.
___________________
(Shoaib Adnan)
Candidate
Certified
_________________________
(Fahareen-Binta-Mosharraf)
Supervisor
Lecturer,
Microbiology Program,
Department of Mathematics and Natural Sciences,
BRAC University, Dhaka

Acknowledgement
The accomplishment of my research work in pursuance of my dissertation is the very first
time that I have had the exposure to this kind of experimental research work. Completion
of this work needed lots of help and encouragement so as not to get frustrated at any
event of failure or whenever I stumbled upon any difficulties during this elaborate time of
the experimental works. I was fortunate enough to have the people around me who have
provided me with all the needed support.
I am heartily thankful to my parents for their moral support in every phase of my life.
They have always encouraged me in my studies and have supported me to follow my
dreams. They always provided me with the best of everything over the years.
My regards, appreciation, indebtedness and deepest gratitude towards my respected
supervisor Fahareen-Binta-Mosharraf, Lecturer, Microbiology Program, Department of
Mathematics and Natural Sciences, BRAC University, for her efforts and patience with
me throughout the period of my research work. I am extremely fortunate to have her as
my supervisor for she has constantly supervised me and bestowed upon me her
constructive criticism, expert guidance and has given me moral support and help
whenever my steps faltered during the whole period of my research work.
I also express my gratitude towards Prof. A. A. Ziauddin Ahmad, Chairperson,
Department of Mathematics and Natural Sciences, BRAC University, for his kind
cooperation, active support and constant supervision. Prof. Naiyyum Choudhury,
coordinator of Biotechnology and Microbiology program, Department of Mathematics
and Natural Sciences, BRAC University for his excellent guidance, monitoring and
constant encouragement throughout the Project. His ever so welcoming nature and the
enthusiastic will to help the students has helped me not only during this research work,
but throughout my entire time in BRAC University.
I would also like to thank and express my deepest gratitude to Dr. Mahboob Hossain,
Associate Professor, Department of Mathematics and Natural Sciences, BRAC
University who helped and guided me in my thesis report writing and has provided
suggestions regarding the setting and execution of the experimental works, interpretation

of the results and ensuing directions for the whole work with great patience. It would
have been impossible to submit my thesis report without his cordial help.
Also, my appreciation goes to all my departmental teachers who have often enquired
about the progress of my work and very often provided me with their valuable advice. I
thank them all for this kind and affectionate gesture.
I am thankful to my friend Aneeka Nawar Fatema for her continuous help for completing
this work without any obstruction.
Finally, I extend my special thanks and gratitude to all my seniors and batch mates in the
microbiology and biotechnology laboratory, who have provided good working
environment by sharing their advice and encouragement to make me feel at ease even in
the hardest times. They have willingly helped me out with their valuable information and
boosted my efforts in finishing the task properly. Without their cordial support it would
be very difficult to carry out this research work.
Shoaib Adnan
August, 2015

Abstract
This study of comparison was conducted to examine the existence of antibiotic resistant
and sensitive bacteria in various environmental samples of Bangladesh with specific
clinical strain obtained from ICDDR,B. From the month April 2014 to September 2014,
these environmental samples were isolated from different locations of Dhaka city to see
the inclination of the environmental isolates to develop antibiotic resistance at different
times of a year. The bacterial isolates were identified on the basis of standard cultural,
morphological and biochemical attributes. Antibiogram was done to determine the
antibiotic susceptibility of the isolates in the way that follows CLSI (Clinical &
Laboratory Standards Institute) guideline. The after effect of this study showed all the
clinical isolates were sensitive to these antibiotics whereas all the environmental isolates
have become resistant to the tested antibiotics, and some of them have emerged to be
multi-resistant to these therapeutic agents. The study serves to anticipate the future
emergence and aide the advancement of strategies and methods to counteract this
resistance. In this way intermittent and far reaching survey of antibiotic resistance in the
natural microbes is needed.

Contents Abstract … … … … … … … … … … … … … … … … … … … … … … … … … … v
Table of Contents … … … … … … … … … … … … … … … … … … … … … vi - viii
List of Tables … … … … … … … … … … … … … … … … … … … … … … … … x
List of Figures … … … … … … … … … … … … … … … … … … … … … … …… xi
List of Abbreviations … ... … … … … … … … … … … … … … … … … … … … xii-xii
Chapter Section Title Page
1 Introduction 1-5
1.1 Overview 1
1.2 Emerging pathogens 2
1.3 Bacterial resistance to antibiotics; now and then 2
1.4 SDS-PAGE 3
1.5 Aims and objectives 5
2 Materials and Methods 6-15
2.1 Working laboratory 6
2.2 Reference Bacterial Strains 6-10
2.2.1 Preparation of plating bacteria 6
2.2.2 Confirmation of the reference strains 6
2.2.3 Biochemical confirmation of the clinical strains 7
2.2.4 Biochemical Identification 7-9

2.2.5 Preparation of Stock Sample 10
2.3 Provided Antibiotic Discs 11
2.4 Antibiotic Susceptibility Test of the Standard Clinical
Strains of Bacteria
11-13
2.4.1 Preparation of McFarland Solution 12
2.4.2 Preparation of inoculums 12
2.4.3 Comparing with McFarland solution 12
2.4.4 Inoculation of the MHA plates 13
2.4.5 Placement of the Antibiotic Discs 13
2.4.6 Measuring zone size 13
2.5 Environmental sample 14-15
2.5.1 Sample processing 14
2.5.2 Assortment of desired colonies from nutrient agar
plates
14
2.5.3 Confirmation of the organisms by biochemical tests 15
2.5.4 Antibiotic susceptibility test of the microorganisms
from environmental samples
15
2.6 Protein profiling 15
2.6.1 Protein Extraction 15
2.6.2 Preparing SDS-PAGE gels 16
2.6.3 SDS-PAGE 18

2.6.5 Staining and distaining of gel 20
3 Results 21-62
3.1 Conformation of clinical strains 21-25
3.2 Confirmation of the environmental strains by
biochemical tests
26-27
3.3 Selective antimicrobial activity test by means of
antibiogram method
28-35
3.4 Comparative analysis of antibiotic susceptibility
profiles of clinical and environmental strains
36-38
3.5 Qualitative analysis of SDS page result 39-41
4 Discussion 41-44
5 Conclusion 45
References 46-47
Appendices 48-58

LIST OF TABLES
Serial number
Title Page
Table 1 Profile of clinical pathogens used in this study 3
Table 2 Respective selective media for different reference strains 7
Table 3 Provided Antibiotic Discs 11
Table 4 Source of environmental samples 14
Table 5 Cultural characteristics of clinical strains on respective selective media
21
Table 6 Standard results of biochemical tests of target strains 23
Table 7 Cultural characteristics of the environmental strains 26
Table 8 Biochemical test results of the environmental strains 27
Table 9 Antibiotic susceptibility test results for clinical strains 28
Table 10 Antibiotic susceptibility test results for S. flexneri collected from
chicken feces
32
Table 11
Antibiotic susceptibility test results for S. typhi collected from human
sewage sample
33
Table12 Relative migration distance of protein markers and respective log of
MW
40
Table13 Relative migration distance of unknown proteins 40
Table14 Determining molecular weight of unknown protein by interpolating
the linier equation
41

LIST OF FIGURES
Serial number
Title Page
Figure 1 Cultural characteristics of clinical strains on respective selective media 18-19
Figure 2 Biochemical tests for S. typhi 23
Figure 3 Biochemical tests for S. flexneri 24
Figure 4 Oxidase Test 24
Figure 5 Catalase test 25
Figure 6 Effect of provided antibiotics on clinical strain of S. flexneri 29
Figure 7
Figure 8 Effectiveness of the applied antibiotics on clinical strain of S. typhi 30
Figure 9
Figure 10 Effectiveness of applied antibiotics on S. typhi H3 isolate collected from
human sewage sample
34
Figure 11
Figure 12 Effect of provided antibiotics on S. flexneri C3 isolate collected from
chicken feces
35
Figure 13
Figure 14
Comparative analysis of the effect of different antibiotics on clinical
and environmental Salmonella typhi spp collected from human sewage
sample
37
Figure 15 Comparative analysis of the effect of different antibiotics on clinical
and environmental Shigella flexneri spp collected from chicken feces
38
Figure 16 SDS page result analysis of S. typhi and S. flexneri whole cell protein 39
Figure 17 Graph of log MW vs. Rf curve for marker proteins 41

LIST OF ABBREVIATIONS
BPA Baird-Parker Agar
CFU Colony Forming Unit
EMB Eosin Methylene Blue Agar
MAC MacConkey Agar
ICDDR,B International Center for Diarrheal Disease
Research, Bangladesh
IMViC Indole, Methyl red, Voges-Proskauer, Citrate
LB Luria Bertani
MSA Mannitol Salt Agar
MR Methyl Red
MRSA Methicillin-resistant Staphylococcus aureus
TSB Trypticase Soy Broth
MYP Mannitol Egg Yolk Polymyxin Agar
NA Nutrient Agar
TSI Triple Sugar Iron
XLD Xylose Lysine Deoxycholate
MHA Mueller-Hinton Agar
UTIs Urinary Tract Infections
SXT 25 Sulfamethoxazole / Trimethoprim
FOX 30 Cefoxitin
PEF 5 Pefloxacin
CIP 5 Ciprofloxacin
E 15 Erythromycin
CN 10 Gentamicin
K 30 Kanamycin
S 10 Streptomycin
CXM 30 Cefuroxime Sodium

NA 30 Nalidixic Acid
OX 1 Oxacillin
C 30 Chloramphenicol
F 300 Nitrofurantoin
SDS Sodium dodecyl sulfate
PAGE Polyacrylamide gel electrophoresis

1
Chapter 1: Introduction
1.1 Overview
It has long been established that, natural selection shapes the evolution of DNA based organisms,
through the course of survival or extinction within the dynamic environment of the planet.
Through breakthrough scientific discoveries, the all-connecting symbiotic nature of all living
things have become more and more evident. With this knowledge it is now understood far better
than ever that as humans, with a huge sustained footprint on the environment, we have become a
substantial influence in the context of evolution. This idea is a bit hard to grasp as most of the
noticeable evolution takes place over thousands to millions of years, but when it comes to
microorganisms, it is fairly observable within human lifespan that these single celled creatures
are adapting to the direct or indirect interactions with us and the environment as a whole, with
ferocious rapidity.
A growing interest among the community of microbiologists is to study this dynamic
relationship as it is imperative to maintain our bloated life expectancy bestowed by the era of
antibiotics. In this trend, common disease-causing microorganisms and our methods to eradicate
or control them are subjects of repeated rigorous scientific experiments. These studies are carried
out by various pharmaceutical companies, organizations for disease control, genetic engineers,
biotechnologists, evolutionary microbiologists and every other group that have a vested interest
in improving and maintain the quality of human life.
A stark example can be the evolution of the enteric disease causing pathogens throughout
the history of modern medicine. In the public consciousness, a disease like diarrhea has gone
from being a sweeping epidemic that leaves us mostly helpless, to a benign inconvenience that
we have to endure for a few days, but this underlies an uphill battle between synthetic antibiotics
and disease causing pathogens, that microbiologists have been fighting ever since the days of
penicillin.

2
1.2 Emerging pathogens
A humongous number of organisms are associated with a variety of infectious diseases, and are
considered to be human pathogens. Not only are the pre existing pathogens menacing the human
health, but also some pathogens have only been recognized very recently. Such pathogens are
largely accountable for a massive number of deaths every year. As many new diseases are held
responsible for this global burden, which is taking its toll on human health, it is also true for
diseases that had been declining over the past few years [1]. The re emergence of these diseases
is associated with certain transmission routes and also different and wide range of hosts.
1.3 Bacterial resistance to antibiotics; now and then
Antibiotics, since its invention have been vital in the fight against infectious diseases that are
caused by various bacteria as well as other microbes. A matter of great misery is that although
we have all these advanced antibiotics now at our disposal, reports have shown that no antibiotic
can actually last effective for too long. As a result, resistance in the pathogens to common
therapeutic agents is increasing in recent years. Thus, a mere cultural contaminant or a harmless
microbe can eventually become great human pathogen over time [2].
The abundance and indiscriminate use of the commercial antimicrobial drugs that are commonly
used in the treatment of infectious diseases is the leading reason of multiple drug resistance in
human pathogenic microorganisms that has been developed over the past years (Table 1) [5].
This development of antibiotic resistance has a number of favoring factors, those including the
characteristics of the hosts, the usage of antibacterial agents, the specific nature of the
relationship of bacteria to antibiotics, as well as environmental factors [3]. Since the bacterial
pathogens have the ability to rapidly evolve, this helps them to come up with new ways to dodge
the host defenses and become resistant to the antibiotic treatments. It is a matter of great concern
that more and more pathogens are showing resistance to multiple drugs. In addition the high
levels of antibiotics used in humans and animals now a day have amplified the emergence of
these antibiotic resistant strains that are the main concern of this study [4].

3
Table 1: Profile of clinical pathogens used in this study
Test organisms Infections Antibiotic susceptibility
Salmonella typhi
Causes food poisoning and
typhoid
Azithromycin,
Ciprofloxacin
Shigella flexneri
Causes dysentery Ampicillin, Ciprofloxacin,
Tetracycline
1.4 SDS-PAGE
The full form of SDS-PAGE is Sodium dodecyl sulfate the purpose of SDS-PAGE is to separate
proteins according to their size, and no other physical feature. The name itself will explain the
entire reasoning of, the point is to understand in details the two names SDS and PAGE
accordingly.
1.4.1 SDS
The main goal is to separate different protein molecules of different shapes and sizes, the first
thing to do is to denature the proteins. So that there is no longer have any secondary, tertiary or
quaternary structure to have a linear form.
The separation of macromolecules is done in an electric field is called electrophoresis. A very
common method for separating proteins by electrophoresis uses a discontinuous polyacrylamide
gel as a support medium and sodium dodecyl sulfate (SDS) to denature the proteins.
It is an anionic detergent, meaning that when dissolved its molecules have a net negative charge
within a wide pH range. A polypeptide chain binds amounts of SDS in proportion to its relative
molecular mass. The negative charges on SDS destroy most of the complex structure of proteins,
and are strongly attracted toward an anode (positively-charged electrode) in an electric field.

4
1.4.2 Polyacrylamide gels
Polyacrylamide gels restrain larger molecules from migrating as fast as smaller molecules.
Because the charge-to-mass ratio is nearly the same among SDS-denatured polypeptides, the
final separation of proteins is dependent almost entirely on the differences in relative molecular
mass of polypeptides. In a gel of uniform density the relative migration distance of a protein (Rf,
the f as a subscript) is negatively proportional to the log of its mass. If proteins of known mass
are run simultaneously with the unknowns, the relationship between Rf and mass can be plotted,
and the masses of unknown proteins estimated.
Protein separation by SDS-PAGE can be used to estimate relative molecular mass, to determine
the relative abundance of major proteins in a sample, and to determine the distribution of
proteins among fractions. The purity of protein samples can be assessed and the progress of a
fractionation or purification procedure can be followed. Different staining methods can be used.
1.5 Aims and objectives
Resistance to antimicrobial agents has resulted in morbidity and mortality from treatment failures
and increased health care costs. Even though defining the precise public health risk and estimating
the increase in costs is not a simple undertaking, there is little doubt that emergent antibiotic
resistance is a serious global problem. Widespread antibiotic usage exerts a selective pressure that
acts as a driving force in the development of antibiotic resistance.
Although pharmaceutical industries have produced a number of new antibiotics in the last few
decades but simultaneously the resistance of the microorganisms to these drugs have also
increased. Due to such increasing resistance in microbes and synthetic antibiotic side effects, it is
now necessary to access resistance pattern of pathogenic organisms against standard antibiotics
to develop therapeutic alternatives.

5
On the basis of above context, the objectives of the present study are:
1. The degree of antibacterial activity will be evaluated considering the diameter (mm) obtained
for the zone of inhibition on each of the replicate agar plate.
2. The resistance pattern of both clinical and environmental samples will be recorded for a
comparative analysis.
3. The purpose of SDS-PAGE is to separate proteins according to their size, and no other
physical feature.

6
Chapter 2: Materials and Methods
2.1 Working laboratory
All project works were performed in the Microbiology and Biotechnology Laboratory,
Department of Mathematics & Natural Sciences, BRAC University.
2.2 Reference Bacterial Strains
In this study, two standard clinical strain of Salmonella typhi, and Shigella flexneri were used.
All these species were obtained from ICDDR,B (International Center for Diarrheal Disease
Research, Bangladesh).
2.2.1 Preparation of plating bacteria
A single bacterial colony of each clinical isolates was inoculated into a screw cap test tube
containing 5 ml Luria Bertani (LB) broth.
The tube was incubated at 37oC in a shaking incubator (Daihan Scientific, Korea) at 120
rotations per min (rpm) for 3 hours.
After incubation 1 ml culture from the test tube was taken in an eppendorf and centrifuged
(Eppendorf, Germany) at 12,000 rpm for 10 min and the supernatant was discarded.
Bacterial pellet was suspended in 1 ml of 10M MgSO4 properly to make it homogenous.
The suspension was stored at 4oC until used.
The suspensions were then diluted 1:100 in TSB broth to obtain 106 CFU/ml before use.
2.2.2 Confirmation of the reference strains
Reference bacterial strains were identified routinely to distinguish each organism by sub
culturing on recommended selective media (Table 2). The cultural properties of each organism
were observed and recorded.

7
Table 2: Respective Selective Media for Different Reference Strains
Bacterial Strain Selective Media
Salmonella typhi Xylose Lysine Deoxycholate agar (XLD) agar
Shigella flexneri Xylose Lysine Deoxycholate (XLD) agar
2.2.3 Biochemical confirmation of the clinical strains
Subsequently each bacterial clinical strain were employed for morphological and biochemical
confirmation tests. Recommended biochemical tests like Methyl red test, Voges–Proskauer test,
Indole test, Citrate utilization test, Oxidase test, Catalase test, TSI agar test were performed for
each of the strains.
2.2.4 Biochemical Identification
Biochemical tests were performed with specific standard isolates developed in specific media
according to the standard methods described in Microbiology Laboratory Manual [6]. Before
starting the process of any biochemical identification test, all the bacterial cultures were grown
on nutrient agar plates in the incubator at 37oC.
Methyl red (MR) test
Bacterium to be tested was inoculated into 3 ml dextrose phosphate broth (MR-VP broth),
which contained dextrose and a phosphate buffer and incubated at 37oC for 24 hours.
Over the 24 hours, the mixed-acid producing organism might produce sufficient acid to
overcome the phosphate buffer and remain acidic.
The pH of the medium was tested by the addition of five drops of MR reagent. Development
of a red color was taken as a positive result. MR negative organism would give a yellow
color.

8
Voges–Proskauer test
Bacterium to be tested was inoculated into 3 ml dextrose phosphate broth (MR-VP broth) and
incubated at 37oC for 24 hours.
To the aliquots of each broth cultures 10 drops of Barritt’s reagent A was added and the
cultures were shaken.
Immediately, 10 drops of Barritt’s reagent B was added and the cultures were shaken again.
Cultures were then kept aside for 15 minutes for the reaction to occur.
After 15 minutes, the colors of the cultures were examined and the results were recorded.
Appearance of a red color was taken as a positive result.
Indole test
Bacterium to be tested was inoculated in 6 ml peptone water, which contains the amino acid
tryptophan and incubated at 37oC for 24 hours.
Following overnight incubation, five drops of Kovac’s reagent were added.
Then the colors of the cultures were examined and the results were recorded. Formation of a
rose red ring at the top indicates a positive result. A negative result can have a yellow or
brown layer.
Citrate utilization test
A single bacterial colony of each bacterium to be tested was picked up from each nutrient
agar plates by a needle and inoculated into the slope of Simmon’s citrate agar and incubated
at 37oC for 24 hours.
Over these 24 hours, the organism which had the ability to utilize citrate would change the
color of the media.
All the media that changed their color from green to a Prussian blue, is taken as a positive
result. A negative slant would have no growth of bacteria and would remain green.

9
Triple Sugar Iron (TSI) Test
A single bacterial colony of each bacterium to be tested was picked up from each nutrient
agar plates by a needle and stabbed into the TSI containing dextrose, lactose and sucrose
butt.
Caps of the tubes were loosened and incubated at 35°C for overnight and were examined
after 18-24 hours for carbohydrate fermentation, CO2 and H2S production.
A yellow (acidic) color in the butt indicated that the organism being tested is capable of
fermenting all the three sugars, whereas a red (alkaline) color in the slant and butt indicated
that the organism being tested is a non-fermenter.
A black precipitation in the butt of the tube is the indication of H2S production.
Presence of bubbles, splitting and cracking of the medium is the indication of CO2 gas
production.
Oxidase test
Two drops of oxidase reagent (p- Aminodimethylaniline oxalate) were added onto the filter
paper (Whatman, 1MM).
A loopful of each bacterium to be tested were taken from nutrient agar plate and streaked
onto the filter paper (Whatman, 1MM).
A positive reaction would turn the paper from violet to purple within 1 to 30 seconds.
Delayed reactions should be ignored as that might give false positive result.
Catalase test
One drop of catalase test reagent (hydrogen peroxide) was placed on a sterile glass slide.
An isolate from a nutrient agar plate was picked up with a sterile toothpick and placed on to
the reagent drop.
This was done with each of the bacterium to be tested.
An immediate bubble formation indicates a positive result.

10
2.2.5 Preparation of Stock Sample
Short term preservation
3 ml of T1N1 agar butt in each vial was inoculated by stabbing isolates from nutrient agar plates.
Then the vials were incubated at 37oC (SAARC) for 6 hours. After incubation, the surface of the
medium was covered with 200 µl sterile paraffin oil and the vials were stored at room
temperature appropriately labeled.
Long term preservation
For long-term preservation, 500 μl of bacterial culture grown in Trypticase Soy Broth at 37oC for
6 hours was taken in a sterile cryovial. Then 500 μl of sterile glycerol was added to the broth
culture and the cryovial was stored at -20oC.

11
2.3 Provided Antibiotic Discs
In this study, the effectiveness of thirteen different antibiotics was determined. They are listed
below in the table:
Table 3: Provided Antibiotic Discs
Antibiotic Disc Identification Number
Sulfamethoxazole / Trimethoprim (SXT 25)
Cefoxitin (FOX 30)
Pefloxacin (PEF 5)
Ciprofloxacin (CIP 5)
Erythromycin (E 15)
Gentamicin (CN 10)
Kanamycin (K 30)
Streptomycin (S 10)
Cefuroxime Sodium (CXM 30)
Nalidixic Acid (NA 30)
Oxacillin (OX 1)
Chloramphenicol (C 30)
Nitrofurantoin (F 300)
2.4 Antibiotic Susceptibility Test of the Standard Clinical Strains of Bacteria
The standard clinical strains of bacteria were tested for their sensitivity against thirteen standard
antibiotics, as mentioned previously in Table 3.

12
2.4.1 Preparation of McFarland Solution
McFarland solution is an essential material needed before testing the microorganisms for their
sensitivity. McFarland standards are used as reference to adjust the turbidity of any given
bacterial suspension. This is done to make sure that the number of bacteria is within a given
range to standardize the microbial testing. This would also help avoid any error in result, because
if the suspension is too heavy or too diluted, an erroneous result might occur for any given anti
microbial agent, which in this study, is antibiotic discs.
97% H2SO4 was diluted to a concentration of 1%
BaCl2.2H2O was diluted to a concentration of 1.175%
To make 5 ml McFarland solution, 4975µl H2SO4 was mixed with 25µl BaCl2.2H2O.
2.4.2 Preparation of inoculums
Using a sterile inoculating loop, one or two colonies of the organism to be tested were taken
from the subculture plate.
The organism was suspended in 6 ml of physiological saline.
The test tube containing the saline was then vortexed to create an overall smooth suspension.
2.4.3 Comparing with McFarland solution
Using the Colorimeter (Labtronics; ISO 9001: 2008 Certified), the OD of the McFarland
solution was measured to be 11.
Then the OD of each of the inoculums that were made was also measured with the
Colorimeter.
Only the solutions with the OD that matched with that of the McFarland solution were taken.
The solutions that gave an OD higher than the standard solution were diluted with solution to
match the standard.
Once all the OD of the inoculums was matched with the standard, they were ready to be
inoculated on MHA (Muller-Hinton Agar) plates.

13
2.4.4 Inoculation of the MHA plates
A sterile swab was dipped into the inoculum tube. The swab was rotated against the side of
the tube above the fluid level, using firm pressure, to remove excess fluid, but the swab was
not dripped wet.
The dried surface of a MHA plate was inoculated by streaking the swab four to six times
over the entire agar surface; the plate was rotated approximately 60 degrees each time to
ensure an even distribution of the inoculums.
The plate was rimmed with the swab to pick up any excess liquid.
Leaving the lid slightly ajar, the plate was allowed to sit at room temperature at least 3 to 5
minutes for the surface of the agar plate to dry before proceeding to the next step.
2.4.5 Placement of the Antibiotic Discs The forceps was sterilized by immersing the forceps in alcohol then igniting.
Four sterile discs were placed on the surface of an agar plate, using that forceps.
The discs were gently pressed with the forceps to ensure complete contact with the agar
surface.
Placing discs close to the edge of the plates was avoided as the zones will not be fully round
and that can be difficult to measure.
Once all discs were in place, the plates were inverted, and placed in a 37°C incubator for 24
hours.
2.4.6 Measuring zone size
Following the incubation, the zone sizes were measured to the nearest millimeter using a ruler.
All measurements were made with the unaided eye while viewing the back of the Petri dish.
The zone size was recorded on the recording sheet.
14
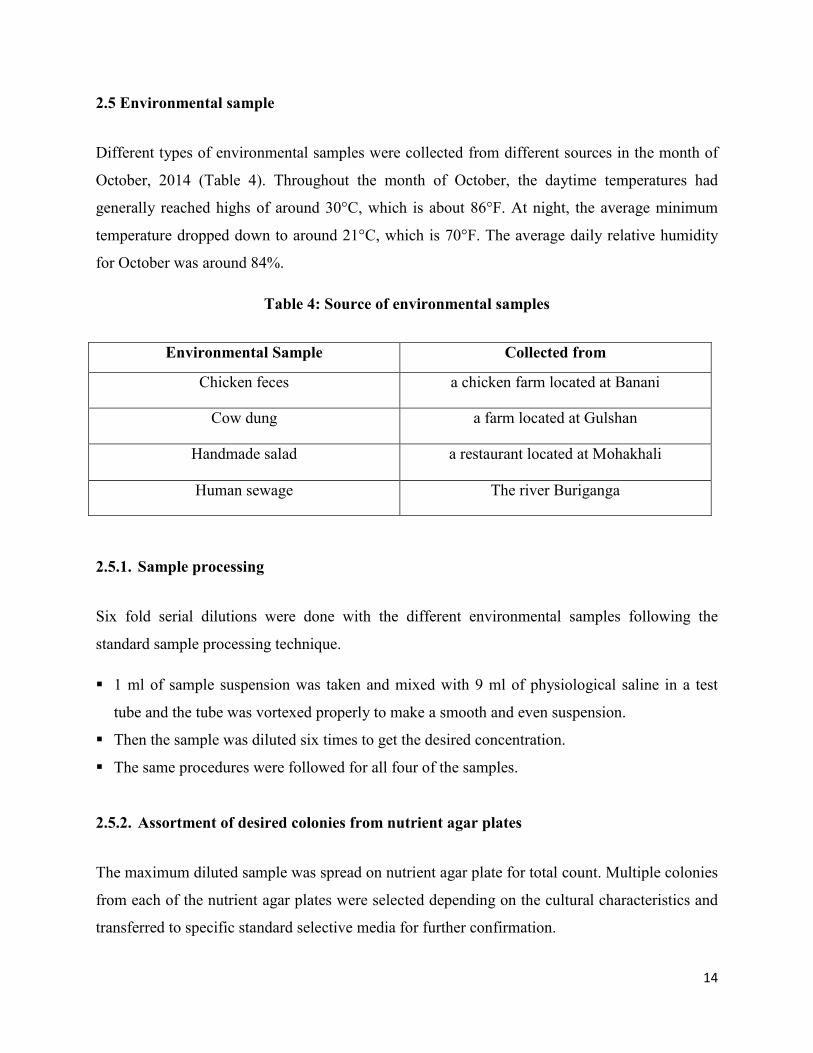
2.5 Environmental sample
Different types of environmental samples were collected from different sources in the month of
October, 2014 (Table 4). Throughout the month of October, the daytime temperatures had
generally reached highs of around 30°C, which is about 86°F. At night, the average minimum
temperature dropped down to around 21°C, which is 70°F. The average daily relative humidity
for October was around 84%.
Table 4: Source of environmental samples
2.5.1. Sample processing
Six fold serial dilutions were done with the different environmental samples following the
standard sample processing technique.
1 ml of sample suspension was taken and mixed with 9 ml of physiological saline in a test
tube and the tube was vortexed properly to make a smooth and even suspension.
Then the sample was diluted six times to get the desired concentration.
The same procedures were followed for all four of the samples.
2.5.2. Assortment of desired colonies from nutrient agar plates
The maximum diluted sample was spread on nutrient agar plate for total count. Multiple colonies
from each of the nutrient agar plates were selected depending on the cultural characteristics and
transferred to specific standard selective media for further confirmation.
Environmental Sample Collected from
Chicken feces a chicken farm located at Banani
Cow dung a farm located at Gulshan
Handmade salad a restaurant located at Mohakhali
Human sewage The river Buriganga

15
2.5.3 Confirmation of the organisms by biochemical tests
Multiple selected presumptive colonies from the specific media were confirmed by biochemical
tests following standard protocol [6], as was previously done with the reference strains.
2.5.4 Antibiotic susceptibility test of the microorganisms from environmental samples
All the steps and methods that were followed during the antibiotic susceptibility test of the
reference bacterial strains were repeated with the microorganisms now isolated from the
environmental samples.
2.6 Protein profiling
The environmental strain from the sample strains that were found to be resistant to the specific
antibiotics were then further sub-cultured in nutrient agar medium before the protein extraction
was undertaken. The culture plates were incubated overnight at 37 o C.
2.6.1 Protein Extraction:
Luria Bertani broth of 5ml was prepared for each strain.
Desired sample was then inoculated into each tube from fresh subculture.
Incubation period was maintained for 37 o C for 24 hours.
After incubation, the culture was taken into microcentrifuge tube of 1ml after vortexing.
Then it was centrifuged at 14,000 rpm for 5minute.
Suspended pellet was found in the ground of the tube,
The supernatant was discarded.
4x SDS dye of 20μl was added in each tube.
The butt of the tube was tapped vigorously to dissolve the pellet and bolied at 100 o C for 3
minutes.
Lastly, the protein was preserved at -20 o C.
16
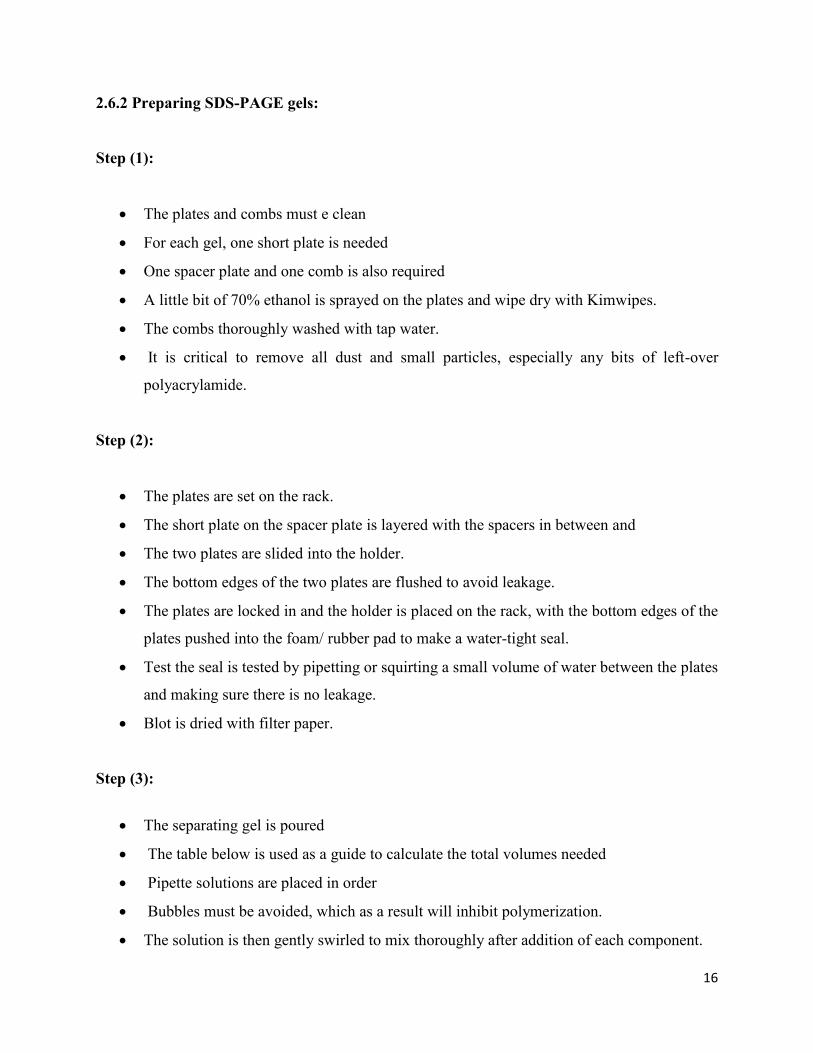
2.6.2 Preparing SDS-PAGE gels:
Step (1):
The plates and combs must e clean
For each gel, one short plate is needed
One spacer plate and one comb is also required
A little bit of 70% ethanol is sprayed on the plates and wipe dry with Kimwipes.
The combs thoroughly washed with tap water.
It is critical to remove all dust and small particles, especially any bits of left-over
polyacrylamide.
Step (2):
The plates are set on the rack.
The short plate on the spacer plate is layered with the spacers in between and
The two plates are slided into the holder.
The bottom edges of the two plates are flushed to avoid leakage.
The plates are locked in and the holder is placed on the rack, with the bottom edges of the
plates pushed into the foam/ rubber pad to make a water-tight seal.
Test the seal is tested by pipetting or squirting a small volume of water between the plates
and making sure there is no leakage.
Blot is dried with filter paper.
Step (3):
The separating gel is poured
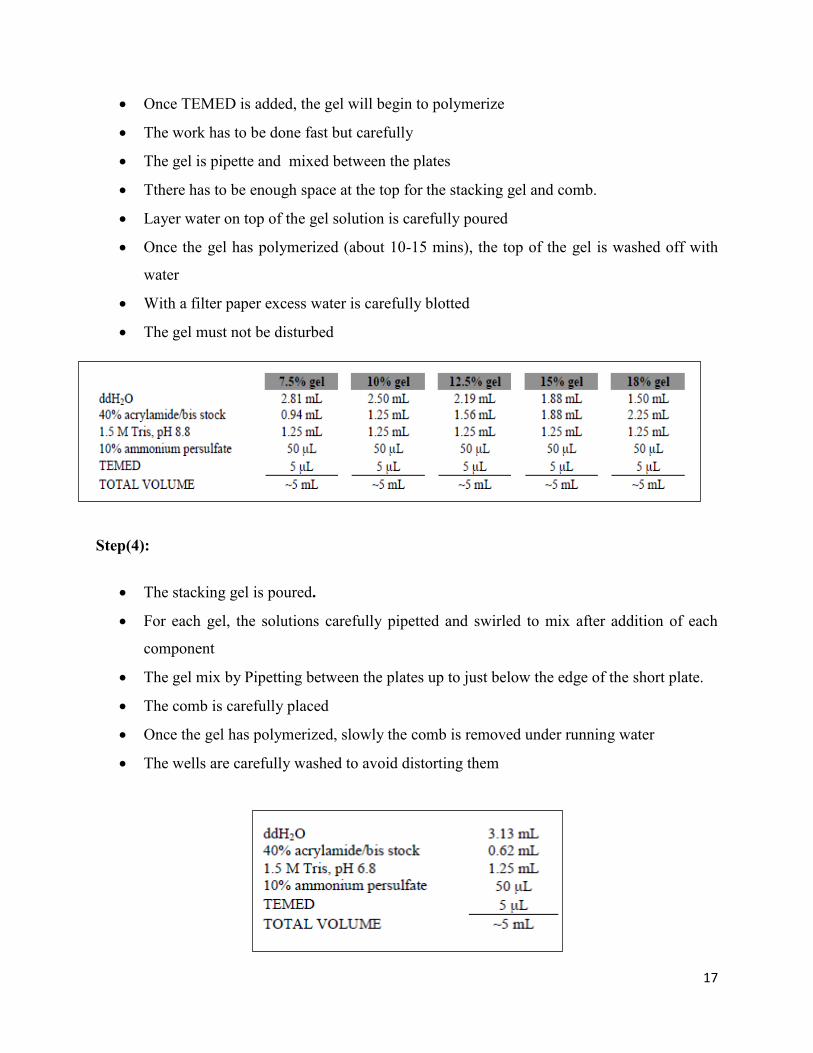
The table below is used as a guide to calculate the total volumes needed
Pipette solutions are placed in order
Bubbles must be avoided, which as a result will inhibit polymerization.
The solution is then gently swirled to mix thoroughly after addition of each component.
17
Once TEMED is added, the gel will begin to polymerize
The work has to be done fast but carefully
The gel is pipette and mixed between the plates
Tthere has to be enough space at the top for the stacking gel and comb.
Layer water on top of the gel solution is carefully poured
Once the gel has polymerized (about 10-15 mins), the top of the gel is washed off with
water
With a filter paper excess water is carefully blotted
The gel must not be disturbed
Step(4):
The stacking gel is poured.
For each gel, the solutions carefully pipetted and swirled to mix after addition of each
component
The gel mix by Pipetting between the plates up to just below the edge of the short plate.
The comb is carefully placed
Once the gel has polymerized, slowly the comb is removed under running water
The wells are carefully washed to avoid distorting them
18
Step(5):
The gel is storage
the comb is returned to storage and the gel is sandwiched between two wet pieces of
paper towels.
The gel can be stored horizontally at 4 °C for up to 1 week.
2.6.3 SDS-PAGE
Pouring the resolving gel
1. The glass plates were cleaned with soap and water, then with ethanol.
2. The glass plates and spacers were assembled
3. A pasteur pipette was used and the bottom of the plates were sealed by spreading 1%
agarose in SDS PAGE electrophoresis buffer along the bottom of the glass plates so it
moves up the crack by capillary action.
4. The degased resolving gel is transferred to a beaker and APS/TEMED is added.
5. It was then mixed
6. The resolving gel solution was a quickly added to the center of the plates to a height
about 4 cm from the top for the large plates.
7. Isobutanol/ absolute ethanol was quickly added to the top of this until the level reaches
the top of the plates.
8. Isobutanol/ absolute ethanol will prevent oxygen from getting into the gel which would
oxidize it and inhibit polymerization.
9. The resolving gel would polymerize in 30 minutes.
10. The stacking gel reagents is added to a flask (without addition of APS & TEMED) and
degas for ten minutes.
Pouring the stacking gel
11. Isobutanol/ absolute ethanol was poured off.
12. The watery interplate surface was dried with a piece of Whatmann paper.
13. The stacking gel was polymerized,
14. APS/TEMED was added,

19
15. It was then mixed
16. The polymerized resolving gel was poured on top
17. The comb was inserted straight on down,
18. Then a little more stacking gel was poured on the sides of the comb to fully seal it
19. Any bubbles were removed from underneath the comb
20. If possible, the comb was gently moved from side to side so the bubbles get into the
space in between and float up
21. The stacking gel polymerized in 20 to 30 minutes
Load the gel
22. Tris-glycine electrophoresis buffer was poured into the upper and lower chambers
23. Bubbles trapped were removed at the bottom of the glass plates in the large gel with a
syringe.
24. The wells were flushed with a syringe just before loading to get rid of any unpolymerized
polyacrylamide that may seep in
25. When loading the gel, sample was loaded in every lane and the dye front migrated more
evenly
26. Large thin gels were ran at a constant current of 12-15 mA.
27. After the dye front entered the resolving gel, the current was turned up to 30 mA.
28. The gel was stopped depending on how big the smallest protein was that was desired to
visualize
29. If waited for the dye front to just flows out of the gel, it would take about 2.5 - 3 hours
for a large, thin gel to run.
30. A thick gel would take 6 - 7 hours

20
2.6.5 Staining and distaining of gel
Reagents needed:
Coomassie Stain solution
Destain solution
Directions
The SDS-PAGE gel was removed from glass and rinsed once in ddH2O in a suitable
container with a lid.
Coomassie Stain was added to cover the gel by 1/2 inch (~ 1.5 cm).
The gel was incubated in the Coomassie stain for 35 minutes at 45°C in water bath.
The Coomassie Stain was poured off. The Coomassie Stain can be recycled a couple of
times by filtering it.
The gel was rinsed twice in ddH2O to remove Coomassie Stain from the container.
Fresh Distaining solution was added to cover the gel by 3/4 inch (~ 2 cm).
The gel was incubated in the Distaining solution for 1 hour in a water bath.
The gel was kept in the distaining solution overnight at room temperature.
The used Destain solution can be recycled a couple of times by storing it in a sealed
container

21
Chapter 3: Results
3.1 Conformation of clinical strains
Clinical strain of the two bacterial species i.e. Salmonella typhi, Shigella flexneri, obtained from
ICDDR,B (International Center for Diarrheal Disease Research, Bangladesh) were preliminary
identified by their cultural properties (Table 5) upon streaking in the respective selective
media (Table 2). Selective medium types are formulated to support the growth of one group of
organisms, but inhibit the growth of another. These media contain antimicrobials, dyes, or
alcohol to inhibit the growth of the organisms that are not targeted for study.
Table 5: Cultural characteristics of clinical strains on respective selective media
Isolates/
Organism
Cultural Characteristics
Medium Size Margin Elevation Form Pigment Consist
ency
S. typhi XLD
Moderate
(2-3mm)
Entire Raised Convex Red
colonies
with black
centre
Smooth
S.
flexneri
XLD Moderate
(1-2mm)
Entire Convex Circular Pinkish to
reddish
colonies
Smooth

22
Figure 1: Cultural characteristics of clinical strains on respective selective media:
a) Salmonella typhi in Xylose Lysine Deoxycholate agar,
b) Shigella flexneri in Xylose Lysine Deoxycholate agar
Isolates shown in Figure 1 showed patterns of biochemical reactions that are typical for each
strain of bacteria according to Microbiology Laboratory Manual [6]. In Table 6 below, the results
of biochemical tests of the clinical isolates are mentioned.
(a) (b)

23
Table 6: Standard results of biochemical tests of target isolates
Isolate/Organism Biochemical Tests
Indo
le p
rodu
ctio
n te
st
Met
hyl r
ed r
eact
ion
test
Vog
es P
rosk
auer
rea
ctio
n te
st
Citr
ate
utili
zatio
n te
st
TSI fermentation
Cat
alas
e ac
tivity
test
Oxi
dase
act
ivity
test
Slan
t
But
t
CO
2
H2S
Salmonella typhi - + - - K A - + + -
Shigella flexneri - + - - K A - - + -
KEY: A= acidic condition, K= alkaline condition, + = positive, - = negative, AG= both acid & gas
production.
Figure 2: Biochemical tests for S. typhi

24
Figure 3: Biochemical tests for S. flexneri
Figure 4: Oxidase Test

25
Figure 5: Catalase test

26
3.2 Confirmation of the environmental strains by biochemical tests
Desired presumptive environmental strains of Salmonella typhi and Shigella flexneri are selected
from specific media (Table 2) depending on their cultural characteristics (Table 7).
Table 7: Cultural characteristics of the environmental strains
Isolates/
Organisms
Cultural Characteristics
Medium Size Margin Elevation Form Pigment Consistency
Sal 1 XLD Moderate
(2-3mm)
Entire Convex Circular Colorless Creamy
Sal 2 XLD Small (1-
2mm)
Entire Convex Circular Pinkish Smooth
Sal 3 XLD
Moderate
(2-3mm)
Entire Raised Convex Red
colonies
with
black
centre
Smooth
Sal 4 XLD Large (2-
3mm)
Undulate Slightly
raised
Irregular Colorless Smooth
Shi 1 XLD Moderate
(2-3mm)
Entire Raised Convex Pink Smooth
Shi 2 XLD Large (2-
3mm)
Entire Raised Irregular Colorless Smooth
Shi 3 XLD Moderate
(1-2mm)
Entire Convex Circular Pinkish to
reddish
colonies
Smooth
Shi 4 XLD Small (1-
2mm)
Entire Slightly
raised
Circular Colorless Creamy

27
A total of twenty colonies belonging to two target strains isolated from different environmental
sources (Table 4) were selected depending on the presumptive cultural characteristics which
were further confirmed by standard biochemical tests showed below in Table 8.
Table 8: Biochemical test results of the environmental strains
Isolate/Organism Biochemical Tests In
dole
pro
duct
ion
test
Met
hyl r
ed r
eact
ion
test
Vog
es P
rosk
auer
rea
ctio
n te
st
Citr
ate
utili
zatio
n te
st
TSI fermentation
Cat
alas
e ac
tivity
test
Oxi
dase
act
ivity
test
Slan
t
But
t
CO
2
H2S
Sal 1 - + - - A A + - + +
Sal 2 - - + - K A + - + -
Sal 3 - + - - K A - + + -
Sal 4 + + - - A K - - - +
Shi 1 + - + + K K + - - -
Shi 2 - - + + K A - + + -
Shi 3 - + - - K A - - + -
Shi 4 + - - - K A - + - +
According to Table 7 and 8, Bac 1, Sal 3, Shi 3, Sta 2, and Esc 4 showed standard cultural
characteristics as well as standard biochemical test results following Table 5 and 6, hence they
were selected for further studies.

28
3.3 Selective antimicrobial activity test by means of antibiogram method
The standard disc diffusion test was done with all the provided antibiotics (Table 3) against two
clinical and isolates of two selected environmental strains to identify their resistance pattern. The
interpretive categories were defined according to the zone diameter of inhibition.
All the clinical strains showed significant susceptibility to all the antibiotics except for OX1
(Table 9). Salmonella typhi showed the maximum level of susceptibility to C30, which was
around 34mm in diameter, whereas in case of Shigella flexneri, the utmost level of susceptibility
was observed when CXM30 and FOX30 were applied in the disc diffusion test (26mm in
diameter).
Table 9: Antibiotic susceptibility test results for clinical strains
Antibiotics Clinical Strains
S. typhi S. flexneri
SXT 25 33 mm 0 mm
FOX 30 32 mm 26 mm
PEF 5 22 mm 0 mm
CIP 5 27 mm 16 mm
E 15 8 mm 20 mm
CN 10 25 mm 22 mm
K 30 25 mm 24 mm
S 10 17 mm 0 mm
CXM 30 26 mm 26 mm
NA 30 0 mm 0 mm
OX 1 0 mm 0 mm
C 30 34 mm 16 mm
F 300 23 mm 24 mm
29
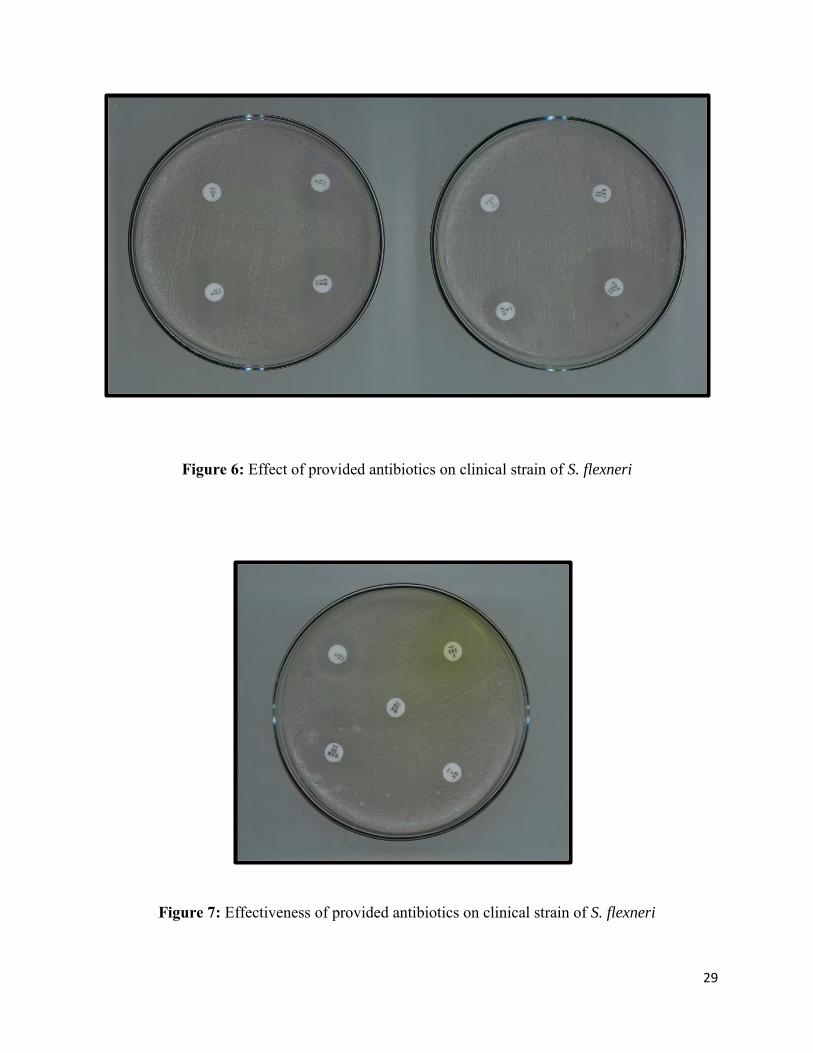
Figure 6: Effect of provided antibiotics on clinical strain of S. flexneri
Figure 7: Effectiveness of provided antibiotics on clinical strain of S. flexneri

30
Figure 8: Effect of the applied antibiotics on clinical strain of S. typhi
Figure 9: Effectiveness of the applied antibiotics on clinical strain of S. typhi

31
A significant level of resistance was observed when all the standard antibiotics were applied
against several isolates of selected environmental strains that Shigella flexneri collected from
chicken feces, and Salmonella typhi collected from human sewage sample. They all showed
resistance to at least one or more than one antibiotics.
The isolate C3 of S. flexneri collected from chicken feces showed resistance against two different
antibiotics, FOX30 and E15, whereas the susceptibility of their clinical strain to these antibiotics
was 26mm and 20mm in diameter respectively (Table 12). In case of S. typhi, which was
collected from human sewage sample, the isolate H1 showed resistance to the antibiotics
FOX30, E15, and S10, and the isolate H3 showed resistance to the antibiotics SXT25, PEF5,
E15, and C30. The clinical strain of S. typhi was vulnerable to all these antibiotics (Table 13).

32
Table 10: Antibiotic susceptibility test results for S. flexneri collected from chicken feces
Antibiotics S. flexneri From Chicken Feces
S.
flexneri
C1
S.
flexneri
C2
S.
flexneri
C3
S.
flexneri
C4
S.
flexneri
C5
S.
flexneri
C6
S.
flexneri
C7
SXT 25 15 mm 12 mm 0 mm 21 mm 17 mm 19 mm 14 mm
FOX 30 24 mm 19 mm Resistant 16 mm 20 mm 18 mm 12 mm
PEF 5 20 mm 16 mm 8 mm 22 mm 22 mm 14 mm 19 mm
CIP 5 17 mm 19 mm 12 mm 25 mm 21 mm 31 mm 24 mm
E15 22 mm 11 mm Resistant 15 mm 19 mm 23 mm 15 mm
CN 10 22 mm 13 mm 9 mm 18 mm 21 mm 19 mm 13 mm
K 30 23 mm 16 mm 21 mm 32 mm 24 mm 21 mm 17 mm
S 10 26 mm 11 mm 8 mm 13 mm 17 mm 17 mm 19 mm
CXM 30 20 mm 20 mm 23 mm 20 mm 27 mm 24 mm 22 mm
NA 30 19 mm 17 mm 0 mm 13 mm 30 mm 11 mm 16 mm
OX 1 0 mm 0 mm 0 mm 0 mm 0 mm 0 mm 0 mm
C 30 17 mm 19 mm 9 mm 14 mm 16 mm 11 mm 7 mm
F 300
25 mm 11 mm 10 mm 6 mm 11 mm 28 mm 22 mm

33
Table 11: Antibiotic susceptibility test results for S. typhi collected from human sewage
sample
Antibiotics S. typhi From Human sewage sample
S. typhi
H1
S. typhi
H2
S. typhi
H3
S. typhi
H4
S. typhi
H5
S. typhi
H6
SXT 25 18 mm 16 mm Resistant 19 mm 15 mm 13 mm
FOX 30 Resistant 21 mm 12 mm 17 mm 23 mm 21 mm
PEF 5 26 mm 18 mm Resistant 22 mm 20 mm 21 mm
CIP 5 23 mm 22 mm 13 mm 20 mm 19 mm 17 mm
E15 Resistant 11 mm Resistant 9 mm 13 mm 13 mm
CN 10 13 mm 17 mm 15 mm 19 mm 17 mm 15 mm
K 30 17 mm 9 mm 10 mm 15 mm 13 mm 7 mm
S 10 Resistant 11 mm 16 mm 12 mm 11 mm 14 mm
CXM 30 22 mm 23 mm 16 mm 11 mm 28 mm 21 mm
NA 30 29 mm 21 mm 0 mm 19 mm 22 mm 17 mm
OX 1 0 mm 0 mm 0 mm 0 mm 0 mm 0 mm
C 30 14 mm 11 mm Resistant 11 mm 14 mm 12 mm
F 300
11 mm 11 mm 9 mm 7 mm 12 mm 8 mm

34
Figure 10: Effectiveness of applied antibiotics on S. typhi H3 isolate collected from human
sewage sample
Figure 11: Effectiveness of applied antibiotics on S. typhi H3 isolate collected from human
sewage sample

35
Figure 12: Effect of provided antibiotics on S. flexneri C3 isolate collected from chicken feces
Figure 13: Effect of provided antibiotics on S. flexneri C3 isolate collected from chicken feces
36
3.4 Comparative analysis of antibiotic susceptibility profiles of clinical and environmental
strains
A comparative study was carried out among clinical and environmental samples isolated from
salad sample, human sewage sample, chicken feces, and bovine sample. Results indicate strong
differences in the numbers of different environmental isolates and the clinical strains in terms of
the development of resistance to standard antibiotic disc.
S. flexneri isolate collected from the feces of chicken showed resistance against two different
antibiotics, FOX30 and E15, whereas for their clinical strains, its susceptibility to these
antibiotics were moderately high. A noticeable fact in the susceptibility test result of S. typhi was
that its clinical strain showed maximum level of susceptibility to the antibiotic C30, according to
section 3.3, and one of its environmental isolate namely H3 collected from human sewage
sample showed resistance to this same antibiotic as presented in the figures below.

37
Figure 14: Comparative analysis of the effect of different antibiotics on clinical and
environmental Salmonella typhi spp collected from human sewage sample
0 5 10 15 20 25 30 35
SXT 25
FOX 30
PEF 5
CIP 5
E15
CN 10
K 30
S 10
CXM 30
NA 30
OX 1
C 30
F 300
Zone of Inhibition (mm in diameter)
Ant
ibio
tic d
iffui
sion
dis
c (C
onc.
) Comparative analysis of the effect of different antibiotics on clinical
and environmental Salmonella typhi spp collected from human sewage sample
H6 isolate
H5 isolate
H4 isolate
H3 isolate
H2 isolate
H1 isolate
Clinical Sample

38
Figure 15: Comparative analysis of the effect of different antibiotics on clinical and
environmental Shigella flexneri spp collected from chicken feces
0 5 10 15 20 25 30 35
SXT 25
FOX 30
PEF 5
CIP 5
E15
CN 10
K 30
S 10
CXM 30
NA 30
OX 1
C 30
F 300
Zone of Inhibition (mm in diameter)
Ant
ibio
tic d
iffui
sion
dis
c (C
onc.
) Comparative analysis of the effect of different antibiotics on clinical and environmental Shigella flexneri spp collected from chicken feces
C7 isolate
C6 isolate
C5 isolate
C4 isolate
C3 isolate
C2 isolate
C1 isolate
Clinical Sample

39
3.5 Qualitative analysis of SDS page result:
SDS-PAGE is a reliable method for determining the molecular weight (MW) of an unknown
protein, since the migration rate of a protein coated with SDS is inversely proportional to the
logarithm of its MW. The key to accurate MW determination is selecting separation conditions
that produce a linear relationship between log MW and migration within the likely MW range of
the unknown protein.
To ensure accurate MW determination, the protein sample was separated on the same gel with a
set of MW standards
Figure16: SDS page result analysis of S. typhi and S. flexneri whole cell protein

40
After separation, the relative migration distance (Rf) of the marker proteins and of the unknown
protein was determined. Rf is defined as the mobility of a protein divided by the mobility of the
ion front. Because the ion front can be difficult to locate, mobilities are normalized to the
tracking dye that migrates only slightly behind the ion front:
Rf = (distan ce to band)/(distance to dye front)
Table12: Relative migration distance of protein markers and respective log of MW
Table13: Relative migration distance of unknown proteins
Molecular
weights of
Marker Proteins
Migration distance
of the protein
(mm)
Migration distance
of the dye front
(mm)
Rf Log of MW
120 9 90 0.1 2.08
90 17 90 0.189 1.94
50 34 90 0.45 1.74
35 54 90 0.6 1.56
26 67 90 0.744 1.415
20 80 90 0.889 1.3
Micro organisms Migration distance of
the unknown protein
(mm)
Migration distance of
the dye front (mm)
Rf
S. typhi 59 94 0.628 S. flexneri 34.5 95 0.363

41
Using the values obtained for the marker proteins, a graph of log MW vs. Rf was plotted. The
plot was linear for most proteins, provided they are fully denatured and that the gel percentage is
appropriate for the MW range of the sample. The standard curve is sigmoid at extreme MW
values because at high MW, the sieving effect of the matrix is so large that molecules are unable
to penetrate the gel; at low MW, the sieving effect is negligible and proteins migrate almost
freely. The MW of the unknown protein band was determined by interpolating the value from
this graph.
Figure 17: Graph of log MW vs. Rf curve for marker proteins
The results were calculated using this equation below, and the inverse log is the molecular weight of the
unknown protein.
y= log of MW of unknown protein
y = -1.2616x + 2.238
0
0.5
1
1.5
2
2.5
0.1 0.189 0.45 0.6 0.744 0.889
log MW
Micro
organism
Rf of
unknown
protein
Interpolating the Rf value
into the equation
y= log of MW of
unknown protein
Inverse log of y
(MW of unknown
protein in kd)
S. typhi 0.628 y = 0-1.2616*0.628 + 2.238 1.446 27.925
S. flexneri 0.363 y = 0-1.2616*0.363 + 2.238 1.78 60.261
Rf
Log of MW
Table14: Determining molecular weight of unknown protein by interpolating the linier equation

42
Chapter 4: Discussion
Antibiotic resistance is the ability of bacteria to endure the antimicrobial activity of antibiotics. It
is now apparent that antibiotics that are used to alleviate an infection do not always work
anymore. Antibiotic resistance is a global issue, and The US Centers for Disease Control and
Prevention (CDC) considers antibiotic resistance one of their peak concerns [7].
One of the greatest discoveries of the 20th century is undoubtedly the finding of
antibiotics. This fact is evident, but the genuine speculation is the rise of antibiotic resistance in
hospitals, communities, and the environment is associated with their use. The surprising yet
alarming new genetic capacities of microorganisms have facilitated from man's overuse of
antibiotics to exploit every source of their resistance genes and every means of horizontal gene
transmission to develop multi-resistant strains [8]. Such has been seen in this study, that the
clinical strain of Shigella flexneri was significantly vulnerable to the antibiotics, yet the same
strain isolated from the feces of chicken showed resistance to as many as eight different
antibiotics. This is surely something to be concerned about.
Even prior to penicillin was introduced, resistant strains of bacteria had been detected.
The selection pressure has been caused by the exercise of millions of antibiotics over the past 75
years. Ever since antibiotics were introduced to mankind, the abundant use of antibiotics has
made almost all disease-causing bacteria resistant to the antibiotics that are commonly used to
treat them [7].
Our environment contains numerous products that are man-made or triggered by human
contamination, a large variety of examples can be petroleum chemicals, chemical solvents, the
products and waste of industrial processes, heavy metals, garbage, and so on. Since the early
development of the industrial revolution, humankind has dumped ever-growing amounts of
organic and inorganic toxins into streams, rivers, seas, oceans, land, and as well as air. Before the
discovery of antibiotics, arsenic, mercury, and iodine were used industrially and, as medicinal.
Which under some circumstances, are still employed as such. The major bacterial solution to
toxic challenges has taken the form of multivalent pumping systems that prevent intracellular
accumulation of structurally diverse bactericidal and bacteriostatic substances [9].

43
Antimicrobial resistance is a global problem. Although antimicrobial agents have played
a major role in reducing the threat from communicable diseases, but the widespread use of these
synthetic agents has increasingly resulted in the development of microorganisms that are
resistant. In recent years, resistance to these agents has been recognized as a major threat to
public health. Emergence of multidrug resistance has limited the therapeutic options, so
monitoring the resistance pattern has vital importance [10]. Resistance has increasingly become
an even bigger problem in recent years due to the drastically slowed pace at which novel
antibiotics are being discovered, while antibiotic use is rising rapidly [11]. This study presents
the most important aspects of antibiotic resistance development through a longitudinal study,
with the conclusion that it is time to take action. To achieve complete reimbursement of
therapeutic applications of antibiotics, we need to gather more information on the rise of
antibiotic resistance. Creative approaches to the discovery of novel antibiotics and their
accelerated and controlled introduction to therapy are mandatory, given the recent situation of
antimicrobial resistance [12].
The environmental strains of Salmonella typhi and Shigella flexneri are isolated from
different potential environmental sources like salad sample, sewage water, chicken feces, bovine
sample etc. Target environmental bacterial species were identified and used for the identification
of antibiotic resistance pattern in compare to clinical strains obtained from ICDDR,B
(International Center for Diarrheal Disease Research, Bangladesh). All strains were confirmed
by means of specific biochemical tests and confirmed in selective media and maintained in
nutrient ager medium.
In this study, two different isolates of S. typhi showed resistance to different antibiotics.
For human sewage sample isolates, S. typhi H1 showed resistance to FOX 30, E15, and S10.
Additionally, S. typhi H3 was resistant to SXT25, PEF5, E15, and C30. No other S. typhi isolates
showed any resistance pattern (Figure 13). The isolates of S. flexneri collected from chicken
feces showed very little resistance pattern. The isolate S. flexneri C3 was resistant to FOX30, and
E15. No other S. flexneri isolates were observed to be resistant to any of the tested antibiotics
(Figure 14).
Likewise, in Ireland, data that has been collected since 1996 had found high levels of
resistance among Salmonella enterica serotype Typhimurium. Many isolates had been found to

44
be resistant to at least 5 antibiotics, Ampicillin, Chloramphenicol, Streptomycin, Sulphonamide
and tetracycline (ACSSuT). In this study S. typhi isolated from human sewage sample was
observed to be resistant to three to four different antibiotics [14]. Among them are FOX30, E15,
S10, SXT25, PEF5, and C30. This data only supports the fact that organisms are evolving in
every possible ways and are gaining resistance to different and newer antibiotics. In this past
decade, various key organizations, including the Infectious Diseases Society of America, the
Centers for Disease Control and Prevention, and the World Health Organization (WHO), have
made antibiotic resistance the focus of highly visible reports, conferences, and actions [15].
Genetic variability is essential for survival and antimicrobial agents will favor those
organisms capable of resisting them. Microorganisms are either inherently resistant, that is,
resistance determined by the basic nature of the organism or they can develop acquired
resistance, which is the resistance that develops in a previously sensitive strain. Acquired
resistance has generally been found to be derived from the use of antimicrobials. In addition,
resistance problems are greatest in countries with highest use and in areas where use is
concentrated, like intensive therapy units [9].
Antimicrobial resistance pattern monitoring will help us to review the current status of
antimicrobial resistance locally, nationally and globally and helpful in minimizing the
consequence of drug resistance, limit the emergence and spread of drug resistant pathogens. This
has been a major endeavor of this study. Resistance to antibiotic is increasing and significant
community health problems are at risk. An accelerated start up of developing new antibiotics and
taking measures to conserve the existing microbial agents can be our way to alleviate the current
problem. Also the widespread usage of antibiotics should be brought to a controlled manner
along with the measures to help control the bacterial spread to slow the emergence and spread of
resistant organisms.
Interpolating the value from (Figure17), the graph it will give the molecular weight of the
unknown protein band. It is also to be noted that the accuracy of this methods in determining the
molecular weight of an unknown protein usually ranges from 5% to 10%. The presence of
polypeptides for example, lipoproteins and glycol generally leads to erroneous results as they are
not fully coated with SDS and therefore, would not behave as expected.

45
Chapter 5: Conclusion
Undoubtedly, we are living in the wonder years of modern medical sciences and enjoying a
longer and healthier life. Antibiotics are one of the major reasons behind this, as it has been our
vital source in fighting against various infectious diseases. Since the very beginning of
antibiotics starting with the discovery of Penicillin, a diverse range of antibiotics have aided us
persistently in our battle against the diseases.
It is alarming that despite all these advances in medical science and development of new
antibiotics, the rate of morbidity and mortality due to antibiotic resistant pathogens are
increasing. One of many reasons behind this is the widespread antibiotic usage, as it drives the
pathogens to develop resistance. Now it is crucial to access the resistance pattern of pathogenic
organisms to come up with a solution. This present study has been done in reflection to this fact,
and the conclusion can be drawn that this comparative analysis will take us one step closer to
resolving this global problem.

46
References
1. Woolhouse, M.E.J. 2002. Population biology of emerging and re-emerging pathogens.
Trends in Microbiology. Vol. 10 No. 10.
2. Bonjar, G.H.S., Nik .A.K. and Aghighi. S. 2004. Antibacterial and antifungal survey in
plants used indigenous herbal-medicine of south east regions of Iran. Journal of
Biological Sciences.Vol.4 (3). pp. 405-412.
3. Abiramasundari, P., V. Priya, G.P .Jeyanthi. and Devi. S Gayathri. 2011. Evaluation of
the Antibacterial activity of Cocculus hirsutus. Hygeia. J. for Drugs and Med .Vol.3 (2):
26-31.
4. Lambert, M. 2011. Molecular Biosafety - An update on alternatives to antibiotics - old
and new strategies. Applied Biosafety: ABSA. Vol.16 (3).
5. Hema, T. A., Arya. A.S, Subha. S, John. R. K and Divya. P.V. 2013. Antimicrobial
activity of five south Indian medicinal plants against clinical pathogens. Int .J. Pharm.
Bio. Sci. Vol. 4(1). pp. 70 – 80. 6. Cappuccino, J.G. and Sherman N. 1996. Microbiology - A Laboratory Manual, 4th Ed.
The Benjamin/ Cummings Publishing Co., Inc., Menlo Park, California. pp. 13-182.
7. Antibiotic resistance—the need for global solutions, LIDC. 2013.
8. Fischbach, M.A., and Walsh, C.T. 2010. Antibiotics For Emerging Pathogens. Science.
Vol. 325. pp. 1089-1093.
9. Davies, J., and Davies, D. 2010. Origins and Evolution of Antibiotic Resistance.
Microbiol Mol Biol Rev. Vol. 74 (3). pp. 417–433.
10. Abdullah, S., J. Gobilik and K. P. Chong. 2013. In Vitro Antimicrobial Activity of
Cynodon dactylon (L.) Pers. (bermuda) against Selected Pathogens. International Journal
of Pharmacy and Pharmaceutical Sciences. Vol. 4. (5). pp. 227-230.
11. Review on Antimicrobial Resistance. Antimicrobial Resistance: Tackling a Crisis for the
Health and Wealth of Nations. 2014.
12. Smith, R.D., and Coast, J. 2002. Antimicrobial resistance: a global response. Bulletin of
the World Health Organization. Vol. 80. pp. 126-133.
13. Dála, M.M.T. 2001. A Strategy for Control of Antimicrobial Resistance in Ireland.
Health and Children.

47
14. Nathan, C., and Cars, O. 2014. Antibiotic Resistance - Problems, Progress, and Prospects.
The New England Journal of Medicine. Vol. 371. pp. 1761-1763.
15. Methods for Dilution Antimicrobial Susceptibility Tests for Bacteria That Grow
Aerobically; Approved Standard—Ninth Edition, CLSI. 2012. Vol. 32 No. 2.

48
Appendices
APPENDIX-I
Media composition
The composition of the media used in the present study has been given below. Unless otherwise
mentioned, all the media were autoclaved at 121oC for 15 min.
1. Nutrient Agar (Himedia,India)
Ingredients Amounts (g/L)
Peptic digest of animal tissue 5.0
Beef extract 1.50
Sodium chloride 5.0
Yeast extract 1.50
Agar 15.0
2. Nutrient Broth (Oxoid, England)
Ingredients Amount (g/L)
Lab-lemco powder 1.0
Yeast extract 2.0
Peptone 5.0
Sodium chloride 5.0

49
3. Cetrimide agar (Merck, India)
Ingredients Amount (g/L)
Pancreatic digest of gelatin 20.0
Magnesium chloride hexahydrate 1.4
Potassium sulfate anhydrous 10.0
Cetrimide 0.3
Agar-Agar 13.0
4. T1N1 soft agar
Ingredients Amount (g/L)
Tryptone 0.6 g
Sodium chloride 0.3g
Agar 0.42 g
5. Tryptone soy broth, (Oxoid, England)
Ingredients Amount (g/L)
Pancreatic digest of Casein 17.0
Papaic digest of soybean meal 3.0
Sodium chloride 5.0
Di-basic potassium phosphate 2.5
Glucose 2.5

50
6. MacConkey agar (Oxoid, England)
Ingredients Amount (g/L)
Peptone 20.0
Lactose 10.0
Bile salts 5.0
Sodium chloride 5.0
Neutral red 0.075
Agar 12.0
7. Simmon’s citrate agar (Oxoid, England)
Ingredients Amount (g/L)
Magnesium sulfate 0.2
Ammonium dihydrogen phosphate 0.2
Ammonium phosphate 0.8
Sodium citrate 2.0
Sodium chloride 5.0
Agar 15.0
Bacto brom thymol blue 0.08
8. Peptone Water
Ingredients Amount (g/L)
Peptone 10.0
Sodium chloride 5.0

51
9. MR-VP broth
Ingredients Amount (g/L)
Peptone 7 g
Dextrose 5 g
Potassium phosphate 5 g
10. Triple sugar iron agar (Himedia, India)
Ingredients Amount (g/L)
Peptic digest of animal tissue 10.0
Sodium chloride 5.0
Lactose 10.0
Sucrose 10.0
Dextrose 1.0
Ferrous sulfate 0.20
Sodium thiosulfate 0.30
Casein enzymatic hydrolysate 10.0
Yeast extract 3.0
Beef extract 3.0

52
11. Eosine methylene blue agar (Oxoid, England)
Ingredients Amount (g/L)
Peptone 10.0
Sucrose 5.0
Lactose 5.0
Di-potassium phosphate 2.0
Eosin Y 0.14
Methylene blue 0.065
Agar 13.50
12. Mannitol Salt agar (Oxoid, England)
Ingredients Amount (g/L)
Peptone 10.0
Manitol 10.0
Lab-lemco powder 1.0
Sodium chloride 75.0
Phenol red 0.025
Agar 15.0

53
13.
14. Thiosulfate Citrate Bile Salts Sucrose agar (Difco, USA) Ingredients Amount (g/L)
Proteose peptone 10.0
Sodium thiosulfate 10.0
Sodium citrate 10.0
Yeast extract 5.0
Oxgall 8.0
Sucrose 20.0
Sodium chloride 10.0
Ferric citrate 1.0
Bromothymol blue 0.04
Thymol blue 0.04
Agar 15.0
15. Xylose Lysine Deoxycholate agar (Himedia, India)
Ingredients Amount (g/L)
L- lysine 5.0
Lactose 7.50
Sucrose 7.50
Xylose 3.50
Sodium chloride 5.0

54
Sodium deoxycholate 2.50
16. Phenol red (Lactose, Dextrose, Sucrose) Broth
Ingredients Amount (g/L)
Trypticase 0.4
Lactose 0.2
Sucrose 0.2
Dextrose 0.2
Sodium chloride 0.2
Phenol red 0.00072
Final pH 7.3
16. Mueller-Hinton agar
Ingredients Amount (g/L)
Beef, dehydrated infusion from 300.0
Casein hydrolysate 17.5
Starch 1.5
Agar 17.0

55
APPENDIX-II
Buffers and reagents
1. Phosphate buffered saline (PBS)
PBS was prepared by dissolving 8.0 g of NaCl, 0.2 g of KCl, 1.44 g of Na2HPO4 and 2.0 g of
KH2PO4 in 800 ml of distilled water. The pH was adjusted to 7.4 with HCl. The final volume was
adjusted to 1 liter by distilled water. The solution was sterilized by autoclaving and was stored at
room temperature.
2. Kovac’s reagent
5 g of para-dimethylaminobenzaldehyde was dissolved in 75 ml of amyl alcohol. Then
concentrated HCl was added to make the final volume 25 ml. This reagent was covered with
aluminum foil and stored at 4oC.
3. Methyl red reagent
0.1 g of methyl red was dissolved in 300 ml of 95% ethyl alcohol. Then distilled water was added
to make the final volume 500 ml. This reagent was covered with aluminum foil and stored at 4oC.
4. Barritt’s reagent
Solution A
5 g of alpha-naphthol was dissolved in 95% ethanol. This solution was covered with aluminum
foil and stored at 4oC.
Solution B
40 g of KOH was dissolved in distilled water. The solution became warm. After cooling to room
temperature, creatine was dissolved by stirring. Distilled water was added. This solution was
covered with aluminum foil and stored at
5. Oxidase reagent
56
100 mg of N,N,N1,N1-tetramethyl-p-phenyldiamine-dihydrochloride was dissolved in 10 ml of
distilled water and covered with aluminum foil. Then the solution was stored at 4oC.
APPENDIX-III
SDS-PAGE Reagents
1) 30% Acrylamide : (for 100ml)
Acrylamide 29.0 gm
Bis- Acrylamide 1.0gm
DH2O 100ml
2) 1.5 M Tris (pH 8.8) : (for 100ml)
1.5 M Trisma base 18.17 gm
SDS 0.4 gm
DH2O 100 ml
0.5 M Tris (pH 6.8) : (for 100ml)
1.5 M Trisma base 6.1 gm
SDS 0.4 gm
DH2O 100ml
3) 10% SDS Solution: (for 100ml)
SDS 10 gm
DH2O 100 ml
4) 10% APS (Ammonium persulphate) : (for 10ml)
APS 1 gm
DH2O 10 ml

57
5) 1x TGS Running Buffer: (for 2.5 L) pH 8.3
Trisma base 7.5 gm
Glycine 36 gm
10% SDS 25 ml
DH2O upto 2.5L
6) Staining: (for 100 ml)
Acetic Acid 10 ml
Methanol 10 ml
DH2O 80 ml
Comassie Blue 0.1-0.2 gm
7) Destaining: (for 100 ml)
Acetic Acid 10 ml
Methanol 10 ml
DH2O 80 ml

58
APPENDIX-IV
Instruments
The important equipments used through the study are listed below:
Autoclave SAARC
Freeze (-20°C) Siemens
Incubator SAARC
Micropipette (10-100µl) Eppendorf, Germany
Micropipette (20-200µl) Eppendorf, Germany
Oven, Model:MH6548SR LG, China
pH meter, Model: E-201-C Shanghai Ruosuaa
Technology company,
China
Refrigerator (4oC), Model: 0636 Samsung
Safety cabinet
Class II Microbiological
SAARC
Shaking Incubator, Model: WIS-20R Daihan Scientific, Korea
Vortex Mixture VWR International
Water bath Korea
Weighing balance ADAM
EQUIPMENT™,
United Kingdom

59