SHIV SHAKTI International Journal in Multidisciplinary and …ssijmar.in/vol2no4/vol2 no4.4.pdf ·...
15
1 www.ssijmar.in A Study on Investor’s attitude towards Currency market in Chennai, Tamil nadu. India MS. R. SARANYA 1 MS.KAVITA PODDAR 2 1. Lecturer - Dept of Management Studies , Sri Ramanujar Engineering College Kolapakkam, Vandalur, Chennai -600 048, Tamil Nadu, India. 2. Lecturer - Dept of Management Studies , Sri Ramanujar Engineering College Kolapakkam, Vandalur, Chennai -600 048, Tamil Nadu, India. Abstract Investment is the purchase of an asset or item with the hope that it will generate income or appreciate in the future and be sold at the higher price. This article sheds light on investment behavior of investors and investment preference for the same. Investment is necessary for meeting the cost of inflation and to maintain the liquidity. The main purpose of this study is to evaluate that which is the most favorable option in which people like to invest their savings and which factors do generally considered by people while making investments in available avenues. Descriptive research design was adopted in this study. Convenient sampling technique used to choose samples. Totally 300 respondents participated through by questionnaire in this study. Chi square, One way Anova, Mann – whitney U test, Kruskal –Wallis test and Rank correlation test were used to measure hypothesis and analyze the matrimonial sites. Findings indicate that Majority of the respondents believe to the statement “High risk, high return” . The main objective of investing in currency market is for the return on investment and the wealth maximization. Keywords: Currency, return, risk, investor’s attitude, term of investment, savings. SHIV SHAKTI International Journal in Multidisciplinary and Academic Research (SSIJMAR) Vol. 2, No. 4, July- August (ISSN 2278 – 5973)
Transcript of SHIV SHAKTI International Journal in Multidisciplinary and …ssijmar.in/vol2no4/vol2 no4.4.pdf ·...
1
www.ssijmar.in
A Study on Investor’s attitude towards Currency market in Chennai, Tamil nadu. India
MS. R. SARANYA1
MS.KAVITA PODDAR2
1. Lecturer - Dept of Management Studies , Sri Ramanujar Engineering College Kolapakkam, Vandalur, Chennai -600 048,
Tamil Nadu, India.
2. Lecturer - Dept of Management Studies , Sri Ramanujar Engineering College Kolapakkam, Vandalur, Chennai -600 048, Tamil Nadu, India.
Abstract
Investment is the purchase of an asset or item with the hope that it will generate income or appreciate in the future and be sold at the
higher price. This article sheds light on investment behavior of investors and investment preference for the same. Investment is
necessary for meeting the cost of inflation and to maintain the liquidity. The main purpose of this study is to evaluate that which is
the most favorable option in which people like to invest their savings and which factors do generally considered by people while
making investments in available avenues. Descriptive research design was adopted in this study. Convenient sampling technique
used to choose samples. Totally 300 respondents participated through by questionnaire in this study. Chi square, One way Anova,
Mann – whitney U test, Kruskal –Wallis test and Rank correlation test were used to measure hypothesis and analyze the
matrimonial sites. Findings indicate that Majority of the respondents believe to the statement “High risk, high return”. The main
objective of investing in currency market is for the return on investment and the wealth maximization.
Keywords:
Currency, return, risk, investor’s attitude, term of investment, savings.
SHIV SHAKTI
International Journal in Multidisciplinary and Academic Research (SSIJMAR)
Vol. 2, No. 4, July- August (ISSN 2278 – 5973)
2
www.ssijmar.in
Introduction
The foreign exchange market is the mechanism by which currencies are valued relative to one another, and exchanged. An individual
or institution buys one currency and sells another in a simultaneous transaction. Currency trading always occurs in pairs where one
currency is sold for another and is represented in the following notation: EUR/USD or CHF/YEN. The exchange rate is determined
through the interaction of market forces dealing with supply and demand.
Currency Trading is the exchange of money from different countries. The value of one country’s currency is constantly changing
against the value of another country’s currency. The investors make money through buying and selling currencies on the foreign
exchange market. Currency is affected by various economic and political factors. The largest fluctuations in currency prices usually
occur during Central Bank intervention, when government trade in huge amounts in an attempt to either raise or lower the value of
their own currency. This, as well as many other factors such as interest rate changes, economic figures, political instability and large
lot transactions by hedge funds can move the market. Currencies trade in pairs, like the Euro-US Dollar (EUR/USD) or US Dollar /
Japanese Yen (USD/JPY). Currency Trading is used to speculate on the relative strength of one currency against another. The
currency market is an over-the-counter market, which means that it is a decentralized market with no central exchange..
Foreign Exchange Traders generate profits, or losses, by speculating whether a currency will rise or fall in value in comparison to
another currency. A trader would buy the currency which is anticipated to gain in value, or sell the currency which is anticipated to
lose value against another currency. The value of a currency, in the simplest explanation, is a reflection of the condition of that
country's economy with respect to other major economies. The Forex market does not rely on any one particular economy. Whether or
not an economy is flourishing or falling into a recession, a trader can earn money by either buying or selling the currency. Reactive
trading is the buying or selling of currencies in response to economic or political events, while speculative trading is based on a trader
anticipating events.
Benefits of Forex Trading
The forex market is the largest and most liquid of the financial markets.
Daily activity often exceeds $4 trillion USD a day, with over $1.5 trillion of that conducted in the form of spot trading.
Forex spot trades consist of a contract to trade a given amount of a currency pair with a market-maker, at the advertised buy /
sell price (the spot rate).
It is the existence of volatility within the forex market that enables trader's to take advantage of exchange rate fluctuations for
speculative purposes.
Traders must be aware that greater volatility also means greater risk potential.
Review of Literature
Dr. Devajit mahanta-Since its inspection in 2008, currency derivative trade in india had experienced explosive growth, both in
volumes and value over the years across all the four currencies contracts that were in operation in INRUSD, INRGBP, INREUR and
INRJPY. However in terms of the open interest currency derivatives trade in MCX is more as compared to the NSE. By consider both
stock and commodity exchanges for launching currency futures contracts government of India has done a commendable job which is
3
www.ssijmar.in
expected to increase the number of quality players, introduce healthy competition and boost trading volumes of Indian currency
futures. The global markets (mainly USA) become active only after Indian markets close at 5.00 pm and as a result there is an evident
fear about the risks associated with overnight fluctuations in the currency pair. Therefore the functioning as well as the profitability in
Indian currency futures is effected by the current performance of the international currency futures market. It is imperative that any
evaluation, projection on Indian currency futures market should be undertaken keeping the international market in perspective.
According to the RBI-SEBI standing technical committee report (RBI-SEBI, 2008) in the context of liberalization of the capital and
commodity futures market most of the participant from the both markets felt that hedging opportunity through currency trading
enhance the flexibility to manage their currency risk dynamically. Even international experience shows that exchange traded currency
futures contracts facilitate efficient price discovery. The launch ofcurrency derivatives in India follow the recommendations
madejointly by the Securities and Exchange Board of India and the Reserve Bank of India in May 2008.
Nair (2004) observed that in most of the countries, where currency futures have really flourished, the trading takes place on multiple
commodity exchanges, rather than stock exchanges. Besides, since foreign operators NRIs, FIIs etc. are barred from participating, the
new exchange means the contract can be traded only within India and that too, without involving any outflow of funds.
A study by Guru (2009) indicated that the global markets (mainly USA) become active only after Indian markets close at 5.00 pm and
as a result there is an evident fear about the risks associated with overnight fluctuations in the currency pair. Once the Indian markets
close, the positions cannot be reversed by the traders till the next day. The tax treatment of the gains/losses in the futures currency
market would this be treated as business income as in the case of equity derivatives also not make it clear by the regulator.
Dharen Kumar Pandey(Banaras Hindu University)-The introduction of currency futures in India has passed a journey of almost two
years and many changes have been implemented in the trading system in this regard. Currency futures have significantly gained
importance all over the world since the first currency futures contract was traded in the year 1972. The futures market holds a great
importance in the economy and, therefore, it becomes imperative that we analyse this important market and seek answers to a few
basic questions. The main theme of this paper is to assess the speed in which the growth of currency futures in India has accelerated. It
also aims at examining the volatility of the currency futures. In order to study the growth of the currency futures, the number of
contracts traded and open interest at NSE has been inclusively compared. Attempt has been made to check whether the daily returns of
the NSE on currency futures are normally distributed. For this purpose the changes in the daily value of Rupee as compared to Dollar,
Yen, Euro and Pound have been calculated for the period and the data have been used for the ANOVA Test to test the hypothesis that
the returns are normally distributed. The currency futures have received a good response from the investors as well as the hedgers.
Initially, currency futures were started for USD-INR contracts but trading in Euro-INR, Yen-INR and Pound-INR contracts have been
introduced in January 2010. The risk involved is comparatively low in this case and currency futures has proved to be a good tool for
hedging the risk involved in the currency of a country (currency risk). It is hoped that the currency futures market will develop more
faster and it will be a good choice for all the market participants in the near future and it will find its way in the Indian economy.
Need For The Study
The study is an attempt to know the perception level of investors towards currency market. The study will help the
organization to understand the needs of the investors and in tracking them in future as per their need. This study is quite
helpful in understanding the functioning of currency trading company in recent market condition..
4
www.ssijmar.in
Scope of the study
The study covers the entire currency market in order to understand the perception level of investors. The study also tries to cover the
investment information of investors considering the socio-economic status of the investors.
Objectives
1. To understand the investors preference towards currency market.
2. To identify the source this provides information to investors about currency market.
3. To identify the level of risk the investors prefer to take in their investment.
4. To study the factors which investors consider before investing.
5. To find out the duration of investment which investors prefer.
6. To identify the objective of saving of an investment.
7. To study the dependence/independence level of demographic factors of the investors.
Limitation And Constraints
1. However the data collected and interpreted with utmost reliability and consistency But due to subjectivity and prejudice of a few
respondents, certain limitation like answers of the questionnaire depend upon the belief of customers, which they may differ
from the reliability
2. The survey conducted considering the time & space constraint: Chance of wrong answer cannot be ruled out; indirect measures
relied upon the customer’s attitude etc.
Hypothesis Formulation (HO)
H0: There is no significant relationship between Investor’s Education Qualification and Investor’s Source of Information
about Currency Market
H0: There is no significant relationship between Occupation of the investor’s and Investor’s Willingness to take Risk in
Currency Market
H0: The Samples are drawn from identical population
H0: There is no significant difference in means of these samples
Research Methodology
Research Design: Descriptive research design was undertaken in this research.
Sampling Technique: Convenience sampling technique was utilized from non-probability sampling method to select the sample.
5
www.ssijmar.in
Method of Data Collection: Survey method of primary data collection using combined interview and questionnaire adopted for
collection of primary. Secondary data’s collected from books, journal, newspaper and websites.
sample size : 121 respondents
Statistical Tools: This research was analyzed through 5 tools. They are Percentage analysis, Chi-Square analysis, Mann Whitney
U Test, Anova Table
Chi Square
Chi square test is a non-parameter test that establishes the in dependence between variables. It is measured by
comparing the observed with those of expected frequencies based on the hypothesis. It is given by
Ψ= Σ (O-E) ^2 / E
O=Observed Frequencies
E=Expected Frequencies
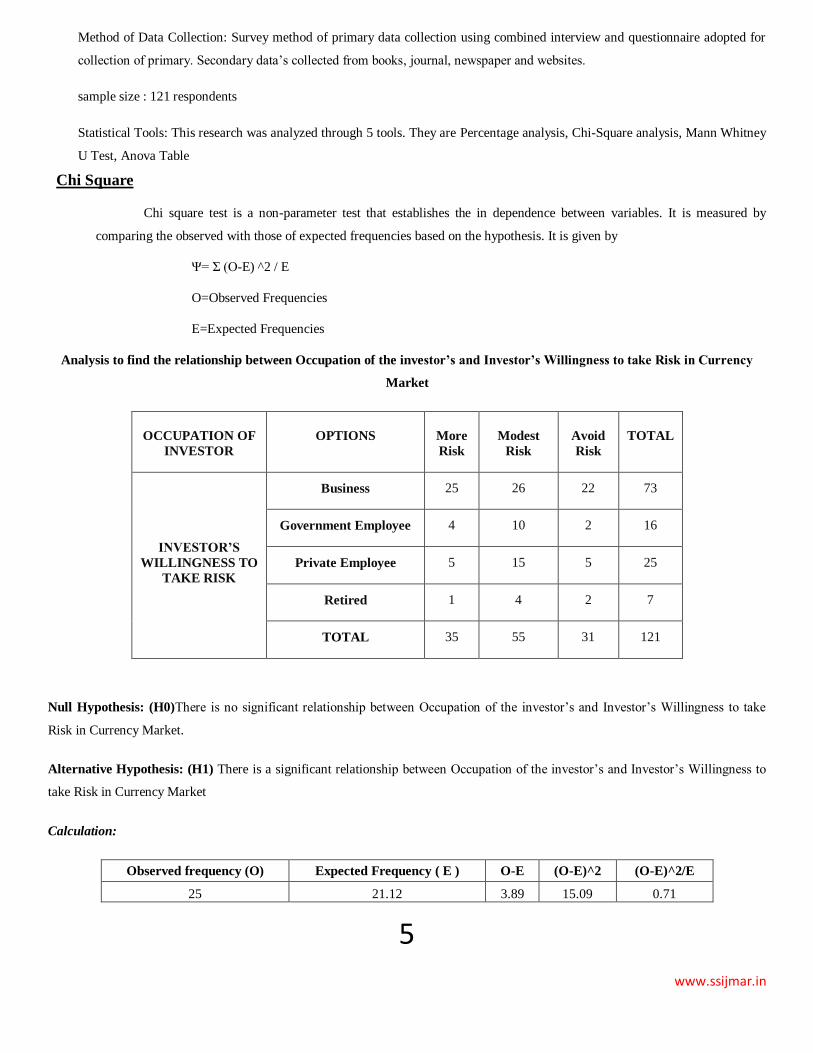
Analysis to find the relationship between Occupation of the investor’s and Investor’s Willingness to take Risk in Currency
Market
OCCUPATION OF
INVESTOR
OPTIONS More
Risk
Modest
Risk
Avoid
Risk
TOTAL
INVESTOR’S
WILLINGNESS TO
TAKE RISK
Business 25 26 22 73
Government Employee 4 10 2 16
Private Employee 5 15 5 25
Retired 1 4 2 7
TOTAL 35 55 31 121
Null Hypothesis: (H0)There is no significant relationship between Occupation of the investor’s and Investor’s Willingness to take
Risk in Currency Market.
Alternative Hypothesis: (H1) There is a significant relationship between Occupation of the investor’s and Investor’s Willingness to
take Risk in Currency Market
Calculation:
Observed frequency (O) Expected Frequency ( E ) O-E (O-E)^2 (O-E)^2/E
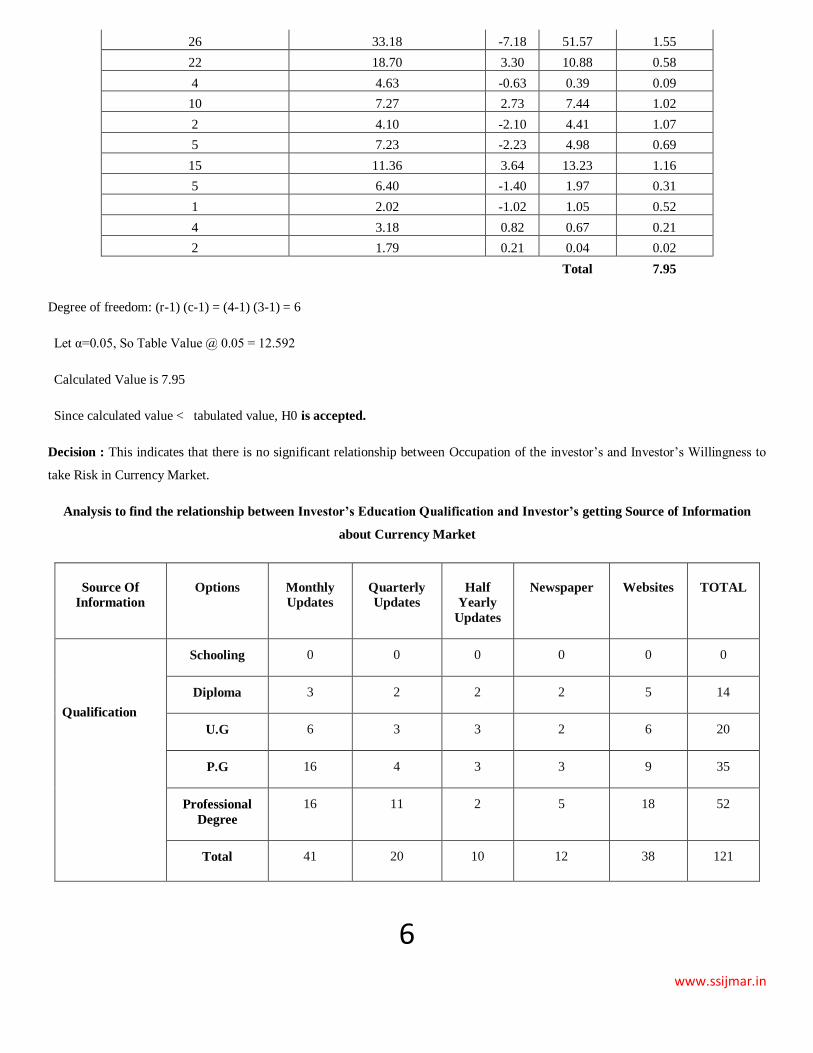
25 21.12 3.89 15.09 0.71
6
www.ssijmar.in
26 33.18 -7.18 51.57 1.55
22 18.70 3.30 10.88 0.58
4 4.63 -0.63 0.39 0.09
10 7.27 2.73 7.44 1.02
2 4.10 -2.10 4.41 1.07
5 7.23 -2.23 4.98 0.69
15 11.36 3.64 13.23 1.16
5 6.40 -1.40 1.97 0.31
1 2.02 -1.02 1.05 0.52
4 3.18 0.82 0.67 0.21
2 1.79 0.21 0.04 0.02
Total 7.95
Degree of freedom: (r-1) (c-1) = (4-1) (3-1) = 6
Let α=0.05, So Table Value @ 0.05 = 12.592
Calculated Value is 7.95
Since calculated value < tabulated value, H0 is accepted.
Decision : This indicates that there is no significant relationship between Occupation of the investor’s and Investor’s Willingness to
take Risk in Currency Market.
Analysis to find the relationship between Investor’s Education Qualification and Investor’s getting Source of Information
about Currency Market
Source Of
Information
Options Monthly
Updates
Quarterly
Updates
Half
Yearly
Updates
Newspaper Websites TOTAL
Qualification
Schooling 0 0 0 0 0 0
Diploma 3 2 2 2 5 14
U.G 6 3 3 2 6 20
P.G 16 4 3 3 9 35
Professional
Degree
16 11 2 5 18 52
Total 41 20 10 12 38 121
7
www.ssijmar.in
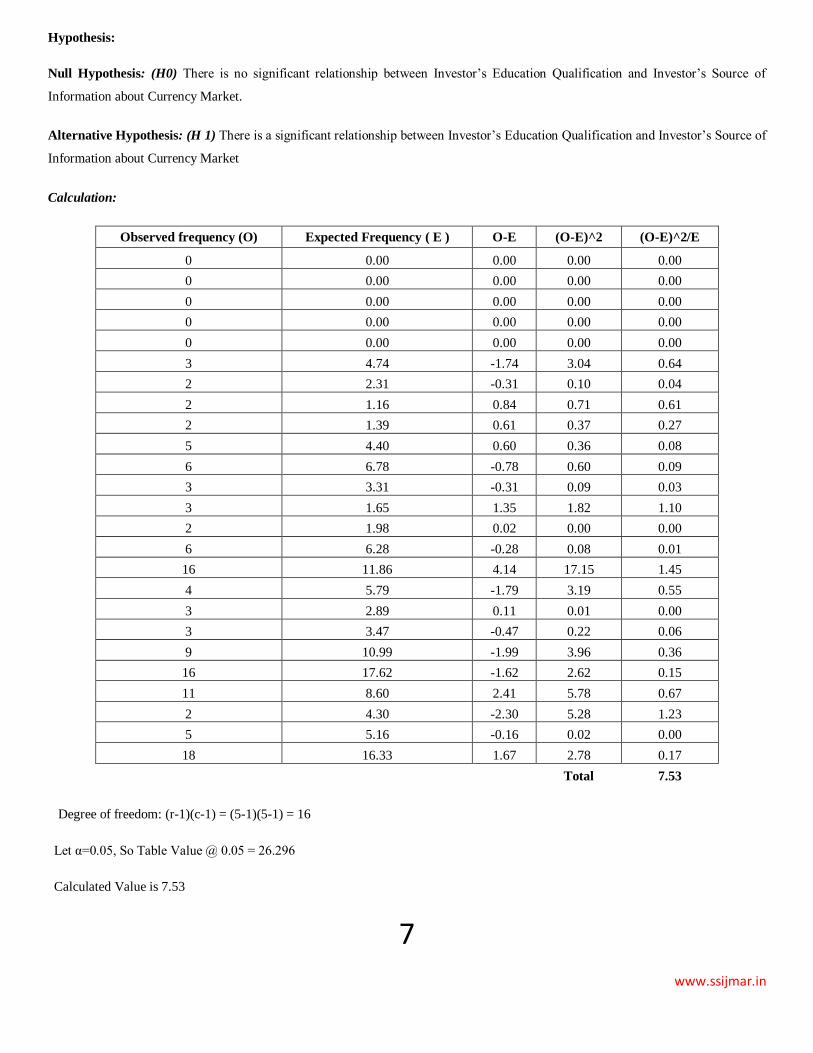
Hypothesis:
Null Hypothesis: (H0) There is no significant relationship between Investor’s Education Qualification and Investor’s Source of
Information about Currency Market.
Alternative Hypothesis: (H 1) There is a significant relationship between Investor’s Education Qualification and Investor’s Source of
Information about Currency Market
Calculation:
Observed frequency (O) Expected Frequency ( E ) O-E (O-E)^2 (O-E)^2/E
0 0.00 0.00 0.00 0.00
0 0.00 0.00 0.00 0.00
0 0.00 0.00 0.00 0.00
0 0.00 0.00 0.00 0.00
0 0.00 0.00 0.00 0.00
3 4.74 -1.74 3.04 0.64
2 2.31 -0.31 0.10 0.04
2 1.16 0.84 0.71 0.61
2 1.39 0.61 0.37 0.27
5 4.40 0.60 0.36 0.08
6 6.78 -0.78 0.60 0.09
3 3.31 -0.31 0.09 0.03
3 1.65 1.35 1.82 1.10
2 1.98 0.02 0.00 0.00
6 6.28 -0.28 0.08 0.01
16 11.86 4.14 17.15 1.45
4 5.79 -1.79 3.19 0.55
3 2.89 0.11 0.01 0.00
3 3.47 -0.47 0.22 0.06
9 10.99 -1.99 3.96 0.36
16 17.62 -1.62 2.62 0.15
11 8.60 2.41 5.78 0.67
2 4.30 -2.30 5.28 1.23
5 5.16 -0.16 0.02 0.00
18 16.33 1.67 2.78 0.17
Total 7.53
Degree of freedom: (r-1)(c-1) = (5-1)(5-1) = 16
Let α=0.05, So Table Value @ 0.05 = 26.296
Calculated Value is 7.53
8
www.ssijmar.in
Since calculated value < tabulated value, H0 is accepted.
Inference:
This indicates that there is no significant relationship between Investor’s Education Qualification and Investor’s Analysing
Source of Information about Currency Market.
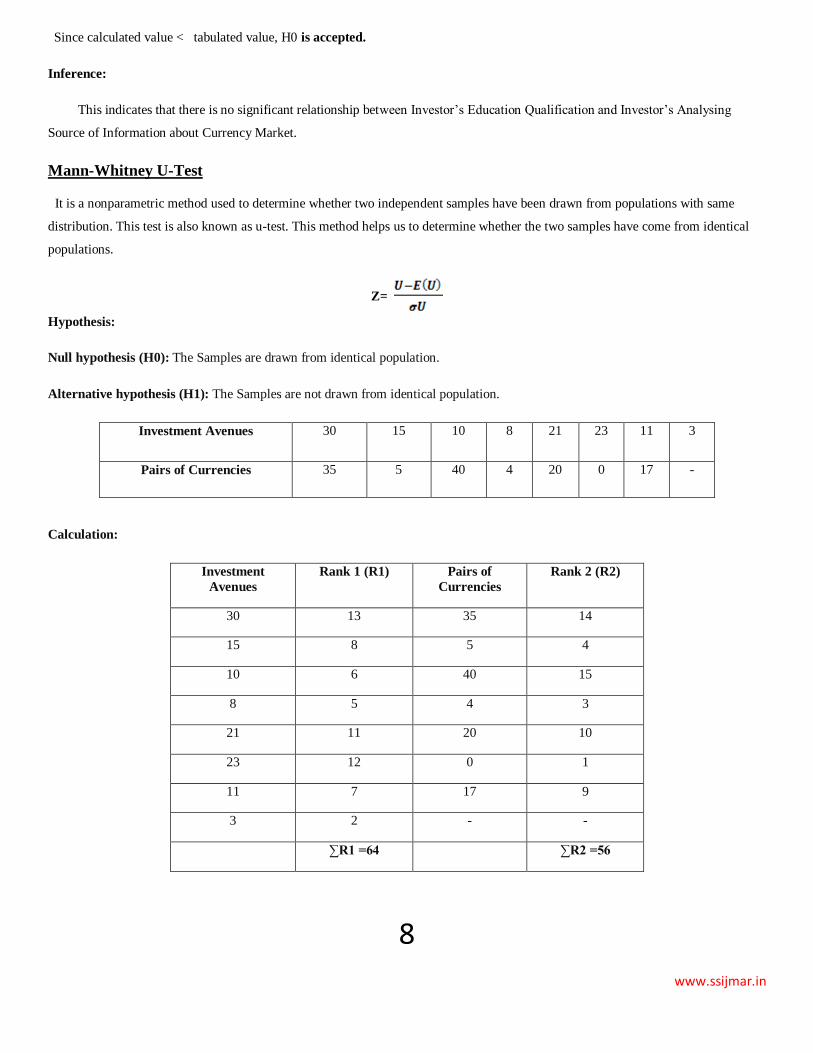
Mann-Whitney U-Test
It is a nonparametric method used to determine whether two independent samples have been drawn from populations with same
distribution. This test is also known as u-test. This method helps us to determine whether the two samples have come from identical
populations.
Z=
Hypothesis:
Null hypothesis (H0): The Samples are drawn from identical population.
Alternative hypothesis (H1): The Samples are not drawn from identical population.
Investment Avenues 30 15 10 8 21 23 11 3
Pairs of Currencies 35 5 40 4 20 0 17 -
Calculation:
Investment
Avenues
Rank 1 (R1) Pairs of
Currencies
Rank 2 (R2)
30 13 35 14
15 8 5 4
10 6 40 15
8 5 4 3
21 11 20 10
23 12 0 1
11 7 17 9
3 2 - -
∑R1 =64 ∑R2 =56
9
www.ssijmar.in
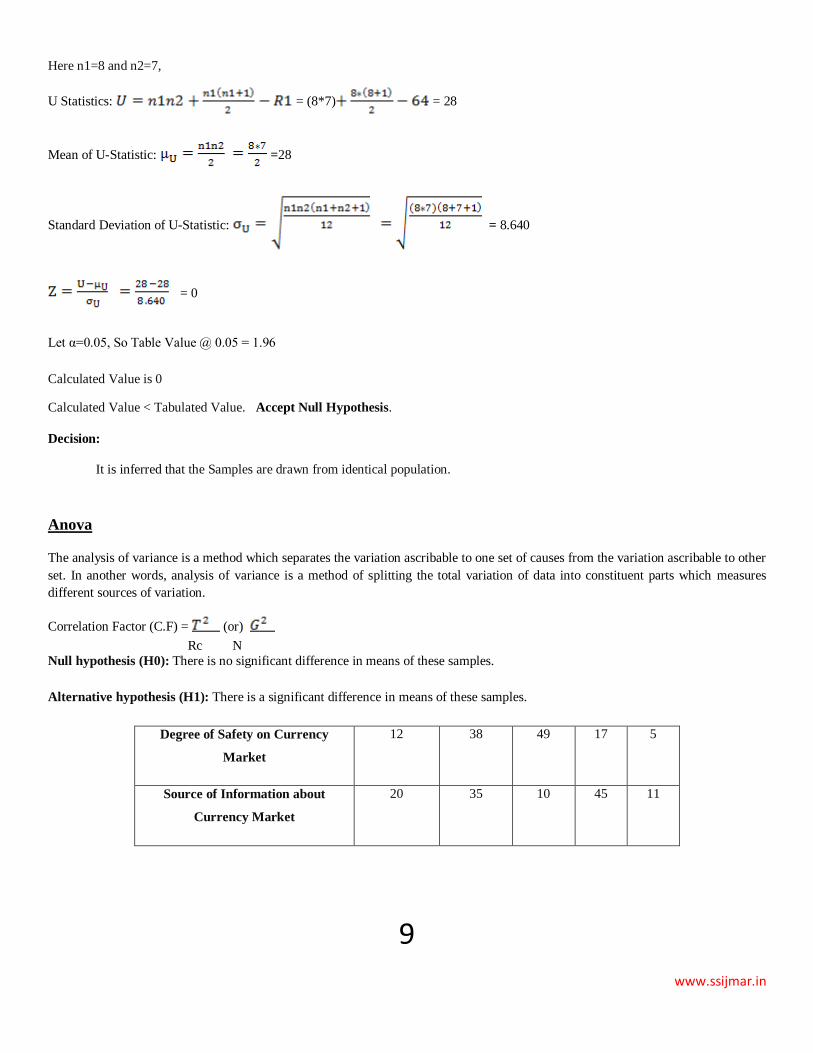
Here n1=8 and n2=7,
U Statistics: = (8*7) = 28
Mean of U-Statistic: =28
Standard Deviation of U-Statistic: = 8.640
= 0
Let α=0.05, So Table Value @ 0.05 = 1.96
Calculated Value is 0
Calculated Value < Tabulated Value. Accept Null Hypothesis.
Decision:
It is inferred that the Samples are drawn from identical population.
Anova
The analysis of variance is a method which separates the variation ascribable to one set of causes from the variation ascribable to other
set. In another words, analysis of variance is a method of splitting the total variation of data into constituent parts which measures
different sources of variation.
Correlation Factor (C.F) = (or)
Rc N
Null hypothesis (H0): There is no significant difference in means of these samples.
Alternative hypothesis (H1): There is a significant difference in means of these samples.
Degree of Safety on Currency
Market
12 38 49 17 5
Source of Information about
Currency Market
20 35 10 45 11
10
www.ssijmar.in
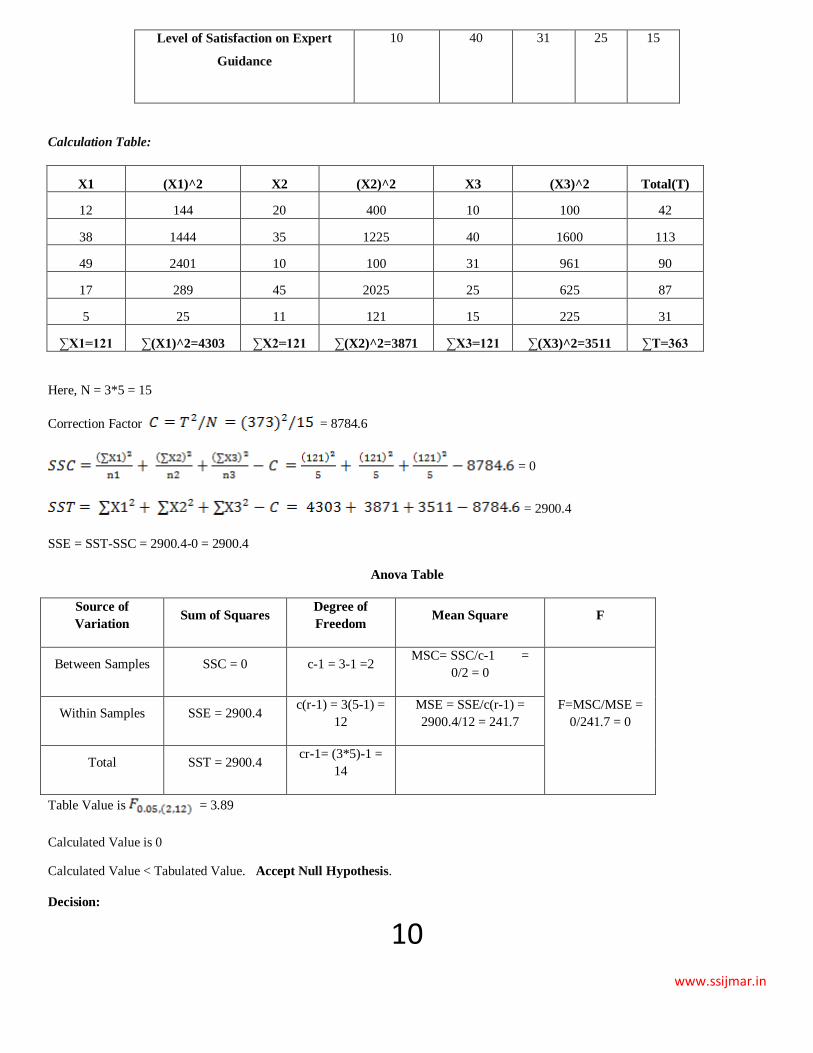
Level of Satisfaction on Expert
Guidance
10 40 31 25 15
Calculation Table:
X1 (X1)^2 X2 (X2)^2 X3 (X3)^2 Total(T)
12 144 20 400 10 100 42
38 1444 35 1225 40 1600 113
49 2401 10 100 31 961 90
17 289 45 2025 25 625 87
5 25 11 121 15 225 31
∑X1=121 ∑(X1)^2=4303 ∑X2=121 ∑(X2)^2=3871 ∑X3=121 ∑(X3)^2=3511 ∑T=363
Here, N = 3*5 = 15
Correction Factor = 8784.6
= 0
= 2900.4
SSE = SST-SSC = 2900.4-0 = 2900.4
Anova Table
Source of
Variation Sum of Squares
Degree of
Freedom Mean Square F
Between Samples SSC = 0 c-1 = 3-1 =2 MSC= SSC/c-1 =
0/2 = 0
F=MSC/MSE =
0/241.7 = 0 Within Samples SSE = 2900.4
c(r-1) = 3(5-1) =
12
MSE = SSE/c(r-1) =
2900.4/12 = 241.7
Total SST = 2900.4 cr-1= (3*5)-1 =
14
Table Value is = 3.89
Calculated Value is 0
Calculated Value < Tabulated Value. Accept Null Hypothesis.
Decision:
11
www.ssijmar.in
It is inferred that there is no significant difference in means of these samples.
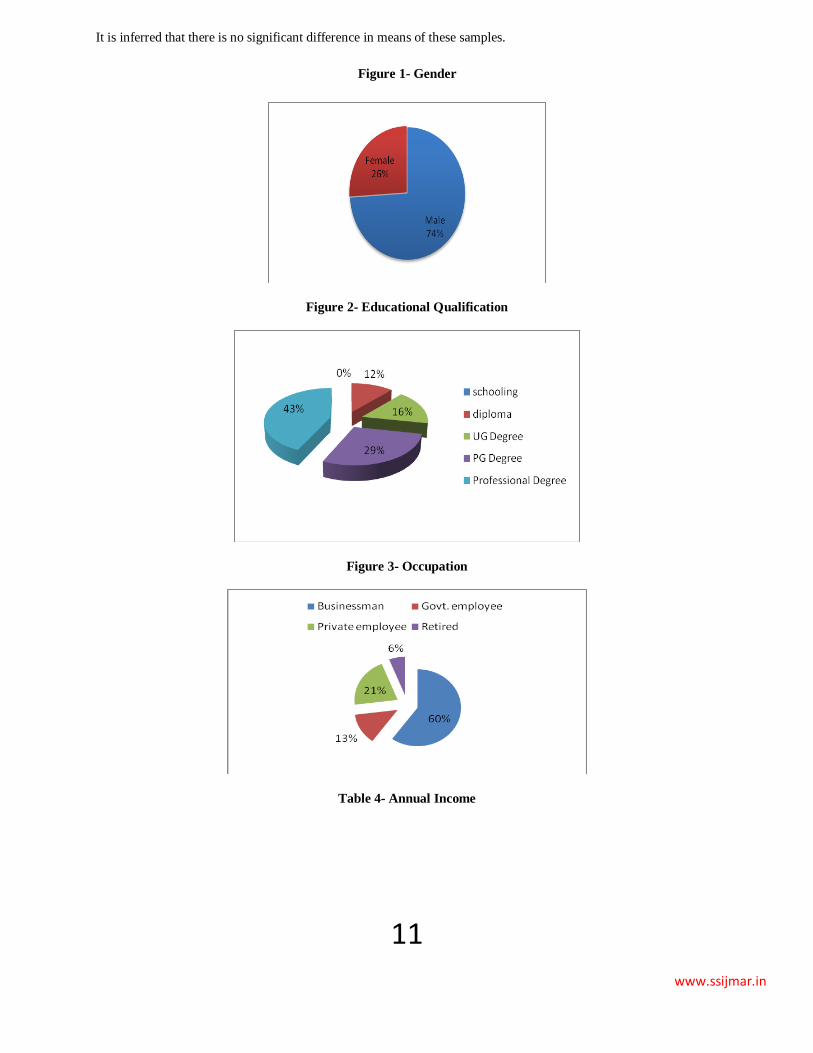
Figure 1- Gender
Figure 2- Educational Qualification
Figure 3- Occupation
Table 4- Annual Income
12
www.ssijmar.in
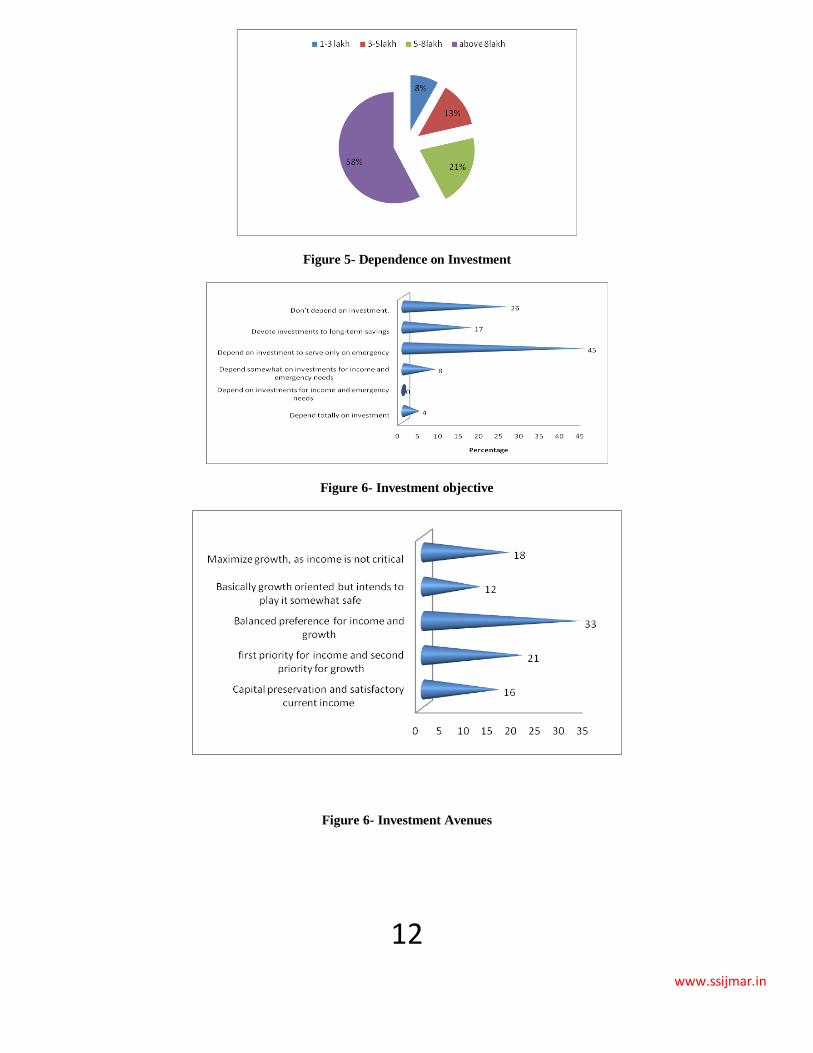
Figure 5- Dependence on Investment
Figure 6- Investment objective
Figure 6- Investment Avenues
13
www.ssijmar.in
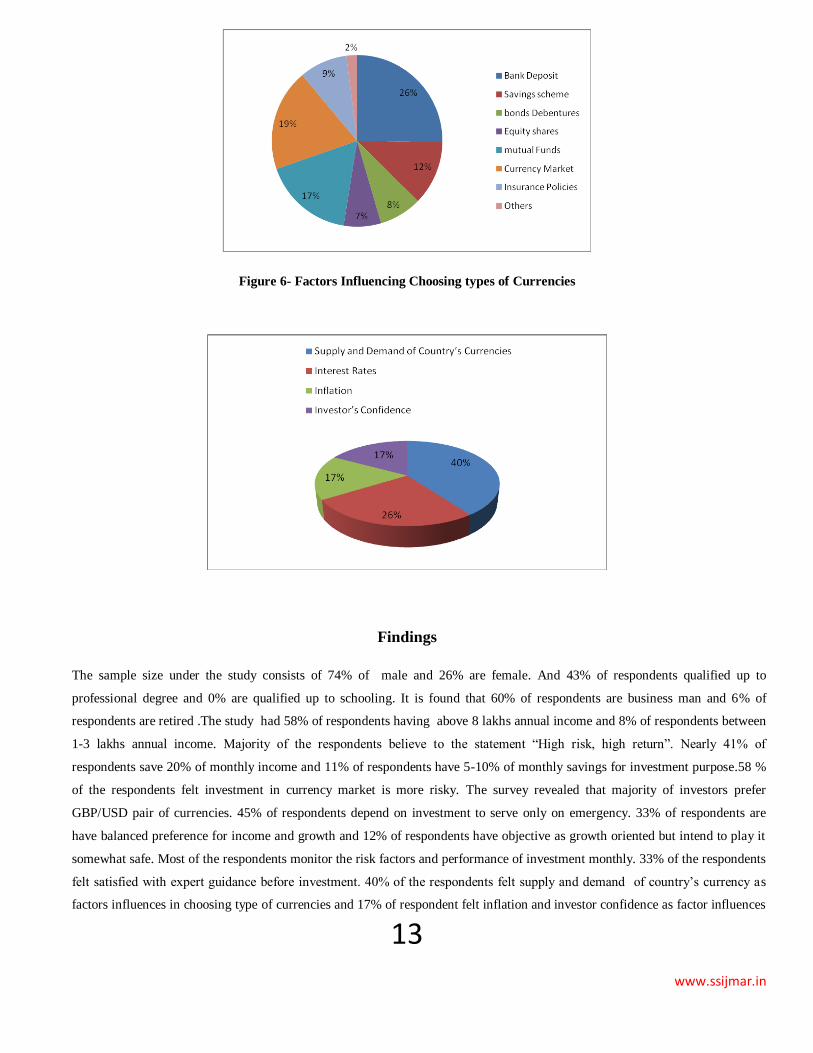
Figure 6- Factors Influencing Choosing types of Currencies
Findings
The sample size under the study consists of 74% of male and 26% are female. And 43% of respondents qualified up to
professional degree and 0% are qualified up to schooling. It is found that 60% of respondents are business man and 6% of
respondents are retired .The study had 58% of respondents having above 8 lakhs annual income and 8% of respondents between
1-3 lakhs annual income. Majority of the respondents believe to the statement “High risk, high return”. Nearly 41% of
respondents save 20% of monthly income and 11% of respondents have 5-10% of monthly savings for investment purpose.58 %
of the respondents felt investment in currency market is more risky. The survey revealed that majority of investors prefer
GBP/USD pair of currencies. 45% of respondents depend on investment to serve only on emergency. 33% of respondents are
have balanced preference for income and growth and 12% of respondents have objective as growth oriented but intend to play it
somewhat safe. Most of the respondents monitor the risk factors and performance of investment monthly. 33% of the respondents
felt satisfied with expert guidance before investment. 40% of the respondents felt supply and demand of country’s currency as
factors influences in choosing type of currencies and 17% of respondent felt inflation and investor confidence as factor influences
14
www.ssijmar.in
Chi Square Analysis inferred that there is no significant relationship between Occupation of the investor’s and Investor’s
Willingness to take Risk in Currency Market and also there is no significant relationship between Investor’s Education
Qualification and investors getting source of Information about Currency Market. Mann Whitney U Test inferred that the Samples
are drawn from identical population. Anova analysis inferred that there is no significant difference in means of these samples
Suggestions
1. Few portions of investors have the awareness about currency market and most of the respondents they don’t have
sufficient knowledge to invest in the market. Financial institutions can try to use some suitable marketing strategies to
promote awareness about available avenues for investment for profit and wealth maximization.
2. Government should stress the financial institutions to conduct investor guidance workshops about available avenues for
investment.
3. The return and risk involved in investment in currency market should be clearly intimated to the investors through
various channels of communication to avoid the misconception and loss to the investors.
4. Industry associations and NGOs to educate the investor on the need for savings.
5. Some personalized service can be given to investors to retain the investors.
6. Financial institutions should try to create suitable products for attracting the various investors and provide guidance for
the investment.
Conclusion
The overall study reveals that people in Chennai are interested in currency market investment for the profit and wealth maximization.
The risk and return concept plays a major role in investing. The demographic factors influence the behavior of the investors in
Chennai. The high income group is ready to take more risk in investment whereas the middle and lower income group considers the
risk involved in investment and safety of investment as major factor.
The marketing strategies play an important role in attracting the people for investment. The action against issues on various
investment alternatives by the controlling authority will help in protecting the interest of the investors which will result a growing
trend for investment in India.
Acknowledgement
My sincere thanks to Mr. Rajesh Purushothaman, Assistant Manager, Sutherland Global services, Siruseri, SIPCOT ,Chennai.
My deep sense of gratitude to Prof. R. Ramamoorthy, Head, Colleagues and students of Department of Management Studies in Sri
Ramanujar Engineering College, Vandalur, Chennai -48, Tamil nadu who were supported, encouraged and helped me a lot to
complete my research. .
I express my thanks to all my friends who were helped me to collect survey from different sources across Chennai. I owe a great many
thanks to a many people who helped and supported me during the writing of this articles.
My special thanks to all respondents who were participated in my survey. I also extend my heartfelt thanks to my family and well
wishers.
15
www.ssijmar.in
Bibliography
International Journal of Marketing, Financial Services & Management Research ,Vol.1 Issue 11, November 2012, ISSN 2277
3622
Anand Sharma, “Statistics for management”, Himalaya publication, Page no 213 -239.
Dr.P.N.Arora S.Arora, Statistics for management, Sultan chand & co ltd, 2003.
Naral Bajpai, “Business research methods”, Pearson. Page no 93 -113.
Shridhara Bhat.K, “Total quality management”, Himalaya publishing house, 3rd edition.
Uma Sekaran, “Research methods for business”, Wiley student edition, 4th edition.
Asia Pacific Journal of Marketing & Management Review ,Vol.1 No. 2, October 2012, ISSN 2319-2836
DK Pandey - icaindia.info