Dry Bulk Shipping-An Opportunity or an Illusion - Yu Jiang Lisarain
shipping report2012
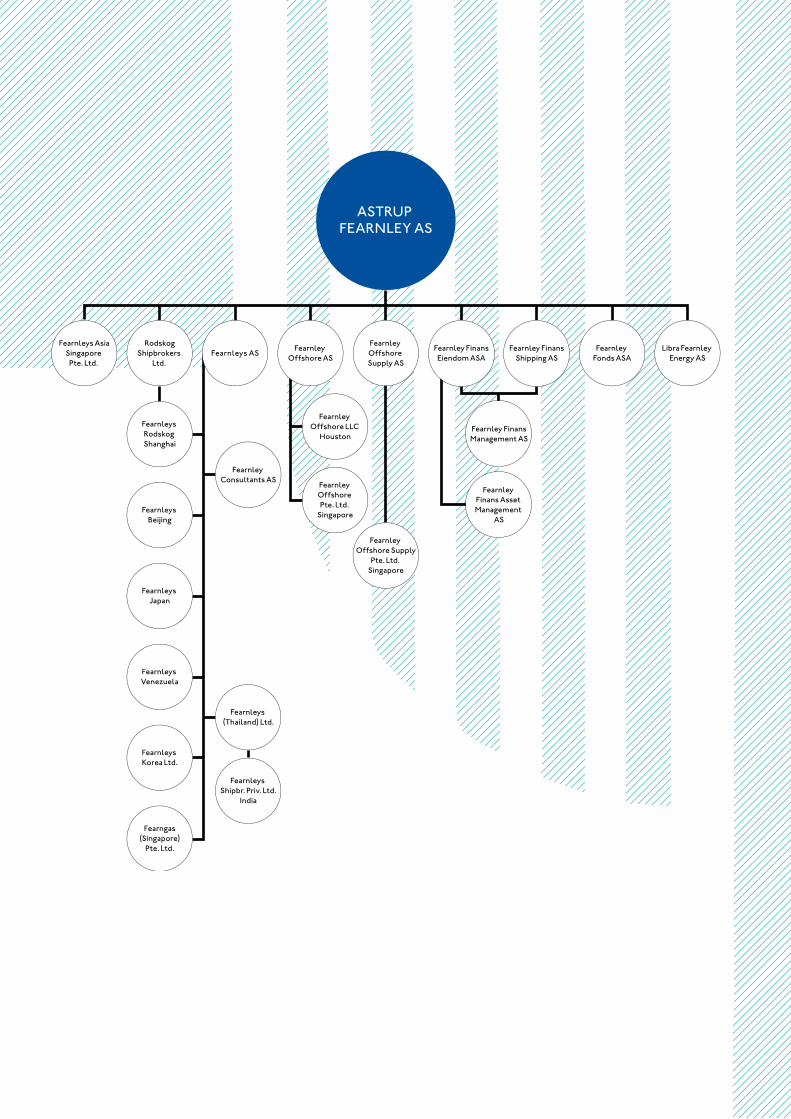
ASTRUP FEARNLEY AS
Fearnleys AsiaSingapore
Pte. Ltd.
RodskogShipbrokers
Ltd. Fearnleys AS
Fearnleys Rodskog Shanghai
Fearnleys Beijing
Fearnleys Japan
Fearnleys Venezuela
Fearnleys Korea Ltd.
Fearngas(Singapore)
Pte. Ltd.
Fearnleys (Thailand) Ltd.
Fearnley Offshore AS
Fearnley Offshore Supply AS
Fearnley Offshore Supply
Pte. Ltd. Singapore
Fearnley Fonds ASA
Libra Fearnley Energy AS
Fearnley Offshore Pte. Ltd.
Singapore
Fearnley Offshore LLC
Houston
Fearnleys Shipbr. Priv. Ltd.
India
Fearnley Consultants AS
Fearnley Finans Asset Management
AS
Fearnley FinansEiendom ASA
Fearnley FinansShipping AS
Fearnley FinansManagement AS
A mArket of opportunities, but don’t Ask the bAnks
deAr reAder,Last year, we wrote about “A market of opportunities”. Maybe we should have saved that heading for this year’s report? The assumption that banks would be supportive towards shipping and project financing proved right only for the first half of the year. The challenges in Greece eventually wiped out the last willing lender late summer of 2011 and funding costs soared. It is of course not entirely right to blame the banks for few opportunities in 2011. The value increase seen in quite a few segments in 2010, proved to be unsustainable, asset values headed mostly south. LNG was the exception, and Offshore Supply managed also well in this gloomy year. A global economy struggling with a sluggish US growth, an indebted Europe, and China with some apparent growth challenges, could simply not absorb the massive order book from the 2006-2007 bonanza years. Earnings fell or did not recover as expected. Several large shipping companies saw their cash reserves deteriorate and bundled with declining values, the banks realized that their loss exposure increased dramatically.
The future for traditional commodity shipping segments such as tank, dry bulk and container does at first glance not look too promising with an order book ranging from 20-40%. At second glance, the significant decline in asset values does represent an opportunity to buy at historically attractive levels. A five-year old dry bulk panamax can be bought at abt. MUSD 24 according to Fearnleys. This is the lowest level since 2003 and more than 70% lower than the peak in 2008. Some segments, such as product and chemical tankers, have experienced a sharp value decline and have an order book of 5-10% which must be characterized as modest.
Coupled with the fact that the steel price has more than doubled since 2003, the case for buying is quite strong. Cash buyers, and preferably those with a cash cushion to come through possible market fluctuations most probably face some good opportunities. That is also the case when negotiating with the yards. We expect them to be more and more anxious to fill their order books. They have become softer on payment terms, but could they eventually also be softer on price? With a continuously high bunkers price (up more than 400% last 10 years), yards and design bureaus will also be challenged to present solutions that can improve speed and consumption figures.
Shipping banks are still very cautious towards new investments and we expect this situation to continue for a while. Buyers, regard- less of buying second hand or newbuilding, will have to be a priority client to obtain financing from banks. Banks support existing clients, and local banks still support local activity. Attractive clients will continue to obtain loans, but even they will face margins that not even existed in their nightmares, if you go 3-4 years back.
Investors’ appetite for new investments appears to be better than the banks’. Maybe that is in particular true for the offshore sector where an important driver for this optimism are the strong oil price, and the outlook for increased spending on exploration and production. There are also large anticipated investments related to offshore wind farms. Values and net earnings appear healthier compared to traditional shipping, although one has to keep a close watch on the supply and demand picture.
There is also more optimism for investment in projects as total volume more than doubled from 2010 to 2011. About MUSD 500 in project value was syndicated amongst the four largest Norwegian players. It should be noted that approximately 80% of this was offshore related projects.
Fearnley Finans Shipping established three new projects in 2011. The projects have quite different structures. One is a classic, long term bareboat, one is a newbuilding project with no fixed employ- ment (but with long term financing secured) and one is a bridge financing with very high seller’s credit. You can read more about the projects in this report.
In this report we present to you estimated market values on each project. These are either based on independent shipbroker’s valuation or on estimated discounted cash flow. All figures and estimates in this report are pre-tax figures, and all clients should seek their own tax advice prior to investing in our projects. Details for each project are mainly based on audited and Board approved figures.
We thank all of our business partners for your support in 2011, and we look forward to a continued close co-operation with you in 2012.
Edvard B. Aaby Eilert H. Lund Tor Kildal Petter Fredrik Bøe
Oslo, March 31st 2012
4www.fearnleys.no shipping report 2012
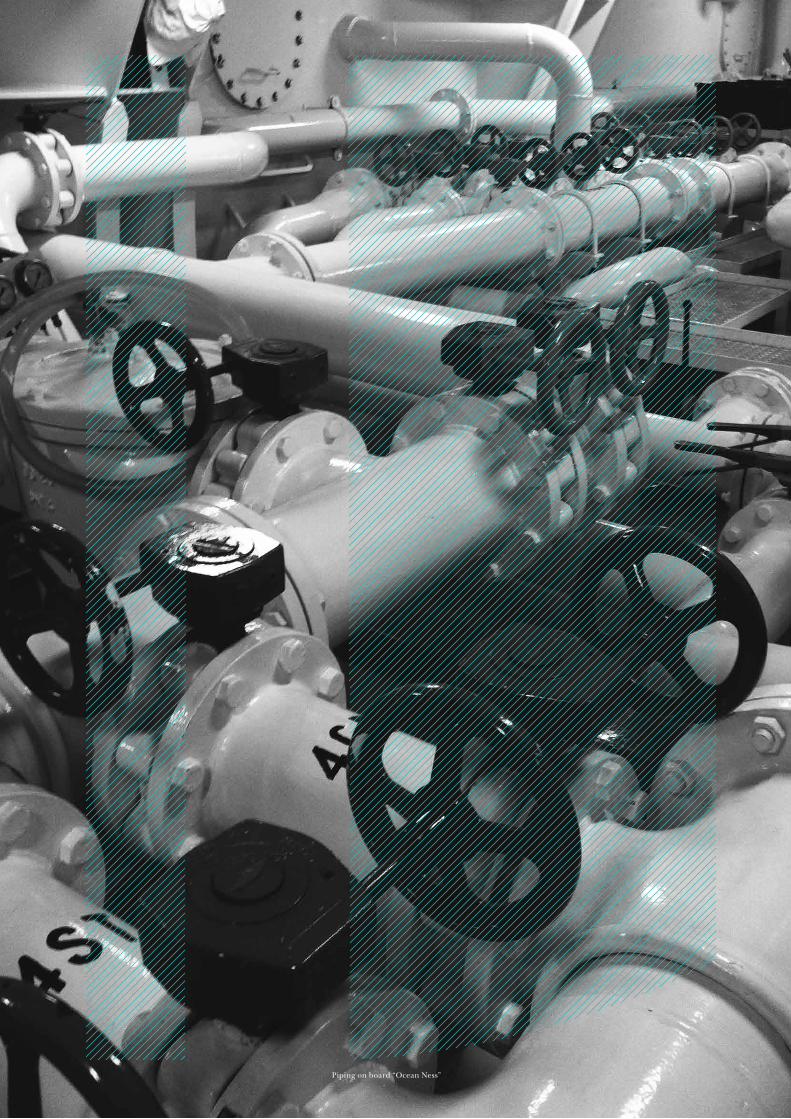
Piping on board “Ocean Ness”
Page
introduction 3index 5Current projects 6Concluded projects 8market report – tankers 10market report – bulk 11market report – offshore 12
The ProjecTs
Name of vessels
TyPe
offshoredyvi Cable ship dis Cable innovator Cable layer/maintenance vessel 14greenbarge dis greenbarge 3 barge 15
greenbarge 4 bargeocean Lanhoy ks ocean king Ahts 16
ocean troll Ahtsocean surf psV
ocean mainport ks ocean mainport psV 17ocean ness dis ocean ness mrV 18ocean rescue ks ocean produce mrV 19seacor supplyships 1 ks seacor express Ahts 20
TaNk/lPgstavanger bay ks stavanger bay Aframax 21
Dry cargoAtlantic sofrana dis helgis mpp/Container Vessel 22Artic express 1 dis Artic fjord fish feed distribution vessel 23
Artic Lady fish feed distribution vesselowner bulk dis owner general cargo bulker 24president bulker dis president bulker general cargo bulker 25ross bulk is tarang panamax bulk carrier 26
roro/lINerAtlantic trader dis Atlantic trader roro/mpp 27bergshav Car Carrier ks hyundai no.203 pure Car Carrier 28dis dyviships Xii dyvi baltic pure Car Carrier 29noCC Atlantic dis noCC Atlantic pure Car truck Carrier 30
Limited partnerships 32fearnley finans eiendom AsA – direct investments in real estate 35
indeX
6www.fearnleys.no shipping report 2012
Current projeCts
segmentProject value upon syndication (UsD)
average Irr p.a.
No. of projects
No. of vessels
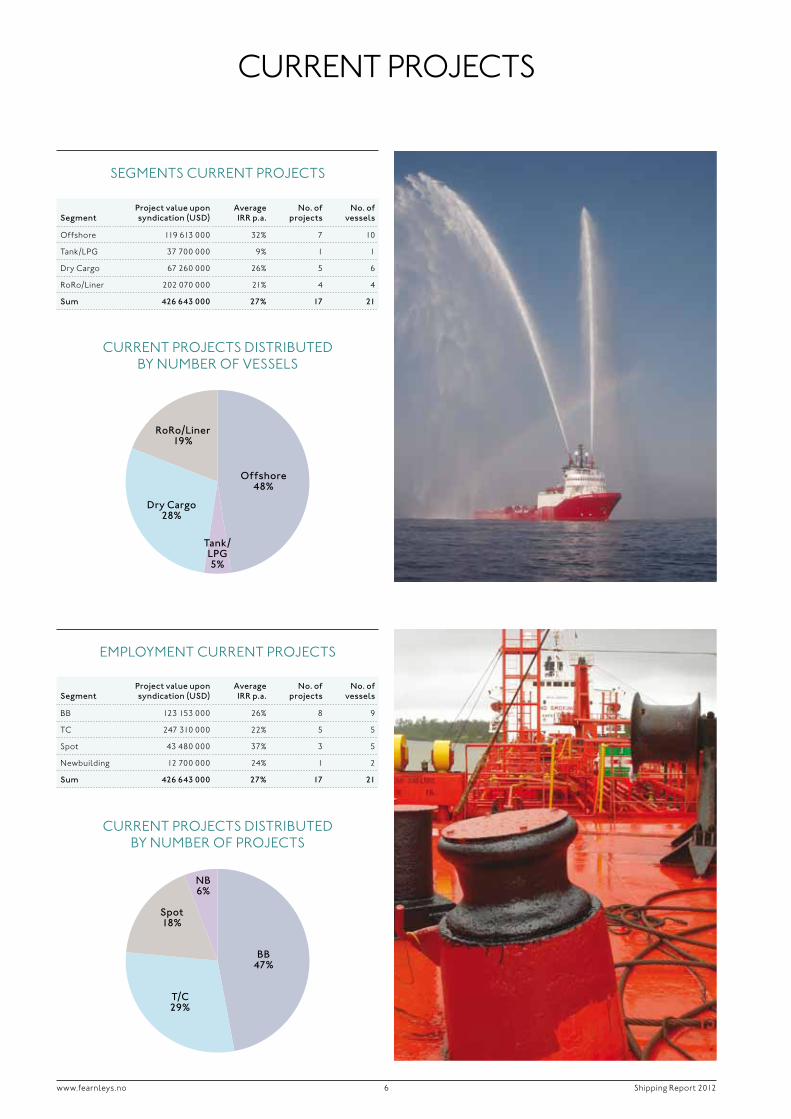
bb 123 153 000 26% 8 9
tC 247 310 000 22% 5 5
spot 43 480 000 37% 3 5
newbuilding 12 700 000 24% 1 2
sum 426 643 000 27% 17 21
segmentProject value upon syndication (UsD)
average Irr p.a.
No. of projects
No. of vessels
offshore 119 613 000 32% 7 10
tank/Lpg 37 700 000 9% 1 1
dry Cargo 67 260 000 26% 5 6
roro/Liner 202 070 000 21% 4 4
sum 426 643 000 27% 17 21
Current projeCts distributed by number of VesseLs
segments Current projeCts
Current projeCts distributed by number of projeCts
empLoyment Current projeCts
BB47%
NB6%
T/C29%
Spot18%
Offshore48%
Tank/LPG5%
Dry Cargo28%
RoRo/Liner19%

7www.fearnleys.no shipping report 2012
projeCt’s AnnuAL internAL rAte of return (irr) And mArket VALue per 1% shAre
established currency
Paid in capital
Net Distributions
market value December 2011 Based on
Irrp.a.
Irr p.a. upon syndication
Nominal return
bergshav Car Carrier ks jul 98 usd 29 500 126 950 71 253 VAe 22% 22% 572%
stavanger bay ks jun 99 usd 82 700 20 000 150 553 VAe 9% 16% 106%
dis dyviships Xii feb 00 nok 32 500 158 500 5 000 VAe 31% 26% 403%
ross bulk is sep 02 usd 12 117 137 043 79 912 pV 71% 23% 1691%
dyvi Cable ship dis feb 06 usd 44 060 47 500 63 840 pV 23% 20% 153%
ocean mainport ks may 06 nok 175 000 483 000 92 945 VAe 97% 26% 135%
Atlantic trader dis jun 06 usd 18 100 16 000 34 929 pV 32% 17% 181%
ocean Lanhoy ks sep 06 nok 614 000 0 1 206 681 VAe 14% 28% -5%
ocean rescue ks oct 06 nok 250 000 0 144 900 VAe 0% 28% 0%
noCC Atlantic dis feb 07 usd 516 000 288 000 200 000 VAe -2% 12% -5%
seacor supplyships 1 ks Apr 07 usd 160 000 306 053 120 036 pV 47% 18% 166%
Artic express 1 dis may 07 nok 308 000 135 000 428 282 pV 16% 14% 83%
Atlantic sofrana dis jul 07 usd 17 340 14 031 5 287 pV 7% 27% 11%
president bulker dis dec 10 usd 25 000 20 610 7 164 pV 15% 25% 11%
owner Bulk DIs aug 11 UsD 20 000 1 750 20 435 Pv 23% 23% 11%
ocean Ness DIs aug 11 Nok 280 000 28 000 279 000 Pv 21% 18% 10%
greenbarge DIs Dec 11 UsD 70 000 0 70 000 vae 24% 24% 0%
average 27% 22% 225%
VAe: Value adjusted equitypV: present value of the future, estimated, discounted equity cash flowirr: internal rate of return per annum on equity
Current projeCts
CommentOur current shipping and offshore portfolio consists of 17 projects and 21 vessels. The average, estimated annual internal rate of return (IRR) is abt. 27% which is abt. 8% higher than upon syndication. About 50% of the fleet is within offshore. This segment increased in 2011 as three out of four new vessels are offshore related. RoRo/ Liner, which also includes car carriers, is the largest segment when project value is the measure. Bareboat projects are not as dominating as one may expect as many believe project financing equals sale-leaseback. Barely 50% are bareboat while the remainder is a mix of timecharter, spot and new buildings. The latter is a new project in 2011 and will eventually end up as spot or TC.
8www.fearnleys.no shipping report 2012
ConCLuded projeCts
segmentProject value upon syndication (UsD)
average Irr p.a.
No. of projects
No. vessels sold
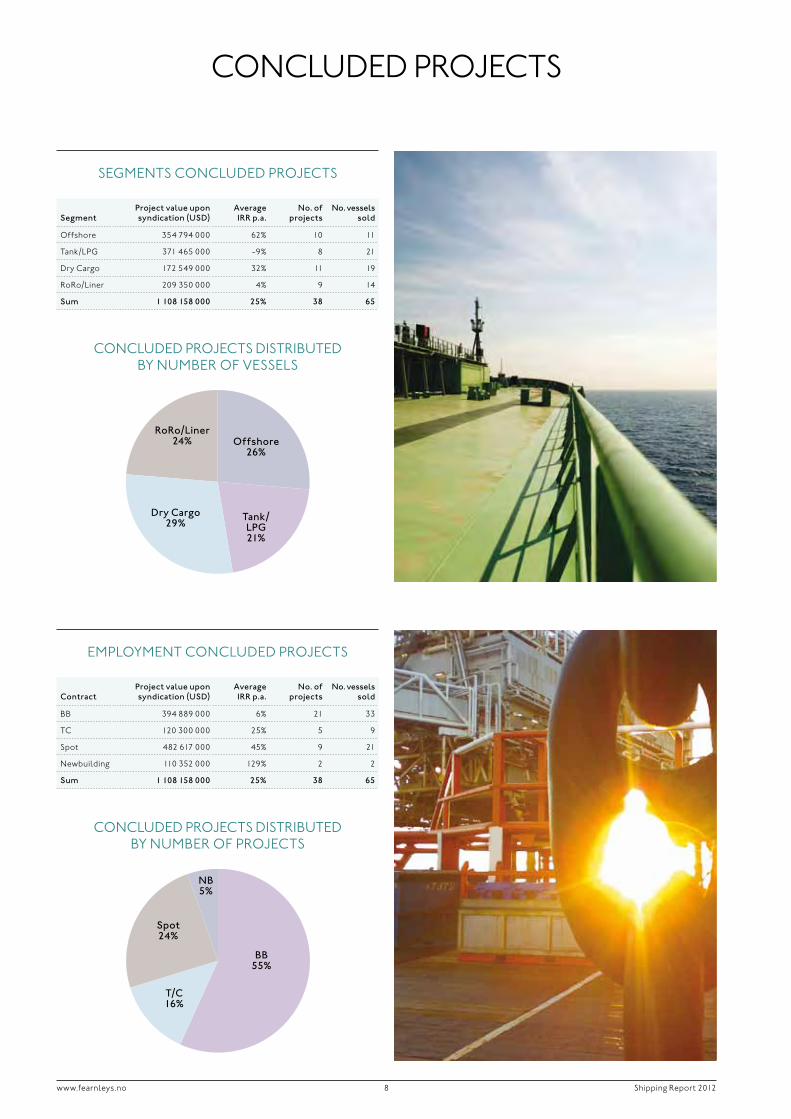
offshore 354 794 000 62% 10 11
tank/Lpg 371 465 000 -9% 8 21
dry Cargo 172 549 000 32% 11 19
roro/Liner 209 350 000 4% 9 14
sum 1 108 158 000 25% 38 65
contractProject value upon syndication (UsD)
average Irr p.a.
No. of projects
No. vessels sold
bb 394 889 000 6% 21 33
tC 120 300 000 25% 5 9
spot 482 617 000 45% 9 21
newbuilding 110 352 000 129% 2 2
sum 1 108 158 000 25% 38 65
BB55%
NB5%
T/C16%
Spot24%
ConCLuded projeCts distributed by number of VesseLs
segments ConCLuded projeCts
ConCLuded projeCts distributed by number of projeCts
empLoyment ConCLuded projeCts
Offshore26%
Tank/LPG21%
Dry Cargo29%
RoRo/Liner24%
9www.fearnleys.no shipping report 2012
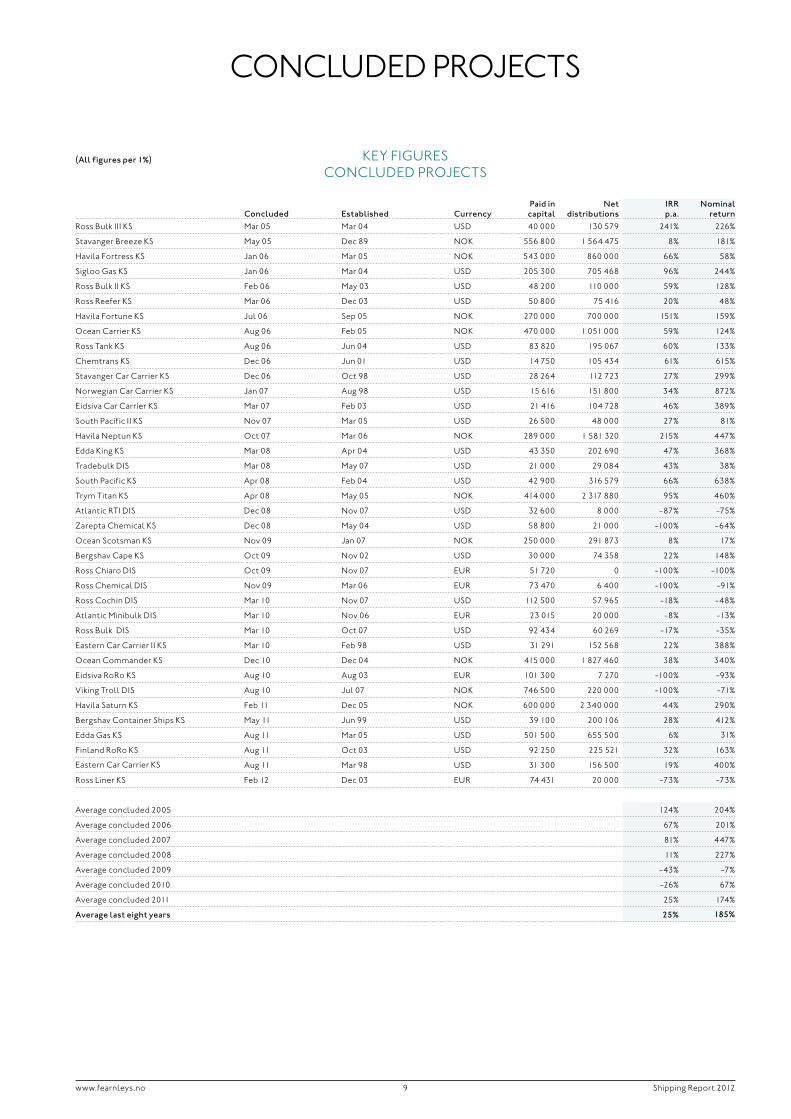
ConCLuded projeCts
key figures ConCLuded projeCts
concluded
established
currency
Paid in capital
Net distributions
Irr p.a.
Nominal return
ross bulk iii ks mar 05 mar 04 usd 40 000 130 579 241% 226%
stavanger breeze ks may 05 dec 89 nok 556 800 1 564 475 8% 181%
havila fortress ks jan 06 mar 05 nok 543 000 860 000 66% 58%
sigloo gas ks jan 06 mar 04 usd 205 300 705 468 96% 244%
ross bulk ii ks feb 06 may 03 usd 48 200 110 000 59% 128%
ross reefer ks mar 06 dec 03 usd 50 800 75 416 20% 48%
havila fortune ks jul 06 sep 05 nok 270 000 700 000 151% 159%
ocean Carrier ks Aug 06 feb 05 nok 470 000 1 051 000 59% 124%
ross tank ks Aug 06 jun 04 usd 83 820 195 067 60% 133%
Chemtrans ks dec 06 jun 01 usd 14 750 105 434 61% 615%
stavanger Car Carrier ks dec 06 oct 98 usd 28 264 112 723 27% 299%
norwegian Car Carrier ks jan 07 Aug 98 usd 15 616 151 800 34% 872%
eidsiva Car Carrier ks mar 07 feb 03 usd 21 416 104 728 46% 389%
south pacific ii ks nov 07 mar 05 usd 26 500 48 000 27% 81%
havila neptun ks oct 07 mar 06 nok 289 000 1 581 320 215% 447%
edda king ks mar 08 Apr 04 usd 43 350 202 690 47% 368%
tradebulk dis mar 08 may 07 usd 21 000 29 084 43% 38%
south pacific ks Apr 08 feb 04 usd 42 900 316 579 66% 638%
trym titan ks Apr 08 may 05 nok 414 000 2 317 880 95% 460%
Atlantic rti dis dec 08 nov 07 usd 32 600 8 000 -87% -75%
Zarepta Chemical ks dec 08 may 04 usd 58 800 21 000 -100% -64%
ocean scotsman ks nov 09 jan 07 nok 250 000 291 873 8% 17%
bergshav Cape ks oct 09 nov 02 usd 30 000 74 358 22% 148%
ross Chiaro dis oct 09 nov 07 eur 51 720 0 -100% -100%
ross Chemical dis nov 09 mar 06 eur 73 470 6 400 -100% -91%
ross Cochin dis mar 10 nov 07 usd 112 500 57 965 -18% -48%
Atlantic minibulk dis mar 10 nov 06 eur 23 015 20 000 -8% -13%
ross bulk dis mar 10 oct 07 usd 92 434 60 269 -17% -35%
eastern Car Carrier ii ks mar 10 feb 98 usd 31 291 152 568 22% 388%
ocean Commander ks dec 10 dec 04 nok 415 000 1 827 460 38% 340%
eidsiva roro ks Aug 10 Aug 03 eur 101 300 7 270 -100% -93%
Viking troll dis Aug 10 jul 07 nok 746 500 220 000 -100% -71%
havila saturn ks feb 11 dec 05 nok 600 000 2 340 000 44% 290%
bergshav Container ships ks may 11 jun 99 usd 39 100 200 106 28% 412%
edda gas ks Aug 11 mar 05 usd 501 500 655 500 6% 31%
finland roro ks Aug 11 oct 03 usd 92 250 225 521 32% 163%
eastern Car Carrier ks Aug 11 mar 98 usd 31 300 156 500 19% 400%
ross Liner ks feb 12 dec 03 eur 74 431 20 000 -73% -73%
Average concluded 2005 124% 204%
Average concluded 2006 67% 201%
Average concluded 2007 81% 447%
Average concluded 2008 11% 227%
Average concluded 2009 -43% -7%
Average concluded 2010 -26% 67%
Average concluded 2011 25% 174%
average last eight years 25% 185%
(all figures per 1%)
10www.fearnleys.no shipping report 2012
mArket report tAnkers
Looking back at 2011 it is hard to find much positive to say about the tanker market; in particular for the crude tanker market. Earnings in the spot market remained far below required rates and it was only during the fourth quarter we saw earnings for any of the size segments yielding a return that could contribute to a positive cash flow from operations.
Having said this, earnings were slightly better than our spot indicator indicates, as the fleet in general operates at economical speed and consumption reducing voyage related costs. Still, 2011 was an extremely challenging year for crude tanker owners.
During the year we saw asset values continuing to decline. Modern tonnage values fell by 10%-30%. However, we saw mid-aged tankers falling by even more. 10 year old VLCC values fell by more than 40% whereas same age Suezmax and Aframax tankers fell by 20% and 12%, respectively. The difficult market conditions in combination with a strong fleet growth contributed to this de- cline. One should also keep in mind that financing of acquisitions became increasingly difficult throughout the year.
At the beginning of 2012 the outlook for crude oil tankers has not improved. We will see record deliveries of Suezmax tankers this year and continued strong growth in the VLCC fleet. The only positive supply signal in the crude tanker segment is that the Aframax fleet is set to grow moderately. The order book in this segment is quite small and contracting of new tonnage is absent.
With a continued contraction of US oil imports from the Middle East we cannot see that an upturn in freight markets is imminent. We therefore expect a continuation of the poor freight market and continued pressure on values this year.
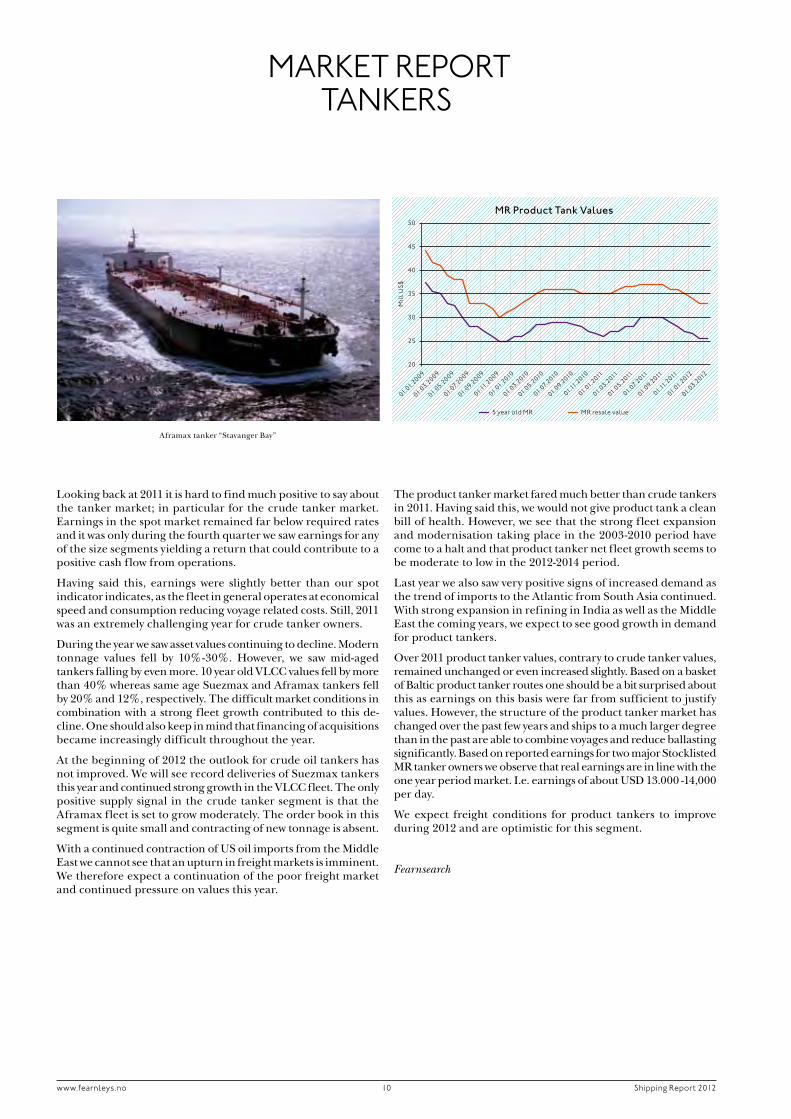
The product tanker market fared much better than crude tankers in 2011. Having said this, we would not give product tank a clean bill of health. However, we see that the strong fleet expansion and modernisation taking place in the 2003-2010 period have come to a halt and that product tanker net fleet growth seems to be moderate to low in the 2012-2014 period.
Last year we also saw very positive signs of increased demand as the trend of imports to the Atlantic from South Asia continued. With strong expansion in refining in India as well as the Middle East the coming years, we expect to see good growth in demand for product tankers.
Over 2011 product tanker values, contrary to crude tanker values, remained unchanged or even increased slightly. Based on a basket of Baltic product tanker routes one should be a bit surprised about this as earnings on this basis were far from sufficient to justify values. However, the structure of the product tanker market has changed over the past few years and ships to a much larger degree than in the past are able to combine voyages and reduce ballasting significantly. Based on reported earnings for two major Stocklisted MR tanker owners we observe that real earnings are in line with the one year period market. I.e. earnings of about USD 13.000 -14,000 per day.
We expect freight conditions for product tankers to improve during 2012 and are optimistic for this segment.
Fearnsearch
MR Product Tank Values
01.01.2009
50
45
40
35
30
25
20
01.03.2009
01.05.2009
01.07.2009
01.09.2009
01.11.2009
01.01.2010
01.03.2010
01.05.2010
01.07.2010
01.09.2010
01.11.2010
01.01.2011
01.03.2011
01.05.2011
01.07.2011
01.09.2011
01.11.2011
01.01.2012
01.03.2012
5 year old MR MR resale value
Mil
l US$
Aframax tanker “Stavanger Bay”
11www.fearnleys.no shipping report 2012
Mil
l US$
Supramax Values
01.01.2009
38
36
34
32
30
28
26
24
22
20
01.03.2009
01.05.2009
01.07.2009
01.09.2009
01.11.2009
01.01.2010
01.03.2010
01.05.2010
01.07.2010
01.09.2010
01.11.2010
01.01.2011
01.03.2011
01.05.2011
01.07.2011
01.09.2011
01.11.2011
01.01.2012
01.03.2012
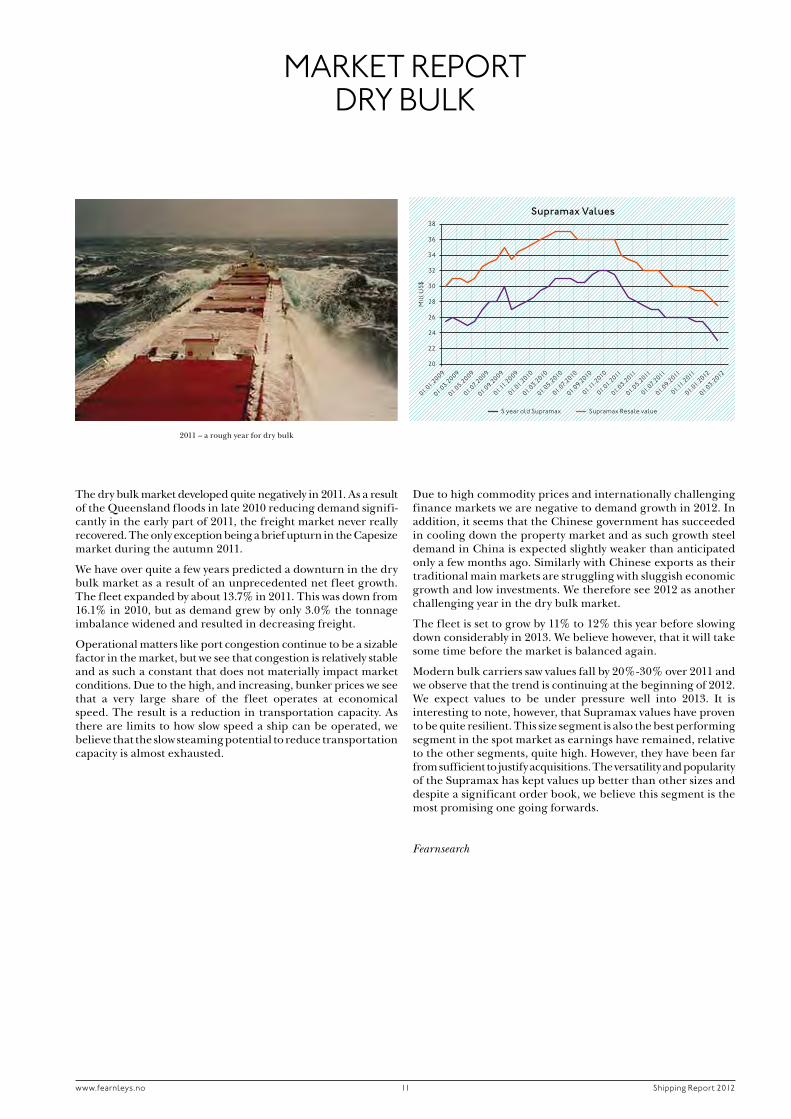
5 year old Supramax Supramax Resale value
mArket report dry buLk
The dry bulk market developed quite negatively in 2011. As a result of the Queensland floods in late 2010 reducing demand signifi- cantly in the early part of 2011, the freight market never really recovered. The only exception being a brief upturn in the Capesize market during the autumn 2011.
We have over quite a few years predicted a downturn in the dry bulk market as a result of an unprecedented net fleet growth. The fleet expanded by about 13.7% in 2011. This was down from 16.1% in 2010, but as demand grew by only 3.0% the tonnage imbalance widened and resulted in decreasing freight.
Operational matters like port congestion continue to be a sizable factor in the market, but we see that congestion is relatively stable and as such a constant that does not materially impact market conditions. Due to the high, and increasing, bunker prices we see that a very large share of the fleet operates at economical speed. The result is a reduction in transportation capacity. As there are limits to how slow speed a ship can be operated, we believe that the slow steaming potential to reduce transportation capacity is almost exhausted.
Due to high commodity prices and internationally challenging finance markets we are negative to demand growth in 2012. In addition, it seems that the Chinese government has succeeded in cooling down the property market and as such growth steel demand in China is expected slightly weaker than anticipated only a few months ago. Similarly with Chinese exports as their traditional main markets are struggling with sluggish economic growth and low investments. We therefore see 2012 as another challenging year in the dry bulk market.
The fleet is set to grow by 11% to 12% this year before slowing down considerably in 2013. We believe however, that it will take some time before the market is balanced again.
Modern bulk carriers saw values fall by 20%-30% over 2011 and we observe that the trend is continuing at the beginning of 2012. We expect values to be under pressure well into 2013. It is interesting to note, however, that Supramax values have proven to be quite resilient. This size segment is also the best performing segment in the spot market as earnings have remained, relative to the other segments, quite high. However, they have been far from sufficient to justify acquisitions. The versatility and popularity of the Supramax has kept values up better than other sizes and despite a significant order book, we believe this segment is the most promising one going forwards.
Fearnsearch
2011 – a rough year for dry bulk
12www.fearnleys.no shipping report 2012
mArket report offshore
new boom-period AheAd?The optimism that was recorded during 2011 was mostly based on hopes for 2012 and beyond, since all indications suggest that our industry has a new boom-period ahead. The positive sentiment is supported by the many drilling rigs entering the market and the increased announced Exploration & Production spending from the large Oil and Gas companies. The subsea activity will play an important role in the oil and gas development and production in the coming years. The demand for subsea construction tonnage will be strong, and we also believe that the market will absorb supply tonnage equipped with cranes and ROVs, and hence nourish a healthy utilization level for AHTS and PSVs.
PSV is about to replace AHTS in the role of dominating the offshore orderbook. The last couple of years have seen a fairly large influx of AHTS vessels originating from the contract boom in the years before the financial crisis, and the trend continued into 2011 with almost 200 vessels leaving the yards. Fortunately for Owners in this segment, we are now at the end of the AHTS delivery wave, and the orderbook for the coming years is more modest. The situation is different for PSVs. More than 100 new orders were placed in 2011, adding on to an already bulging orderbook. We will experience two to three years with a rapid growing fleet of PSVs, especially large PSVs of more than 4,500 dwt.
The Newbuild price has been at a downward slide since the peak in 2008 and with the current gloomy marked for conventional shipping, more shipyards are entering the competition for building offshore tonnage. The development of the value of the existing fleet has been twofold. We see that the older fleet has decreased in value, while modern tonnage has clearly maintained value, and we believe this trend will continue also in 2012.
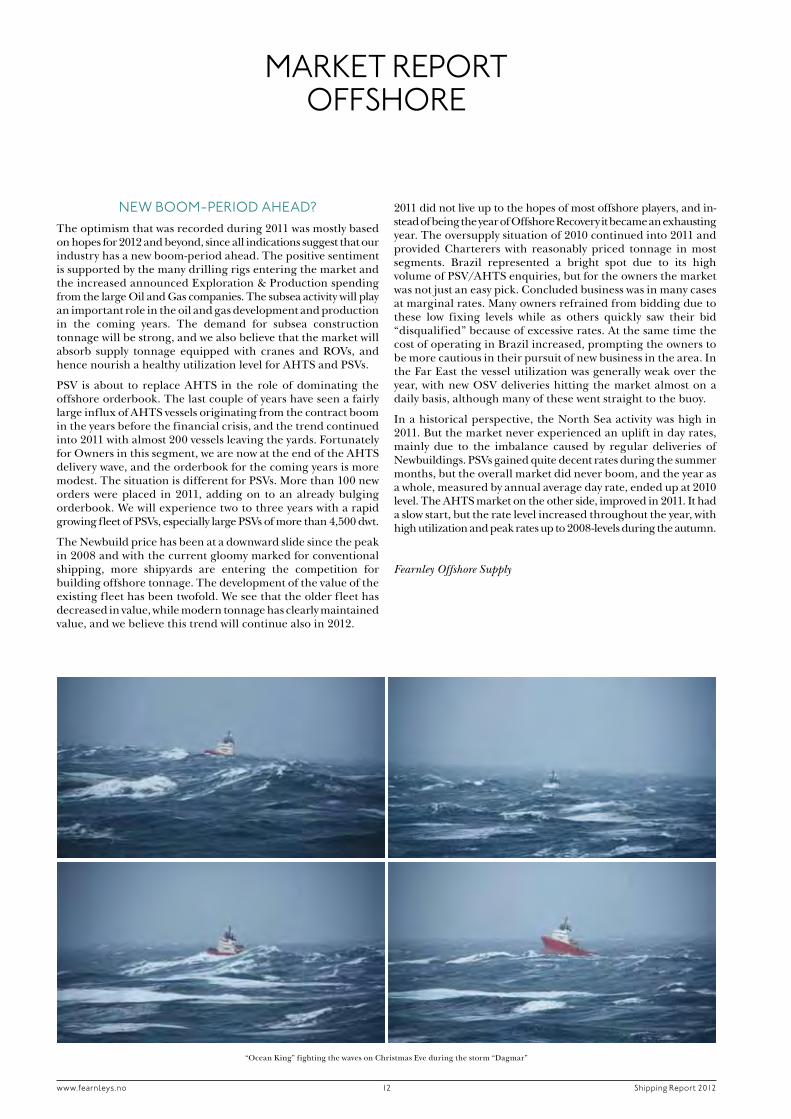
2011 did not live up to the hopes of most offshore players, and in- stead of being the year of Offshore Recovery it became an exhausting year. The oversupply situation of 2010 continued into 2011 and provided Charterers with reasonably priced tonnage in most segments. Brazil represented a bright spot due to its high volume of PSV/AHTS enquiries, but for the owners the market was not just an easy pick. Concluded business was in many cases at marginal rates. Many owners refrained from bidding due to these low fixing levels while as others quickly saw their bid “disqualified” because of excessive rates. At the same time the cost of operating in Brazil increased, prompting the owners to be more cautious in their pursuit of new business in the area. In the Far East the vessel utilization was generally weak over the year, with new OSV deliveries hitting the market almost on a daily basis, although many of these went straight to the buoy.
In a historical perspective, the North Sea activity was high in 2011. But the market never experienced an uplift in day rates, mainly due to the imbalance caused by regular deliveries of Newbuildings. PSVs gained quite decent rates during the summer months, but the overall market did never boom, and the year as a whole, measured by annual average day rate, ended up at 2010 level. The AHTS market on the other side, improved in 2011. It had a slow start, but the rate level increased throughout the year, with high utilization and peak rates up to 2008-levels during the autumn.
Fearnley Offshore Supply
“Ocean King” fighting the waves on Christmas Eve during the storm “Dagmar”
the projeCts 2012
14fearnleys.no shipping report 2012
key figuresCompany established march 2006Vessel’s purchase price usd 25 000 000paid in capital usd 4 406 000uncalled capital nok 30 000 000Accumulated distributions usd 4 750 000estimated irr p.a. upon syndication 20%estimated irr p.a. actual 23%
off
sh
or
e
CAsh fLow (usd)2011a 2012e 2013e
operating revenue 3 173 675 3 182 370 3 173 675overhead expenses -121 265 -110 000 -112 200Net operating cash flow 3 052 410 3 072 370 3 061 475interest earned 5 056 - -interest cost -444 122 -397 170 -386 354repayment long term debt -1 400 000 -1 400 000 -1 400 000repayment seller’s Credit - - -Net financial items -1 839 066 -1 797 170 -1 786 354distributions -800 000 -1 800 000 -1 300 000sale of vessel - - -Net project cash flow 413 344 -524 800 -24 879
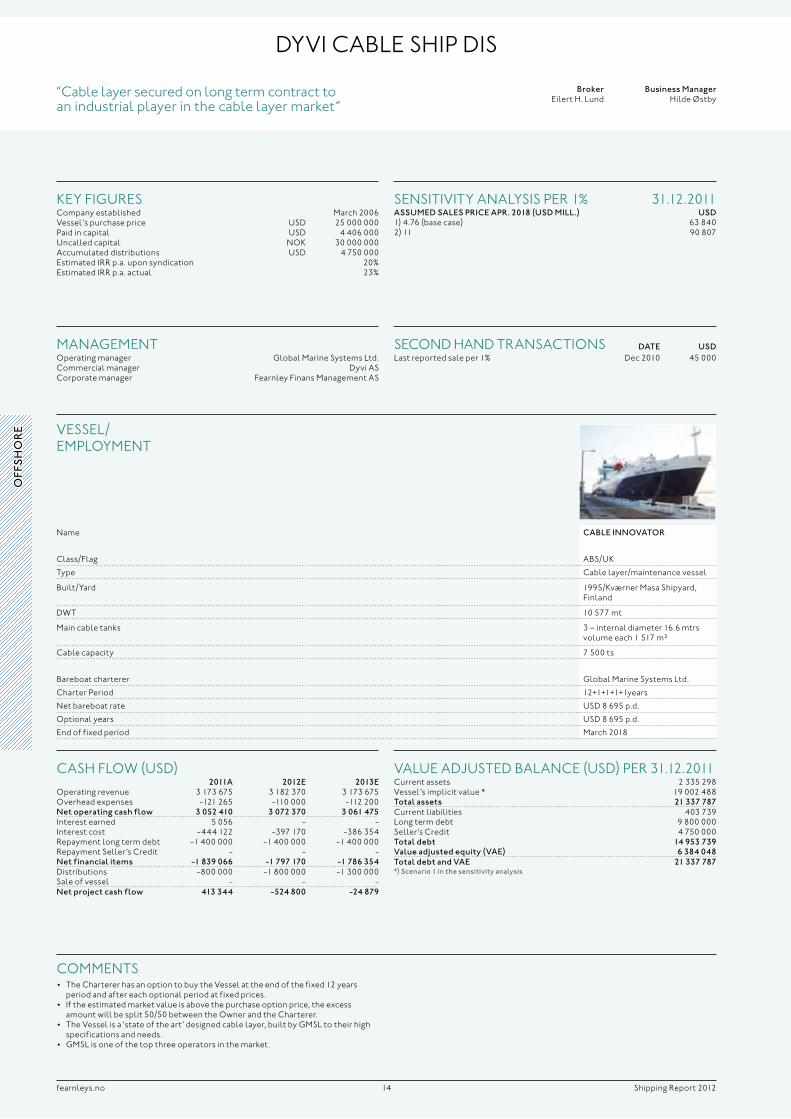
name caBle INNovaTor
Class/flag Abs/uk
type Cable layer/maintenance vessel
built/yard 1995/kværner masa shipyard, finland
dwt 10 577 mt
main cable tanks 3 – internal diameter 16.6 mtrs volume each 1 517 m³
Cable capacity 7 500 ts
bareboat charterer global marine systems Ltd.
Charter period 12+1+1+1+1years
net bareboat rate usd 8 695 p.d.
optional years usd 8 695 p.d.
end of fixed period march 2018
VesseL/ empLoyment
dyVi CAbLe ship dis
“Cable layer secured on long term contract to an industrial player in the cable layer market”
Broker eilert h. Lund
Business manager hilde Østby
VALue Adjusted bALAnCe (usd) per 31.12.2011Current assets 2 335 298Vessel’s implicit value * 19 002 488Total assets 21 337 787Current liabilities 403 739Long term debt 9 800 000seller’s Credit 4 750 000Total debt 14 953 739value adjusted equity (vae) 6 384 048Total debt and vae 21 337 787*) scenario 1 in the sensitivity analysis
seCond hAnd trAnsACtions DaTe UsDLast reported sale per 1% dec 2010 45 000
mAnAgementoperating manager global marine systems Ltd.Commercial manager dyvi AsCorporate manager fearnley finans management As
sensitiVity AnALysis per 1% 31.12.2011assUmeD sales PrIce aPr. 2018 (UsD mIll.) UsD1) 4.76 (base case) 63 8402) 11 90 807
Comments• TheChartererhasanoptiontobuytheVesselattheendofthefixed12years
period and after each optional period at fixed prices.• Iftheestimatedmarketvalueisabovethepurchaseoptionprice,theexcess
amount will be split 50/50 between the owner and the Charterer.• TheVesselisa‘stateoftheart’designedcablelayer,builtbyGMSLtotheirhigh
specifications and needs.• GMSLisoneofthetopthreeoperatorsinthemarket.
15fearnleys.no shipping report 2012
greenbArge dis
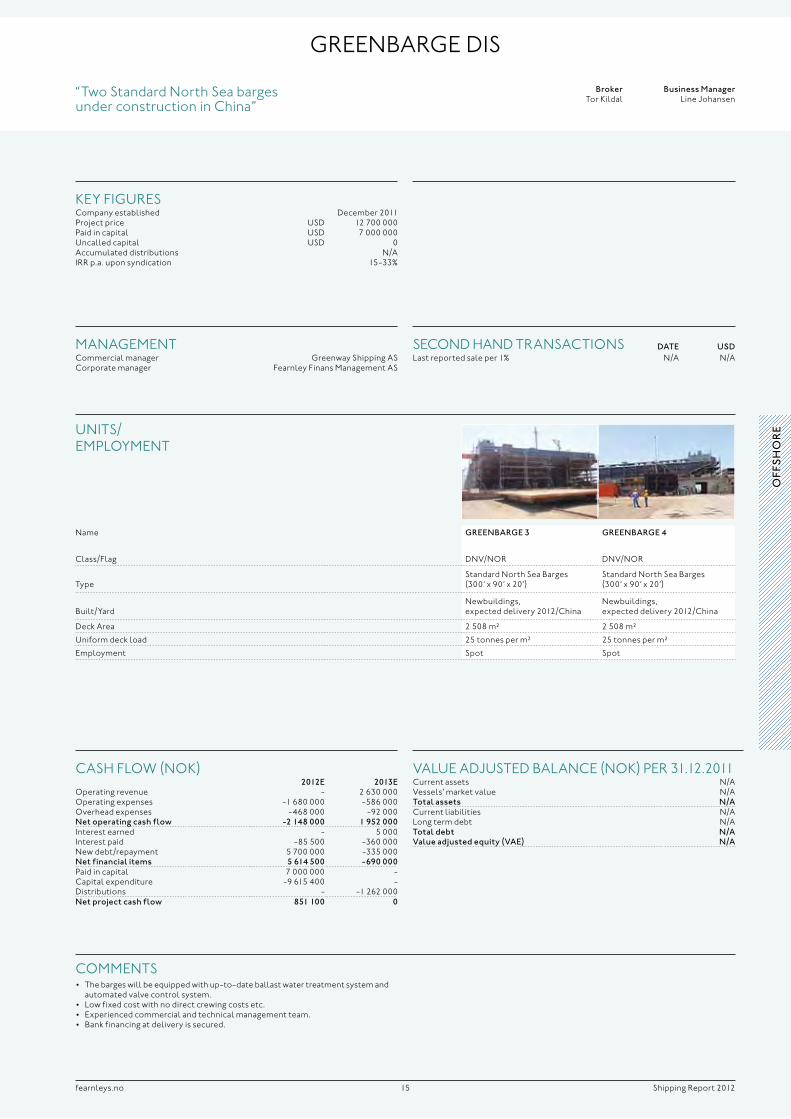
name greeNBarge 3 greeNBarge 4
Class/flag dnV/nor dnV/nor
typestandard north sea barges (300’ x 90’ x 20’)
standard north sea barges (300’ x 90’ x 20’)
built/yardnewbuildings, expected delivery 2012/China
newbuildings, expected delivery 2012/China
deck Area 2 508 m² 2 508 m²
uniform deck load 25 tonnes per m² 25 tonnes per m²
employment spot spot
units/ empLoyment
“two standard north sea barges under construction in China”
key figuresCompany established december 2011project price usd 12 700 000paid in capital usd 7 000 000uncalled capital usd 0Accumulated distributions n/Airr p.a. upon syndication 15-33%
VALue Adjusted bALAnCe (nok) per 31.12.2011Current assets n/AVessels’ market value n/ATotal assets N/aCurrent liabilities n/ALong term debt n/ATotal debt N/avalue adjusted equity (vae) N/a
seCond hAnd trAnsACtions DaTe UsDLast reported sale per 1% n/A n/A
mAnAgementCommercial manager greenway shipping AsCorporate manager fearnley finans management As
Comments• Thebargeswillbeequippedwithup-to-dateballastwatertreatmentsystemand
automated valve control system.• Lowfixedcostwithnodirectcrewingcostsetc.• Experiencedcommercialandtechnicalmanagementteam.• Bankfinancingatdeliveryissecured.
Broker tor kildal
Business manager Line johansen
off
sh
or
eCAsh fLow (nok)
2012e 2013eoperating revenue - 2 630 000operating expenses -1 680 000 -586 000overhead expenses -468 000 -92 000Net operating cash flow -2 148 000 1 952 000interest earned - 5 000interest paid -85 500 -360 000new debt/repayment 5 700 000 -335 000Net financial items 5 614 500 -690 000paid in capital 7 000 000 -Capital expenditure -9 615 400 -distributions - -1 262 000Net project cash flow 851 100 0
16fearnleys.no shipping report 2012
oCeAn LAnhoy ks
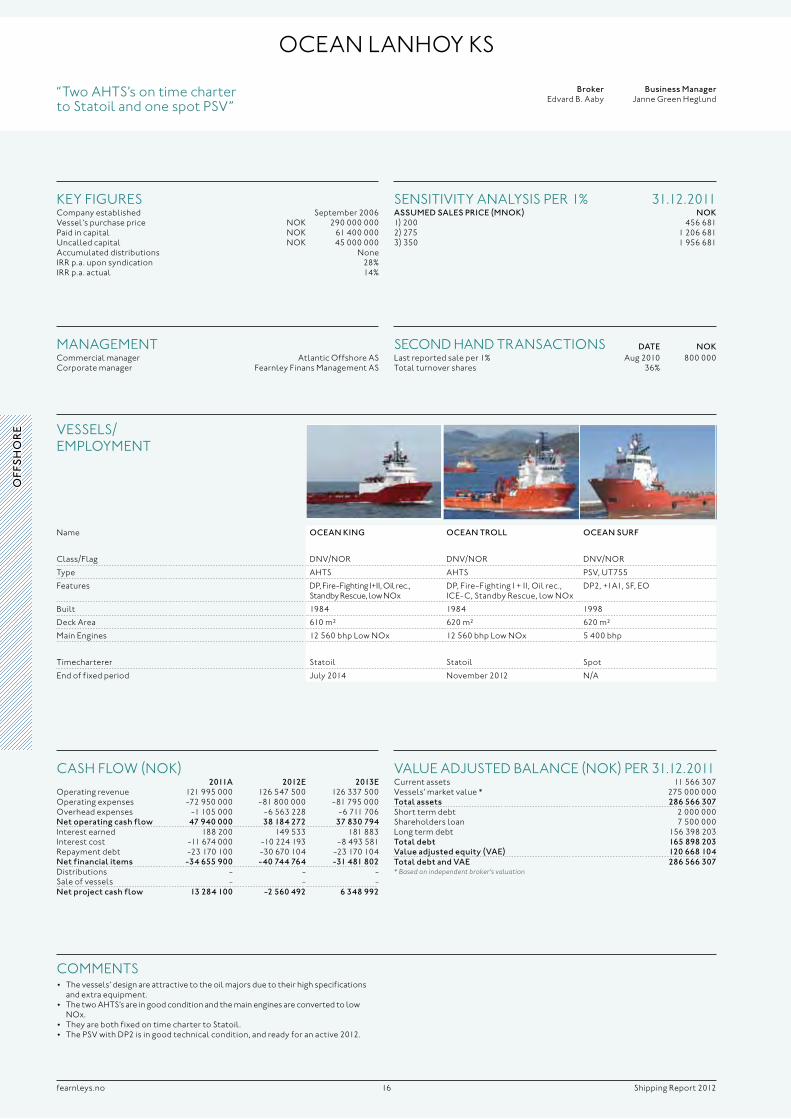
name oceaN kINg oceaN Troll oceaN sUrf
Class/flag dnV/nor dnV/nor dnV/nor
type Ahts Ahts psV, ut755
features dp, fire-fighting i+ii, oil rec., standby rescue, low nox
dp, fire-fighting i + ii, oil rec., iCe-C, standby rescue, low nox
dp2, +1A1, sf, eo
built 1984 1984 1998
deck Area 610 m² 620 m² 620 m²
main engines 12 560 bhp Low nox 12 560 bhp Low nox 5 400 bhp
timecharterer statoil statoil spot
end of fixed period july 2014 november 2012 n/A
VesseLs/ empLoyment
“two Ahts’s on time charter to statoil and one spot psV”
key figuresCompany established september 2006Vessel’s purchase price nok 290 000 000paid in capital nok 61 400 000uncalled capital nok 45 000 000Accumulated distributions noneirr p.a. upon syndication 28%irr p.a. actual 14%
VALue Adjusted bALAnCe (nok) per 31.12.2011Current assets 11 566 307Vessels’ market value * 275 000 000Total assets 286 566 307short term debt 2 000 000shareholders loan 7 500 000Long term debt 156 398 203Total debt 165 898 203value adjusted equity (vae) 120 668 104Total debt and vae 286 566 307* Based on independent broker’s valuation
seCond hAnd trAnsACtions DaTe NokLast reported sale per 1% Aug 2010 800 000total turnover shares 36%
mAnAgementCommercial manager Atlantic offshore AsCorporate manager fearnley finans management As
sensitiVity AnALysis per 1% 31.12.2011assUmeD sales PrIce (mNok) Nok1) 200 456 6812) 275 1 206 6813) 350 1 956 681
Comments• Thevessels’designareattractivetotheoilmajorsduetotheirhighspecifications
and extra equipment.• ThetwoAHTS’sareingoodconditionandthemainenginesareconvertedtolow
nox.• TheyarebothfixedontimechartertoStatoil.• ThePSVwithDP2isingoodtechnicalcondition,andreadyforanactive2012.
Broker edvard b. Aaby
Business manager janne green heglund
CAsh fLow (nok)2011a 2012e 2013e
operating revenue 121 995 000 126 547 500 126 337 500operating expenses -72 950 000 -81 800 000 -81 795 000overhead expenses -1 105 000 -6 563 228 -6 711 706Net operating cash flow 47 940 000 38 184 272 37 830 794interest earned 188 200 149 533 181 883interest cost -11 674 000 -10 224 193 -8 493 581repayment debt -23 170 100 -30 670 104 -23 170 104Net financial items -34 655 900 -40 744 764 -31 481 802distributions - - -sale of vessels - - -Net project cash flow 13 284 100 -2 560 492 6 348 992
off
sh
or
e
17fearnleys.no shipping report 2012
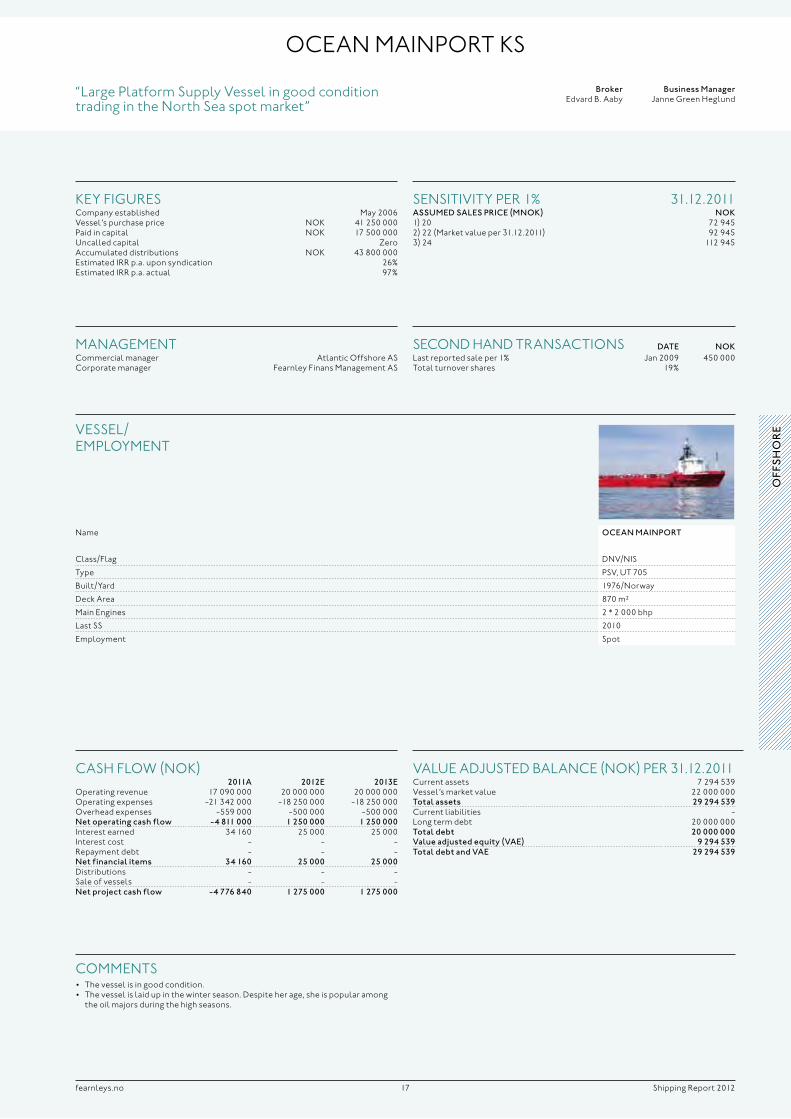
“Large platform supply Vessel in good condition trading in the north sea spot market”
oCeAn mAinport ks
name oceaN maINPorT
Class/flag dnV/nis
type psV, ut 705
built/yard 1976/norway
deck Area 870 m²
main engines 2 * 2 000 bhp
Last ss 2010
employment spot
VesseL/ empLoyment
Broker edvard b. Aaby
Business manager janne green heglund
key figuresCompany established may 2006Vessel’s purchase price nok 41 250 000paid in capital nok 17 500 000uncalled capital ZeroAccumulated distributions nok 43 800 000estimated irr p.a. upon syndication 26%estimated irr p.a. actual 97%
VALue Adjusted bALAnCe (nok) per 31.12.2011Current assets 7 294 539Vessel’s market value 22 000 000Total assets 29 294 539Current liabilities -Long term debt 20 000 000Total debt 20 000 000value adjusted equity (vae) 9 294 539Total debt and vae 29 294 539
seCond hAnd trAnsACtions DaTe NokLast reported sale per 1% jan 2009 450 000total turnover shares 19%
mAnAgementCommercial manager Atlantic offshore AsCorporate manager fearnley finans management As
sensitiVity per 1% 31.12.2011assUmeD sales PrIce (mNok) Nok1) 20 72 9452) 22 (market value per 31.12.2011) 92 9453) 24 112 945
Comments• Thevesselisingoodcondition.• Thevesselislaidupinthewinterseason.Despiteherage,sheispopularamong
the oil majors during the high seasons.
CAsh fLow (nok)2011a 2012e 2013e
operating revenue 17 090 000 20 000 000 20 000 000operating expenses -21 342 000 -18 250 000 -18 250 000overhead expenses -559 000 -500 000 -500 000Net operating cash flow -4 811 000 1 250 000 1 250 000interest earned 34 160 25 000 25 000interest cost - - -repayment debt - - -Net financial items 34 160 25 000 25 000distributions - - -sale of vessels - - -Net project cash flow -4 776 840 1 275 000 1 275 000
off
sh
or
e
18fearnleys.no shipping report 2012
oCeAn ness dis
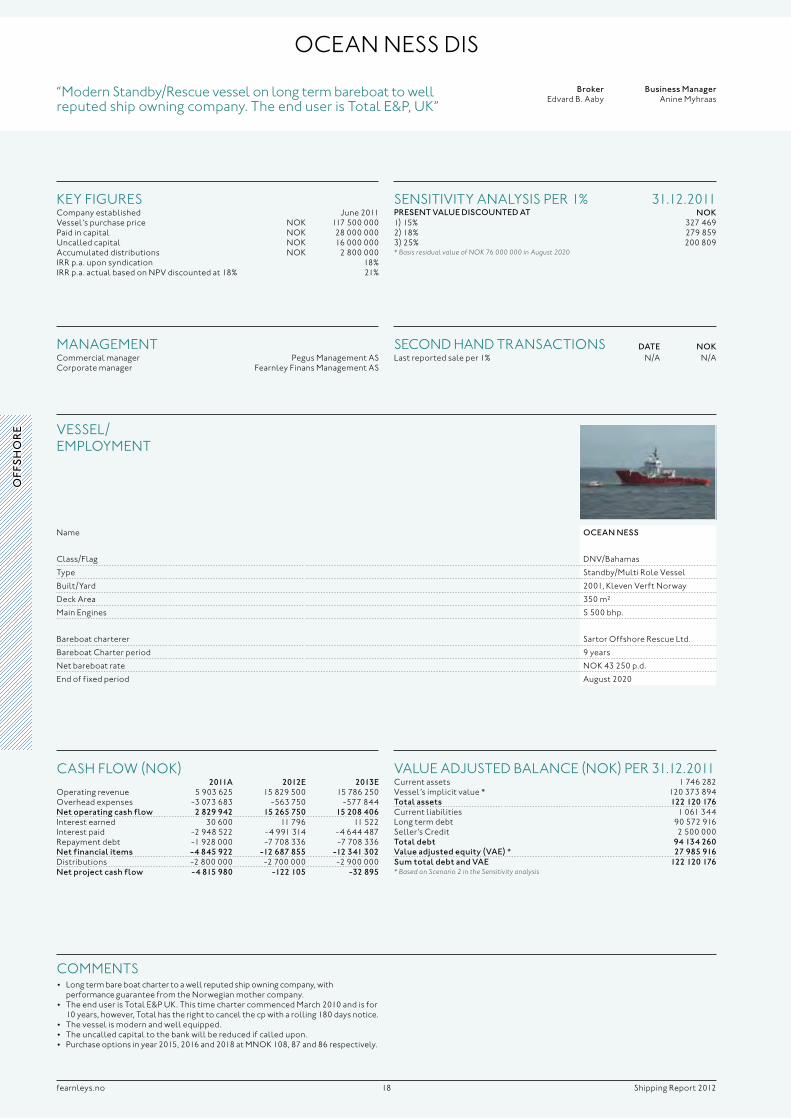
“modern standby/rescue vessel on long term bareboat to well reputed ship owning company. the end user is total e&p, uk”
name oceaN Ness
Class/flag dnV/bahamas
type standby/multi role Vessel
built/yard 2001, kleven Verft norway
deck Area 350 m²
main engines 5 500 bhp.
bareboat charterer sartor offshore rescue Ltd.
bareboat Charter period 9 years
net bareboat rate nok 43 250 p.d.
end of fixed period August 2020
VesseL/ empLoyment
Broker edvard b. Aaby
Business manager Anine myhraas
key figuresCompany established june 2011Vessel’s purchase price nok 117 500 000paid in capital nok 28 000 000uncalled capital nok 16 000 000Accumulated distributions nok 2 800 000irr p.a. upon syndication 18%irr p.a. actual based on npV discounted at 18% 21%
VALue Adjusted bALAnCe (nok) per 31.12.2011Current assets 1 746 282Vessel’s implicit value * 120 373 894Total assets 122 120 176Current liabilities 1 061 344Long term debt 90 572 916seller’s Credit 2 500 000Total debt 94 134 260value adjusted equity (vae) * 27 985 916sum total debt and vae 122 120 176* Based on Scenario 2 in the Sensitivity analysis
seCond hAnd trAnsACtions DaTe NokLast reported sale per 1% n/A n/A
mAnAgementCommercial manager pegus management AsCorporate manager fearnley finans management As
sensitiVity AnALysis per 1% 31.12.2011PreseNT valUe DIscoUNTeD aT Nok1) 15% 327 4692) 18% 279 8593) 25% 200 809* Basis residual value of NOK 76 000 000 in August 2020
Comments• Longtermbareboatchartertoawellreputedshipowningcompany,with
performance guarantee from the norwegian mother company.• TheenduserisTotalE&PUK.ThistimechartercommencedMarch2010andisfor
10 years, however, total has the right to cancel the cp with a rolling 180 days notice.• Thevesselismodernandwellequipped.• Theuncalledcapitaltothebankwillbereducedifcalledupon.• Purchaseoptionsinyear2015,2016and2018atMNOK108,87and86respectively.
CAsh fLow (nok)2011a 2012e 2013e
operating revenue 5 903 625 15 829 500 15 786 250overhead expenses -3 073 683 -563 750 -577 844Net operating cash flow 2 829 942 15 265 750 15 208 406interest earned 30 600 11 796 11 522interest paid -2 948 522 -4 991 314 -4 644 487repayment debt -1 928 000 -7 708 336 -7 708 336Net financial items -4 845 922 -12 687 855 -12 341 302distributions -2 800 000 -2 700 000 -2 900 000Net project cash flow -4 815 980 -122 105 -32 895
off
sh
or
e
19fearnleys.no shipping report 2012
oCeAn resCue ks
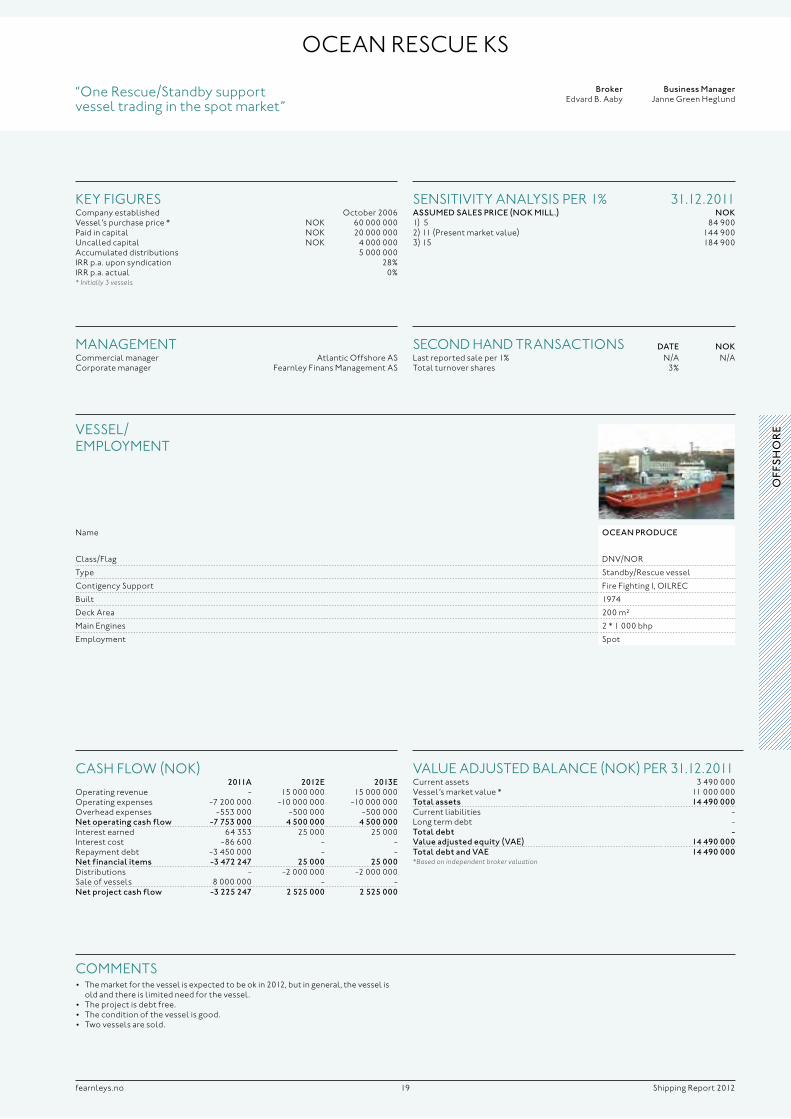
“one rescue/standby support vessel trading in the spot market”
name oceaN ProDUce
Class/flag dnV/nor
type standby/rescue vessel
Contigency support fire fighting i, oiLreC
built 1974
deck Area 200 m²
main engines 2 * 1 000 bhp
employment spot
VesseL/ empLoyment
Broker edvard b. Aaby
Business manager janne green heglund
key figuresCompany established october 2006Vessel’s purchase price * nok 60 000 000paid in capital nok 20 000 000uncalled capital nok 4 000 000Accumulated distributions 5 000 000irr p.a. upon syndication 28%irr p.a. actual 0%* Initially 3 vessels
VALue Adjusted bALAnCe (nok) per 31.12.2011Current assets 3 490 000Vessel’s market value * 11 000 000Total assets 14 490 000Current liabilities -Long term debt -Total debt -value adjusted equity (vae) 14 490 000Total debt and vae 14 490 000*Based on independent broker valuation
seCond hAnd trAnsACtions DaTe NokLast reported sale per 1% n/A n/Atotal turnover shares 3%
mAnAgementCommercial manager Atlantic offshore AsCorporate manager fearnley finans management As
sensitiVity AnALysis per 1% 31.12.2011assUmeD sales PrIce (Nok mIll.) Nok1) 5 84 9002) 11 (present market value) 144 9003) 15 184 900
Comments• Themarketforthevesselisexpectedtobeokin2012,butingeneral,thevesselis
old and there is limited need for the vessel.• Theprojectisdebtfree.• Theconditionofthevesselisgood.• Twovesselsaresold.
CAsh fLow (nok)2011a 2012e 2013e
operating revenue - 15 000 000 15 000 000operating expenses -7 200 000 -10 000 000 -10 000 000overhead expenses -553 000 -500 000 -500 000Net operating cash flow -7 753 000 4 500 000 4 500 000interest earned 64 353 25 000 25 000interest cost -86 600 - -repayment debt -3 450 000 - -Net financial items -3 472 247 25 000 25 000distributions - -2 000 000 -2 000 000sale of vessels 8 000 000 - -Net project cash flow -3 225 247 2 525 000 2 525 000
off
sh
or
e
20fearnleys.no shipping report 2012
seACor suppLyships 1 ks
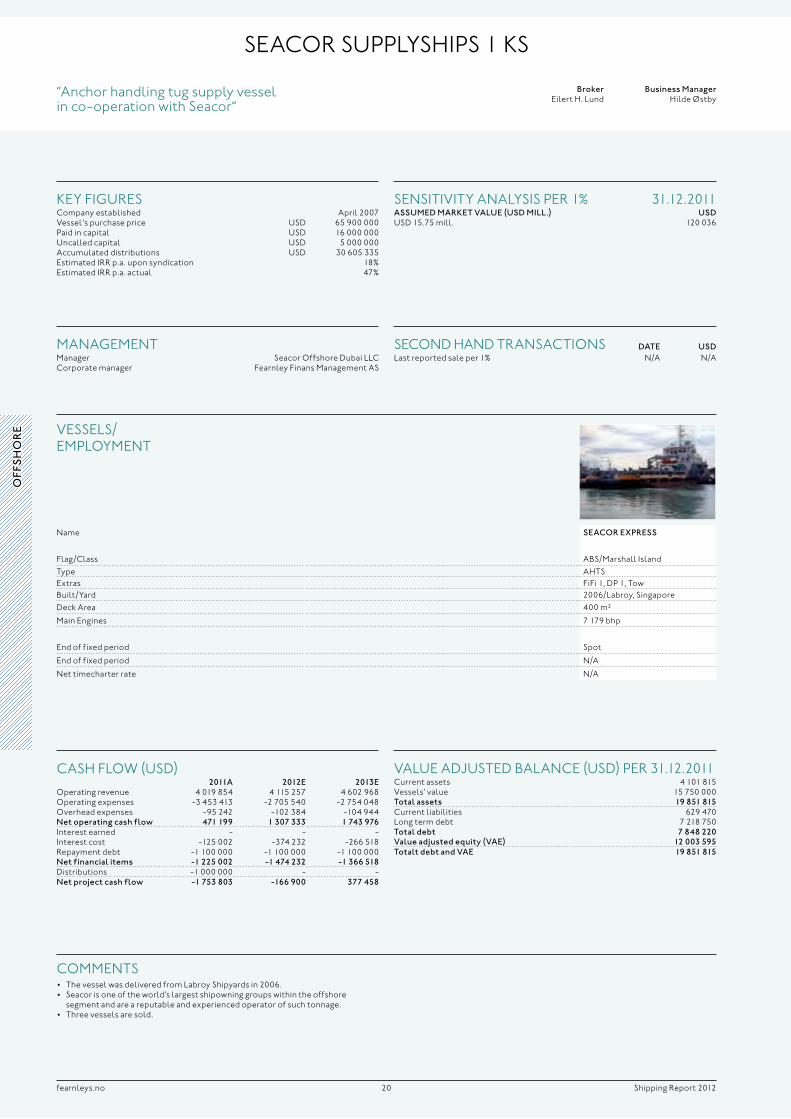
“Anchor handling tug supply vessel in co-operation with seacor“
name seacor exPress
flag/Class Abs/marshall islandtype Ahtsextras fifi 1, dp 1, towbuilt/yard 2006/Labroy, singaporedeck Area 400 m²
main engines 7 179 bhp
end of fixed period spot
end of fixed period n/A
net timecharter rate n/A
VesseLs/ empLoyment
Broker eilert h. Lund
Business manager hilde Østby
VALue Adjusted bALAnCe (usd) per 31.12.2011Current assets 4 101 815Vessels’ value 15 750 000Total assets 19 851 815Current liabilities 629 470Long term debt 7 218 750Total debt 7 848 220value adjusted equity (vae) 12 003 595Totalt debt and vae 19 851 815
seCond hAnd trAnsACtions DaTe UsDLast reported sale per 1% n/A n/A
mAnAgementmanager seacor offshore dubai LLCCorporate manager fearnley finans management As
sensitiVity AnALysis per 1% 31.12.2011assUmeD markeT valUe (UsD mIll.) UsDusd 15.75 mill. 120 036
Comments• ThevesselwasdeliveredfromLabroyShipyardsin2006.• Seacorisoneoftheworld’slargestshipowninggroupswithintheoffshore
segment and are a reputable and experienced operator of such tonnage.• Threevesselsaresold.
key figuresCompany established April 2007Vessel’s purchase price usd 65 900 000paid in capital usd 16 000 000uncalled capital usd 5 000 000Accumulated distributions usd 30 605 335estimated irr p.a. upon syndication 18%estimated irr p.a. actual 47%
CAsh fLow (usd)2011a 2012e 2013e
operating revenue 4 019 854 4 115 257 4 602 968operating expenses -3 453 413 -2 705 540 -2 754 048overhead expenses -95 242 -102 384 -104 944Net operating cash flow 471 199 1 307 333 1 743 976interest earned - - -interest cost -125 002 -374 232 -266 518repayment debt -1 100 000 -1 100 000 -1 100 000Net financial items -1 225 002 -1 474 232 -1 366 518distributions -1 000 000 - -Net project cash flow -1 753 803 -166 900 377 458
off
sh
or
e
21fearnleys.no shipping report 2012
TaN
k/l
Pg
stAVAnger bAy ks
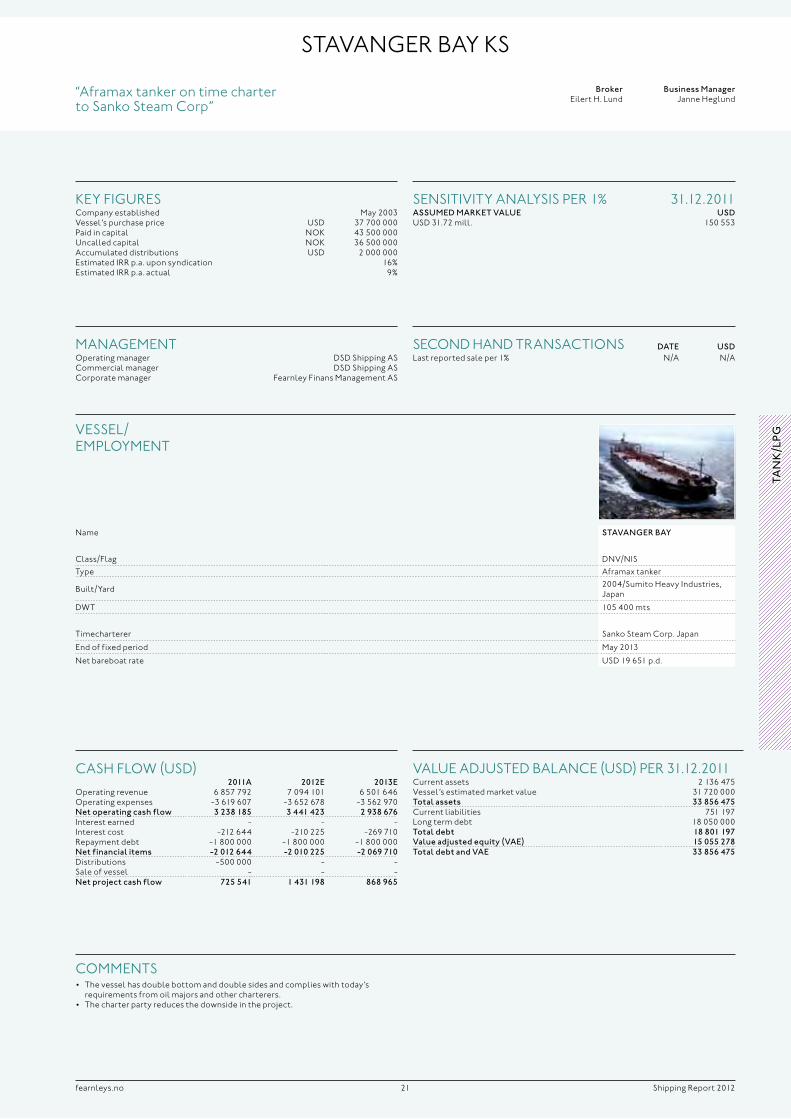
“Aframax tanker on time charter to sanko steam Corp”
name sTavaNger Bay
Class/flag dnV/nistype Aframax tanker
built/yard 2004/sumito heavy industries, japan
dwt 105 400 mts
timecharterer sanko steam Corp. japan
end of fixed period may 2013
net bareboat rate usd 19 651 p.d.
VesseL/ empLoyment
Broker eilert h. Lund
Business manager janne heglund
key figuresCompany established may 2003Vessel’s purchase price usd 37 700 000paid in capital nok 43 500 000uncalled capital nok 36 500 000Accumulated distributions usd 2 000 000estimated irr p.a. upon syndication 16%estimated irr p.a. actual 9%
VALue Adjusted bALAnCe (usd) per 31.12.2011Current assets 2 136 475Vessel’s estimated market value 31 720 000Total assets 33 856 475Current liabilities 751 197Long term debt 18 050 000Total debt 18 801 197value adjusted equity (vae) 15 055 278Total debt and vae 33 856 475
seCond hAnd trAnsACtions DaTe UsDLast reported sale per 1% n/A n/A
mAnAgementoperating manager dsd shipping AsCommercial manager dsd shipping AsCorporate manager fearnley finans management As
sensitiVity AnALysis per 1% 31.12.2011assUmeD markeT valUe UsDusd 31.72 mill. 150 553
Comments• Thevesselhasdoublebottomanddoublesidesandcomplieswithtoday’s
requirements from oil majors and other charterers.• Thecharterpartyreducesthedownsideintheproject.
CAsh fLow (usd)2011a 2012e 2013e
operating revenue 6 857 792 7 094 101 6 501 646operating expenses -3 619 607 -3 652 678 -3 562 970Net operating cash flow 3 238 185 3 441 423 2 938 676interest earned - - -interest cost -212 644 -210 225 -269 710repayment debt -1 800 000 -1 800 000 -1 800 000Net financial items -2 012 644 -2 010 225 -2 069 710distributions -500 000 - -sale of vessel - - -Net project cash flow 725 541 1 431 198 868 965
22fearnleys.no shipping report 2012
AtLAntiC sofrAnA dis
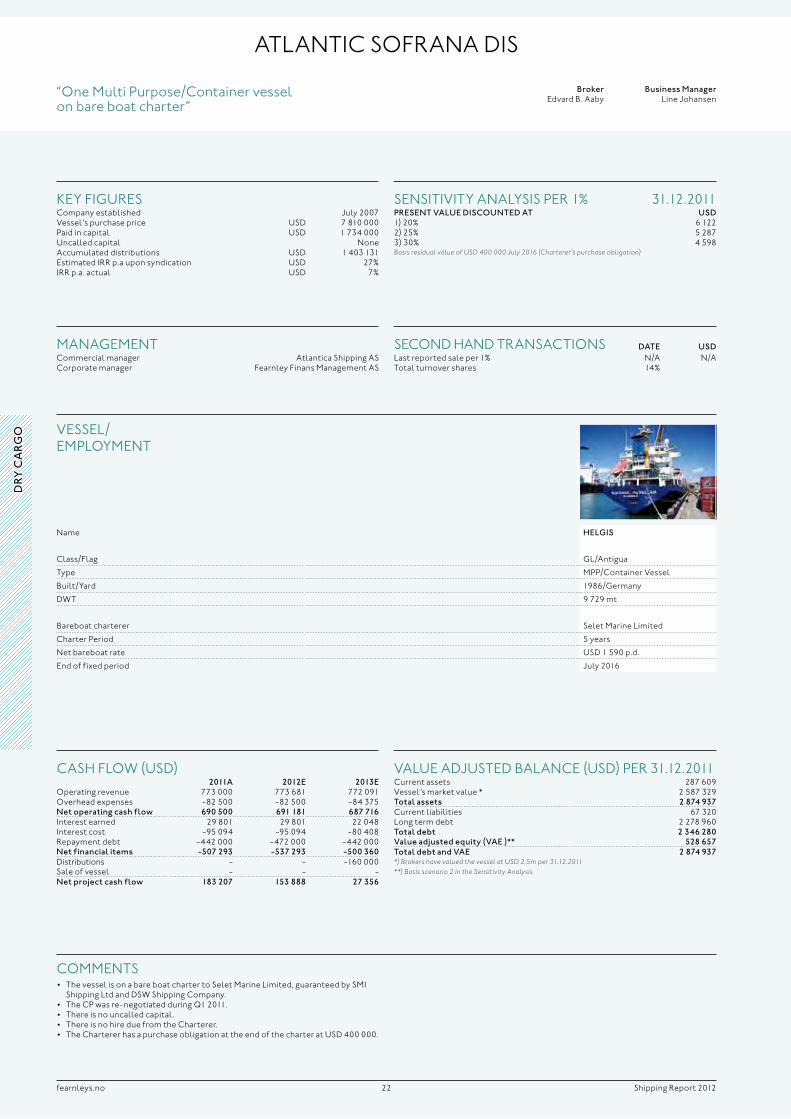
“one multi purpose/Container vessel on bare boat charter”
name helgIs
Class/flag gL/Antigua
type mpp/Container Vessel
built/yard 1986/germany
dwt 9 729 mt
bareboat charterer selet marine Limited
Charter period 5 years
net bareboat rate usd 1 590 p.d.
end of fixed period july 2016
VesseL/ empLoyment
Broker edvard b. Aaby
Business manager Line johansen
key figuresCompany established july 2007Vessel’s purchase price usd 7 810 000paid in capital usd 1 734 000uncalled capital noneAccumulated distributions usd 1 403 131estimated irr p.a upon syndication usd 27%irr p.a. actual usd 7%
CAsh fLow (usd)2011a 2012e 2013e
operating revenue 773 000 773 681 772 091overhead expenses -82 500 -82 500 -84 375Net operating cash flow 690 500 691 181 687 716interest earned 29 801 29 801 22 048interest cost -95 094 -95 094 -80 408repayment debt -442 000 -472 000 -442 000Net financial items -507 293 -537 293 -500 360distributions - - -160 000sale of vessel - - -Net project cash flow 183 207 153 888 27 356
VALue Adjusted bALAnCe (usd) per 31.12.2011Current assets 287 609Vessel’s market value * 2 587 329Total assets 2 874 937Current liabilities 67 320Long term debt 2 278 960Total debt 2 346 280value adjusted equity (vae )** 528 657Total debt and vae 2 874 937*) Brokers have valued the vessel at USD 2.5m per 31.12.2011**) Basis scenario 2 in the Sensitivity Analysis
seCond hAnd trAnsACtions DaTe UsDLast reported sale per 1% n/A n/Atotal turnover shares 14%
mAnAgementCommercial manager Atlantica shipping AsCorporate manager fearnley finans management As
sensitiVity AnALysis per 1% 31.12.2011PreseNT valUe DIscoUNTeD aT UsD1) 20% 6 1222) 25% 5 2873) 30% 4 598Basis residual value of USD 400 000 July 2016 (Charterer’s purchase obligation)
Comments• ThevesselisonabareboatchartertoSeletMarineLimited,guaranteedbySMI
shipping Ltd and dsw shipping Company.• TheCPwasre-negotiatedduringQ12011.• Thereisnouncalledcapital.• ThereisnohireduefromtheCharterer.• TheChartererhasapurchaseobligationattheendofthecharteratUSD400000.
Dry
ca
rg
o
23fearnleys.no shipping report 2012
ArtiC eXpress 1 dis
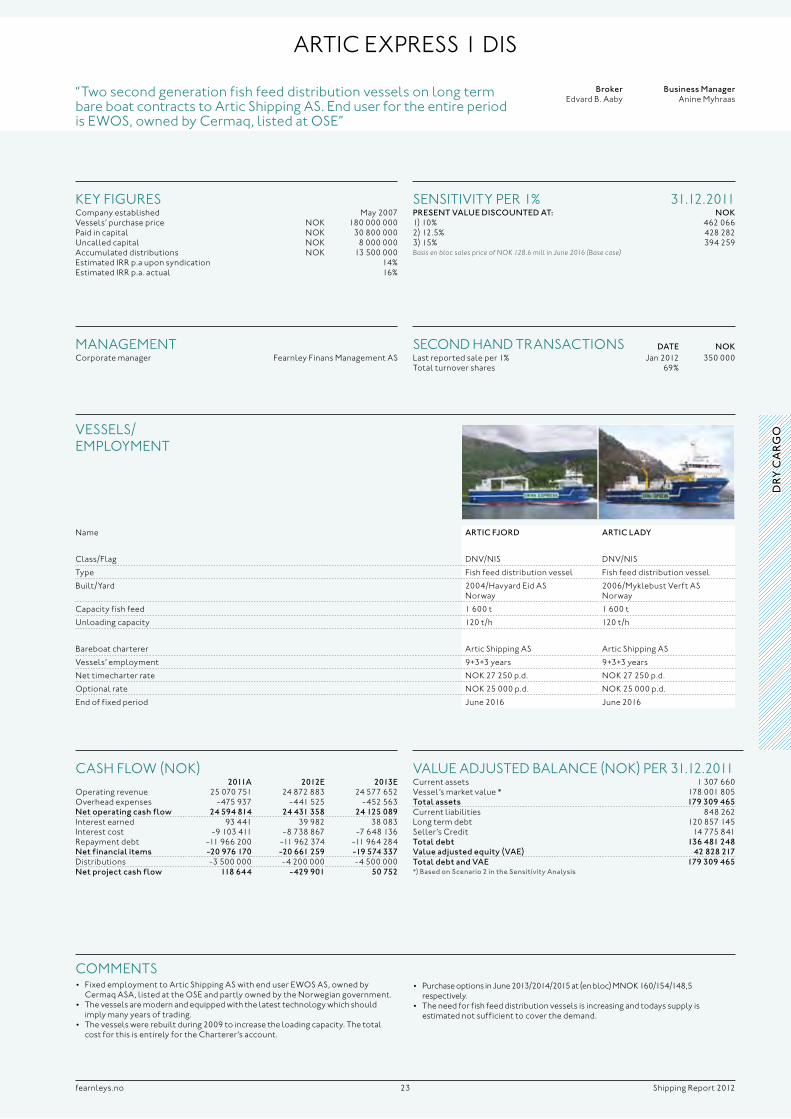
“two second generation fish feed distribution vessels on long term bare boat contracts to Artic shipping As. end user for the entire period is ewos, owned by Cermaq, listed at ose”
name arTIc fjorD arTIc laDy
Class/flag dnV/nis dnV/nis
type fish feed distribution vessel fish feed distribution vessel
built/yard 2004/havyard eid As norway
2006/myklebust Verft As norway
Capacity fish feed 1 600 t 1 600 t
unloading capacity 120 t/h 120 t/h
bareboat charterer Artic shipping As Artic shipping As
Vessels’ employment 9+3+3 years 9+3+3 years
net timecharter rate nok 27 250 p.d. nok 27 250 p.d.
optional rate nok 25 000 p.d. nok 25 000 p.d.
end of fixed period june 2016 june 2016
VesseLs/ empLoyment
Broker edvard b. Aaby
Business manager Anine myhraas
key figuresCompany established may 2007Vessels’ purchase price nok 180 000 000paid in capital nok 30 800 000uncalled capital nok 8 000 000Accumulated distributions nok 13 500 000estimated irr p.a upon syndication 14%estimated irr p.a. actual 16%
CAsh fLow (nok)2011a 2012e 2013e
operating revenue 25 070 751 24 872 883 24 577 652overhead expenses -475 937 -441 525 -452 563Net operating cash flow 24 594 814 24 431 358 24 125 089interest earned 93 441 39 982 38 083interest cost -9 103 411 -8 738 867 -7 648 136repayment debt -11 966 200 -11 962 374 -11 964 284Net financial items -20 976 170 -20 661 259 -19 574 337distributions -3 500 000 -4 200 000 -4 500 000Net project cash flow 118 644 -429 901 50 752
VALue Adjusted bALAnCe (nok) per 31.12.2011Current assets 1 307 660Vessel’s market value * 178 001 805Total assets 179 309 465Current liabilities 848 262Long term debt 120 857 145seller’s Credit 14 775 841Total debt 136 481 248value adjusted equity (vae) 42 828 217Total debt and vae 179 309 465*) Based on scenario 2 in the sensitivity analysis
seCond hAnd trAnsACtions DaTe NokLast reported sale per 1% jan 2012 350 000total turnover shares 69%
mAnAgementCorporate manager fearnley finans management As
sensitiVity per 1% 31.12.2011PreseNT valUe DIscoUNTeD aT: Nok1) 10% 462 0662) 12.5% 428 2823) 15% 394 259Basis en bloc sales price of NOK 128.6 mill in June 2016 (Base case)
Comments• FixedemploymenttoArticShippingASwithenduserEWOSAS,ownedby
Cermaq AsA, listed at the ose and partly owned by the norwegian government.• Thevesselsaremodernandequippedwiththelatesttechnologywhichshould
imply many years of trading.• Thevesselswererebuiltduring2009toincreasetheloadingcapacity.Thetotal
cost for this is entirely for the Charterer’s account.
• PurchaseoptionsinJune2013/2014/2015at(enbloc)MNOK160/154/148,5respectively.
• Theneedforfishfeeddistributionvesselsisincreasingandtodayssupplyisestimated not sufficient to cover the demand.
Dry
ca
rg
o
24fearnleys.no shipping report 2012
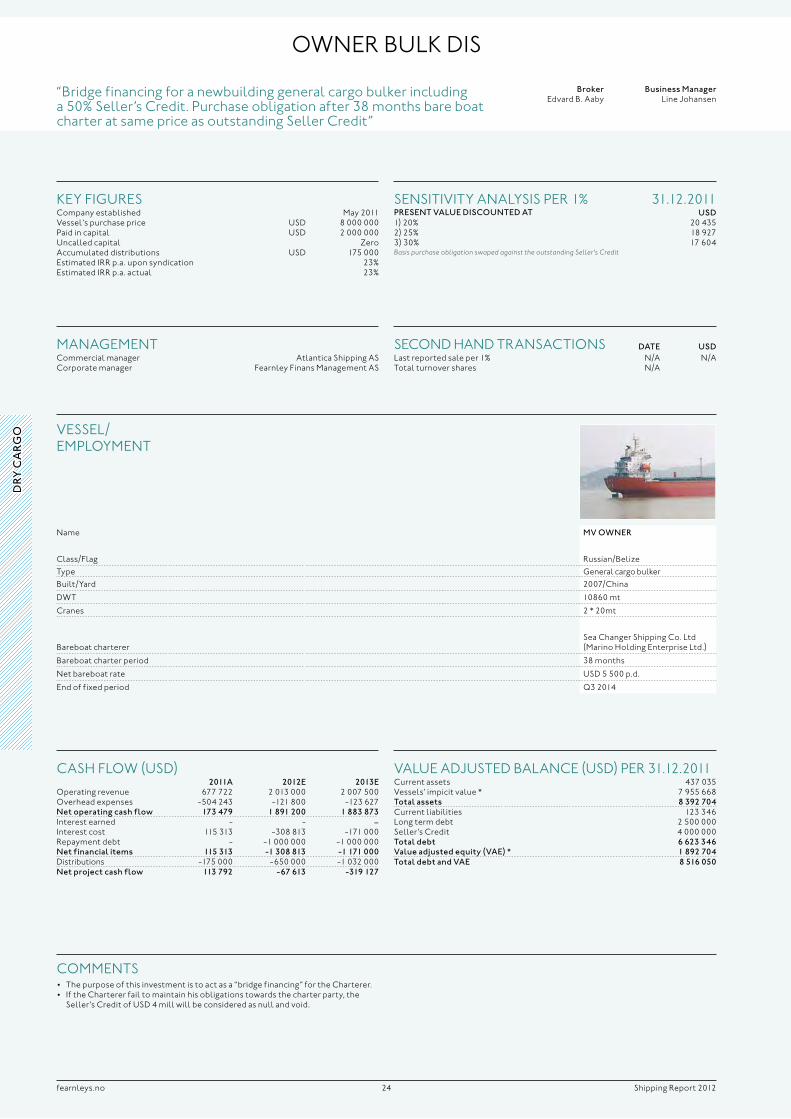
name mv owNer
Class/flag russian/belize type general cargo bulkerbuilt/yard 2007/China
dwt 10860 mt
Cranes 2 * 20mt
bareboat charterersea Changer shipping Co. Ltd (marino holding enterprise Ltd.)
bareboat charter period 38 months
net bareboat rate usd 5 500 p.d.
end of fixed period Q32014
VesseL/ empLoyment
owner buLk dis
“bridge financing for a newbuilding general cargo bulker including a 50% seller’s Credit. purchase obligation after 38 months bare boat charter at same price as outstanding seller Credit”
Broker edvard b. Aaby
Business manager Line johansen
key figuresCompany established may 2011Vessel’s purchase price usd 8 000 000paid in capital usd 2 000 000uncalled capital ZeroAccumulated distributions usd 175 000estimated irr p.a. upon syndication 23%estimated irr p.a. actual 23%
CAsh fLow (usd)2011a 2012e 2013e
operating revenue 677 722 2 013 000 2 007 500overhead expenses -504 243 -121 800 -123 627Net operating cash flow 173 479 1 891 200 1 883 873interest earned - - -interest cost 115 313 -308 813 -171 000repayment debt - -1 000 000 -1 000 000Net financial items 115 313 -1 308 813 -1 171 000distributions -175 000 -650 000 -1 032 000Net project cash flow 113 792 -67 613 -319 127
VALue Adjusted bALAnCe (usd) per 31.12.2011Current assets 437 035Vessels’ impicit value * 7 955 668Total assets 8 392 704Current liabilities 123 346Long term debt 2 500 000seller’s Credit 4 000 000Total debt 6 623 346value adjusted equity (vae) * 1 892 704Total debt and vae 8 516 050
seCond hAnd trAnsACtions DaTe UsDLast reported sale per 1% n/A n/Atotal turnover shares n/A
mAnAgementCommercial manager Atlantica shipping AsCorporate manager fearnley finans management As
sensitiVity AnALysis per 1% 31.12.2011PreseNT valUe DIscoUNTeD aT UsD1) 20% 20 4352) 25% 18 9273) 30% 17 604Basis purchase obligation swaped against the outstanding Seller’s Credit
Comments• Thepurposeofthisinvestmentistoactasa“bridgefinancing”fortheCharterer.• IftheChartererfailtomaintainhisobligationstowardsthecharterparty,the
seller’s Credit of usd 4 mill will be considered as null and void.
Dry
ca
rg
o
25fearnleys.no shipping report 2012
president buLker dis
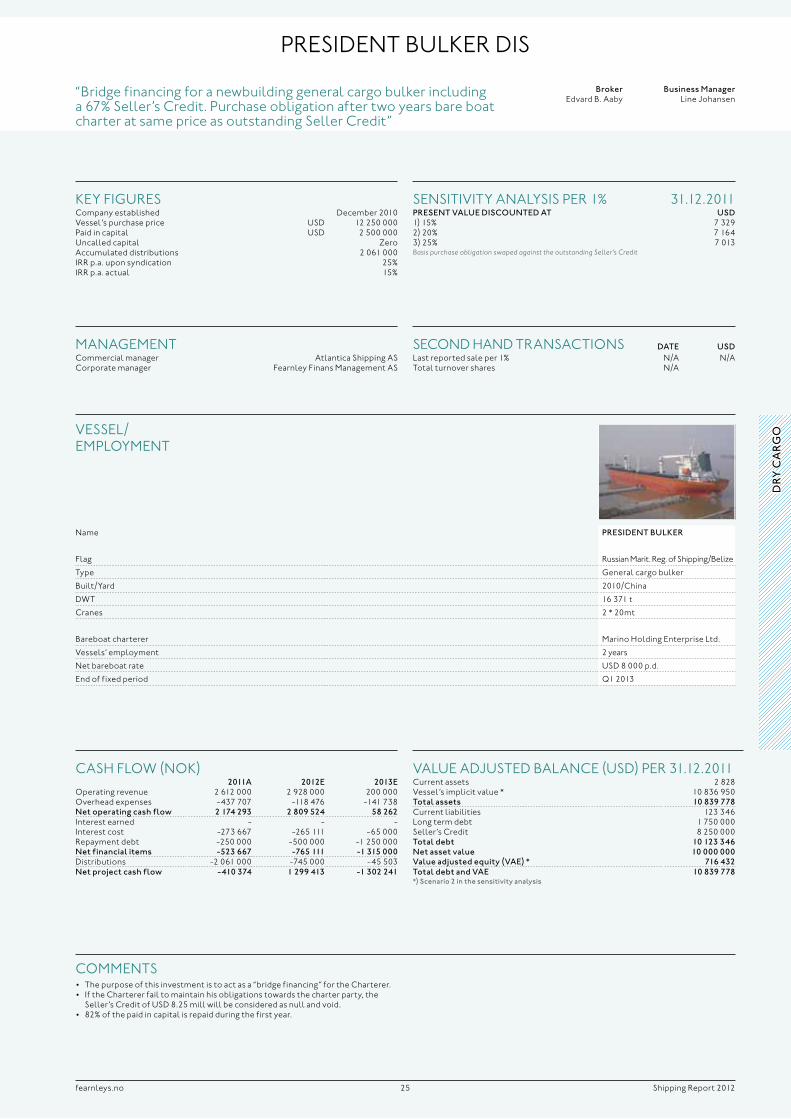
“bridge financing for a newbuilding general cargo bulker including a 67% seller’s Credit. purchase obligation after two years bare boat charter at same price as outstanding seller Credit”
name PresIDeNT BUlker
flag russian marit. reg. of shipping/belize
type general cargo bulker
built/yard 2010/China
dwt 16 371 t
Cranes 2 * 20mt
bareboat charterer marino holding enterprise Ltd.
Vessels’ employment 2 years
net bareboat rate usd 8 000 p.d.
end of fixed period Q12013
VesseL/ empLoyment
Broker edvard b. Aaby
Business manager Line johansen
key figuresCompany established december 2010Vessel’s purchase price usd 12 250 000paid in capital usd 2 500 000uncalled capital ZeroAccumulated distributions 2 061 000irr p.a. upon syndication 25%irr p.a. actual 15%
CAsh fLow (nok)2011a 2012e 2013e
operating revenue 2 612 000 2 928 000 200 000overhead expenses -437 707 -118 476 -141 738Net operating cash flow 2 174 293 2 809 524 58 262interest earned - - -interest cost -273 667 -265 111 -65 000repayment debt -250 000 -500 000 -1 250 000Net financial items -523 667 -765 111 -1 315 000distributions -2 061 000 -745 000 -45 503Net project cash flow -410 374 1 299 413 -1 302 241
VALue Adjusted bALAnCe (usd) per 31.12.2011Current assets 2 828Vessel’s implicit value * 10 836 950Total assets 10 839 778Current liabilities 123 346Long term debt 1 750 000seller’s Credit 8 250 000Total debt 10 123 346Net asset value 10 000 000value adjusted equity (vae) * 716 432Total debt and vae 10 839 778*) scenario 2 in the sensitivity analysis
seCond hAnd trAnsACtions DaTe UsDLast reported sale per 1% n/A n/Atotal turnover shares n/A
mAnAgementCommercial manager Atlantica shipping AsCorporate manager fearnley finans management As
sensitiVity AnALysis per 1% 31.12.2011PreseNT valUe DIscoUNTeD aT UsD1) 15% 7 3292) 20% 7 1643) 25% 7 013Basis purchase obligation swaped against the outstanding Seller’s Credit
Comments• Thepurposeofthisinvestmentistoactasa“bridgefinancing”fortheCharterer.• IftheChartererfailtomaintainhisobligationstowardsthecharterparty,the
seller’s Credit of usd 8.25 mill will be considered as null and void.• 82%ofthepaidincapitalisrepaidduringthefirstyear.
Dry
ca
rg
o
26fearnleys.no shipping report 2012
ross buLk is
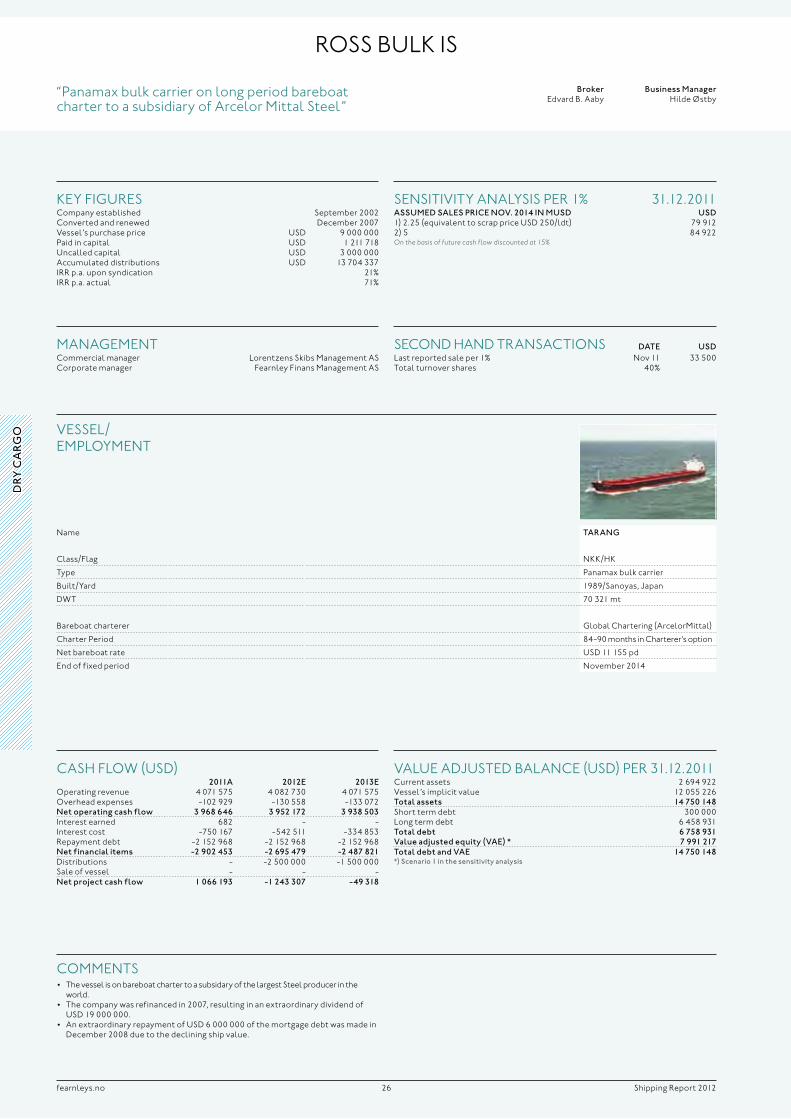
“panamax bulk carrier on long period bareboat charter to a subsidiary of Arcelor mittal steel”
name TaraNg
Class/flag nkk/hk
type panamax bulk carrier
built/yard 1989/sanoyas, japan
dwt 70 321 mt
bareboat charterer global Chartering (Arcelormittal)
Charter period 84-90 months in Charterer’s option
net bareboat rate usd 11 155 pd
end of fixed period november 2014
VesseL/ empLoyment
Broker edvard b. Aaby
Business manager hilde Østby
key figuresCompany established september 2002Converted and renewed december 2007Vessel’s purchase price usd 9 000 000paid in capital usd 1 211 718uncalled capital usd 3 000 000Accumulated distributions usd 13 704 337irr p.a. upon syndication 21%irr p.a. actual 71%
CAsh fLow (usd)2011a 2012e 2013e
operating revenue 4 071 575 4 082 730 4 071 575overhead expenses -102 929 -130 558 -133 072Net operating cash flow 3 968 646 3 952 172 3 938 503interest earned 682 - -interest cost -750 167 -542 511 -334 853repayment debt -2 152 968 -2 152 968 -2 152 968Net financial items -2 902 453 -2 695 479 -2 487 821distributions - -2 500 000 -1 500 000sale of vessel - - -Net project cash flow 1 066 193 -1 243 307 -49 318
VALue Adjusted bALAnCe (usd) per 31.12.2011Current assets 2 694 922Vessel’s implicit value 12 055 226Total assets 14 750 148short term debt 300 000Long term debt 6 458 931Total debt 6 758 931value adjusted equity (vae) * 7 991 217Total debt and vae 14 750 148*) scenario 1 in the sensitivity analysis
seCond hAnd trAnsACtions DaTe UsDLast reported sale per 1% nov 11 33 500total turnover shares 40%
mAnAgementCommercial manager Lorentzens skibs management AsCorporate manager fearnley finans management As
sensitiVity AnALysis per 1% 31.12.2011assUmeD sales PrIce Nov. 2014 IN mUsD UsD1) 2.25 (equivalent to scrap price usd 250/ldt) 79 9122) 5 84 922On the basis of future cash flow discounted at 15%
Comments• ThevesselisonbareboatchartertoasubsidaryofthelargestSteelproducerinthe
world.• Thecompanywasrefinancedin2007,resultinginanextraordinarydividendof
usd 19 000 000.• AnextraordinaryrepaymentofUSD6000000ofthemortgagedebtwasmadein
december 2008 due to the declining ship value.
Dry
ca
rg
o
27fearnleys.no shipping report 2012
ro
ro
/lIN
er
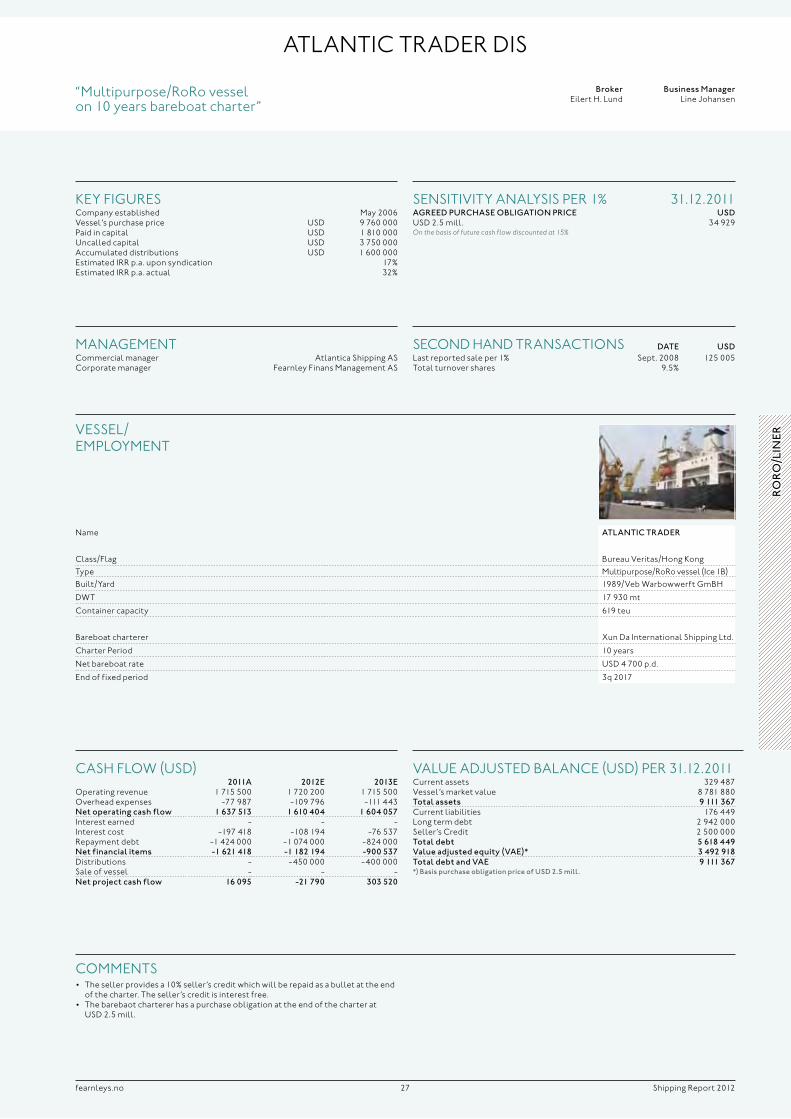
name aTlaNTIc TraDer
Class/flag bureau Veritas/hong kongtype multipurpose/roro vessel (ice 1b)built/yard 1989/Veb warbowwerft gmbh
dwt 17 930 mt
Container capacity 619 teu
bareboat charterer Xun da international shipping Ltd.
Charter period 10 years
net bareboat rate usd 4 700 p.d.
end of fixed period 3q 2017
VesseL/ empLoyment
AtLAntiC trAder dis
“multipurpose/roro vessel on 10 years bareboat charter”
Broker eilert h. Lund
Business manager Line johansen
key figuresCompany established may 2006Vessel’s purchase price usd 9 760 000paid in capital usd 1 810 000uncalled capital usd 3 750 000Accumulated distributions usd 1 600 000estimated irr p.a. upon syndication 17%estimated irr p.a. actual 32%
VALue Adjusted bALAnCe (usd) per 31.12.2011Current assets 329 487Vessel’s market value 8 781 880Total assets 9 111 367Current liabilities 176 449Long term debt 2 942 000seller’s Credit 2 500 000Total debt 5 618 449value adjusted equity (vae)* 3 492 918Total debt and vae 9 111 367*) Basis purchase obligation price of UsD 2.5 mill.
seCond hAnd trAnsACtions DaTe UsDLast reported sale per 1% sept. 2008 125 005total turnover shares 9.5%
mAnAgementCommercial manager Atlantica shipping AsCorporate manager fearnley finans management As
sensitiVity AnALysis per 1% 31.12.2011agreeD PUrchase oBlIgaTIoN PrIce UsDusd 2.5 mill. 34 929On the basis of future cash flow discounted at 15%
Comments• Thesellerprovidesa10%seller’screditwhichwillberepaidasabulletattheend
of the charter. the seller’s credit is interest free.• Thebarebaotchartererhasapurchaseobligationattheendofthecharterat
usd 2.5 mill.
CAsh fLow (usd)2011a 2012e 2013e
operating revenue 1 715 500 1 720 200 1 715 500overhead expenses -77 987 -109 796 -111 443Net operating cash flow 1 637 513 1 610 404 1 604 057interest earned - - -interest cost -197 418 -108 194 -76 537repayment debt -1 424 000 -1 074 000 -824 000Net financial items -1 621 418 -1 182 194 -900 537distributions - -450 000 -400 000sale of vessel - - -Net project cash flow 16 095 -21 790 303 520

28fearnleys.no shipping report 2012
bergshAV CAr CArrier ks
“pure Car Carrier chartered out on time charter”
name hyUNDaI No. 203
Class korea/panamatype pure Car Carrierbuilt/yard 1987/hyundai hi
Car capacity 4 734 ceu
Car decks/hoist. decks 12/1
next ss
VesseL/ empLoyment
Broker eilert h. Lund
Business manager janne green heglund
key figuresCompany established july 1998Vessel’s purchase price usd 24 350 000paid in capital usd 2 952 756uncalled capital 0Accumulated distributions usd 12 395 000estimated irr p.a. upon syndication (10 years) 22%estimated irr p.a. actual (13.5 years) 22%
VALue Adjusted bALAnCe (nok) per 31.12.2011Current assets 8 589 916Vessel’s value 59 927 000Total assets 68 516 916Current liabilities 9 344 465Long term debt 16 472 500Total debt 25 816 965value adjusted equity (vae) 42 699 951Total debt and vae 68 516 916
seCond hAnd trAnsACtions DaTe NokLast reported sale per 1% jan 02 397 500
mAnAgementmanager bergshav management AsCorporate manager fearnley finans management As
sensitiVity AnALysis per 1% 31.12.2011assUmeD markeT valUe Noknok 60 mill. 427 000
Comments
CAsh fLow (nok)2011a 2012e 2013e
operating revenue 3 307 640 - -overhead expenses -2 292 855 - -Net operating cash flow 1 014 785 - -interest earned 480 - -interest cost -55 853 - -repayment debt -500 000 - -Net financial items -555 373 - -distributions - - -Net project cash flow 459 412 - -
ro
ro
/lIN
er
29fearnleys.no shipping report 2012
ro
ro
/lIN
er
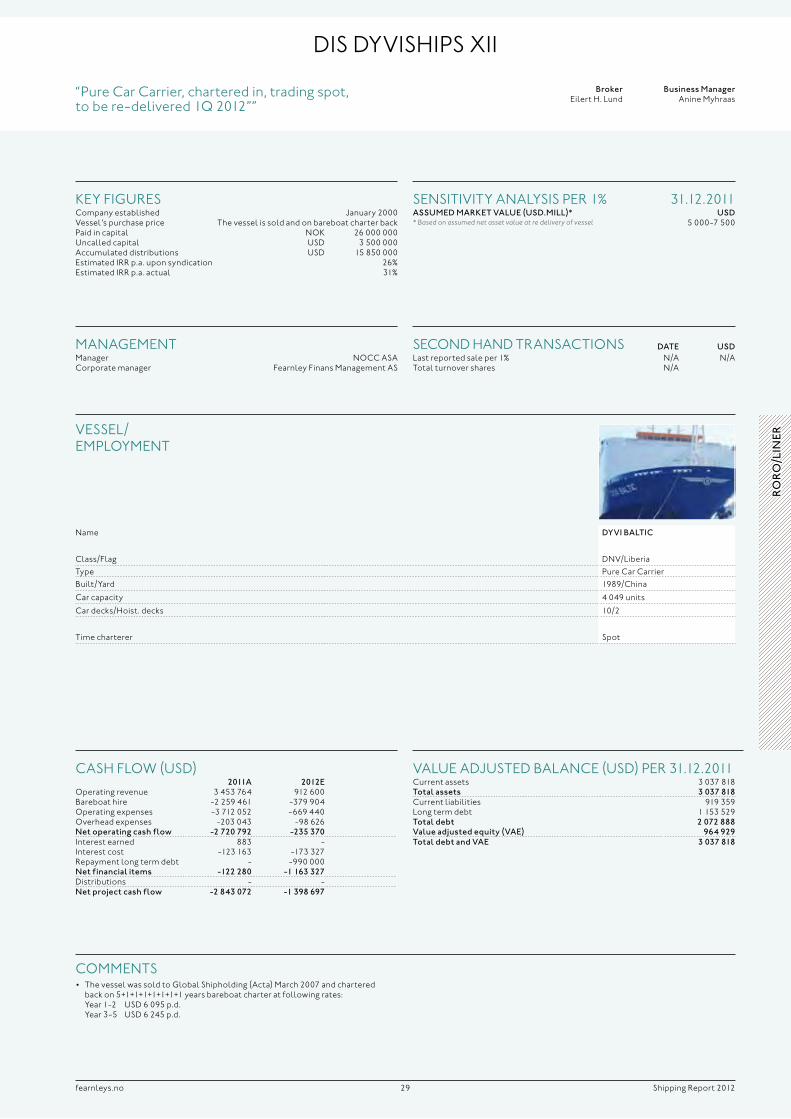
name DyvI BalTIc
Class/flag dnV/Liberiatype pure Car Carrierbuilt/yard 1989/China
Car capacity 4 049 units
Car decks/hoist. decks 10/2
time charterer spot
VesseL/ empLoyment
dis dyViships Xii
“pure Car Carrier, chartered in, trading spot, tobere-delivered1Q2012””
Broker eilert h. Lund
Business manager Anine myhraas
key figuresCompany established january 2000Vessel’s purchase price the vessel is sold and on bareboat charter backpaid in capital nok 26 000 000uncalled capital usd 3 500 000Accumulated distributions usd 15 850 000estimated irr p.a. upon syndication 26%estimated irr p.a. actual 31%
VALue Adjusted bALAnCe (usd) per 31.12.2011Current assets 3 037 818Total assets 3 037 818Current liabilities 919 359Long term debt 1 153 529Total debt 2 072 888value adjusted equity (vae) 964 929Total debt and vae 3 037 818
seCond hAnd trAnsACtions DaTe UsDLast reported sale per 1% n/A n/Atotal turnover shares n/A
mAnAgementmanager noCC AsACorporate manager fearnley finans management As
sensitiVity AnALysis per 1% 31.12.2011assUmeD markeT valUe (UsD.mIll)* UsD* Based on assumed net asset value at re delivery of vessel 5 000-7 500
Comments• ThevesselwassoldtoGlobalShipholding(Acta)March2007andchartered
back on 5+1+1+1+1+1+1+1 years bareboat charter at following rates: year 1-2 usd 6 095 p.d.
year 3-5 usd 6 245 p.d.
CAsh fLow (usd)2011a 2012e
operating revenue 3 453 764 912 600bareboat hire -2 259 461 -379 904operating expenses -3 712 052 -669 440overhead expenses -203 043 -98 626Net operating cash flow -2 720 792 -235 370interest earned 883 -interest cost -123 163 -173 327repayment long term debt - -990 000Net financial items -122 280 -1 163 327distributions - -Net project cash flow -2 843 072 -1 398 697

30fearnleys.no shipping report 2012
name Nocc aTlaNTIc
Class/flag dnV/nis
type pure Car truck Carrier
delivery Q12009yard weihai shipbuilding Co. Ltd, ChinaCar capacity 6 800 units
decks/hoist. decks 13/4
employment 5 year t/c
VesseL/ empLoyment
noCC AtLAntiC dis
Broker eilert h. Lund
Business manager janne heglund
key figuresCompany established february 2007Vessels’ purchase price usd 75 480 000paid in capital usd 25 800 000uncalled capital usd 15 000 000Accumulated distributions usd 3 000 000estimated p.a. irr upon syndication 12%estimated irr p.a. actual -2%
VALue Adjusted bALAnCe (usd) per 31.12.2011Current assets 7 161 898Vessels implicit value * 64 619 460Total assets 71 781 358Current liabilities 3 443 858Long term debt 48 337 500Total debt 51 781 358value adjusted equity (vae) 20 000 000Total debt and vae 71 781 358*) Based on sensitivity analysis
seCond hAnd trAnsACtions DaTe UsDLast reported sale per 1% jan 2012 200 000
mAnAgementmanager noCC AsAtechnical manager wsm koreaCorporate manager fearnley finans management As
sensitiVity AnALysis per 1% 31.12.2011assUmeD markeT valUe (UsD.mIll)* UsD64.6 200 000* Implisit value of the vessel with charter, basis last reported sale
Comments• Therearelimitedopportunitiestoinvestinthecarcarriersector.Historically
there have been few second hand vessel transactions, so sector exposure is limited to newbuilding contracts and a few listed companies only.
• Theprojectwasestablishedasatwovesselproject,buthasbeenreducedtoone.the key figures are thus halfed. As to accumulated ditributions this represents a “net figure”,after the paid in capital on vessel no. 1, had been reimbursed.
CAsh fLow (usd)2011a 2012e 2013e
operating revenue 11 785 306 12 344 426 12 310 326operating expenses -2 758 240 -2 539 674 -2 596 053overhead expenses -164 000 -165 502 -169 640Net operating cash flow 8 863 066 9 639 250 9 544 632interest earned 500 - -interest cost -1 757 105 -1 566 317 -1 412 174repayment debt -3 850 000 -6 850 000 -3 850 000Net financial items -5 606 605 -8 416 317 -5 262 174distributions -3 000 000 -1 500 000 -Net project cash flow 256 461 -277 067 4 282 459
ro
ro
/lIN
er
31www.fearnleys.no shipping report 2012
32www.fearnleys.no shipping report 2012
A fLeXibLe instrument for mAritime inVestments
Societe en commandite simple (France), Kommanditgesellschaft (Germany), Limited partnership (UK and USA), Kommandittselskap (Norway and Denmark) and similar companies in other countries – the names differ; the instruments and principles are the same. They are all limited partnerships.
Conceived in Renaissance Italy during its period of commercial expansion, they spread out via France to Northern Europe and the New World as a means of grouping together risk willing investors for definite business ventures. Their importance as a way of raising considerable sums of investment capital became particularly apparent during the 19th century when they were applied for acquiring expensive assets like ocean going vessels and coasters.
Nowadays, Germany, Norway and other Nordic countries still use them actively particularly for maritime purposes. In Scandinavia in general and in Norway in particular, the limited partnership – kommandittselskap, KS for short – has been, and is, widely used. During the 1970ies, -80ies and -90ies it was to a large extent the predominant way of raising capital for single unit/single purpose companies meant for owning ships or floating offshore oil industry units.
Norway, like other countries, has a written code for general and limited partnerships. The fiscal regime is also well defined. Thus, rules and regulations are clear, transparent and predictable and partnership agreements can be made short and simple.
oVerViewOne definition of a limited partnership is: “A form of business organization under which two or more persons associate and contribute their property or capital to carry forward some trade, business, investment or other venture to share in its control, profits and risks”. A limited partnership has one or more general partner(s) and one or more limited (also referred to as special) partner(s). The agreement between the partners – the partnership agreement – setting forth the conditions and terms under which the partnership is formed, will regulate how to split the profits, how partners can vote etc.
The main difference between a general partnership and a limited partnership is the limited partners’ limited liabilities as opposed to the general partners’ unlimited liabilities. This distinction is crucial.
the norwegiAn CAseBefore the arrival of well functioning stock markets and bourses, most Norwegian shipping projects were financed through general or limited partnerships with the latter becoming increasingly more popular, especially with shifting times. In many towns along the coast this was the predominant type of company used during the second half of the 19th century and the beginning of the 20th century.
Back then, a general partner was often a person (physical or legal), running the risk of being fully liable for the company’s dues and loose capital by an amount exceeding by far his original investment if things went wrong.
Nowadays, things are organized differently. As no investor wants to assume unlimited liability if it can be avoided, a way around the general partner’s unlimited liability had to be found while still maintaining and making use of the flexible KS structure. Therefore, the general partner is no longer a person (physical or legal) having assets or activities unrelated to the KS investment. Typically, the general partner is now a single purpose company with limited liability capitalized sufficiently to meet the minimum legal requirement of a contribution of least 10%. Either it is the initiator(s) or manager of the project who owns the general partner, or it is owned by the limited partners on a pro rata basis related to the ownership percentages in the KS represented by their limited partnership shares. Thus, in a KS with ten participants a 10% limited partner will typically own 9% directly in the KS and a further 1% indirectly as a 10% shareholder in the general partner (company).
The mortgage over the vessel constitutes the prime security to the lending bank. In addition the bank normally takes an assignment over freight revenues and insurance proceeds. The bank may also have an indirect form for security in the uncalled/committed capital of the KS for which each partner is liable on a pro rata basis, yet limited to each partner’s percentage participation. In a KS the claim for uncalled capital may however not serve as collateral, as these claims may not be assigned or pledged. The purpose of having an uncalled capital beyond the initial requirement to get the project going is to obtain the highest possible level of financing. The financing is further dependent on several other factors such as the vessel’s age, charterparty structure and market expectations. In the event that there should be a need for working capital in the project, related to the operation of the vessel for or debt service, calls can be made under the available committed capital.
The right sort of deal, well structured, should give investors a competitive rate of return on their investment comparing well with other alternatives. Fearnley Finans Shipping AS has traditionally concentrated on projects of two main categories of shipping and offshore with a different risk or return profile. First of all, financial deals where the focus has been on long charter parties, hence lower market exposure. These projects have normally given the investors a return of 10% to 20% on the paid in equity. The other category is asset play projects where the timing in
Limited pArtnerships – the norwegiAn wAy
this presentation is provided by the law firm Vogt & wiig
33www.fearnleys.no shipping report 2012
relation to the markets, shipping values and rates are the deciding factors. These projects involves more risk, due to the increased exposure, but the fluctuations in the shipping markets have in periods given the investors very good returns on the paid in equity.
Limited pArtnerships – LegAL ChArACteristiCs
Limited partnerships are governed by the Norwegian Act of 21 June 1985 no 83 on companies and limited partnerships (the “Companies Act”).
A limited partnership have a specific partner ship capital, divided into one or more general partner participations (“general partners”) and one or more limited partner participations (“limited partners”). The general partner(s) are jointly and severally liable for the liabilities of the partnership to the full extent of their assets. The liability of the limited partners is restricted to their committed capital, as they are only liable for the amount of their investment asspecified in the limited partnership agreement.
The partners must enter into a limited partnership agreement regulating, inter alia, the partners’ liability for the obligations of the partnership, the amount of the part nership capital, the part of the partnership capital which shall be restricted (see below) and the partners’ obligations to contribute capital to the limited partner ship. A limited partnership, including the identity of the investors, shall be registered with the Norwegian Register of Business Enterprises.
The profits and losses of the limited part nership are divided among the partners as specified in the limited partner ship agreement or the Companies Act. Taxes are imposed on the individual partners on their share of the net income from the limited partnership (transparent).
There are certain minimum requirements in the Companies Act on what information and documents the partners should be provided with before subscribing for part ner ship shares. Please note, however, that under Norwegian law, shares in limited partner- ships are still not defined as “financial instruments” (or “securities”) and that the prospectus requirements of the securities trading act and stock exchange regulations do not apply to limited partnerships. The partners are free to agree on the amount of the partnership capital, however so that the committed capital of each of the limited partners must be at least NOK 20.000,-.
The general partner shall contribute (i) at least 1/10 of the partnership capital, (ii) own at least 1/10 of the partnership’s net capital at any time and (iii) have at least 1/10 of the profit and loss of the limited partnership. If there are two or more general partners in the limited partnership, at least one of the general partners must satisfy the said conditions. In most limited partnerships, there is only one general partner.
The limited partnership’s right to call and receive capital cannot be assigned, nor can it be deposited as security for debt or subject to distraint for the obligations of the limited partnership. At least 2/5 of the partnership capital shall be restricted capital and is not distributable to the partners.
The limited partnership cannot be registered in the Norwegian Register of Business Enterprises before at least 1/5 of each partner’s committed capital has been paid in to the partnership. A total of at least 2/5 of the committed capital shall be paid in to the partnership within two years from the registration. There are no requirements in the Companies Act with regards to the obligations of paying in the “unrestricted” part of the committed capital. The partners are free to decide if and when such capital shall be called for. However, the limited partnership agreement usually contains provisions regulating the partners’ obligations to pay in capital to the limited partnership.
The highest authority in the limited partnership is the partnership meeting. However, the partnership meeting may decide that the general partner or the board of directors (if appointed) shall have the general decision making authority of the partnership. If so, please note that certain matters must always be decided by the partnership meeting anyway. The general partner conducts the management of the limited partnership and has the legal authority to enter into contracts for the limited partnership if not decided otherwise. It can be, however, and usually is, agreed that the partnership shall have a board of directors authorised to conduct the management of the partnership. The general partner shall always appoint at least one director.
Normally, the scope of the business of the limited partnership is described in the limited partnership agreement, and the decision making authority and procedural rules are normally set out to specify the majority requirements for certain important matters (sale of assets), sales trigger clauses etc.
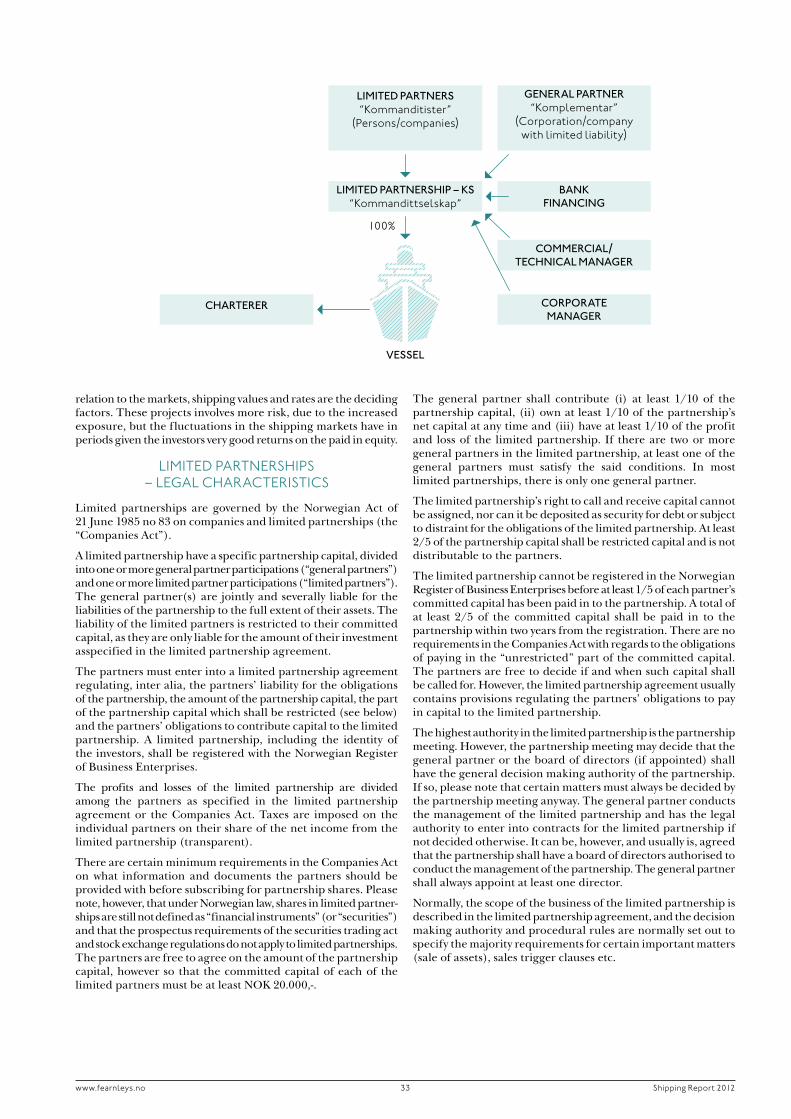
charTerer
lImITeD ParTNers “kommanditister”
(persons/companies)
geNeral ParTNer “komplementar”
(Corporation/company with limited liability)
lImITeD ParTNershIP – ks “kommandittselskap”
BaNk fINaNcINg
commercIal/ TechNIcal maNager
corPoraTe maNager
vessel
100%
34 shipping report 2012
Profit and loss shall be shared among the partners according to their respective participations in the partnership capital, except as otherwise agreed. The assets of the partnership may not be dis- tributed to the partners except to the extent that the partnership’s net capital according to the balance sheet at the end of the last financial year exceeds 2/5 of the partnership capital.
the CompArAtiVe AdVAntAge•TheKSismeantforsinglepurposeinvestmentsasopposedto
other corporate structures whose duration may well exceed several generations of assets and whose bye-laws will reflect that. When the asset is being disposed of, the partnership gets liquidated and the partners receive a distribution equivalent to their shares of the net proceeds,
•UntiltheKSgetsliquidated,partnershipsharescanbeboughtand sold, and the corporate manager will create a market in the shares. Typically, the share price will reflect the estimated under- lying value less a certain discount,
•Theuncalledcapital(committedbeyondthecalledupcapital)enables the KS to borrow more than what is normally obtainable solely with the vessel as collateral,
•ThroughaNorwegianregisteredKSthegroupingtogetherofinvestors from various jurisdictions is easy. As revenues to non-Norwegian owners deriving from international shipping activities organized through partnerships are under the present Norwegian tax regime usually not taxed in Norway, there is no handicap to a non-Norwegian in having ones shipping investments organized through a Norwegian KS. On the contrary, it may be advantageous to foreigners to make the best of the well established Norwegian system.
the eVen more fLeXibLe ALternAtiVe – internAL pArtnerships
In recent years, internal partnerships, “IS or “DIS” for short, have conquered ground where limited partnerships used to rule. In its nature, both partnerships are almost the same, but one of the main reasons for the internal partnerships’ advance is that there is no statutory requirements when it comes to capital structure in the internal partnership.
Even though there is a lot of similarities between the two partner- ships, there are also several differences. Below is a summary of the main differences:
•AKSisaseparatelegalentitywhichcanenterintoagreementswith third parties. The Internal Partnership cannot enter into such agreements and is not a legal entity. All agreements are made and represented by the General Partner.
•TheparticipantsinaKSisregisteredintheRegisterofBusinessEnterprises whilst the Partners in an Internal Partnership remain anonymous. The General partner will be registered.
•InaKStherearerestrictionslinkedtothedistributionoffundsregulated by the Partnership Act. In an internal partnership there are no requirements for paid-in capital, which allows a much greater flexibility in respect of the capital structure and permits distributions to he made solely based on commercial and financial considerations.
•Therearenostatutoryrequirementswhenitcomestocapitalstructure in the Internal Partnership. In a KS the capital structure is governed by the Partnership Act.
•TheGeneralPartner’sclaimagainst theSilentPartners forpayment of uncalled committed capital may he assigned as security to third parties (usually this claim is assigned to the Lender as security for the Loan).
•Taxwisetherearenodifferencesfortheinvestors.
www.fearnleys.no
this report has been produced by fearnley finans shipping As (“ffs”) on a best effort basis and is based upon information accessible to ffs from sources ffs deems reliable. the report is made solely for the use as information to investors in connection with the projects and may not be re- produced or redistributed, in whole or in part, to any other person.
ffs makes no representation or warranty (expressed or implied) as to, and no reliance should be placed on, any information, including projections, estimates, targets and opinions, contained here- in, and no liability whatsoever is accepted as to any errors, omissions or misstatements contained herein, and, accordingly, ffs or any of its group companies or any such person’s officers or employees does not accept any liability whatsoever arising directly or indirectly from the use of this report.
should one or more of the risks or uncertainties materialise, or should underlying assumptions prove to be incorrect, actual results may vary materially from those described in this report. ffs does not assume any obligations for such loss and ffs does not assume any obligation to update or correct the information included in this report.
by receiving this report you acknowledge that you will be solely responsible for your own assessment of the project and the shipping market and that you will conduct your own analysis and are solely responsible for forming your own view of the project.
An investment in the shipping market involves risk and several factors could cause the actual result of the investment. general economic and business conditions, changes in the domestic and foreign markets and laws and regulation and other factors may have an impact on the project and each investors’ investment. if information contained in this report is used as basis for investments, the investor is obliged to check and compare the information herein with the official accounts and information published by the company at all times.
purchase agreement, charter parties and corporate documentation such as partnership agreement and other relevant documentation, can be obtained from ffs.
In addition to Shipping, Fearnley Finans arranges direct investments in real estate aimed at institutional clients and high net worth individuals. Fearnley Finans Eiendom ASA is involved in all sectors of the real estate market – commercial, retail, industrial and residential.
Projects have traditionally been structured as single purpose vehicles, where Fearnley Finans Eiendom ASA is responsible for equity syndication and the arrangement of debt financing. The property team consists of 11 highly dedicated professionals with aggregate experience of approximately 100 years within real estate investments and management.
Over the past 10 years Fearnley Finans Eiendom ASA has been involved in property transactions of approximately EUR 3,9 billion comprising more than 1,7 billion sq.m of property, primarily in the attractive Norwegian market, as well as in other Nordic countries.
For further information, please contact the real estate team.
feArnLey finAns eiendom AsA
projeCt brokers
Christian BullDir. tlf: (+47) 22 93 63 35 Mobil: (+47) 95 81 50 27 [email protected]
Thomas Holtan LeskovskyDir. tlf: (+47) 22 93 63 45 Mobil: (+47) 99 29 13 19 [email protected]
Paul Dehli Navestad Dir. tlf: (+47) 22 93 64 56 Mobil: (+47) 41 65 84 42 [email protected]
Haakon SheteligDir. tlf: (+47) 22 93 63 38 Mobil: (+47) 93 22 74 38 [email protected]
Jonas H. Myrholt (Analyst) Dir: tlf: (+47) 22 93 64 59 Mobil: (+47) 91 30 00 45 [email protected]
Asset mAnAgement
Morten Ring-AndersenDir. tlf: (+47) 22 93 63 36 Mobil: (+47) 97 18 73 48 [email protected]
AdministrAtion And ACCountAnts
Tove Auset (Controller) Dir. tlf: (+47) 22 93 63 46 Mobil: (+47) 98 82 75 56 [email protected]
Andreas Haugbro Dir. tlf: (+47) 22 93 64 51 Mobil: (+47) 90 68 55 22 [email protected]
Tone KågenDir. tlf: (+47) 22 93 63 37 Mobil: (+47) 95 75 80 49 [email protected]
Jarle LomeDir. tlf: (+47) 22 93 64 53 Mobil: (+47) 97 61 58 97 [email protected]
Jan-Trygve RiiseDir. tlf: (+47) 22 93 64 52 Mobil: (+47) 92 82 55 60 [email protected]
Lise Tandberg (Secretary) Dir: tlf: (+47) 22 93 64 48 Mobil: (+47) 92 48 36 69 [email protected]
direCt inVestments in reAL estAte
EiEndomsrapport2012
projeCt brokers
Edvard B. Aaby(Managing Partner) Dir: +47 22 93 63 47 Mob: +47 92 63 36 76 Mail: [email protected]
Eilert H. Lund (Senior Partner) Dir: +47 22 93 63 33 Mob: +47 92 25 63 33 Mail: [email protected]
Tor Kildal (Senior Partner) Dir: +47 22 93 63 39 Mob: +47 95 33 95 39 Mail: [email protected]
Petter Fredrik Bøe (Analyst) Dir: +47 22 93 64 50 Mob: +47 98 85 66 25 Mail: [email protected]
CorporAte mAnAgement
Line Johansen (Controller) Dir: +47 22 93 64 39 Mob: +47 90 73 18 63 Mail: [email protected]
Janne HeglundDir: +47 22 93 63 42 Mob: +47 95 88 59 57 Mail: [email protected]
Anine Myhraas Dir: +47 22 93 64 26 Mob: +47 45 02 26 11 Mail: [email protected]
Hilde ØstbyDir: +47 22 93 63 41 Mob: +47 92 28 70 12 Mail: [email protected]
Lise Tandberg (Secretary) Dir: +47 22 93 64 48 Mob: +47 92 48 36 69 Mail: [email protected]
Visitor’s addressGrev Wedelsplass 9 Oslo, Norway
Postal addressP.O.Box 1158 Sentrum 0107 Oslo, Norway
ContactTel: +47 22 93 60 00 Fax: +47 22 93 63 40 Mail: [email protected]
An Astrup Fearnley Company
www.fearnleys.no