
Shipbuilding Industry in Chinese Taipei
38
OECD Council Working Party on Shipbuilding (WP6) Shipbuilding industry in Chinese Taipei December 2009
-
Upload
gopalakrishnan -
Category
Documents
-
view
30 -
download
0
description
Shipbuilding Industry in Chinese Taipei
Transcript of Shipbuilding Industry in Chinese Taipei

OECD Council Working Party on Shipbuilding (WP6)
Shipbuilding industry in Chinese Taipei
December 2009

2
.

C/WP6(2009)14
3
TABLE OF CONTENTS
THE SHIPBUILDING INDUSTRY IN CHINESE TAIPEI ........................................................................... 4
Introduction .................................................................................................................................................. 4 Overview of the Chinese Taipei shipbuilding industry ............................................................................ 4 Shipbuilding clusters - Geographic distribution of principal construction facilities ................................ 5
Role of shipbuilding in the Chinese Taipei economy .................................................................................. 5 Chinese Taipei economic growth ............................................................................................................. 5 Shipbuilding’s contribution to GDP ......................................................................................................... 6 Shipbuilding Employment ........................................................................................................................ 8 Relationship with other industries ............................................................................................................ 9
Policies of the Chinese Taipei government................................................................................................ 10 General government view of the shipbuilding industry ......................................................................... 10 Role of government ................................................................................................................................ 10 Support given to the industry ................................................................................................................. 11 Financing and guarantee scheme ............................................................................................................ 11 R & D and innovation ............................................................................................................................ 12
Structure of the industry............................................................................................................................. 13 Broad structure of the shipbuilding industry .......................................................................................... 13 Ownership structure and foreign participation ....................................................................................... 13 Workforce (including training and education) ....................................................................................... 14 Access to, and development of, technology ........................................................................................... 15 Role of shipbuilding associations ........................................................................................................... 15 Construction/production capabilities ...................................................................................................... 17
Industry performance ................................................................................................................................. 18 Output and world share of production .................................................................................................... 18 Analysis of order books .......................................................................................................................... 20 Domestic/export production mix ............................................................................................................ 21 Financial performance of the CSBC in Chinese Taipei ......................................................................... 22 Productivity and competitiveness ........................................................................................................... 23
Future developments .................................................................................................................................. 24 General ................................................................................................................................................... 24 Global shipbuilding demand/capacity forecast ...................................................................................... 24 Investment plans ..................................................................................................................................... 26
Summary and conclusions ......................................................................................................................... 27
ANNEX 1 Vessels completed in Chinese Taipei shipyards (1994- 2008) .................................................. 29
ANNEX 2 Shipbuilding worker productivity in selected economies - 2007 .............................................. 30
ANNEX 3 Output per worker by value (USD - 2007) ................................................................................ 31
ANNEX 4 Output per worker by cgt (2007) ............................................................................................... 32
ANNEX 5 New orders q3 2008 to q2 2009 ................................................................................................. 33
ANNEX 6 The main shipyards in Chinese Taipei ...................................................................................... 34
REFERENCES .............................................................................................................................................. 36
4
THE SHIPBUILDING INDUSTRY IN CHINESE TAIPEI
Introduction
Overview of the Chinese Taipei shipbuilding industry
1. Chinese Taipei is an island off the coast of East Asia, and was the 17th largest trading nation in
the world in 2008. Around 90% of its trade depends on sea transportation. There are two main sea ports in
Chinese Taipei; Keelung in the north and Kaohsiung in the south, with Kaohsiung the 8th largest container
port in the world in 2007 (United Nations, 2008). In 2007 the port reached its handling capacity with a
record volume of 10.2 million TEUs.1 A new container terminal is currently under construction that by
2013 will increase handling capacity by 2 million TEUs (Lloyd's List Daily Commercial News, 2008).
The shipbuilding industry plays an important role in Chinese Taipei to promote the development of the
shipping, fishing and national defence industries, and to boost related industrial development, such as the
steel and machinery industries. The Evergreen Marine Corporation, located in Chinese Taipei, is one of
the most important shipping companies in the world.
2. The modern shipbuilding industry in Chinese Taipei commenced in 1948, when the government
established the Taiwan Shipbuilding Corporation (TSBC) at the north Keelung dockyard. Between 1948
and 1956 the TSBC built a number of fishing vessels in support of the development of the fishing industry
in Chinese Taipei. Large scale commercial shipbuilding commenced in 1957 when the US based Ingalls
Shipbuilding Corporation established the Ingalls Taiwan Shipbuilding and Drydock Company, which
rented the TSBC shipyard for its operations, and made important contribution to shipbuilding technologies
and development in Chinese Taipei. Between 1957 and 1962 Ingalls’ delivered a total of 14 vessels,
including two “faith type”, steel ocean-going tankers of 36 000 dwt (deadweight tons).
3. The transfer of steel construction technology by the TSBC allowed local small and medium size
shipbuilders to grow rapidly, by enabling them to build large tonnage, steel commercial and fishing vessels
to meet the growing need of the domestic fleet. In parallel, Chinese Taipei also developed its FRP
(Fibreglass Reinforced Plastics) yacht industry, which now specialises in luxury yachts.
4. An outcome of the government’s prioritisation of shipbuilding, as one the major industries
sectors in the Chinese Taipei economy, was the establishment in 1973 of the China Shipbuilding
Corporation (CSBC) in order to develop a strategic shipbuilding industry in Chinese Taipei. The TSBC
was merged with the CSBC in 1978. The CSBC2 has since played an important role in the global
shipbuilding market through its increasing ability to build large tankers and modern cellular container ships.
The latter have represented a growing proportion of its completions, especially since 2006 (see Annex 1).
1 TEU = Twenty Foot Equivalent Units, a measure of the carrying capacity of cellular container ships.
2 In March 2007 the China Shipbuilding Corporation changed its name to CSBC Corporation, Taiwan.

C/WP6(2009)14
5
Shipbuilding clusters - Geographic distribution of principal construction facilities
5. There are around 126 companies (116 shipyards - including 34 yacht builders - and 10 marine
equipment companies) that make up the shipbuilding industry in Chinese Taipei. In the world shipbuilding
context only the CSBC could be considered as moderately large, while five others are medium sized.
6. The main shipbuilding industry cluster is centred around the southern port of Kaohsiung, which
has an excellent deep sea port and a large industrial hinterland that supports the production of large-sized
ship types, such as 8 000 TEU containerships. Kaohsiung is also a highly developed industrial zone, with
companies operating in the steel, petroleum and machinery sectors.
7. On the other hand, the smaller shipbuilding clusters concentrated in the north-east are less
favourably located, as they need to source both raw materials and fabricated components from the more
industrially developed southern parts of the island.
Role of shipbuilding in the Chinese Taipei economy
Chinese Taipei economic growth
8. In the aftermath of World War II, the development of the Chinese Taipei economy was hampered
by the lack of both natural resources and investment capital. Initially, in the period 1953-1959, this was
addressed by the adoption of an import-substitution policy to restrict dependence on imports, and a focus
on developing agriculture as a key component of the national economy. Between 1959 and1979 an export
expansion policy was implemented, to promote the development of the manufacturing industry, especially
textiles. Since 1979, there have been a series of 10-year economic plans to strengthen the role of industry
in the economy, through the development of high-tech and valued-added sectors such as IT,
telecommunications, electronics, machinery and transport.
9. The impact of these changes has meant that Chinese Taipei’s economic structure had changed
significantly between 1960 ,when agriculture played an important role (27.2% of the economy, with
industry 26.1%: and services 46.7%), and 2008 when agriculture accounted for just 1.8% of the economy,
with industry (25.5%) and services (72.7%) dominating.3
10. With the exception of the downturn in 2001, Chinese Taipei’s economy has grown steadily since
1989, and its GDP reached NTD 12 340 billion (USD 395 billion) in 2008 (Chart 1), which ranked it as the
26th largest economy in the world (World Bank, 2009). Its GDP per capita increased from USD 177 in
1950 to USD 17 116 in 2008.
3 Source from Directorate-General of Budget, Accounting and Statistics, Executive Yuan, Chinese Taipei

6
CHART 1
Chinese Taipei GDP growth rate expressed in local currency (1989-2008)
Source: OECD based on statistics from the Directorate-General of Budget, Accounting and Statistics (DBAS). Executive Yuan, Chinese Taipei.
Shipbuilding’s contribution to GDP
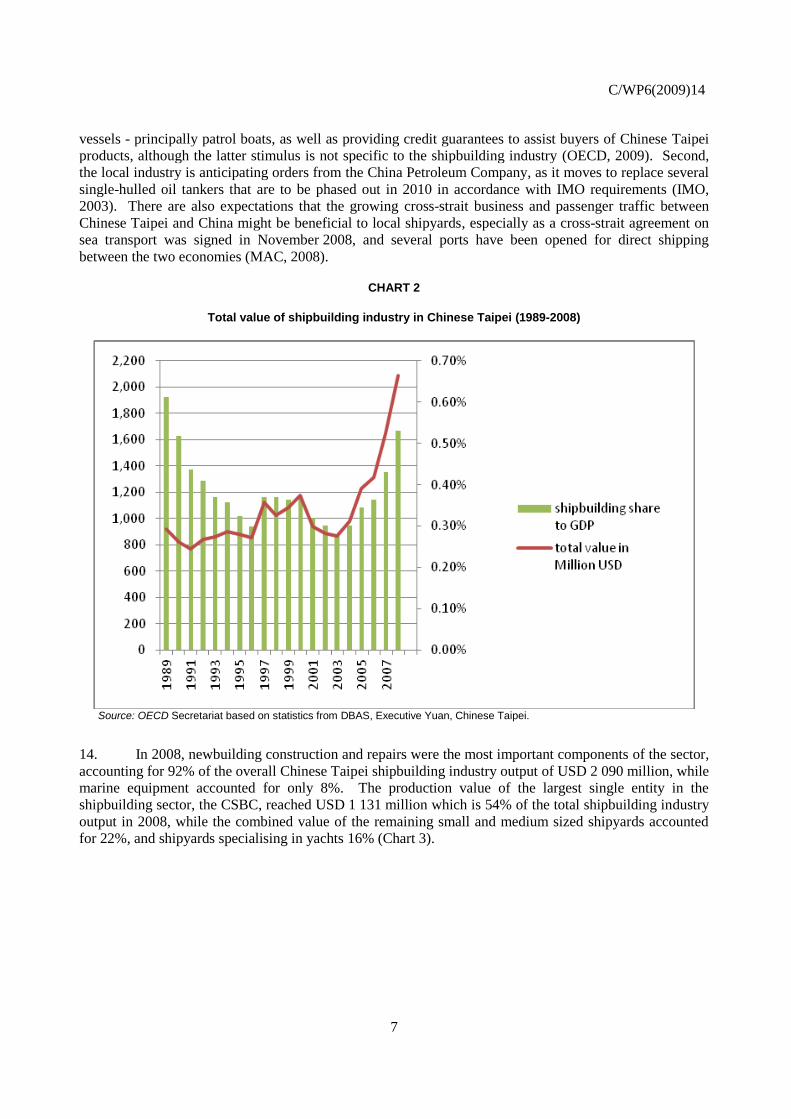
11. The total value of output generated by shipbuilding in Chinese Taipei (construction, conversions,
repairs and marine equipment) reached USD 1,641 million in 2007, and USD 2 090 million in 2008.
While the value of shipbuilding output has been steadily increasing since 1989, its contribution to GDP has
fluctuated over that period, and only on three separate occasions has it exceeded 0.5% of GDP (Chart 2). It
also fell below 0.3% in some years, indicating that comparatively shipbuilding was not performing as well
as other sectors of the economy. This trend has reversed in the last several years, perhaps reflecting the
strong global demand for new vessels over the last several years. However, the impact of the current
financial crisis is not yet reflected in these data.
12. Even though the shipbuilding industry only makes a comparatively moderate contribution to
GDP compared to other industries, it nevertheless continues to play an important role in Chinese Taipei’s
economy, principally from the perspective of employment and industrial capacity. Since shipbuilding is a
traditional industry in the south, employment in the sector is also significant to regional development, a
feature which the industry in Chinese Taipei shares with a number of other economies with shipbuilding
sectors.
13. There are a number of other factors that could help the shipbuilding industry retain, or perhaps
strengthen, its future role in the overall economy. First, to counteract the 2008 economic downturn the
government has announced stimulus measures, costing around USD 0.8 billion, to renew public service
C/WP6(2009)14
7
vessels - principally patrol boats, as well as providing credit guarantees to assist buyers of Chinese Taipei
products, although the latter stimulus is not specific to the shipbuilding industry (OECD, 2009). Second,
the local industry is anticipating orders from the China Petroleum Company, as it moves to replace several
single-hulled oil tankers that are to be phased out in 2010 in accordance with IMO requirements (IMO,
2003). There are also expectations that the growing cross-strait business and passenger traffic between
Chinese Taipei and China might be beneficial to local shipyards, especially as a cross-strait agreement on
sea transport was signed in November 2008, and several ports have been opened for direct shipping
between the two economies (MAC, 2008).
CHART 2
Total value of shipbuilding industry in Chinese Taipei (1989-2008)
Source: OECD Secretariat based on statistics from DBAS, Executive Yuan, Chinese Taipei.
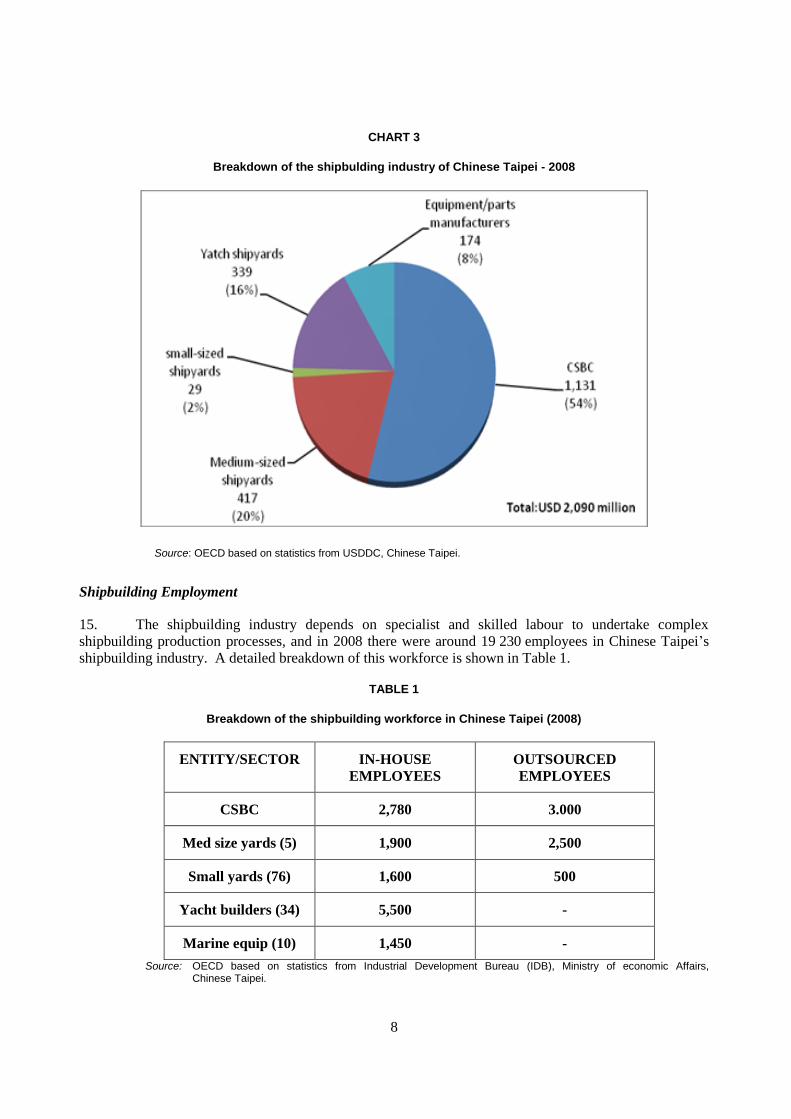
14. In 2008, newbuilding construction and repairs were the most important components of the sector,
accounting for 92% of the overall Chinese Taipei shipbuilding industry output of USD 2 090 million, while
marine equipment accounted for only 8%. The production value of the largest single entity in the
shipbuilding sector, the CSBC, reached USD 1 131 million which is 54% of the total shipbuilding industry
output in 2008, while the combined value of the remaining small and medium sized shipyards accounted
for 22%, and shipyards specialising in yachts 16% (Chart 3).
8
CHART 3
Breakdown of the shipbulding industry of Chinese Taipei - 2008
Source: OECD based on statistics from USDDC, Chinese Taipei.
Shipbuilding Employment
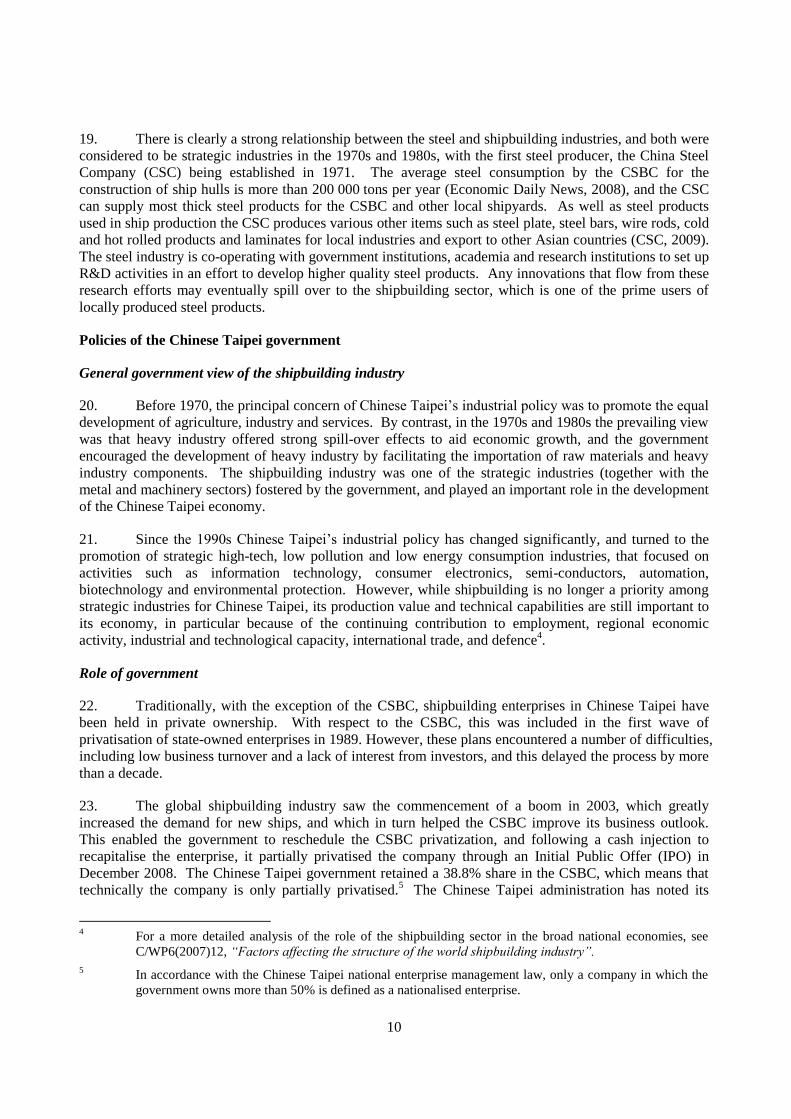
15. The shipbuilding industry depends on specialist and skilled labour to undertake complex
shipbuilding production processes, and in 2008 there were around 19 230 employees in Chinese Taipei’s
shipbuilding industry. A detailed breakdown of this workforce is shown in Table 1.
TABLE 1
Breakdown of the shipbuilding workforce in Chinese Taipei (2008)
ENTITY/SECTOR IN-HOUSE
EMPLOYEES
OUTSOURCED
EMPLOYEES
CSBC 2,780 3.000
Med size yards (5) 1,900 2,500
Small yards (76) 1,600 500
Yacht builders (34) 5,500 -
Marine equip (10) 1,450 -
Source: OECD based on statistics from Industrial Development Bureau (IDB), Ministry of economic Affairs, Chinese Taipei.

C/WP6(2009)14
9
16. While the local shipbuilding workforce is considered to be comparatively skilled, it is not large,
and shipyards claim that there is a lack of well trained shipbuilding personnel. A 2007 study on the
training of shipbuilding professionals, conducted by the Ministry of Education showed that most students
had little interest in the shipbuilding industry, and considered that they had more opportunities in high–tech
sectors, which offered higher salaries and better benefits (Ministry of Education, 2007). These perceived
attitudes of young people towards shipbuilding would probably explain their reluctance to enter the
industry.
Relationship with other industries
17. While shipbuilders in Chinese Taipei need to import many important components, this does not
mean that it has no domestic production of marine equipment and components. Indeed, in 2008 production
by this sector reached USD 171 million, which represented 8% of the total value of shipbuilding industry
(see also Chart 3). Local producers can provide domestic shipyards with items such as small and medium
sized propellers (especially below three metres in diameter) as well as other equipment such as cranes,
valve units, electrical equipment and laminated safety glass. However, local shipyards must still import
many high value components, such as engines, electrical generators, automation systems and navigation
equipment from Japan, South Korea and Europe. While the local industry has attempted to develop and
manufacture some high value marine equipments, such as engines, the projects have been unsuccessful,
largely due to the comparatively small scale of the local shipbuilding industry.
18. The local marine equipment sector has achieved some export success with some of the more
specialised products, in particular ship propellers, where annual production has increased by over 20%
(IDB, 2006). Nevertheless, the export of locally produced marine equipments is limited, and amounted to
around USD 124 million in 2008 (see Chart 4).
CHART 4
Trade of marine equipment for Chinese Taipei in 2008
Marine equipment for Chinese Taipei in 2008 (unit:USD)
15 446 581
2 221 829
2 445 723
17 938 462
27 609 008
4 004 012
12 284 299
39 610 500
2 503 389
124 063 802
1 430 530
14 785 248
138 574 150
3 500 031
15 982 197
2 839 925
23 296 063
177 574 388
12 340 914
390 323 446
Laminated safety glass
i ronsteel masts , ra i l s and parts of
hul ls
pis ton engines ,marine propuls ion
Parts of s teering and rudder
equipment for ships
Ships ' or boat's propel lers and blades
therefor
Electric wave sounders and
navigational a id apparatus
wiring sets
Suppl ies required for repairing and
bui lding of vessels
Other
Total
export import
Source: OECD based on statistics from Board of Foreign Trade, Ministry of Economic Affairs, Chinese Taipei.
10
19. There is clearly a strong relationship between the steel and shipbuilding industries, and both were
considered to be strategic industries in the 1970s and 1980s, with the first steel producer, the China Steel
Company (CSC) being established in 1971. The average steel consumption by the CSBC for the
construction of ship hulls is more than 200 000 tons per year (Economic Daily News, 2008), and the CSC
can supply most thick steel products for the CSBC and other local shipyards. As well as steel products
used in ship production the CSC produces various other items such as steel plate, steel bars, wire rods, cold
and hot rolled products and laminates for local industries and export to other Asian countries (CSC, 2009).
The steel industry is co-operating with government institutions, academia and research institutions to set up
R&D activities in an effort to develop higher quality steel products. Any innovations that flow from these
research efforts may eventually spill over to the shipbuilding sector, which is one of the prime users of
locally produced steel products.
Policies of the Chinese Taipei government
General government view of the shipbuilding industry
20. Before 1970, the principal concern of Chinese Taipei’s industrial policy was to promote the equal
development of agriculture, industry and services. By contrast, in the 1970s and 1980s the prevailing view
was that heavy industry offered strong spill-over effects to aid economic growth, and the government
encouraged the development of heavy industry by facilitating the importation of raw materials and heavy
industry components. The shipbuilding industry was one of the strategic industries (together with the
metal and machinery sectors) fostered by the government, and played an important role in the development
of the Chinese Taipei economy.
21. Since the 1990s Chinese Taipei’s industrial policy has changed significantly, and turned to the
promotion of strategic high-tech, low pollution and low energy consumption industries, that focused on
activities such as information technology, consumer electronics, semi-conductors, automation,
biotechnology and environmental protection. However, while shipbuilding is no longer a priority among
strategic industries for Chinese Taipei, its production value and technical capabilities are still important to
its economy, in particular because of the continuing contribution to employment, regional economic
activity, industrial and technological capacity, international trade, and defence4.
Role of government
22. Traditionally, with the exception of the CSBC, shipbuilding enterprises in Chinese Taipei have
been held in private ownership. With respect to the CSBC, this was included in the first wave of
privatisation of state-owned enterprises in 1989. However, these plans encountered a number of difficulties,
including low business turnover and a lack of interest from investors, and this delayed the process by more
than a decade.
23. The global shipbuilding industry saw the commencement of a boom in 2003, which greatly
increased the demand for new ships, and which in turn helped the CSBC improve its business outlook.
This enabled the government to reschedule the CSBC privatization, and following a cash injection to
recapitalise the enterprise, it partially privatised the company through an Initial Public Offer (IPO) in
December 2008. The Chinese Taipei government retained a 38.8% share in the CSBC, which means that
technically the company is only partially privatised.5 The Chinese Taipei administration has noted its
4 For a more detailed analysis of the role of the shipbuilding sector in the broad national economies, see
C/WP6(2007)12, “Factors affecting the structure of the world shipbuilding industry”.
5 In accordance with the Chinese Taipei national enterprise management law, only a company in which the
government owns more than 50% is defined as a nationalised enterprise.
C/WP6(2009)14
11
intention of further reducing its interest in CSBC, but has not announced any timetable for this, beyond
noting that it would follow the recovery of the shipbuilding industry from the global economic downturn.
24. While the administration has expressed its intention to remain at arm’s length from the day to day
running of the company, it nevertheless controls what is probably the largest single shareholding, and
would be able to influence the enterprises’ decision making if it so wished.
25. One of the objectives of privatisation, was to give the CSBC greater commercial flexibility to
build its business model (based on specialising in the construction of container ships) and a focus on
customer services (Economic Daily News, 2008). For its part the government would focus on facilitating
technology upgrades, job training and R&D in order to assist the CSBC and other local shipbuilders to face
market challenges.
26. With shipbuilding no longer considered to be a strategic industry, the government has adopted a
lower key industrial policy focused on supporting R&D, training and design. The key policy body for
shipbuilding in Chinese Taipei is the Industry Development Bureau (IDB) under the Ministry of Economic
Affairs, which is responsible for planning and implementing shipbuilding policies. In 2005 the IDB
announced a 10-year Action Plan for the shipbuilding industry (IDB, 2005), which set the target of
shipbuilding production value reaching USD 2.5 billion by 2015, and set the following specific objectives
(amongst others for the marine sector) :
To become the third largest producer in the world of containership of 1 000 TEU to
10 000 TEUs.
To become the third largest producer of large, luxury yachts.
Support given to the industry
27. The shipbuilding industry is highly complex, and integrates a wide range of supporting industries.
The Chinese Taipei administration has adopted a national industrial strategy that minimizes government
involvement, and has advised that it does not provide specific incentives, subsidies or other direct support
measures to the shipbuilding industry. It has been reported that in 2004 the Ministry of Economic Affairs
proposed the establishment of a fund to help develop the shipbuilding industry, but this was rejected
(National Chiao-Tung University, 2004). It is understood that the shipbuilding industry believes that the
lack of a clear-cut shipbuilding policy by the government could hinder future prospects in face of
international competition.
28. However, in order to assist the industry to achieve objectives set by the 10-year Action Plan, the
government provides some indirect assistance through the United Ship Design and Development Center
(USDDC), a semi-government body established in 1976 under the sponsorship of the Ministries of
Economic Affairs, Communications, and Education, and with support provided by the CSBC, the Chinese
Petroleum Corporation, the China Corporation Register of Shipping and the Administration Bureaus of
Keelung and Kaohsiung Harbours. The USDDC provides technical services to help local shipyards to
design higher-valued ship types in conformity with the concepts of environment protection and energy
saving. While the shipyards in Chinese Taipei generally pay for the services of the USDDC, it is
understood that at least some are funded, or co-funded by the Chinese Taipei government.
Financing and guarantee scheme
29. While the Chinese Taipei government expects the competitiveness of the shipbuilding industry to
be derived from its productivity and the quality of its products and services, it does nevertheless provide
some credit assistance to assist local shipbuilders as well as local and foreign ship owners.

12
30. This is done through the government owned Chinese Taipei Export-Import Bank (Eximbank),6
which was established in 1979 with the aim of facilitating export and import trade through export credit,
insurance, relending facilities and other various kinds of financing facilities. Local and foreign ship buyers
or ship owners can apply for shipbuilding credit from Eximbank at interest rates that are either set by the
bank or negotiated with the ship buyers. The maximum amount of credit provided cannot exceed 80% of
the total amount of the shipbuilding contract. The Eximbank also provides shipbuilding guarantees to help
manufacturers to develop emerging markets, and to encourage local ship owners to purchase from local
shipbuilders.
31. In addition, in October 2008 the Chinese Taipei government announced a credit guarantee plan of
around USD 3 billion in response to the economic downturn. This plan, which was general in nature, but
available to the shipbuilding industry, provides credit guarantees for firms which were promising, but short
of collateral necessary to obtain finance from financial institutions. The plan, which is due to expire at the
end of December 2009, can provide assistance of up to USD 3.3 million per firm (OECD 2009). Advice
from the Chinese Taipei authorities is that the shipbuilding industry has not availed itself any of these
credit and guarantee facilities.
R & D and innovation
32. As the only design house servicing the Chinese Taipei shipbuilding industry, the United Ship
Design and Development Center (USDDC) provides planning and consultancy for both public and private
enterprises in the shipbuilding, shipping and marine development sectors. Its services include ship design,
technical services and R&D. It participates regularly in international shipbuilding exhibitions and
exchanges industrial experiences with shipbuilding associations in other economies. The USDCC has
completed contract designs for over 70 ship types, including bulk carriers, container ships, crude oil
tankers, product carriers, research vessels, fishing vessels, tug boats, and patrol boats of various kinds, and
its designs have been utilized in the construction of 215 vessels (Shipnet, 2009). In addition, technical
services are provided for both new buildings and conversions, including development of owner's
requirements, contract specification reviews, drawing reviews, equipment inspections and on-site
supervision.
33. The USDDC has undertaken ad-hoc R&D projects, financed by the Ministry of Economic Affairs,
in partnership with shipbuilding companies, and one of its principal R&D tasks has been the development
of techniques to improve the accuracy of calculating the effects of pressure and resistance on hulls of
ocean-going vessels, in order to improve ship quality. The USDDC has also undertaken several special
projects in the field of vibration noise analysis, ship load and structure response and propeller cavitations.
In response to the need for increased environmental protection the USDDC has also focused its R&D on
integrating solar and wind power into ship propulsion systems. In the future, the USDDC aims to become a
centre of design for high-performance ships and to integrate marine technology research and marine
development in Chinese Taipei.
34. In addition to the USDDC, R&D is also undertaken by individual enterprises. For example, to
reduce fuel consumption, shipping costs and environmental pollution, the CSBC carried out between 2006
and 2008 a project known as the ES-10, to develop energy-saving technologies aimed at an overall 10%
reduction in energy use, using existing 1 700 TEU container ship as research targets. Following the
success of that project the CSBC is now undertaking the ES-20 project which, as its name implies, is
seeking energy savings of around 20%.
6 For further details of credit and guarantee facilities available to the shipbuilding industry in Chinese Taipei
please see www.eximbank.com.tw
C/WP6(2009)14
13
Structure of the industry
Broad structure of the shipbuilding industry
35. Chinese Taipei's shipyards have the capacity to build a variety of commercial, naval and pleasure
craft, using different types of materials, including steel (for merchant ships and fishing vessels), aluminium
(fast ferries and patrol boats), fibreglass-reinforced-plastic (yachts, fishing vessels), and wood (yachts or
police boats) (USDDC 2005). Of the 116 local shipyards, 70% are small, with less than 50 employees,
while the remainder could be categorised as small to medium. The CSBC is the only large shipyard (by
international standards) on the island (See Table 2 and Annex 6 for more details).
36. The CSBC has two main production facilities in Keelung and Kaohsiung, and produces over 50%
of the total value of the Chinese Taipei shipbuilding industry. The CSBC has a workforce of around
2 800 employees of whom about 270 are dedicated to R&D. The CSBS mainly produces merchant vessels
and has a 1 million dwt dry dock (950m x 92m x 14m) in Kaohsiung, which is one of the largest in the
world. It also operates a 130 000 dwt dry dock (275m x 45m x 10m) in Keelung. It has been increasingly
specialising in containerships of between 1 700 TEU and 8 000 TEU, which it sees as both an area of
expertise for its yards, and a market segment where its vessels could be highly competitive. Both
dockyards have comprehensive facilities to also provide various kinds of maintenance services.
37. As well as CSBC, Chinese Taipei also has a large number of small and medium size shipyards
that are located around cities such as of Keelung, Tao Yuan, Tainan and Kaohsiung. These yards have the
capability to build a range of smaller commercial vessels, such as oil and chemical tankers up to 15 000 gt,
general product carriers, high-tech research vessels as well as patrol and fishing vessels. The Jong-Shyn
Shipbuilding Group, has a dock capable of handling vessels up to 50 000 dwt, but now specialises in
smaller-sized patrol, passenger and fishing boats. These yards also have extensive ship repair and
conversion facilities.
38. The largest shipbuilding enterprise in Chinese Taipei that is fully privately owned is Ching Fu
Shipyards (CFS), which was created in 2002 when it merged with the Fong-Kuo yards.7 According to its
web site CFS is capable of constructing oil and chemical tankers up to 15 000 tons as well as a variety of
other vessels.
39. These smaller yards are well positioned to develop niche markets, and generally would be
unlikely to compete directly with the larger vessels being targeted by the CSBC, especially the large,
sophisticated cellular container vessels that are a key component of the CSBC’s business strategy.
Ownership structure and foreign participation
40. As described earlier, with the exception of the CSBC which is partially privatised (with 38.8% of
its shares still owned by the government), the remaining enterprises in Chinese Taipei’s shipbuilding
industry are held in private ownership. Given the Chinese Taipei administration’s stated approach of
minimal involvement in the shipbuilding industry, and the sector’s loss of its status as a strategic industry,
it can be assumed that the fully private enterprises would have relative freedom to determine their
commercial strategies, and would be constrained only by their need to adhere (it is assumed voluntarily) to
government policies and directions (for example the 10-year Action Plan described earlier). The impact of
the partial government ownership on the CSBC is less clear, but it is understood that administration
adheres to its stated policy of non-interference.
7 See, http://www.cfsb.com.tw

14
41. In an apparent response to the 10 year Action plan which set the industry the objective of
becoming the third largest producer of cellular container ships, in 2008 the CSBC adopted as a business
strategy a focus on cellular container vessels, especially those with higher TEU capacity. However, as
with most shipbuilders around the world, the CSBC strategy has to some extent been hindered by the
economic downturn, which has seen a sharp fall in world trade, and consequently a drop in demand for all
vessel types, including container ships. Also in line with other ship builders the CSBC has experienced a
sharp drop in new vessel orders, as well as requests for the delay or cancellation of orders already placed,
as ship buyers struggle to put together suitable financing packages. It has been reported that the CSBC will
try to address the downturn by seeking more orders from local companies or government authorities, and
by partially putting to one side plans for specialisation by diversifying into the construction of other types
of vessels, including more sophisticated and custom-made commercial vessels (Economic Daily News,
2008).
42. While there are no significant restrictions on foreign investment in Chinese Taipei,8 neither are
there specific measures or incentives to encourage such investments, which can take the form of joint
ventures, the establishment of 100% foreign owned companies, ownership of shares and mergers and
acquisitions. While in practice the government has generally taken a positive and open attitude towards
foreign investment in the local shipbuilding industry, it is understood that there has been little foreign
participation in local yards. In particular, while some foreign interest was shown in the partial privatisation
of the CSBC in 2008, this did not result in any significant foreign investment in the enterprise.
Workforce (including training and education)
43. Despite the increasing role of automation, shipbuilding is still a labour intensive industry, and
labour costs remain a major cost input for shipyards. Advice from the industry is that those costs are
relatively high in Chinese Taipei, and are increasing. This could have an effect on the competitiveness of
the local industry.
44. As noted earlier, the shipbuilding industry suffers from a poor perception amongst new entrants
in the workforce, who believe that there are better opportunities in other parts of the economy, and the
industry claims that the number and quality of shipbuilding professionals do not meet its needs. However,
there is a well developed educational feeder system to train workers in shipbuilding related disciplines.
For example, the National Taiwan Ocean University has departments dealing with Marine Engineering,
Systems Engineering and Naval Architecture, and associated departments dealing with related skills that
would be relevant to the shipbuilding sector.9 Similarly, the National Taiwan University also has a strong
College of Engineering that would train students in skills relevant to the shipbuilding sector, including
courses in Engineering Science and Ocean Engineering. The University is also the home of the Hydrotech
Research Institute, which can undertake research and training in disciplines such as fluid mechanics10
.
45. The government has also participated in establishing some training networks in cooperation with
universities to upgrade the quality of human resources in the shipbuilding industry. For example, the
Ministry of Education, in cooperation with the Marine Education Enforcement Project Office has promoted
the “2008-11 Marine Education Enhancement Project (MEEP)” and the 2007 “Plan for Marine Science and
Technology” (Ministry of Education, 2008), which aim to build partnership networks between the
shipbuilding departments of some local universities with shipyards, to provide students with practical
techniques in ship construction and to develop the capability of students in the field of ship design.
8 It is understood that the only exceptions are for minor repairs of boats and ships (MOEAIC, 2004)
9 See http://english.ntou.edu.tw
10 See http://www.ntu.edu.tw/english

C/WP6(2009)14
15
46. The USDDC also implements, under the auspices of the Ministry of Economic Affairs, the “Plan
for blue collar and white collar professionals in the shipbuilding industry” which commenced in 2007 and
aims to provide on-the-job training in R&D and ship construction, and promotes ship design by means of
3D Computer Aided Design (CAD) techniques. The USDDC and some local shipyards also provide
scholarships for students of shipbuilding departments in local universities to encourage skilled young
people to enter the industry.
Access to, and development of, technology
47. As well as undertaking R&D and developing new techniques, the USDDC also encourages local
shipbuilding companies to build up industrial e-business environments by using the Internet and the latest
web information technologies, and several ship and yacht building, and marine equipment networks have
been established. The networks have become important platforms to help shipyards and manufacturers to
release and exchange industrial information domestically and internationally, and are intended to
strengthen the competitiveness of small and medium-size local shipyards.
48. As the largest shipyard in Chinese Taipei, the CSBC designs high performance vessels that can
be increasingly constructed with automated techniques to increase productivity. As well as practical
designs, the CSBC also develops solutions for specific construction processes and technical problems,
including using innovative technologies, such as three-dimensional techniques, to produce customised hull
designs.
Role of shipbuilding associations
49. The two principal shipbuilding associations in Chinese Taipei are the Taiwan Shipbuilding
Association (TSBA) and the Taiwan Yacht Industry Association (TYIA). The TSBA has 88 members and
the TYIA 77 members. The roles of these two associations are similar to other shipbuilding associations in
other countries, and their objectives generally encompass the following activities:
Research, data collection, statistical outputs.
Technical co-operation, technical training; organization of workshops.
Common industry rules and approaches (in relation to production and distribution).
Promotion of the sector (including export promotion, participation in international
exhibitions).
Public information activities.
Implementation of government policies, and advice to the government.
Mediation of trade and labour disputes.
Investigation of supply and demand and sources of raw materials.

16
TABLE 2
New building and repair yards in Chinese Taipei
Shipyard name Construction/production capabilities
CSBC There is a 1 million dwt dry dock (950m x 92m x 14m) in
Kaohsiung shipyard, which can construct medium and large size
merchant ships, deck cargo carriers, oil drilling rigs and offshore
production platforms. Recently, it has mainly produced cellular
container vessels of between 4 000 and 8 000 TEU
CSBC also operates a 130 000 dwt dry dock (275m x 45m x 10m)
in Keelung. It can construct medium sized merchant ship of
between 100 000 dwt and 150 000 dwt. However, in recent years,
it has also mainly constructed containerships in the range of
1 700 TEU to 8 000 TEU. As well as construction capability, both
shipyards have complete facilities to offer various types of
maintenance services.
Jong-Shyn Shipbuilding Group Co.
Ltd This shipyard has 50 000 dwt semi-dry dock, several floating
docks and a slipway. It can provide ship designs in line with the
owner's project requirements.
This shipyard has built more than four hundred ships, including all
sizes of deep-sea fishing vessels, patrol crafts, cruisers, ferries,
working ships, tugboats and aluminium speedboats, in the last
twenty years. More than six hundred ships are maintained and
refitted by Jong Shyn for the Navy, Coast Guard and private
companies.
Ching-Fu Shipbuilding This shipyard established in 1991, has two dry docks (100 m x
30m and 80m x 25m), several mooring winch machines and
gantry cranes.
It can provide comprehensive modification and maintenance
services for various ship types, and has repaired a wide range of
vessels including oil tankers, general cargo, deep sea fishing
vessels, bulk carriers, and other smaller boat types.
It can carry out conversion work to lengthen hulls for vessels of
less than 100m, and can install various helicopter platforms and
other special modification works.
Fong-Kuo Shipbuilding Established in 1965, this was the first private company to build
sea-going steel vessels, and has one dry dock (100m x 21m) and
gantry cranes.
It can design and produce tug boats, barges, fishing research
vessels, purse seine, squid vessels, patrol boats and ferry boats,
and can also provide repair services, lengthen hulls and undertake
other special modifications.
Shipyard name Construction/production capabilities
Shing- Sheng -Fa Boatbuilding This shipyard was established in 1970 to develop coastal and
pelagic fishing vessels.
It mainly produces fishing boats and passenger vessels to a
maximum of 199gt for domestic and foreign markets.
C/WP6(2009)14
17
Chien-Fu Shipbuilding This shipyard was established in 1942, and has 40 000 square
meters of construction area.
It specialises in Fibreglass Reinforced Plastics fishing boats of
more than 100 gt, and can provide repair services.
Lung-Teh Shipbuilding This shipyard, established in 1979 can produce aluminium and
steel patrol boats, search and rescue boats, fire boats, pilot boats,
passenger boats, ferry boats, research boats and yachts with length
less than 40 meters.
It designs vessels to customer specification and can provide
regular/overhaul maintenance for various types of ships. It also
can convert and modify small vessels to increase their capacity.
Source: Compiled by the OECD based on information from USDDC, Chinese Taipei and companies’ websites.
Construction/production capabilities
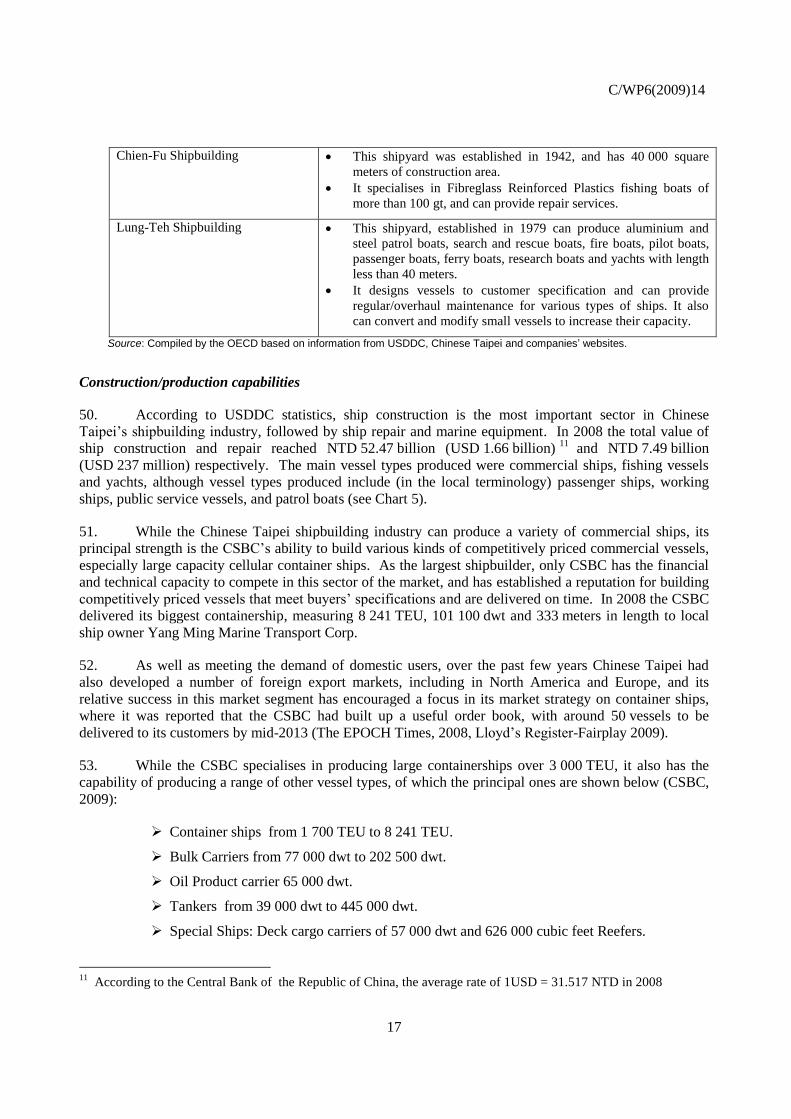
50. According to USDDC statistics, ship construction is the most important sector in Chinese
Taipei’s shipbuilding industry, followed by ship repair and marine equipment. In 2008 the total value of
ship construction and repair reached NTD 52.47 billion (USD 1.66 billion)11
and NTD 7.49 billion
(USD 237 million) respectively. The main vessel types produced were commercial ships, fishing vessels
and yachts, although vessel types produced include (in the local terminology) passenger ships, working
ships, public service vessels, and patrol boats (see Chart 5).
51. While the Chinese Taipei shipbuilding industry can produce a variety of commercial ships, its
principal strength is the CSBC’s ability to build various kinds of competitively priced commercial vessels,
especially large capacity cellular container ships. As the largest shipbuilder, only CSBC has the financial
and technical capacity to compete in this sector of the market, and has established a reputation for building
competitively priced vessels that meet buyers’ specifications and are delivered on time. In 2008 the CSBC
delivered its biggest containership, measuring 8 241 TEU, 101 100 dwt and 333 meters in length to local
ship owner Yang Ming Marine Transport Corp.
52. As well as meeting the demand of domestic users, over the past few years Chinese Taipei had
also developed a number of foreign export markets, including in North America and Europe, and its
relative success in this market segment has encouraged a focus in its market strategy on container ships,
where it was reported that the CSBC had built up a useful order book, with around 50 vessels to be
delivered to its customers by mid-2013 (The EPOCH Times, 2008, Lloyd’s Register-Fairplay 2009).
53. While the CSBC specialises in producing large containerships over 3 000 TEU, it also has the
capability of producing a range of other vessel types, of which the principal ones are shown below (CSBC,
2009):
Container ships from 1 700 TEU to 8 241 TEU.
Bulk Carriers from 77 000 dwt to 202 500 dwt.
Oil Product carrier 65 000 dwt.
Tankers from 39 000 dwt to 445 000 dwt.
Special Ships: Deck cargo carriers of 57 000 dwt and 626 000 cubic feet Reefers.
11
According to the Central Bank of the Republic of China, the average rate of 1USD = 31.517 NTD in 2008
18
CHART 5
Main ship types produced in Chinese Taipei
Source: USDDC, Chinese Taipei.
Industry performance
Output and world share of production
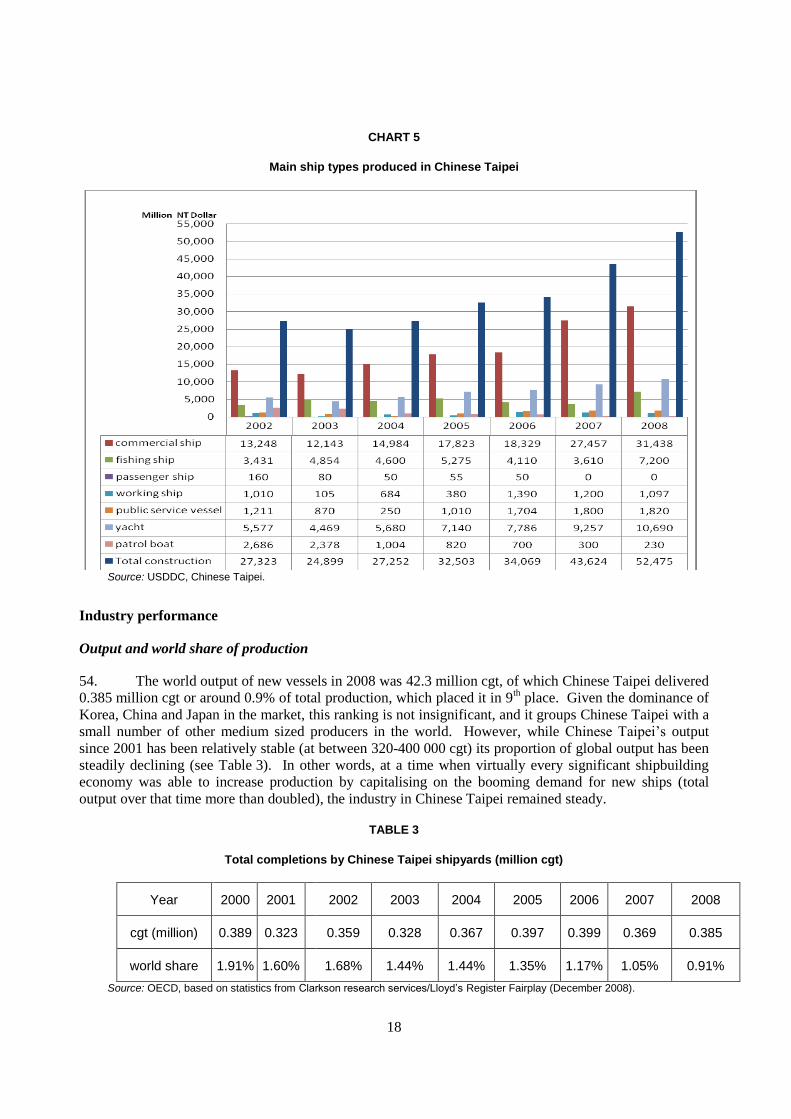
54. The world output of new vessels in 2008 was 42.3 million cgt, of which Chinese Taipei delivered
0.385 million cgt or around 0.9% of total production, which placed it in 9th place. Given the dominance of
Korea, China and Japan in the market, this ranking is not insignificant, and it groups Chinese Taipei with a
small number of other medium sized producers in the world. However, while Chinese Taipei’s output
since 2001 has been relatively stable (at between 320-400 000 cgt) its proportion of global output has been
steadily declining (see Table 3). In other words, at a time when virtually every significant shipbuilding
economy was able to increase production by capitalising on the booming demand for new ships (total
output over that time more than doubled), the industry in Chinese Taipei remained steady.
TABLE 3
Total completions by Chinese Taipei shipyards (million cgt)
Year 2000 2001 2002 2003 2004 2005 2006 2007 2008
cgt (million) 0.389 0.323 0.359 0.328 0.367 0.397 0.399 0.369 0.385
world share 1.91% 1.60% 1.68% 1.44% 1.44% 1.35% 1.17% 1.05% 0.91%
Source: OECD, based on statistics from Clarkson research services/Lloyd’s Register Fairplay (December 2008).
C/WP6(2009)14
19
55. There are a number of possible explanations for apparent inability of the Chinese Taipei
shipbuilding industry to tap into the very rapidly expanding market since 2000, but the explanation offered
by the industry12
was that the CBSC (the only enterprise in Chinese Taipei producing larger sized
commercial vessels) had not added to its shipbuilding capacity, so that its yards were working at close to
full capacity during that period. In addition, other yards in Chinese Taipei capable of producing
commercial vessels focused instead on fishing vessels and ship repair activities, hence the overall slide in
market share in recent years.
56. While the response by the Chinese Taipei shipbuilding industry not to increase capacity to tap
into a booming global market over an extended period seems counter-intuitive from a commercial
perspective, the OECD has no other information available that would negate this.
57. Over this period Chinese Taipei yards produced a moderately wide range of different ship types,
but production has increasingly focussed on container ships, especially since 2006 (see Annex 1).
However, while production has concentrated on container vessels, the Chinese Taipei yards have only
made modest gains in efforts to capture an increasing proportion of the overall containership market, which
in gt terms was 3.1% in 2006, 3.1% in 2007, and 3.7% in 2008.
58. A more detailed analysis of the performance of the shipbuilding industry in Chinese Taipei over
recent years provides some further insights into the industry’s performance highlights. Table 4 below
provides snapshots of the output performance of a number of selected shipbuilding economies in 2000,
2004 and 2008. This table indicates that while Chinese Taipei’s share of the world shipbuilding market
has declined (as was detailed in Table 3 above), it has nevertheless been able to retain its relative position
in the ranking, so that its 9th ranking in 2008 is identical to its rank in 2000.
59. The reason for this is that while over that period some economies have grown faster than Chinese
Taipei, and have overtaken it on the rankings (for example Turkey and Romania), others that were ahead in
2000 (such as Spain and the Netherlands) have performed less well, and have slipped behind Chinese
Taipei. On this basis the performance of Chinese Taipei is quite commendable, because while many
shipbuilding economies lost market share over that period, Chinese Taipei at least managed to hold its
ranking on the basis of production.
60. However, the issue confronting Chinese Taipei (as well as a number of other shipbuilding
economies) is that some formerly quite small producers have managed to significantly increase their
market shares. Table 4 quite clearly indicates that a number of these economies, all of them in the Asian
region, were able to increase their market share so as to move from very low rankings in 2000, to be in the
top 15 in 2008. More importantly, they still appear to be growing quite quickly. Additional analysis later
in the report of the Order Books and recent New Orders will provide additional insights of what this may
mean in the future for the Chinese Taipei shipyards.
12
Correspondence between the CSBC and the OECD Secretariat.

20
TABLE 4
World ranking based on shipbuilding output – Selected economies
2008 Economy 2008 2004 2000 2000
Rank 000 cgt % 000 cgt % 000 cgt % Rank
1 Korea 14,630 34.59% 8,348 32.79% 6,482 31.86% 1
2 Japan 9,762 23.08% 7,996 31.40% 6,409 31.50% 2
3 China 9,253 21.88% 2,929 11.50% 1,146 5.63% 3
4 Germany 1,172 2.77% 873 3.43% 917 4.51% 4
5 Turkey 818 1.93% 256 1.01% 104 0.51% 18
6 Italy 748 1.77% 688 2.70% 623 3.06% 5
7 Poland 580 1.37% 478 1.88% 548 2.69% 6
8 Romania 534 1.26% 306 1.20% 231 1.14% 15
9 Chinese Taipei 385 0.91% 368 1.45% 389 1.91% 9
10 Philippines 309 0.73% 107 0.42% 99 0.49% 19
11 Malaysia 309 0.73% 95 0.37% 28 0.14% 27
12 Spain 285 0.67% 369 1.45% 527 2.59% 7
13 Indonesia 287 0.68% 88 0.35% 56 0.28% 24
14 Denmark 264 0.62% 192 0.75% 258 1.27% 12
15 Vietnam 256 0.61% 62 0.24% 3 0.01% neg*
16 Netherlands 213 0.50% 287 1.13% 447 2.20% 8
Rest World 2,491 5.89% 2,019 7.93% 2,079 10.22%
Total 42,296 100.00% 25,461 100.00% 20,346 100.00%
* neg = negligible output did not permit accurate ranking.
Source: Lloyd’s Register-Fairplay: World Fleet Statistics.
Analysis of order books
61. In the June quarter of 2009 (the most recent consistent data available), based on the size of the
order book, Chinese Taipei’s shipbuilding industry ranked as 11th in the world (Table 5), which if left
undisturbed by the effects of the economic crisis (that is, through cancellations or deferrals) represents
around 4 years work for the Chinese Taipei shipyards. This ranking is more or less consistent with
Chinese Taipei’s recent performance, although for some years it had consistently held 8th place.
62. The world order book has changed significantly in recent years, especially due to the rapid
growth of the shipbuilding industry in some emerging economies, such as China, India, the Philippines and
Vietnam. China has started to become a dominant force in world shipbuilding, and in terms of the size of
its order book (if not yet in production) since the end of 2008 it has become the largest shipbuilding
economy in the world, overtaking Korea.
63. Also of interest has been the rapid growth in the order books of some of the emerging economies,
particularly Vietnam and the Philippines, which have overtaken Germany on this ranking. The world
shipbuilding market has been very strong since 2003, although the global economic crisis has meant that
new orders have slumped dramatically since late 2008, and there have been many requests from ship
buyers for cancellations and deferrals. This aspect will be dealt with in more detail later in this report, but
it is significant that the impacts of that slump are now being reflected in the shipyard order books.

C/WP6(2009)14
21
TABLE 5
World order book - Top Fifteen Order Books at Q2 2009 (million cgt)
Rank Economy Q2 2009 Q4 2008 Q4 2007
m cgt % m cgt % m cgt %
1 China 58.59 33.67% 62.00 32.59% 50.22 28.25%
2 Korea 56.79 32.64% 64.36 33.82% 63.39 35.66%
3 Japan 28.16 16.18% 30.65 16.11% 30.71 17.28%
4 Vietnam 3.07 1.76% 3.00 1.58% 2.14 1.21%
5 Philippines 2.98 1.71% 2.66 1.40% 2.49 1.40%
6 Germany 2.68 1.54% 3.28 1.73% 3.78 2.12%
7 Italy 2.46 1.42% 2.07 1.09% 2.95 1.66%
8 India 2.40 1.38% 2.45 1.29% 2.03 1.14%
9 Turkey 1.98 1.14% 2.34 1.23% 2.34 1.32%
10 Romania 1.63 0.94 2.12 1.11% 2.12 1.19%
11 Chinese Taipei 1.35 0.78% 1.57 0.83% 1.68 0.95%
12 Brazil 1.22 0.74% 1.25 0.66% 0.97 0.55%
13 Spain 0.97 0.56% 1.04 0.55% 1.11 0.63%
14 USA 0.69 0.40% 0.74 0.39% .71 0.40%
15 Indonesia 0.67 0.39% 0.83 0.44% 0.67 0.39% Source: Compiled by the OECD from Lloyd’s Register Fairplay.
Domestic/export production mix
64. Historically, Chinese Taipei’s shipyards production has been mainly taken up by domestic buyers
However, based on the targeted specialisation by yards, and in a effort to capture some of the buoyant
market for new vessels (at least as it was until late 2008), Chinese Taipei’s shipbuilding industry has been
actively seeking to expand its international presence. Top destination markets are Europe, Japan and Hong
Kong (China), with the principal ship types exported being container ships and bulk carriers.
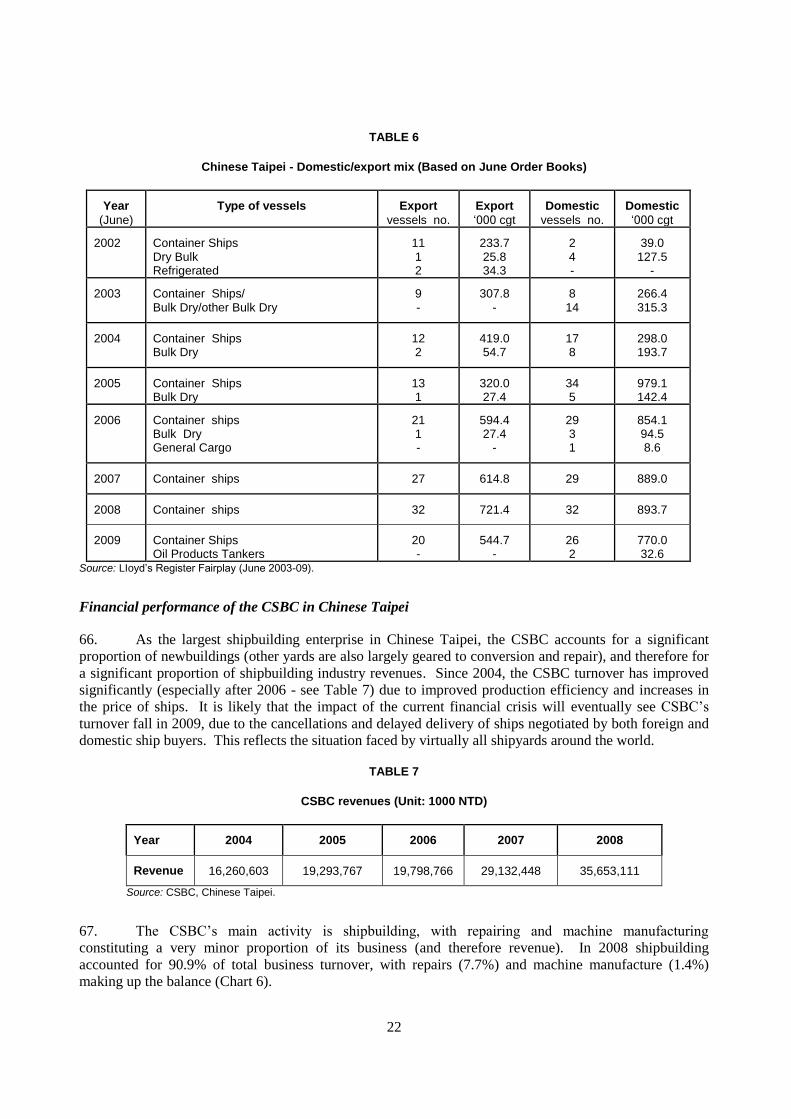
65. These concerted efforts to develop the export market have been moderately successful, and in
recent years exports and domestic demand (at least as reflected by the order book) have been relatively
balanced (See Table 6). It is understood that recently some local shipping companies such as Wan Hai,
and Yang Ming have placed orders with the CSBC.
22
TABLE 6
Chinese Taipei - Domestic/export mix (Based on June Order Books)
Year
(June)
Type of vessels Export
vessels no.
Export
‘000 cgt
Domestic
vessels no.
Domestic
‘000 cgt
2002 Container Ships Dry Bulk Refrigerated
11 1 2
233.7 25.8 34.3
2 4 -
39.0 127.5
-
2003 Container Ships/ Bulk Dry/other Bulk Dry
9 -
307.8 -
8 14
266.4 315.3
2004 Container Ships Bulk Dry
12 2
419.0 54.7
17 8
298.0 193.7
2005 Container Ships Bulk Dry
13 1
320.0 27.4
34 5
979.1 142.4
2006 Container ships Bulk Dry General Cargo
21 1 -
594.4 27.4
-
29 3 1
854.1 94.5 8.6
2007 Container ships 27 614.8 29 889.0
2008 Container ships 32 721.4 32 893.7
2009 Container Ships Oil Products Tankers
20 -
544.7 -
26 2
770.0 32.6
Source: LIoyd’s Register Fairplay (June 2003-09).
Financial performance of the CSBC in Chinese Taipei
66. As the largest shipbuilding enterprise in Chinese Taipei, the CSBC accounts for a significant
proportion of newbuildings (other yards are also largely geared to conversion and repair), and therefore for
a significant proportion of shipbuilding industry revenues. Since 2004, the CSBC turnover has improved
significantly (especially after 2006 - see Table 7) due to improved production efficiency and increases in
the price of ships. It is likely that the impact of the current financial crisis will eventually see CSBC’s
turnover fall in 2009, due to the cancellations and delayed delivery of ships negotiated by both foreign and
domestic ship buyers. This reflects the situation faced by virtually all shipyards around the world.
TABLE 7
CSBC revenues (Unit: 1000 NTD)
Year 2004 2005 2006 2007 2008
Revenue 16,260,603 19,293,767 19,798,766 29,132,448 35,653,111
Source: CSBC, Chinese Taipei.
67. The CSBC’s main activity is shipbuilding, with repairing and machine manufacturing
constituting a very minor proportion of its business (and therefore revenue). In 2008 shipbuilding
accounted for 90.9% of total business turnover, with repairs (7.7%) and machine manufacture (1.4%)
making up the balance (Chart 6).

C/WP6(2009)14
23
CHART 6
Composition of CSBC activities
Source: CSBC, Chinese Taipei.
Productivity and competitiveness
68. Productivity is a significant factor that drives competitiveness in the shipbuilding industry.
However, comparative productivity is difficult to measure and would require a very detailed study to
provide a reliable guide to productivity. Therefore the discussion that follows, based on relatively, but not
fully consistent data is only indicative, and needs to be interpreted with care. It is reported here to
highlight an area where some more detailed analysis might be useful.
69. The first comparison is based on the implicit value of output per worker in the industry. This is
based on employment data and overall industry outputs reported by national shipbuilder associations. The
possibility of error in this measure is relatively high, because there is comparatively little information
available on precisely what is being measure in the overall industry outputs reported by shipbuilding
associations. The outcome of this comparison is shown in Annexes 2 and 3.
70. The second comparison is based on industry outputs, in compensated gross tons (cgt13
), as
reported by Lloyds Register – Fairplay.14
While again not definitive, this is likely to be a more robust
measure because of the consistent way in which cgt completions data is collected and reported. This
comparison is shown in Annexes 2 and 4.
71. Both of these comparisons are generally consistent, and seem to indicate that the average
productivity of the Chinese Taipei industry is average rather than high. It is stressed that this assessment is
indicative only, but may indicate an area where addition analysis would be useful, as well as indicating an
aspect of the industry where there could be some room for improvement.
13
cgt = a unit of measurement, promulgated by the OECD that is intended to provide a common yardstick to
reflect the relative output of merchant shipbuilding activity
14 These publications record completions of commercial vessels over 100gt.

24
72. If productivity is not as high as in other shipbuilding economies, this could in part be explained
by the generally small scale and diffused nature of the shipbuilding enterprises in Chinese Taipei (with the
exception of CSBC), which would make more difficult the exploitation of economies of scale.
73. High wages, labour shortages, lack of experience in the construction of non-traditional ship types
and the high cost of imported marine equipment have also been identified as other factors that could
impede competitiveness and growth. Local shipyards have attempted to improve productivity by
increasing the efficiency of construction processes and by modernising equipment, as well as addressing
labour shortages and high wages by improving efficiency through (amongst other things) enhancing
employee training as well as improving quality control and manufacturing flow.
74. It has also been suggested that the performance of the Chinese Taipei industry could be explained
not by any lack of competitiveness or productivity on its part, but because it is trying to compete in a
market where its competitors are in receipt of significant government support. It is indeed possible that the
global shipbuilding market could be significantly distorted by government subsidies and other support
measures, although this is a very difficult thing to establish, especially from the perspective of proving that
individual industries and enterprises have been specifically affected. However, in December 2009 the
OECD’s Council Working Party on Shipbuilding (WP6) is holding a major Workshop on market distorting
factors in the shipbuilding industry, and this could well throw additional light on this issue.
Future developments
General
75. Looking into the future is always a very difficult task, with a high probability of forecasts being
wrong. Therefore this study will limit itself to looking at some basic trends which are already well
established, and to assess how these trends might affect the Chinese Taipei shipbuilding industry in the
near future. This section will also briefly examine future plans of the industry when these have been
announced and/or implemented.
Global shipbuilding demand/capacity forecast
76. The long-running, buoyant shipbuilding market prior to the economic crisis of 2008 ensured a
strong supply of new vessels coming on to the market, which in turn swelled the global shipping fleet. The
impacts of that strong demand are still evident in the sizeable order books currently held by virtually all
shipbuilders, even though new orders have dwindled to virtually nothing since the end of 2008.
77. This is a difficult time for shipbuilders, as the future is particularly uncertain, given the relative
fragility of the global economic recovery, and the expectations that world trade (and hence demand for
shipping) will take some time yet to recover. In this uncertain economic climate, earlier forecasts of
shipbuilding demand have been rendered less useful, and shipbuilders and their associations are
understandably cautious in producing new detailed forecasts, with the general consensus being that the
future of the shipbuilding market will be “uncertain and difficult”.
78. However, there is an expectation in the industry that sustained closer relations between China and
Chinese Taipei (which has been evidenced by actions such as the establishment of direct shipping services
between the two economies) could significantly expand future cross-strait transport and trade. If this
increased cross-strait transport demand eventuates, it could offer some opportunities for local shipyards,
which believe that they are well placed to participate in the construction of new vessels to provide those
services.
C/WP6(2009)14
25
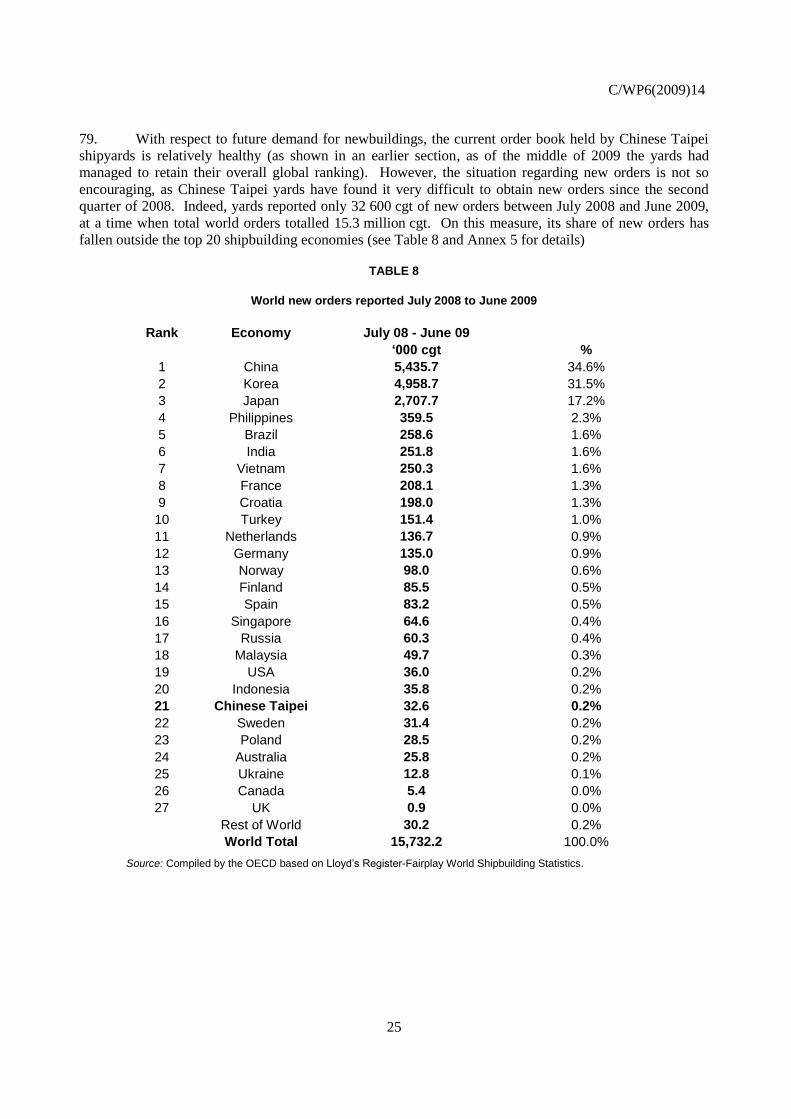
79. With respect to future demand for newbuildings, the current order book held by Chinese Taipei
shipyards is relatively healthy (as shown in an earlier section, as of the middle of 2009 the yards had
managed to retain their overall global ranking). However, the situation regarding new orders is not so
encouraging, as Chinese Taipei yards have found it very difficult to obtain new orders since the second
quarter of 2008. Indeed, yards reported only 32 600 cgt of new orders between July 2008 and June 2009,
at a time when total world orders totalled 15.3 million cgt. On this measure, its share of new orders has
fallen outside the top 20 shipbuilding economies (see Table 8 and Annex 5 for details)
TABLE 8
World new orders reported July 2008 to June 2009
Rank Economy July 08 - June 09
‘000 cgt %
1 China 5,435.7 34.6%
2 Korea 4,958.7 31.5%
3 Japan 2,707.7 17.2%
4 Philippines 359.5 2.3%
5 Brazil 258.6 1.6%
6 India 251.8 1.6%
7 Vietnam 250.3 1.6%
8 France 208.1 1.3%
9 Croatia 198.0 1.3%
10 Turkey 151.4 1.0%
11 Netherlands 136.7 0.9%
12 Germany 135.0 0.9%
13 Norway 98.0 0.6%
14 Finland 85.5 0.5%
15 Spain 83.2 0.5%
16 Singapore 64.6 0.4%
17 Russia 60.3 0.4%
18 Malaysia 49.7 0.3%
19 USA 36.0 0.2%
20 Indonesia 35.8 0.2%
21 Chinese Taipei 32.6 0.2%
22 Sweden 31.4 0.2%
23 Poland 28.5 0.2%
24 Australia 25.8 0.2%
25 Ukraine 12.8 0.1%
26 Canada 5.4 0.0%
27 UK 0.9 0.0%
Rest of World 30.2 0.2%
World Total 15,732.2 100.0%
Source: Compiled by the OECD based on Lloyd’s Register-Fairplay World Shipbuilding Statistics.
26
80. The global recession has hit the shipbuilding industry quite hard,15
so a dramatic fall in orders is
not of itself unusual. However, there are some specific features of Chinese Taipei’s experience that could
be significant.
81. First, its yards failed to secure any orders in the third quarter of 2008, when globally new orders
totalled a relatively strong 12.3 million cgt, (see Annex 5). Second, some of Chinese Taipei’s main
competitors in the region were able to still attract significant orders over the last two or three quarters, even
though total orders had dramatically fallen from earlier levels. Fox example, in Q1 of 2009, when total
orders only totalled 1.1 million cgt (1.4 million cgt and 12.3 million cgt in the previous two quarters
respectively), the Philippines captured 16% of those orders, more than both Korea and China, and just
behind Japan. As well, Malaysia, Vietnam and Indonesia were also able to claim some useful orders in
that quarter, which lifted them well above Chinese Taipei overall. It may well be that the shipbuilding
industries in these economies may have been able to capture these orders through some kind of
government support, but no data is available to either confirm or deny this.
82. An additional factor that must be of concern to the Chinese Taipei shipyards is that the severe
drop in new orders means that as the existing order book is completed, there may be growing problems
with shipbuilding capacity, which globally has been geared (through green-field yard developments,
upgrading and improved productivity) to handling a very buoyant market over a number of years. This
considerable, and probably excess capacity, will inevitably be competing for a very constrained
newbuilding market until the world economy recovers significantly.
83. Shipbuilding capacity is a very difficult thing to measure, and there are a number of different
methodologies employed to produce such estimates, each with their own strengths and weaknesses. For
indicative purposes, a presentation at the OECD Council Working Party on Shipbuilding (WP6) in
July 2009 by the Korean Shipbuilder’s Association (KOSHIPA, 2009) indicated that even with slippages
and cancellations it was likely that world output would approach 50 million cgt in 2009. Even more
strikingly is that without such slippages and cancellation the scheduled deliveries for 2009 approached
60 million cgt. These outputs set a base line for potential (but not necessarily actual) capacity, and those
numbers are very large.
84. Even if they are not perfect, the importance of these estimates is that they point to a very large
future overcapacity when the current, strong, order book starts to run out. In other words, unless the world
economy picks up significantly, and there is a strong return to the market by ship buyers, then this
structural overcapacity will be competing for a smaller number of orders, and in the future this will put all
enterprises, but especially the less efficient (or less supported) enterprises, under considerable pressure.
85. This study has mentioned a number of times the strategy to specialise in large high-tech cellular
containerships that has formed the basis of both the 10 year Action Plan issued by the government, and the
business strategy announced by CSBC. However, recent data does not suggest that this strategy has been
particularly successful so far (and especially over the last 12 months), and the recent announcement by the
CSBC to broaden its portfolio to other types of vessels in order to encourage additional orders, at least
indicates a level of welcome flexibility in the Chinese Taipei shipbuilding industry in.
Investment plans
86. Given the likely global shipbuilding overcapacity, it is not unexpected that there are few
expansion or new investment plans by Chinese Taipei shipyards (see Table 9). However, shipyards have
15
A series of presentation on these impacts made to the WP6 in July 2009 can be found on the OECD’s
shipbuilding site at www.oecd.org/sti/shipbuilding
C/WP6(2009)14
27
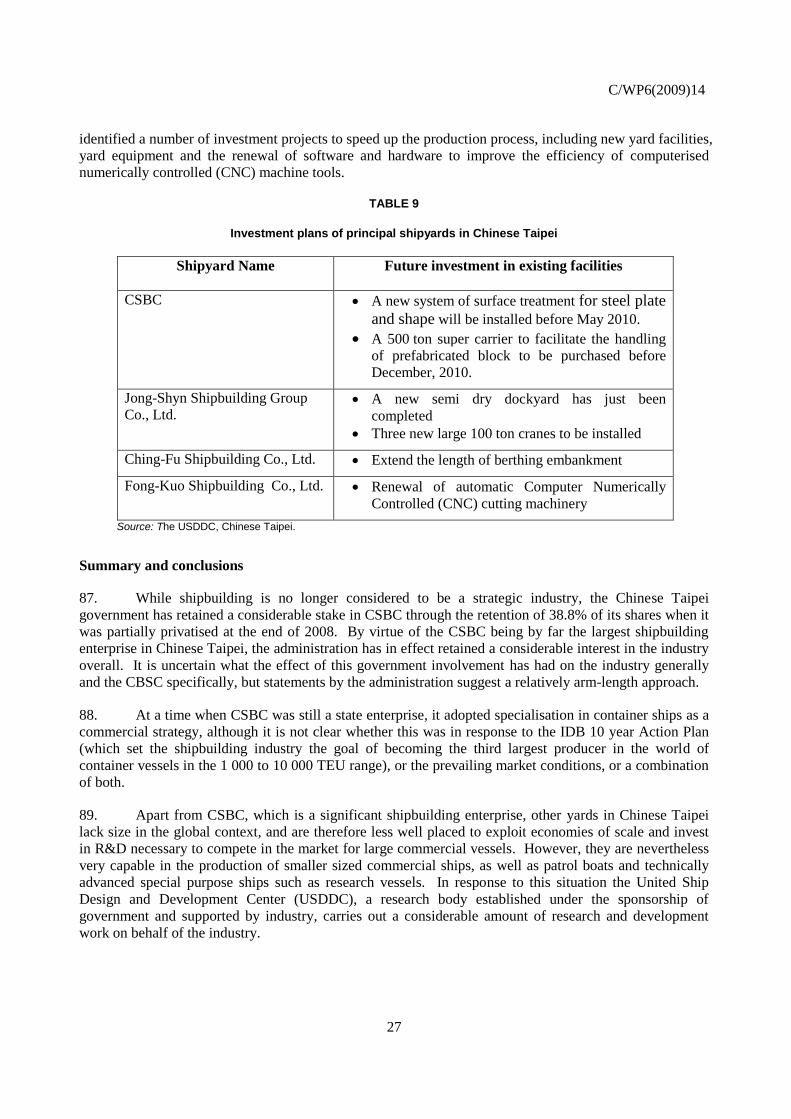
identified a number of investment projects to speed up the production process, including new yard facilities,
yard equipment and the renewal of software and hardware to improve the efficiency of computerised
numerically controlled (CNC) machine tools.
TABLE 9
Investment plans of principal shipyards in Chinese Taipei
Shipyard Name Future investment in existing facilities
CSBC A new system of surface treatment for steel plate
and shape will be installed before May 2010.
A 500 ton super carrier to facilitate the handling
of prefabricated block to be purchased before
December, 2010.
Jong-Shyn Shipbuilding Group
Co., Ltd. A new semi dry dockyard has just been
completed
Three new large 100 ton cranes to be installed
Ching-Fu Shipbuilding Co., Ltd. Extend the length of berthing embankment
Fong-Kuo Shipbuilding Co., Ltd. Renewal of automatic Computer Numerically
Controlled (CNC) cutting machinery
Source: The USDDC, Chinese Taipei.
Summary and conclusions
87. While shipbuilding is no longer considered to be a strategic industry, the Chinese Taipei
government has retained a considerable stake in CSBC through the retention of 38.8% of its shares when it
was partially privatised at the end of 2008. By virtue of the CSBC being by far the largest shipbuilding
enterprise in Chinese Taipei, the administration has in effect retained a considerable interest in the industry
overall. It is uncertain what the effect of this government involvement has had on the industry generally
and the CBSC specifically, but statements by the administration suggest a relatively arm-length approach.
88. At a time when CSBC was still a state enterprise, it adopted specialisation in container ships as a
commercial strategy, although it is not clear whether this was in response to the IDB 10 year Action Plan
(which set the shipbuilding industry the goal of becoming the third largest producer in the world of
container vessels in the 1 000 to 10 000 TEU range), or the prevailing market conditions, or a combination
of both.
89. Apart from CSBC, which is a significant shipbuilding enterprise, other yards in Chinese Taipei
lack size in the global context, and are therefore less well placed to exploit economies of scale and invest
in R&D necessary to compete in the market for large commercial vessels. However, they are nevertheless
very capable in the production of smaller sized commercial ships, as well as patrol boats and technically
advanced special purpose ships such as research vessels. In response to this situation the United Ship
Design and Development Center (USDDC), a research body established under the sponsorship of
government and supported by industry, carries out a considerable amount of research and development
work on behalf of the industry.

28
90. The availability and cost of skilled labour has been identified by industry as a significant problem
for the industry, and it is noted that there is now in place a well developed educational feeder stream,
supported by both government and industry, to train workers in shipbuilding related disciplines.
91. There is an indication in the available data that average productivity in the Chinese Taipei
shipbuilding industry is moderate rather than high, and this is an area where additional analysis would be
useful to determine whether some remedial actions are required.
92. The industry’s performance in the global market has been mixed since 2000. On the one hand,
even though its total output has remained steady, its share of the global market has been consistently
declining (this may be due to the yards working consistently at full capacity). On the other hand, Chinese
Taipei has been able to more or less retain its position in the world completions and order book rankings,
which is a positive outcome.
93. However, more recently, the ability of the industry to attract new orders has declined, and
between July 2008 and June 2009 it was only able to capture 0.2% of new orders, which on a cgt basis
placed it in 21st place, which is well below its recent rankings. Also, the fact that not a single order was
receive in the 9 months between July 2008 and March 2009, must be of some concern to both the
government and industry. However, it is also noted that an order was received in the June Quarter of 2009,
and early data indicate an improved situation in the latter stages of 2009.
94. Whatever the reasons for this dip in orders, which could range from a focus on the wrong kind of
vessels, to some lack of competitiveness of the industry, through to having to compete in a distorted market
affected by government interventions, improving the industry’s ability to capture future orders will be a
significant challenge facing the Chinese Taipei industry.
95. The recent announcements by the CSBC to seek construction opportunities in a wider range of
vessel type (as opposed to specialising in container ships) as a response to the economic crisis probably
indicates a recognition that in the difficult times ahead a more flexible approach may be required in order
to keep the industry viable in Chinese Taipei.
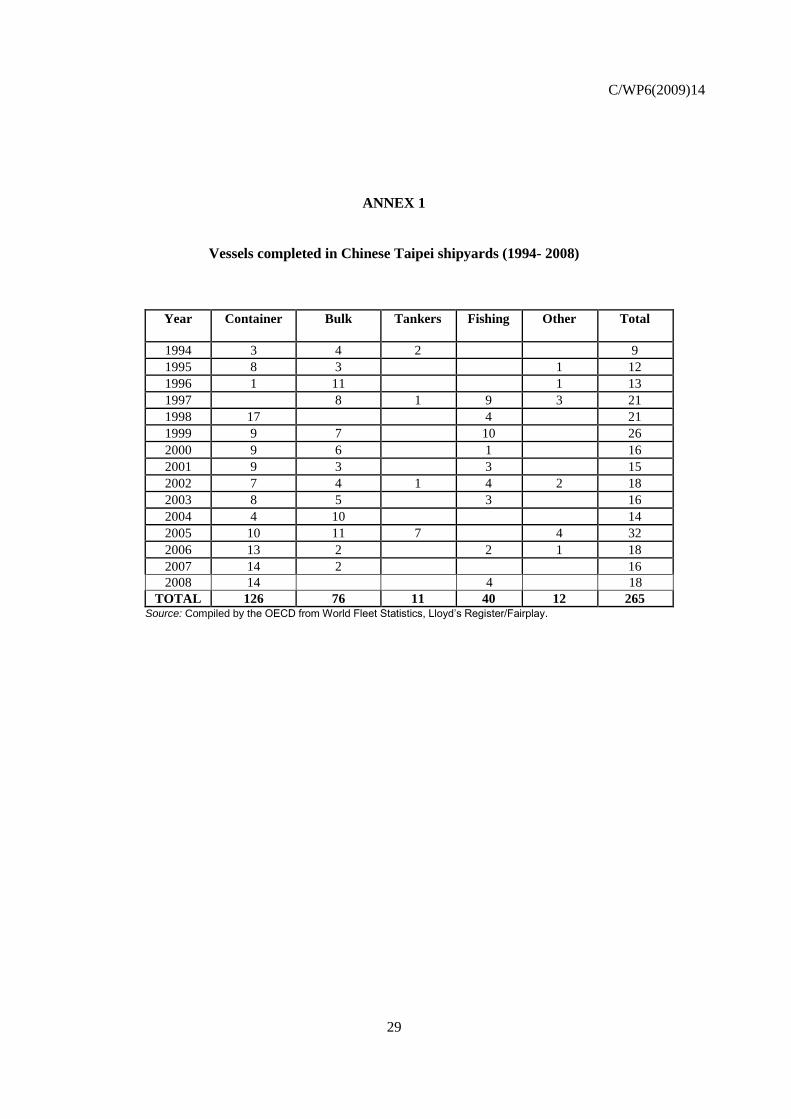
C/WP6(2009)14
29
ANNEX 1
Vessels completed in Chinese Taipei shipyards (1994- 2008)
Year Container Bulk
Tankers Fishing Other Total
1994 3 4 2 9
1995 8 3 1 12
1996 1 11 1 13
1997 8 1 9 3 21
1998 17 4 21
1999 9 7 10 26
2000 9 6 1 16
2001 9 3 3 15
2002 7 4 1 4 2 18
2003 8 5 3 16
2004 4 10 14
2005 10 11 7 4 32
2006 13 2 2 1 18
2007 14 2 16
2008 14 4 18
TOTAL 126 76 11 40 12 265 Source: Compiled by the OECD from World Fleet Statistics, Lloyd’s Register/Fairplay.

30
ANNEX 2
Shipbuilding worker productivity in selected economies - 2007
Economy Shipbuilding
Employees
Output
(billion
USD)
Output
USD/employee
Output
(‘000 cgt)
Output
cgt/employee
Japan 50,000 17.0 340,000 8,964.6 179.3
Korea 119,000 22.1 185,700 11,291.3 94.9
European 14 114,000 20.8 182,500 4,619.5 40.5
Chinese Taipei 11,000 1.3 118,200 369.4 33.6
China 360,000 12.5 34,700 6,765.9 18.8
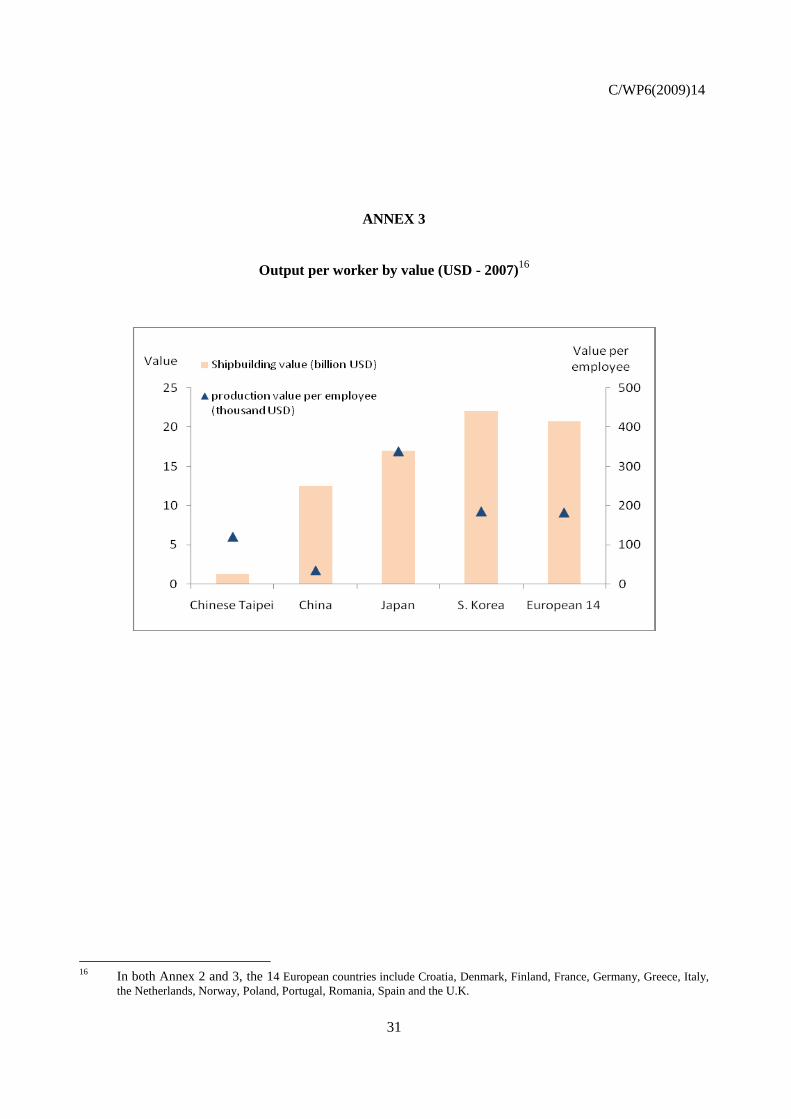
C/WP6(2009)14
31
ANNEX 3
Output per worker by value (USD - 2007)16
16
In both Annex 2 and 3, the 14 European countries include Croatia, Denmark, Finland, France, Germany, Greece, Italy,
the Netherlands, Norway, Poland, Portugal, Romania, Spain and the U.K.
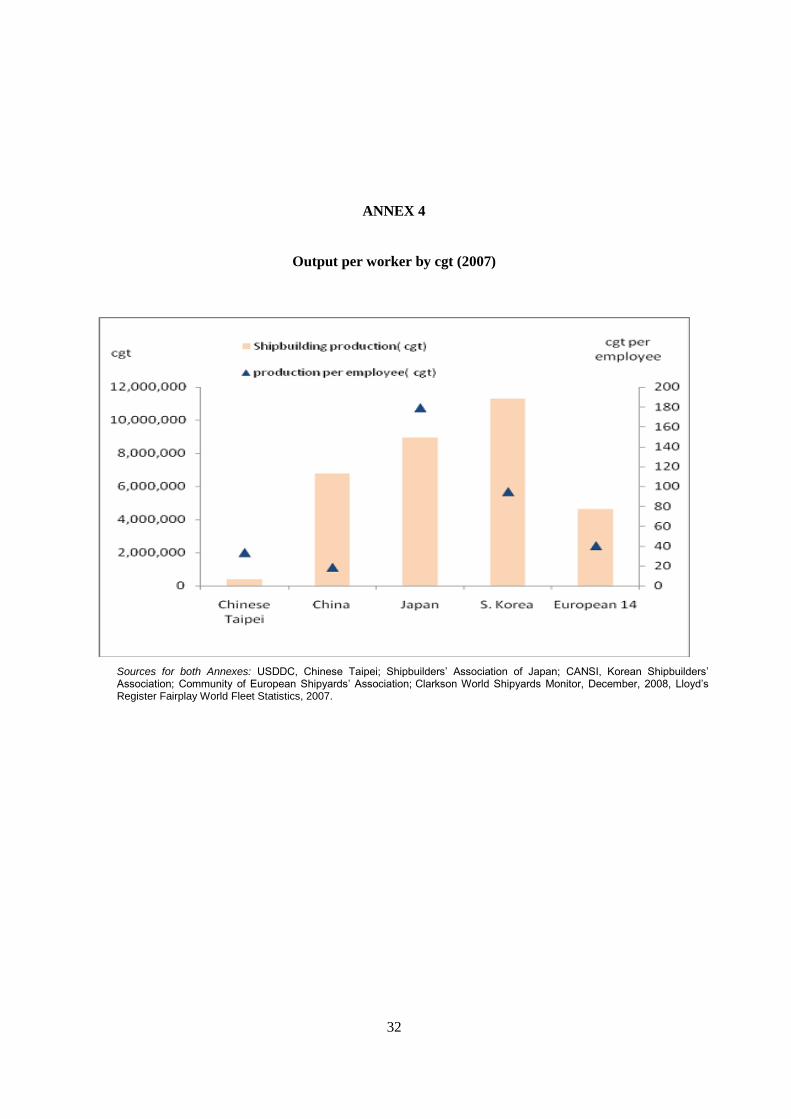
32
ANNEX 4
Output per worker by cgt (2007)
Sources for both Annexes: USDDC, Chinese Taipei; Shipbuilders’ Association of Japan; CANSI, Korean Shipbuilders’ Association; Community of European Shipyards’ Association; Clarkson World Shipyards Monitor, December, 2008, Lloyd’s Register Fairplay World Fleet Statistics, 2007.

C/WP6(2009)14
33
ANNEX 5
New orders q3 2008 to q2 2009
Economy
000 cgt % 000 cgt % 000 cgt % 000cgt % 000 cgt %
China 5,435.7 34.6% 78.8 9.7% 142.7 12.7% 462.2 31.0% 4,751.9 38.6%
Korea 4,958.7 31.5% 40.3 4.9% 171.1 15.2% 331.6 22.3% 4,415.6 35.9%
Japan 2,707.7 17.2% 524.5 64.3% 446.9 39.8% 297.4 20.0% 1,438.9 11.7%
Philippines 359.5 2.3% 0.0% 180.2 16.0% 0.0% 179.3 1.5%
Brazil 258.6 1.6% 6.6 0.8% 0.0 0.0% 208.8 14.0% 43.1 0.4%
India 251.8 1.6% 0.0% 1.6 0.1% 17.7 1.2% 232.6 1.9%
Vietnam 250.3 1.6% 9.0 1.1% 6.7 0.6% 53.1 3.6% 181.5 1.5%
France 208.1 1.3% 0.0% 0.0 0.0% 0.0% 208.1 1.7%
Croatia 198.0 1.3% 21.5 2.6% 34.2 3.0% 0.0% 142.3 1.2%
Turkey 151.4 1.0% 0.0% 17.6 1.6% 13.9 0.9% 119.9 1.0%
Netherlands 136.7 0.9% 0.0% 1.6 0.1% 5.1 0.3% 130.0 1.1%
Germany 135.0 0.9% 0.0% 0.0 0.0% 0.0% 135.0 1.1%
Norway 98.0 0.6% 39.4 4.8% 17.7 1.6% 0.0% 41.0 0.3%
Finland 85.5 0.5% 0.0% 0.0 0.0% 0.0% 85.5 0.7%
Spain 83.2 0.5% 13.9 1.7% 15.1 1.3% 0.0% 54.2 0.4%
Singapore 64.6 0.4% 6.6 0.8% 1.9 0.2% 8.5 0.6% 47.6 0.4%
Russia 60.3 0.4% 23.8 2.9% 0.0 0.0% 11.1 0.7% 25.3 0.2%
Malaysia 49.7 0.3% 1.4 0.2% 24.8 2.2% 23.5 1.6% 0.0 0.0%
USA 36.0 0.2% 0.0% 29.1 2.6% 7.0 0.5% 0.0 0.0%
Indonesia 35.8 0.2% 0.0% 4.6 0.4% 31.2 2.1% 0.0 0.0%
Chinese Taipei 32.6 0.2% 32.6 4.0% 0.0 0.0% 0.0% 0.0 0.0%
Sweden 31.4 0.2% 0.0% 0.0 0.0% 0.0% 31.4 0.3%
Poland 28.5 0.2% 2.5 0.3% 0.0 0.0% 11.0 0.7% 15.1 0.1%
Australia 25.8 0.2% 12.3 1.5% 13.4 1.2% 0.0% 0.0 0.0%
Ukraine 12.8 0.1% 0.0% 0.0 0.0% 0.0% 12.8 0.1%
Canada 5.4 0.0% 0.0% 5.4 0.5% 0.0% 0.0 0.0%
UK 0.9 0.0% 0.9 0.1% 0.0 0.0% 0.0% 0.0 0.0%
Rest of World 30.2 0.2% 1.4 0.2% 8.8 0.8% 6.7 0.5% 13.2 0.1%
World Total 15,732.2 100.0% 815.5 100.0% 1,123.4 100.0% 1,488.8 100.0% 12,304.3 100.0%
July08-June09 2009-Q2 2009 - Q1 2008 - Q4 2008- Q3
Source: Lloyd’s Register – Fairplay World Shipbuilding Statistics.
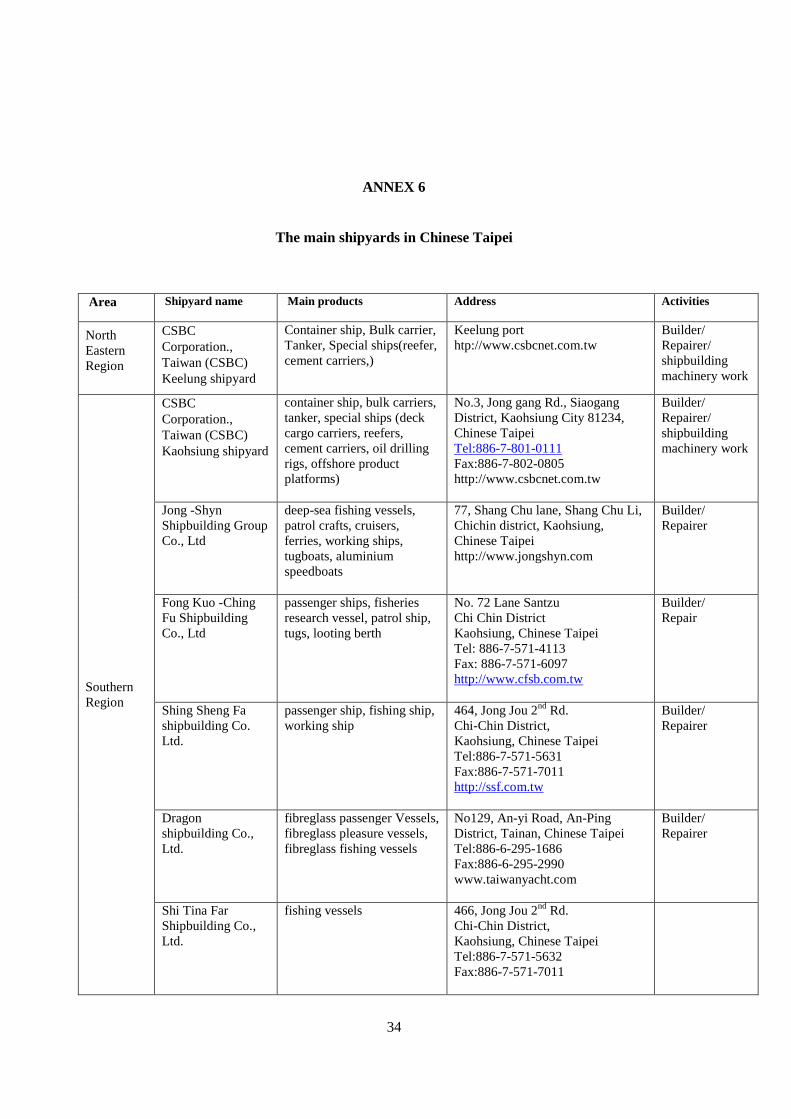
34
ANNEX 6
The main shipyards in Chinese Taipei
Area Shipyard name Main products
Address Activities
North
Eastern
Region
CSBC
Corporation.,
Taiwan (CSBC)
Keelung shipyard
Container ship, Bulk carrier,
Tanker, Special ships(reefer,
cement carriers,)
Keelung port
htp://www.csbcnet.com.tw
Builder/
Repairer/
shipbuilding
machinery work
Southern
Region
CSBC
Corporation.,
Taiwan (CSBC)
Kaohsiung shipyard
container ship, bulk carriers,
tanker, special ships (deck
cargo carriers, reefers,
cement carriers, oil drilling
rigs, offshore product
platforms)
No.3, Jong gang Rd., Siaogang
District, Kaohsiung City 81234,
Chinese Taipei
Tel:886-7-801-0111
Fax:886-7-802-0805
http://www.csbcnet.com.tw
Builder/
Repairer/
shipbuilding
machinery work
Jong -Shyn
Shipbuilding Group
Co., Ltd
deep-sea fishing vessels,
patrol crafts, cruisers,
ferries, working ships,
tugboats, aluminium
speedboats
77, Shang Chu lane, Shang Chu Li,
Chichin district, Kaohsiung,
Chinese Taipei
http://www.jongshyn.com
Builder/
Repairer
Fong Kuo -Ching
Fu Shipbuilding
Co., Ltd
passenger ships, fisheries
research vessel, patrol ship,
tugs, looting berth
No. 72 Lane Santzu
Chi Chin District
Kaohsiung, Chinese Taipei
Tel: 886-7-571-4113
Fax: 886-7-571-6097
http://www.cfsb.com.tw
Builder/
Repair
Shing Sheng Fa
shipbuilding Co.
Ltd.
passenger ship, fishing ship,
working ship
464, Jong Jou 2nd
Rd.
Chi-Chin District,
Kaohsiung, Chinese Taipei
Tel:886-7-571-5631
Fax:886-7-571-7011
http://ssf.com.tw
Builder/
Repairer
Dragon
shipbuilding Co.,
Ltd.
fibreglass passenger Vessels,
fibreglass pleasure vessels,
fibreglass fishing vessels
No129, An-yi Road, An-Ping
District, Tainan, Chinese Taipei
Tel:886-6-295-1686
Fax:886-6-295-2990
www.taiwanyacht.com
Builder/
Repairer
Shi Tina Far
Shipbuilding Co.,
Ltd.
fishing vessels 466, Jong Jou 2nd
Rd.
Chi-Chin District,
Kaohsiung, Chinese Taipei
Tel:886-7-571-5632
Fax:886-7-571-7011

C/WP6(2009)14
35
Chien Fu
shipbuilding Co.,
Ltd
fishing vessels No.15-1, Kuang-Fu Rd., Shing
Yuan county, Ping-Tong, Chinese
Taipei.
Tel: 886-8-8325119
Fax: 886-8-8351339
http://www.cfsb.com.tw
Builder/
Repairer
Chin Hay
shipbuilding Co.,
Ltd
passenger ship, fishing ship 472, Jong Jou 2nd
Rd.
Chi-Chin District,
Kaohsiung, Chinese Taipei
Tel:886-7-5713540
Fax: 886-7-5711689
Builder/
Repairer
North
Eastern
Region
Lung Teh
Shipbuilding Co.,
Ltd
pilot boat, patrol ship,
ferries, diving support boat,
fishery support vessel,
survey vessel,
No.15, De Shang 5th Road, Dung-
Shan Country, ILAN, Chinese
Taipei
Tel: 886-3-9901166
Fax:886-3-9905650
http://www.lts.com.tw
Builder/
Repairer
Source: Compiled by the OECD based on information from Chinese Taipei shipyards.

36
REFERENCES
CANSI (2008), “2007 全國船舶工業運行報告” (“Annual Report of China Shipbuilding industry, 2007”),
The Chinese Association of National Shipbuilding Industry, 22 February 2008, p3 at
http://www.chinaship.cn/tjxx/200802/t20080222_11119.htm.
CESA (2004), Annual Report 2004-2005, Global shipbuilding requirement & capacity, Community of
European shipyards’ Association, at http://www.cesa-shipbuilding.org/market.phtml?sid=.
CESA (2007), “Annual Report 2007-2008”, Community of European Shipyards’ Association, at
http://www.cesa-shipbuilding.org/market.phtml?sid=.
Clarkson (2009) World Shipyard Monitor, Clarkson Research Services, Volume 16, No. 9 –
September 2009.
CSBC (2009), Introduction to the China Shipbuilding Corporation at http://www.csbcnet.com.tw.
CSC (2009), Introduction on China Steel Company, China Steel Company at
http://www.csc.com.tw/indexe.html.
Economic Daily News (2008) “台船公司 12 月 22 日上市”, Economic Daily News, 27 November 2008
at http://edn.gmg.tw/article/view.jsp?aid=61355).
IMO (2003), “IMO meeting adopts accelerated single-hull tanker phase-out, new regulation on carriage of
heavy fuel oil ” , Marine Environment Protection Committee , International Maritime Organization ,
50th session, 1 and 4 December 2003 at http://www.imo.org.
IDB (2006) “Development Status of Chinese Taipei’s Marine Equipment”, Industrial Development Bureau,
Ministry of Economic Affairs, Chinese Taipei, 28 July, 2006
IDB (2005), “The strategy of development for shipbuilding industry”, Industrial Development Bureau,
Ministry of Economic Affairs, Chinese Taipei, 2005.
KOSHIPA (2008), Korean Shipbuilding Performance, The Shipbuilders’ Association of Korea, at
http://www.koshipa.or.kr/eng/koshipa/koshipa3/statistics_kor.htm.
KOSHIPA (2009) “Impact of the Economic Downturn on the Shipbuilding Industry” at the 108th Session
of the OECD’s Council Working Party on Shipbuilding, July 2009 at
www.oecd.org/sti/shipbuilding.
Lloyd's List Daily Commercial News (2008), Dale, Jamie (2008). "Kaohsiung container port hits full
capacity". (Informa Australia): pp. 16.
Lloyd’s Register Fairplay (2000), World Fleet Statistics, Lloyd’s Register Fairplay, 2000-2008.
Lloyd’s Register Fairplay (2009), Shipbuilding Statistics, Lloyd’s Register Fairplay June 2009.
C/WP6(2009)14
37
MAC (2008), “Cross-strait agreements on sea transport, air transport, and postal service”, Mainland
Affairs Council, Executive Yuan, Chinese Taipei, 4 November, 2008 at
http://www.mac.gov.tw/english/index1-e.htm).
Ministry of Education (2007), “Training plan of Marine Personnel”, Ministry of Education, Chinese
Taipei, 30 June 2007, pp.40-41
MOEAIC (2004) “Negative List for Investment by Overseas Chinese and Foreign Nationals”, (amended on
13 May, 2004), Investment Commission, Ministry of Economic Affairs, Chinese Taipei at
http://www.moeaic.gov.tw,
Ministry of Education (2008) “2008-2011 Marine Education Enhancement Project”, Project of education
in humanities and social sciences, Ministry of Education, June 2008, No.37 at
http://www.meep.nsysu.edu.tw/hss/indexcf28.html?id=260.
MOEA (2009), “ 國內 外經 濟情 勢分 析 ”, (“The analysis of domestic and international economic
situation“), Ministry of Economic Affairs, Chinese Taipei, June 2009, p.8.
National Chiao-Tung University (2004), Chiai-Chan Chou and Palo-Long Chang, “Core competence and
competitive strategy on the Taiwan shipbuilding industry: a resource-based approach”, Institute of
Business and Management, National Chiao-Tung University, Chinese Taipei, 2004.
OECD (2009), Economic crisis: Stimulus packages and other support for the shipbuilding sector”
C/WP6(2009)5/REV1.
Pin-Kai Wu (2008) “台船盼中鋼增加供應原料”, (“CSBC hopes China Steel increase supply of raw
materials”), Economic Daily News , 14 July, 2008.
Shipnet (2009), Shipbuilding industry information on line, Taiwan ship net ( 台 灣 船 舶 網 ) at
http://www.ship.org.tw/industry/.
Shipnet (2009), Information about Taiwan Shipbuilding Association (TSBA) and the Taiwan Yacht
Industry Association (TYIA), Taiwan ship net, at http://www.ship.org.tw/member/tsba/ and
http://www.ship.org.tw/member/tyia/.
SAJN (2007), Shipbuilding Relations, The shipbuilders’ Association of Japan, at
http://www.sajn.or.jp/data/index.htm.
The Epoch Times (2008), “ 世界第三大貨櫃輪台船榮耀打造萬明名輪 ”, The EPOCH Times,
5 August 2008 at http://www.epochtimes.com/b5/8/5/8n2109973.htm).
The Epoch Times (2009), “ 台船:續爭取公務 船及陸上工”, The Epoch Times, 19 April 2009
http://www.epochtimes.com/b5/9/4/19/n2499922.htm.
USDDC (2005), “Taiwan shipbuilding Industry”, ITIS project, United Ship Design and Development
Centre, 2005. p4
USDDC (2009), Introduction on the United Ship Design and Development Centre at
http://www.usddc.com.

38
United Nations (2008), “Review of Maritime Transport 2008”. New York: United Nations. 2008.
World Bank (2009) “Gross Domestic Product 2008”, World Development Indicators database, World
Bank, 1 July 2009 at http://www.worldbank.org