Ship energy efficiency in simulations and energy system ...
34
Ship energy efficiency in simulations and energy system analysis Modelling and Optimization of Ship Energy Systems October 23 - 25, 2017. EPFL Sion, Switzerland Invited speaker Assoc. Prof. Kari Tammi, Aalto University Jari Vepsäläinen, Klaus Kivekäs, Juuso Autiosalo, Guangrong Zou
Transcript of Ship energy efficiency in simulations and energy system ...

Ship energy efficiency in simulations and energy system analysisModelling and Optimization of Ship Energy SystemsOctober 23 - 25, 2017. EPFL Sion, SwitzerlandInvited speakerAssoc. Prof. Kari Tammi, Aalto UniversityJari Vepsäläinen, Klaus Kivekäs, Juuso Autiosalo, Guangrong Zou

2015: Le Bisse de
Clavau
2004: L’Aiguillette
d’Argentière
2000: Le Mont Blanc du
Tacul

ContentBackground
Previous examples
• HT water control
• Power turbine usage
• Shaft generator usage
• Power demand estimation
Current work on uncertainty in power system design
• Cycle uncertainty
• Robust design
• Digital twin
Future outlook

Background & team
Kari Tammi, Aalto University 2015-
Earlier Research Professor at VTT:
electric machines, energy efficiency,
electric vehicles, dynamics & control
At CERN 1997-2000 (LHC/CMS)
Teaching: Mechatronic machine
design (5 cr), Vehicle mechatronics
(5 cr), Design of electric vehicle
systems at IIT Guwahati, India 2016
Panu Sainio. Chief Engineer, expertise:
vehicle technology, hybridization, electric
powertrain
Shashank Arora. Post-doc, expertise:
batteries, mechanical modelling
Klaus Kivekäs. Electric powertrain
optimization with statistical methods
Jari Vepsäläinen. Multi-objective robust
design of electric powertrain
Juuso Autiosalo. Digital twin for industrial
products

Ship Energy Flow Modelling
Mechanical Power, 48%
Exhaust Gas, 25.5%
HT Water, 15%
LT Water, 11%
Heat Radiation, 0.5%
FuelMarine Diesel
Engine

625/10/2017 6
95% of worldwide transport of goods by ships
Increasingly high fuel cost
Accumulatively strict IMO rules GREEN SHIPPING!
Motivation – Why Ship Energy Efficiency?!
shipping 95% aviation 1%
others 4%
EE
DI [g
.CO
2/te
.nm
]
Cut-off limit Capacity [DWT or GT]
Fig. 1: An EEDI reference figure of new-building ships enforced by IMO. (Source: Lloyd’s Register, (2012), Implementing the Energy
Efficiency Design Index)

725/10/2017 7
0 10 20 30 40 50 60 70
Container ships
Dry bulk vessels
Dry cargo vessels
Tankers
Passenger ships
Fuel cost for container ships is the highest among all the other ship types
Many are struggling to balance their financial sheets
Fuel costs as a percentage of total operational
costs for different ship types

825/10/2017 8
Motivation – How to Improve Ship Energy Efficiency?!
Better planning
Slow steaming Energy management
Novel technology
How to evaluate the overall effectiveness of each solution?
How to estimate the Return On Investment of each
solution?
Challenge
925/10/2017 9
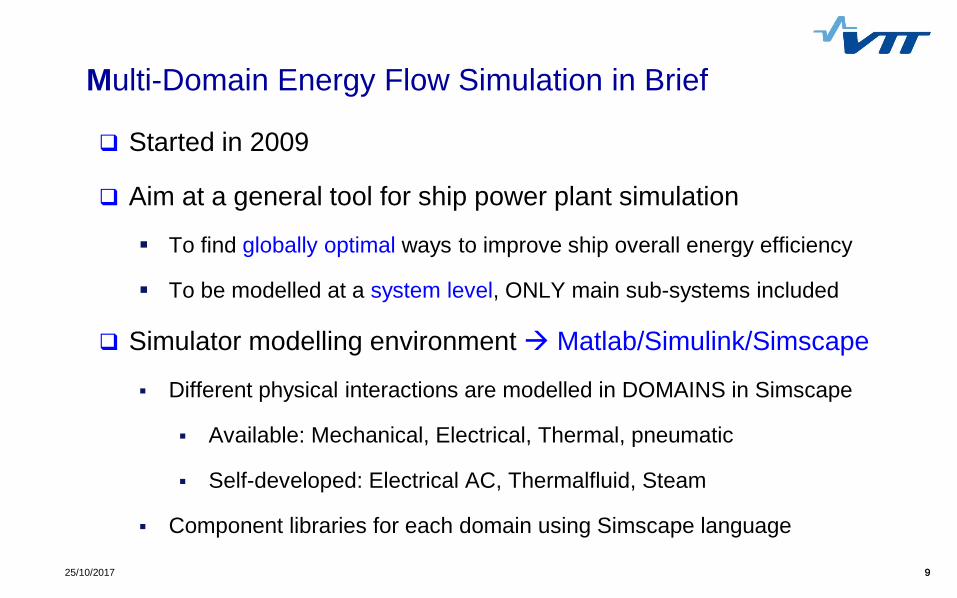
Multi-Domain Energy Flow Simulation in Brief
Started in 2009
Aim at a general tool for ship power plant simulation
To find globally optimal ways to improve ship overall energy efficiency
To be modelled at a system level, ONLY main sub-systems included
Simulator modelling environment Matlab/Simulink/Simscape
Different physical interactions are modelled in DOMAINS in Simscape
Available: Mechanical, Electrical, Thermal, pneumatic
Self-developed: Electrical AC, Thermalfluid, Steam
Component libraries for each domain using Simscape language

1025/10/2017 10
To AirTo SEA
PowerGeneration
ElectricalSystems
HT Water Systems
Steam Powered Systems
FUEL
Acronym:DG - Diesel GeneratorEGE - Exhaust Gas EconomizerHT - High TemperatureLT - Low TemperatureMD - Main DistributionOFB - Oil Fired Boiler
EGE1
EGE2
DG1
DG2
DG3
DG4
OFB2
EGE3
EGE4
POD2
POD1
BOW THRUSTER
PROPULSION
ENGINE ROOM
CHILLERHOTEL
MD
AC CHILLER 1
AC CHILLER 2
AC CHILLER 3
MD20 MD30 MD40 MD50 MD60 MD70
AC CHILLER 4
OFB1
HOTEL
ENGINE
ENGINE PRE-HEATING
TANK HEATING
FUEL OIL HEATING
AIR-CONDITIONING
SWIMMING POOL
PORTABLE WATER HEATING
GALLEYS
LAUNDRY
FRESH WATER EVAPORATOR
HT WATER AIR-CONDITIONING
FRESH WATER EVAPORATOR
FRESH WATER EVAPORATOR 1
FRESH WATER EVAPORATOR 2
LT-WATER EXHAUST GAS
STEAM
Flow Colors:Black - Diesel (l/h)Green - Electrical power (kW)Purple - Exhaust Gas (kW)Red - Steam (kW)Blue - HT Water (kW)Light Blue - LT Water (kW)
Helpful to thoroughly understand the energy distribution and consumption
Potential to utilize the simulation method in different types of ships
Multi-Domain Energy Flow Simulation – Example

1125/10/2017 11
Ship Energy Flow Simulator
Sub systems
Electrical AC
4 DG sets
HT/LT FWC
STEAM
Data I/O &
processing,
result display
--Simplified Marine Engine Energy Flow Simulator--
EGE_T
EGE_mdot
EGE_T1
EGE_mdot1
Sub_STM2
EGE_T
EGE_mdot
EGE_T1
EGE_mdot1
Sub_STM1
HT_kw3
LT_kw3
HT_kw4
LT_kw4
To_HRC
From_HRC
Sub_FCW2
HT_kw1
LT_kw1
HT_kw2
LT_kw2
From_HRC
To_HRC
Sub_FCW1
TO_DG1&2
TO_DG3&4
Sub_ElectricAC
f(x)=0
To_HT12
From_HT12
From_HT34
To_HT34
EVAP&HVAC
DG_S
im
DG_R
eal
DG D
iff
DG_S
w
Fuel
_Sim
Fuel
_Com
p
Fuel
_Rea
l
Mdo
t_HT
P_HT
Q_H
T
T_HT
Fuel
_STM
HT_kw3
LT_kw3
HT_kw4
LT_kw4
Exh_T3
Exh_mf3
Exh_T4
Exh_mf4
To_ElecAC
DGset_3&4
Exh_T1
Exh_mf1
Exh_T2
Exh_mf2
HT_kw1
LT_kw1
HT_kw2
LT_kw2
To_ElecAC
DGset_1&2

1225/10/2017 12
Model validation results
0 1 2 3 4 5 6
x 105
0.8
0.9
1
1.1
1.2
1.3
Time (s)
Ra
tio
DG power difference (simulation results / measured data)
0 1 2 3 4 5 6
x 105
0.6
0.7
0.8
0.9
1
1.1
1.2
1.3
Time (s)
Ra
tio
DG power output
mostly within [0.95 1]
Ship fuel consumption
mostly within [0.95 1.15]
The energy flow simulator can accurately represent the energy flow
distribution in the case ship.

1325/10/2017 13
HT water control example
4N02
4V02
DE
4V01
LT Flow
HT Flow4P14
To test and verify different energy saving technologies and ideas
QUESTION: Can we harvest a part of the wasted heat energy by tuning
the set-point of valve 4V02?

1425/10/2017 14
HT water control example
0 10 20 30 40 50 60 70 80 90 10068
70
72
74
76
78
80
82
84
Engine Load (%)
Te
mp
era
ture
(C
)
Flow temperature control of 3-way mixing thermostat
To specify the set-point of valve 4V02 as a function of engine load
To Check:
Working efficiency
WHR
Working safety
– Constant set point
– Variable set point

1525/10/2017 15
Power and steam turbine usage
Shaft generator system (SG)
ME
Water Cooling systems
Aux. DG 1 Aux. DG 2 Aux. DG 3 Aux. DG 4 Aux. DG 5
Ringnet1 Ringnet2Cargo
3~BT
3~Engine Rooms
Dual-PEGE
TurboCharger
MSB, Electrical6600 V
Freq. Converter
PMS
Motoring
Gen
erating
Shaft Gen./Motor
Gen
erat
ors
SteamTurbinePower
Turbine
Waste heat recovery system (WHR)

1625/10/2017 16
Shaft generator usage
• Generator mode • Parallel generation • Motor/booster mode
Harvest energy from ME shaft to generate electricity, less fuel consumption
More flexible energy utilization to achieve higher overall energy efficiency
>=50%
(Source: Rolls-Royce, Hybrid shaft generator propulsion system upgrade)

1725/10/2017 17
Results
Different energy saving solutions evaluated
under operation cycles recoded on-board
Improved HT water temperature control
ROI 1 year, annual fuel savings 50 kUSD
(HT/LT 3-way valve), [1]
In collaboration with ABB & Deltamarin
Power turbine in waste heat recovery
ROI 2 years, annual fuel savings 2 M€, [2-3]
In collaboration with ABB
1. Zou G., Elg M., Kinnunen A., Kovanen P., Tammi K. & Tervo K. Modeling ship energy flow with multi-
domain simulation. CIMAC.2013
2. Zou G., Kinnunen A., Tervo K., Orivuori J., Vänskä K. & Tammi K. Evaluate Ship Energy Saving
Scenarios Using Multi-Domain Energy Flow Simulation. COMPIT.2014
3. Solution developed was installed in 14 new container ships. ABB to provide waste heat recovery
systems for 14 container ships. World Maritime News. Nov 15, 2013
http://worldmaritimenews.com/archives/97685/abb-to-provide-waste-heat-recovery-systems-for-14-
container-ships/
0 1 2 3 4 5
x 105
0
15
30
45
60
75
Time (s)
Recovere
d h
eat
gain
(%
)
0 1 2 3 4 5
x 105
40
50
60
70
80
90
Time (s)
Engin
e load (
%)
0 1 2 3 4 5
x 105
1
1.5
2
2.5
3
3.5x 10
6
Time (s)
Recovere
d h
eat
(W)
Variable set point
Constant set point
(b)
(a)
(c)

How to Predict Ship energy Flows?

1925/10/2017 19
Energy flow prediction
How to estimate energy flows within ship based on
incomplete measurement information?
How to predict / forecast the energy flows 6-32 hours
ahead as accurately as possible?
How to operate and control ship and ship systems as
energy efficiently as possible?

2025/10/2017 20
Marine engine cooling water circuit

2125/10/2017 21
Signal estimation results (RLS)

Uncertainty in machinery designCases electric vehicles
25.10.2017
22

Driving cycle and passenger load uncertainty - approach• How much do the variations in the driving cycle and
passenger load on a single bus route affect the energy
consumption?
• Create a method to generate varying synthetic cycles and
passenger flows and then run them with a simulation model.
• Case example: Line 11 in Espoo, battery electric bus
• Note: “driving cycle” substantially more complicated in ships
due to high auxiliary loads

Driving cycle and passenger load uncertainty - methods• Divide route into segments between bus stops
• Create new cycles by randomly choosing respective
segments from measured cycles
• Segments need to be connected
• The bus stops at which the vehicle stops are also randomized
• Cycle synthesis validated:
• Passenger flow is sampled from a multivariate distribution

• Energy consumption
distribution acquired
• Resembles normal distribution
• Mean: 0.913 kWh/km, Range: 0.301 kWh/km
• Consumption correlates
strongly with number of stops
• Pearson coefficient: 0.778
• Lesser correlation with
passenger load
Driving cycle and passenger load uncertainty - results

Robust Design – Approach (1/2)
• Noise factors cause unwanted
variation in vehicle performance
• Robust design = make the system
insensitive to these variations
• Identify noise factors and their
range of values
• Study control factors that reduce
the effect of noise factor variation
Payload
User Behaviour
Age & Wear
Waves & Storms
Operating Temperature

Robust Design – Approach (2/2)
• Robustly optimize control
factors to guarantee long lasting
quality design, without
unnecessary oversizing of
components
Payload
User Behavior
Age & Wear
Waves & Storms
Temperature
Energy Storages+
Propulsion
Energy Generation & Control+ +

Robust Design – Methods
Challenge: Complex
dynamic model
Solution: Surrogate
analytical model (PCE)
Sensitivity analysis:
Impact of Noise Factors
Noise
FactorsControl
Factors

Robust Design – Results Case: Electric City BusThe consumption varied from 0.4 to 2.3 kWh/km in the
selected route
• Key noise factors1. Ambient temperature
2. Rolling resistance
3. Mission
4. Driver aggressiveness
5. Traffic
6. Payload
7. Headwind
25.10.2017
29

Digital Twin
25.10.2017
30
Physical Twin Digital TwinKnowledge
Data
1. Can be inspected with
all senses on location
2. Obeys laws of physics
3. Doesn’t have
intelligence
4. Is constantly changing
1. Can be inspected through a user
interface from anywhere around the
world
2. Laws of physics must be simulated
3. Can have artificial intelligence that can
be used to control physical twin
4. Must be updated to match the physical
twin

IoT & Digital Twin, Approach
Ship energy systems are constantly producing vast amount of
data. This data could be utilized better with enhanced
connectivity and data management
Currently, there is no standardized way of transferring and
displaying data. Standardizing work is necessary, and good
standards can only be achieved through experience
Functional demonstrators will crucial for creating the future
standards.

IoT & Digital Twin, Benefits
Benefits of Digital Twin come from multiple factors:
1. Deeper knowledge of the energy process state
2. Centralized data interface
3. Deductions from comparing large populations with e.g with
artificial intelligence
4. Truly integrating connected products to each other with
standardized data formats
Energy system optimisation
Operation optimisation
Fleet management

Future outlook
25.10.2017
33

Technologies (to be) studied
IoT: automation systems provide with various measurements
Computer power enables on-line control and e.g.
• Uncertainty and sensitivity in design
• Tracking simulator approaches
Emerging technologies:
• Electrification (hybridization), DC grid, variable AC
• Energy storages, electric and thermal
• Waste Heat Recovery (ORC, connection to energy storages)
• Absorption chillers
• Power turbines and multi-stage turbo charging
SET final publication in VTT Technology serieshttp://www.vtt.fi/inf/pdf/technology/2017/T306.pdf.