
Shinpei Sano - 財務省 Sano Associate Professor, Faculty of Law, Politics & Economics, Chiba...
25
505 Method of Household Surveys and Characteristics of Surveyed House- holds: Comparison regarding Household Composition, Annual Income and Educational Attainment * Shinpei Sano Associate Professor, Faculty of Law, Politics & Economics, Chiba University Shunji Tada Researcher, Research and Co-ordination Department, Policy Research Institute, Ministry of Finance Manabu Yamamoto Former Researcher, Research and Co-ordination Department, Policy Research Institute, Ministry of Finance Abstract This paper identified the characteristics of various statistics and the points of attention at the time of usage by comparing household-related statistics compiled through different sur- vey methods. Regarding households comprised of two or more members, there was not any significant difference in the average attributes of surveyed households. However, the distri- bution of household attributes varied depending on the survey method, and it is possible that the Comprehensive Survey of Living Conditions covers more non-average households than the National Survey of Family Income and Expenditure and the Family Income and Expen- diture Survey. On the other hand, the proportion of single-person households was lower in the Comprehensive Survey of Living Conditions than in other statistics. Presumably, sin- gle-person households were underrepresented in the Comprehensive Survey of Living Con- ditions, which neither adopts substitute households nor uses ratio estimation. Regarding educational attainment, various statistics show mostly similar distributions. However, the presence of people with “unreported educational attainment” included in the Comprehensive Survey of Living Conditions and the Population Census makes comparison difficult. According to an estimation using cohort information included in the Population Census and the distribution of educational attainment levels included in the Labour Force Survey, people with unreported educational attainment are concentrated among people whose last school education was primary school or junior or senior high school. Excluding people with unreported educational attainment is deemed to be likely to generate a bias. Keywords: household surveys, non-sampling error JEL Classification: C80, C83 * Micro data used in this paper are data from the Comprehensive Survey of Living Conditions conducted by the Ministry of Health, Labour and Welfare (MHLW). We are grateful to the MHLW for providing the precious data. We would also like to thank Takashi Unayama for valuable comments. All remaining errors are our own. Policy Research Institute, Ministry of Finance, Japan, Public Policy Review, Vol.11, No.4, September 2015
Transcript of Shinpei Sano - 財務省 Sano Associate Professor, Faculty of Law, Politics & Economics, Chiba...

505
Method of Household Surveys and Characteristics of Surveyed House-holds: Comparison regarding Household Composition, Annual Income and Educational Attainment*
Shinpei SanoAssociate Professor, Faculty of Law, Politics & Economics, Chiba University
Shunji TadaResearcher, Research and Co-ordination Department, Policy Research Institute, Ministry of Finance
Manabu YamamotoFormer Researcher, Research and Co-ordination Department, Policy Research Institute, Ministry of Finance
AbstractThis paper identified the characteristics of various statistics and the points of attention at
the time of usage by comparing household-related statistics compiled through different sur-vey methods. Regarding households comprised of two or more members, there was not any significant difference in the average attributes of surveyed households. However, the distri-bution of household attributes varied depending on the survey method, and it is possible that the Comprehensive Survey of Living Conditions covers more non-average households than the National Survey of Family Income and Expenditure and the Family Income and Expen-diture Survey. On the other hand, the proportion of single-person households was lower in the Comprehensive Survey of Living Conditions than in other statistics. Presumably, sin-gle-person households were underrepresented in the Comprehensive Survey of Living Con-ditions, which neither adopts substitute households nor uses ratio estimation.
Regarding educational attainment, various statistics show mostly similar distributions. However, the presence of people with “unreported educational attainment” included in the Comprehensive Survey of Living Conditions and the Population Census makes comparison difficult. According to an estimation using cohort information included in the Population Census and the distribution of educational attainment levels included in the Labour Force Survey, people with unreported educational attainment are concentrated among people whose last school education was primary school or junior or senior high school. Excluding people with unreported educational attainment is deemed to be likely to generate a bias.
Keywords: household surveys, non-sampling error JEL Classification: C80, C83
* Micro data used in this paper are data from the Comprehensive Survey of Living Conditions conducted by the Ministry of Health, Labour and Welfare (MHLW). We are grateful to the MHLW for providing the precious data. We would also like to thank Takashi Unayama for valuable comments. All remaining errors are our own.
Policy Research Institute, Ministry of Finance, Japan, Public Policy Review, Vol.11, No.4, September 2015
CW6_A6335D04.indd 505 2015/09/03 13:17:29

I. Introduction
Household surveys play an important role in understanding social and economic situa-tion and in academic research. Information about income, consumption and savings, which are the key determinant factors of the economic welfare, are grasped from a survey of household income and expenditure. Especially, individual data on households is a powerful tool to analyze an asymmetry between households such as an index of income disparity. In addition to household income and expenditure, the unemployment rate is grasped from a survey of labor force and the level of human capital in a country is measured from statistics on educational status.
There are various household surveys conducted by the Japanese government, but the re-sults from surveys can differ due to method of household surveys. For example, some re-search indicates that the Gini coefficient which is the degree of income disparity varies ac-cording to statistics. (Tachibanaki1998, Funaoka2001, Ohtake2005, Oshio2010, Cabinet Office 2010) In generally, there are two methods of official household survey, which are the inventory survey and sample survey. Sample survey has different sampling methods.
Most surveys are based on the multiple-stage stratified sampling method. The sampling units are randomly selected from the survey unit area stratified based on the Population cen-sus. Detailed survey procedure varies by surveys. On the one hand, the Comprehensive Sur-vey of Living Conditions (hereafter, CSLC) conducted by the Ministry of Health, Labour and Welfare employs a cluster sampling method which covers all household in the survey unit area. On the other hand, the Family Income and Expenditure Survey (hereafter, FIES) and the National Survey of Family Income and Expenditure (hereafter, NSFIE) conducted by the Ministry of Internal Affairs and Communications employ a multiple-stage stratified sampling method which randomly select households in the survey unit area. In addition, FIES and NSFIE tabulate each individual with sampling weight, a technique called ratio es-timation, to collect a sampling bias regarding household characteristics. These survey meth-ods are theoretically equivalent in property. However statistical property could change de-pending on treatment when a survey is refused.
In this paper, we presented the characteristics of various statistics by comparing house-hold-related statistics compiled through different survey methods. To be specific, we com-pared major household-related variables regarding household composition, income and edu-cational attainment. We made known the points of attention at the time of usage by correlating different survey results with different survey methods.
Regarding households comprised of two or more members, there was not any significant difference in the average attributes of surveyed households. However, the distribution of household attributes varied depending on the survey method, and it is possible that the Com-prehensive Survey of Living Conditions covers more non-average households than the Na-tional Survey of Family Income and Expenditure and the Family Income and Expenditure Survey.
506 S Sano, S Tada, M Yamamoto / Public Policy Review
CW6_A6335D04.indd 506 2015/09/03 13:17:29

507
On the other hand, the proportion of single-person households was lower in the Compre-hensive Survey of Living Conditions than in other statistics (Nitta 2004). Presumably, sin-gle-person households were underrepresented in the Comprehensive Survey of Living Con-ditions, which neither adopts substitute households nor uses ratio estimation.
Regarding educational attainment, various statistics show mostly similar distributions. However, the presence of people with “unreported educational attainment” included in the Comprehensive Survey of Living Conditions and the Population Census makes comparison difficult. According to an estimation using cohort information included in the Population Census and the distribution of educational attainment levels included in the Labour Force Survey, people with unreported educational attainment are concentrated among people whose last school education was primary school or junior or senior high school. Excluding people with unreported educational attainment is deemed to be likely to generate a bias.
The remainder of this paper is organized as follows. Section 2 overviews CSLC, FIES and NSFIE which are the fundamental statistics about household. Section 3 compares the household-related characteristics such as number of households and the age of household heads in each statistic. Section 4 makes comparisons regarding educational attainment using CSLC, Population Census and more. Section 5 concludes the report.
II. Brief Summary of Household Surveys in Japan
II-1. Comprehensive Survey of Living Conditions
The purpose of CSLC is “to research basic subjects of living conditions such as health, medical care, welfare, pension, income and to obtain basic data which have been required for the planning and management for the health, labour and welfare administration” and the responsible agency is MHLW. CSLC is conducted using the Large-scale survey, which con-tains detailed household questionnaires, every 3 years and the Small-scale survey in each in-terim year of the Large-scale survey year. This paper focused on the Large-scale survey.
The Large-scale survey has five questionnaires: Household, Health, Long-term care, In-come and Savings. The Household, Health and Long-term care questionnaires are conducted through the following channel: from the MHLW to the Prefecture to the Public health cen-ter. The Income and Savings questionnaire is conducted through the following channel: from the MHLW to the Prefecture to the Welfare office. Enumerators worked together in Public health centers and Welfare offices to distribute and pick up the household question-naires at the survey areas.
The survey unit is households and household members nationwide. The following households are excluded: employee transferred without family, students transferred without family, Inpatients inmates of reformatory institutions, Long-term inpatients in hospitals, and persons in prison. The survey covers all households in the survey unit area. The sampling unit is not households but household members.
The Household and Health questionnaire covered approximately 300,000 households.
Policy Research Institute, Ministry of Finance, Japan, Public Policy Review, Vol.11, No.4, September 2015
CW6_A6335D04.indd 507 2015/09/03 13:17:29
The Long-term care, Income and Savings questionnaire covered households resampling from the units covered by the Household and Health questionnaire. The Sample size of the Household and Health questionnaire is approximately 40,000 households and that of the Long-term care questionnaire is 7,000 household members who need long-term care and as-sistance as defined by the Long-Term Care Insurance Act.
CSLC employs a cluster sampling method. The advantage of cluster sampling is that it covers all household in the survey unit area. The disadvantage of cluster sampling is that an alternative survey unit does not exist if the survey is refused.
II-2. Family Income and Expenditure Survey
The purpose of FIES is “to provide comprehensive data on income and expenditure of households” and the responsible agency is MIAC. The FIES is conducted every month. About 9,000 households (including 800 single-households) are randomly selected for the survey. The FIES is a smaller sample size than the other 2 surveys, but more frequently sur-veyed.
The FIES has four questionnaires: Household Schedule, Family Account Book, Yearly Income Schedule and Savings Schedule. Households answer all questionnaires. Data are ob-tained by the following steps: Enumerators fill in the Household Schedule based on inter-views with households. The Survey is designed so that the sample has to be renewed regu-larly. In the case of two-or-more-person households, one sample household is surveyed for six months and one-sixth of the sample is replaced every month by a new one. While, in the case of one-person households, one sample household is surveyed for three months and one-third of the sample is replaced every month by a new one. After one month after beginning the survey, households are requested to fill in the Yearly Income Schedule with income during the last year. After three month after beginning the survey, households except for one-person households are requested to fill in the Savings Schedule with amount of saving.
The survey unit is households nationwide except for following household: One-person student households, Inpatients in hospitals, inmates of reformatory institutions, Households which manage restaurants, hotels, boarding houses or dormitories or share their dwellings, Households which serve meals to the boarders even though not managing boarding houses as an occupation, Households whose heads are absent for a long time (three months or more), and Foreigner households. The definition of one-person households in FIES is differ-ent from that in CSLS. In the case of FIES, households where the head transferred without family members are divided into two households unit and both households are treated as sampling units.
FIES employs a three-stage stratified sampling method. The sampling units are firstly the municipality, secondly the survey unit area and finally the household. In the first stage, 168 municipalities are selected. In the second stage, the survey unit areas from selected mu-nicipalities at the first stage are selected based on the Enumeration Districts of the Popula-tion Census. In the tertiary stage, from list of all households in the survey unit area, six sam-
508 S Sano, S Tada, M Yamamoto / Public Policy Review
CW6_A6335D04.indd 508 2015/09/03 13:17:29

509
ple households are randomly selected from each survey unit area for two-or-more-person households. When the survey is refused, the enumerator surveys alternative households from within the same survey area. Because the number of one-person households is inde-pendently determined from the household distribution at the survey area, the household dis-tribution is adjusted by the ratio estimation method to correct the characteristics of house-holds. In concrete term, the composition of the area, number of households and age-group is corrected to conform to the household distribution from Labour Force Survey. The ratio es-timation method could correct the bias with regard to the household characteristics due to refusal of the survey1.
II-3. National Survey of Family Income and Expenditure
The purpose of the NSFIE is “to identify overall family budget structure from the point of view of income, consumption and assets” and the responsible agency is the MIAC. The NSFIE is conducted every five years. Sample size is about 57,000 households (including about 4,400 one-person households) in order to investigate the detailed information regard-ing households and compare it to the FIES.
The NSFIE has five questionnaires: Household Accounts A (Two-month period: from September to October), Household Accounts B (One-month period: November), Household, Consumer Durables and Annual Income, Savings. Two-or-more-person households fill in Household Accounts questionnaire from September to November; one-person households from October to November. Households fill in the Consumer Durables and Annual Income, Savings questionnaire with items related to annual income, current savings balance, and cur-rent debt balance as of the end of November and fill in the Household questionnaire with item related to households as of September 1 for two-or-more-person households, as of Oc-tober 1 for one-person households.
The survey unit, similar to FIES, is households nationwide except for following house-holds: Households with four or more live-in employees, Inmates of social and reform insti-tutions, Inpatients in hospitals and sanatoriums, and students. Employees transferred without family are included in one-person households. The sample unit is households unit similar to the FIES.
NSFIE employs a multiple-stage stratified sampling method, but sample households are selected separately for two-or-more-person households and one-person households. In the case of two-or-more-person households, the sampling units are firstly the municipality (all cities, while towns and villages surveyed were selected based on area and industry distribu-tion), secondly the survey unit area and finally 12 households from each survey unit. In the case of one-person households, the sampling units are firstly the survey unit area that is the same as for two-or-more-person households and finally about 4,400 households are selected.
Similar to the FIES, the enumerator of the NSFIE surveys alternative household from
1 See Matsui (2005) for details.
Policy Research Institute, Ministry of Finance, Japan, Public Policy Review, Vol.11, No.4, September 2015
CW6_A6335D04.indd 509 2015/09/03 13:17:29

within the same survey area if the survey is refused. Data obtained from the survey is tabu-lated with the proportional estimation method.
II-4. Comparison regarding Method of Household Surveys
Table 1 shows summary of the CSLC, FIES and NSFIE. This paper investigate the points of attention at the time of usage by comparing household-related statistics compiled
Table 1Comparison of Public Household Surveys
510 S Sano, S Tada, M Yamamoto / Public Policy Review
CW6_A6335D04.indd 510 2015/09/03 13:17:30

511
through different survey methods, and compares each survey related to the correspondence of refusal of the survey.
The FIES is conducted every month, despite a small sample, captures household income and expenditure during survey period taking seasonality into account. The above point is different from the other two surveys. However, survey households bear a heavy burden in terms of filling in the Household Account during the survey period, similar to NSFIE.
The NSFIE is conducted every 5 year with large sample size, but has bias reflected by seasonality due to the specific survey period (two-or-more person households: from Septem-ber to November, one-person households: from October to November). Similar to FIES, survey household bear a heavy burden in terms of filling in Household Account during sur-vey period.
The Large-scale survey of the CSLC is conducted every 3 year with a large sample size.. Compared to items filled in the Household, Health, Long-term care, and Savings question-naire during the survey period, annual income and tax except for a resident tax filled in In-come questionnaire is before a survey year. Annual income, tax and insurance from the other surveys are during the survey period. Even if survey year is the same across these three sur-veys, we need to set a timing of these items across surveys.
The correspondence of refusal and the existence of proportional estimation method caus-es the largest part of the differences across surveys. CSLC does not have the mechanism of adjusting for household distribution without the proportional estimation method due to sur-vey design. If households with a specific characteristic systematically refuse the survey, the distribution of households with these characteristics would be too few.
Because the FIES and NSFIE employ the ratio estimation method, at least a number of household and age distributions are adjusted ex post. In case households with a specific characteristic systematically refuse the survey, data from survey contaminate sampling bias despite adjustment by the ratio estimation method. For example, respondents with relatively better education cause upward bias related to the levels of income and consumption.
III. Comparison regarding Characteristics of Surveyed Households
In this section, we compare the surveys with regard to the composition of household, age and income. We compare the CSLC Income questionnaire at 2010 with the FIES and NSFIE at 2009 to fit a survey year. The figure of the CSLC is tabulated using micro data with sampling weight, and the figures of the FIES and NSFIE are from aggregate statistics. We also use aggregate statistics from the Survey of Labour Force Survey, Household Con-sumption and Population Census if needed. We tabulate figures in a manner as similar as possible across surveys and compare the statistics related not only to the mean but also to the distribution.
Policy Research Institute, Ministry of Finance, Japan, Public Policy Review, Vol.11, No.4, September 2015
CW6_A6335D04.indd 511 2015/09/03 13:17:31

III-1. Comparison regarding Household Composition
Table 2 shows the comparison regarding household characteristics across surveys. In the case of the total household at Panel A, the CSLC has a larger number of households and per-sons aged 65 and older compare to the other 2 surveys. The figure for the number of persons per household in the CSLC is 2.65, and is from 0.15 to 0.2 more than the other surveys. The
Table 2Comparison of Characteristics of Surveyed Households
Notes: CSLC is based on micro data of Income questionnaire. Household head in CSLC are “the person who re-plied as household head”; in CSLS II are “breadwinner”. And CSLC I excludes jobless students.
512 S Sano, S Tada, M Yamamoto / Public Policy Review
CW6_A6335D04.indd 512 2015/09/03 13:17:31

513
figure for the age of household head in the CSLC is 59.1, and is 4 years older than the other surveys. Based on there being 0.1 more persons aged 65 and older, not only the household heads but also the household members in CSLC are older than the other surveys.
Except for the CSLC, there is not any significant difference in the average attributes of surveyed households. The number of persons in households is around 2.5. The age of house-hold heads is around 55 years old. Regarding the household composition, the difference in the number of persons aged 18 and younger is 0.4 and aged 65 and older is from 0.5 to 0.6. These results indicate that these surveys are homogenous except for the CSLC.
To investigate the difference between the CSLC and the others, we tabulate the share of households by the number of household members in Table 3. The share of one-person households in the CSLC is 21.8% compared to around 30% in other surveys. It is possible that the lower share of one-person households in the CSLC affect the household composi-tion. We tabulate the figure divided into two groups: one-person households at Panel B and two-or-more person households at Panel C in Table 2. All figures of persons per households at Panel C in Table 2 are identical. The reason for the lower number of household members in the CSLC is the lower share of one-person households.
We compare the figures at Panel B in Table 2 to investigate the lower share of one-per-son households in the CSLC. The CSLC has a higher share of elderly and female and lower household income households than other surveys. The average age of household heads is 61.1, the share aged 65 and older is above 50% and the share of female is 56.5%. The CSLC has a higher share of female household heads, in comparison with the Population Census (45.7%). Annual income in the CSLC is about 2.6 million yen, this is from 0.5 million to 0.6 million yen lower than other surveys.
These differences come from the definition of one-person household or sampling bias. We discuss the definition of one-person household. The CSLC includes students but ex-cludes single households who live in boardinghouses. In contrast, FIES and NSFIE include single households who live in boardinghouse but exclude student. CSLC in table 2 shows
Table 3Distribution by Number of Household Members (Total Households)
Policy Research Institute, Ministry of Finance, Japan, Public Policy Review, Vol.11, No.4, September 2015
CW6_A6335D04.indd 513 2015/09/03 13:17:32

the figures of single households excluding student. We found similar result. According to NSFIE, share of households in boardinghouse out of all single household is less than 1%. Therefore whether including households in boardinghouse or not doesn’t affect the result. Even if we compare the figures arranging the conditions, these differences do not come from the difference of the definition of one-person households.
Let us examine the sampling bias in more detail. Here, we compare the figures with the Population Census because of the inventory survey. We consider that the figures with Popu-lation Census to be more accurate values than other surveys. Figure 1 shows the distribution by age-group and by gender for single households. Compared with the Population Census, the share of under 50 age in both the CSLC and NSFIE is lower, and the share above 60 age is higher. Concerning the gap versus the Population Census, the gap between the CSLC and Population Census for single households is wider in each age group. Especially, the share of above 70 aged female in CSLC is about 31% contrary to about 17% in the Population Cen-sus. As just described, single household in CSLC has sampling bias toward older female persons. In generally, younger household heads take on a job and refuse the survey more of-
Figure 1Comparison of Distribution for One-person Households by Age Group and Sex
514 S Sano, S Tada, M Yamamoto / Public Policy Review
CW6_A6335D04.indd 514 2015/09/03 13:17:32
515
ten than older persons. In addition, there are more females in old single households. There-fore, the share of female into one-person households is high in both the CSLC and NSFIE.
However, uncooperative responses from young persons should be about the same for all surveys. Sampling bias in the CSLC comes from both the sampling and tabulation method. The FIES and NSFIE with a multi-stage stratifying sampling method make it possible to ob-tain an alternative sample and to correct the distribution of household composition using ra-tio estimation. In contrast, the CSLC with a cluster sampling method cannot apply these methods. Therefore, if young people refuses the survey, the share of one-person households of total household is lower and the share of older female households in one-person house-holds are higher in the CSLC sample.
III-2. Comparison regarding Households Comprised of Two or More Members
As described above, a difference has been found between the CSLC and other surveys regarding one-person households and total households due to the sampling method. There-fore we focus on two-and-more person households. Statistics like the number of household members roughly coincide with the average values across the surveys, but a slight difference remains regarding the persons per households aged 65 and over, age of households head and earners per households. The average of person per households aged 65 and over with the CSLC is 0.77 and 0.1 more than other surveys. The age of household heads with the CSLC and Survey of Household Economy is around 58, 3 years older than other surveys. Earner per household with the FIES is 1.37, 0.1 fewer than other surveys.
It is possible that the difference regarding age of households head comes from the defi-nition of household head. In the NSFIE, FIES and Survey of Household Economy, house-hold heads are defined as the main earner in the household. In contrast, household head is defined as the reported household head in the CSLC (Funaoka 2001). We tabulate statistics for the household head as main earner in CSLC II in Table 2, because our micro data for CSLC enable us to utilize annual income for each household member. Average age of house-hold head changes to 55.2, and is consistent with other surveys. Therefore, older age of household head in CSLC is due to the difference of the definition of household head. Al-though it is consistent in regard to the household age arranging the definition across surveys, but the share of male household heads drops to 81.3%, whose figure is inconsistent with other surveys. To investigate the reason why this change occurs is a future project.
Regarding households comprised of two or more members, there was not any significant difference in the average attributes of surveyed households, except for a small difference re-garding averages per households aged 65 and over and earners per households. Using micro data has a significance in comparing not only averages, but also regarding distribution. Ta-ble 4 shows the distribution of household characteristics obtained from each surveys. Note that we correct the household head in the CSLC to be the main earner in the household.
The distribution concerning household age, number of household members and house-hold composition out of household characteristics from the CSLC, FIES and NSFIE is com-
Policy Research Institute, Ministry of Finance, Japan, Public Policy Review, Vol.11, No.4, September 2015
CW6_A6335D04.indd 515 2015/09/03 13:17:32

parable with the figures from the Population Census. Regarding age of household head and number of household members, there is not any significant differences in distribution. It is natural that the figures from the FIES and NSFIE are consistent with figures from the Popu-lation Census, because the FIES and NSFIE employ the ratio estimation method to confirm to the distribution from the Population Census by-region and per-household. Although the CSLC does not adjust the distribution because it employs the clustering sampling method, these figures are roughly consistent across surveys. In so far as two-or-more households, there is not any significant difference in the distribution across surveys.
However there is significant difference in the distribution of household composition be-cause of lack of adjustment using ratio estimation. The sum of married couple and married couple with children accounts for a large part of total family in many surveys. On the one
Table 4Distribution of Two-or-more-person Households
516 S Sano, S Tada, M Yamamoto / Public Policy Review
CW6_A6335D04.indd 516 2015/09/03 13:17:32

517
hand, the figure in the CSLC is about 70%, which is consistent with the one in the Popula-tion Census. On the other hand, the figure in the FIES and NSFIE is about 80%, which is 10% higher than the Population Census. In addition, except for the sum of married couple and married couple with children in the CSLC, the share of one parent with children is low-er (similarly with the FIES and NSFIE), and the share of married couple, their children and parents is more than in the Population Census.
Let us compare earner per households, occupation and annual income which are not re-ported in the Population Census. The CSLC has a large share of three-or-more-person earn-ers. In contrast, the FIES and NSFIE have a large share of one-person earner. Regarding oc-cupation, The CSLC has a larger share of self-employed household than other surveys. Regarding annual income, the share of below 3 million yen is about 20% in CSLC in con-trast to from 12 to 13% in the FIES and NSFIE, which means the CSLC has a large share of lower income households. It’s not always true that the CSLC covers lower income house-holds more than other surveys. But the share of above 15 million yen is 4.2%, which is 1% higher than the FIES and NSFIE. This is similar to findings from Yamaguchi (2014) who pointed out that the NSFIE is thicker around median and thinner in the tail of the income distribution compared with the CSLC. The CSLC covers more not-average-households re-garding not only income but also other characteristics than FIES and NSFIE.
It is possible that the difference of distribution between the CSLC and the FIES and NS-FIE comes from the sampling method. The CSLC employs clustering sampling, in contrast, the FIES and NSFIE employ stratified sampling. These methods are equivalent in statistical theory, but it could make difference depending on treatment when a survey is refused.
It is another possibility that the burden of filling-in the questionnaire makes a difference. The CSLC employs the pre-coded questionnaire, which means survey respondents answer only once during the survey period. In contrast, the respondents of the FIES and NSFIE are requested to fill in the open-answered Family Account Book during the survey period (FIES: 6 months, NSFIE: 3 months). The heavy burden of answering the questionnaire may lead to refusal of the survey. It is possible that different types of survey methods and burdens of an-swering the questionnaire may make a difference in the distribution.
III-3. Comparison regarding Annual Income
At the bottom of Table 2 shows the comparison regarding annual income which is a comparable economic variable among the three surveys. As described above, we focus on the panel C in Table 2 because there is a significant difference in one-person households. In two-and-more member households, annual income from the FIES and from CSLC are around 6.3 million yen, but annual income from the NSFIE is 0.2 million higher than others. These differences are about 3%, which is not particularly significant, we investigate the source of these differences.
As described above, the CSLC has more young and elderly respondents than the NSFIE, and the NSFIE has more in the 50-69 age group than another survey. Considering differenc-
Policy Research Institute, Ministry of Finance, Japan, Public Policy Review, Vol.11, No.4, September 2015
CW6_A6335D04.indd 517 2015/09/03 13:17:32
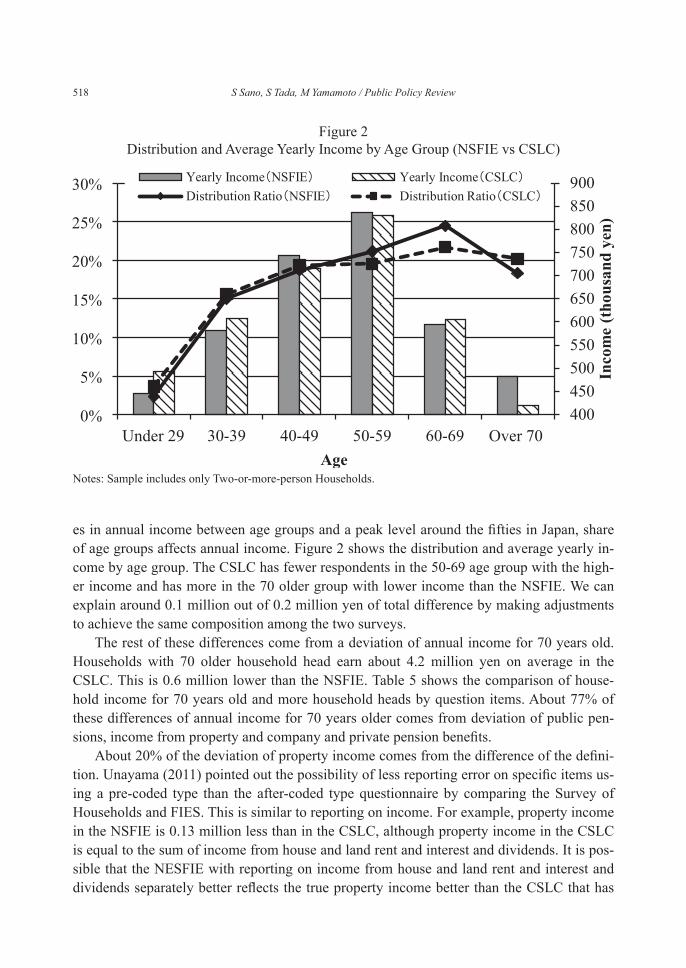
es in annual income between age groups and a peak level around the fifties in Japan, share of age groups affects annual income. Figure 2 shows the distribution and average yearly in-come by age group. The CSLC has fewer respondents in the 50-69 age group with the high-er income and has more in the 70 older group with lower income than the NSFIE. We can explain around 0.1 million out of 0.2 million yen of total difference by making adjustments to achieve the same composition among the two surveys.
The rest of these differences come from a deviation of annual income for 70 years old. Households with 70 older household head earn about 4.2 million yen on average in the CSLC. This is 0.6 million lower than the NSFIE. Table 5 shows the comparison of house-hold income for 70 years old and more household heads by question items. About 77% of these differences of annual income for 70 years older comes from deviation of public pen-sions, income from property and company and private pension benefits.
About 20% of the deviation of property income comes from the difference of the defini-tion. Unayama (2011) pointed out the possibility of less reporting error on specific items us-ing a pre-coded type than the after-coded type questionnaire by comparing the Survey of Households and FIES. This is similar to reporting on income. For example, property income in the NSFIE is 0.13 million less than in the CSLC, although property income in the CSLC is equal to the sum of income from house and land rent and interest and dividends. It is pos-sible that the NESFIE with reporting on income from house and land rent and interest and dividends separately better reflects the true property income better than the CSLC that has
Figure 2Distribution and Average Yearly Income by Age Group (NSFIE vs CSLC)
Notes: Sample includes only Two-or-more-person Households.
518 S Sano, S Tada, M Yamamoto / Public Policy Review
CW6_A6335D04.indd 518 2015/09/03 13:17:32

519
Notes: Sample includes only Two-or-more-person Households and 70 years old and more Househeads.
Table 5Comparison of Household Income for 70 years old and more Househeads by question items
Notes: Sample includes only Two-or-more-person Households.
Figure 3Distribution and Average Yearly Income by Age Group (NSFIE vs FIES)
Policy Research Institute, Ministry of Finance, Japan, Public Policy Review, Vol.11, No.4, September 2015
CW6_A6335D04.indd 519 2015/09/03 13:17:33

reporting only on property income. By the way, there remains 0.2 million yen difference regarding annual income between
the FIES and NSFIE. As noted, although the composition regarding age of household head is a slight difference, the remaining 0.2 million difference in annual income is open to ques-tion. To investigate the question, we construct a Figure 3 as distribution and average yearly income by age group using the NSFIE and FIES. We find that there are not such significant differences in age distribution concerning under 49 years old and average income. But the groups above 50 years old in the NSFIE earn about 0.3 million yen more than ones in the FIES. The difference in the questionnaire between the NSFIE and FIES causes these devia-tions in income. FIES captures the earnings of household heads and other household mem-bers. By contrast, the NSFIE captures the earnings of household heads, of spouses of house-hold heads, of other household members above 65 years old, and of household members under 65 years old separately. There are 8 types of earnings in the FIES compared to 11 types of earnings in the NSFIE. The item of other income in the FIES includes income from house and land rents, interest and dividends, company and private pension benefits and re-mittance from relatives in the NSFIE. It is possible that the differences in the questionnaires cause the deviation of annual income for above 50 years old who begin to earn more outside the field of earnings at work.
IV. Comparison regarding Educational Attainments of Surveyed Households
IV-1. Availability of Information about Educational Attainment from Household Surveys
Recently, analysis regarding education attracts attention in research regarding house-holds. A high level of education improves high labor quality. Additionally, education is an important determinant factor regarding social class and affects the levels of consumption and leisure. However, in Japan, the statistics regarding academic attainment are not estab-lished adequately. In this sub-section, we summarize the availability of information regard-ing academic attainment and clarify the problems to be addressed in survey of education.
There are three ways obtaining information regarding education from public statistics in Japan. First, household surveys such as the Population Census directly ask respondents about the household members regarding school and educational background. Second, estab-lishment surveys such as the Basic Survey on Wage Structure ask respondents about the em-ployee’s schooling selected from a sampling from each establishment, or the number of ap-pointments of new graduates by educational group. Last, school surveys such as the Basic School Survey asks respondents about the number of enrollment and graduates.
Each method has advantages and disadvantages. The advantages of household survey are that it is easy to obtain the information about the education of each respondent because of direct survey. Additionally, we can grasp the information during the survey period and can make aggregate statistics by the local or national level. From the academic point of view, it enables estimation of the return to education combined with other survey items from
520 S Sano, S Tada, M Yamamoto / Public Policy Review
CW6_A6335D04.indd 520 2015/09/03 13:17:33

521
the household survey (Sano and Yasui 2009). By contrast, the disadvantages are the possi-bility of measurement error coming from a dealing with a drop out in questionnaire partici-pation and of non-sampling error coming from refusals of the surveys from individuals with a systematic characteristics.
The advantages of establishment surveys are the same as the household survey regarding availability of individual educational background. Additionally, rich information regarding employment and wages enables us to estimate the Mincer Wage Equation. (Kawaguchi 2011) By contrast, disadvantages come from the possibility of violation of random sampling assumption and less information about variables related with family background compared to employment because of sampling design.
The advantages of school surveys are the accurate statistics related with the numbers of enrollment and graduates because of inventory surveys and the easy aggregation by the local and macro level. However, it is not necessarily easy to aggregate statistics by age group. School surveys can capture accurate numbers for the compulsory education, but cannot cap-ture the numbers in higher education where ages are not uniformed distributed. Another dis-advantage is that school surveys do not have individual or household variables due to survey design.
When we see the picture of educational attainment and utilize statistics for research, what types of surveys are suitable depend on the subject. For example, an establishment sur-vey is suitable for estimation of a wage equation which measures the relationship between detailed wage information and education. In the case of analysis taking into account work-ing decision, a household survey is suitable because of the inclusion of household character-istics. In the case of measuring national levels of human capital, it makes it possible to tabu-late aggregate statistics not only by using household surveys (Barro and Lee 2000), but also by using school surveys if measurement error is taken into consideration (Godo 2011).
In this section, we compare the information regarding educational attainment obtained from the CSLC at 2010, the Population Census and the Labour Force Survey (hereafter LFS) which are household surveys2. In comparing the surveys, we note the following two points. First, the difference of definition in each surveys matters. Each survey asks the re-spondents about school attendance using mains question and about types of last school com-pleted using sub questions in each questionnaire. Thed CSLC classifies the types of last school completed as 6 categories (elementary and junior high school, high school, vocation-al school, junior college or higher professional school, university, and graduate school). The Population Census classifies the types of last school completed as 4 categories (elementary and junior high school, high school, junior college or higher professional school, university and graduate school). The LFS classifies the types of last school completed as 3 categories (below high school, junior college or higher professional school, university and graduate school). What category vocational school is classified as is a point of difference. On the one
2 The Employment Status Survey is another candidate for comparing the information regarding education. But Employment Status Surveys were conducted in 2007 and 2012.
Policy Research Institute, Ministry of Finance, Japan, Public Policy Review, Vol.11, No.4, September 2015
CW6_A6335D04.indd 521 2015/09/03 13:17:33

hand, respondents with the vocational school degree classified by the CSLC choose the questionnaire item which is prepared by survey conductor. On the other hand, the vocational school respondents of the Population Census or LFS classify themselves using instructions and choose the proper items3. It is possible that the different results result among surveys are observed due to divergent definitions of vocational school in each survey.
Second, the problem arising from “unreported educational attainment” makes different results among surveys. It is possible that respondents with specific characteristics refuse the survey or the specific survey items. Although information regarding gender or number of household members are observed from other sources, marital, job and educational status are observable only by being investigated through household survey. Additionally, even if re-spondents answer a survey, some respondents don’t respond to specific items such as educa-tion. These are treated as “unreported or unknown items”. Because it is sensitive for respon-dents to answer about educational attainment, there are a measurable number of “unreported” responses and it leads to difficulty in comparing surveys.
IV-2. Comparison regarding Educational Attainment
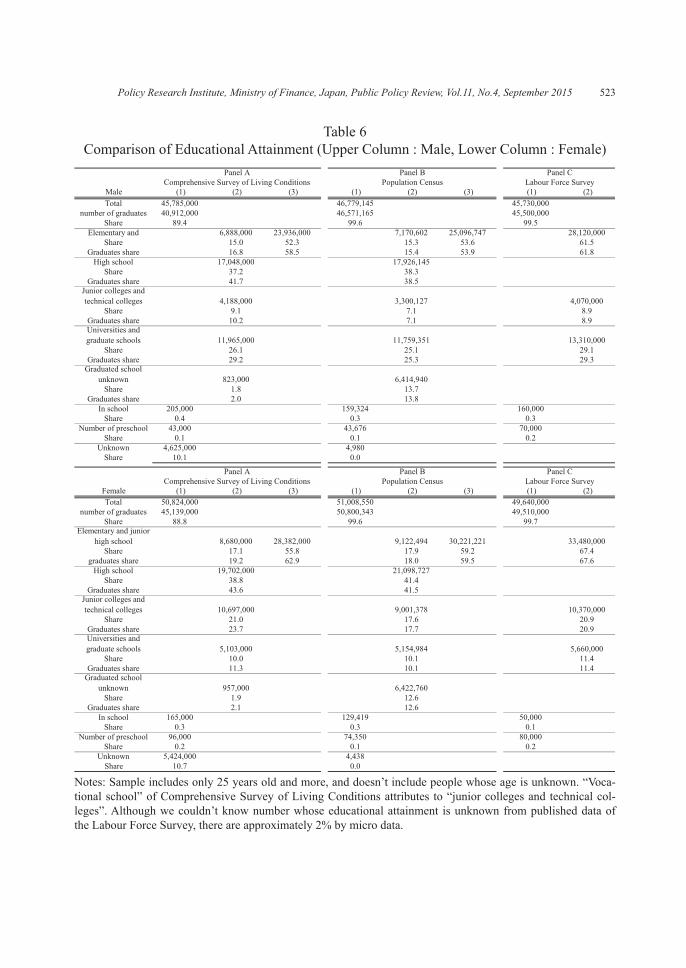
Let us compare the educational attainment form for each household survey. Table 6 shows the result of distribution of educational attainment by gender from the CSLC (Panel A), Population Census4 (Panel B) and LFS (Panel C). Note that the classification of educa-tional attainment in each survey is adjusted5, and figures are tabulated using above 25 years old because they are rarely changed6.
According to columns (1) at each panel in Table 6, the total number is the same among surveys, but number of graduates in the CSLS is 5 million less than other surveys. This re-sult comes from the approximately 10% “unknown” which is unreported educational status in the CSLS.
Column (2) at each panel in Table 6 indicates the distribution of types of last school completed. Let us compare the CSLC and Population Census. The shares of the total num-ber have a similar tendency among each survey. In contrast, the numbers of graduates devi-ate between each survey. The CSLC has 0.5 million less elementary and junior high school graduates for both sexes than Population Census. The CSLC has one million less male high school graduates and 1.3 million fewer female high school graduates than the Population Census. High school graduates in the CSLC are 0.8 million more for male and 1.6 million more for female than the Population Census due to the divergent definition of vocational school in each survey. Graduates with university and graduate school degrees are similar in magnitude across surveys. However there are a measurably large number of cases of unre- 3 For example, if respondents graduated from 4 year or above vocational school, they are categorized as 4 year college gradu-ates. If respondents graduated from 2 or below 4 year vocational school, they are categorized as 2 year college graduates.4 We use only a Japanese sample. It remained unchanged including non-Japanese.5 Vocational school in the CSLC is included in the junior college or higher professional school category.6 As described in the previous section, although it is important for comparison to include one-person household samples, we make a comparison using a number of households.
522 S Sano, S Tada, M Yamamoto / Public Policy Review
CW6_A6335D04.indd 522 2015/09/03 13:17:33
523
Notes: Sample includes only 25 years old and more, and doesn’t include people whose age is unknown. “Voca-tional school” of Comprehensive Survey of Living Conditions attributes to “junior colleges and technical col-leges”. Although we couldn’t know number whose educational attainment is unknown from published data of the Labour Force Survey, there are approximately 2% by micro data.
Table 6Comparison of Educational Attainment (Upper Column : Male, Lower Column : Female)
Policy Research Institute, Ministry of Finance, Japan, Public Policy Review, Vol.11, No.4, September 2015
CW6_A6335D04.indd 523 2015/09/03 13:17:34

ported educational attainment in the CSLC and Population Census. These results are changeable depending on how vocational school is categorized, so it makes difficult to com-pare the results across surveys.
Columns (3) at each panel in Table 6 shows the comparison result adjusted to categories using the LFS definition. Unreported is not shown in published aggregate statistics, so we calculate and find 2% unreported using micro data and find a less serious unreported prob-lem in the LFS. From the point of view of both the share and number of graduates, both the CSLC and Population Census have fewer numbers of graduated in each education group, except for junior college or higher professional school, than the LFS. Especially, the devia-tion regarding elementary and junior high school graduate is large, say, from around 3 to 5 million. However, because junior college or higher professional school graduates in the CSLC include vocational school graduates, with about 3 million for male and 4.6 million for female, the CSLC has fewer graduates assigned to junior college or higher professional school than LFS. Namely, the deviation of graduates of the last school category across sur-veys remains despite taking into account the definition: this deviation comes from unreport-ed educational attainment.
IV-3. Issue arising from“Unreported Educational Attainment”
From the nature of survey design, household surveys could be subject to the refusal the surveys or unreported specific items. These are treated as “unreported or unknown”. It caus-es biased result whether or not the unreported sample is included. A recent study pointed out that the Population Census which is a fundamental survey has an unreported problem (Un-ayama 2013, Yamada 2012, Abe 2013, Koike and Yamauchi 2014). The unreported problem tends to occur for age, marital, job, resident and educational status and not to occur in gen-der and number of household members which are easy to investigate from other sources. Especially, unreported problem in educational status is serious. According to panel B in Ta-ble 6, the share of unreported educational status in population is about 13%, which is a rapid increased from the prior Large Scale Population Census in 2000 (about 3.5%). CSLC, panel A in Table 6 shows a similar result of a measurably large share of unknown educational sta-tus for male: 10.1%, and for female: 10.7%.
The way to treat unreported educational attainment depends on the assumption of their structure. In the case of removing the unreported ones from aggregation, we must impose the assumption that respondents with reported and respondents with unreported have the same property. However, this assumption is not always true. For example, suppose that sin-gle respondents lived in apartment with an automatically locked door in a city tend to refuse the survey. The average property of these people can differ from the respondents living in rural area. Although the characteristics of unreported respondents cannot be known in ad-vance, we can estimate which educational group tend to be an unreported one using other statistics.
There are two ways to estimate which educational group tend to be unreported. One way
524 S Sano, S Tada, M Yamamoto / Public Policy Review
CW6_A6335D04.indd 524 2015/09/03 13:17:34

525
is the cohort estimation using the prior Large Scale Population Census in 2000. The unre-ported problem in 2000 is not serious, because the unreported share of total graduates was about from 3 to 4% in 2000. And we can investigate the transition of the same cohort for ten years using the information across two periods. Another way is the comparison regarding distribution of education between the observed and predicted results using the LFS which is regarded as a true distribution in Japan. The LSF is conducted using a random sampling method based on the composition of gender, age group and area in the Population Census, which is able to restore the national information. If survey from random sampling based on gender, age group and area represents the true distribution of education, the predicted distri-bution of other statistics is restored using FLS. Although each method is not completed, comparison between different methods clarifies the characteristics of unreported educational attainment.
Let us explain the way to predict using cohort information. For example, high school graduates born in 1970 aged 30 in 2000 are expected to be 40 years old with a high school degree in 20107. If the high school graduates born in 1970 decreased rapidly, when the com-parison between actual graduates and predicted graduates are adjusted by changes in popu-lation from 2000 to 2010, they probably become unreported in 2010.
Let denote that t is survey year, c is age cohort, n is number of population and e is num-ber of graduates for each group. The rate of cohort change is rc = /c c
10n 00n , where tcn is popula-
tion in cohort c in survey year t. Assume that the rate of cohort change is constant across ed-ucation group, the predicted number of graduates in 2010 using information in 2000 can be estimated as rc c
00e and the deviation from predicted to observed can be calculated by each group. The sum of deviations predicted from 2000 is equal to unreported in 2010. We tabu-late the statistics by cohort, by gender and by education group using the above prediction method. The predicted deviation divided by population can be interpreted as the index of tendency of being unreported. The positive value of this index means observed statistics are underestimated, and that the opposite is true. In prediction, we restricted the sample between graduates born from 1971 to 75 and graduates born from 1926 to 30.
Let us explain the method to predict using the LFS. Assume that the distribution of edu-cation obtained from the LFS is true, we compare between observed and predicted distribu-tions of education in the CSLC and Population Census, and we investigate which education-al groups are to be unreported.
The method of prediction is as follow. Let ELF denote total number of graduates and the education group is i, and the age group is j. The group weight of each groups is wij and the number of each groups is ij
LFe , and total number of graduates is defined as:
E LF wij=j j
ijLFe (1)
7 Of course, last school completed might be changed for 10 years.
Policy Research Institute, Ministry of Finance, Japan, Public Policy Review, Vol.11, No.4, September 2015
CW6_A6335D04.indd 525 2015/09/03 13:17:35
After being adjusted to the category of each type of completed school, survey is S in-cluding CSLC and Population Census, total number of graduates for each survey is Es, the number of each group is ij
Se . Predicted total number of graduates using LFS for each survey S defines as:
ECSLC wij=j j
ijCSLCe (2)
The deviation from predicted to observed, is equal to unreported. And predicted deviation divided by the number of graduates is the index of tendency of being unreported for each groups. We restricted sample above 35 years old to compare with cohort analysis8.
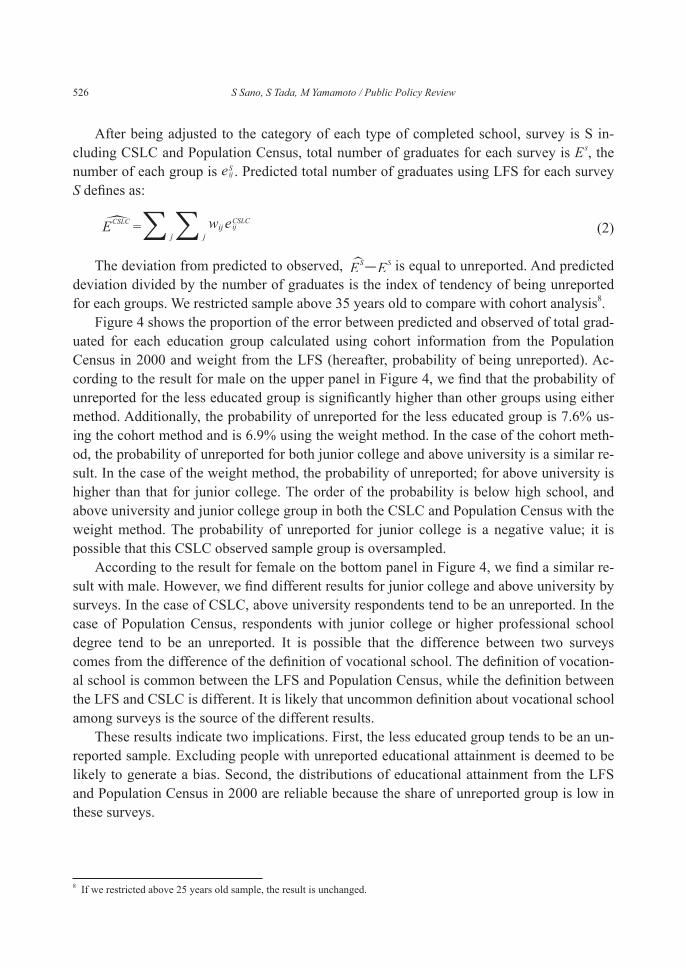
Figure 4 shows the proportion of the error between predicted and observed of total grad-uated for each education group calculated using cohort information from the Population Census in 2000 and weight from the LFS (hereafter, probability of being unreported). Ac-cording to the result for male on the upper panel in Figure 4, we find that the probability of unreported for the less educated group is significantly higher than other groups using either method. Additionally, the probability of unreported for the less educated group is 7.6% us-ing the cohort method and is 6.9% using the weight method. In the case of the cohort meth-od, the probability of unreported for both junior college and above university is a similar re-sult. In the case of the weight method, the probability of unreported; for above university is higher than that for junior college. The order of the probability is below high school, and above university and junior college group in both the CSLC and Population Census with the weight method. The probability of unreported for junior college is a negative value; it is possible that this CSLC observed sample group is oversampled.
According to the result for female on the bottom panel in Figure 4, we find a similar re-sult with male. However, we find different results for junior college and above university by surveys. In the case of CSLC, above university respondents tend to be an unreported. In the case of Population Census, respondents with junior college or higher professional school degree tend to be an unreported. It is possible that the difference between two surveys comes from the difference of the definition of vocational school. The definition of vocation-al school is common between the LFS and Population Census, while the definition between the LFS and CSLC is different. It is likely that uncommon definition about vocational school among surveys is the source of the different results.
These results indicate two implications. First, the less educated group tends to be an un-reported sample. Excluding people with unreported educational attainment is deemed to be likely to generate a bias. Second, the distributions of educational attainment from the LFS and Population Census in 2000 are reliable because the share of unreported group is low in these surveys.
ES ES-
8 If we restricted above 25 years old sample, the result is unchanged.
526 S Sano, S Tada, M Yamamoto / Public Policy Review
CW6_A6335D04.indd 526 2015/09/03 13:17:35

527
Notes: Sample includes only 35 years old and more as of 2010. “Weight” indicates estimation by distribution of Labour Force Survey, and “Cohort” indicates estimation by using cohort information of Population Census.
Figure 4Incidence of Unknown by Educational Attainment (Upper Figure : Male, Lower Figure : Female)
Policy Research Institute, Ministry of Finance, Japan, Public Policy Review, Vol.11, No.4, September 2015
CW6_A6335D04.indd 527 2015/09/03 13:17:35

V. Concluding Remarks
This paper identified the characteristics of various statistics and the points of attention at the time of usage by comparing household-related statistics compiled through different sur-vey methods. Regarding households comprised of two or more members, there was not any significant difference in the average attributes of surveyed households. However, the distri-bution of household attributes varied depending on the survey method, and it is possible that the Comprehensive Survey of Living Conditions covers more non-average households than the National Survey of Family Income and Expenditure and the Family Income and Expen-diture Survey. On the other hand, the proportion of single-person households was lower in the Comprehensive Survey of Living Conditions than in other statistics. Presumably, sin-gle-person households were underrepresented in the Comprehensive Survey of Living Con-ditions, which neither adopts substitute households nor uses ratio estimation.
Regarding educational attainment, various statistics show mostly similar distributions. However, the presence of people with “unreported educational attainment” included in the Comprehensive Survey of Living Conditions and the Population Census makes comparison difficult. According to an estimation using cohort information included in the Population Census and the distribution of educational attainment levels included in the Labour Force Survey, people with unreported educational attainment are concentrated among people whose last school education was primary school or junior or senior high school. Excluding people with unreported educational attainment is deemed to be likely to generate a bias.
The implication obtains from this paper is as follow. Because there was consistent result in the case of two-and-more household members, the CSLC is comparable with other house-hold surveys. The result regarding educational attainment also is consistent in spite of slight difference regarding definition.
The advantage of the clustering sampling method is to capture many non-average house-holds. Without ratio estimation to adjust to characteristics for respondents, it is likely to generate a bias. However, the burden and the method of filling in the questionnaires could make respondents with systematic characteristics drop from the surveys.
Adding to result from unreported educational attainment problem, a lower collection rate from respondents with less educational background is likely to generate a deep bias in both clustering and stratified survey. Not only airing the understanding of public statistics but also enriching the crosscheck across the surveys such as adding the item regarding edu-cation, which is not included in the NSFIE, is good idea.
References
Abe, T. (2013), “Statistics Survey: Problems Concerning Unidentified Samples on National Census”, Tokei, December 2013, pp. 51–54. (in Japanese)
Barro, R. and J. Lee (2000) “International Data on Educational Attainment Updates and Im-
528 S Sano, S Tada, M Yamamoto / Public Policy Review
CW6_A6335D04.indd 528 2015/09/03 13:17:35

529
plications”, NBER Working Paper 7911Cabinet Office (2010), Annual Report on the Japanese Economy and Public Finance (in
Japanese)Funaoka, F. (2001), “Japan’s Inequality in Income Distribution”, Keizai Kenkyu, Vol. 52 No.
2, pp. 117–131. (in Japanese)Godo, Y. (2011) “Estimation of Average Years of Schooling for Japan, Korea and the United
States”, PRIMCED Discussion Paper Series, No. 9Kawaguchi, D. (2011), “Applying the Mincer Wage Equation to Japanese Data”, in Abe,
K,M. Ogaki, K. Ogawa and T. Tabuchi, (eds.), Gendai Keizaigaku no Tyoryu 2011, Toyo Keizai Shimposha (in Japanese)
Koike, S. and M. Yamauchi (2014), “Unidentified Samples in National Census 2010: Focus-ing on Residences Five Years Ago”, Jinko Mondai Kenkyu, No. 70–3, pp. 325–338. (in Japanese)
Matsui, H. (2005), “Introduction of Sampling Survey Method: Fundamental Theory and Practice of Sampling Survey”, Nihon Tokei Kyokai (in Japanese)
Nitta, I. (2004), “Study for Research Design of Comprehensive Survey of Living Condi-tions: Considering Effects of Non-response Data”, Kosei no Shihyo, Vol. 51 No. 11, pp. 24–28 (in Japanese)
Ohtake, F. (2005), Inequality in Japan, Nihon Keizai Shimbunsha (in Japanese)Oshio, T. (2010), Public Welfare Analysis of Redistribution, Nippon Hyoron Sha (in Japa-
nese)Sano, S. and K. Yasui (2009), “Estimation of Return to Education in Japan”, Kokumin
Keizai Zasshi, Vol. 200 No. 5, pp. 24–28. (in Japanese)Tachibanaki, T. (1998), Economic Disparity in Japan, Iwanami Shinsho (in Japanese)Unayama, T. (2011), “Family Income and Expenditure Survey: Problems and Remedies”,
Tokei to Nihon Keizai, Vol. 1 No. 1, pp. 3–28. (in Japanese)Unayama, T. (2013), “Nursery School Effects on the Trade-off Between Marriage and Jobs:
Evidence from National Census 2010 in Japan”, RIETI Discussion Paper Series, 13-J-039 (in Japanese)
Yamaguchi, M. (2014), “Widening Income Inequality and Reexamining the Effect of Popu-lation Aging”, Keizai Kenkyu, Vol. 65 No. 1, pp. 86–93. (in Japanese)
Yamada, S. (2012), “Precision of Metropolitan Population by Sex and by Age in National Census 2010”, Seikei Ronso, Vol. 158, pp. 35–67. (in Japanese)
Policy Research Institute, Ministry of Finance, Japan, Public Policy Review, Vol.11, No.4, September 2015
CW6_A6335D04.indd 529 2015/09/03 13:17:35


