SHIH Et Al (2006) - Effect of Nanosilica on Characterization of Portland Cement Composite
9
Materials Science and Engineering A 424 (2006) 266–274 Effect of nanosilica on characterization of Portland cement composite Jeng-Ywan Shih, Ta-Peng Chang ∗ , Tien-Chin Hsiao Department of Construction Engineering , National Taiwan Universit y of Science and Techno logy , Taipei 10672, Ta iwan, ROC Received 16 November 2005; accepted 4 March 2006 Abstract Both the filling effect and the pozzolanic reaction make siliceous materials as one of major ingredients of high-performance Portland cement- based composites. Hence, the introduction of nanosilica with finer particle size and larger silicon dioxide to the composite becomes a great deal of interest in recent years. In this study , a liquid-for m of nanosilica particle with a spherical diameter of about 20 nm was incorporate d into the Portland cement paste at five different dosages and analyzed at four different ages to identify the nanosizing effects on the microstructures and material properties of composite cement paste. Experimental results show that the Portland cement composite with 0.60% of added nanosilica by wei ght of ceme nt has an opt imu m compre ssi ve str eng th, inwhich theincrease of compre ssive str eng th is about 43. 8%. Mor eov er, the cor res pondin g nanosilica paste of one portion of water mixed with nanosilica of 1.08 wt.% of water has the maximum absolute value of zeta potential of 41.3 mV . Pro per tie s thr ough the ana lys es of NMR, BETand MIPalso ind ica te tha t the mic ros tru cture of Portland cement compos ite wit h nanosi lic a evi den tly has a more solid, dense and stable bonding framework. © 2006 Elsevier B.V. All rights reserved. Keywords: Nanosilica; Cement paste; Compressive strength; Zeta potential 1. Intro ductio n Due to results of the filling effect to reduce porosity by uniform distribution of particle size and the pozzolanic reac- tion that consu mes calci um hydro xides (Ca(OH 2 )) to yi eld cal cium sili cat e hyd rat es (C–S –H) , the silica fume, a con - ventional supplementary cementitious material, is one of the very important admixtures for producing the high-performance Portland cement-based concrete with enhancing strength and abrasion resistance along with reducing permeability and dry shrinkage [1–4]. In order to obtain further improvements of Portl and cemen t-bas ed comp osite (or alter nati vely called as cement composite for simplicity when appropriate hereinafter), siliceous materials of higher purity and finer size are intro- duc ed. In the pas t dec ade , novel proper ties of nanoparticles with 1–100 nm scale have attracte d enormous attention [5]. Among these nanoparticles, nanosilica is commonly used for reinforce- men t of pol yme r to inc rea se the har dness,modulus,wea the rab il- ity, flammability, and so on [6–10]. Likewise, some efforts on excellent mechanical properties and microstructure of cement composites with nanosilica have been also reported [11,12], in ∗ Corresponding author. Tel.: +886 2 2737 6577; fax: +886 2 2737 6606. E-mail address: [email protected] (T.-P. Chang). which a water reducing agent was always applied to aid the dispersion of nanosilica during the process of specimen prepa- ration. Although, the water reducing agent may help improve themateri al proper ties of cement compos ites, some unp redict ed interaction among water, water reducing agent, nanosilica and cement is anticipated to complicate the study on the chemical mec han ism of such compos ite mat eri al. For this reason, in order to alleviate the complex interaction of state variables and to pro per ly evaluatetheinfluen cin g ef fec ts of nan osilica on cement composites, this study does not include water reducing agent as one of the ingredients. Rather, only the addition of nanosilica in liquid form was included to investigate the characteristics of corresponding cement composite. On the other hand, the zeta potential is the electric potential around the particle on the slip surface within an electric double layer formed at the particle–liquid interface. In the slip sur- face, the double layer is divided into two parts: the inner region named stern layer and the outer region called diffusive layer. Because the zeta potential performs the quantitative measure on the effective charge of particles, it is related to the stability and agglomeration processes. In other words, if the repulsive force between approaching particles becomes high enough, then they will repel each other to make them separable. On the contrary if the rep uls ive force is suf ficiently wea k, the n the par ticles wil l get tog eth er andambient par ticles may als o be seized in the gro win g 0921-5093/$ – see front matter © 2006 Elsevier B.V. All rights reserved. doi:10.1016/j.msea.2006.03.010
-
Upload
felipe-pereira -
Category
Documents
-
view
214 -
download
0
Transcript of SHIH Et Al (2006) - Effect of Nanosilica on Characterization of Portland Cement Composite

7/29/2019 SHIH Et Al (2006) - Effect of Nanosilica on Characterization of Portland Cement Composite
http://slidepdf.com/reader/full/shih-et-al-2006-effect-of-nanosilica-on-characterization-of-portland-cement 1/9
Materials Science and Engineering A 424 (2006) 266–274
Effect of nanosilica on characterization of Portland cement composite
Jeng-Ywan Shih, Ta-Peng Chang ∗, Tien-Chin Hsiao
Department of Construction Engineering, National Taiwan University of Science and Technology, Taipei 10672, Taiwan, ROC
Received 16 November 2005; accepted 4 March 2006
Abstract
Both the filling effect and the pozzolanic reaction make siliceous materials as one of major ingredients of high-performance Portland cement-
based composites. Hence, the introduction of nanosilica with finer particle size and larger silicon dioxide to the composite becomes a great deal
of interest in recent years. In this study, a liquid-form of nanosilica particle with a spherical diameter of about 20 nm was incorporated into the
Portland cement paste at five different dosages and analyzed at four different ages to identify the nanosizing effects on the microstructures andmaterial properties of composite cement paste. Experimental results show that the Portland cement composite with 0.60% of added nanosilica by
weight of cement has an optimum compressive strength, in which the increase of compressive strength is about 43.8%. Moreover, the corresponding
nanosilica paste of one portion of water mixed with nanosilica of 1.08wt.% of water has the maximum absolute value of zeta potential of 41.3 mV.
Properties through the analyses of NMR, BETand MIPalso indicate that the microstructure of Portland cement composite with nanosilica evidently
has a more solid, dense and stable bonding framework.
© 2006 Elsevier B.V. All rights reserved.
Keywords: Nanosilica; Cement paste; Compressive strength; Zeta potential
1. Introduction
Due to results of the filling effect to reduce porosity byuniform distribution of particle size and the pozzolanic reac-
tion that consumes calcium hydroxides (Ca(OH2)) to yield
calcium silicate hydrates (C–S–H), the silica fume, a con-
ventional supplementary cementitious material, is one of the
very important admixtures for producing the high-performance
Portland cement-based concrete with enhancing strength and
abrasion resistance along with reducing permeability and dry
shrinkage [1–4]. In order to obtain further improvements of
Portland cement-based composite (or alternatively called as
cement composite for simplicity when appropriate hereinafter),
siliceous materials of higher purity and finer size are intro-
duced. In the past decade, novel properties of nanoparticles with
1–100 nm scale have attracted enormous attention [5]. Among
these nanoparticles, nanosilica is commonly used for reinforce-
ment of polymer to increase the hardness, modulus, weatherabil-
ity, flammability, and so on [6–10]. Likewise, some efforts on
excellent mechanical properties and microstructure of cement
composites with nanosilica have been also reported [11,12], in
∗ Corresponding author. Tel.: +886 2 2737 6577; fax: +886 2 2737 6606.
E-mail address: [email protected] (T.-P. Chang).
which a water reducing agent was always applied to aid the
dispersion of nanosilica during the process of specimen prepa-
ration. Although, the water reducing agent may help improvethe material properties of cement composites, some unpredicted
interaction among water, water reducing agent, nanosilica and
cement is anticipated to complicate the study on the chemical
mechanism of such composite material. For this reason, in order
to alleviate the complex interaction of state variables and to
properly evaluate the influencing effects of nanosilica on cement
composites, this study does not include water reducing agent as
one of the ingredients. Rather, only the addition of nanosilica
in liquid form was included to investigate the characteristics of
corresponding cement composite.
On the other hand, the zeta potential is the electric potential
around the particle on the slip surface within an electric double
layer formed at the particle–liquid interface. In the slip sur-
face, the double layer is divided into two parts: the inner region
named stern layer and the outer region called diffusive layer.
Because the zeta potential performs the quantitative measure on
the effective charge of particles, it is related to the stability and
agglomeration processes. In other words, if the repulsive force
between approaching particles becomes high enough, then they
will repel each other to make them separable. On the contrary if
the repulsive force is sufficiently weak, then the particles will get
together and ambient particles may also be seized in the growing
0921-5093/$ – see front matter © 2006 Elsevier B.V. All rights reserved.
doi:10.1016/j.msea.2006.03.010

7/29/2019 SHIH Et Al (2006) - Effect of Nanosilica on Characterization of Portland Cement Composite
http://slidepdf.com/reader/full/shih-et-al-2006-effect-of-nanosilica-on-characterization-of-portland-cement 2/9
J.-Y. Shih et al. / Materials Science and Engineering A 424 (2006) 266–274 267
agglomeration. So, when the absolute value of the zeta poten-
tial gets over a specific electric charge, the system will keep in
a dispersing state. Therefore, when silica particles in the fresh
Portland cement paste are under such spreading condition, the
opportunity of producing calcium silicate hydrates, which plays
a vital role of strength development, can rise apparently.
In addition to using the compressive strength and zeta poten-
tial as two major indices to evaluate the effects of added nanosil-
ica on the features of cement composite, other material proper-
ties such as degree of hydration, bonding pattern, and fractal
dimension are also addressed.
2. Experimental program
2.1. Experimental techniques and facilities for
microstructural properties
The examination of microstructural properties of cement
composite and nanosilica was conducted by one or more of the
following methods and corresponding facilities, whichever suitsthe requirements:
(1) Zeta potential measured by electrophoresis apparatus using
Malvern Instruments Zetasizer 2000.
(2) Degree of hydration assessed by nuclear magnetic resonance
(NMR) using a Varian 400 MHz (one-pulse pattern, pulse
delay 180 s.).
(3) Specific surface measured by nitrogen adsorption according
to the Brunauer, Emmett, and Teller (BET) method using a
Micromeritics ASAP 200C.
(4) Porosity analyzed by Mercury Intrusion Porosimeter (MIP)
using a Micromeritics AutoPore IV 9520 (from atmosphericpressure to 414 MPa).
2.2. Materials
Three major ingredients of cement composite were used in
this study: (1) Type I Portland cement complying with ASTM
C150 standard; (2) ordinary distilled water and (3) nanosilica
(NS) in liquid form used as the admixture. The chemical compo-
sitions and physical properties of ASTM Type I Portland cement
are given in Table 1. Basic material properties of nanosilica are
given in Table 2.
2.3. Experimental variables, procedure and specimen preparation
At the beginning, five different water/cement (W / C ) ratios of
0.25, 0.35, 0.45, 0.55 and 0.65 were used to mix the cement
composite whose performance was carefully examined accord-
ingly. Finally, the optimum water/cement (W / C ) ratio was fixed
at 0.55. Five different dosages of nanosilica, 0.0, 0.2, 0.4, 0.6
and 0.8 wt.% of cement were added to the Portland cement paste
to cast the specimens of cement composite. The mix proportions
of these five cement composites are given in Table 3.
Cylindrical nanocomposite specimens of Ø25 mm×50mm
were used for the compressive test. Each experiment was per-
Table 1
Chemical compositions and physical properties of Type I Portland cement used
in this study
Chemical composition (mass%)
SiO2 20.31
Al2O3 5.05
Fe2O3 3.16
CaO 62.43MgO 3.81
SO3 2.48
Free CaO 0.4-78
LOI 1.49
Physical properties
Fineness (m2/kg) 349.0
Specific weight 3.15
Initial setting (min) 185.0
Final setting (min) 292.0
Table 2
Basic material properties of nanosilica (NS) (in liquid form)
Composition (mass%) SiO2 (40.6%), H2O (58.8%), others (0.6%)
Dimension 20 nm (spherical shape)
pH value 10.1
formed at four ages of 7, 14, 28 and 56 days using three speci-
mens prepared from same batch of mixture. All the specimens
of cement composite were demoulded 24 h after they were cast
and then immersed in the saturated limewater basin until 1 day
before the test and then cured in the ambient temperature for
24 h. The test of compressive strength of cylindrical nanocom-
posite specimen was performed by a 10 tonnes material testing
machine following the procedure of ASTM C39 standard.The zeta potential can be calculated from the velocity per
unit electrical field strength, which is the electrophoretic mobil-
ity. Thus the specimenusedin the zetapotential test is inthe form
of a dilute suspension. The procedures of suspension prepara-
tion and zeta potential measurement are briefly described as
follows. After entering into deionized water, nanosilica was
ultrasonically dispersed for 180 s in the solution to obtain the
aqueous suspension. Then, the sample suspension was injected
into the electrophoresis apparatus to determine the zeta poten-
tial of nanosilica. The average was decided as the experimental
consequence by measuring the same suspension for five times.
Thus, the zeta potential tests of four various added dosages
of nanosilica, 0.36, 0.72, 1.08, and 1.44 wt.% of water, in which
these four mix proportions were corresponding to the mix tags
of C-02, C-04, C-06 and C-08 of cement composite, were also
Table 3
Mix proportion of Portland cement composite
Designation Cement:water:NS (by mass)
C-00 1:0.55:0.000
C-02 1:0.55:0.002
C-04 1:0.55:0.004
C-06 1:0.55:0.006
C-08 1:0.55:0.008
7/29/2019 SHIH Et Al (2006) - Effect of Nanosilica on Characterization of Portland Cement Composite
http://slidepdf.com/reader/full/shih-et-al-2006-effect-of-nanosilica-on-characterization-of-portland-cement 3/9
268 J.-Y. Shih et al. / Materials Science and Engineering A 424 (2006) 266–274
investigated to gain the optimal addition. Finally, the test results
of compressive strengths and zeta potentials were used as two
performance indices to select the optimal nanocomposite from
which its microstructural properties were examined.
For the MIP analysis, the cylindrical disk specimens of
Ø20 mm× 10 mm were dried in an oven at 105 ◦C for 24h to
reach a constant weight, and then were loaded into a penetrom-
eter. After specimen was installed and evacuated to the required
vacuum level, the penetrometer was backfilled with mercury. As
the pressure was increasing, the mercury was gradually entering
the pores of specimens. Thus the volume of mercury deducted
in the penetrometer is related to the volume of the pores filled.
Hence, the volume of mercury penetrating into the pores can
be obtained from the applied pressure from which the pore size
distribution and pore volume of specimen can also estimated.
3. Results and discussion
3.1. Compressive strengths
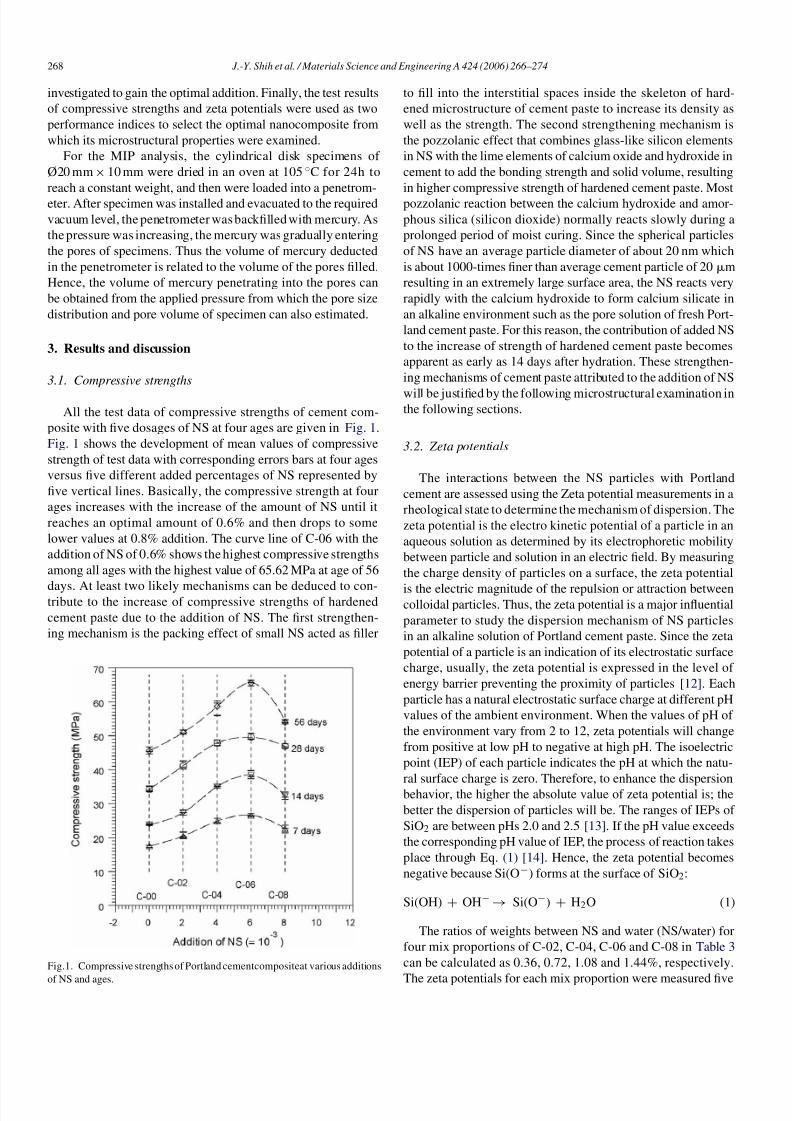
All the test data of compressive strengths of cement com-
posite with five dosages of NS at four ages are given in Fig. 1.
Fig. 1 shows the development of mean values of compressive
strength of test data with corresponding errors bars at four ages
versus five different added percentages of NS represented by
five vertical lines. Basically, the compressive strength at four
ages increases with the increase of the amount of NS until it
reaches an optimal amount of 0.6% and then drops to some
lower values at 0.8% addition. The curve line of C-06 with the
addition of NS of 0.6% shows the highest compressive strengths
among all ages with the highest value of 65.62 MPa at age of 56
days. At least two likely mechanisms can be deduced to con-tribute to the increase of compressive strengths of hardened
cement paste due to the addition of NS. The first strengthen-
ing mechanism is the packing effect of small NS acted as filler
Fig.1. Compressive strengths of Portland cementcompositeat various additions
of NS and ages.
to fill into the interstitial spaces inside the skeleton of hard-
ened microstructure of cement paste to increase its density as
well as the strength. The second strengthening mechanism is
the pozzolanic effect that combines glass-like silicon elements
in NS with the lime elements of calcium oxide and hydroxide in
cement to add the bonding strength and solid volume, resulting
in higher compressive strength of hardened cement paste. Most
pozzolanic reaction between the calcium hydroxide and amor-
phous silica (silicon dioxide) normally reacts slowly during a
prolonged period of moist curing. Since the spherical particles
of NS have an average particle diameter of about 20 nm which
is about 1000-times finer than average cement particle of 20m
resulting in an extremely large surface area, the NS reacts very
rapidly with the calcium hydroxide to form calcium silicate in
an alkaline environment such as the pore solution of fresh Port-
land cement paste. For this reason, the contribution of added NS
to the increase of strength of hardened cement paste becomes
apparent as early as 14 days after hydration. These strengthen-
ing mechanisms of cement paste attributed to the addition of NS
will be justified by the following microstructural examination inthe following sections.
3.2. Zeta potentials
The interactions between the NS particles with Portland
cement are assessed using the Zeta potential measurements in a
rheological state to determine the mechanism of dispersion. The
zeta potential is the electro kinetic potential of a particle in an
aqueous solution as determined by its electrophoretic mobility
between particle and solution in an electric field. By measuring
the charge density of particles on a surface, the zeta potential
is the electric magnitude of the repulsion or attraction betweencolloidal particles. Thus, the zeta potential is a major influential
parameter to study the dispersion mechanism of NS particles
in an alkaline solution of Portland cement paste. Since the zeta
potential of a particle is an indication of its electrostatic surface
charge, usually, the zeta potential is expressed in the level of
energy barrier preventing the proximity of particles [12]. Each
particle has a natural electrostatic surface charge at different pH
values of the ambient environment. When the values of pH of
the environment vary from 2 to 12, zeta potentials will change
from positive at low pH to negative at high pH. The isoelectric
point (IEP) of each particle indicates the pH at which the natu-
ral surface charge is zero. Therefore, to enhance the dispersion
behavior, the higher the absolute value of zeta potential is; the
better the dispersion of particles will be. The ranges of IEPs of
SiO2 are between pHs 2.0 and 2.5 [13]. If the pH value exceeds
the corresponding pH value of IEP, the process of reaction takes
place through Eq. (1) [14]. Hence, the zeta potential becomes
negative because Si(O−) forms at the surface of SiO2:
Si(OH) + OH−→ Si(O−) + H2O (1)
The ratios of weights between NS and water (NS/water) for
four mix proportions of C-02, C-04, C-06 and C-08 in Table 3
can be calculated as 0.36, 0.72, 1.08 and 1.44%, respectively.
The zeta potentials for each mix proportion were measured five

7/29/2019 SHIH Et Al (2006) - Effect of Nanosilica on Characterization of Portland Cement Composite
http://slidepdf.com/reader/full/shih-et-al-2006-effect-of-nanosilica-on-characterization-of-portland-cement 4/9
J.-Y. Shih et al. / Materials Science and Engineering A 424 (2006) 266–274 269
Fig. 2. Zeta potential by various additions.
times and the test results of each individual data and average
value are presented in Fig. 2. As described in Section 3.1, the
mix proportion of C-06 has the highest compressive strengths
among all ages. The experimental data of zeta potential also
indicates an optimum value of −41.3 mV for the NS/water of
1.08% which corresponds to the mix proportion of C-06. Both
the compressive strength and zeta potential verify an optimum
added amount of NS of 0.6%. Due to alkalinity of the cement
hydration products of C–S–H and Ca(OH)2, the relationship of
zeta potentials and pH values from 7 to 12 investigated at 1.08%
of NS/water ratio is shown in Fig. 3. The absolute values of zeta
potential gradually increase with the increase of pH values. As
a result, under alkali environment, the dispersion mechanism of
nanosilica performs quite well.
Fig. 3. Zeta potential at various pH values.
3.3. Microstructural examination on performance of
nanosilica in cement composite
To justify the optimum macro-behavior of strengthen mech-
anism of hardened cement composite in terms of compressive
strengths due to the addition of NS with an optimum added
amount of 0.6 wt.% of cement, several microstructural exam-
inations such as NMR, BET and MIP were also conducted in
this study. For the purpose of comparison, both the specimens of
harden cement composite with 0.6% addition of NS and without
addition of NS at age of 56 days were used.
3.3.1. NMR examination
The non-destructive and non-invasive measurement of
nuclear magnetic resonance (NMR) measured on 29Si nuclei
has been used to study the behaviors of Portland cement pow-
der, pure hardened Portland cement paste and hardened Portland
cement composite with addition of 0.6% of NS. In a 29Si NMR
spectroscopy, the quantity of chemical shift of a nucleus, nor-
mally expressed in ppm, is the difference between the resonancefrequency of the nucleus and the standard of tetramethylsilane,
Si(CH3)4, abbreviated TMS. Let Qn represent a SiO4 tetrahe-
dron with n bridging oxygens. The intensities of five separate
peaks appear around−70,−80,−88,−98 and−110 ppm in the
NMR curve, denoted as Q0, Q1, Q2, Q3 and Q4, can be used as
a base to characterize quantitatively the degree of hydration of
tested sample through the curve given either by Lorentzian func-
tion or Gaussian function to fit the experimental data of NMR
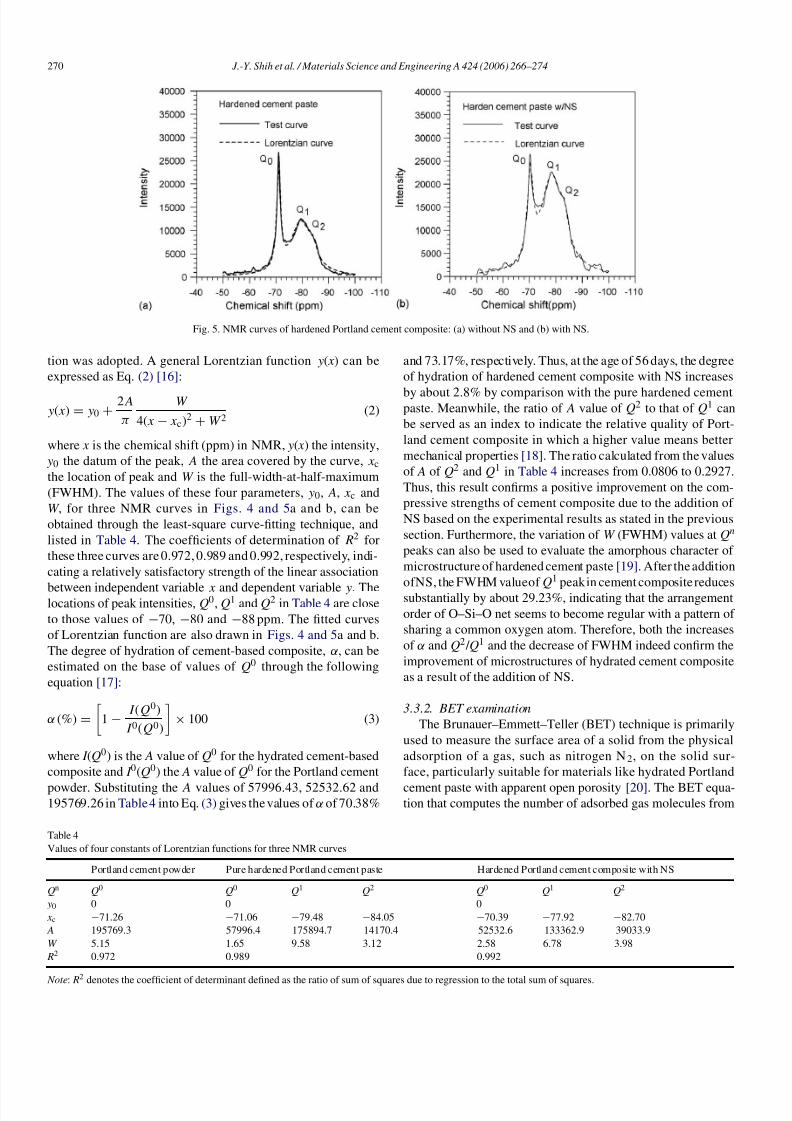
curve [15]. All the test results of NMR experiments are shown
in Figs. 4 and 5a and b, respectively. Fig. 4 is the NMR curve
for pure Portland cement that only has a single peak of Q0. Both
Fig. 5a (hardened pure cement paste) and b (hardened cementcomposite with NS) show one sharp peak of Q0 and another
wider peak containing both Q1 and Q2. These two figures do not
have either Q3 peak or Q4 peak.
After some preliminary assessment on the suitability of the
fitted equation to fit the experimental data, the Lorentzian func-
Fig. 4. NMR curve of Portland cement.
7/29/2019 SHIH Et Al (2006) - Effect of Nanosilica on Characterization of Portland Cement Composite
http://slidepdf.com/reader/full/shih-et-al-2006-effect-of-nanosilica-on-characterization-of-portland-cement 5/9
270 J.-Y. Shih et al. / Materials Science and Engineering A 424 (2006) 266–274
Fig. 5. NMR curves of hardened Portland cement composite: (a) without NS and (b) with NS.
tion was adopted. A general Lorentzian function y( x ) can be
expressed as Eq. (2) [16]:
y(x) = y0 +2A
π
W
4(x− xc)2+W 2
(2)
where x is the chemical shift (ppm) in NMR, y( x ) the intensity,
y0 the datum of the peak, A the area covered by the curve, x cthe location of peak and W is the full-width-at-half-maximum
(FWHM). The values of these four parameters, y0, A, x c and
W , for three NMR curves in Figs. 4 and 5a and b, can be
obtained through the least-square curve-fitting technique, and
listed in Table 4. The coefficients of determination of R2 for
these three curves are 0.972, 0.989 and 0.992, respectively, indi-
cating a relatively satisfactory strength of the linear association
between independent variable x and dependent variable y. Thelocations of peak intensities, Q0, Q1 and Q2 in Table 4 are close
to those values of −70, −80 and −88 ppm. The fitted curves
of Lorentzian function are also drawn in Figs. 4 and 5a and b.
The degree of hydration of cement-based composite, α, can be
estimated on the base of values of Q0 through the following
equation [17]:
α (%) =
1−
I (Q0)
I 0(Q0)
× 100 (3)
where I (Q0) is the A value of Q0 for the hydrated cement-based
composite and I 0(Q0) the A value of Q0 for the Portland cement
powder. Substituting the A values of 57996.43, 52532.62 and195769.26 in Table 4 into Eq. (3) gives the values of α of 70.38%
and 73.17%, respectively. Thus, at the age of 56 days, the degree
of hydration of hardened cement composite with NS increases
by about 2.8% by comparison with the pure hardened cementpaste. Meanwhile, the ratio of A value of Q2 to that of Q1 can
be served as an index to indicate the relative quality of Port-
land cement composite in which a higher value means better
mechanical properties [18]. The ratio calculated from the values
of A of Q2 and Q1 in Table 4 increases from 0.0806 to 0.2927.
Thus, this result confirms a positive improvement on the com-
pressive strengths of cement composite due to the addition of
NS based on the experimental results as stated in the previous
section. Furthermore, the variation of W (FWHM) values at Qn
peaks can also be used to evaluate the amorphous character of
microstructure of hardened cement paste [19]. After the addition
ofNS, the FWHM valueof Q1 peak in cement composite reduces
substantially by about 29.23%, indicating that the arrangement
order of O–Si–O net seems to become regular with a pattern of
sharing a common oxygen atom. Therefore, both the increases
of α and Q2 / Q1 and the decrease of FWHM indeed confirm the
improvement of microstructures of hydrated cement composite
as a result of the addition of NS.
3.3.2. BET examination
The Brunauer–Emmett–Teller (BET) technique is primarily
used to measure the surface area of a solid from the physical
adsorption of a gas, such as nitrogen N 2, on the solid sur-
face, particularly suitable for materials like hydrated Portland
cement paste with apparent open porosity [20]. The BET equa-tion that computes the number of adsorbed gas molecules from
Table 4
Values of four constants of Lorentzian functions for three NMR curves
Portland cement powder Pure hardened Portland cement paste Hardened Portland cement composite with NS
Qn Q0 Q0 Q1 Q2 Q0 Q1 Q2
y0 0 0 0
x c −71.26 −71.06 −79.48 −84.05 −70.39 −77.92 −82.70
A 195769.3 57996.4 175894.7 14170.4 52532.6 133362.9 39033.9
W 5.15 1.65 9.58 3.12 2.58 6.78 3.98
R2 0.972 0.989 0.992
Note: R2
denotes the coefficient of determinant defined as the ratio of sum of squares due to regression to the total sum of squares.

7/29/2019 SHIH Et Al (2006) - Effect of Nanosilica on Characterization of Portland Cement Composite
http://slidepdf.com/reader/full/shih-et-al-2006-effect-of-nanosilica-on-characterization-of-portland-cement 6/9
J.-Y. Shih et al. / Materials Science and Engineering A 424 (2006) 266–274 271
the adsorption isotherms of nitrogen N2 is given as follows [21]:
P
W (P 0 − P )=
1
W mC+
C − 1
W mCP 0P (4)
where P0 is the saturation pressure of the adsorbate, P the equi-
librium pressure of the adsorbate, W the weight of nitrogen
adsorbed at a given P / P0, W m the weight of a monolayer of adsorbate, and C is the constant related to the heat of adsorp-
tion. A linear relationship between 1/ W [(P0 / P)− 1] and P / P0 is
required to obtain the quantity of nitrogen adsorbed. The slope
a and intercept b are used to determine the quantity of nitrogen
adsorbed in the monolayer, W m, by the following equation:
W m =1
a+ b(5)
Then, the specific surface area of the sample, S , canbe calculated
as
S =W mN AAcs
Mw (6)
where N A is Avogadro’s number (6.023× 10²³ molecules/mol),
Acs the molecular cross-sectional area (77◦K nitrogen N2
16.2 A2), M the molecular weight of adsorbate (nitrogen N2
28.0134 g/mol), and w is the sample weight.
The intercept a and the slope b for the experimental BET
data in this study were founded to be 1.517 and 147.98 for the
hardened Portland cement paste, and 0.209 and 137.0 for the
hardened cement composite with NS, respectively, as shown in
Fig. 6a and b. From Eq. (6), the specific surface area increases
from 23.30 m2 /g for the hardened Portland cement paste to
25.38 m2 /g for the hardened cement composite with NS by
8.95%.To estimate the surface characteristics of hardened Portland
cement composite, an index often referred to as fractal dimen-
sion D determined from adsorption data was used in this study
[22–24]. One kind of the fractal dimension value D is defined
as given in Eq. (7) [24]:
D = 3+ s (7)
where s is a material parameter. In order to conform to the phys-
ical meaning of a surface, the range of D should be between 2
(smooth surfaces)and 3 (all available porositiesbeingoccupied).
In other words,−1 < s <0 is essential for Eq. (7).
The value of s can be estimated through the
Frenkel–Halsey–Hill equation shown as follows [25]:
logP 0
P
= BV s
(8)
where P0 and P are the same as those in Eq. (4), V the amount
of adsorption, and B is the another constant accounting for the
interaction between the adsorbent and adsorbate. The value of
s can be obtained as the slope of a linear equation in Eq. (9)
transformed from Eq. (8):
log
log
P 0
P
= logB− s logV (9)
plots of log V verses log(log(P0 / P)) for the experimental BET
curves are presented in Fig. 7a and b from which the values of
s for the hardened Portland cement paste and cement composite
with NS were found to be −0.4977 and −0.3805, respectively.
From Eq. (7), the values of fractal dimension D become 2.502
and 2.620, respectively, indicating an improvement on the sur-
face roughness. Therefore, both the surface area and fractal
dimension confirm that the hardened Portland cement composite
with NS has denser microstructures.
3.3.3. MIP examination
Mercury intrusion porosimetry is based on the capillary
law governing liquid penetration into minor pores. This law is
expressed by the modified Washburn equation [26]:
d =−φγ cos θ
p(10)
where φ is the shape factor, d the narrow dimension of pore,
γ the surface tension, θ the contact angle and p is the applied
pressure.
In respect to mercury liquid and oven-dried Portland cement-
based materials, the values of surfacetensionγ and contact angle
Fig. 6. BET plots of hardened Portland cement composite: (a) without NS and (b) with NS.
7/29/2019 SHIH Et Al (2006) - Effect of Nanosilica on Characterization of Portland Cement Composite
http://slidepdf.com/reader/full/shih-et-al-2006-effect-of-nanosilica-on-characterization-of-portland-cement 7/9
272 J.-Y. Shih et al. / Materials Science and Engineering A 424 (2006) 266–274
Fig. 7. FHH plots of hardened Portland cement composite: (a) without NS and (b) with NS.
θ were taken as 117◦ and 0.484 N/m, respectively [27,28]. More-
over, according to the observation of Maage [29] as well as the
report of Cook and Hover [30], the value of shape factor φ is
assumed to be 4 in terms of the circular cross section of cylin-
drical pore. Therefore, Eq. (10) can be rewritten as follows:
d =878.93
p(11)
where d is the pore entry diameter in nm, p the applied pressure
in MPa. Eq. (11) was used to convert a given applied pressure
to a specific pore diameter for the experimental MIP data.
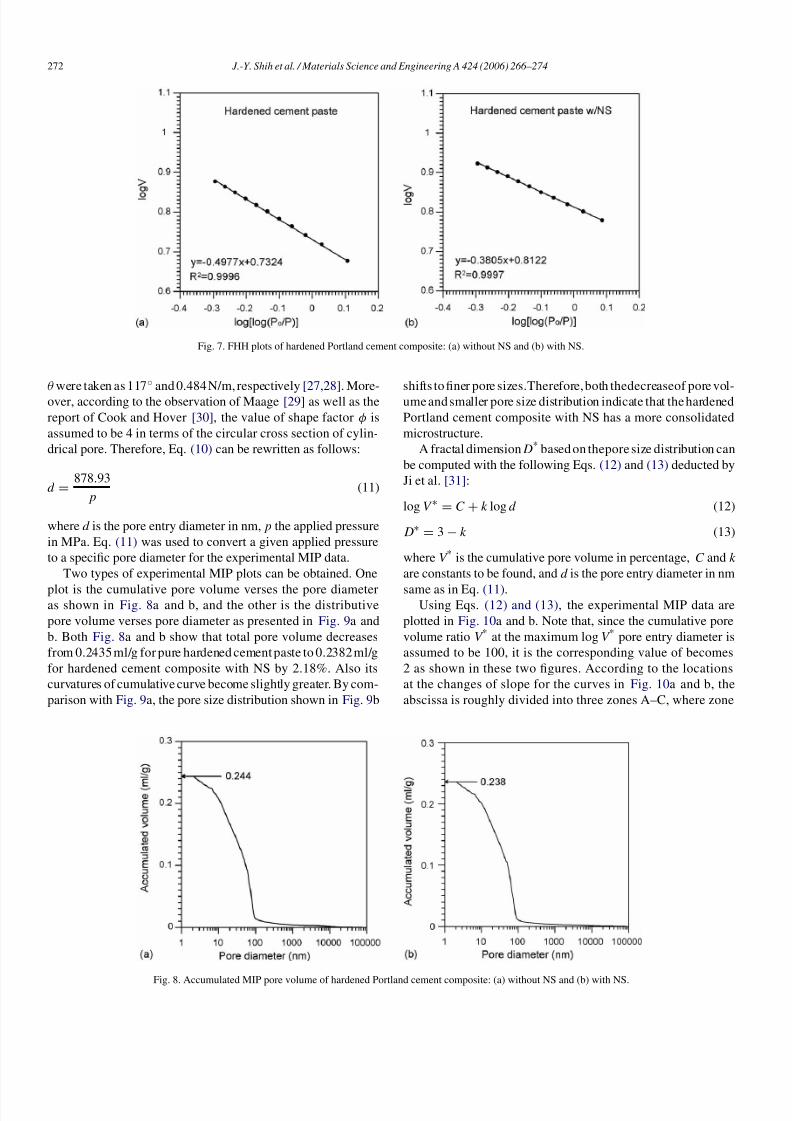
Two types of experimental MIP plots can be obtained. One
plot is the cumulative pore volume verses the pore diameteras shown in Fig. 8a and b, and the other is the distributive
pore volume verses pore diameter as presented in Fig. 9a and
b. Both Fig. 8a and b show that total pore volume decreases
from 0.2435 ml/g for pure hardened cement paste to 0.2382 ml/g
for hardened cement composite with NS by 2.18%. Also its
curvatures of cumulative curve become slightly greater. By com-
parison with Fig. 9a, the pore size distribution shown in Fig. 9b
shifts to finer pore sizes.Therefore, both thedecreaseof pore vol-
ume and smaller pore size distribution indicate that the hardened
Portland cement composite with NS has a more consolidated
microstructure.
A fractal dimension D* based on thepore size distribution can
be computed with the following Eqs. (12) and (13) deducted by
Ji et al. [31]:
logV ∗ = C + k log d (12)
D∗ = 3− k (13)
where V * is the cumulative pore volume in percentage, C and k
are constants to be found, and d is the pore entry diameter in nm
same as in Eq. (11).Using Eqs. (12) and (13), the experimental MIP data are
plotted in Fig. 10a and b. Note that, since the cumulative pore
volume ratio V * at the maximum log V * pore entry diameter is
assumed to be 100, it is the corresponding value of becomes
2 as shown in these two figures. According to the locations
at the changes of slope for the curves in Fig. 10a and b, the
abscissa is roughly divided into three zones A–C, where zone
Fig. 8. Accumulated MIP pore volume of hardened Portland cement composite: (a) without NS and (b) with NS.

7/29/2019 SHIH Et Al (2006) - Effect of Nanosilica on Characterization of Portland Cement Composite
http://slidepdf.com/reader/full/shih-et-al-2006-effect-of-nanosilica-on-characterization-of-portland-cement 8/9
J.-Y. Shih et al. / Materials Science and Engineering A 424 (2006) 266–274 273
Fig. 9. MIP pore distribution of hardened Portland cement composite: (a) without NS and (b) with NS.
Fig. 10. Relationship between log V * and log d of Portland cement composite: (a) without NS and (b) with NS.
A denotes the pore size smaller than 10 nm, zone B the pore
sizes between 10 and 100 nm and zone C the pore size larger
than 100 nm. For each zone, an individual least-square linear
model to fit the test data was conducted to obtain the slope k
in Eq. (12) and thus the value of D* in Eq. (13). These calcu-
lated values are presented in Table 5, where the percentages of
partial volumes between bounds of each individual neighboring
zone computed by the difference of V * are also illustrated. After
adding NS into cement composite, the partial volume ratio V p
at zone A increases by 1.22%, whereas decreases by 1.21% and
0.01% for zones B and C, respectively. On the contrary, the value
of D* decreases from 1.567 to 1.517 for zone A, but increase
from.2.261 to 2.305 for zone B and from 2.991 to 2.993 for
zone C, respectively. These results indicate that the microstruc-
ture of hardened cement composite with NS becomes denser
at the regions where the pore size is larger than 10 nm, but
becomes looser at the regions where the pore size is smaller
than 10 nm.
Table 5
Values of slope k , fractal dimension D* and volume ratio V P at three zones
Pure hardened Portland cement paste Hardened Portland cement composite with NS
Zone A B C A B C
Range <10 nm 10–100 nm >100 nm <10 nm 10–100 nm >100 nm
k 1.433 0.739 0.009 1.483 0.695 0.007
D* 1.567 2.261 2.991 1.517 2.305 2.993
V p 14.84% 79.31% 5.85% 16.06% 78.10% 5.84%
V * V * (<10 nm): 14.84%; V * (<100 nm): 94.15% V * (<10 nm): 16.06%; V * (<100 nm): 94.16%
Note: V *
= accumulated volume ratios.

7/29/2019 SHIH Et Al (2006) - Effect of Nanosilica on Characterization of Portland Cement Composite
http://slidepdf.com/reader/full/shih-et-al-2006-effect-of-nanosilica-on-characterization-of-portland-cement 9/9
274 J.-Y. Shih et al. / Materials Science and Engineering A 424 (2006) 266–274
4. Conclusions
Based on the experimental results and microstructural anal-
yses presented in this study, the following conclusions can be
drawn:
(1) Among four ages and five sets of mix proportions, the opti-
mal mix proportion is the set of cement:water:nanosilica =
1:0.55:0.006 which has the highest compressive strength of
65.62 MPa at age of 56 days. By comparison with the con-
trol set of cement paste without the addition of nanosilica,
the ratio of maximum increase in compressive strength is
about 60.6% at age of 14 days and reduces to 43.8% at age
of 56 days.
(2) Among four sets of mix proportions, the zeta potential for
the optimum mix set of nanosilica/water of 1.08% by weight
has a maximum absolute value of 41.3 mV. This optimal
mixture set obtained by zeta potential test is corresponding
to the mix proportion of cement composite in the compres-
sive test. Thus, the test results of zeta potential suggest thatthis test method may be able to serve as a quick and easy pre-
liminary technique to select quantitatively the optimal mix
proportion of cement composite with addition of nanosilica
simply by using the paste mixing the nanosilica with water.
(3) The observation on the changes of test values for these
indices of α, Q2 / Q1, and FWHM obtained from the NMR
analyses, has shown that the microstructures of Portland
cement composite added with nanosilica become more sta-
ble and stronger bonding.
(4) Both the surface area and the fractal dimension deducted by
BETexperiment also confirma densermicrostructure forthe
hardened cement composite with the addition of nanosilica.(5) The Portland cement composite incorporating nanosilica
measured by MIP technique reveals that the pore vol-
ume increases and the fractal dimension of microstructure
decreases at regions where the pore size smaller than 10 nm,
but the results are opposite for regions where the pore size
larger than 10 nm.
Acknowledgments
The authors thank the National Science Council of Taiwan,
Republic of China forfinancialsupport of this work (GrantNSC-
92-2211-E-011-052). Courtesy of some experimental data from
Mr. Kuo-Ming Yang is also appreciated.
References
[1] B.B. Sabir, Mag. Concr. Res. 47 (1995) 219.
[2] H.A. Toutanji, T. El-Korchi, Cem. Concr. Aggr. 18 (1996) 78.
[3] G.A. Rao, Cem. Concr. Res. 33 (2003) 1765.[4] M. Mazloom, A.A. Ramezanianpour, J.J. Brooks, Cem. Concr. Comp.
26 (2004) 347.
[5] M.J. Pitkethly, Mater. Today 7 (2004) 20.
[6] S. Kang, S.I. Hong, C.R. Choe, M. Park, S. Rim, J. Kim, Polymer 42
(2001) 879.
[7] E. Reynaud, T. Jouen, C. Gauthier, G. Vigier, J. Varlet, Polymer 42
(2001) 8759.
[8] S. Zhou, L. Wu, J. Sun, W. Shen, J. Appl. Polym. 88 (2003)
189.
[9] T. Kashiwagi, A.B. Morgan, J.M. Antonucci, M.R. Vanlandingham,
R.H. Harris, W.H. Awad, J.R. Shields, J. Appl. Polym. 89 (2003)
2072.
[10] H. Li, H. Xiao, J. Yuan, J. Ou, Composites Part B 35 (2004)
185.
[11] G. Li, Cem. Concr. Res. 34 (2004) 1043.[12] G. Xu, J. Zhang, G. Song, Powder Technol. 134 (2003) 218.
[13] H. Sieger, M. Winterer, H. Muhlenweg, G. Michael, H. Hahn, Chem.
Vap. Depos. 10 (2004) 71.
[14] H. Zhang, X. Jia, Z. Liu, W. Li, J. Cn. Ceram. Soc. 31 (2003)
928.
[15] E. Lippmaa, M. Magi, A. Samoson, G. Engelhardt, A.R. Grimmer, J.
Am. Ceram. Soc. 102 (1980) 4889.
[16] T. Ida, H. Hibino, H. Toraya, J. Appl. Cryst. 34 (2001) 144.
[17] H. Justnes, I. Meland, J.O. Bjoergum, J. Krane, T. Skjetne, SINTEF
FCB Report (1989) 1.
[18] K. Johansson, C. Larsson, O.N. Antzutkin, W. Forsling, H.R. Kota, V.
Ronin, Cem. Concr. Res. 29 (1999) 1575.
[19] X. Cong, R.J. Kirkpatrick, Adv. Cem. Bas. Mater. 3 (1996) 133.
[20] I. Odler, Cem. Concr. Res. 33 (2003) 2049.
[21] S. Brunauer, P.H. Emmet, E. Teller, J. Am. Chem. Soc. 60 (1938)309.
[22] M.W. Cole, N.S. Holter, P. Pfeifer, Phys. Rev. B33 (1986) 8806.
[23] P. Pfeifer, Y.J. Wu, M.W. Cole, J. Krim, Phys. Rev. Lett. 62 (1989)
1997.
[24] P. Pfeifer, M.W. Cole, New J. Chem. 14 (1990) 221.
[25] B. Sahouli, S. Blacher, F. Brouers, Langmuir 13 (1997) 4391.
[26] R.G. Jenkins, M.B. Rao, Powder Technol. 38 (1984) 177.
[27] D.N. Winslow, S. Diamond, J. Mater. 5 (1970) 564.
[28] A.K. Suryavanshi, R.N. Swamy, Cem. Concr. Aggr. 20 (1998) 169.
[29] M. Maage, Mater. Struct. 17 (1984) 345.
[30] R.A. Cook, K.C. Hover, ACI Mater. J. 90 (1993) 152.
[31] X. Ji, S.Y.N. Chan, N. Feng, Cem. Concr. Res. 27 (1997) 1691.