SHG Impact Assessment
13
Impact & Impact & Impact & Impact & o o o o S.P.-24, Chetan Ph : 0522- 4026249, secretary.janhi performance Ana performance Ana performance Ana performance Ana of Women SHGs of Women SHGs of Women SHGs of Women SHGs n Vihar, Sector-C, Aliganj, Lucknow-22602 4007845; E-mail : janhitfoundation@ya it@gmail.com; Website : www.janhit.ne alysis alysis alysis alysis 24 ahoo.in, et
-
Upload
deepti-tripathi -
Category
Government & Nonprofit
-
view
112 -
download
1
Transcript of SHG Impact Assessment

Impact & performance AnalysisImpact & performance AnalysisImpact & performance AnalysisImpact & performance Analysis
of Women SHGsof Women SHGsof Women SHGsof Women SHGs
S.P.-24, Chetan Vihar, Sector
Ph : 0522- 4026249,
secretary.janhit
Impact & performance AnalysisImpact & performance AnalysisImpact & performance AnalysisImpact & performance Analysis
of Women SHGsof Women SHGsof Women SHGsof Women SHGs
24, Chetan Vihar, Sector-C, Aliganj, Lucknow-226024
4007845; E-mail : [email protected]
[email protected]; Website : www.janhit.net
Impact & performance AnalysisImpact & performance AnalysisImpact & performance AnalysisImpact & performance Analysis
226024
; Website : www.janhit.net
Page | 1
INDEX
Sl. No. Description Page
1 A. Background 2
B. Janhit Foundation 2
• Major Intervention 2
C. Performance Analysis of SHGs and Impact Assessment 3
• Objective 3
• Social 3
• Performance of SHGs 3
• Capacity Development 3
• Impact on SHG members’ household 3
D. Methodology 3
2 Findings 4
A. Social 4
• Caste Profile of members of sample groups 4
B. Performance of SHGs 4
B1. Size of Sample groups 4
B2. Members brought under financial inclusion and Life Insurance Cover 4
B3. Trend of total Savings Mobilized 4
B4. Trend of total loan of sample groups 4
B5. Dispersion of Loan among members 5
B6. Turnover/velocity of Internal lending 5
C. Capacity Development 6
C1. Expenditure reduction through debt swapping 6
C2. Investment towards Health & Education 6
C3. New Investment towards Livelihood 7
C4. New Investment towards Domestic Asset Creation & House Reconstruction 8
D. Impact/Benefits perceived by SHGs’ members 8
D1. Participation in family decision making process after joining group 8
D2. Mobility/Financial literacy 9
D3. Health (Medical treatment) 9
D4. Health(Living standard/fooding pattern) 9
D5. Education of Children 9
D6. Debt swapping from money lender to SHG 10
D7. Debt still to be repaid to Money Lender 10
D8. Income 10
D9. Livelihood 11
D10. House Reconstruction 11
D11. Domestic Assets Creation 11
3 Questionnaire (Sample) 12

Page | 2
A. Background: Like everyone else, poor people need and use financial and livelihood services all the time. The
financial services available to the poor, however, often have serious limitations in terms of cost,
security, and convenience. The poor rarely access services through the formal financial sector.
They address their need for financial services through a variety of financial relationships, mostly
informal. Credit is available from money-lenders but usually at a very high cost to borrowers.
Over the years the Community involvement and the concept of self-help were felt most required
for the success of efforts to mitigate poverty in the country. In other words, Self-Help Groups
(SHGs) are realized to be a proven model/methodology to address the issues of poverty
alleviation and women empowerment. To activate this model, micro-credit has been recognized
as a powerful tool in the struggle to end poverty and economic dependence. Microcredit program
extend small loans to poor people through their SHG for self-employment enterprise that
generate income, allowing them to care for themselves and their families. In most cases,
microcredit programs offer a combination of services and resources to their clients in addition to
credit for self-employment, these often include savings facilities, training, networking, and peer
support. Solutions to the alleviation of poverty lie in generation of self-employment/wage
employment opportunities. Such opportunities can be created by bringing at least one member of
every poor family into the fold of SHGs and enhancing access to micro-credit and livelihood
support services.
B. Janhit Foundation:
Janhit Foundation was formed by dedicated social workers and development professionals to
work as catalytic and facilitative agency for sustainable development and empowerment of poor
and underprivileged households in rural and urban areas. JANHIT FOUNDATION is registered
under society registration Act 1860 in Dec 2002.
Janhit Foundation's approach is enabling the poor to better their lives and achieve self-reliance.
Janhit strongly believes that what poor need is not charity, but hope, not sympathy but
entitlement, not delivery of services but an enabling environment to earn those services by
themselves. We hope that this enabling approach
will facilitate the poor to stand on their own by
earning a decent income with dignity.
Janhit achieves it by promoting self-reliant people
institutions, by organizing the poor. Thus creating
effective demand streams, where the poor have
an opportunity to access livelihood support
services i.e. Microcredit etc and improve income
generation and asset building capacity. Janhit is
actively working for last 4 years in 18 blocks of 4
districts of U.P. & M.P covering more than 60000
poor households.
Major Interventions:
• Targeting poor households from Poor/Small & Marginal farmers/SC/OBC/Minorities
households through its women members who are organized into self-help groups
• Capacity building of these SHGs on group management, financial literacy etc. through
formal/ informal learning sessions.

• Enabling poor household’s members to articu
empowerment.
• Ensuring in-situ availability of Agriculture/Business development service for improving
income generation through self
• Enhancing access to easy and timely availability of low cost microcredit through
with Banks.
• Risk mitigation measure like Life/Non
C. Performance Analysis of SHGs and Impact Assessment:
Objectives:
The objective of the study is to examine the performance of SHGs which have completed 3 years
of age and impact of Janhit’s Livelihood Improvement Program on SHG members’ household. It
would enable an understanding of the effects the program has on client
help in designing better financial and support services. Also it would lead to development of
complementary non-financial services at the household level to maximize the impact of program.
Under the performance of SHGs and impact of Ja
following aspects were studied:
• Social: Caste profile of members.
• Performance of SHGs:
and Life Insurance Cover, total saving mobilized, total loan dispersion
among members, turnover/velocity of internal ending.
• Capacity Development:
Investment towards health & education, livelihood intensification/diversification and
domestic asset creation.
• Impact on SHG members’ household:
decision making process, mobility/ self confidence, improvement in income and
capacity enhancement.
D. Methodology:
20% sample of total 118 groups
completing 3 years of age as on 30
September 2013, were randomly
selected and their secondary data
available in web based MIS was
analyzed to find out trend and
impact on livelihoods of groups
/members. In addition 25% of total
283 members of sample groups
were also randomly selected and
interviewed to find out perceived
benefits from their participation in
SHGs
Enabling poor household’s members to articulate their needs for livelihood
situ availability of Agriculture/Business development service for improving
income generation through self-employment.
Enhancing access to easy and timely availability of low cost microcredit through
Risk mitigation measure like Life/Non-Life Insurance.
Performance Analysis of SHGs and Impact Assessment:
The objective of the study is to examine the performance of SHGs which have completed 3 years
of age and impact of Janhit’s Livelihood Improvement Program on SHG members’ household. It
would enable an understanding of the effects the program has on client households and would
help in designing better financial and support services. Also it would lead to development of
financial services at the household level to maximize the impact of program.
Under the performance of SHGs and impact of Janhit’s Livelihood Improvement Program
following aspects were studied:
Caste profile of members.
Performance of SHGs: Size of groups, Members brought under financial Inclusion
Life Insurance Cover, total saving mobilized, total loan dispersion
among members, turnover/velocity of internal ending.
Capacity Development: Expenditure reduction through debt swapping, Enhanced
Investment towards health & education, livelihood intensification/diversification and
domestic asset creation.
on SHG members’ household: participation of SHG members in family
decision making process, mobility/ self confidence, improvement in income and
capacity enhancement.
20% sample of total 118 groups
completing 3 years of age as on 30th
September 2013, were randomly
selected and their secondary data
available in web based MIS was
analyzed to find out trend and
impact on livelihoods of groups
/members. In addition 25% of total
283 members of sample groups
were also randomly selected and
nterviewed to find out perceived
benefits from their participation in
Page | 3
late their needs for livelihood
situ availability of Agriculture/Business development service for improving
Enhancing access to easy and timely availability of low cost microcredit through linkages
The objective of the study is to examine the performance of SHGs which have completed 3 years
of age and impact of Janhit’s Livelihood Improvement Program on SHG members’ household. It
households and would
help in designing better financial and support services. Also it would lead to development of
financial services at the household level to maximize the impact of program.
nhit’s Livelihood Improvement Program
Size of groups, Members brought under financial Inclusion
Life Insurance Cover, total saving mobilized, total loan dispersion of loan
Expenditure reduction through debt swapping, Enhanced
Investment towards health & education, livelihood intensification/diversification and
participation of SHG members in family
decision making process, mobility/ self confidence, improvement in income and
Page | 4
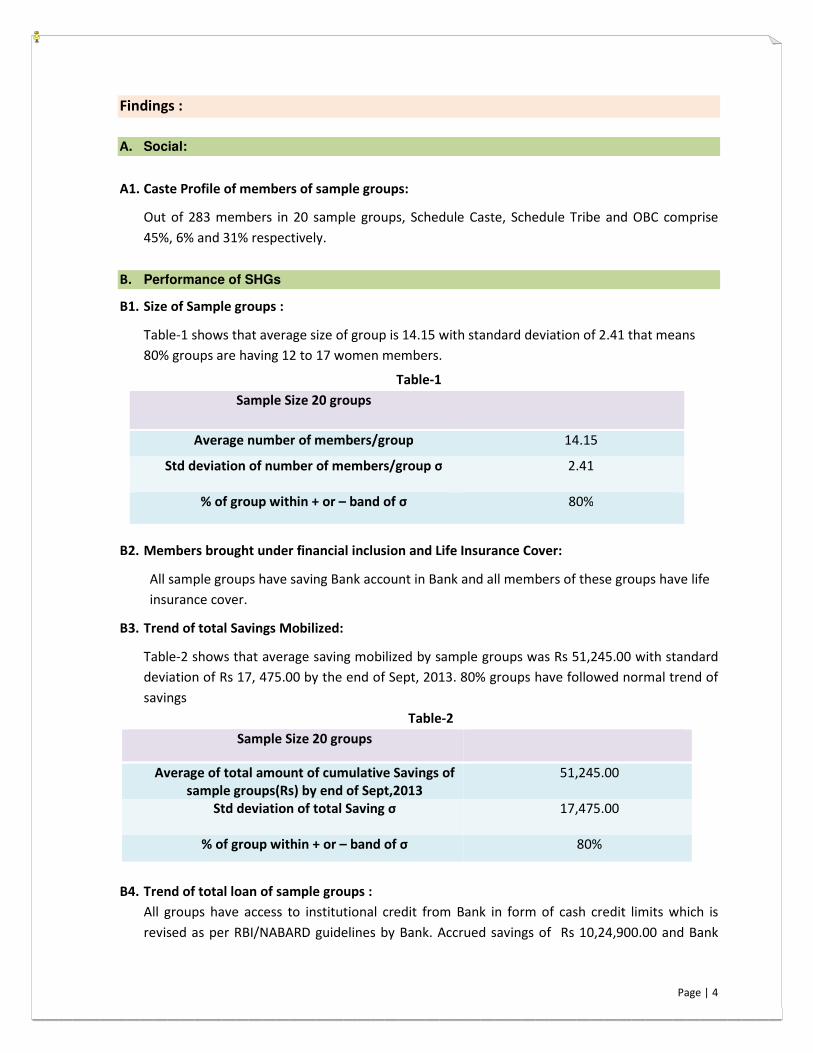
Findings :
A. Social:
A1. Caste Profile of members of sample groups:
Out of 283 members in 20 sample groups, Schedule Caste, Schedule Tribe and OBC comprise
45%, 6% and 31% respectively.
B. Performance of SHGs
B1. Size of Sample groups :
Table-1 shows that average size of group is 14.15 with standard deviation of 2.41 that means
80% groups are having 12 to 17 women members.
Table-1
Sample Size 20 groups
Average number of members/group 14.15
Std deviation of number of members/group σ
2.41
% of group within + or – band of σ 80%
B2. Members brought under financial inclusion and Life Insurance Cover:
All sample groups have saving Bank account in Bank and all members of these groups have life
insurance cover.
B3. Trend of total Savings Mobilized:
Table-2 shows that average saving mobilized by sample groups was Rs 51,245.00 with standard
deviation of Rs 17, 475.00 by the end of Sept, 2013. 80% groups have followed normal trend of
savings
Table-2
Sample Size 20 groups
Average of total amount of cumulative Savings of
sample groups(Rs) by end of Sept,2013
51,245.00
Std deviation of total Saving σ
17,475.00
% of group within + or – band of σ 80%
B4. Trend of total loan of sample groups :
All groups have access to institutional credit from Bank in form of cash credit limits which is
revised as per RBI/NABARD guidelines by Bank. Accrued savings of Rs 10,24,900.00 and Bank

Page | 5
loan of Rs 91,50,727.00 availed by groups was used to lend to members to meet their livelihood
and other needs. Table E-1 indicates that 60% in year 2011 and subsequently 75% groups follow
normal trend while balance have some have extreme values of total cumulative loan(i.e.
extremely low or high).
Table-3
Sample Size 20 groups Average of total amount of
cumulative loan of sample groups
2011 2012 2013
Average of total amount of cumulative
loan of sample groups(Rs)
138,185 261,532 640,945
Std deviation of total loan σ
73,528 149,704 429,338
% of group within + or – band of σ 60% 75% 75%
B5. Dispersion of Loan among members:
Table-4 shows that in 70% of sample group, 81-100% members availed loan from their SHG
while in 20% group only 61- 80% of members availed loan.
Table-4
Sample Size
20 groups
Range of Dispersion of loan among members(x)
40%<x<=60% 60%<x<=80% 80%<x<=100%
% of group
under range
10% 20% 70%
B6. Turnover/velocity of Internal lending:
Turnover or velocity of internal lending is an indicator of efficiency of financial management of
group. Turnover=Total Internal Loan/(Total Savings + Total Bank Loan).Table-5 shows that all
sample groups have turnover of more than 1.0 which indicates that these groups/members have
acquired financial/group management skill through training and practice.
Table-5
Sample Size 20 groups Turnover(x)
X<=1.20 1.20<x<01.50 1.50<x<=2.0 x>2.0
% of groups 30% 45% 20% 5%

Page | 6
C. Capacity Development:
C1. Expenditure reduction through debt swapping:
Member Households of groups have done debt swapping by repaying high interest loan taken
from local money lender/MFI by taking loan from their SHGs thereby reducing monthly
expenditure liability. Table-6 shows that member households of majority of groups were debt
ridden in the network of money lender/MFI and they availed opportunity of debt swapping to
reduce monthly expenditure liability.
Table-6
Sample Size 20 groups % of groups availing Debt Swapping
Year 2011 2012 2013
Debt swapping
85%
90%
95%
Table-7 shows that as capacity of groups improved to due to enhanced access to institutional
credit and accrued savings, more and more members reduced their monthly expenditure
liability by repaying high interest loan. More than 100% growth in debt swapping amount in
subsequent year is a testimony of this fact.
Table-7
C2. Investment towards Health & Education:
Table-8 shows that % of groups investing towards health and education has increased year to
year. This clearly shows that members are slowly realizing that this investment will ultimately
have positive bearing on their livelihood and quality of life.
Table-8
Sample Size 20
groups
% of groups investing for Health &
Education
Year 2011 2012 2013
Health &
Education
70%
75%
85%
Sample
Size 20
groups
Debt Swapping Average
cumulative amount/group (Rs)
% growth of Debt Swapping
Year 2011 2012 2013 2011 2012 2013
Debt
swapping
22,425
67,210
159,826
NA
200%
138%

Page | 7
Table-9 shows that not only number of groups/members but amount of expenditure towards
health and education is also increasing yearly.
Table-9
C3. New Investment towards Livelihood:
Lack of access to institutional credit has been one of the main causes of unsustainable
livelihood. Once access to credit through SHGs is established, member household utilize major
amount of credit availed to improve their existing livelihood option. Table-10 shows almost all
groups have invested to improve their livelihood through intensification/diversification of
existing livelihood option.
Table-10
Sample Size 20
groups
% of groups investing for Livelihood
Year 2011 2012 2013
Livelihood 95% 100% 100%
Table-11 shows that not only number of groups/members but amount of investment towards
Livelihood is also increasing yearly which indicates that members are reaping benefits of
enhanced investment in livelihood.
Table-11
Sample
Size 20
groups
Average cumulative investment
amount/group on health &
Education(Rs)
% growth of Average
cumulative investment
amount/group on health &
Education
Year 2011 2012 2013 2011 2012 2013
Health &
Education
14,259 22,659 25,024 NA 59% 10%
Sample Size 20
groups
Average cumulative investment
amount/group on Livelihood (Rs)
% growth of Average
cumulative investment
amount/group on
Livelihood
Year 2011 2012 2013 2011 2012 2013
Livelihood 75,530 128,305 376,455 NA 70% 193%

Page | 8
C4. New Investment towards Domestic Asset Creation & House Reconstruction:
Table-12 shows that numbers of groups are increasingly investing for Domestic Asset
Creation/House Reconstruction which is an indicator of economic well being.
Table -12
Sample Size 20
groups
% of groups investing for Asset Creation
Year 2011 2012 2013
Domestic Asset
Creation & House
Reconstruction
95% 100% 100%
Table-13 shows the year wise cumulative amount of investment on asset creation and its
growth.
Table-13
D . Impact/Benefits perceived by SHGs’ members:
D1. Participation in family decision making process after joining group:
98.57% respondents have articulated that their role in decision making process of family,
have improved.
Table-14
Question Response % respondents
Are decisions in the family taken in
consultation with you, after joining
SHG?
1- Yes 98.57
2- No 1.43
3- Some Time 0.00
*Sample size 70 members.
Sample Size 20 groups Average cumulative
investment amount/group on
Asset Creation (Rs)
% growth of Average
investment amount/group on
Asset Creation
Year 2011 2012 2013 2011 2012 2013
Domestic Asset Creation
& House Reconstruction
10,466
23,978
37,270
NA
129%
55%
Page | 9
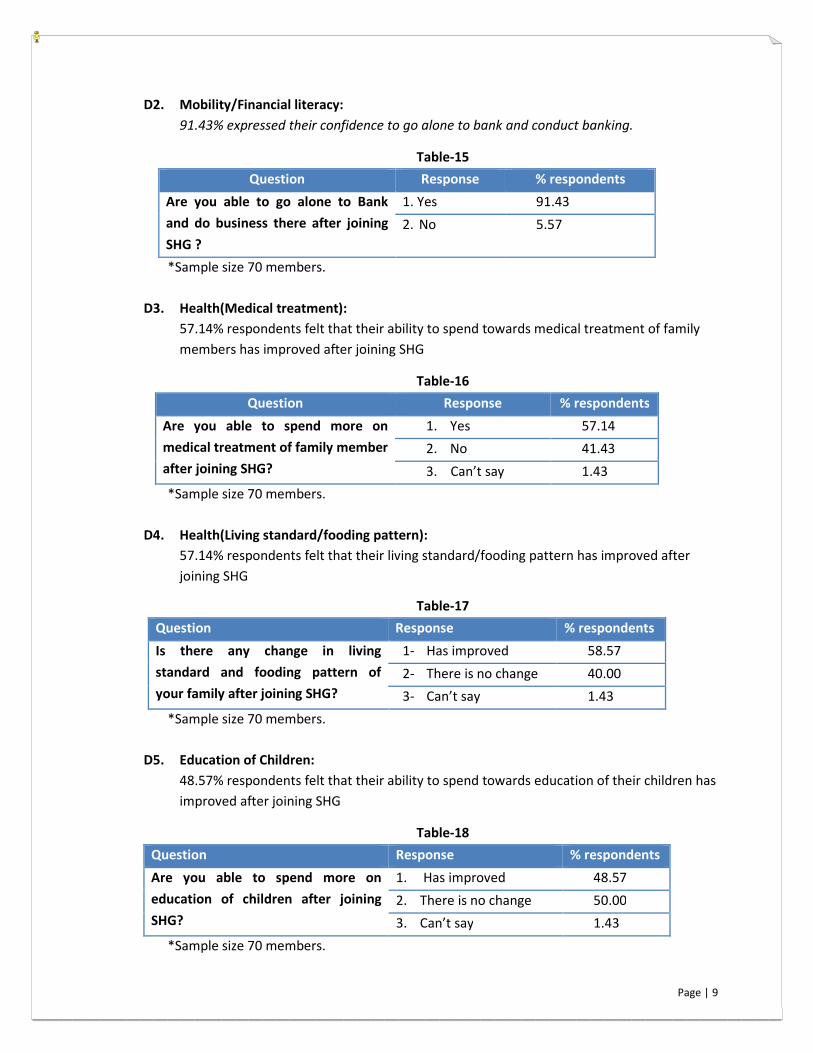
D2. Mobility/Financial literacy:
91.43% expressed their confidence to go alone to bank and conduct banking.
Table-15
Question Response % respondents
Are you able to go alone to Bank
and do business there after joining
SHG ?
1. Yes 91.43
2. No 5.57
*Sample size 70 members.
D3. Health(Medical treatment):
57.14% respondents felt that their ability to spend towards medical treatment of family
members has improved after joining SHG
Table-16
Question Response % respondents
Are you able to spend more on
medical treatment of family member
after joining SHG?
1. Yes 57.14
2. No 41.43
3. Can’t say 1.43
*Sample size 70 members.
D4. Health(Living standard/fooding pattern):
57.14% respondents felt that their living standard/fooding pattern has improved after
joining SHG
Table-17
Question Response % respondents
Is there any change in living
standard and fooding pattern of
your family after joining SHG?
1- Has improved 58.57
2- There is no change 40.00
3- Can’t say 1.43
*Sample size 70 members.
D5. Education of Children:
48.57% respondents felt that their ability to spend towards education of their children has
improved after joining SHG
Table-18
Question Response % respondents
Are you able to spend more on
education of children after joining
SHG?
1. Has improved 48.57
2. There is no change 50.00
3. Can’t say 1.43
*Sample size 70 members.

Page | 10
D6. Debt swapping from money lender to SHG:
30% members have repaid loan ranging from Rs5000/ to Rs 50000/ taken from money
lender
Table-19
*Sample size 70 members.
D7. Debt still to be repaid to Money Lender:
95.71% members have articulated that there is no outstanding loan from money ender
while balance 4.29% members still have to repay money lender loan.
Table-20
Question Response % respondents
Is there any loan still outstanding from
money lender?
1- Yes 4.29
2- No 95.71
*Sample size 70 members.
D8. Income:
54.29% respondents have perceived that their income has increased while balance 45.71%
expressed no change.
Table-21
Question Response % respondents
Is there any change in income of
your family, after joining SHG?
1- Income has increased 54.29
2- Income has decreased 0.00
3- No change 45.71
*Sample size 70 members.
Question Response % respondents /
Amount
Have you repaid loan of
money lender after joining
SHG?
1- Yes 30.00
2- If yes, how much Rs. 5000 to 50000

D9. Livelihood :
30% respondents have
11.43% respondents have diversified their livelihood. 8.57% respondents have started new
enterprise while there is no change in balance 50% respondents’ livelihood.
Question
Is there any change in
Livelihood of your family,
after joining SHG?
*Sample size 70 members.
D10. House Reconstruction:
15.71% respondents have repaired their old house while 12.86% respondents have
undertaken new construction in their house.
*Sample size 70 members.
D11. Domestic Assets Creation:
8.57% respondents have purchased domestic assets like
and Inverter etc.
*Sample size 70 members.
Question
Have you undertaken any
repair/construction in your
house, after joining SHG?
Question
Have you purchase any domestic asset?
30% respondents have articulated that they have intensified their existing livelihood while
11.43% respondents have diversified their livelihood. 8.57% respondents have started new
enterprise while there is no change in balance 50% respondents’ livelihood.
Table-22
Response
1- Expansion of existing enterprise
2- Started new enterprise
3- Started new enterprise in addition to existing enterprise
4- No change
*Sample size 70 members.
House Reconstruction:
15.71% respondents have repaired their old house while 12.86% respondents have
undertaken new construction in their house.
Table-23
*Sample size 70 members.
Creation:
8.57% respondents have purchased domestic assets like Refrigerator, Television, Solar light
Table-24
*Sample size 70 members.
Response % respondents
Have you undertaken any
repair/construction in your
1- Repaired old house 15.71
2- Some new construction done 12.86
3- Non of above 71.43
Response % respondents
Have you purchase any domestic asset? 1- Yes 8.57
2- No 91.43
Page | 11
articulated that they have intensified their existing livelihood while
11.43% respondents have diversified their livelihood. 8.57% respondents have started new
enterprise while there is no change in balance 50% respondents’ livelihood.
% respondents
30.00
8.57
Started new enterprise in addition to existing enterprise 11.43
50.00
15.71% respondents have repaired their old house while 12.86% respondents have
Refrigerator, Television, Solar light
% respondents
15.71
12.86
71.43
% respondents
8.57
1.43

Page | 12
QUESTIONNAIRE: