Shetty, Public Health Nutrition, Feb 2002 Comparison of Population pyramids of India and China.
12
Shetty, Public Health Nutrition, Feb 200 Comparison of Population pyramids of India and China
-
date post
19-Dec-2015 -
Category
Documents
-
view
214 -
download
0
Transcript of Shetty, Public Health Nutrition, Feb 2002 Comparison of Population pyramids of India and China.

Shetty, Public Health Nutrition, Feb 2002
Comparison of Population pyramids of India and China

Shetty, Public Health Nutrition, Feb 2002
Changes in Population Pyramids over time in India (1971-2016)Source: Technical Group on Population Projections
Registrar General of India, 1996

Shetty, Public Health Nutrition, Feb 2002
Comparison of the population pyramids of Kerala and Uttar PradeshSource: Technical Group on Population Projections
Registrar General of India, 1996
Shetty, Public Health Nutrition, Feb 2002
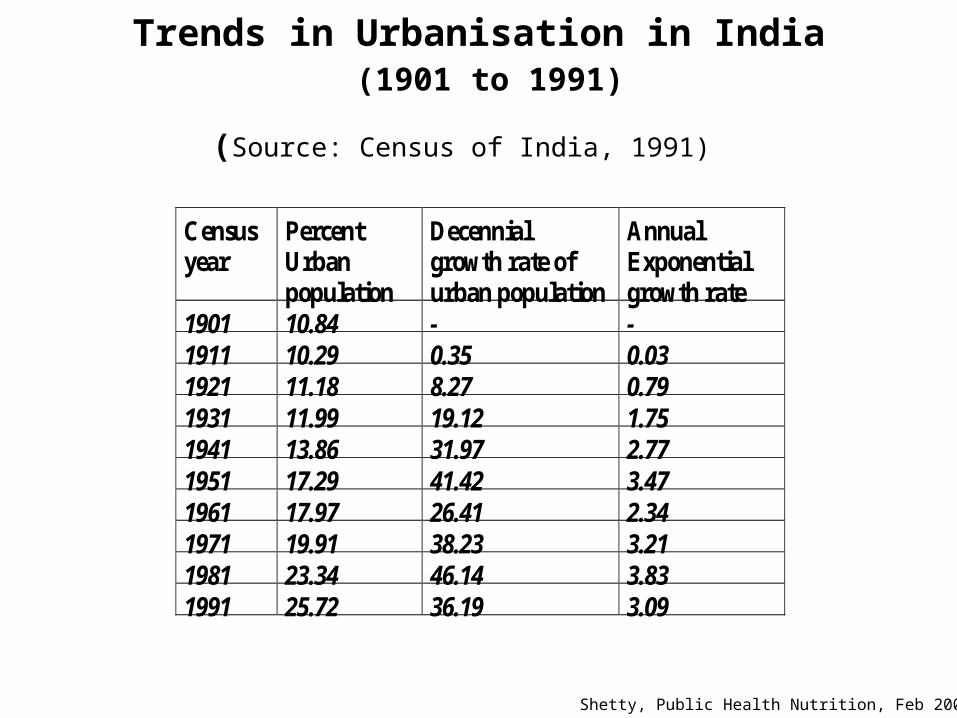
Trends in Urbanisation in India (1901 to 1991)
(Source: Census of India, 1991) Censusyear
PercentUrbanpopulation
Decennialgrowth rate ofurban population
AnnualExponentialgrowth rate
1901 10.84 - -1911 10.29 0.35 0.031921 11.18 8.27 0.791931 11.99 19.12 1.751941 13.86 31.97 2.771951 17.29 41.42 3.471961 17.97 26.41 2.341971 19.91 38.23 3.211981 23.34 46.14 3.831991 25.72 36.19 3.09

Shetty, Public Health Nutrition, Feb 2002
Variations in levels of urbanisation in the different major States of India
(Source: Census of India)
State Percent UrbanAndhra Pradesh 26.9Bihar 13.1Gujarat 35.5Haryana 24.6Himachal Pradesh 8.6Karnataka 30.9Kerala 26.4Maharastra 38.7Madya Pradesh 23.2Orissa 13.4Punjab 29.6Rajasthan 22.9Tamil Nadu 34.2Uttar Pradesh 19.8West Bengal 27.5

Shetty, Public Health Nutrition, Feb 2002
Consumption of food items (g per consumption unit per day) and nutrients in
rural populations 1970s and 1990s (NNMB surveys)
1975 - 79 1988 - 90 1990 - 91 1995
Total Cereals 504 490 468 320.9 Pulses 36 32 27.3 13.6 Leafy Vegetables 8 11 8 16 Other vegetables 51 49 43 Roots and tubers 48 50 35 45.2 Fruits 21.2 19.2 Milk + Products 100 96 85 60 Fats & Oils 12 13 9 15.7 Sugars 23 29 20 31.2 Meat etc 4.8 1.3
Energy (kcals) 2340 2283 2136 2249 Protein (g) 59 59 53 73.1 Carbohydrates (g) 347 Fats (g) 63.1 Fibre (g) 8.7

Shetty, Public Health Nutrition, Feb 2002
Consumption of food items (g per consumption unit (CU) per day) andnutrients in Urban India – differences by socio-economic status and time

Shetty, Public Health Nutrition, Feb 2002
Dietary fat intake by socio-economic groups (urban and rural) in India
(Source: NNMB surveys, 1987)
Incomegroup
Fat intake (g/day) Fat as % ofenergy
Visible Invisible TotalUrbanHigh 46 49.7 95.7 33.1Middle 35 36.5 71.5 27.2Low 22 29.9 51.9 21.0Industriallabour
23 30.0 53.0 21.3
Slumdweller
13 24.2 37.2 16.7
Rural*< 30 5 18 23 9.530-60 9 20.3 28.3 1160-90 13 22.8 35.8 13.390-150 17 25.6 42.6 14.8> 150 25 27.4 53.4 18.5Average 9 25.6 34.6 13.7

Shetty, Public Health Nutrition, Feb 2002
Comparisons of intakes of nutrients and foods between Rural and Urban populations in India
(Source: District Nutrition Profiles Survey, 1998)
Rural UrbanNutrients:Energy (kcal) 2321 2259Protein (g) 70.0 70.0Fat (g) 31.3 39.5
Food (g/CU/day):Cereals 488.1 419.5Pulses/Legumes 32.5 39.5Green Leafy vegetables 31.8 23.4Other Vegetables andFruits
84.9 112.7
Roots/Tubers 98.6 126.6Milk + Milk products 125.9 142.5Fats + Oils 14.3 21.2Sugar 20.2 21.9

Shetty, Public Health Nutrition, Feb 2002
Urban - Rural Differences in NCDs in India
Urban Rural Reference
NIDDMprevalence(Tamil Nadu)
8.2 % 2.4 % Ramachandran, 1998
CHDprevalence Delhi Moradabad
9.7 %9.0 %
2.7 %3.3 %
Chadha et al, 1997Singh, et al, 1997
Cancerincidence(Delhi vs Barshi)
118.8 57.6 Gopalan, 1997

Shetty, Public Health Nutrition, Feb 2002
Distribution of Rural and Urban adults according to BMI grades
(District Nutrition Profiles survey, 1998)
CED(<18.5)
Normal(18.5–25.0)
Overweight(> 25.0)
Obese(>30.0)
Rural: Men 29.3 % 66.7 % 3.7 % 0.3 % Women 38.2 % 57.7 % 3.6 % 0.5 %Urban: Men 38.2 % 68.7 % 5.4 % 0.4 % Women 29.1 % 64.8 % 5.4 % 0.7 %

Shetty, Public Health Nutrition, Feb 2002
Prevalence of stunting in children in India(Results of 3 different surveys)
NFHS survey, 1992 NNMB surveys,1988-96
DNP survey, 1998
Stunted 52.0 % 63.0 % 56.5 %Severely stunted 28.9 % 35.8 % 36.4 %