
Shear-torsion tests on 400 mm hollow core floor
118
ESPOO 2004 VTT RESEARCH NOTES 2274 Matti Pajari Shear-torsion tests on 400 mm hollow core floor 12 11 1 2 3 4 5 6 7 8 9 10
Transcript of Shear-torsion tests on 400 mm hollow core floor

VTT RESEA
RCH N
OTES 2274Shear-torsion tests on 400 m
m hollow
core floor
Tätä julkaisua myy Denna publikation säljs av This publication is available from
VTT TIETOPALVELU VTT INFORMATIONSTJÄNST VTT INFORMATION SERVICEPL 2000 PB 2000 P.O.Box 2000
02044 VTT 02044 VTT FIN–02044 VTT, FinlandPuh. 020 722 4404 Tel. 020 722 4404 Phone internat. + 358 20 722 4404Faksi 020 722 4374 Fax 020 722 4374 Fax + 358 20 7226 4374
ISBN 951–38–6518–5 (URL: http://www.vtt.fi/inf/pdf/)ISSN 1455–0865 (URL: http://www.vtt.fi/inf/pdf/)
ESPOO 2004 VTT RESEARCH NOTES 2274
Fifteen load tests on a floor comprising four prestressed hollow core slabswere carried out to clarify the interaction of shear and torsion. The slabswere 400 mm in depth and 7 m in length. The ends of the slabs were simplysupported on concrete beams. The loads in each test comprised one or twoconcentrated loads close to the support.
In twelve tests the loads were limited to a typical service load. Inthese tests the behaviour of the floor was relatively linear. In three teststhe floor was loaded to failure. The observed failure loads were 25–97%higher than in a reference test on a single slab unit. In the first failuretest with one point load, the failure mode was punching. In other twotests with two point loads, as well as in the reference test with one pointload, the failure was a typical shear – torsion failure.
Matti Pajari
Shear-torsion tests on 400 mmhollow core floor
1211
12
3 45
67
89
10


VTT TIEDOTTEITA � RESEARCH NOTES 2274
Shear-torsion tests on 400 mm hollow core floor
Matti Pajari VTT Building and Transport

ISBN 951�38�6518�5 (URL: http://www.vtt.fi/inf/pdf/) ISSN 1455�0865 (URL: http://www.vtt.fi/inf/pdf/) Copyright © VTT 2004
JULKAISIJA � UTGIVARE � PUBLISHER
VTT, Vuorimiehentie 5, PL 2000, 02044 VTT puh. vaihde (09) 4561, faksi (09) 456 4374
VTT, Bergsmansvägen 5, PB 2000, 02044 VTT tel. växel (09) 4561, fax (09) 456 4374
VTT Technical Research Centre of Finland, Vuorimiehentie 5, P.O.Box 2000, FIN�02044 VTT, Finland phone internat. + 358 9 4561, fax + 358 9 456 4374
VTT Rakennus- ja yhdyskuntatekniikka, Kemistintie 3, PL 1805, 02044 VTT puh. vaihde 020 722 111, faksi 020 722 7007
VTT Bygg och transport, Kemistvägen 3, PB 1805, 02044 VTT tel. växel 020 722 111, fax 020 722 7007
VTT Building and Transport, Kemistintie 3, P.O.Box 1805, FIN�02044 VTT, Finland phone internat. +358 20 722 111, fax +358 20 722 7007
2
Technical editing Leena Ukskoski

3
Pajari, Matti. Shear-torsion tests on 400 mm hollow core floor. Espoo 2004. VTT Tiedotteita � Research Notes 2274. 30 p. + app. 82 p.
Keywords shear tests, torsion tests, hollow core slabs, floors, testing, test specimens, load testing,failure loads, load distribution, concrete, precast, prestressed, structure
Abstract Fifteen load tests on a floor comprising four prestressed hollow core slabs were carried out to clarify the interaction of shear and torsion. The slabs were 400 mm in depth, 1.2 m in width and 7 m in length. The ends of the slabs were simply supported on concrete beams. The loads in each test comprised one or two concentrated loads close to the support.
In twelve tests the loads were limited to a typical service load or to a somewhat higher load. In these tests the behaviour of the floor was relatively linear and no sign of failure could be observed. In three tests the floor was loaded to a local failure. The observed failure loads were 25�97% higher than in a reference test on a single slab unit with identical support conditions. In the first failure test with one point load the failure mode was punching. In other two tests with two point loads, as well as in the reference test with one point load, the failure was a typical shear-torsion failure.
As a subtask of HOLCOTORS project, the test results have been used by Chalmers University of Technology for calibration of computerized calculation methods they have developed. This work is published elsewhere. Therefore, the present design practice has not been evaluated here in view of the obtained results.

Preface In 2002�2004, a European research project named HOLCOTORS was carried out. It aimed at providing numerical methods for analysis and simplified methods for design of prestressed hollow core floors subjected to shear and torsion. The calculation models were developed by Chalmers University of Technology, Sweden. The tests used for verification of the models were carried out and documented by VTT, Finland. The researchers in the involved research institutes were
Helen Broo Chalmers Björn Engström Chalmers Karin Lundgren Chalmers Matti Pajari VTT Mario Plos Chalmers.
In addition to the researchers, the following representatives of the industrial partners participated in the work as members of the steering group and by participating in the workshops organised on the day before the steering group meetings:
Olli Korander Consolis Technology, Finland, Chairman Arnold van Acker Belgium Willem Bekker Echo, Belgium David Fernandez-Ordonez Castelo, Spain Ronald Klein-Holte BVSH (VBI) The Netherlands Gösta Lindström Strängbetong, Sweden Aad van Paassen BVSH (VBI), The Netherlands Nordy Robbens Echo, Belgium Bart Thijs Echo, Belgium Jan de Wit IPHA (Dycore), The Netherlands Javier Zubia Castelo, Spain.
Gösta Lindström also worked in close co-operation with the researchers, participated in extra workshops between the steering group meetings and made proposals for the future design practice.
The experimental part of the research project, a part of which is documented in this report, was financed by the Fifth Framework Programme of European Commission (Competitive and Sustainable Growth, Contract Nº G6RD-CT-2001-00641); Inter-national Prestressed Hollow Core Association, Bundesverband Spannbeton-Hohlplatten, Castelo, Consolis, Echo, Strängbetong, and VTT. The test specimens were provided by Parma Betonila, Finland.
4

Contents
Abstract..............................................................................................................................3
Preface ...............................................................................................................................4
1. Introduction..................................................................................................................6
2. Test arrangements ........................................................................................................7
3. Results of load tests ...................................................................................................14 3.1 Tests with service load .....................................................................................14 3.2 Failure tests.......................................................................................................18
4. Strength of concrete ...................................................................................................24
5. Analysis of results......................................................................................................26
6. Discussion..................................................................................................................29
References .......................................................................................................................30
Appendices A Photographs
B Measured slab cross-sections
C Measured forces, strains and displacements
D Initial part of load-deflection curves
5

1. Introduction
The tests documented in this report were planned to clarify the effect of shear and torsion on the deflection and resistance of a floor made of prestressed hollow core slab units. By placing the load close to the support, bending failure modes were eliminated.
In all figures of this report, the measures are given in millimetres unless otherwise specified.
6

2. Test arrangements
12 tests with service load were carried out. In these tests the floor was subjected to one point load which was increased monotonously until a certain predefined limit load was achieved. After that the load was moved to another position and the same procedure was repeated. All positions of the service point load are shown in Fig. 1.a.
After the service load tests the floor was loaded to failure in three tests. In the first test there was one point load, in the second and third test two point loads. Their location is illustrated in Fig. 1.b. Some characteristics of the test specimens are given in Table 1. Different tests are identified by symbol PF400:x where x is the number of the test shown in Fig. 1.
1211
1 23 4
5 6 7
8910
a)
13
15
14
b)
Fig. 1. General view on loading arrangements. a) Location of point load in tests PF400:1�12. b) Location of point loads in tests PF400:13�15.
Table 1. Characteristics of slab units in test PF400.
Thickness mm
Strands Initial prestress MPa
Length m
Cast
400 11 d 12.5 1000 7080 26.6.2002
For comparison, a load test called ST400E1M with similar support conditions as in the present floor but with only one slab unit was carried out, see Fig. 2. This test has been reported elsewhere [3].
7

8
P
e
Fig. 2. Loading arrangements in test ST400E1M [3].
The material data provided by the manufacturer of the slab units are collected in Table 2.
Table 2. Data provided by the slab manufacturer.
Concrete K60 Cement CEM I 52,5 R Cement kg/m3 270 Water l/m3 145 Maximum aggregate size # [mm] 16 Number of aggregates 4 Strands - strength/0.2% yield strength [MPa] - initial prestress [MPa]
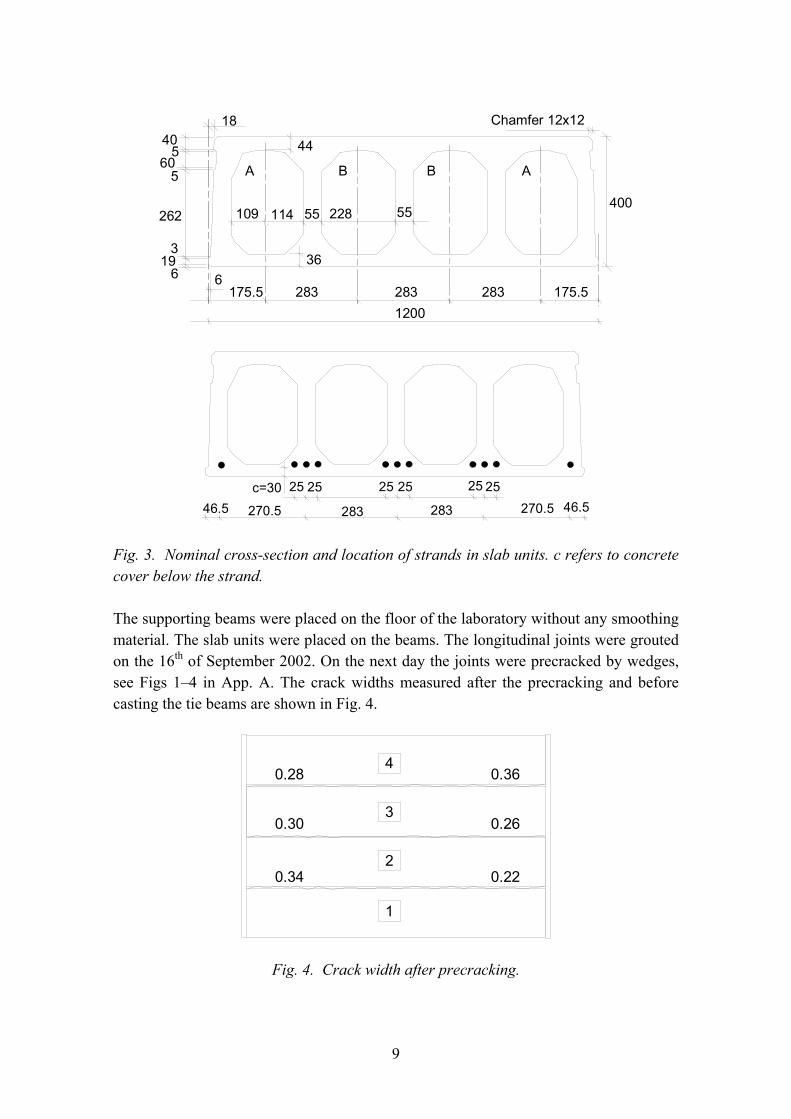
1860 / 1640
1000
The nominal cross-section of the slab units is given in Fig. 3 and the measured geometry in Appendix B. For the shape of the hollow cores see also Fig. 34. The geometry of the supporting beams is specified in Fig. 6.a and the arrangements at the support in Figs 6.b and 7.
109 114 228
175.5 283 283 283 175.56
1840
560
5
3
619
Chamfer 12x12
1200
36
44
55400
55262
A B B A
270.5
c=3046.5 283 283
25
270.5 46.52525252525
Fig. 3. Nominal cross-section and location of strands in slab units. c refers to concrete cover below the strand.
The supporting beams were placed on the floor of the laboratory without any smoothing material. The slab units were placed on the beams. The longitudinal joints were grouted on the 16th of September 2002. On the next day the joints were precracked by wedges, see Figs 1�4 in App. A. The crack widths measured after the precracking and before casting the tie beams are shown in Fig. 4.
4
3
2
1
0.34
0.30
0.28
0.22
0.26
0.36
Fig. 4. Crack width after precracking.
9

The tie beams were cast on the 18th of September 2002.
The support conditions and test arrangements are roughly presented in Fig. 5 and in more detail in Figs 6�11.
200
7080 (length of slab)
7
P
I Location of load P/2 in test I (I = 14, 15)
Location of vertical transducer J
Concrete elementL = 5000
6
I Location of load P in test I (I = 1, ... ,13)
5
43,142
9
1,13
1011,1512
40
1
2
3
4
1112
1314
15
1617
1819
20
2122
2324
25
2627
2829
42
41
40
39
38
37
36
35
34
33
32
31
63
2
4
5
1
60200 760JK Location of horizontal transducer K
20
47
46
45
44
43
20
40
14
15
8
30
Fig. 5. Numbering and location of horizontal transducers 1�6 and vertical transducers 11�47 as well as location of loads in tests PF400:1�PF400:15.
10

570
400
200 150150
300
400100 100
Rebarsd 10 c/c 300
2 d 10
2 d 16
2 holes for lifting
Concrete K30
a)
80100
30
Cast-in-situ concrete K30
2 rebars d 16 L = 4750
16 rebars d 10c/c 300L = 400 + 300
200
10060Plywood board
30x50x80under webs,2 pc./s lab end
50
Thin plastic sheet
b)
Fig. 6. a) Supporting beam, length = 5.0 m. b) Arrangements at support. See also Fig. 7. d x refers to a reinforcing bar with diameter x.
1
2
3
4
1200AA
a)
30
200
100100
70
Tie bar inlongitudinal joint
A A
160
70230
b)
Fig. 7. Tie reinforcement in longitudinal joints. a) Plan. b) Elevation.
11

2355
Location of vertical transducer J Location of load P 40
3
4
60200
208318001517
11551245
883600317
2355208318001517
11551245
883600317
2355
1155
Symmetric
760200
40
1245
45 45Centre line of floor45
Symm. 453176008831155
151718002083
Symm.
2355
1
2
Location of load P/2
Fig. 8. Location of loads P and vertical transducers. See Fig. 5 for numbering of transducers.
P
Gypsum
Steel plate10x100x100
Fig. 9. Arrangements below one point load.
12

13
P e
Gypsum
Roller barSteel plate10x100x100
CL
Gypsum
Bar welded to steel plateSteel plate10x100x100
e
Fig. 10. Arrangements when two point loads are applied.
3
70
70
Strain gauge
Centre line of joint
Centre line of joint
9 (10)
7 (8)
Fig. 11. Location of strain gauges 7�10 fixed to horizontal steel bars in tie beam at the loaded end. See also Fig. 3 in App. A. The numbers in parentheses refer to gauges glued to the lower bar.
The tests were carried out by keeping the rate of elongation of the actuator at a predefined level. When necessary, this level was shifted. The rate of loading was measured. It is given in App. C for each test.

3. Results of load tests
3.1 Tests with service load
In tests PF400:1�PF400:12 the floor was loaded with one point load. Before each test the measuring devices were zero-balanced. The load was increased monotonously up to a value which was estimated to be 50% or less of the failure load. The load-time relationship as well as the measured strains, crack widths and displacements are given graphically in App. C and some details in App. D. In test PF400:1 there was a sudden, uncontrolled increase in the load to 250 kN. In other tests the loading was under control all the time.
The displacements measured along the transverse line close to the loads were small, in all tests less than 1.1 mm. The settling of the supports was negligible, the highest value being of the order of 0.1 mm. The measured strains in the reinforcement of the tie beam were also small. Their highest value corresponded to the stress 22 MPa in the steel.
The ascending part of the load-deflection curves for the span (transducers 11�30) showed certain bilinearity in many cases, see Appendices C and D. This might have been due to cracking of the concrete, but then it would not have occurred during reloading (load on the next web).
The maximum change of crack width was of the order of 0.02 mm. This is much less than 0.3 mm which was the order of the crack width after precracking.
Figures 12�23 illustrate the deflection of the slab along a transverse line close to the load. In many cases there is a considerable discontinuity over the joints.
0.00.20.40.60.81.01.2
0 1.2 2.4 3.6 4.8
Distance from edge [mm]
Def
lect
ion
[mm
]
250 kN
Fig. 12. PF400:1. Deflection measured by transducers 11�30 at maximum load.
14

0.0
0.2
0.4
0.6
0.8
0 1.2 2.4 3.6 4.8
Distance from edge [mm]
Def
lect
ion
[mm
]
200 kN
Fig. 13. PF400:2. Deflection measured by transducers 11�30 at maximum load.
0.00.10.20.30.40.50.60.7
0 1.2 2.4 3.6 4.8
Distance from edge [mm]
Def
lect
ion
[mm
]
150 kN
Fig. 14. PF400:3. Deflection measured by transducers 11�30 at maximum load. Transducer 26 (fifth from the right) out of action, see also App. C, Fig. 27.
0.00.10.20.30.40.50.6
0 1.2 2.4 3.6 4.8
Distance from edge [mm]
Def
lect
ion
[mm
]
150 kN
Fig. 15. PF400:4. Deflection measured by transducers 11�30 at maximum load.
15

0.0
0.1
0.2
0.3
0.4
0.5
0 1.2 2.4 3.6 4.8
Distance from edge [mm]
Def
lect
ion
[mm
]
100 kN
Fig. 16. PF400:5. Deflection measured by transducers 11�30 at maximum load.
-0.10.00.10.20.30.40.50.6
0 1.2 2.4 3.6 4.8
Distance from edge [mm]
Def
lect
ion
[mm
]
101 kN
Fig. 17. PF400:6. Deflection measured by transducers 11�30 at maximum load.
0.00.10.20.30.40.50.60.7
0 1.2 2.4 3.6 4.8
Distance from edge [mm]
Def
lect
ion
[mm
]
100 kN
Fig. 18. PF400:7. Deflection measured by transducers 11�30 at maximum load.
16

0.00.10.20.30.40.50.6
0 1.2 2.4 3.6 4.8Distance from edge [mm]
Def
lect
ion
[mm
]
150 kN
Fig. 19. PF400:8. Deflection measured by transducers 11�30 at maximum load.
0.0
0.1
0.2
0.3
0.4
0.5
0 1.2 2.4 3.6 4.8Distance from edge [mm]
Def
lect
ion
[mm
]
150 kN
Fig. 20. PF400:9. Deflection measured by transducers 11�30 at maximum load.
0.0
0.1
0.2
0.3
0.4
0.5
0 1.2 2.4 3.6 4.8
Distance from edge [mm]
Def
lect
ion
[mm
]
100 kN
Fig. 21. PF400:10. Deflection measured by transducers 11�30 at maximum load.
17

-0.1
0.0
0.1
0.2
0.3
0.4
0.5
0.6
0 1.2 2.4 3.6 4.8
Distance from edge [mm]
Def
lect
ion
[mm
]
100 kN
Fig. 22. PF400:11. Deflection measured by transducers 11�30 at maximum load.
-0.10.00.10.20.30.40.50.60.7
0 1.2 2.4 3.6 4.8
Distance from edge [mm]
Def
lect
ion
[mm
]
101 kN
Fig. 23. PF400:12. Deflection measured by transducers 11�30 at maximum load.
3.2 Failure tests
In test PF400:13 the floor was loaded with one point load. The failure mode was punching failure. To avoid this unintended failure mode in the remaining failure tests, the floor was loaded with two point loads in tests PF400:14 and PF400:15. In all three tests the load was increased monotonously until failure load. All measuring devices were zero-balanced before each test.
The load vs. time relationship as well as the measured strains, crack widths and displacements are given graphically in App. C. The failure loads are summarized in Fig. 24. The cracking patterns are illustrated in Figs 25�27 and in App. A, Figs 9�15, 17�26 and 31�36. See also Table 8 in which the observations made during the tests are
18
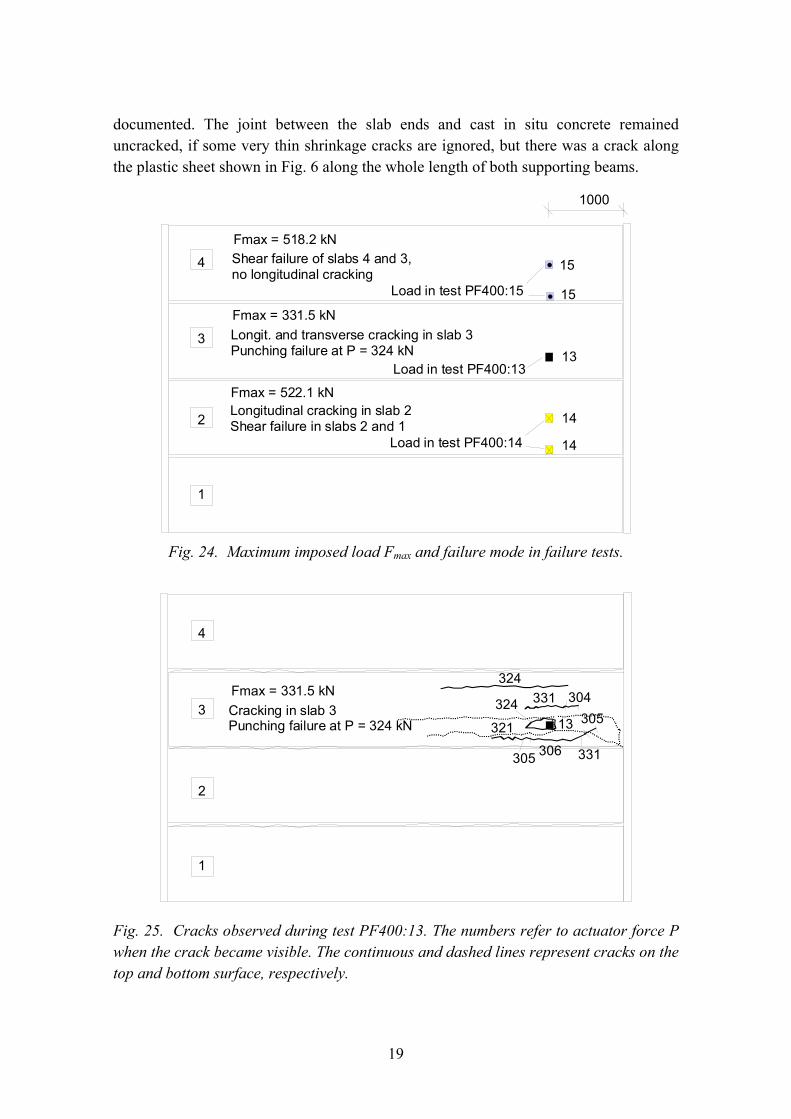
documented. The joint between the slab ends and cast in situ concrete remained uncracked, if some very thin shrinkage cracks are ignored, but there was a crack along the plastic sheet shown in Fig. 6 along the whole length of both supporting beams.
14
13
15
1
2
3
4
1000
14
Load in test PF400:15
Load in test PF400:13
Load in test PF400:14
Fmax = 518.2 kNShear failure of slabs 4 and 3, no longitudinal cracking
Fmax = 331.5 kN Longit. and transverse cracking in slab 3Punching failure at P = 324 kN
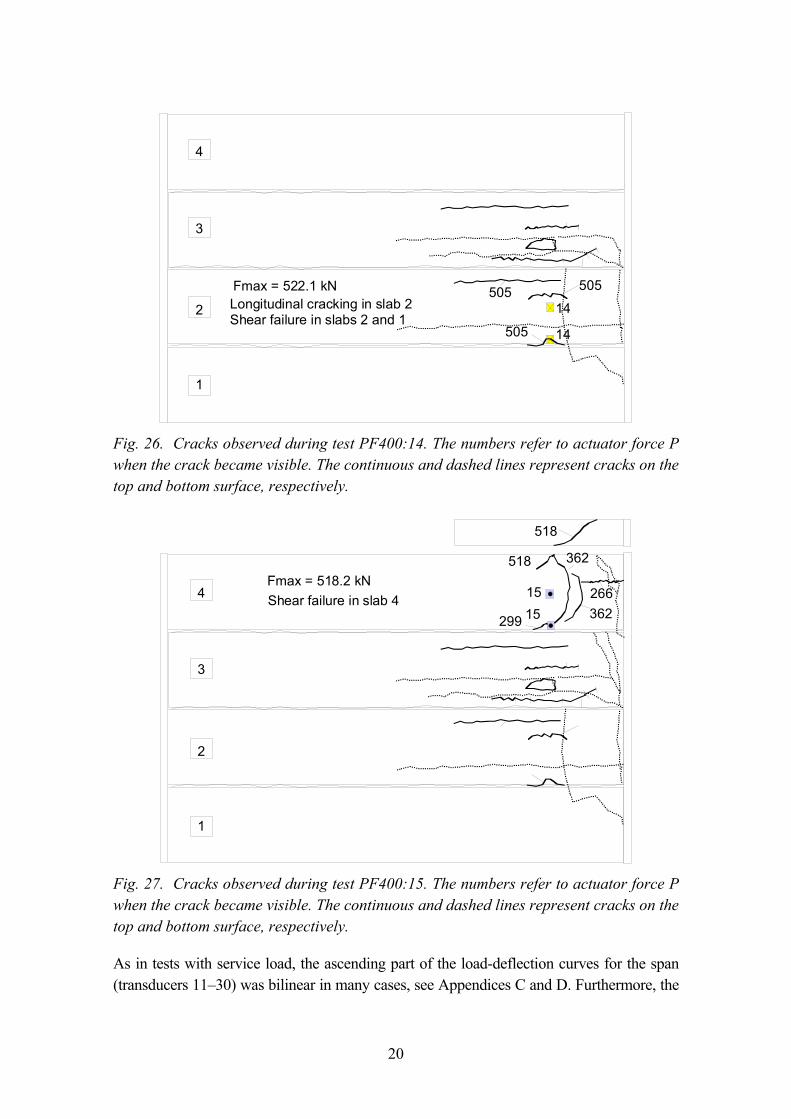
Fmax = 522.1 kNLongitudinal cracking in slab 2Shear failure in slabs 2 and 1
15
Fig. 24. Maximum imposed load Fmax and failure mode in failure tests.
13
1
2
3
4
Fmax = 331.5 kN Cracking in slab 3Punching failure at P = 324 kN
331
306 331305
321
304324
324
305
Fig. 25. Cracks observed during test PF400:13. The numbers refer to actuator force P when the crack became visible. The continuous and dashed lines represent cracks on the top and bottom surface, respectively.
19
14
1
2
3
4
14
Fmax = 522.1 kNLongitudinal cracking in slab 2Shear failure in slabs 2 and 1
505 505
505
Fig. 26. Cracks observed during test PF400:14. The numbers refer to actuator force P when the crack became visible. The continuous and dashed lines represent cracks on the top and bottom surface, respectively.
15
1
2
3
4Fmax = 518.2 kNShear failure in slab 4
15
518 362
362266
299
518
Fig. 27. Cracks observed during test PF400:15. The numbers refer to actuator force P when the crack became visible. The continuous and dashed lines represent cracks on the top and bottom surface, respectively.
As in tests with service load, the ascending part of the load-deflection curves for the span (transducers 11�30) was bilinear in many cases, see Appendices C and D. Furthermore, the
20

initial parts of the curves in tests PF400:13 and PF400:14 are close to those in tests PF400:1 and PF400:4. This is difficult to explain by cracking of the concrete but it may be attributable to the possible tilting of the supporting beams, which was not measured.
At maximum load, the displacements measured along the transverse line close to the loads were small, in all tests less than 3.5 mm. The settling of the supports was also negligible, the highest value being of the order of 0.3 mm. The measured strains in the reinforcement of the tie beam were also small. Their highest value corresponded to the stress 90 MPa in the steel in test PF400:15, but in other tests the stresses were below 12 MPa.
The maximum change of crack width was of the order of 0.08 mm. This is much less than 0.3 mm which was the order of the crack width before the test series was started.
0.0
0.5
1.0
1.5
2.0
2.5
0 1.2 2.4 3.6 4.8
Distance from edge [mm]
Def
lect
ion
[mm
]
251 kN300 kN331 kN
Fig. 28. PF400:13. Deflection measured by transducers 11�30 at different loads.
0.00.51.01.52.02.53.03.54.0
0 1.2 2.4 3.6 4.8
Distance from edge [mm]
Def
lect
ion
[mm
]
150 kN400 kN485 kN505 kN
Fig. 29. PF400:14. Deflection measured by transducers 11�30 at different loads.
21

0.0
0.5
1.0
1.5
2.0
2.5
3.0
3.5
0 1.2 2.4 3.6 4.8
Distance from edge [mm]
Def
lect
ion
[mm
]100 kN250 kN400 kN517 kN
Fig. 30. PF400:15. Deflection measured by transducers 11�30 at different loads.
In Figs 31�33 the deflection measured in failure test is compared with the deflection measured in service load test. The deflections coincide rather well despite the permanent deformations and cracking which had taken place before the last two tests were started.
0.0
0.2
0.4
0.6
0.8
1.0
1.2
0 1.2 2.4 3.6 4.8
Distance from edge [mm]
Def
lect
ion
[mm
]
251 kN, Fail250 kN, Ser
Fig. 31. Tests PF400:1 (Ser) and PF400:13 (Fail). Deflection measured by transducers 11�30 at load P ≈ 250 kN.
22

0.0
0.1
0.2
0.3
0.4
0.5
0.6
0 1.2 2.4 3.6 4.8
Distance from edge [mm]
Def
lect
ion
[mm
]150 kN, Fail150 kN, Ser
Fig. 32. Tests PF400:4 (Ser) and PF400:14 (Fail). Deflection measured by transducers 11�30 at load P = 150 kN.
0.0
0.1
0.2
0.3
0.4
0.5
0 1.2 2.4 3.6 4.8
Distance from edge [mm]
Def
lect
ion
[mm
]
100 kN, Fail100 kN, Ser
Fig. 33. Tests PF400:10 (Ser) and PF400:15 (Fail). Deflection measured by transducers 11�30 at load P = 100 kN.
23

24
4. Strength of concrete
The strength of the concrete was measured from 50 x 50 mmcores for the slab units and from 150 mm test cubes for the cast-in-situ concrete. The results are given in Tables 3�5. The cores were covered with plastic after drilling in such a way that they were still wet when tested. The test cubes were kept in the same temperature and relative humidity as the floor test specimen until testing.
Table 3. Strength and density of 50x50 mm cores drilled from slab units 2 and 3 and tested on 9th of October 2002.
Specimen Strength MPa
Density kg/m3
21 (slab 2) 75.5 2440 22 (slab 2) 67.0 2430 23 (slab 2) 71.5 2430 31 (slab 3) 79.0 2450 32 (slab 3) 79.0 2440 33 (slab 3) 77.0 2440
Mean x 74.8 2438 Standard deviation s 4.8 8
Characteristic strength fck,C50 = x�1.65s
66.8
Table 4. Strength and density of 150 mm test cubes cast from grouting in the longitudinal joints and tested on 3rd of October 2002.
Specimen Strength MPa
Density kg/m3
S1 37.5 2250 S2 38.5 2240 S3 38.0 2250 S4 39.5 2270 S5 39.0 2260 S6 38.0 2250
Mean x 38.4 2253 Standard deviation s 0.7 10
Characteristic strength fck,K150 = x�1.65s
37.2

Table 5. Strength and density of 150 mm test cubes cast from grouting in the tie beams and tested on 3rd of October 2002.
Specimen Strength MPa
Density kg/m3
P1 37.5 2260 P2 36.5 2260 P3 36.5 2240 P4 37.0 2270 P5 37.0 2230 P6 37.5 2260
Mean x 37.4 2253 Standard deviation s 1.1 15
Characteristic strength fck,K150 = x�1.65s
35.6
25

26
5. Analysis of results
It is assumed that the strength measured from 50 mm drilled cores gives directly the cubic strength measured from 150 mm cubes and that the cylinder strength is equal to 85% of the cubic strength. In this way, the lower characteristic cylinder strength fck,C150 (150 x 300 mm cylinders) given in Table 6 is obtained. From this, the mean tensile strength
⎟⎠⎞
⎜⎝⎛ ++=
MPaMPaf
f ckctm 10
81ln12,2 (1)
is obtained according to Eurocode 2 [2].
Table 6. Strength fc,C50 measured from 50 mm cores, corresponding cylinder strength fc,C150 and mean tensile strength fctm.
fc,C50
MPa
fc,C150
MPa
fctm
MPa
PF400 66.8 56.8 4.27
To give an impression about the shear resistance observed in tests PF400:13�PF400:15, a virtual load test PFR400 is analysed according to the product standard EN 1168 [1]. In this test a single slab element, identical to those in floor test and with similar support conditions, is loaded with a line load P at a distance of 1.0 m from slab end. It is assumed that the critical point is at the mid-depth of the cross-section and at a distance of 280 from the slab end (200 mm from the inner edge of the support). Since Eurocode 2 does not state clearly, which value can be regarded as the mean transfer length, two different values, 395 and 700 mm, are used for the transfer length. It is not clear, either, what would be the exact value for the loss of prestress. Therefore, calculations are made with two values: 5% and 10% of the initial prestressing force.
The cross-sectional characteristics of the slab are calculated from the nominal cross-section shown in Fig. 34 with the exception that the measured value 276 mm, see App. B, is used for bw, the sum of the web widths. In this way, the values given in Table 7 are obtained. In addition to the support reaction due to the imposed load Pu,pre, Vu,pre also includes the support reaction due to the dead weight of the slab.

4444
165
62
400114109
3664
7615
R120R120 R120R120
40 69 52 62
64
36
525262
228
762
194
55
83 95
1160
A B AB
36
Figure 34. Geometry used for calculating A, S and I.
Table 7. Virtual shear test PF400R. Distance from centroid of strands to the bottom fibre ep, distance from centroidal axis to bottom fibre e, sum of web widths bw, cross-sectional area A, second moment of area I and first moment of area above centroidal axis S, assumed transfer length lb, Assumed loss of prestress and predicted shear resistance Vu,pre (shear force at support).
ep
mm
e
mm
bw
mm
A
mm2
I
mm4
S
mm3
lb
mm
Loss
%
Pu,pre
kN
Vu,pre
kN
PF400R 35 200 276 210800 4.43.109 1.41.107 395 5 551 493 " " " " " " 395 10 495 488 " " " " " " 700 5 545 445 " " " " " " 700 10 491 441
Comparison of the calculated resistances Vu,pre indicates that the exact value of the loss is of little importance but the transfer length plays a major role. In Table 7 also the imposed load Pu,pre corresponding to the shear resistance is given. It is of the same order as the eccentric failure loads in tests PF400:14 and PF400:15.
In Table 8 the obtained resistances for different failure tests, virtual test PFR400 included, are compared.
27

28
Table 8. Failure load Fmax = Pmax + Peq (Pmax is the actuator force, Peq is the weight of loading equipment), its eccentricity e and description of response. Peq = 0.8 kN for tests PF400:14 and PF400:15. For other tests Peq = 0.3 kN.
Fmax kN
e mm
Observations
PF400:13
331.5 283 First cracks on the top of the floor at P = 305 kN. Load decreased with increasing displacements until P = 289 kN and started to increase again. At P = 331 kN there was a drop to 303 kN. The load could still be increased until at 324 kN a punching failure took place.
PF400:14
522.1 283 Shear or shear torsion failure in slabs 2 and 1 at P = 521 kN. With decreasing load at P = 505 kN cracks could be seen on the top surface.
PF400:15
518.2 283 At P = 266 kN a short longitudinal crack on the top of slab 4, see Fig. 27. At P = 517 kN shear failure in slab 4, but the load could still be kept at P = 340�360 kN for a longer period.
ST400E1M1)
264.8 283 Shear-torsion failure, test on a single slab unit supported on mortar bearing.
PFR400
491�551 0 Virtual test on a single slab unit. Shear tension failure. Fmax depends on assumed transfer length and loss of prestresss..
1) See report [3]

6. Discussion
The test specimens seemed to be typical of normal production. The strength of the concrete was high enough and the slippage of the strands was small in all elements. The loading and measuring equipment worked as intended with some insignificant exceptions.
The observed failure loads were higher than expected on the basis of the design practice presented in EN 1168 [1]. In the first failure test with one point load, a punching failure took place instead of the desired shear-torsion failure. In the remaining two failure tests with two point loads each, the failure mode was shear-torsion failure. In these two tests the local failure in the previous test(s) may have slightly reduced the observed resistance, but it is on the safe side to use the observed resistances as the real ones.
In view of the obtained high failure loads, the loads in most service load tests might have been higher. On the other hand, the response of the floor was so linear in the failure tests that increasing the maximum loads in the service load tests would not have affected the observed stiffness too much.
In most tests the load-deflection relationship looked bilinear in such a way that at the beginning the response was considerably stiffer than thereafter. It is not easy to explain this behaviour by clamping of the slab ends at the beginning and subsequent cracking because the bilinearity did not disappear after the first test. In fact, it was there still in the failure tests PF400:13�PF400:15 as shown in App. D in which the initial parts of the load-deflection curves are presented not only for the failure tests but also for the corresponding service load tests. Other possible explanations are hysteresis and tilting or horizontal sliding of the supporting beams along the supporting floor. The tilting or sliding cannot be confirmed by measurements because the horizontal displacements of the beams were not measured.
29

30
References
1. EN 1168. Precast concrete products � Hollow core slabs. 2005.
2. EN 1992-1-1. Eurocode 2: Design of concrete structures � Part 1: General rules and rules for buildings. 2004.
3. Pajari, M. Shear-torsion interaction tests on single hollow core slabs. Espoo 2004. VTT Research Notes 2275. 76 p. + app. 122 p. http://www.vtt.fi/inf/pdf/tiedotteet/2004/T2274.pdf

Appendix A: Photographs The numbers on the surface of the slabs refer to the actuator load. They tell the load at which the crack grew until the indicated position.
Fig. 1. Arrangements before jointing.
Fig. 2. Design of wedging equipment to create longitudinal cracks in the joints.
A1

Fig. 3. Crack in joint due to wedging.
Fig. 4. Crack in joint due to wedging.
A2
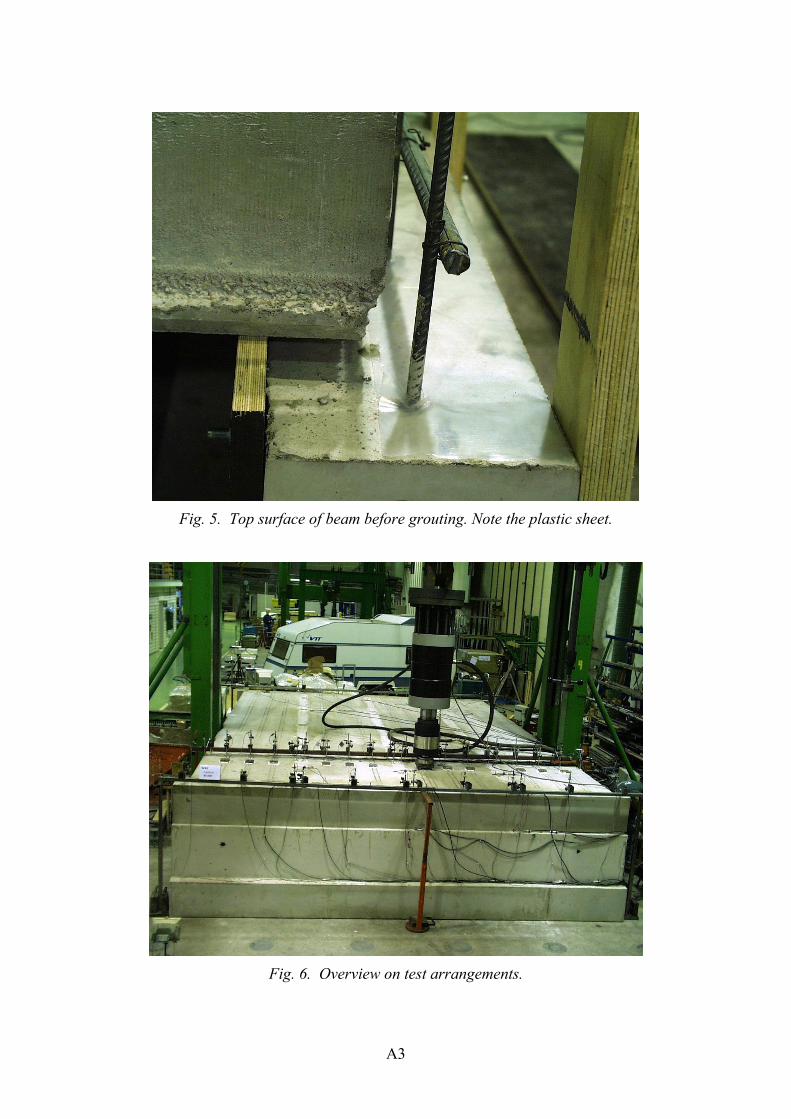
Fig. 5. Top surface of beam before grouting. Note the plastic sheet.
Fig. 6. Overview on test arrangements.
A3
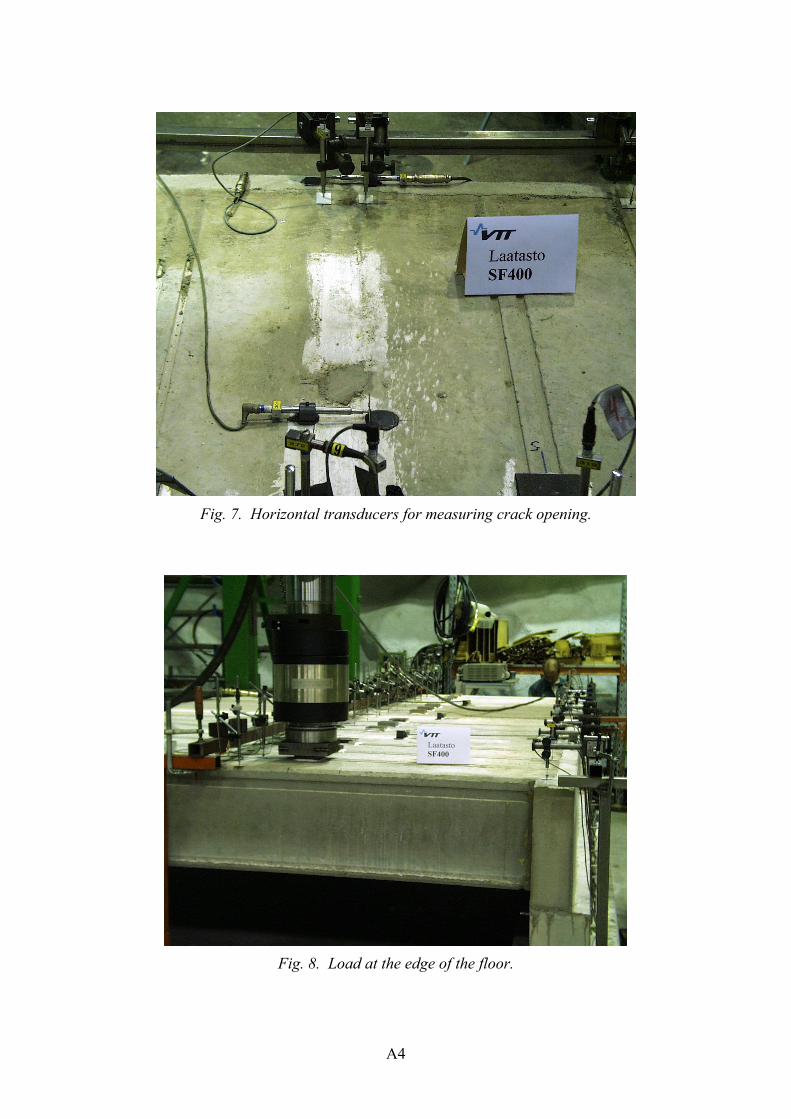
Fig. 7. Horizontal transducers for measuring crack opening.
Fig. 8. Load at the edge of the floor.
A4

Fig. 9. PF400:13. Cracks after failure.
Fig. 10. PF400:13. Cracks after failure.
A5

Fig. 11. PF400:13. Cracks after failure on the top.
Fig. 12. PF400:13. Cracks in soffit of slab 3 after failure.
A6
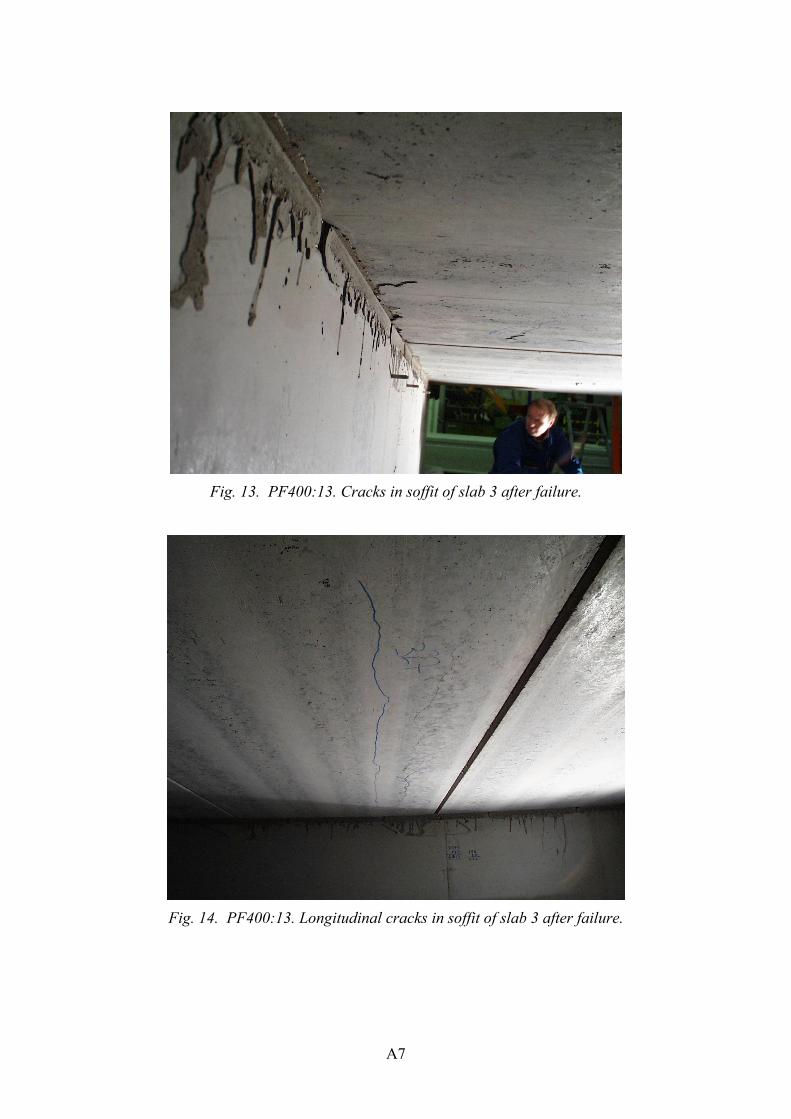
Fig. 13. PF400:13. Cracks in soffit of slab 3 after failure.
Fig. 14. PF400:13. Longitudinal cracks in soffit of slab 3 after failure.
A7
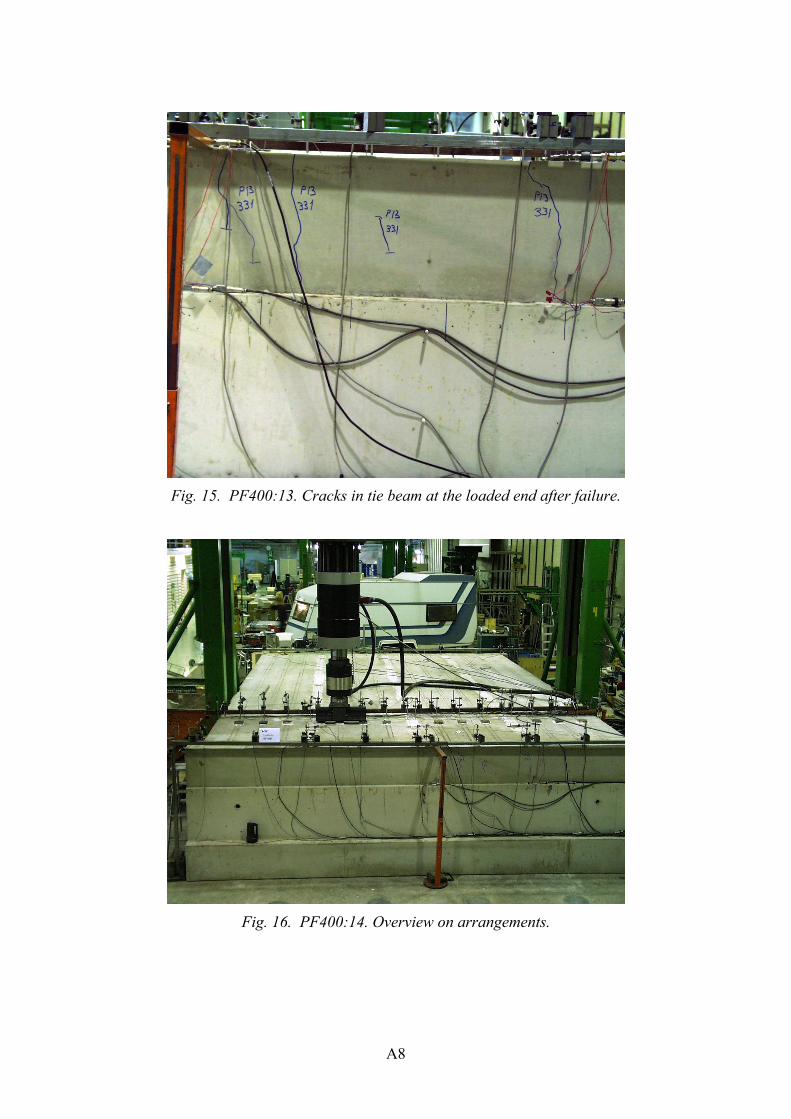
Fig. 15. PF400:13. Cracks in tie beam at the loaded end after failure.
Fig. 16. PF400:14. Overview on arrangements.
A8

Fig. 17. PF400:14. View on loading details.
Fig. 18. PF400:14. Cracks in tie beam at the loaded end shown in red colour.
A9
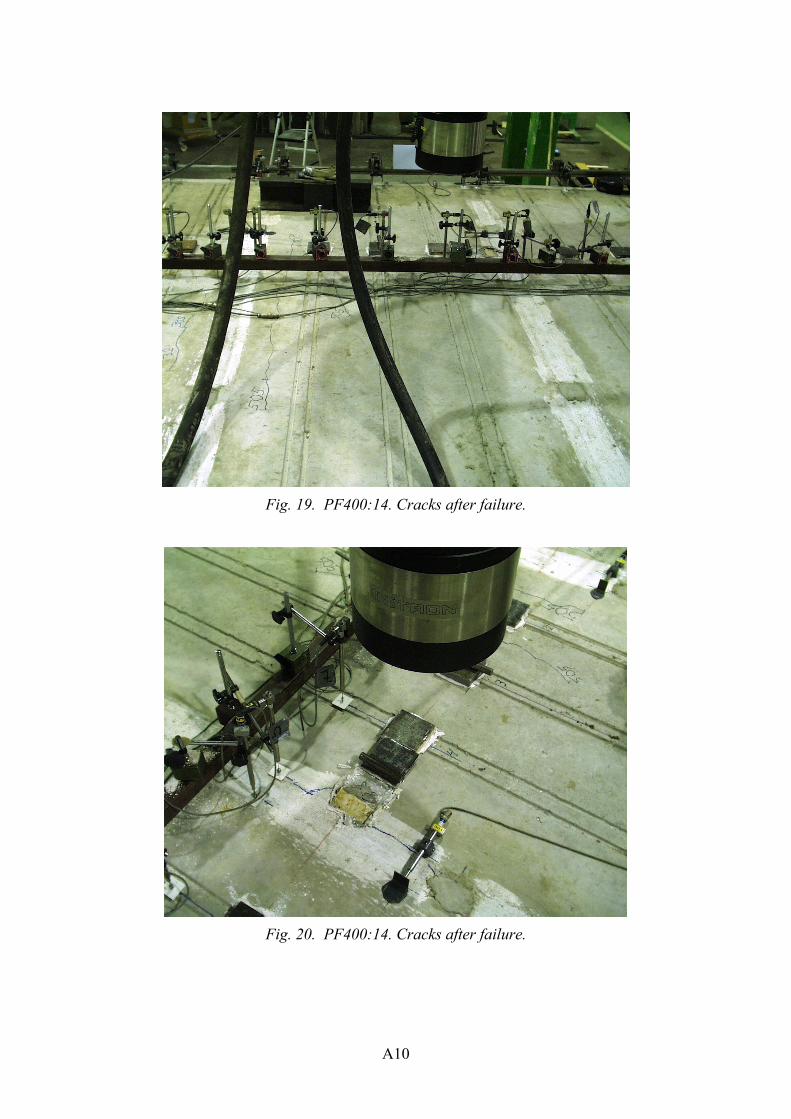
Fig. 19. PF400:14. Cracks after failure.
Fig. 20. PF400:14. Cracks after failure.
A10
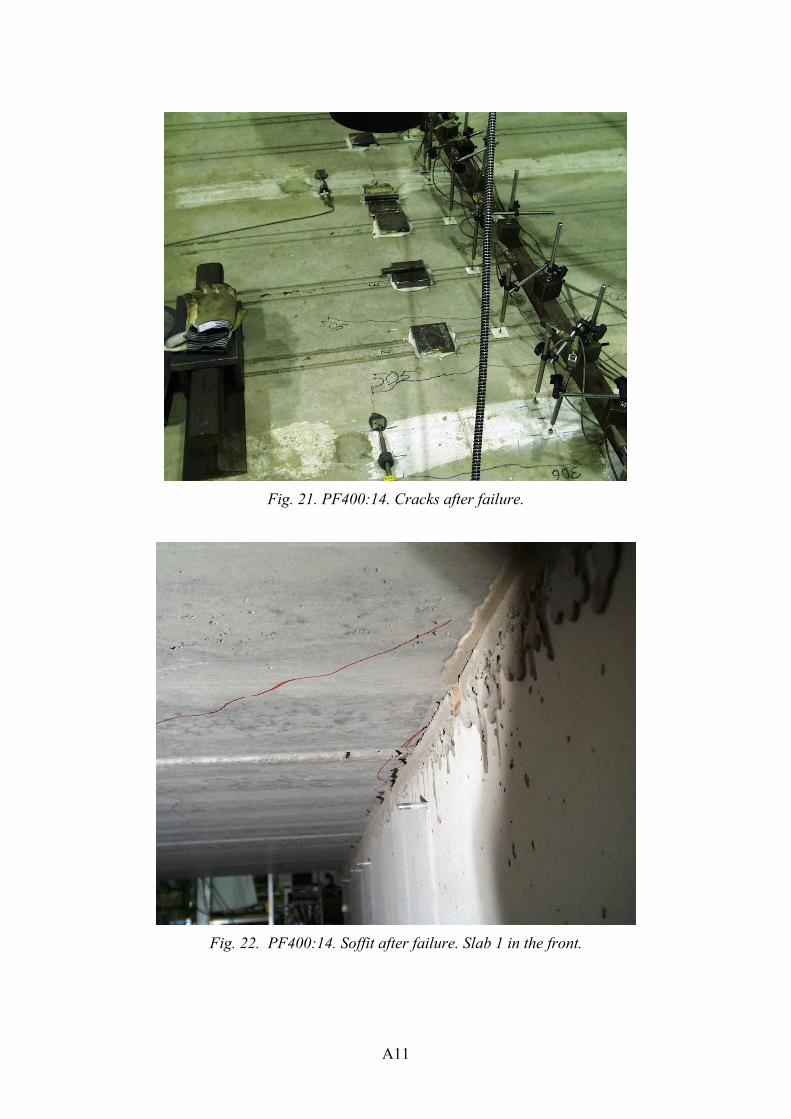
Fig. 21. PF400:14. Cracks after failure.
Fig. 22. PF400:14. Soffit after failure. Slab 1 in the front.
A11

Fig. 23. PF400:14. Soffit after failure. Slab 2 on the left, slab 1 on the right.
Fig. 24. PF400:14. Soffit after failure. Slab 2 on the left, slab 1 on the right.
A12

Fig. 25. PF400:14. Soffit after failure. Slab 1 in the front.
Fig. 26. PF400:14. PF400:14. Diagonal shear crack in slab 2 photographed after removal of slab 1.
A13

Fig. 27. PF400:15. Overview on arrangements.
Fig. 28. PF400:15. Loading arrangements.
A14

Fig. 29. PF400:15. Cracking pattern in Western tie beam after failure.
Fig. 30. PF400:15. Cracking after failure.
A15
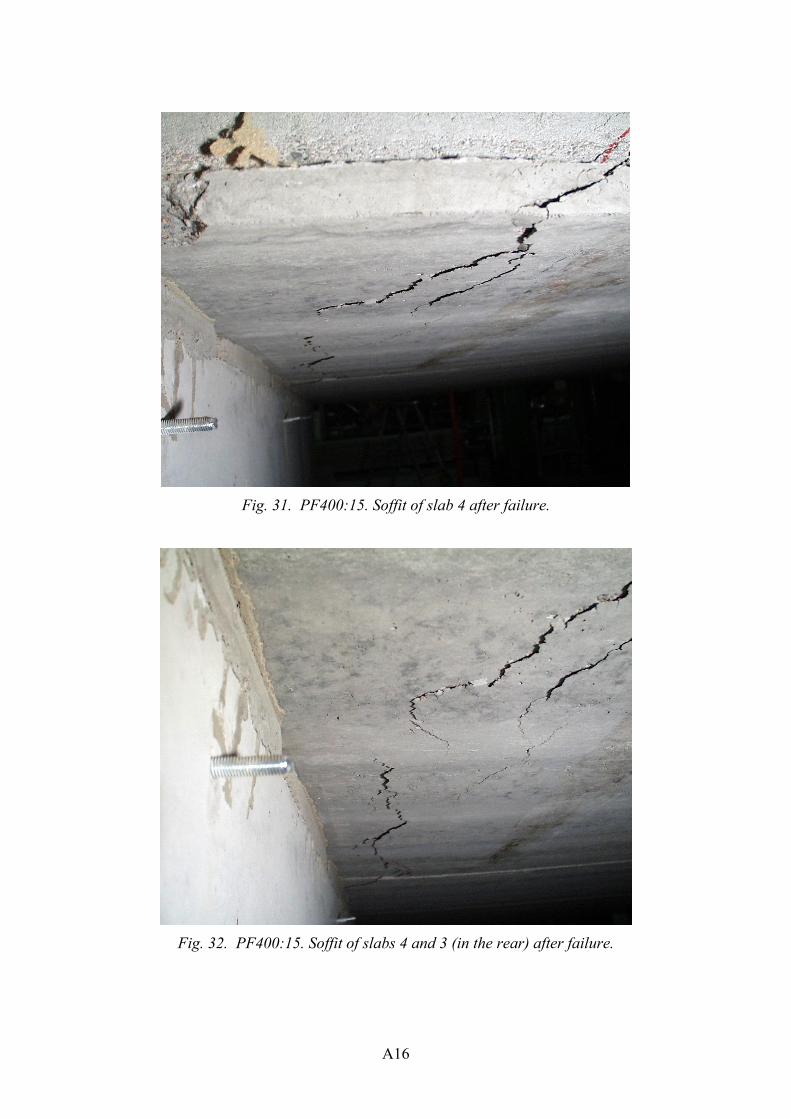
Fig. 31. PF400:15. Soffit of slab 4 after failure.
Fig. 32. PF400:15. Soffit of slabs 4 and 3 (in the rear) after failure.
A16

Fig. 33. PF400:15. Soffit of slabs 4 (on the left) and 3 after failure.
Fig. 34. PF400:15. Top surface after failure.
A17

Fig. 35. PF400:15. Top surface after failure.
Fig. 36. PF400:15. Detail of top surface after failure.
A18

Appendix B: Measured slab cross-sections End 1 of slabs 1�4, see Figs 1�4, was the loaded end in floor test. The underlined figures give the measured spillage of the strands.
END 2 / EDGE 1 END 2 / EDGE 2
1156 (1165 at middepth)
38 39 39 38
400 226 21953 58 55 58 49
38 38 37 39
402
45 295
1196
1,1 2,1
36 40 35
1152
220
317
225
318320 318
398
0,6
35
END 1 / EDGE 1 END 1 / EDGE 2
Slab 1Lower strands : 11 d 12.5, prestress = 1000 MPa Length : 7081 mm
Mass : 3600 kg
340
1,4
36
1,5 1,3
36 37
2,1
35
1,2 1,0
35 40
2,1
35
315 574 619 595 848 895 873
1,3
38 44 39 38
400 225 21855 60 57 58 48
37 37 38 40
402
45 295
1195
1,0 1,6
37 42 35
1153
217
318
224
315321 320
400
0,7
37
342
1,2
37
1,4 0,9
37 37
1,7
36
1,6 1,2
36 40
1,6
36
316 575 620 595 849 895 875
1,1
1154 (1163 at middepth)
Fig. 1. Slab 1.
B1

END 2 / EDGE 1 END 2 / EDGE 2
1155 (1161 at middepth)
38 42 39 39
401 225 21955 59 56 58 49
37 38 37 40
402
45 295
1195
1,5 2,2
37 41 36
1154
218
318
225
315320 320
400
1.2
36
END 1 / EDGE 1 END 1 / EDGE 2
Slab 2Lower strands : 11 d 12.5, prestress = 1000 MPa Length : 7068 mm
Mass : 3580 kg
341
1,4
36
2,0 1,7
37 37
2,7
37
1,6 1,4
35 39
1,5
35
316 575 620 596 849 896 875
1,3
37 40 39 39
400 225 21956 59 56 59 48
38 38 38 40
402
45 295
1195
1,0 1,3
38 42 37
1153
216
315
223
315321 316
398
0,9
38
341
1,2
38
1,5 1,4
38 39
2,1
38
1,6 1,2
37 41
1,8
37
316 574 620 596 849 896 873
1,2
1156 (1165 at middepth)
Fig. 2. Slab 2.
B2

END 2 / EDGE 1 END 2 / EDGE 2
1157 (1165 at middepth)
38 40 40 38
400 226 21748 60 55 58 55
39 37 36 38
400
43 300
1195
0,8 1,3
37 40 36
1151
222
313
227
317319 320
399
1.6
36
END 1 / EDGE 1 END 1 / EDGE 2
Slab 3Lower strands : 11 d 12.5, prestress = 1000 MPa Length : 7078 mm
Mass : 3590 kg
347
1,5
36
1,2 2,0
36 36
1,9
35
1,4 1,5
35 42
1,7
36
321 576 622 600 855 900 880
1,2
38 40 40 38
400 226 21748 60 55 58 55
40 37 37 38
400
44 300
1195
0,7 1,1
40 41 36
1151
222
313
227
317319 320
399
1,1
40
348
1,5
37
1,2 1,4
38 38
2,1
38
0,8 0,8
38 43
1,0
38
323 577 623 600 855 902 880
0,9
1156 (1165 at middepth)
Fig. 3. Slab 3.
B3

END 2 / EDGE 1 END 2 / EDGE 2
1156 (1163 at middepth)
39 40 40 39
403 227 21955 58 55 60 49
40 38 38 38
403
44 295
1196
1,5 1,2
38 42 38
1152
218
318
223
318320 320
399
0,7
38
END 1 / EDGE 1 END 1 / EDGE 2
Slab 4Lower strands : 11 d 12.5, prestress = 1000 MPa Length : 7084 mm
Mass : 3600 kg
340
0,9
38
1,6 1,5
38 40
1,6
38
1,4 1,0
38 40
1,5
37
311 573 619 595 848 894 873
0,8
35 38 39 40
401 225 21855 59 56 60 50
39 39 40 40
403
43 292
1196
1,1 1,4
37 40 35
1153
218
317
224
315320 318
400
0,9
37
339
1,1
37
1,6 1,3
37 38
1,5
36
1,4 1,4
35 40
2,2
35
313 573 618 595 849 896 873
1,1
1154 (1165 at middepth)
Fig. 4. Slab 4.
B4

Appendix C: Measured forces, strains and displacements
0
50
100
150
200
250
300
0 10 20 30 40 50 60Time [min]
Load
[kN
]
Fig. 1. PF400:1. Load-time relationship.
0
50
100
150
200
250
300
-0.020 -0.010 0.000 0.010
∆(Crack width) [mm]
Load
[kN
]
123456
Fig. 2. PF400:1. Change of crack width measured by transducers 1�6.
C1

0
50
100
150
200
250
300
-20 -10 0 10 20 30 40 50 60
Strain [10-6]
Load
[kN
]
78910
Fig. 3. PF400:1. Strain in tie reinforcement measured by transducers 7�9.
0
50
100
150
200
250
300
-0.1 0.0 0.1 0.2 0.3 0.4 0.5
Displacement [mm]
Load
[kN
]
1112131415
Fig. 4. PF400:1. Vertical displacement measured by transducers 11�15.
0
50
100
150
200
250
300
-0.2 0.0 0.2 0.4 0.6 0.8
Displacement [mm]
Load
[kN
]
1617181920
Fig. 5. PF400:1. Vertical displacement measured by transducers 16�20.
C2
0
50
100
150
200
250
300
-0.2 0.0 0.2 0.4 0.6 0.8 1.0 1.2
Displacement [mm]
Load
[kN
]
2122232425
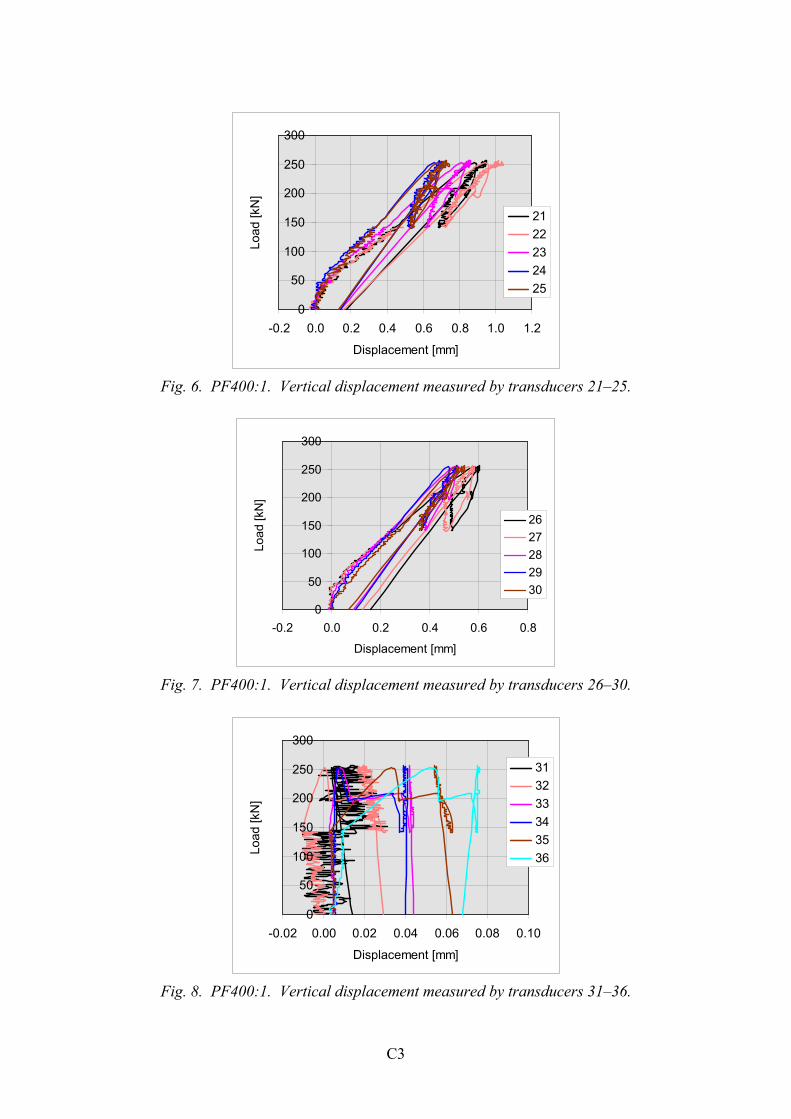
Fig. 6. PF400:1. Vertical displacement measured by transducers 21�25.
0
50
100
150
200
250
300
-0.2 0.0 0.2 0.4 0.6 0.8
Displacement [mm]
Load
[kN
]
2627282930
Fig. 7. PF400:1. Vertical displacement measured by transducers 26�30.
0
50
100
150
200
250
300
-0.02 0.00 0.02 0.04 0.06 0.08 0.10
Displacement [mm]
Load
[kN
]
313233343536
Fig. 8. PF400:1. Vertical displacement measured by transducers 31�36.
C3

0
50
100
150
200
250
300
-0.02 0.00 0.02 0.04 0.06 0.08 0.10
Displacement [mm]
Load
[kN
]
373839404142
Fig. 9. PF400:1. Vertical displacement measured by transducers 37�42.
0
50
100
150
200
250
300
-0.02 0.00 0.02 0.04
Displacement [mm]
Load
[kN
]
4344454647
Fig. 10. PF400:1. Vertical displacement measured by transducers 43�47.
0
50
100
150
200
250
0 10 20 30 40Time [min]
Load
[kN
]
Fig. 11. PF400:2. Load-time relationship.
C4

020406080
100120140160180200
-0.03 -0.02 -0.01 0.00 0.01
∆(Crack width) [mm]
Load
[kN
] 123456
Fig. 12. PF400:2. Change of crack width measured by transducers 1�6.
0
50
100
150
200
250
-10 0 10 20 30 40
Strain [10-6]
Load
[kN
]
78910
Fig. 13. PF400:2. Strain in tie reinforcement measured by transducers 7�9.
0
50
100
150
200
250
-0.1 0.0 0.1 0.2 0.3 0.4 0.5
Displacement [mm]
Load
[kN
]
1112131415
Fig. 14. PF400:2. Vertical displacement measured by transducers 11�15.
C5

0
50
100
150
200
250
-0.1 0.0 0.1 0.2 0.3 0.4 0.5 0.6 0.7
Displacement [mm]
Load
[kN
]
1617181920
Fig. 15. PF400:2. Vertical displacement measured by transducers 16�20.
0
50
100
150
200
250
-0.1 0.0 0.1 0.2 0.3 0.4 0.5 0.6
Displacement [mm]
Load
[kN
]
2122232425
Fig. 16. PF400:2. Vertical displacement measured by transducers 21�25.
0
50
100
150
200
250
-0.1 0.0 0.1 0.2 0.3
Displacement [mm]
Load
[kN
] 2627282930
Fig. 17. PF400:2. Vertical displacement measured by transducers 26�30.
C6

0
50
100
150
200
250
-0.02 0.00 0.02 0.04 0.06
Displacement [mm]
Load
[kN
]
313233343536
Fig. 18. PF400:2. Vertical displacement measured by transducers 31�36.
0
50
100
150
200
250
-0.02 0.00 0.02 0.04 0.06
Displacement [mm]
Load
[kN
] 373839404142
Fig. 19. PF400:2. Vertical displacement measured by transducers 37�42.
0
50
100
150
200
250
-0.02 0.00 0.02 0.04 0.06
Displacement [mm]
Load
[kN
] 4344454647
Fig. 20. PF400:2. Vertical displacement measured by transducers 43�47.
C7

020406080
100120140160
0 10 20 30 40Time [min]
Load
[kN
]
Fig. 21. PF400:3. Load-time relationship.
020406080
100120140160
-0.015 -0.010 -0.005 0.000 0.005
∆(Crack width) [mm]
Load
[kN
] 123456
Fig. 22. PF400:3. Change of crack width measured by transducers 1�6.
020406080
100120140160
-20 0 20 40 60 80 100 120
Strain [10-6]
Load
[kN
]
78910
Fig. 23. PF400:3. Strain in tie reinforcement measured by transducers 7�9.
C8
0
20
40
60
80
100
120
140
160
-0.1 0.0 0.1 0.2 0.3
Displacement [mm]
Load
[kN
]
1112131415
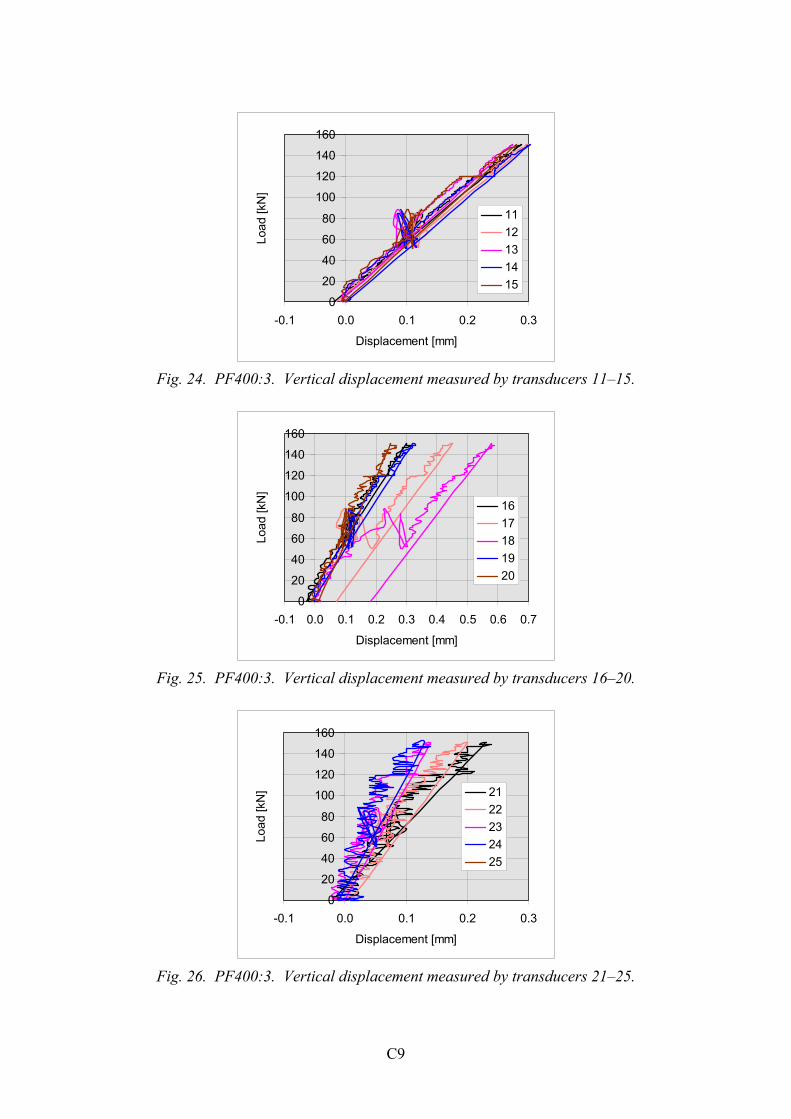
Fig. 24. PF400:3. Vertical displacement measured by transducers 11�15.
0
20
40
60
80
100
120
140
160
-0.1 0.0 0.1 0.2 0.3 0.4 0.5 0.6 0.7
Displacement [mm]
Load
[kN
]
1617181920
Fig. 25. PF400:3. Vertical displacement measured by transducers 16�20.
0
20
40
60
80
100
120
140
160
-0.1 0.0 0.1 0.2 0.3
Displacement [mm]
Load
[kN
] 2122232425
Fig. 26. PF400:3. Vertical displacement measured by transducers 21�25.
C9

C10
0
20
40
60
80
100
120
140
160
-0.1 0.0 0.1 0.2 0.3 0.4 0.5 0.6 0.7
Displacement [mm]
Load
[kN
] 2627282930
Fig. 27. PF400:3. Vertical displacement measured by transducers 26�30. Transducer 26 out of action.
0
20
40
60
80
100
120
140
160
-0.02 0.00 0.02 0.04 0.06
Displacement [mm]
Load
[kN
]
313233343536
Fig. 28. PF400:3. Vertical displacement measured by transducers 31�36.
0
20
40
60
80
100
120
140
160
-0.02 0.00 0.02 0.04 0.06
Displacement [mm]
Load
[kN
]
373839404142
Fig. 29. PF400:3. Vertical displacement measured by transducers 37�42.

0
20
40
60
80
100
120
140
160
-0.02 0.00 0.02 0.04 0.06
Displacement [mm]
Load
[kN
] 4344454647
Fig. 30. PF400:3. Vertical displacement measured by transducers 43�47.
020406080
100120140160
0 10 20Time [min]
Load
[kN
]
30
Fig. 31. PF400:4. Load-time relationship.
020406080
100120140160
-0.015 -0.010 -0.005 0.000 0.005
∆(Crack width) [mm]
Load
[kN
]
123456
Fig. 32. PF400:4. Change of crack width measured by transducers 1�6.
C11

020406080
100120140160
-4 -2 0 2 4 6 8 10 12
Strain [10-6]
Load
[kN
]
78910
Fig. 33. PF400:4. Strain in tie reinforcement measured by transducers 7�9.
0
20
40
60
80
100
120
140
160
-0.1 0.0 0.1 0.2 0.3 0.4 0.5
Displacement [mm]
Load
[kN
]
1112131415
Fig. 34. PF400:4. Vertical displacement measured by transducers 11�15.
0
20
40
60
80
100
120
140
160
-0.1 0.0 0.1 0.2 0.3 0.4 0.5
Displacement [mm]
Load
[kN
]
1617181920
Fig. 35. PF400:4. Vertical displacement measured by transducers 16�20.
C12
0
20
40
60
80
100
120
140
160
-0.05 0.00 0.05 0.10 0.15 0.20 0.25 0.30
Displacement [mm]
Load
[kN
]
2122232425
Fig. 36. PF400:4. Vertical displacement measured by transducers 21�25.
0
20
40
60
80
100
120
140
160
-0.05 0.00 0.05 0.10 0.15
Displacement [mm]
Load
[kN
]
2627282930
Fig. 37. PF400:4. Vertical displacement measured by transducers 26�30.
020406080
100120140160180
-0.02 0.00 0.02 0.04 0.06
Displacement [mm]
Load
[kN
]
313233343536
Fig. 38. PF400:4. Vertical displacement measured by transducers 31�36.
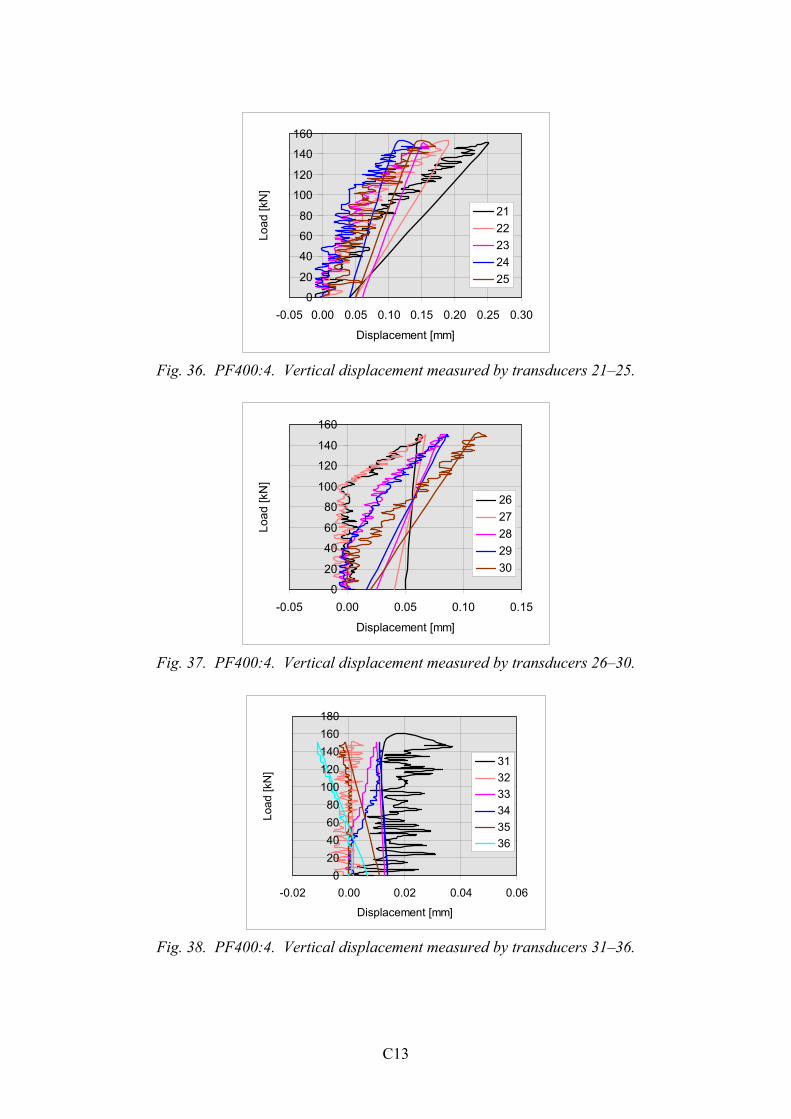
C13
020406080
100120140160180
-0.02 0.00 0.02 0.04 0.06
Displacement [mm]
Load
[kN
]
373839404142
Fig. 39. PF400:4. Vertical displacement measured by transducers 37�42.
020406080
100120140160180
-0.02 0.00 0.02 0.04 0.06
Displacement [mm]
Load
[kN
] 4344454647
Fig. 40. PF400:4. Vertical displacement measured by transducers 43�47.
0
20
40
60
80
100
120
0 10 20 3Time [min]
Load
[kN
]
0
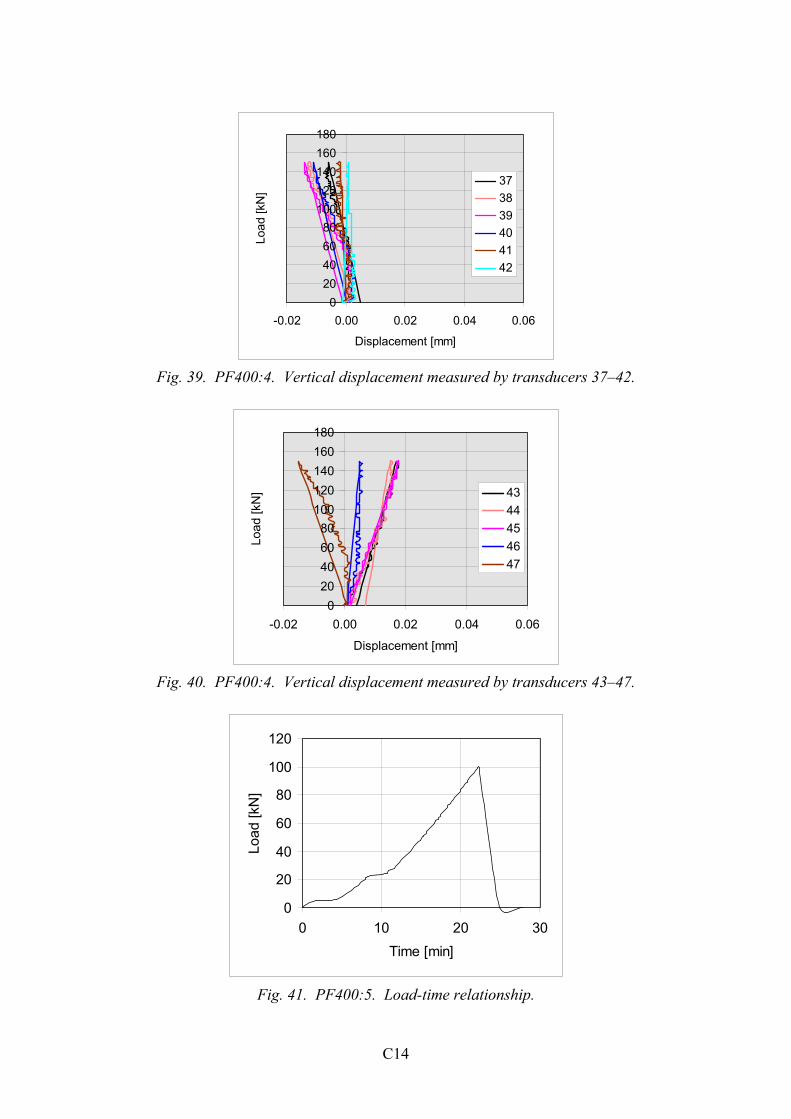
Fig. 41. PF400:5. Load-time relationship.
C14
0
20
40
60
80
100
120
-0.010 -0.005 0.000 0.005
∆(Crack width) [mm]
Load
[kN
]
123456
Fig. 42. PF400:5. Change of crack width measured by transducers 1�6.
0
20
40
60
80
100
120
-3 -2 -1 0 1 2 3 4 5 6
Strain [10-6]
Load
[kN
]
78910
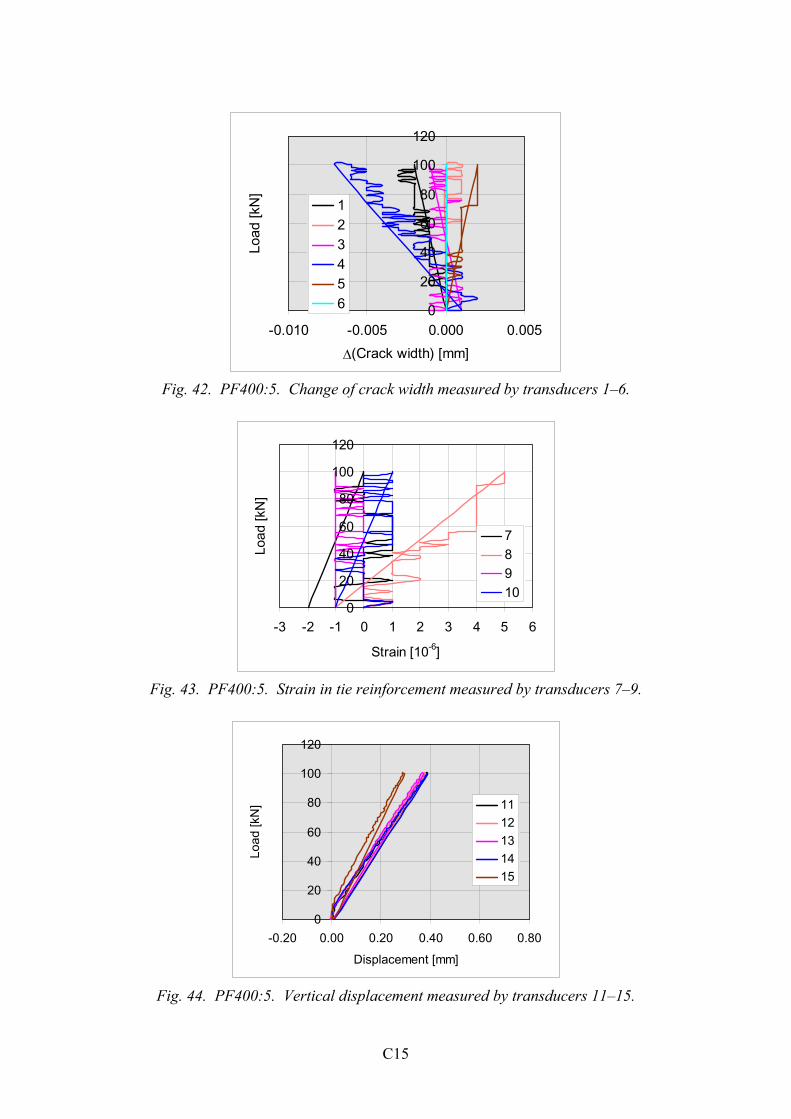
Fig. 43. PF400:5. Strain in tie reinforcement measured by transducers 7�9.
0
20
40
60
80
100
120
-0.20 0.00 0.20 0.40 0.60 0.80
Displacement [mm]
Load
[kN
] 1112131415
Fig. 44. PF400:5. Vertical displacement measured by transducers 11�15.
C15

0
20
40
60
80
100
120
-0.05 0.00 0.05 0.10 0.15 0.20 0.25 0.30
Displacement [mm]
Load
[kN
]
1617181920
Fig. 45. PF400:5. Vertical displacement measured by transducers 16�20.
0
20
40
60
80
100
120
-0.05 0.00 0.05 0.10
Displacement [mm]
Load
[kN
]
2122232425
Fig. 46. PF400:5. Vertical displacement measured by transducers 21�25.
0
20
40
60
80
100
120
-0.05 0.00 0.05 0.10
Displacement [mm]
Load
[kN
]
2627282930
Fig. 47. PF400:5. Vertical displacement measured by transducers 26�30.
C16

0
20
40
60
80
100
120
-0.02 0.00 0.02 0.04
Displacement [mm]
Load
[kN
] 313233343536
Fig. 48. PF400:5. Vertical displacement measured by transducers 31�36.
0
20
40
60
80
100
120
-0.02 0.00 0.02 0.04
Displacement [mm]
Load
[kN
]
373839404142
Fig. 49. PF400:5. Vertical displacement measured by transducers 37�42.
0
20
40
60
80
100
120
-0.02 0.00 0.02 0.04
Displacement [mm]
Load
[kN
] 4344454647
Fig. 50. PF400:5. Vertical displacement measured by transducers 43�47.
C17

0
20
40
60
80
100
120
0 10 20Time [min]
Load
[kN
]
30
Fig. 51. PF400:6. Load-time relationship.
0
20
40
60
80
100
120
-0.005 0.000 0.005
∆(Crack width) [mm]
Load
[kN
] 123456
Fig. 52. PF400:6. Change of crack width measured by transducers 1�6.
0
20
40
60
80
100
120
-4 -3 -2 -1 0 1 2 3 4 5
Strain [10-6]
Load
[kN
]
78910
Fig. 53. PF400:6. Strain in tie reinforcement measured by transducers 7�9.
C18

0
20
40
60
80
100
120
-0.1 0.0 0.1 0.2 0.3 0.4 0.5
Displacement [mm]
Load
[kN
]
1112131415
Fig. 54. PF400:6. Vertical displacement measured by transducers 11�15.
0
20
40
60
80
100
120
-0.05 0.00 0.05 0.10 0.15 0.20 0.25 0.30
Displacement [mm]
Load
[kN
]
1617181920
Fig. 55. PF400:6. Vertical displacement measured by transducers 16�20.
0
20
40
60
80
100
120
-0.05 0.00 0.05 0.10
Displacement [mm]
Load
[kN
]
2122232425
Fig. 56. PF400:6. Vertical displacement measured by transducers 21�25.
C19

0
20
40
60
80
100
120
-0.05 0.00 0.05 0.10
Displacement [mm]
Load
[kN
]
2627282930
Fig. 57. PF400:6. Vertical displacement measured by transducers 26�30.
0
20
40
60
80
100
120
-0.02 0.00 0.02 0.04 0.06
Displacement [mm]
Load
[kN
] 313233343536
Fig. 58. PF400:6. Vertical displacement measured by transducers 31�36.
0
20
40
60
80
100
120
-0.02 0.00 0.02 0.04 0.06
Displacement [mm]
Load
[kN
] 373839404142
Fig. 59. PF400:6. Vertical displacement measured by transducers 37�42.
C20

0
20
40
60
80
100
120
-0.02 0.00 0.02 0.04 0.06
Displacement [mm]
Load
[kN
]
4344454647
Fig. 60. PF400:6. Vertical displacement measured by transducers 43�47.
0
20
40
60
80
100
120
0 10 20 3Time [min]
Load
[kN
]
0
Fig. 61. PF400:7. Load-time relationship.
0
20
40
60
80
100
120
-0.005 0.000 0.005 0.010
∆(Crack width) [mm]
Load
[kN
] 123456
Fig. 62. PF400:7. Change of crack width measured by transducers 1�6.
C21

0
20
40
60
80
100
120
-5 -4 -3 -2 -1 0 1 2 3 4 5
Strain [10-6]
Load
[kN
]
78910
Fig. 63. PF400:7. Strain in tie reinforcement measured by transducers 7�9.
0
20
40
60
80
100
120
-0.1 0.0 0.1 0.2 0.3 0.4 0.5 0.6 0.7
Displacement [mm]
Load
[kN
]
1112131415
Fig. 64. PF400:7. Vertical displacement measured by transducers 11�15.
0
20
40
60
80
100
120
-0.05 0.00 0.05 0.10 0.15 0.20 0.25 0.30
Displacement [mm]
Load
[kN
]
1617181920
Fig. 65. PF400:7. Vertical displacement measured by transducers 16�20.
C22

0
20
40
60
80
100
120
-0.05 0.00 0.05 0.10
Displacement [mm]
Load
[kN
]
2122232425
Fig. 66. PF400:7. Vertical displacement measured by transducers 21�25.
0
20
40
60
80
100
120
-0.05 0.00 0.05 0.10
Displacement [mm]
Load
[kN
]
2627282930
Fig. 67. PF400:7. Vertical displacement measured by transducers 26�30.
0
20
40
60
80
100
120
-0.04 -0.02 0.00 0.02 0.04 0.06
Displacement [mm]
Load
[kN
]
313233343536
Fig. 68. PF400:7. Vertical displacement measured by transducers 31�36.
C23

0
20
40
60
80
100
120
-0.04 -0.02 0.00 0.02 0.04 0.06
Displacement [mm]
Load
[kN
]
373839404142
Fig. 69. PF400:7. Vertical displacement measured by transducers 37�42.
0
20
40
60
80
100
120
-0.04 -0.02 0.00 0.02 0.04 0.06
Displacement [mm]
Load
[kN
]
4344454647
Fig. 70. PF400:7. Vertical displacement measured by transducers 43�47.
020406080
100120140160
0 10 20 3Time [min]
Load
[kN
]
0
Fig. 71. PF400:8. Load-time relationship.
C24

020406080
100120140160
-0.015 -0.010 -0.005 0.000 0.005
∆(Crack width) [mm]
Load
[kN
]
123456
Fig. 72. PF400:8. Change of crack width measured by transducers 1�6.
020406080
100120140160180
-5 0 5 10 15 20
Strain [10-6]
Load
[kN
]
78910
Fig. 73. PF400:8. Strain in tie reinforcement measured by transducers 7�9.
0
20
40
60
80
100
120
140
160
-0.05 0.00 0.05 0.10 0.15 0.20
Displacement [mm]
Load
[kN
]
1112131415
Fig. 74. PF400:8. Vertical displacement measured by transducers 11�15.
C25

0
20
40
60
80
100
120
140
160
-0.1 0.0 0.1 0.2 0.3
Displacement [mm]
Load
[kN
]
1617181920
Fig. 75. PF400:8. Vertical displacement measured by transducers 16�20.
0
20
40
60
80
100
120
140
160
-0.1 0.0 0.1 0.2 0.3 0.4 0.5 0.6
Displacement [mm]
Load
[kN
]
2122232425
Fig. 76. PF400:8. Vertical displacement measured by transducers 21�25.
0
20
40
60
80
100
120
140
160
-0.1 0.0 0.1 0.2 0.3 0.4
Displacement [mm]
Load
[kN
]
2627282930
Fig. 77. PF400:8. Vertical displacement measured by transducers 26�30.
C26

0
20
40
60
80
100
120
140
160
-0.02 0.00 0.02 0.04
Displacement [mm]
Load
[kN
] 313233343536
Fig. 78. PF400:8. Vertical displacement measured by transducers 31�36.
0
20
40
60
80
100
120
140
160
-0.02 0.00 0.02 0.04
Displacement [mm]
Load
[kN
]
373839404142
Fig. 79. PF400:8. Vertical displacement measured by transducers 37�42.
0
20
40
60
80
100
120
140
160
-0.02 0.00 0.02 0.04
Displacement [mm]
Load
[kN
]
4344454647
Fig. 80. PF400:8. Vertical displacement measured by transducers 43�47.
C27

020406080
100120140160
0 10 20 3Time [min]
Load
[kN
]
0
Fig. 81. PF400:9. Load-time relationship.
020406080
100120140160
-0.015 -0.010 -0.005 0.000 0.005
∆(Crack width) [mm]
Load
[kN
]
123456
Fig. 82. PF400:9. Change of crack width measured by transducers 1�6.
020406080
100120140160180
-5 0 5 10 15 20
Strain [10-6]
Load
[kN
]
78910
Fig. 83. PF400:9. Strain in tie reinforcement measured by transducers 7�9.
C28

0
20
40
60
80
100
120
140
160
-0.05 0.00 0.05 0.10 0.15
Displacement [mm]
Load
[kN
]
1112131415
Fig. 84. PF400:9. Vertical displacement measured by transducers 11�15.
0
20
40
60
80
100
120
140
160
-0.05 0.00 0.05 0.10 0.15 0.20 0.25
Displacement [mm]
Load
[kN
]
1617181920
Fig. 85. PF400:9. Vertical displacement measured by transducers 16�20.
0
20
40
60
80
100
120
140
160
-0.1 0.0 0.1 0.2 0.3 0.4 0.5 0.6
Displacement [mm]
Load
[kN
]
2122232425
Fig. 86. PF400:9. Vertical displacement measured by transducers 21�25.
C29

0
20
40
60
80
100
120
140
160
-0.1 0.0 0.1 0.2 0.3 0.4 0.5
Displacement [mm]
Load
[kN
]
2627282930
Fig. 87. PF400:9. Vertical displacement measured by transducers 26�30.
0
20
40
60
80
100
120
140
160
-0.02 0.00 0.02 0.04
Displacement [mm]
Load
[kN
] 313233343536
Fig. 88. PF400:9. Vertical displacement measured by transducers 31�36.
0
20
40
60
80
100
120
140
160
-0.02 0.00 0.02 0.04
Displacement [mm]
Load
[kN
]
373839404142
Fig. 89. PF400:9. Vertical displacement measured by transducers 37�42.
C30

0
20
40
60
80
100
120
140
160
-0.02 0.00 0.02 0.04
Displacement [mm]
Load
[kN
]
4344454647
Fig. 90. PF400:9. Vertical displacement measured by transducers 43�47.
0
20
40
60
80
100
120
0 10 20 3
Time [min]
Load
[kN
]
0
Fig. 91. PF400:10. Load-time relationship.
0
20
40
60
80
100
120
-0.005 0.000 0.005∆(Crack width) [mm]
Load
[kN
] 123456
Fig. 92. PF400:10. Change of crack width measured by transducers 1�6.
C31

0
20
40
60
80
100
120
-20 0 20 40 60 80
Strain [10-6]
Load
[kN
]
78910
Fig. 93. PF400:10. Strain in tie reinforcement measured by transducers 7�9.
0
20
40
60
80
100
120
-0.10 -0.05 0.00 0.05 0.10
Displacement [mm]
Load
[kN
]
1112131415
Fig. 94. PF400:10. Vertical displacement measured by transducers 11�15.
0
20
40
60
80
100
120
-0.10 -0.05 0.00 0.05 0.10
Displacement [mm]
Load
[kN
] 1617181920
Fig. 95. PF400:10. Vertical displacement measured by transducers 16�20.
C32

0
20
40
60
80
100
120
-0.1 0.0 0.1 0.2 0.3 0.4 0.5
Displacement [mm]
Load
[kN
]
2122232425
Fig. 96. PF400:10. Vertical displacement measured by transducers 21�25.
0
20
40
60
80
100
120
-0.1 0.0 0.1 0.2 0.3 0.4 0.5
Displacement [mm]
Load
[kN
]
2627282930
Fig. 97. PF400:10. Vertical displacement measured by transducers 26�30.
0
20
40
60
80
100
120
-0.04 -0.02 0.00 0.02 0.04 0.06
Displacement [mm]
Load
[kN
]
313233343536
Fig. 98. PF400:10. Vertical displacement measured by transducers 31�36.
C33

0
20
40
60
80
100
120
-0.04 -0.02 0.00 0.02 0.04 0.06
Displacement [mm]
Load
[kN
] 373839404142
Fig. 99. PF400:10. Vertical displacement measured by transducers 37�42.
0
20
40
60
80
100
120
-0.04 -0.02 0.00 0.02 0.04 0.06
Displacement [mm]
Load
[kN
] 4344454647
Fig. 100. PF400:10. Vertical displacement measured by transducers 43�47.
0
20
40
60
80
100
120
0 10 20 3
Time [min]
Load
[kN
]
0
Fig. 101. PF400:11. Load-time relationship.
C34

0
20
40
60
80
100
120
-0.005 0.000 0.005 0.010∆(Crack width) [mm]
Load
[kN
] 123456
Fig. 102. PF400:11. Change of crack width measured by transducers 1�6.
0
20
40
60
80
100
120
-60 -40 -20 0 20 40 60 80
Strain [10-6]
Load
[kN
]
78910
Fig. 103. PF400:11. Strain in tie reinforcement measured by transducers 7�9.
0
20
40
60
80
100
120
-0.10 -0.05 0.00 0.05 0.10
Displacement [mm]
Load
[kN
] 1112131415
Fig. 104. PF400:11. Vertical displacement measured by transducers 11�15.
C35

0
20
40
60
80
100
120
-0.10 -0.05 0.00 0.05 0.10
Displacement [mm]
Load
[kN
] 1617181920
Fig. 105. PF400:11. Vertical displacement measured by transducers 16�20.
0
20
40
60
80
100
120
-0.1 0.0 0.1 0.2 0.3
Displacement [mm]
Load
[kN
] 2122232425
Fig. 106. PF400:11. Vertical displacement measured by transducers 21�25.
0
20
40
60
80
100
120
-0.2 0.0 0.2 0.4 0.6
Displacement [mm]
Load
[kN
]
2627282930
Fig. 107. PF400:11. Vertical displacement measured by transducers 26�30.
C36

0
20
40
60
80
100
120
-0.04 -0.02 0.00 0.02
Displacement [mm]
Load
[kN
] 313233343536
Fig. 108. PF400:11. Vertical displacement measured by transducers 31�36.
0
20
40
60
80
100
120
-0.04
-0.02
0.00 0.02 0.04 0.06 0.08 0.10
Displacement [mm]
Load
[kN
]
373839404142
Fig. 109. PF400:11. Vertical displacement measured by transducers 37�42.
0
20
40
60
80
100
120
-0.04 -0.02 0.00 0.02
Displacement [mm]
Load
[kN
] 4344454647
Fig. 110. PF400:11. Vertical displacement measured by transducers 43�47.
C37

0
20
40
60
80
100
120
0 10 20 3
Time [min]
Load
[kN
]
0
Fig. 111. PF400:12. Load-time relationship.
0
20
40
60
80
100
120
-0.005 0.000 0.005 0.010 0.015
∆(Crack width) [mm]
Load
[kN
]
123456
Fig. 112. PF400:12. Change of crack width measured by transducers 1�6.
0
20
40
60
80
100
120
-60 -50 -40 -30 -20 -10 0 10
Strain [10-6]
Load
[kN
]
78910
Fig. 113. PF400:12. Strain in tie reinforcement measured by transducers 7�9.
C38
0
20
40
60
80
100
120
-0.10 -0.05 0.00 0.05 0.10
Displacement [mm]
Load
[kN
]
1112131415
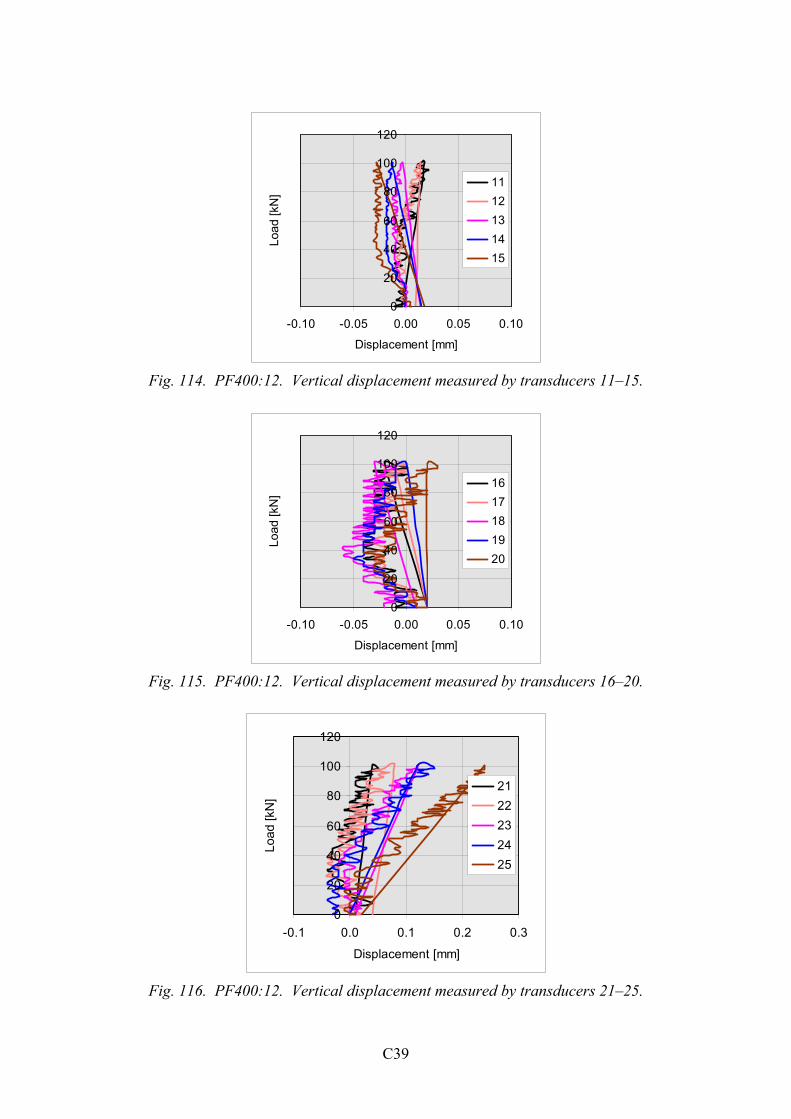
Fig. 114. PF400:12. Vertical displacement measured by transducers 11�15.
0
20
40
60
80
100
120
-0.10 -0.05 0.00 0.05 0.10
Displacement [mm]
Load
[kN
]
1617181920
Fig. 115. PF400:12. Vertical displacement measured by transducers 16�20.
0
20
40
60
80
100
120
-0.1 0.0 0.1 0.2 0.3
Displacement [mm]
Load
[kN
]
2122232425
Fig. 116. PF400:12. Vertical displacement measured by transducers 21�25.
C39

0
20
40
60
80
100
120
-0.2 0.0 0.2 0.4 0.6 0.8
Displacement [mm]
Load
[kN
]
2627282930
Fig. 117. PF400:12. Vertical displacement measured by transducers 26�30.
0
20
40
60
80
100
120
-0.05 0.00 0.05 0.10 0.15
Displacement [mm]
Load
[kN
]
313233343536
Fig. 118. PF400:12. Vertical displacement measured by transducers 31�36.
0
20
40
60
80
100
120
-0.05 0.00 0.05 0.10 0.15
Displacement [mm]
Load
[kN
]
373839404142
Fig. 119. PF400:12. Vertical displacement measured by transducers 37�42.
C40

0
20
40
60
80
100
120
-0.05 0.00 0.05 0.10 0.15
Displacement [mm]
Load
[kN
] 4344454647
Fig. 120. PF400:12. Vertical displacement measured by transducers 43�47.
0
50
100
150
200
250
300
350
0 20 40 60 80 100 120Time [min]
Load
[kN
]
Fig. 121. PF400:13. Load-time relationship.
0
50
100
150
200
250
300
350
-0.15 -0.10 -0.05 0.00 0.05∆(Crack width) [mm]
Load
[kN
] 123456
Fig. 122. PF400:13. Change of crack width measured by transducers 1�6.
C41

0
50
100
150
200
250
300
350
-200 -150 -100 -50 0 50 100
Strain [10-6]
Load
[kN
]
78910
Fig. 123. PF400:13. Strain in tie reinforcement measured by transducers 7�9.
0
50
100
150
200
250
300
350
-0.2 0.0 0.2 0.4 0.6 0.8
Displacement [mm]
Load
[kN
]
1112131415
Fig. 124. PF400:13. Vertical displacement measured by transducers 11�15.
0
50
100
150
200
250
300
350
-0.2 0.0 0.2 0.4 0.6 0.8 1.0 1.2
Displacement [mm]
Load
[kN
]
1617181920
Fig. 125. PF400:13. Vertical displacement measured by transducers 16�20.
C42
0
50
100
150
200
250
300
350
-0.5 0.0 0.5 1.0 1.5 2.0 2.5 3.0 3.5 4.0
Displacement [mm]
Load
[kN
]
2122232425
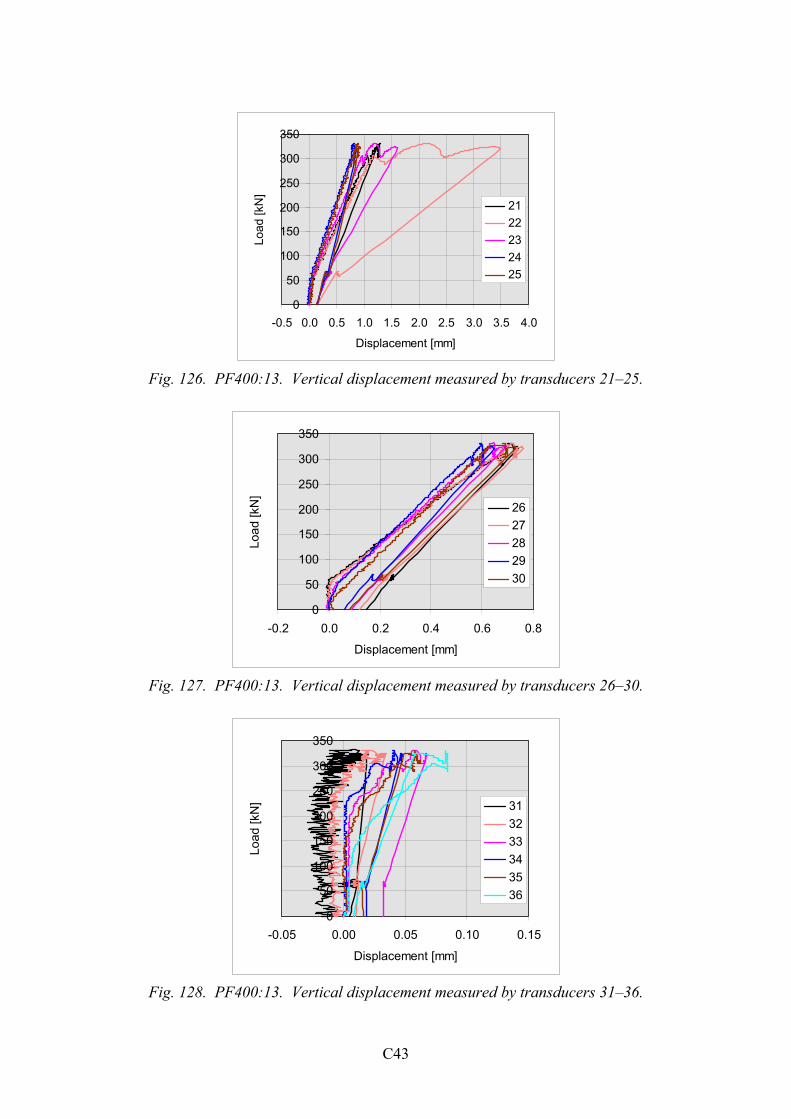
Fig. 126. PF400:13. Vertical displacement measured by transducers 21�25.
0
50
100
150
200
250
300
350
-0.2 0.0 0.2 0.4 0.6 0.8
Displacement [mm]
Load
[kN
]
2627282930
Fig. 127. PF400:13. Vertical displacement measured by transducers 26�30.
0
50
100
150
200
250
300
350
-0.05 0.00 0.05 0.10 0.15
Displacement [mm]
Load
[kN
] 313233343536
Fig. 128. PF400:13. Vertical displacement measured by transducers 31�36.
C43

0
50
100
150
200
250
300
350
-0.05 0.00 0.05 0.10 0.15
Displacement [mm]
Load
[kN
]
373839404142
Fig. 129. PF400:13. Vertical displacement measured by transducers 37�42.
0
50
100
150
200
250
300
350
-0.05 0.00 0.05 0.10 0.15
Displacement [mm]
Load
[kN
] 4344454647
Fig. 130. PF400:13. Vertical displacement measured by transducers 43�47.
0
100
200
300
400
500
600
0 10 20 30 40 50 60 70 80 90Time [min]
Load
[kN
]
Fig. 131. PF400:14. Load-time relationship.
C44

0
100
200
300
400
500
600
-0.20 -0.15 -0.10 -0.05 0.00 0.05∆(Crack width) [mm]
Load
[kN
]
123456
Fig. 132. PF400:14. Change of crack width measured by transducers 1�6.
0
100
200
300
400
500
600
-10 0 10 20 30
Strain [10-6]
Load
[kN
]
8910
Fig. 133. PF400:14. Strain in tie reinforcement measured by transducers 8�9. (No. 7 out of action).
0
100
200
300
400
500
600
-1 0 1 2 3 4 5 6
Displacement [mm]
Load
[kN
]
1112131415
Fig. 134. PF400:14. Vertical displacement measured by transducers 11�15.
C45

0
100
200
300
400
500
600
-1 0 1 2 3 4 5 6
Displacement [mm]
Load
[kN
]
1617181920
Fig. 135. PF400:14. Vertical displacement measured by transducers 16�20.
0
100
200
300
400
500
600
-0.5 0.0 0.5 1.0 1.5 2.0
Displacement [mm]
Load
[kN
]
2122232425
Fig. 136. PF400:14. Vertical displacement measured by transducers 21�25.
0
100
200
300
400
500
600
-0.2 0.0 0.2 0.4 0.6 0.8
Displacement [mm]
Load
[kN
]
2627282930
Fig. 137. PF400:14. Vertical displacement measured by transducers 26�30.
C46

0
100
200
300
400
500
600
-0.10 0.00 0.10 0.20 0.30
Displacement [mm]
Load
[kN
] 313233343536
Fig. 138. PF400:14. Vertical displacement measured by transducers 31�36.
0
100
200
300
400
500
600
-0.20 -0.10 0.00 0.10 0.20Displacement [mm]
Load
[kN
] 373839404142
Fig. 139. PF400:14. Vertical displacement measured by transducers 37�42.
0
100
200
300
400
500
600
-0.20 -0.10 0.00 0.10 0.20
Displacement [mm]
Load
[kN
] 4344454647
Fig. 140. PF400:14. Vertical displacement measured by transducers 43�47.
C47

0
100
200
300
400
500
600
0 10 20 30 40 50 60 70 80 90Time [min]
Load
[kN
]
Fig. 141. PF400:15. Load-time relationship.
0
100
200
300
400
500
600
-0.10 -0.05 0.00 0.05 0.10∆(Crack width) [mm]
Load
[kN
] 123456
Fig. 142. PF400:15. Change of crack width measured by transducers 1�6.
0
100
200
300
400
500
600
-200 0 200 400 600
Strain [10-6]
Load
[kN
]
8910
Fig. 143. PF400:15. Strain in tie reinforcement measured by transducers 8�9. (No. 7 out of action).
C48

0
100
200
300
400
500
600
-0.2 0.0 0.2 0.4 0.6 0.8
Displacement [mm]
Load
[kN
]
1112131415
Fig. 144. PF400:15. Vertical displacement measured by transducers 11�15.
0
100
200
300
400
500
600
-0.2 0.0 0.2 0.4 0.6 0.8 1.0 1.2
Displacement [mm]
Load
[kN
]
1617181920
Fig. 145. PF400:15. Vertical displacement measured by transducers 16�20.
0
100
200
300
400
500
600
-1 0 1 2 3 4 5 6
Displacement [mm]
Load
[kN
]
2122232425
Fig. 146. PF400:15. Vertical displacement measured by transducers 21�25.
C49

0
100
200
300
400
500
600
-1 0 1 2 3 4 5 6 7 8
Displacement [mm]
Load
[kN
]
2627282930
Fig. 147. PF400:15. Vertical displacement measured by transducers 26�30.
0
100
200
300
400
500
600
-0.20 -0.10 0.00 0.10 0.20
Displacement [mm]
Load
[kN
] 313233343536
Fig. 148. PF400:15. Vertical displacement measured by transducers 31�36.
0
100
200
300
400
500
600
-0.10 0.00 0.10 0.20 0.30
Displacement [mm]
Load
[kN
]
373839404142
Fig. 149. PF400:15. Vertical displacement measured by transducers 37�42.
C50

0
100
200
300
400
500
600
-0.30 -0.20 -0.10 0.00 0.10
Displacement [mm]
Load
[kN
]4344454647
Fig. 150. PF400:15. Vertical displacement measured by transducers 43�47.
C51


Appendix D: Initial part of load-deflection curves
0
20
40
60
80
100
-0.1 0.0 0.1 0.2
Displacement [mm]
Load
[kN
]
1112131415
Fig. 1. PF400:1. Vertical displacement measured by transducers 11�15.
0
20
40
60
80
100
-0.1 0.0 0.1 0.2 0.3
Displacement [mm]
Load
[kN
]
1617181920
Fig. 2. PF400:1. Vertical displacement measured by transducers 16�20.
D1

0
20
40
60
80
100
-0.2 0.0 0.2 0.4
Displacement [mm]
Load
[kN
]
2122232425
Fig. 3. PF400:1. Vertical displacement measured by transducers 21�25.
0
20
40
60
80
100
-0.1 0.0 0.1 0.2
Displacement [mm]
Load
[kN
]
2627282930
Fig. 4. PF400:1. Vertical displacement measured by transducers 26�30.
0
20
40
60
80
100
-0.1 0.0 0.1 0.2 0.3
Displacement [mm]
Load
[kN
]
1112131415
Fig. 5. PF400:4. Vertical displacement measured by transducers 11�15.
D2

0
20
40
60
80
100
-0.1 0.0 0.1 0.2 0.3
Displacement [mm]
Load
[kN
]
1617181920
Fig. 6. PF400:4. Vertical displacement measured by transducers 16�20.
0
20
40
60
80
100
-0.05 0.00 0.05 0.10 0.15
Displacement [mm]
Load
[kN
]
2122232425
Fig. 7. PF400:4. Vertical displacement measured by transducers 21�25.
0
20
40
60
80
100
-0.05 0.00 0.05 0.10
Displacement [mm]
Load
[kN
]
2627282930
Fig. 8. PF400:4. Vertical displacement measured by transducers 26�30.
D3

0
20
40
60
80
100
120
-0.10 -0.05 0.00 0.05 0.10
Displacement [mm]
Load
[kN
]
1112131415
Fig. 9. PF400:10. Vertical displacement measured by transducers 11�15.
0
20
40
60
80
100
120
-0.10 -0.05 0.00 0.05 0.10
Displacement [mm]
Load
[kN
] 1617181920
Fig. 10. PF400:10. Vertical displacement measured by transducers 16�20.
0
20
40
60
80
100
120
-0.1 0.0 0.1 0.2 0.3 0.4 0.5
Displacement [mm]
Load
[kN
]
2122232425
Fig. 11. PF400:10. Vertical displacement measured by transducers 21�25.
D4

0
20
40
60
80
100
120
-0.1 0.0 0.1 0.2 0.3 0.4 0.5
Displacement [mm]
Load
[kN
]
2627282930
Fig. 12. PF400:10. Vertical displacement measured by transducers 26�30.
0
50
100
150
200
-0.2 0.0 0.2 0.4
Displacement [mm]
Load
[kN
]
1112131415
Fig. 13. PF400:13. Vertical displacement measured by transducers 11�15.
0
50
100
150
200
-0.2 0.0 0.2 0.4 0.6
Displacement [mm]
Load
[kN
]
1617181920
Fig. 14. PF400:13. Vertical displacement measured by transducers 16�20.
D5

0
50
100
150
200
-0.5 0.0 0.5 1.0
Displacement [mm]
Load
[kN
]
2122232425
Fig. 15. PF400:13. Vertical displacement measured by transducers 21�25.
0
50
100
150
200
-0.2 0.0 0.2 0.4
Displacement [mm]
Load
[kN
]
2627282930
Fig. 16. PF400:13. Vertical displacement measured by transducers 26�30.
0
50
100
150
200
250
300
-0.2 0.0 0.2 0.4 0.6 0.8 1.0 1.2
Displacement [mm]
Load
[kN
]
1112131415
Fig. 17. PF400:14. Vertical displacement measured by transducers 11�15.
D6

0
50
100
150
200
250
300
-0.5 0.0 0.5 1.0 1.5
Displacement [mm]
Load
[kN
]
1617181920
Fig. 18. PF400:14. Vertical displacement measured by transducers 16�20.
0
50
100
150
200
250
300
-0.5 0.0 0.5 1.0
Displacement [mm]
Load
[kN
]
2122232425
Fig. 19. PF400:14. Vertical displacement measured by transducers 21�25.
0
50
100
150
200
250
300
-0.2 0.0 0.2 0.4
Displacement [mm]
Load
[kN
]
2627282930
Fig. 20. PF400:14. Vertical displacement measured by transducers 26�30.
D7

0
50
100
150
200
250
300
-0.2 0.0 0.2 0.4
Displacement [mm]
Load
[kN
]
1112131415
Fig. 21. PF400:15. Vertical displacement measured by transducers 11�15.
0
50
100
150
200
250
300
-0.2 0.0 0.2 0.4 0.6
Displacement [mm]
Load
[kN
]
1617181920
Fig. 22. PF400:15. Vertical displacement measured by transducers 16�20.
0
50
100
150
200
250
300
-0.5 0.0 0.5 1.0 1.5
Displacement [mm]
Load
[kN
]
2122232425
Fig. 23. PF400:15. Vertical displacement measured by transducers 21�25.
D8

0
50
100
150
200
250
300
-1 0 1 2
Displacement [mm]
Load
[kN
]
2627282930
Fig. 24. PF400:15. Vertical displacement measured by transducers 26�30.
D9


Published by
Series title, number and report code of publication
VTT Research Notes 2274VTT�TIED�2274
Author(s) Pajari, Matti Title Shear-torsion tests on 400 mm hollow core floor Abstract Fifteen load tests on a floor comprising four prestressed hollow core slabs were carried out to clarify the interaction of shear and torsion. The slabs were 400 mm in depth, 1.2 m in width and 7 m in length. The ends of the slabs were simply supported on concrete beams. The loads in each test comprised one or two concentrated loads close to the support.
In twelve tests the loads were limited to a typical service load. In these tests the behaviour of the floor was relatively linear and no sign of failure could be observed. In three tests the floor failed locally. The observed failure loads were 25�97% higher than in a reference test on a single slab unit with identical support conditions. In the first failure test with one point load the failure mode was punching. In other two tests with two point loads, as well as in the reference test with one point load, the failure was a typical shear-torsion failure.
As a subtask of HOLCOTORS project, the test results have been used by Chalmers University of Technology for calibration of computerized calculation methods they have developed. This work is published elsewhere. Therefore, the present design practice has not been evaluated here in view of the obtained results.
Keywords shear tests, torsion tests, hollow core slabs, floors, testing, test specimens, load testing, failure loads, load distribution, concrete, precast, prestressed, structure
Activity unit VTT Building and Transport, Kemistintie 3, P.O.Box 1805, FIN�02044 VTT, Finland
ISBN Project number 951�38�6518�5 (URL: http://www.vtt.fi/inf/pdf/) R2SU00137
Date Language Pages Price December 2005 English 30 p. + app. 82 p. -
Name of project Commissioned by Holcotors EU, Concrete industry, VTT
Series title and ISSN Published by VTT Tiedotteita � Research Notes 1455�0865 (URL: http://www.vtt.fi/inf/pdf/)
VTT Information Service P.O.Box 2000, FIN�02044 VTT, Finland Phone internat. +358 9 456 4404 Fax +358 9 456 4374
VTT RESEA
RCH N
OTES 2274Shear-torsion tests on 400 m
m hollow
core floor
ISBN 951–38–6518–5 (URL: http://www.vtt.fi/inf/pdf/)ISSN 1455–0865 (URL: http://www.vtt.fi/inf/pdf/)
ESPOO 2004 VTT RESEARCH NOTES 2274
Fifteen load tests on a floor comprising four prestressed hollow core slabswere carried out to clarify the interaction of shear and torsion. The slabswere 400 mm in depth and 7 m in length. The ends of the slabs were simplysupported on concrete beams. The loads in each test comprised one or twoconcentrated loads close to the support.
In twelve tests the loads were limited to a typical service load. Inthese tests the behaviour of the floor was relatively linear. In three teststhe floor was loaded to failure. The observed failure loads were 25–97%higher than in a reference test on a single slab unit. In the first failuretest with one point load, the failure mode was punching. In other twotests with two point loads, as well as in the reference test with one pointload, the failure was a typical shear – torsion failure.
Matti Pajari
Shear-torsion tests on 400 mmhollow core floor
1211
12
3 45
67
89
10
VTT TIETOPALVELU VTT INFORMATIONSTJÄNST VTT INFORMATION SERVICEPL 2000 PB 2000 P.O.Box 2000
02044 VTT 02044 VTT FIN–02044 VTT, FinlandPuh. 020 722 4404 Tel. 020 722 4404 Phone internat. + 358 20 722 4404Faksi 020 722 4374 Fax 020 722 4374 Fax + 358 20 722 4374


