Shear thinning in non-Brownian suspensions explained by ...
30
HAL Id: hal-01765759 https://hal.archives-ouvertes.fr/hal-01765759v2 Preprint submitted on 1 Jan 2019 HAL is a multi-disciplinary open access archive for the deposit and dissemination of sci- entific research documents, whether they are pub- lished or not. The documents may come from teaching and research institutions in France or abroad, or from public or private research centers. L’archive ouverte pluridisciplinaire HAL, est destinée au dépôt et à la diffusion de documents scientifiques de niveau recherche, publiés ou non, émanant des établissements d’enseignement et de recherche français ou étrangers, des laboratoires publics ou privés. Shear thinning in non-Brownian suspensions explained by variable friction between particles Laurent Lobry, Elisabeth Lemaire, Frédéric Blanc, Stany Gallier, François Peters To cite this version: Laurent Lobry, Elisabeth Lemaire, Frédéric Blanc, Stany Gallier, François Peters. Shear thinning in non-Brownian suspensions explained by variable friction between particles. 2019. hal-01765759v2
Transcript of Shear thinning in non-Brownian suspensions explained by ...
HAL Id: hal-01765759https://hal.archives-ouvertes.fr/hal-01765759v2
Preprint submitted on 1 Jan 2019
HAL is a multi-disciplinary open accessarchive for the deposit and dissemination of sci-entific research documents, whether they are pub-lished or not. The documents may come fromteaching and research institutions in France orabroad, or from public or private research centers.
L’archive ouverte pluridisciplinaire HAL, estdestinée au dépôt et à la diffusion de documentsscientifiques de niveau recherche, publiés ou non,émanant des établissements d’enseignement et derecherche français ou étrangers, des laboratoirespublics ou privés.
Shear thinning in non-Brownian suspensions explainedby variable friction between particles
Laurent Lobry, Elisabeth Lemaire, Frédéric Blanc, Stany Gallier, FrançoisPeters
To cite this version:Laurent Lobry, Elisabeth Lemaire, Frédéric Blanc, Stany Gallier, François Peters. Shear thinning innon-Brownian suspensions explained by variable friction between particles. 2019. hal-01765759v2

This draft was prepared using the LaTeX style file belonging to the Journal of Fluid Mechanics 1
Shear thinning in non-Brownian suspensionsexplained by variable friction between
particles
Laurent Lobry1, Elisabeth Lemaire1, Frederic Blanc1, Stany Gallier2
and Francois Peters1†1Institut de Physique de Nice, CNRS UCA, Parc Valrose, 06108 Nice cedex 2 France
2ArianeGroup, Le Bouchet Research Center, 91710 Vert le Petit, France
(Received xx; revised xx; accepted xx)
We propose to explain shear thinning behaviour observed in most concentrated non-Brownian suspensions by variable friction between particles. Considering the low mag-nitude of the forces experienced by the particles of suspensions under shear flow, it isfirst argued that rough particles come into solid contact through one or a few asperities.In such a few-asperity elastic-plastic contact, the friction coefficient is expected not tobe constant but to decrease with increasing normal load. Simulations based on theForce Coupling Method and including such a load-dependent friction coefficient areperformed for various particle volume fractions. The results of the numerical simulationsare compared to viscosity measurements carried out on suspensions of polystyreneparticles (40 µm in diameter) dispersed in a Newtonian silicon oil. The agreement is shownto be satisfactory. Furthermore, the comparison between the simulations conducted eitherwith a constant or a load-dependent friction coefficient provides a model for the shear-thinning viscosity. In this model the effective friction coefficient µeff is specified by theeffective normal contact force which is simply proportional to the bulk shear stress. Asthe shear stress increases, µeff decreases and the jamming volume fraction increases,leading to the reduction of the viscosity. At last, using this model, we show that it ispossible to evaluate the microscopic friction coefficient for each applied shear stress fromthe rheometric measurements.
Key words:
1. Introduction
Suspensions of rigid particles in low Reynolds number flows are ubiquitous in industry(food transport, cosmetic products, civil engineering, etc.) or natural flows (such asmud or lava flows) to mention but a few. This wide occurrence of suspensions hasfostered significant research in the past years that has revealed a great complexity inthe behaviour of these systems. Concentrated suspensions may present shear-thinning orshear-thickening behaviours, anisotropic normal stresses, irreversibility under oscillatingshear and many other complex behaviours. Some of these features come from thepossible complexity of the suspensions themselves. For instance, the suspending liquidmay be non-Newtonian, particles may have irregular shape, be elongated or faceted,
† Email address for correspondence: [email protected]
2 L. Lobry, E. Lemaire, F. Blanc, S. Gallier and F. Peters
be deformable or polydisperse, they may interact through colloidal forces, Brownian orbuoyancy forces may exist... But, it is quite fascinating that even very simple ”model”suspensions made of non-Brownian, non-colloidal, monodisperse spherical particles dis-persed in a Newtonian fluid exhibit non-Newtonian behaviours. Most of these behavioursmay be explained by the coupling between flow, contact interactions and microstructure.To mention just a few examples, Pham et al. (2015) showed that irreversible dynamics ofnon-Brownian neutrally buoyant particles subjected to a periodic shear flow originatesin particle solid-solid contacts. Gadala-Maria & Acrivos (1980) proposed to explain thetransient response of the viscosity under shear reversal by the presence of an asymmetricshear-induced microstructure that is broken and re-built along the new direction of theflow. Later Blanc et al. (2011) showed that the asymmetry of the microstructure comesfrom solid contact between particles through the asperities they have at their surface. Theinvolvement of contact forces has also made it possible to explain discontinuous shear-thickening often observed in very concentrated suspensions of non-Brownian spheres(Seto et al. 2013; Mari et al. 2014) by a transition from frictionless to frictional contacts.The effect of solid friction between particles on both normal stress differences andviscosity of concentrated suspensions is also very significant. Numerical simulations ofGallier et al. (2014) showed that changing the friction coefficient, µ, from 0 to 0.5 for a0.45 volume fraction suspension leads to an increase of the viscosity by a factor of 1.5 whilethe first normal stress difference magnitude—which is negative—is divided by almost 2and the second normal stress is two-fold-increased. As the particle volume fraction, φ,increases, the contribution of contact forces to the viscosity becomes more and moreimportant compared to the contribution of hydrodynamic forces. For rough frictionalparticles with µ = 0.5, hydrodynamic and contact contributions are almost the same forφ = 0.4 but, at φ = 0.46, the contact contribution is around twice the hydrodynamiccontribution. So one has to keep in mind that solid contacts between particles is a keyingredient to explain non-Brownian suspension rheology.
Among non-Newtonian behaviours that still raise question, shear-thinning occupies aspecial place because it is quite ubiquitous and can be observed in most experimentalresults on shear rate-shear stress dependence but is rarely discussed. A first attemptto explain shear-thinning has been made by Acrivos et al. (1994) who showed that theapparent shear-thinning that they observed when the viscosity of a suspension of non-Brownian particles is measured in a Couette device is due to a mismatch in the densitiesof the liquid and of the particles. But whereas this explanation seems compelling inthe case of the Couette flow where the larger and larger resuspension of the denserparticles as the shear rate increases should lead to a decrease of the measured apparentviscosity, it cannot explain shear-tinning observed in other flow geometries such as forexample in torsional parallel-plate flow. Shear-thinning, however, has been reported inrotating parallel plate measurements by several authors (Dbouk 2011; Zarraga et al.2000; Vazquez-Quesada et al. 2016). Vazquez-Quesada et al. (2016) explains the shear-thinning they observed by the shear-thinning behaviour of the suspending liquid (siliconoil) itself. More precisely, the suspending liquid is Newtonian at the macroscopic shearrates involved in the measurement of the viscosity but may be shear-thinning in the rangeof the higher shear rates experienced by the host liquid in the interparticle gap. Later,the authors showed that this mechanism cannot apply for all systems and suggested thatvariable contact friction between particles may also be responsible for shear-thinning(Vazquez-Quesada et al. 2017). Recently, Tanner et al. (2018) proposed a model basedon a bootstrap mechanism of friction that introduces shear-thinning by assuming thatthe friction coefficient is a decreasing function of the sliding speed between particles.Here, we explore the same kind of idea and propose to explain shear-thinning by a
Shear-thinning in non-Brownian suspensions 3
decrease of the friction coefficient between particles as the contact force between them,which is controlled by the suspension shear stress, increases. Prior to describe the contactlaw between particles, we would like to highlight that particle contacts are enabled bythe asperities that are present at particle surface. For perfectly smooth particles, solidcontact is prevented by lubrication forces that diverge as the particle separation tendsto zero. On the opposite, for rough particles, contact between particles is made possiblethrough isolated asperities that maintain finite lubrication forces between particles. Inother words, roughness is able to screen lubrication divergence. In such a scenario, onlyone or a few asperities may be involved in contact, and the macroscopic Amontons-Coulomb law that is used to describe contact between macroscopic surfaces and accordingto which the friction coefficient does not depend on the magnitude of the tangentialor normal load is expected not to hold anymore. Indeed, this macroscopic contact lawis usually understood in the frame of theories where a large number of asperities arecompressed (Greenwood & Williamson 1966). Instead, in the case of a small number ofelastically contacting asperities, the friction coefficient is expected to decrease with load(Archard 1957).
In the present paper, we modify the contact model presented in (Gallier et al. 2014)in order to account for a variable friction between particles. The first part is dedicatedto the presentation of the numerical method and of the contact model that has beenchosen to introduce a load-dependent friction coefficient in the numerical simulations.The second section presents the simulation results and proposes a viscosity model thatmakes it possible to estimate the influence of any particular friction law on the viscositywithout performing new simulations. In the third section, experiments carried out onsuspensions of monodisperse polystyrene particles, 40 µm in diameter, dispersed in asilicone oil for five values of the particle volume fraction are presented. And the lastsection is devoted to a comparison of the numerical model to the experimental results.
2. Numerical method
2.1. The Force Coupling Method
We use the Force Coupling Method to study the rheology of non-Brownian suspensionsmade of rigid rough particles in a Newtonian liquid, η0 in viscosity. The main features ofthe method are recalled in (Peters et al. 2016) and the interested reader will find moredetail in (Yeo & Maxey 2010b). In this method, the motion of the fluid is computedin the whole meshed domain, where the presence of the particles is taken into accountusing a specified force density that enforces rigid body motion in the particles. Smallscale flows between the particles are not resolved by the direct computation, so thatthe hydrodynamic force and other moments are corrected using theoretical expressionsfrom lubrication approximation. Thus, this method is able to catch both long range andshort range hydrodynamic interactions. Inertia is neglected in computing both the liquidand the particle motion, and the particle density is matched to that of the liquid. As aconsequence, the total force and torque on each particle vanish.
F h + F c = 0 (2.1)
T h + T c = 0 (2.2)
where the superscript h stands for the hydrodynamic moments (both direct computationand lubrication corrections) and c for the contact moments. The later will be describedin the following section, and the former are computed as explained in (Peters et al. 2016).The hydrodynamic force moment (stresslet) Sh as well as the contact force moment Sc
4 L. Lobry, E. Lemaire, F. Blanc, S. Gallier and F. Peters
of each particle are computed too, yielding the effective stress, and then the relativeviscosity ηS defined as the ratio of the suspension viscosity to the host liquid viscosity.
The particles are contained in a cubic domain, where the shear rate γ is imposed. Theflow is made periodic in all three dimensions using Lee Edwards conditions. The total solidvolume fraction is denoted by φ. We consider a bidisperse collection of spheres, of radiusa1 and a2=1.4 a1, with the same volume fraction φ/2, in order to avoid crystallisation.The particular value a1/a2 = 1.4 that was chosen is widely used in the literature (Setoet al. 2013; Mari et al. 2014; Ness & Sun 2015; Seto et al. 2017). We note here that arecent study was published, that explored the influence of bidispersity on the suspensionrheology, and compared it to polydisperse system rheology (Pednekar et al. 2018). Fromthis study, it is possible to infer that, at least for the volume fraction range that isprobed in the present article, the viscosity is nearly the same as for a monodispersesystem without crystallisation. The size of the computation cell is Lx × Ly × Lz =16a1 × 16a1 × 16a1 corresponding to approximately 300 particles for a solid volumefraction φ=0.5. The suspension is sheared during a total strain ranging between 40 and100, depending on the solid volume fraction, in order to obtain correct averaging.
2.2. Contact model
2.2.1. Introduction
Up to now, most simulations of sheared frictional suspensions (Mari et al. 2014; Setoet al. 2013; Gallier et al. 2014; Peters et al. 2016) have considered a simple model offrictional contact with a constant static friction coefficient, as defined by the ratio of thelargest tangential force that is allowed before sliding motion occurs to the normal force.This simple Amontons-Coulomb model is a simplified description of the contact betweenmacroscopic surfaces for which the real area of contact is far smaller than the apparentmacroscopic contact area, meaning that contact occurs between surface asperities (Tabor1981). Considering a macroscopic contact, it is usually assumed that a statistically largenumber of asperities are deformed as in (Greenwood & Williamson 1966). Even thoughthe contact area for each single asperity is not proportional to the corresponding load,the total area is approximately proportional to the total load, leading to a static frictioncoefficient that does not depend on the load, in agreement with Amontons-Coulomb law.
Contrarily, when a contact between a single asperity and a smooth surface is con-sidered, the contact law is not linear anymore and a decrease of the friction coefficientwith increasing normal load is expected. Many models have been proposed, where thedeformation remains elastic at low applied load, and enters a plastic regime as the loadis increased (see for example (Chang et al. 1987; Brizmer et al. 2006b, 2007)), and someexperimental validations have been performed for the contact of a smooth sphere againsta flat substrate, leading to a load-dependent static friction coefficient (Ovcharenko et al.2008).
The present paper deals with contacting micro-particles immersed in a host liquid, thewhole suspension experiencing a shear flow. This particular problem may be consideredquite specific for several reasons. First, the contact forces that are controlled by thesheared suspension bulk stress may be very weak, depending on the shear rate and thevolume fraction. As a consequence, contact occurs between a small number of asperitiesand not between a large distribution of asperities as in Greenwood-Williamson model(see Sec. 2.2.4 for details on the model parameters and the estimation of the number ofcontacting asperities). Hence a load-dependent friction coefficient is expected, instead ofthe Amontons-Coulomb law.
During the last 2-3 decades, experimental studies have been performed by means of
Shear-thinning in non-Brownian suspensions 5
the so-called colloidal probe technique, where a single bead, a few microns in diametertypically, is attached to the cantilever of an atomic force microscope (AFM) (see forexample the review by Butt et al. (2005)). Some of these studies deal with the adhesionand/or friction coefficient between a particle and a hard flat substrate. When experimentsare performed in dry atmosphere, a significant adhesion is measured (Schaefer et al.1995; Biggs & Spinks 1998), that may depend on the applied load (Biggs & Spinks 1998)possibly due to plastic deformation of the surface asperities (Reitsma et al. 2000). Thestatic friction coefficient is affected by the adhesion forces, so that a finite friction forceis observed with vanishing normal load (Biggs & Spinks 1998; Reitsma et al. 2000; Ecke& Butt 2001). Adhesion forces between particles have been also measured for smoothparticles in air, again leading to a friction coefficient that decreases as the load increases.The intensity of the adhesion depends on the nature of the particles and on the surfaceroughness (Heim et al. 2002; Ling et al. 2007). When particles are immersed in water,the interaction forces are more complicated due to electric double layer (Ducker et al.1992; Li et al. 1993; Zou et al. 2015). In the case of weak adhesion, the friction forcebetween silica particles in a salty alkaline solution has been shown to follow Amontons-Coulomb law (Fernandez et al. 2015). This contrasts with the results of the article ofChatte et al. (2018) who used a quartz-tuning fork based AFM to measure the frictionforce between PVC particles immersed in a plasticizer (Dinch). They observed that thefriction coefficient decreased with increasing normal load. To conclude this overviewof experimental studies, the friction law between microparticles in a liquid stronglydepends on the particular system that is considered, and is affected by many factorssuch as adhesion, roughness, plastic deformation and surface coating that may introducediscrepancies with the Amontons-Coulomb law and yield an apparent friction coefficientthat decreases as the load increases. In the following subsection, we focus on the choiceof a contact model that would account for such load-dependent friction properties andwe discuss the main underlying assumptions.
2.2.2. Choice of a contact model
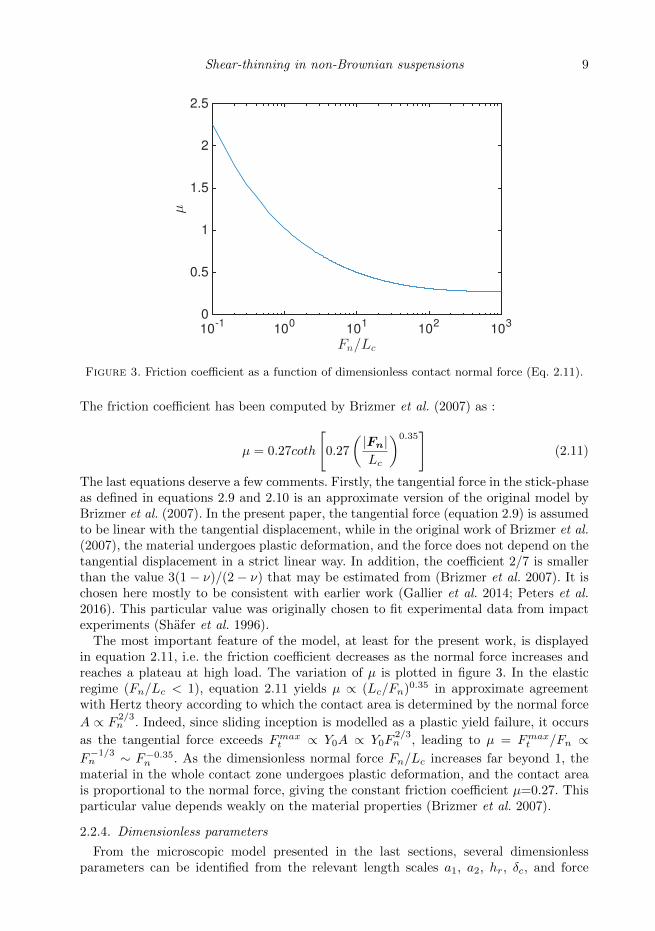
As discussed above, the sliding friction between two rough micro-spheres is expectedto involve mono- or few-asperity contacts which would result in load-dependent frictioncoefficient. Among the relevant models available in the literature, we select one of thesimplest that has been proposed by Brizmer et al. (2007) who investigated the elastic-plastic contact between a single asperity and a rigid flat under full stick conditions. Usingthe finite element method, they show that, at low normal loads, the contact is elasticand the friction coefficient decreases with increasing normal load while, for higher normalloads, the contact becomes more and more plastic and the friction coefficient approachesa constant value. The decrease of the friction coefficient in the elastic regime can beexplained by the variation of the contact area. According to the Hertz theory, the area
of the elastic contact zone varies as F2/3N (FN being the normal force), which leads to
a decrease of the friction coefficient with increasing normal force: µ ∝ F−1/3N . When
the normal force is high enough for the contact to enter the plastic regime, the frictioncoefficient levels off at a constant value of about 0.3. In the following, we are going to usea simplified version of this model. Before explaining it in more detail, we have to makea few comments.
(i) the decrease of µ with increasing normal force is expected in the elastic regime i.e.at low normal loads. Thus, shear-thinning behaviour is anticipated for low shear stresses.
(ii) in the plastic regime, at higher normal loads, µ is expected to level off and theviscosity to reach a plateau.

6 L. Lobry, E. Lemaire, F. Blanc, S. Gallier and F. Peters
(iii) the existence of an elastoplastic transition introduces a force scale in the system,Lc, which is the critical normal force at yield inception.
(iv) a single asperity contact is considered but the contact model can be straightfor-wardly refined to account for a few contacting asperities and would display the samequalitative trends.
(v) the contact is hysteretic at high normal load. This means that, in the plasticregime, the deformation is not totally recovered upon unloading. In the following theirreversibility associated with plasticity will not be considered. The main reason behindthis simplification is the following: during the contact phase, the primary effect ofplasticity on the particle dynamics would be depicted as a reduction of the asperityheight and so of the interparticle distance. Several authors showed that the viscosityweakly increases with decreasing particle separation distance, i.e. typically less than 20%for a hundredfold decrease of the distance between particle surfaces (Sierou & Brady2002; Yeo & Maxey 2010a; Gallier et al. 2014). Thus, considering the weakness of theinterparticle distance effects on viscosity, contact irreversibility will be neglected.
To conclude this discussion on the choice of the contact model, we would like to stressout that the aim of the present paper is not to elucidate the micro-mechanisms at playin contact between particles but to test the influence of a variable friction coefficient onthe rheological behaviour of non-Brownian suspensions. Notwithstanding this remark,we will show in Sec. 5 that the numerical simulations conducted with such an elastic-plastic contact model yield flow curves in quite good agreement with experimental data.The realistic values of the physical parameters (Young’s modulus, Poisson’s ratio, yieldstrength, roughness height) that have to be introduced in the model to get a goodagreement with the experimental results are a strong argument in favour of the presenceof elastic-plastic contacts between particles. However, we do not pretend that othermechanisms cannot contribute to the decrease of the friction coefficient with increasingshear stress and to its saturation at high shear stresses. In particular, it is likely that thenumber of contacting asperities increases with load which would lead also to a saturationof µ.
2.2.3. An elastic-plastic mono-asperity contact model
We consider rough spherical particles of radius a1 or a2 that come into contact, throughtheir surface asperities. It is assumed that the whole contact between particles occursbetween one single asperity, modelled by a spherical surface with radius hr, and a smoothpatch of the second particle (figure 1). In the original work of Brizmer et al. (2007), thesphere was made of an elastic linear isotropic hardening material, where the Hooke’sand Prandtl-Reuss constitutive law governed the elastic and plastic regime, respectively.A normal preload P was applied first and kept constant as the tangential load Q wasincreased until sliding inception, which was treated as a plastic yield failure. The frictioncoefficient was defined as the ratio of the largest value of the tangential load Qmax tothe normal preload P , and a correlation law was fitted to the variation of Qmax withP . Two different regimes were identified: when the preload is smaller than a criticalvalue, Lc (equation 2.4), the deformation of the sphere keeps fully elastic during normalloading, and the friction coefficient decreases with the applied preload approximately
as (P/Lc)1/3
. As P is increased, the fraction of the material that experiences plasticdeformation increases and the friction coefficient gradually tends to a constant value.The correlation between the preload P and the surface overlap is also provided, thatincludes the transition from elastic to plastic regime.
In the present article, the contact force exerted on the smooth patch (figure 1) is splitinto the force normal to the surfaces, Fn and the tangential force, Ft. The normal force

Shear-thinning in non-Brownian suspensions 7
Figure 1. Sketch of the roughness modelling. s is the hydrodynamic separation distance, hr isthe roughness height
depends on the surface overlap δ = hr − s according to the correlation found by Brizmeret al. (2006a,b), but, for the sake of simplicity, it is treated as fully elastic i.e. reversible.It means that the influence of the hysteresis of the contact law, which is connected tomaterial plasticity, is neglected here. The normal force Fn is given in the elastic regime(δ 6 δc , L 6 Lc) by equation 2.3:
Fn = −Lc(δ
δc
)3/2
n (2.3)
where Lc and δc are the critical normal load and surface overlap at yield inception,respectively:
Lc = Lcπ3Y0
6C3ν
(hr
2(1− ν2) Y0E
)2
(2.4)
δc = δc hr
[πCν
(1− ν2) Y0E
]2(2.5)
E, ν and Y0 are the Young’s modulus , Poisson’s ratio and yield strength of the materialrespectively, and Cν = 1.234 + 1.256 ν. Equations 2.3, 2.4 and 2.5 differ from the usualHertz contact law between a sphere and a plane half-space made of the same materialby the over-bar quantities 2.6 and 2.7, that are characteristic of the full stick contactcondition:
Lc =[8.88ν − 10.13
(ν2 + 0.089
)](2.6)
δc =[6.82ν − 7.83
(ν2 + 0.0586
)](2.7)
The case that was considered in the original articles of Brizmer et al. (2006a,b, 2007) ofa rigid flat surface was transposed to the present case of an elastic surface by consideringthat the relevant parameters for the contact between two spheres (1) and (2) are themean modulus 1/E∗ = (1−ν21)/E1 +(1−ν21)/E2 = 2(1−ν2)/E and the mean curvature1/R∗ = 1/R1 + 1/R2. This procedure is rigorously exact only for the elastic contact. Inthe present article, we only consider a contact between a spherical asperity with a radiushr and a flat surface, so that 1/R∗ ≈ 1/hr.

8 L. Lobry, E. Lemaire, F. Blanc, S. Gallier and F. Peters
δ/hr
10-2
10-1
100
Fn
Lc
10-1
100
101
102
103
δc/hr
Figure 2. Dimensionless normal contact force as a function of dimensionless overlap. Dashedline : original force from equation 2.8. Solid line : corrected force to keep δ/hr <0.8.
In the plastic regime (δ > δc , L > Lc), the normal force is softer :
Fn = −Lc(δ
δc
)3/2
1− exp
1
1−(δδc
)βn (2.8)
where β=0.174+0.08 ν. In addition, due to the softness of the normal force, and thehigh level of contact forces at large shear rate and high solid volume fraction, particlesmay overlap, meaning that the asperity is fully flattened out, and the distance s maybecome negative. To avoid this, a multiplying function is included, that goes to infinityfor s = 0.2 hr (δ= 0.8 hr), so that the distance between particle surfaces, s, is keptlarger than 0.2 hr. This particular value was chosen arbitrarily but has only a quite weakinfluence on the lubrication stress. Figure 2 displays the interparticular force normalisedby critical force Lc as a function of the the dimensionless overlap, δ/hr. The dashed lineis the dimensionless force from equation 2.8, while the solid line displays the force usedin the simulations, in order to keep δ/hr <0.8 as mentioned above. Its expression differsfrom the original one only for δ/hr &0.7.
The tangential force is modelled as a linear spring-like force with a threshold as in(Cundall & Strack 1979; Gallier et al. 2014; Peters et al. 2016):
Ft =
−κtY for |Ft| < µ|Fn| (stick-phase)
µ|Fn| Ft
|Ft| otherwise (slip-phase)(2.9)
where µ is the (static and dynamic) friction coefficient. Y is the relative tangentialdisplacement of the two particle surfaces and it is calculated as the integral of the slipvelocity during contact (Peters et al. 2016). The value of the stiffness of the tangentialspring, κt, is linked to the normal force intensity |Fn| through equation 2.10 so that itdepends on the surface overlap δ (Eq. 2.8).
κt =2
7
|Fn|δ
(2.10)
Shear-thinning in non-Brownian suspensions 9
Fn/Lc
10-1
100
101
102
103
µ
0
0.5
1
1.5
2
2.5
Figure 3. Friction coefficient as a function of dimensionless contact normal force (Eq. 2.11).
The friction coefficient has been computed by Brizmer et al. (2007) as :
µ = 0.27coth
[0.27
(|Fn|Lc
)0.35]
(2.11)
The last equations deserve a few comments. Firstly, the tangential force in the stick-phaseas defined in equations 2.9 and 2.10 is an approximate version of the original model byBrizmer et al. (2007). In the present paper, the tangential force (equation 2.9) is assumedto be linear with the tangential displacement, while in the original work of Brizmer et al.(2007), the material undergoes plastic deformation, and the force does not depend on thetangential displacement in a strict linear way. In addition, the coefficient 2/7 is smallerthan the value 3(1− ν)/(2− ν) that may be estimated from (Brizmer et al. 2007). It ischosen here mostly to be consistent with earlier work (Gallier et al. 2014; Peters et al.2016). This particular value was originally chosen to fit experimental data from impactexperiments (Shafer et al. 1996).
The most important feature of the model, at least for the present work, is displayedin equation 2.11, i.e. the friction coefficient decreases as the normal force increases andreaches a plateau at high load. The variation of µ is plotted in figure 3. In the elasticregime (Fn/Lc < 1), equation 2.11 yields µ ∝ (Lc/Fn)0.35 in approximate agreementwith Hertz theory according to which the contact area is determined by the normal force
A ∝ F2/3n . Indeed, since sliding inception is modelled as a plastic yield failure, it occurs
as the tangential force exceeds Fmaxt ∝ Y0A ∝ Y0F2/3n , leading to µ = Fmaxt /Fn ∝
F−1/3n ∼ F−0.35n . As the dimensionless normal force Fn/Lc increases far beyond 1, the
material in the whole contact zone undergoes plastic deformation, and the contact areais proportional to the normal force, giving the constant friction coefficient µ=0.27. Thisparticular value depends weakly on the material properties (Brizmer et al. 2007).
2.2.4. Dimensionless parameters
From the microscopic model presented in the last sections, several dimensionlessparameters can be identified from the relevant length scales a1, a2, hr, δc, and force
10 L. Lobry, E. Lemaire, F. Blanc, S. Gallier and F. Peters
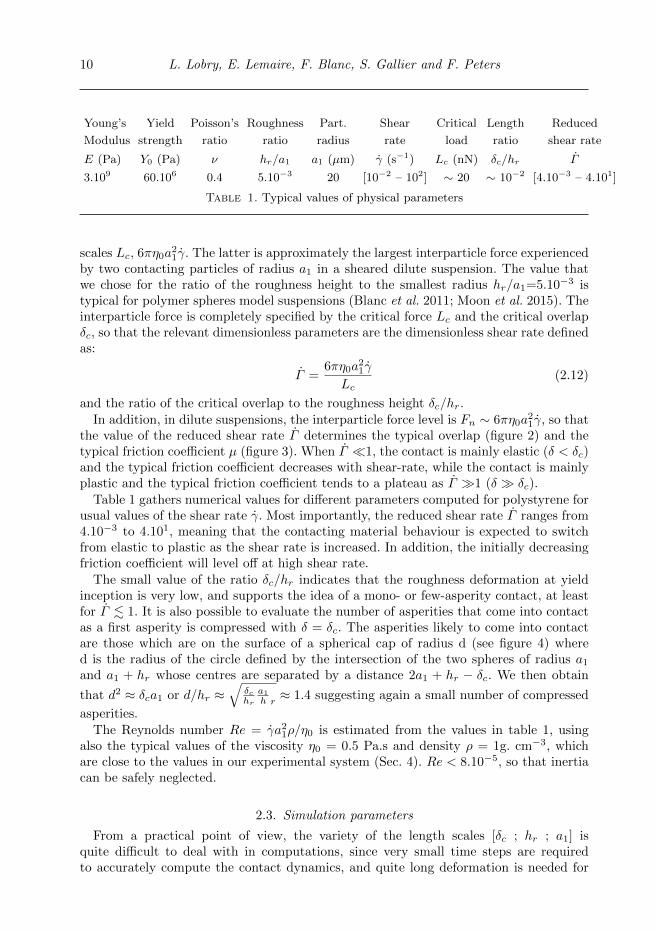
Young’s Yield Poisson’s Roughness Part. Shear Critical Length Reduced
Modulus strength ratio ratio radius rate load ratio shear rate
E (Pa) Y0 (Pa) ν hr/a1 a1 (µm) γ (s−1) Lc (nN) δc/hr Γ
3.109 60.106 0.4 5.10−3 20 [10−2 – 102] ∼ 20 ∼ 10−2 [4.10−3 – 4.101]
Table 1. Typical values of physical parameters
scales Lc, 6πη0a21γ. The latter is approximately the largest interparticle force experienced
by two contacting particles of radius a1 in a sheared dilute suspension. The value thatwe chose for the ratio of the roughness height to the smallest radius hr/a1=5.10−3 istypical for polymer spheres model suspensions (Blanc et al. 2011; Moon et al. 2015). Theinterparticle force is completely specified by the critical force Lc and the critical overlapδc, so that the relevant dimensionless parameters are the dimensionless shear rate definedas:
Γ =6πη0a
21γ
Lc(2.12)
and the ratio of the critical overlap to the roughness height δc/hr.In addition, in dilute suspensions, the interparticle force level is Fn ∼ 6πη0a
21γ, so that
the value of the reduced shear rate Γ determines the typical overlap (figure 2) and thetypical friction coefficient µ (figure 3). When Γ 1, the contact is mainly elastic (δ < δc)and the typical friction coefficient decreases with shear-rate, while the contact is mainlyplastic and the typical friction coefficient tends to a plateau as Γ 1 (δ δc).
Table 1 gathers numerical values for different parameters computed for polystyrene forusual values of the shear rate γ. Most importantly, the reduced shear rate Γ ranges from4.10−3 to 4.101, meaning that the contacting material behaviour is expected to switchfrom elastic to plastic as the shear rate is increased. In addition, the initially decreasingfriction coefficient will level off at high shear rate.
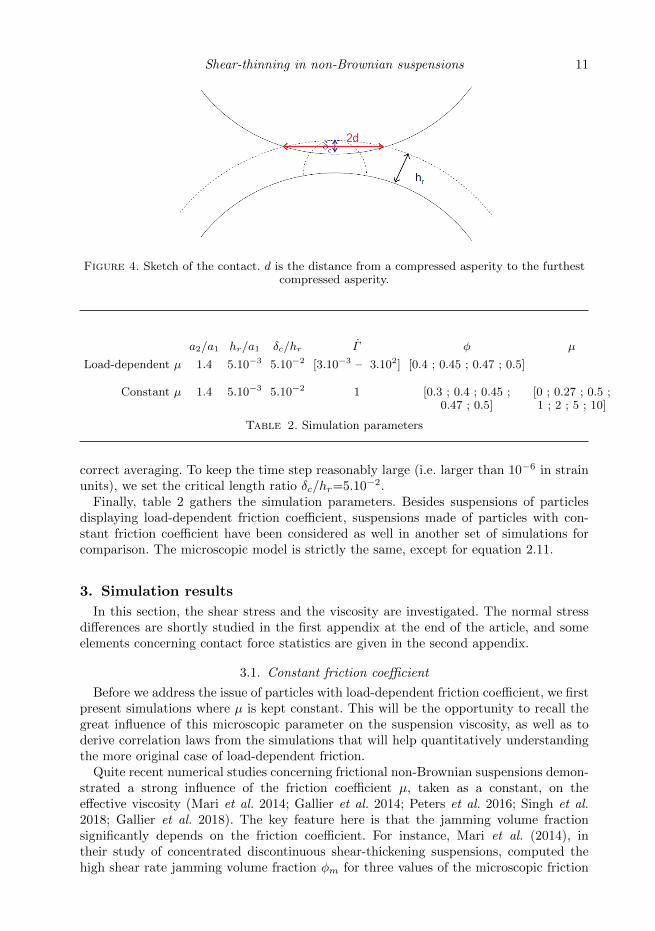
The small value of the ratio δc/hr indicates that the roughness deformation at yieldinception is very low, and supports the idea of a mono- or few-asperity contact, at leastfor Γ . 1. It is also possible to evaluate the number of asperities that come into contactas a first asperity is compressed with δ = δc. The asperities likely to come into contactare those which are on the surface of a spherical cap of radius d (see figure 4) whered is the radius of the circle defined by the intersection of the two spheres of radius a1and a1 + hr whose centres are separated by a distance 2a1 + hr − δc. We then obtain
that d2 ≈ δca1 or d/hr ≈√
δchr
a1h r≈ 1.4 suggesting again a small number of compressed
asperities.The Reynolds number Re = γa21ρ/η0 is estimated from the values in table 1, using
also the typical values of the viscosity η0 = 0.5 Pa.s and density ρ = 1g. cm−3, whichare close to the values in our experimental system (Sec. 4). Re < 8.10−5, so that inertiacan be safely neglected.
2.3. Simulation parameters
From a practical point of view, the variety of the length scales [δc ; hr ; a1] isquite difficult to deal with in computations, since very small time steps are requiredto accurately compute the contact dynamics, and quite long deformation is needed for
Shear-thinning in non-Brownian suspensions 11
Figure 4. Sketch of the contact. d is the distance from a compressed asperity to the furthestcompressed asperity.
a2/a1 hr/a1 δc/hr Γ φ µ
Load-dependent µ 1.4 5.10−3 5.10−2 [3.10−3 – 3.102] [0.4 ; 0.45 ; 0.47 ; 0.5]
Constant µ 1.4 5.10−3 5.10−2 1 [0.3 ; 0.4 ; 0.45 ; [0 ; 0.27 ; 0.5 ;0.47 ; 0.5] 1 ; 2 ; 5 ; 10]
Table 2. Simulation parameters
correct averaging. To keep the time step reasonably large (i.e. larger than 10−6 in strainunits), we set the critical length ratio δc/hr=5.10−2.
Finally, table 2 gathers the simulation parameters. Besides suspensions of particlesdisplaying load-dependent friction coefficient, suspensions made of particles with con-stant friction coefficient have been considered as well in another set of simulations forcomparison. The microscopic model is strictly the same, except for equation 2.11.
3. Simulation results
In this section, the shear stress and the viscosity are investigated. The normal stressdifferences are shortly studied in the first appendix at the end of the article, and someelements concerning contact force statistics are given in the second appendix.
3.1. Constant friction coefficient
Before we address the issue of particles with load-dependent friction coefficient, we firstpresent simulations where µ is kept constant. This will be the opportunity to recall thegreat influence of this microscopic parameter on the suspension viscosity, as well as toderive correlation laws from the simulations that will help quantitatively understandingthe more original case of load-dependent friction.
Quite recent numerical studies concerning frictional non-Brownian suspensions demon-strated a strong influence of the friction coefficient µ, taken as a constant, on theeffective viscosity (Mari et al. 2014; Gallier et al. 2014; Peters et al. 2016; Singh et al.2018; Gallier et al. 2018). The key feature here is that the jamming volume fractionsignificantly depends on the friction coefficient. For instance, Mari et al. (2014), intheir study of concentrated discontinuous shear-thickening suspensions, computed thehigh shear rate jamming volume fraction φm for three values of the microscopic friction

12 L. Lobry, E. Lemaire, F. Blanc, S. Gallier and F. Peters
φ0 0.1 0.2 0.3 0.4 0.5 0.6
1√
ηS
0
0.2
0.4
0.6
0.8
1
1.2
1.4
Figure 5. Inverse of the square root of the shear viscosity against volume fraction for two valuesof the friction coefficient. () µ = 0.27 () µ = 2. Solid lines : best fit of equation 3.1 to thedata. The variation of φmax and α0 with µ is clearly displayed.
coefficient, namely µ = 0, µ = 1 and µ = ∞. The jamming volume fraction was shownto decrease from 0.66 to 0.56. More recently, Peters et al. (2016) and Singh et al. (2018)explained the variation of the viscosity of non-colloidal suspensions with the microscopicparticle friction coefficient by a smooth decrease of the jamming volume fraction formicroscopic friction coefficient ranging from 0 to 1. We note that such a correlationbetween jamming volume fraction and microscopic friction coefficient was evidenced insimulations of granular flows (Silbert 2010) and in experiments concerning discontinuousshear-thickening suspensions (Fernandez et al. 2013; Chatte et al. 2018).
We show here similar simulations where the friction coefficient is kept constant (table2). For each value of µ, the following simple correlation law is fitted to the variation ofthe relative viscosity against the volume fraction :
ηS(µ, φ) =α0(µ)(
1− φφm(µ)
)2 (3.1)
We note that such a fitting function has already been used in recent works concerningconcentrated suspensions (Peters et al. 2016; Singh et al. 2018). Obviously, the correlation3.1 is not suitable at low volume fraction, for which the value α0 = 1 is expected. Thedata from the simulation together with the respective correlation laws are displayed infigure 5 for two values of the friction coefficient.
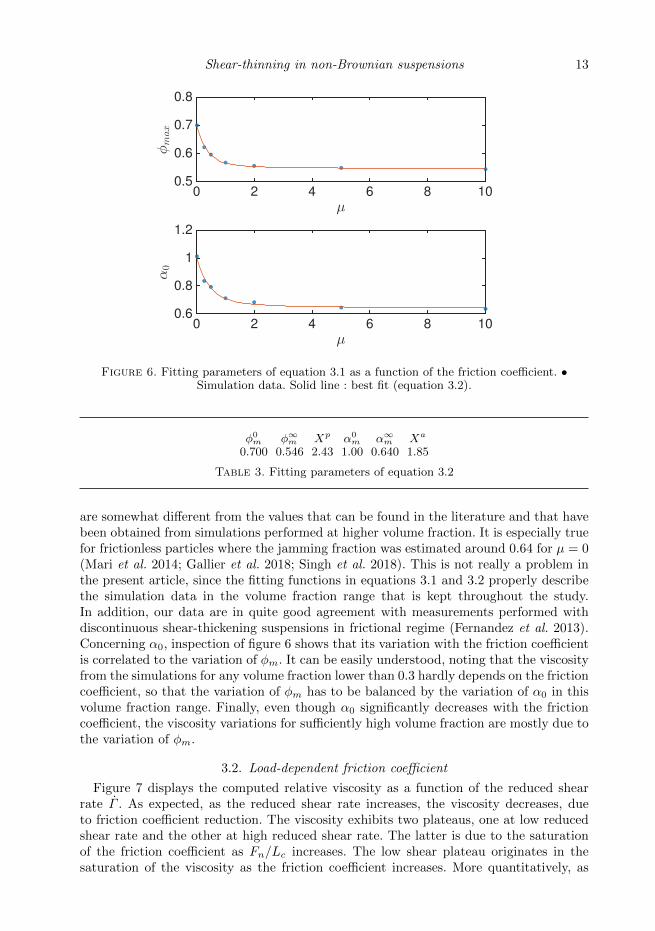
The fitting parameters α0 and φm are displayed in figure 6 against the frictioncoefficient µ, together with the best fit to equations 3.2, where the φxm, αx0 and Xx
are again fitting parameters, that are gathered in table 3.
φm = φ∞m + (φ0m − φ∞m ) exp(−Xp atan(µ))−exp(−πXp/2)1−exp(−πXp/2)
α0 = α∞0 + (α00 − α∞0 ) exp(−Xa atan(µ))−exp(−πXa/2)
1−exp(−πXa/2)
(3.2)
In particular, the jamming volume fraction seems to approach the limit φ∞m = 0.546as the friction coefficient goes to ∞ and is equal to φ0m = 0.700 for µ=0. These values
Shear-thinning in non-Brownian suspensions 13
µ0 2 4 6 8 10
φmax
0.5
0.6
0.7
0.8
µ0 2 4 6 8 10
α0
0.6
0.8
1
1.2
Figure 6. Fitting parameters of equation 3.1 as a function of the friction coefficient. •Simulation data. Solid line : best fit (equation 3.2).
φ0m φ∞m Xp α0
m α∞m Xa
0.700 0.546 2.43 1.00 0.640 1.85
Table 3. Fitting parameters of equation 3.2
are somewhat different from the values that can be found in the literature and that havebeen obtained from simulations performed at higher volume fraction. It is especially truefor frictionless particles where the jamming fraction was estimated around 0.64 for µ = 0(Mari et al. 2014; Gallier et al. 2018; Singh et al. 2018). This is not really a problem inthe present article, since the fitting functions in equations 3.1 and 3.2 properly describethe simulation data in the volume fraction range that is kept throughout the study.In addition, our data are in quite good agreement with measurements performed withdiscontinuous shear-thickening suspensions in frictional regime (Fernandez et al. 2013).Concerning α0, inspection of figure 6 shows that its variation with the friction coefficientis correlated to the variation of φm. It can be easily understood, noting that the viscosityfrom the simulations for any volume fraction lower than 0.3 hardly depends on the frictioncoefficient, so that the variation of φm has to be balanced by the variation of α0 in thisvolume fraction range. Finally, even though α0 significantly decreases with the frictioncoefficient, the viscosity variations for sufficiently high volume fraction are mostly due tothe variation of φm.
3.2. Load-dependent friction coefficient
Figure 7 displays the computed relative viscosity as a function of the reduced shearrate Γ . As expected, as the reduced shear rate increases, the viscosity decreases, dueto friction coefficient reduction. The viscosity exhibits two plateaus, one at low reducedshear rate and the other at high reduced shear rate. The latter is due to the saturationof the friction coefficient as Fn/Lc increases. The low shear plateau originates in thesaturation of the viscosity as the friction coefficient increases. More quantitatively, as
14 L. Lobry, E. Lemaire, F. Blanc, S. Gallier and F. Peters
Γ
10-2
100
102
ηS
101
102
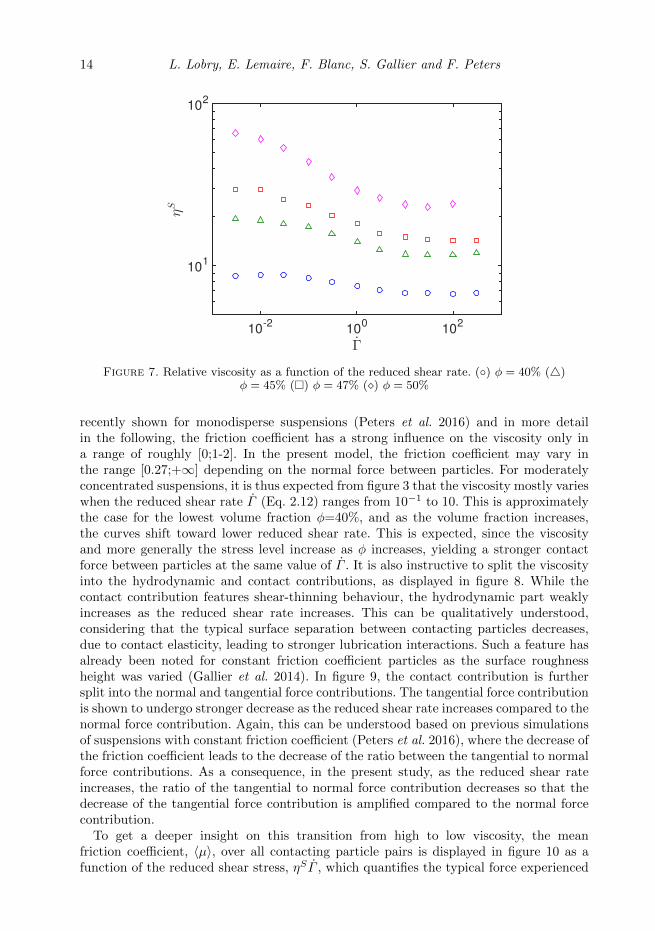
Figure 7. Relative viscosity as a function of the reduced shear rate. () φ = 40% (4)φ = 45% () φ = 47% () φ = 50%
recently shown for monodisperse suspensions (Peters et al. 2016) and in more detailin the following, the friction coefficient has a strong influence on the viscosity only ina range of roughly [0;1-2]. In the present model, the friction coefficient may vary inthe range [0.27;+∞] depending on the normal force between particles. For moderatelyconcentrated suspensions, it is thus expected from figure 3 that the viscosity mostly varieswhen the reduced shear rate Γ (Eq. 2.12) ranges from 10−1 to 10. This is approximatelythe case for the lowest volume fraction φ=40%, and as the volume fraction increases,the curves shift toward lower reduced shear rate. This is expected, since the viscosityand more generally the stress level increase as φ increases, yielding a stronger contactforce between particles at the same value of Γ . It is also instructive to split the viscosityinto the hydrodynamic and contact contributions, as displayed in figure 8. While thecontact contribution features shear-thinning behaviour, the hydrodynamic part weaklyincreases as the reduced shear rate increases. This can be qualitatively understood,considering that the typical surface separation between contacting particles decreases,due to contact elasticity, leading to stronger lubrication interactions. Such a feature hasalready been noted for constant friction coefficient particles as the surface roughnessheight was varied (Gallier et al. 2014). In figure 9, the contact contribution is furthersplit into the normal and tangential force contributions. The tangential force contributionis shown to undergo stronger decrease as the reduced shear rate increases compared to thenormal force contribution. Again, this can be understood based on previous simulationsof suspensions with constant friction coefficient (Peters et al. 2016), where the decrease ofthe friction coefficient leads to the decrease of the ratio between the tangential to normalforce contributions. As a consequence, in the present study, as the reduced shear rateincreases, the ratio of the tangential to normal force contribution decreases so that thedecrease of the tangential force contribution is amplified compared to the normal forcecontribution.
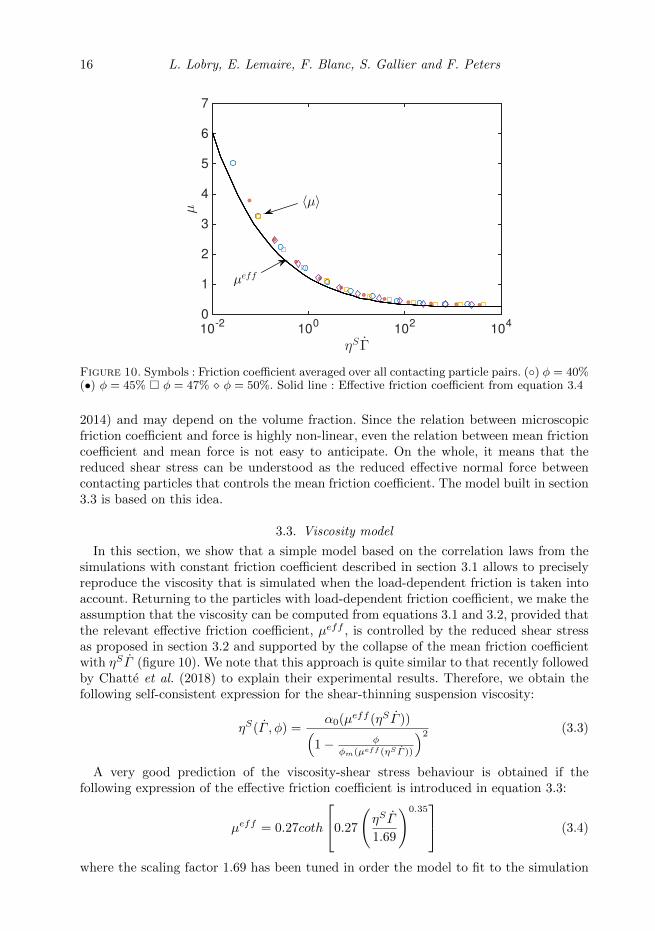
To get a deeper insight on this transition from high to low viscosity, the meanfriction coefficient, 〈µ〉, over all contacting particle pairs is displayed in figure 10 as afunction of the reduced shear stress, ηSΓ , which quantifies the typical force experienced

Shear-thinning in non-Brownian suspensions 15
ηSΓ
10-2
100
102
104
ηC,ηH
100
101
102
Figure 8. Hydrodynamic and contact contributions to the viscosity. Open symbols : contactcontribution. Closed symbols : hydrodynamic contribution. Same volume fraction values as infigure 7.
ηSΓ
10-2
100
102
104
ηC n,ηC t
10-1
100
101
102
Figure 9. Normal and tangential contact force contributions to the viscosity. Open symbols :normal force contribution. Closed symbols : tangential force contribution. Same volume fractionvalues as in figure 7.
by two contacting particles. A striking feature is that the data collapse on a singlecurve whatever the particle volume fraction. This feature is not completely obvious anddeserves a comment. The microscopic friction coefficient between contacting particles isindeed controlled by the actual normal contact force. However, the mean force is onlyqualitatively connected to the bulk shear stress. In addition, the contact force distributionis quite broad, with a distribution width which is comparable with the mean force (Gallier
16 L. Lobry, E. Lemaire, F. Blanc, S. Gallier and F. Peters
ηSΓ
10-2
100
102
104
µ
0
1
2
3
4
5
6
7
〈µ〉
µeff
Figure 10. Symbols : Friction coefficient averaged over all contacting particle pairs. () φ = 40%(•) φ = 45% φ = 47% φ = 50%. Solid line : Effective friction coefficient from equation 3.4
2014) and may depend on the volume fraction. Since the relation between microscopicfriction coefficient and force is highly non-linear, even the relation between mean frictioncoefficient and mean force is not easy to anticipate. On the whole, it means that thereduced shear stress can be understood as the reduced effective normal force betweencontacting particles that controls the mean friction coefficient. The model built in section3.3 is based on this idea.
3.3. Viscosity model
In this section, we show that a simple model based on the correlation laws from thesimulations with constant friction coefficient described in section 3.1 allows to preciselyreproduce the viscosity that is simulated when the load-dependent friction is taken intoaccount. Returning to the particles with load-dependent friction coefficient, we make theassumption that the viscosity can be computed from equations 3.1 and 3.2, provided thatthe relevant effective friction coefficient, µeff , is controlled by the reduced shear stressas proposed in section 3.2 and supported by the collapse of the mean friction coefficientwith ηSΓ (figure 10). We note that this approach is quite similar to that recently followedby Chatte et al. (2018) to explain their experimental results. Therefore, we obtain thefollowing self-consistent expression for the shear-thinning suspension viscosity:
ηS(Γ , φ) =α0(µeff (ηSΓ ))(
1− φ
φm(µeff (ηS Γ ))
)2 (3.3)
A very good prediction of the viscosity-shear stress behaviour is obtained if thefollowing expression of the effective friction coefficient is introduced in equation 3.3:
µeff = 0.27coth
0.27
(ηSΓ
1.69
)0.35 (3.4)
where the scaling factor 1.69 has been tuned in order the model to fit to the simulation

Shear-thinning in non-Brownian suspensions 17
ηSΓ
10-2
100
102
104
ηS
101
102
Figure 11. Viscosity as a function of reduced shear stress. Symbols : same data as in figure 7.Solid lines : equation 3.3.
data. The computed viscosity from equations 3.2, 3.3 and 3.4 is displayed in figure 11, inclose agreement with the data from the simulation. It follows from this phenomenologicalmodel that the characteristic reduced force that controls friction, and consequently thesuspension viscosity, is proportional to the reduced shear stress:
FnLc
=6πη0η
Sa21γ
1.69 Lc=ηSΓ
1.69(3.5)
It should be noted (figure 10), that the effective friction coefficient, µeff , which hasbeen tuned in order the modelled viscosity to fit the simulated viscosity - shear stressbehaviour, is quite close to the mean friction coefficient, 〈µ〉, that is a direct output ofthe simulations (Section 3.2).
Using equations 3.2 and 3.4, we can compute the variation of α0 (solid line in figure 12)and φm (solid line in figure 13) with ηSΓ . At low shear stress, where the friction coefficientdiverges, the jamming volume fraction approaches the asymptotic value φ∞m = 0.546 forhigh friction coefficient (equation 3.2 and text thereafter). At high shear stress, φm levelsoff at the value 0.625 computed from equation 3.2 for the lowest friction coefficient 0.27corresponding to infinite shear stress (equation 3.4).
To conclude this numerical section, it should be noted that the very good agreementbetween the data from the load-dependent friction simulations and the viscosity fromequation 3.3 allows to check the influence of any particular friction law on the viscositywithout need to perform new simulations. We follow this idea at the end of the experi-mental section.
4. Experiments
4.1. Suspensions
The suspensions are made of polystyrene (PS) particles (Dynoseed TS40, Microbeads),dispersed in silicon oil (M 500, Roth). The particles are 40 µm in diameter with a relativestandard deviation lower than 5 %. Their roughness has been measured using AFM (see

18 L. Lobry, E. Lemaire, F. Blanc, S. Gallier and F. Peters
ηSΓ, Σ12/Σc
10-2
100
102
104
α0
0.6
0.65
0.7
0.75
0.8
0.85
0.9
Figure 12. Second fitting parameter in the viscosity correlation (equation 3.1). Solid line :computed from equations 3.2 and 3.4. () Experiments.
ηS Γ, Σ12/Σc
10-2
100
102
104
φmax
0.54
0.55
0.56
0.57
0.58
0.59
0.6
0.61
0.62
0.63
Figure 13. Jamming volume fraction as a function of reduced shear stress. Solid line :computed from equations 3.2 and 3.4. () Experiments.
figure 14) and has been found to be around 36nm (RMS value) which agrees closelywith the results of Moon et al. (2015) who measured 32nm and is not so far fromthe estimation of Garland et al. (2013) who measured a characteristic roughness heightaround 100nm. Before adding the particles to the suspending liquid, they are carefullywashed with clear water and dried under vacuum at 60C for 12 hours.
The particle density has been measured to be 1.044 ± 0.005 g/cm3 and the density ofthe silicon oil to 0.972 g/cm3 at T = 25C. The viscosity of the suspending liquid, η0, hasbeen measured in cone-plate geometry. At T = 25C, η0 is measured to be 0.487Pa.s

Shear-thinning in non-Brownian suspensions 19
Figure 14. AFM image of a polystyrene particle.
and shows no variation with shear rate in the tested range 5.10−1s−1 < γ < 250 s−1.Five particle volume fractions have been tested : 0.4, 0.43, 0.45, 0.47 and 0.49, all atT = 25C. Due to density mismatch between particles and silicon oil, it is necessary tomeasure the viscosity for stresses that are high enough for particles to be resuspended.The settling of the particles is controlled by the Shields parameter, Sh, that is the ratioof fluid force on the particle to the weight of the particle.
Sh =τ
2a∆ρ g>> 1 (4.1)
Sh = 1 for τ = 0.03Pa and in the experiments only stresses larger than 0.1Pa areapplied so that particle settling is not expected to take place.
4.2. Rheometric measurements
The viscosity has been measured in rotating parallel plate geometry. The radius of thedisks, R, is 30mm and the gap height is set to 1mm, i.e. 25 particle diameters. Rotatingplate geometry provides the advantage that no migration (Chow et al. 1994) or very slowmigration (Merhi et al. 2005) takes place. The drawback of using such a geometry tostudy non-Newtonian materials is obviously the variation of the shear rate magnitudeover the gap. To account for shear rate variation from 0 at the centre to γR = ΩR/h atthe rim, the Mooney-Rabinovitch correction is used :
η(γR) = ηmes
(1 +
1
4
d ln(ηmes)
d ln(γR)
)(4.2)
where ηmes = σR/γR is the apparent viscosity delivered by the rheometer, and theapparent stress σR is given as a function of the torque Γ as σR = Γ × 2/(πR3).
The shear stress ranges from 0.1 to 600Pa and each measurement is preceded by apre-shear of 100Pa for a period of 20 s.
4.3. Experimental results
Figure 15 displays the shear rate dependence of the relative viscosity, ηS = η/η0,corrected using the Mooney-Rabinovitch correction (Eq. 4.2) for the five particle volumefractions: 0.4, 0.43, 0.45, 0.47 and 0.49. The measurement uncertainties have beenestimated by reloading five times the suspensions in the rheometer.
The shear-thinning behaviour extends over a range of more than the three decades thathave been tested and is more pronounced as the particle volume fraction increases. Theseresults are very consistent with those of (Tanner & Dai 2016) obtained with the sameparticles (Microbeads, TS40 ) dispersed in a silicon oil (viscosity 1.1Pa.s.) in a slightlynarrower range of shear stress.

20 L. Lobry, E. Lemaire, F. Blanc, S. Gallier and F. Peters
Σ12 (Pa)10
-110
010
110
210
3
ηS
0
10
20
30
40
50
60
70
80
Figure 15. relative viscosity as a function of shear stress. Symbol : 40µm PS particles ()φ = 0.4 . () φ = 0.43. () φ = 0.45 (4) φ = 0.47 (5) φ = 0.49
5. Discussion: comparison between experiments and simulations
No simulations were performed for φ = 0.43 and φ = 0.49. However, since the modeldefined in equation 3.3 accurately fits the simulation data, the experimental data arecompared to the model. In addition, in order to draw the experimental and numericaldata on the same figure, a single value of the critical stress Σc has to be stated for allvalues of the volume fraction so that ηSΓ = Σ12/Σc. We determine the value that fitsthe best: Σc = 9.53 Pa. Figure 16 displays the suspension viscosity as a function ofreduced shear stress, both experiments and model.
The experimental data are in quite good qualitative agreement with the model. Theviscosity range for a given volume fraction is roughly the same in both cases, and isspanned over the same reduced stress range too. From the value of the fitted critical stressΣc=9.53 Pa , we can deduce the value of the critical load Lc: Lc = Σc × (6πa21) = 46nN. As for the radius a1, that is 0.8 times the mean radius of the bidisperse suspensionin the simulations, we take a1 = 16 µm. The value of Lc yields an estimation of theasperity radius of curvature Rexp—hr in the contact law—using equation 2.4 togetherwith the material constant in table 1 : Rexp ≈ 156 nm. We recall here that in the contactmodel, the asperity was considered as half a sphere of radius hr. However, the typicalextension of an asperity in the direction parallel to the surface L‖ may be different fromthe asperity height hr ∼ 36nm. This extension may be estimated from the curvature:L‖ ∼
√2Rexphr ≈ 3.4µm. We did not perform extensive study of the surface roughness
statistics. However, this value for the extension of an asperity is quite consistent withthe AFM image displayed in figure 14. We note also that contact may occur through afew contact points instead of a single point as assumed in the model. The consequencewould be qualitatively the same as increasing the radius of curvature, i.e. to increasethe critical load. For instance, if the contact is supposed to involve two asperities, thecurvature radius can be computed from Lc = 1/2×Σc × (6πa21) together with equation2.4 : Rexp ≈ 156/
√2 ≈ 110 nm, closer to hr. On the whole, this qualitative agreement

Shear-thinning in non-Brownian suspensions 21
ηSΓ ,Σ12/Σc
10-1
100
101
102
ηS
101
102
Figure 16. Viscosity as a function of reduced shear stress. φ = 0.4, φ = 0.43, φ = 0.45,φ = 0.47, φ = 0.49 . Symbols : experiments. Solid lines : model (equation 3.3).
suggests that the physical mechanism of the shear-thinning behaviour is satisfactorilycaptured by the load-dependent friction model.
In more detail, the viscosity from the model (or the simulations) presents somediscrepancies with the experimental values. At low shear stress, the experimental viscositydoes not really show any plateau, contrarily to what is expected from the model or thesimulations. This difference may be explained by residual adhesion between particlesregardless the great care that has been taken in the choice and in the preparation of thesuspensions. Such adhesive interactions, even very small, should influence the viscosity atsmall enough shear stress. In the high stress range, the experimental measurement couldnot be performed at such high stresses that the viscosity plateau would be reached, dueto the usual edge fracture in the parallel plate geometry.
To go further in the comparison between the model and the experiments, it is possibleto compute for each stress the parameters of the viscosity model α0(Σ12) and φm(Σ12)from the experimental data. These experimental parameters are displayed in figures 12and 13, respectively, against the reduced shear stress, together with their numericalcounterpart. We chose the same value of the critical stress Σc = 9.53 Pa as in figure16. The variations of φm from the experiments and from the model are in quite goodagreement, with approximately the same volume fraction range, and the same reducedstress range. However, the experimental jamming fraction takes one value under φ∞m atlow shear stress, possibly due to residual adhesion mentioned above. The experimentaland numerical data for α0 are in quite good agreement too, even though the experimentalvalues are above the model. It should be stressed here that the values of α0 and φm fromthe experiment significantly depend on the precise adjustment procedure, apparently dueto the dispersion of the experimental data, especially in the low stress range, where thediscrepancies are larger. It does not affect the qualitative shape of the φm curve, butleads to variations of ∆φm ∼ 0.01.
Finally the effective friction coefficient µeff (Σ12) can be computed from the experi-mental jamming volume fraction (figure 13) reversing equation 3.2. It is then assumed,
22 L. Lobry, E. Lemaire, F. Blanc, S. Gallier and F. Peters
Fn(N)10
-910
-810
-710
-6
µ
0
0.5
1
1.5
2
2.5
3
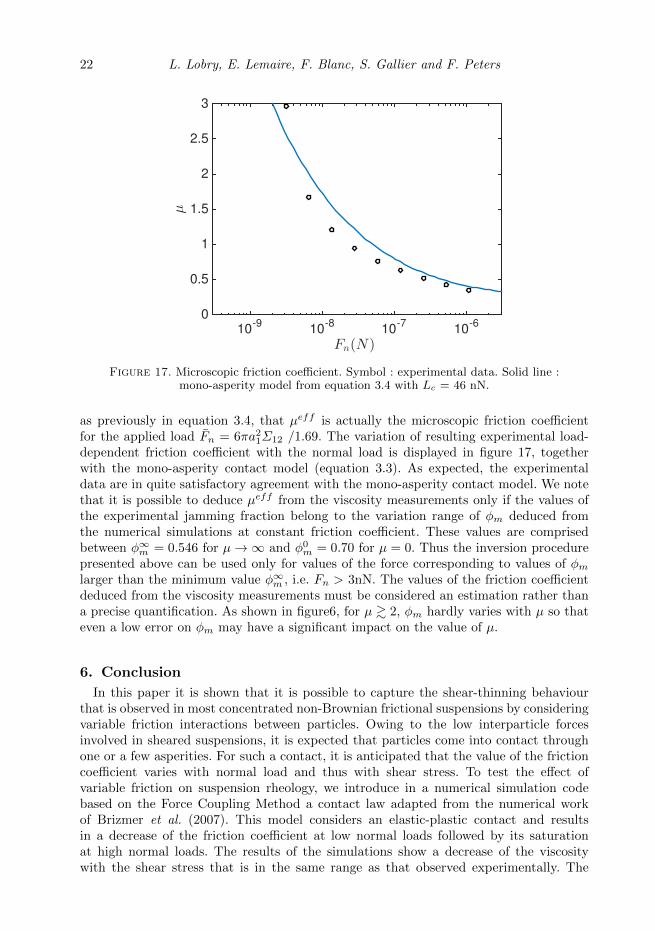
Figure 17. Microscopic friction coefficient. Symbol : experimental data. Solid line :mono-asperity model from equation 3.4 with Lc = 46 nN.
as previously in equation 3.4, that µeff is actually the microscopic friction coefficientfor the applied load Fn = 6πa21Σ12 /1.69. The variation of resulting experimental load-dependent friction coefficient with the normal load is displayed in figure 17, togetherwith the mono-asperity contact model (equation 3.3). As expected, the experimentaldata are in quite satisfactory agreement with the mono-asperity contact model. We notethat it is possible to deduce µeff from the viscosity measurements only if the values ofthe experimental jamming fraction belong to the variation range of φm deduced fromthe numerical simulations at constant friction coefficient. These values are comprisedbetween φ∞m = 0.546 for µ→∞ and φ0m = 0.70 for µ = 0. Thus the inversion procedurepresented above can be used only for values of the force corresponding to values of φmlarger than the minimum value φ∞m , i.e. Fn > 3nN. The values of the friction coefficientdeduced from the viscosity measurements must be considered an estimation rather thana precise quantification. As shown in figure6, for µ & 2, φm hardly varies with µ so thateven a low error on φm may have a significant impact on the value of µ.
6. Conclusion
In this paper it is shown that it is possible to capture the shear-thinning behaviourthat is observed in most concentrated non-Brownian frictional suspensions by consideringvariable friction interactions between particles. Owing to the low interparticle forcesinvolved in sheared suspensions, it is expected that particles come into contact throughone or a few asperities. For such a contact, it is anticipated that the value of the frictioncoefficient varies with normal load and thus with shear stress. To test the effect ofvariable friction on suspension rheology, we introduce in a numerical simulation codebased on the Force Coupling Method a contact law adapted from the numerical workof Brizmer et al. (2007). This model considers an elastic-plastic contact and resultsin a decrease of the friction coefficient at low normal loads followed by its saturationat high normal loads. The results of the simulations show a decrease of the viscositywith the shear stress that is in the same range as that observed experimentally. The

Shear-thinning in non-Brownian suspensions 23
comparison between simulations conducted either with constant friction coefficient orload-dependent friction coefficient makes it possible to propose a model for the shear-thinning viscosity. As already shown by Peters et al. (2016) and Singh et al. (2018),the viscosity in the former case (constant friction coefficient) increases with the frictioncoefficient, mainly due to the decrease of the jamming volume fraction. In the proposedviscosity model for the particles with load-dependent friction coefficient, the effectivefriction coefficient µeff is specified by the effective normal contact force which is simplyproportional to the shear stress. As the shear stress increases, µeff decreases and thejamming volume fraction increases, leading to the reduction of the viscosity. A very goodagreement between the model and the simulations is found. These results are comparedto experimental measurements carried out on suspensions of polystyrene particles (40 µmin diameter) dispersed in silicone oil for five particle volume fractions between 0.40 an0.49. The overall agreement between the model (or the simulations) and the experimentsis satisfactory. The viscosity reduction as the shear stress increases is well captured bythe model and the variation of the jamming volume fraction with the shear stress fromthe experiments is in quite good agreement with the predictions. The closeness betweenthe experiments and the predictions of the model enabled us to evaluate the frictioncoefficient and its variation with the applied shear stress from rheometric measurements.Finally, the simplistic nature of the contact law deserves a few words. The essentialfeature is the variation of the friction coefficient with load, that is connected to thesmall number of asperities in contact –here a single asperity– in contrast to the usualmodel of a statistical distribution of contacting asperities. Such a mono-asperity contactmodel could be refined at will, to take into account a finite number of asperities, possiblygrowing with the bore load. This may also have an influence on the way the frictioncoefficient levels off at large load, possibly supplementing or even replacing plasticity.More generally, due to the complexity of contact at microscopic scale, and to the numberof parameters that are potentially relevant in the surface physical chemistry, the nextstep to get a more quantitative understanding of the physical mechanism leading to thisshear-thinning behaviour would be to determine the friction law between particles fromcolloidal probe AFM measurements.
AcknowledgementsThe authors thank Cyril Claudet and Olga Volkova for the AFM roughness measure-
ments. This work was granted access to the HPC and visualisation resources of ”Centrede Calcul Interactif” hosted by ”Universite Nice Sophia Antipolis”.
Appendix A. Normal stress differences
Figure 18 presents the variation of the two normal stress differences normalised by theshear stress, N1/Σ12 and N2/Σ12, with the non-dimensional stress ηSΓ . These results areconsistent with previous numerical results performed with a constant friction coefficientand present the same characteristics (Gallier et al. 2014): both N1 and N2 are negative,N1 is much smaller than N2. The values of the reduced normal stress differences are alsoof the same order of magnitude as those obtained with a friction coefficient in the range[0.3 - 0.5]. At last, N2/Σ12 appears not to vary much with φ for φ > 0.45. This saturationof N2/Σ12 has already been observed in experiments (Zarraga et al. 2000; Boyer et al.2011; Dbouk et al. 2013) and in numerical simulations conducted at constant frictioncoefficient (Gallier et al. 2014). Concerning the variation of N1/Σ12 and N2/Σ12 withηSΓ , the trends are also consistent with the numerical results that have been obtainedwith different constant friction coefficient. According to the findings of Sec. 3.2 and 3.3,

24 L. Lobry, E. Lemaire, F. Blanc, S. Gallier and F. Peters
ηSΓ
10-2
100
102
104
N1/Σ
12,N
2/Σ
12
-0.5
-0.4
-0.3
-0.2
-0.1
0
Figure 18. Open symbols : reduced first normal stress difference. Closed symbols : reducedsecond normal stress difference. () φ = 40% (4) φ = 45% () φ = 47% () φ = 50%.
increasing ηSΓ leads to a decrease of the friction coefficient. Figure 18 shows that themagnitude of N1/Σ12 increases and that of N2/Σ12 decreases with increasing ηSΓ , justas the magnitude of N1/Σ12 increases and that of N2/Σ12 decreases when the frictioncoefficient decreases, as shown by Gallier et al. (2014).
The hydrodynamic and contact contributions to the normal stress differences aredisplayed on figure 19. It is difficult to compare the trends displayed on figure 19(a)with the results of Gallier et al. (2014). The latter seem to indicate that for particlevolume fraction larger than 0.4 NH
1 /Σ12 hardly varies with µ while the magnitude ofNC
1 /Σ12 tends to decrease weakly with increasing µ. The behaviour of the shear-thinningsuspensions considered here seems different with a trend of decreasing NH
1 /Σ12 and ofincreasing NC
1 /Σ12 with increasing ηSΓ . But we have to keep in mind that both NH1 and
NC1 are much smaller than the total stresses, Σ11 and Σ22 from which they are deduced
and can be very sensitive to the details of the suspension microstructure that may bea little different from a non-shear-thinning suspension. Concerning the results obtainedfor NH
2 and NC2 , they are consistent with those of Gallier et al. (2014) with a small NH
2
compared to NC2 and a trend of NC
2 to decrease in magnitude with increasing ηSΓ .
Appendix B. Some elements on contact statistics
Figure 20 displays the fraction of particles that have experienced plastic contactversus strain for 3 values of ηSΓ at φ = 0.45. The initial value of NPlastic/NTotal isthe average fraction of particles that undergo plastic contact. As the strain increases,NPlastic/NTotal increases with an exponential-like relaxation. From this variation, wededuce a characteristic strain γc which is the average strain necessary for a particleto undergo a plastic contact. The variation of γc with ηSΓ is displayed in figure 21for the four values of the particle volume fraction. As ηSΓ increases, γc decreases andreaches for ηSΓ ≈ 1 a plateau whose value depends on the volume fraction. A qualitativeunderstanding is quite straightforward. For reduced stress ηSΓ smaller than 2 10−1
no particle was found to undergo plastic deformation. As the reduced stress increases,
Shear-thinning in non-Brownian suspensions 25
ηSΓ
10-2
100
102
104
NC 1/Σ
12,N
H 1/Σ
12
-0.15
-0.1
-0.05
0
0.05
0.1 (a)
ηSΓ
10-2
100
102
104
NC 2/Σ
12,N
H 2/Σ
12
-0.5
-0.4
-0.3
-0.2
-0.1
0
0.1 (b)
Figure 19. (a) Reduced first normal stress difference. (b) Reduced second normal stressdifference. Open symbols : contact contribution. Closed symbols : hydrodynamic contribution.Same volume fractions as in figure 18.
γ
0 1 2 3 4 5 6
NPlastic/N
Total
0
0.2
0.4
0.6
0.8
1
ηSΓ = 0.55
ηSΓ = 1.7
ηSΓ = 14
Figure 20. Variation of the fraction of particles that have experienced a plastic contact as afunction of strain time for 3 values of ηSΓ at φ = 0.45
the probability of a plastic contact takes a finite value, leading to a high value of thecharacteristic strain, that decreases as the probability of plastic contact increases. Forreduced stress larger that typically one, the characteristic strain levels off to a plateau.We note significant noise for the largest value of the reduced stress. The strain range ofthe simulation may be to short to reach completely satisfying statistical accuracy.
A deeper understanding can be achieved plotting the fraction of plastic contactsf(FN > Lc) against ηSΓ . As shown in figure 22, the data obtained for the four particlevolume fractions collapse on a single curve. Figure 22 is very similar to what has beenobtained by Mari et al. (2014) who studied the fraction of frictional contacts in ashear-thickening suspension. They showed that the number of contacts was controlledby a competition between the applied shear forces and the short-range repulsive forcesbetween particles. It is quite remarkable that similar results on contact statistics are
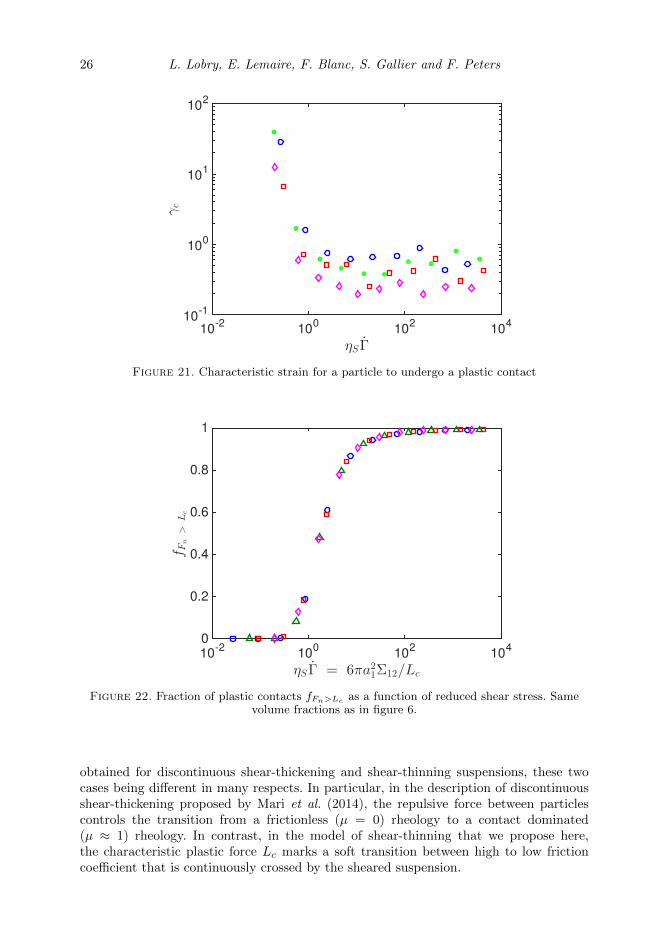
26 L. Lobry, E. Lemaire, F. Blanc, S. Gallier and F. Peters
ηS Γ
10-2
100
102
104
γc
10-1
100
101
102
Figure 21. Characteristic strain for a particle to undergo a plastic contact
ηS Γ = 6πa21Σ12/Lc
10-2
100
102
104
f Fn
>Lc
0
0.2
0.4
0.6
0.8
1
Figure 22. Fraction of plastic contacts fFn>Lc as a function of reduced shear stress. Samevolume fractions as in figure 6.
obtained for discontinuous shear-thickening and shear-thinning suspensions, these twocases being different in many respects. In particular, in the description of discontinuousshear-thickening proposed by Mari et al. (2014), the repulsive force between particlescontrols the transition from a frictionless (µ = 0) rheology to a contact dominated(µ ≈ 1) rheology. In contrast, in the model of shear-thinning that we propose here,the characteristic plastic force Lc marks a soft transition between high to low frictioncoefficient that is continuously crossed by the sheared suspension.

Shear-thinning in non-Brownian suspensions 27
REFERENCES
Acrivos, Andreas, Fan, Xiaoxing & Mauri, Roberto 1994 On the measurement of therelative viscosity of suspensions. Journal of Rheology 38 (5), 1285–1296.
Archard, JF 1957 Elastic deformation and the laws of friction. Proceedings of the Royal Societyof London A: Mathematical, Physical and Engineering Sciences 243 (1233), 190–205.
Biggs, Simon & Spinks, Geoffrey 1998 Atomic force microscopy investigation of the adhesionbetween a single polymer sphere and a flat surface. Journal of adhesion science andtechnology 12 (5), 461–478.
Blanc, Frederic, Peters, Francois & Lemaire, Elisabeth 2011 Experimental signature ofthe pair trajectories of rough spheres in the shear-induced microstructure in noncolloidalsuspensions. Physical review letters 107 (20), 208302.
Boyer, Francois, Pouliquen, Olivier & Guazzelli, Elisabeth 2011 Dense suspensionsin rotating-rod flows: normal stresses and particle migration. Journal of Fluid Mechanics686, 5–25.
Brizmer, V, Kligerman, Y & Etsion, I 2006a The effect of contact conditions and materialproperties on the elasticity terminus of a spherical contact. International Journal of Solidsand Structures 43 (18), 5736–5749.
Brizmer, Victor, Kligerman, Yuri & Etsion, Izhak 2007 Elastic–plastic spherical contactunder combined normal and tangential loading in full stick. Tribology Letters 25 (1),61–70.
Brizmer, Victor, Zait, Yuval, Kligerman, Yuri & Etsion, Izhak 2006b The effect ofcontact conditions and material properties on elastic-plastic spherical contact. Journal ofmechanics of materials and structures 1 (5), 865–879.
Butt, Hans-Jurgen, Cappella, Brunero & Kappl, Michael 2005 Force measurementswith the atomic force microscope: Technique, interpretation and applications. Surfacescience reports 59 (1), 1–152.
Chang, WR, Etsion, I & Bogy, D BASME 1987 An elastic-plastic model for the contact ofrough surfaces. Journal of tribology 109 (2), 257–263.
Chatte, Guillaume, Comtet, Jean, Nigues, Antoine, Bocquet, Lyderic, Siria,Alessandro, Ducouret, Guylaine, Lequeux, Francois, Lenoir, Nicolas,Ovarlez, Guillaume & Colin, Annie 2018 Shear thinning in non-browniansuspensions. Soft matter 14, 879–893.
Chow, Andrea W, Sinton, Steven W, Iwamiya, Joseph H & Stephens, Thomas S 1994Shear-induced particle migration in couette and parallel-plate viscometers: NMR imagingand stress measurements. Physics of Fluids 6 (8), 2561–2576.
Cundall, Peter A & Strack, Otto DL 1979 A discrete numerical model for granularassemblies. geotechnique 29 (1), 47–65.
Dbouk, Talib 2011 Rheology of concentrated suspensions and shear-induced migration. PhDthesis, Universite Nice Sophia Antipolis.
Dbouk, Talib, Lobry, Laurent & Lemaire, Elisabeth 2013 Normal stresses in concentratednon-brownian suspensions. Journal of Fluid Mechanics 715, 239–272.
Ducker, William A, Senden, Tim J & Pashley, Richard M 1992 Measurement of forcesin liquids using a force microscope. Langmuir 8 (7), 1831–1836.
Ecke, Stefan & Butt, Hans-Jurgen 2001 Friction between individual microcontacts. Journalof colloid and interface science 244 (2), 432–435.
Fernandez, Nicolas, Cayer-Barrioz, Juliette, Isa, Lucio & Spencer, Nicholas D 2015Direct, robust technique for the measurement of friction between microspheres. Langmuir31 (32), 8809–8817.
Fernandez, Nicolas, Mani, Roman, Rinaldi, David, Kadau, Dirk, Mosquet,Martin, Lombois-Burger, Helene, Cayer-Barrioz, Juliette, Herrmann, Hans J,Spencer, Nicholas D & Isa, Lucio 2013 Microscopic mechanism for shear thickeningof non-brownian suspensions. Physical review letters 111 (10), 108301.
Gadala-Maria, F & Acrivos, Andreas 1980 Shear-induced structure in a concentratedsuspension of solid spheres. Journal of Rheology 24 (6), 799–814.
Gallier, Stany 2014 Simulation numerique de suspensions frictionnelles. application auxpropergols solides. PhD thesis, Universite Nice Sophia Antipolis.
Gallier, Stany, Lemaire, Elisabeth, Peters, Francois & Lobry, Laurent 2014
28 L. Lobry, E. Lemaire, F. Blanc, S. Gallier and F. Peters
Rheology of sheared suspensions of rough frictional particles. Journal of Fluid Mechanics757, 514–549.
Gallier, Stany, Peters, Francois & Lobry, Laurent 2018 Simulations of sheared densenon-colloidal suspensions: evaluation of the role of long-range hydrodynamics. To bepublished in Phys. Rev. Fluids .
Garland, S, Gauthier, G, Martin, J & Morris, JF 2013 Normal stress measurements insheared non-brownian suspensions. Journal of Rheology 57 (1), 71–88.
Greenwood, JA & Williamson, JBP 1966 Contact of nominally flat surfaces. Proceedings ofthe Royal Society of London. Series A, Mathematical and Physical Sciences 295 (1442),300–319.
Heim, Lars O, Ecke, Stefan, Preuss, Markus & Butt, Hans-Jurgen 2002 Adhesionforces between individual gold and polystyrene particles. Journal of adhesion science andtechnology 16 (7), 829–843.
Li, YQ, Tao, NJ, Pan, J, Garcia, AA & Lindsay, SM 1993 Direct measurement of interactionforces between colloidal particles using the scanning force microscope. Langmuir 9 (3),637–641.
Ling, Xing, Butt, Hans-Jurgen & Kappl, Michael 2007 Quantitative measurement offriction between single microspheres by friction force microscopy. Langmuir 23 (16), 8392–8399.
Mari, Romain, Seto, Ryohei, Morris, Jeffrey F & Denn, Morton M 2014 Shearthickening, frictionless and frictional rheologies in non-brownian suspensions. Journal ofRheology 58 (6), 1693–1724.
Merhi, Dima, Lemaire, Elisabeth, Bossis, Georges & Moukalled, Fadl 2005 Particlemigration in a concentrated suspension flowing between rotating parallel plates:Investigation of diffusion flux coefficients. Journal of Rheology 49 (6), 1429–1448.
Moon, Ji Young, Dai, Shaocong, Chang, Li, Lee, Joon Sang & Tanner, Roger I 2015The effect of sphere roughness on the rheology of concentrated suspensions. Journal ofNon-Newtonian Fluid Mechanics 223, 233–239.
Ness, Christopher & Sun, Jin 2015 Flow regime transitions in dense non-browniansuspensions: Rheology, microstructural characterization, and constitutive modeling.Physical Review E 91 (1), 012201.
Ovcharenko, A, Halperin, G & Etsion, I 2008 Experimental study of adhesive static frictionin a spherical elastic-plastic contact. Journal of Tribology 130 (2), 021401.
Pednekar, Sidhant, Chun, Jaehun & Morris, Jeffrey F 2018 Bidisperse and polydispersesuspension rheology at large solid fraction. Journal of Rheology 62 (2), 513–526.
Peters, Francois, Ghigliotti, Giovanni, Gallier, Stany, Blanc, Frederic, Lemaire,Elisabeth & Lobry, Laurent 2016 Rheology of non-brownian suspensions of roughfrictional particles under shear reversal: A numerical study. Journal of rheology 60 (4),715–732.
Pham, Phong, Metzger, Bloen & Butler, Jason E 2015 Particle dispersion in shearedsuspensions: Crucial role of solid-solid contacts. Physics of Fluids 27 (5), 051701.
Reitsma, Mark, Craig, Vince & Biggs, Simon 2000 Elasto-plastic and visco-elasticdeformations of a polymer sphere measured using colloid probe and scanning electronmicroscopy. International journal of adhesion and adhesives 20 (6), 445–448.
Schaefer, DM, Carpenter, M, Gady, B, Reifenberger, R, Demejo, LP & Rimai,DS 1995 Surface roughness and its influence on particle adhesion using atomic forcetechniques. Journal of adhesion science and technology 9 (8), 1049–1062.
Seto, Ryohei, Giusteri, Giulio G. & Martiniello, Antonio 2017 Microstructure andthickening of dense suspensions under extensional and shear flows. Journal of FluidMechanics 825, R3.
Seto, Ryohei, Mari, Romain, Morris, Jeffrey F & Denn, Morton M 2013 Discontinuousshear thickening of frictional hard-sphere suspensions. Physical review letters 111 (21),218301.
Shafer, J, Dippel, S & Wolf, D 1996 Force schemes in simulations of granular materials. J.Phys. I France 6, 5–20.
Sierou, A & Brady, JF 2002 Rheology and microstructure in concentrated noncolloidalsuspensions. Journal of Rheology 46 (5), 1031–1056.
Shear-thinning in non-Brownian suspensions 29
Silbert, Leonardo E 2010 Jamming of frictional spheres and random loose packing. SoftMatter 6 (13), 2918–2924.
Singh, Abhinendra, Mari, Romain, Denn, Morton M & Morris, Jeffrey F 2018 Aconstitutive model for simple shear of dense frictional suspensions. Journal of Rheology62 (2), 457–468.
Tabor, David 1981 Friction—the present state of our understanding. J. Lubr. Technol 103 (2),169–179.
Tanner, Roger I & Dai, Shaocong 2016 Particle roughness and rheology in noncolloidalsuspensions. Journal of Rheology 60 (4), 809–818.
Tanner, Roger I, Ness, Christopher, Mahmud, Arif, Dai, Shaocong & Moon, Jiyoung2018 A bootstrap mechanism for non-colloidal suspension viscosity. Rheologica Acta pp.1–9.
Vazquez-Quesada, Adolfo, Mahmud, Arif, Dai, Shaocong, Ellero, Marco & Tanner,Roger I 2017 Investigating the causes of shear-thinning in non-colloidal suspensions:Experiments and simulations. Journal of Non-Newtonian Fluid Mechanics .
Vazquez-Quesada, Adolfo, Tanner, Roger I & Ellero, Marco 2016 Shear thinning ofnoncolloidal suspensions. Physical review letters 117 (10), 108001.
Yeo, Kyongmin & Maxey, Martin R 2010a Dynamics of concentrated suspensions of non-colloidal particles in couette flow. Journal of Fluid Mechanics 649, 205–231.
Yeo, Kyongmin & Maxey, Martin R 2010b Simulation of concentrated suspensions usingthe force-coupling method. Journal of computational physics 229 (6), 2401–2421.
Zarraga, Isidro E, Hill, Davide A & Leighton Jr, David T 2000 The characterization ofthe total stress of concentrated suspensions of noncolloidal spheres in newtonian fluids.Journal of Rheology 44 (2), 185–220.
Zou, Yi, Jayasuriya, Sunil, Manke, Charles W & Mao, Guangzhao 2015 Influence ofnanoscale surface roughness on colloidal force measurements. Langmuir 31 (38), 10341–10350.