SHEAR STRENGTH AND BEHAVIOR OF PRESTRESSED CONCRETE BEAMS · Shear Strength and Behavior of...
180
SHEAR STRENGTH AND BEHAVIOR OF PRESTRESSED CONCRETE BEAMS by Alejandro R. Avendaño V. and Oguzhan Bayrak Technical Report: IAC-88-5DD1A003-3 conducted for the Texas Department of Transportation by THE UNIVERSITY OF TEXAS AT AUSTIN September 2008 Investigation performed in cooperation with the Texas Department of Transportation.
Transcript of SHEAR STRENGTH AND BEHAVIOR OF PRESTRESSED CONCRETE BEAMS · Shear Strength and Behavior of...

SHEAR STRENGTH AND BEHAVIOR OF PRESTRESSED
CONCRETE BEAMS
by
Alejandro R. Avendaño V. and Oguzhan Bayrak
Technical Report: IAC-88-5DD1A003-3
conducted for the
Texas Department of Transportation
by
THE UNIVERSITY OF TEXAS AT AUSTIN
September 2008
Investigation performed in cooperation with the Texas Department of Transportation.

ACKNOWLEDGMENTS We greatly appreciate the financial support from the Texas Department of
Transportation that made this project possible. The support of the project
monitoring committee, John Holt, Amy Eskridge and Randy Cox is also very
much appreciated.
DISCLAIMER The contents of this report reflect the views of the authors, who are responsible
for the facts and the accuracy of the data presented herein. The contents do not
necessarily reflect the view of the Federal Highway Administration or the Texas
Department of Transportation. This report does not constitute a standard,
specification, or regulation.
NOT INTENDED FOR CONSTRUCTION,
PERMIT, OR BIDDING PURPOSES
i
Shear Strength and Behavior of Prestressed Concrete Beams
An experimental study was conducted at the Phil M. Ferguson Structural Engineering Laboratory at the University of Texas at Austin to investigate possible shear performance issues for the new family of Tx girders. A comprehensive literature review revealed that similar I-shaped girder sections and Bulb-Tees are prone to fail in a horizontal sliding shear mode, where the bottom flange tends to slide in against the bottom flange-web interface. Due to the increased flange width to web width ratio of the new Tx girders, there is reason to think that the horizontal sliding shear mode can govern the behavior of the Tx girders, compromising the safety margin of current bridge designs. The goals of this project were:
i) to investigate the applicability and conservativeness of current shear design provisions when applied to the Tx girders,
ii) to evaluate the overall shear performance of the Tx28 girder under the worst case scenario service loads, and
iii) to incorporate the results of this experimental program into the University of Texas Prestressed Concrete Shear Database
To achieve these goals, shear tests were conducted on two ends of two full
scale Tx28 girders, resulting in a horizontal sliding shear failure mode in all cases but still yielding conservative results with the use of current shear design provisions from ACI-318 (2008), the AASHTO LRFD Bridge Design Specifications (2007) and the AASHTO Guide for Design and Construction of Segmental Concrete Bridges (Interim 2003).
In the light of the results from this experimental program and several others included in the University of Texas Prestressed Concrete Shear Database, recommendations for current shear design provisions were made.

ii
Table of Contents
CHAPTER 1 INTRODUCTION ............................................................................... 1
1.1 BACKGROUND ................................................................................................ 1
1.2 OBJECTIVES ................................................................................................... 2
1.3 SCOPE ............................................................................................................ 2
1.4 OVERVIEW: CHAPTER OUTLINE ..................................................................... 2
CHAPTER 2 LITERATURE REVIEW ................................................................... 5
2.1 OVERVIEW ..................................................................................................... 5
2.2 RESEARCH ON SHEAR STRENGTH AND BEHAVIOR ......................................... 5
2.2.1 Shahawy and Batchelor (1996) ................................................................. 6
2.2.2 Ma, Tadros and Baishya (2000) ................................................................ 8
2.2.3 Teoh, Mansur and Wee (2002) ............................................................... 10
2.2.4 Hawkins, Kuchma, Mast, Marsh and Reineck (2005) ............................ 12
2.2.5 Hawkins and Kuchma (2007) ................................................................. 15
2.3 CODE PROVISIONS: ACI AND AASHTO ...................................................... 17
2.3.1 ACI 318-08 ............................................................................................. 17
2.3.2 AASHTO-LRFD Bridge Design Specifications 4th Edition (2007) ...... 20
2.3.2.1 General Procedure .......................................................................... 20
2.3.2.2 Simplified Procedure ...................................................................... 24
2.3.3 AASHTO Guide Specifications for Design and Construction of
Segmental Concrete Bridges, 2nd Edition, (Interim 2003) ................................. 25
2.4 EXPERIMENTAL RESULTS DATABASE .......................................................... 27
2.4.1 Database Description .............................................................................. 27
2.5 SUMMARY .................................................................................................... 30
CHAPTER 3 EXPERIMENTAL PROGRAM ...................................................... 33
3.1 OVERVIEW ................................................................................................... 33
3.2 TEST SPECIMEN DETAILS ............................................................................. 33

iii
3.2.1 Tx Girders Sections................................................................................. 33
3.2.2 Prestressing Strand Properties................................................................. 35
3.2.3 Concrete Properties and Mixture Design ................................................ 36
3.2.4 Shear Reinforcement Properties ............................................................. 37
3.2.5 Instrumentation ....................................................................................... 43
3.2.5.1 Temperature Monitoring ................................................................. 44
3.2.5.2 Deflection Measurements ................................................................ 44
3.3 SPECIMEN FABRICATION AND MATCH CURING ............................................ 46
3.3.1 Girder Design and Fabrication ................................................................ 48
3.3.2 Girder Match Curing ............................................................................... 49
3.3.3 Deck Design and Fabrication .................................................................. 51
3.4 SHEAR TESTS ............................................................................................... 54
3.4.1 Shear Test Setup ..................................................................................... 55
3.4.2 Test Specimens: Preliminary Analysis ................................................... 58
3.4.2.1 Web-Shear Cracking Strength ........................................................ 60
3.4.2.2 Flexure-Shear Cracking Strength ................................................... 61
3.4.3 Shear Test Procedure .............................................................................. 63
3.5 SUMMARY .................................................................................................... 63
CHAPTER 4 TEST RESULTS ............................................................................... 65
4.1 OVERVIEW ................................................................................................... 65
4.2 TEST RESULTS ............................................................................................. 66
4.2.1 Tx28-II Shear Test Results ..................................................................... 66
4.2.1.1 Evaluation after Release ................................................................. 66
4.2.1.2 Evaluation at Service Level Shear .................................................. 71
4.2.1.3 Evaluation at Failure ...................................................................... 74
4.2.2 Tx28-I Shear Test Results ....................................................................... 85
4.2.2.1 Evaluation after release .................................................................. 85
4.2.2.2 Evaluation at Service Level Shear .................................................. 89

iv
4.2.2.3 Evaluation at Failure ...................................................................... 93
4.3 SUMMARY .................................................................................................. 100
CHAPTER 5 RECOMMENDATIONS FOR SHEAR DESIGN ....................... 107
5.1 INTRODUCTION .......................................................................................... 107
5.2 EVALUATION OF CURRENT SHEAR DESIGN PROVISIONS FOR STRENGTH ... 107
5.2.1 Effect of shear span-to-depth ratio ........................................................ 108
5.2.2 Effect of concrete strength .................................................................... 111
5.2.3 Effect of transverse reinforcement ........................................................ 114
5.2.4 Effect of overall member depth ............................................................ 118
5.2.5 Shear Design: Prestressed Concrete ...................................................... 122
5.2.6 Recommendations for the shear design provisions of the AASHTO
Guide Specifications for Design and Construction of Segmental Concrete
Bridges, 2nd Edition, 2003 Interim (2003) ....................................................... 124
5.3 MINIMUM SHEAR REINFORCEMENT PROVISIONS ....................................... 128
5.4 MAXIMUM SHEAR REINFORCEMENT PROVISIONS ...................................... 137
CHAPTER 6 SUMMARY AND CONCLUSIONS .............................................. 145
6.1 SUMMARY .................................................................................................. 145
6.2 RECOMMENDATIONS FOR CURRENT DESIGN PROVISIONS ........................... 146
6.3 RECOMMENDATIONS FOR FUTURE INVESTIGATION .................................... 148
APPENDIX A .......................................................................................................... 149
BIBLIOGRAPHY ................................................................................................... 167

v
List of Tables Table 2- 1: Reduced Database Details (Hawkins et al., 2005) .................................. 13 Table 2- 2: Solution for β for sections with at least the minimum amount of shear reinforcement. (AASHTO-LRFD Bridge Design Specifications, 2007) ...................... 22 Table 2- 3: Solution for β for sections without the minimum amount of shear reinforcement. (AASHTO-LRFD Bridge Design Specifications, 2007) ...................... 22 Table 3- 1: Section Properties for new Tx Girders (TxDOT Bridge Division: Prestressed Concrete I-Girder Detail) ....................................................................... 34 Table 3- 2: Concrete Mix Design and Strength Summary .......................................... 37 Table 3- 3: Shear spans used for each test. ................................................................ 56 Table 3- 4: Test Specimen Properties ......................................................................... 59 Table 3- 5: Beam theory vs. layered section analysis ................................................. 63 Table 4- 1: Estimated and experimental shear strength at the critical section for shear tests conducted on specimen Tx28-II ................................................................ 75 Table 4- 2: Estimated and experimental shear strength at the critical section for shear tests conducted on specimen Tx28-I .................................................................. 93 Table 5- 1: Shear Strength Ratio Statistics for all Shear Failures: 367 Tests ......... 123 Table 5- 2: Shear Strength Ratio Statistics for Specimens with transverse reinforcement and overall depth greater than 12 in. : 153 Tests ............................. 123 Table 5- 3: Shear Strength Ratio for two of MacGregor et al. (1960) specimens. ... 125 Table 5- 4: Evaluation of Shear Strength Provisions of AASHTO Segmental Specifications ............................................................................................................ 126
vi
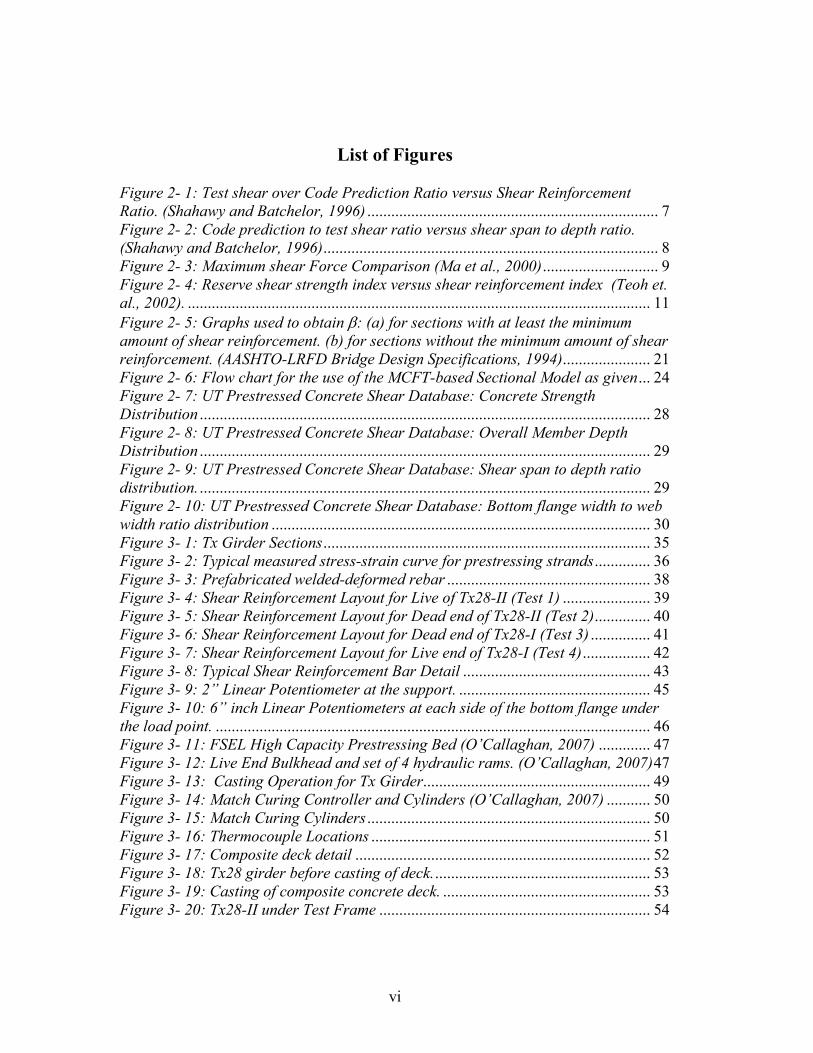
List of Figures Figure 2- 1: Test shear over Code Prediction Ratio versus Shear Reinforcement Ratio. (Shahawy and Batchelor, 1996) ......................................................................... 7 Figure 2- 2: Code prediction to test shear ratio versus shear span to depth ratio. (Shahawy and Batchelor, 1996) .................................................................................... 8 Figure 2- 3: Maximum shear Force Comparison (Ma et al., 2000) ............................. 9 Figure 2- 4: Reserve shear strength index versus shear reinforcement index (Teoh et. al., 2002). .................................................................................................................... 11 Figure 2- 5: Graphs used to obtain β: (a) for sections with at least the minimum amount of shear reinforcement. (b) for sections without the minimum amount of shear reinforcement. (AASHTO-LRFD Bridge Design Specifications, 1994) ...................... 21 Figure 2- 6: Flow chart for the use of the MCFT-based Sectional Model as given ... 24 Figure 2- 7: UT Prestressed Concrete Shear Database: Concrete Strength Distribution ................................................................................................................. 28 Figure 2- 8: UT Prestressed Concrete Shear Database: Overall Member Depth Distribution ................................................................................................................. 29 Figure 2- 9: UT Prestressed Concrete Shear Database: Shear span to depth ratio distribution. ................................................................................................................. 29 Figure 2- 10: UT Prestressed Concrete Shear Database: Bottom flange width to web width ratio distribution ............................................................................................... 30 Figure 3- 1: Tx Girder Sections .................................................................................. 35 Figure 3- 2: Typical measured stress-strain curve for prestressing strands .............. 36 Figure 3- 3: Prefabricated welded-deformed rebar ................................................... 38 Figure 3- 4: Shear Reinforcement Layout for Live of Tx28-II (Test 1) ...................... 39 Figure 3- 5: Shear Reinforcement Layout for Dead end of Tx28-II (Test 2) .............. 40 Figure 3- 6: Shear Reinforcement Layout for Dead end of Tx28-I (Test 3) ............... 41 Figure 3- 7: Shear Reinforcement Layout for Live end of Tx28-I (Test 4) ................. 42 Figure 3- 8: Typical Shear Reinforcement Bar Detail ............................................... 43 Figure 3- 9: 2” Linear Potentiometer at the support. ................................................ 45 Figure 3- 10: 6” inch Linear Potentiometers at each side of the bottom flange under the load point. ............................................................................................................. 46 Figure 3- 11: FSEL High Capacity Prestressing Bed (O’Callaghan, 2007) ............. 47 Figure 3- 12: Live End Bulkhead and set of 4 hydraulic rams. (O’Callaghan, 2007) 47 Figure 3- 13: Casting Operation for Tx Girder ......................................................... 49 Figure 3- 14: Match Curing Controller and Cylinders (O’Callaghan, 2007) ........... 50 Figure 3- 15: Match Curing Cylinders ....................................................................... 50 Figure 3- 16: Thermocouple Locations ...................................................................... 51 Figure 3- 17: Composite deck detail .......................................................................... 52 Figure 3- 18: Tx28 girder before casting of deck. ...................................................... 53 Figure 3- 19: Casting of composite concrete deck. .................................................... 53 Figure 3- 20: Tx28-II under Test Frame .................................................................... 54

vii
Figure 3- 21: Shear Strength Ratio versus Shear span to depth ratio for ACI 318’s Detailed Method (367 Specimens from the University of Texas Prestressed Concrete Database) .................................................................................................................... 55 Figure 3- 22: Typical setup for Shear Tests. .............................................................. 56 Figure 3- 23: Test setup cross section view ................................................................ 57 Figure 4- 1: Tx28-II Live End before Test 1. .............................................................. 67 Figure 4- 2: Tx28-II Dead End before Test 2. ............................................................ 67 Figure 4- 3: End zone instrumentation for Tx Girders (O’Callaghan, 2007) ............ 68 Figure 4- 4: Live end bursting stresses for Tx28-II specimen (O’Callaghan, 2007) . 69 Figure 4- 5: Dead end bursting stresses for Tx28-II specimen (O’Callaghan, 2007) 70 Figure 4- 6: Crack patterns for Tests 1 and 2 on Tx28-II at Service Level Shear. West face is shown. .............................................................................................................. 73 Figure 4- 7: Live end of Tx28-II at Service Level Shear during Test 1. East face is shown. ......................................................................................................................... 74 Figure 4- 8: Dead End of Tx28-II after shear failure of live end in Test 1. East face is shown. ......................................................................................................................... 74 Figure 4- 9: Shear Diagram at failure for Test 1 ....................................................... 76 Figure 4- 10: Shear Diagram at failure for Test 2 ..................................................... 77 Figure 4- 11: Live end of Tx28-II at failure for Test 1. .............................................. 79 Figure 4- 12: Dead end Tx28-II at failure for Test 2. ................................................ 80 Figure 4- 13: Live end of Tx28-II after Test 1. ........................................................... 81 Figure 4- 14: Dead end of Tx28-II after Test 2. ......................................................... 81 Figure 4- 15: Strand Slip at the dead end of Tx28-II after failure of girder in Test 2...................................................................................................................................... 82 Figure 4- 16: Splitting through the bottom flange at the dead end of Tx28-II after failure of girder (Test 2). ............................................................................................ 83 Figure 4- 17: Load-Deflection Curves for tests 1 and 2 on Tx28-II. .......................... 84 Figure 4- 18: Tx28-I dead end before Test 3. ............................................................. 85 Figure 4- 19: Tx28-I live end before Test 4. ............................................................... 86 Figure 4- 20: Live end bursting stresses for Tx28-I specimen (O’Callaghan, 2007). 87 Figure 4- 21: Dead end bursting stresses for Tx28-I specimen (O’Callaghan, 2007) 88 Figure 4- 22: Crack patterns for Tests 3 and 4 on Tx28-I at Service Level Shear. West face is shown. .............................................................................................................. 90 Figure 4- 23: Dead End of Tx28-I at Service Level Shear for Test 3 East Face is shown. ......................................................................................................................... 91 Figure 4- 24: Live End of Tx28-I at Service Level Shear for Test 4 East Face is shown. ......................................................................................................................... 91 Figure 4- 25: Comparison of cracks caused by applied load at service level shear for tests 1 and 3 (Release cracks are not shown) ............................................................. 92 Figure 4- 26: Shear Diagram at failure for Test 3 ..................................................... 94 Figure 4- 27: Shear Diagram at failure for Test 4 ..................................................... 95 Figure 4- 28: Dead end of Tx28-I at failure for Test 3. .............................................. 97 Figure 4- 29: Live end of Tx28-I at failure for Test 4. ............................................... 97

viii
Figure 4- 30: Dead end of Tx28-I after Test 3............................................................ 98 Figure 4- 31: Live end of Tx28-I after Test 4. ............................................................ 98 Figure 4- 32: Load-Deflection curves for tests 3 and 4 on Tx28-I. ............................ 99 Figure 4- 33: Load-Deflection curve for all tests. .................................................... 100 Figure 4- 34: Shear strength: Estimations vs. Experiments ..................................... 101 Figure 4- 35: Shear strength ratio comparison for all tests. .................................... 101 Figure 4- 36: Cracking shear: Estimates vs. Experiments ...................................... 102 Figure 4- 37: Experimental to estimated cracking shear ratio ................................ 103 Figure 4- 38: Cracking shear to nominal and maximum shear comparison for all tests. .......................................................................................................................... 104 Figure 4- 39: Maximum shear stress ratio for all tests. ........................................... 106 Figure 5- 1: Shear Strength Ratio versus shear span-to-depth ratio for different design code provisions. ............................................................................................. 109 Figure 5- 2: Shear Strength Ratio versus concrete strength for different design code provisions. ................................................................................................................. 112 Figure 5- 3: Shear Strength Ratio versus transverse reinforcement index for different design code provisions. ............................................................................................. 116 Figure 5- 4: Shear Strength Ratio versus overall height for different design code provisions. ................................................................................................................. 120 Figure 5- 5: Shear Strength Ratio for members with flexural tension cracks: AASHTO Segmental Specifications with and without the limit on K and '
cf . ...................... 127 Figure 5- 6: Cracking to Strength Ratio versus shear reinforcement index............. 130 Figure 5- 7: Reinforcing bar Details used in Kaufman and Ramirez’s Specimens. (Kaufman and Ramirez, 1988) .................................................................................. 131 Figure 5- 8: Crack Strength Ratio versus shear reinforcement index to root of the concrete strength ratio. ............................................................................................. 133 Figure 5- 9: Most detailed approach to minimum shear reinforcement evaluation . 136 Figure 5- 10: Ratio of AASHTO LRFD maximum allowed shear strength to equivalent ACI 318 limit. .......................................................................................... 138 Figure 5- 11: Cracking Strength to Nominal shear strength ratio versus Shear Reinforcement Strength to Concrete Shear Strength Ratio for ACI 318 Detailed Method ...................................................................................................................... 140 Figure 5- 12: Crack Strength to Nominal shear strength ratio versus Shear Reinforcement Strength to Concrete Shear Strength Ratio for AASHTO LRFD Simplified Procedure ................................................................................................ 141 Figure 5- 13: Histogram for dbfV wcc
'/ for 506 tests. ........................................... 142
1
CHAPTER 1 Introduction
1.1 BACKGROUND
Prestressed concrete girder bridges are popularly used in the state of Texas and many other states. In the last 25 years, the use and availability of high strength concretes have increased significantly. Additionally, the use of 0.6 inch diameter prestressing strands is now widely accepted. Since the 1960s major changes in strand manufacturing permitted the fabrication of low relaxation strands and the ultimate strength of strands have first increased from 250 ksi to 270 ksi and recently 300 ksi strands have entered the market place. Given that typical AASHTO and TxDOT I-girder sections’ geometries are more than 40 years old, the advantages of the use of high strength concrete and larger diameter strands are limited by the use of outdated I girder cross sections. This fact motivated the Texas Department of Transportation to develop a new family of prestressed concrete girders to make best use of currently available materials and construction practices. The new flexurally-optimized geometry of the Tx girders allows for a larger quantity of strands to be placed in the bottom flange, allowing shallower beams to span longer distances. Wide top flanges and efficient geometries allow for maximizing beam spacing and eliminating a beam line in some cases.
Current theoretical knowledge of flexural behavior of concrete beams allows for accurate estimations of member’s strength and behavior. This is not the case for shear strength and behavior. The bases for current shear design provisions are vastly different from one design specification to another.
In some cases, provisions are based on beam theory, with some elementary assumptions made in order to simplify expressions. This group of provisions holds little theoretical justification once sections are cracked and therefore, their acceptance is solely based on their conservativeness for a pool of tests, making them empirically justified.
In some other cases, provisions are based on some material models developed in an effort to characterize the mechanical properties of cracked concrete. These so called “theoretically-justified” approaches still owe their formulation to an empirical determination of the material model, making them in effect, empirical provisions as well. Furthermore, resulting material models are often complicated and have to be simplified in order to make them accessible and understandable to the structural designers, making them drift away from their “theoretical” base.

2
Although different arguments have been presented over the years supporting or highlighting the weaknesses of different design provisions, the fact is that none of the design provisions provides all the answers to completely and accurately predict shear strength and behavior of prestressed concrete members.
Hence, experimental evaluation of shear strength and behavior of new section geometries, such as the new Tx Girders, is invaluable for a proper and responsible assessment of their performance.
1.2 OBJECTIVES
With the introduction of the new flexurally-optimized geometry of the Tx girders, several questions arose regarding the shear behavior of this sections. To answer the most relevant questions, an Interagency Testing Contract was funded by the Texas Department of Transportation. Testing was performed at the Phil M. Ferguson Structural Engineering Laboratory in the University of Texas at Austin. The main goals of this investigation were i) to investigate the applicability and conservativeness of current shear design provisions when applied to the Tx girders, ii) to evaluate the overall shear performance of the Tx28 girder under the worst case scenario service loads and iii) to incorporate the results of this experimental program into the University of Texas Prestressed Concrete Shear Database
1.3 SCOPE
After a comprehensive examination of the available literature regarding shear strength and behavior of prestressed concrete beam elements, the University of Texas Prestressed Concrete Shear Database was expanded to include a total of 506 tests. Recent publications were studied to identify problematic shear issues reported for sections of similar characteristics to the new Tx girders. The experimental program consisted of shear tests on two ends of two full scale Tx28 girders. Conservativeness of shear strength estimations for the Tx28 girders was evaluated for three different sets of design provisions: a) the ACI 318-08 Building Code Requirements for Structural Concrete, b) AASHTO LRFD Bridge Design Specifications (2007) and c) AASHTO Guide Specifications for Design and Construction of Segmental Concrete Bridges (2003).
1.4 OVERVIEW: CHAPTER OUTLINE
Chapter 2 includes reviews of recent research programs in the area of shear in prestressed concrete beam elements where beam geometries were similar to the new Tx girders. This review revealed important shear related issues in the performance of I-shaped girders and Bulb-Tees. Current shear design provisions of ACI 318-08 Building Code Requirements for Structural Concrete (2008), AASHTO LRFD Bridge

3
Design Specifications (2007) and AASHTO Guide Specifications for Design and Construction of Segmental Concrete Bridges (2003) were reviewed as well. Finally, a description of the tests included in the University of Texas Prestressed Concrete Shear Database is presented.
The experimental program is presented in Chapter 3. Details of the materials used including specifications for nominal strength and measured mechanical properties are presented. Instrumentation used during fabrication and during the shear tests is described. Fabrication procedure for the full scale Tx girders is outlined and finally, details of the shear test setup, specimen properties and test procedure are presented.
Chapter 4 presents the results of the experimental program. Evaluation of test specimens after prestress transfer is briefly discussed, followed by the evaluation of the girder performance under service loads and at failure. Conservativeness of three different shear design provisions reviewed in Chapter 2 is evaluated and some recommendations for the use of these design provisions for the Tx28 girders are made.
Chapter 5 evaluates the performance of current shear design provisions for shear strength estimations of tests included in the University of Texas Prestressed Concrete Shear Database. The effect of shear span-to-depth ratio, concrete strength, web reinforcement and overall member depth on current shear design provisions is studied. Specific recommendations for shear design provisions are made regarding limits to concrete contribution to shear strength, the required minimum amount of shear reinforcement, strength reduction factors, concrete strength limitations and the maximum permissible nominal strength.
Chapter 6 presents a summary of the work performed and the conclusions of the work conducted in this research program.

4

5
CHAPTER 2 Literature Review
2.1 OVERVIEW
Current code provisions regarding shear strength of prestressed members have been evaluated extensively through research over the years. Nevertheless, the applicability of some of those provisions to common bridge members is often questioned. The fact is that designing test specimens and conditions to resemble actual field conditions is not a simple or economical task. Typical test specimens utilized in most of the experimental investigations are small (depth under 24 inches), simply supported, subjected to concentrated loads and built with normal concrete strengths (around 6,000 psi). Conversely, typical bridge girders can easily be twice as deep as those tested in laboratories and have concrete strengths that easily exceed 10,000 psi. Furthermore, most of the time bridge girders will have a composite deck on top, which can potentially change the behavior of the section. In order to reconcile differences between common bridge girders and overly-simplified test specimens, a few research projects have been conducted in an effort to contribute to the pool of results of full scale specimens with high strength concretes and composite decks on top. These experimental studies sought to validate the applicability of current design provisions and improve them when/if it is appropriate.
Recent and relevant publications, investigating the shear strength and behavior of prestressed concrete members leading up to the current research project are reviewed in the subsequent sections of this chapter. In addition, the results of shear tests conducted between 1954 and 2008 are presented in this chapter. All of the previous shear tests are compiled in a comprehensive database in an effort to put the results of the current test program in perspective.
2.2 RESEARCH ON SHEAR STRENGTH AND BEHAVIOR
A historical review of shear provisions included in building and bridge design specifications was previously prepared by Ramirez and Breen (1983). In addition, Hartmann, Breen and Kreger (1988) conducted an experimental study to evaluate the code provisions relevant to shear strength of bridge elements in 1988. Therefore, we will focus our attention on documents published after 1988, allowing us to discuss some issues related to the AASHTO-LRFD Bridge Design Specifications, introduced in 1994. References will be made to previous work, where appropriate, to provide important background information while trying to keep this review as concise as possible.

6
2.2.1 Shahawy and Batchelor (1996)
Shahawy and Batchelor made one of the single largest contributions to the prestressed concrete shear database. The researchers tested two ends of 20 specimens yielding 40 tests. Of their tests, 24 resulted in shear failures and 16 in flexural failures. The length of the AASHTO Type II pretensioned girders (36 inches deep) ranged between 21 ft and 41 ft. The compressive strength of pretensioned girders was around 6,000 psi. All test specimens had composite decks (8 in thick by 42 in wide) added on top, and shear spans ranged between 1.3 and 3.5. The amount of shear reinforcement was a key variable. While some test specimens contained no web reinforcement others contained three times the amount required by design. The researchers evaluated the conservativeness of the shear strength provisions of ACI318-95 (equivalent to AASHTO Standard Specification for Highway Bridges) and the, at the time newly introduced, AASHTO-LRFD Bridge Design Specification of 1994.
Several conclusions rose from Shahawy and Batchelor’s work. The researchers found specific trends when plotting the “Test Shear over LRFD Prediction ratio” versus “shear reinforcement ratios” (provided shear reinforcement to required shear reinforcement ratio) for specimens failing in shear (Figure 2- 1). Figure 2- 1 clearly illustrates that the AASHTO LRFD Specifications overestimated the strength of beams with large amounts of shear reinforcement. There is agreement in the engineering community behind the idea that excessive amounts of shear reinforcement seize to contribute to the overall shear strength of members as crushing of diagonal compression struts starts to occur. However, there is still no agreement as to what the upper limit of the shear strength should be in order to prevent concrete crushing. It should be noted that, for most cases where the AASHTO LRFD Code prediction was not conservative, the design strength was governed by the upper limit established by the code. It is interesting to note that while crushing of diagonal struts establish the basis of “maximum permissible shear force or stress” of AASHTO LRFD specifications, strand-slip and horizontal shear failure at bottom flange to web interface was the governing failure mode in most of their tests.
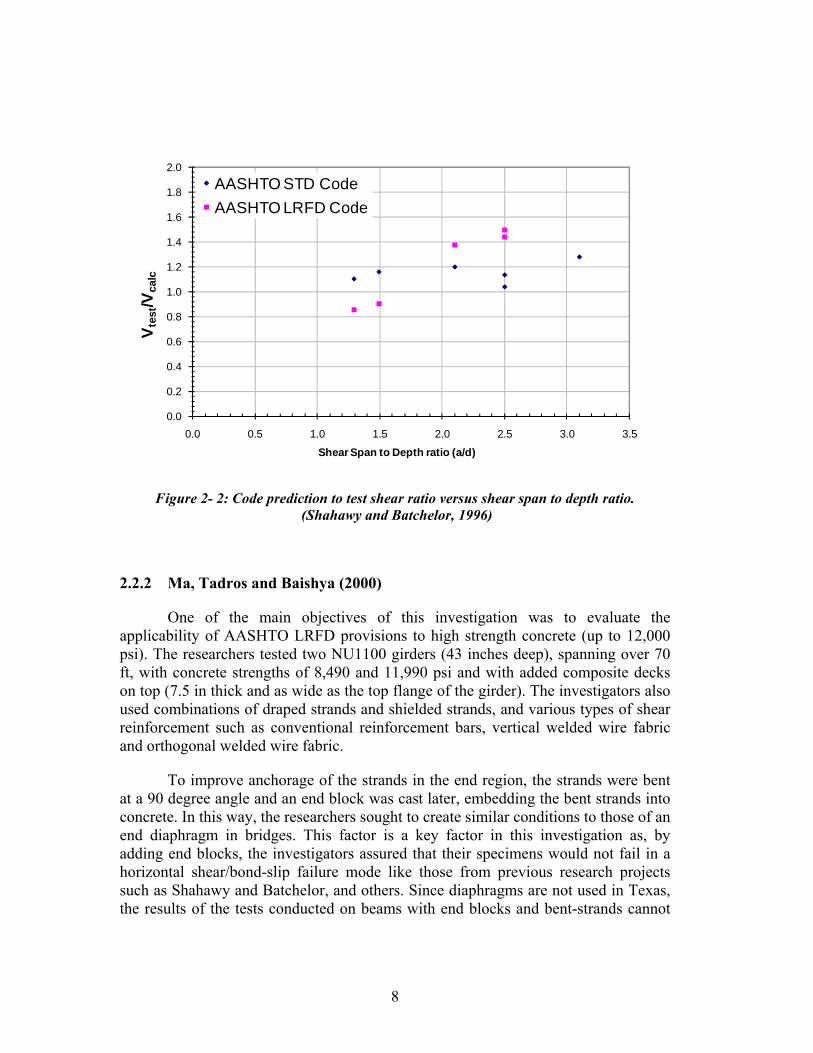
Trends were also found when comparing the shear strength ratio versus the shear span to depth ratio as can be seen in Figure 2- 2. Shahawy and Batchelor concluded that the LRFD Code underestimated the shear strength for shear spans of 2.0 and above and this can result in designs where unnecessary shear reinforcement is provided towards the middle of the span.

7
0.0
0.5
1.0
1.5
2.0
2.5
3.0
3.5
0 0.5 1 1.5 2 2.5 3 3.5
V tes
t/Vca
lc
Shear Reinforcement Ratio (xR)
(a) AASHTO STD Code
xR = 2 represents a beam provided with twice the amount of shear reinforcement required
0.0
0.5
1.0
1.5
2.0
2.5
3.0
3.5
0 0.5 1 1.5 2 2.5 3 3.5
V tes
t/Vca
lc
Shear Reinforcement Ratio (xR)
(b) AASHTO LRFD Code
xR = 2 represents a beam provided with twice the amount of shear reinforcement required
Figure 2- 1: Test shear over Code Prediction Ratio versus Shear Reinforcement Ratio. (Shahawy and Batchelor, 1996)
8
0.0
0.2
0.4
0.6
0.8
1.0
1.2
1.4
1.6
1.8
2.0
0.0 0.5 1.0 1.5 2.0 2.5 3.0 3.5
V tes
t/Vca
lc
Shear Span to Depth ratio (a/d)
AASHTO STD CodeAASHTO LRFD Code
Figure 2- 2: Code prediction to test shear ratio versus shear span to depth ratio. (Shahawy and Batchelor, 1996)
2.2.2 Ma, Tadros and Baishya (2000)
One of the main objectives of this investigation was to evaluate the applicability of AASHTO LRFD provisions to high strength concrete (up to 12,000 psi). The researchers tested two NU1100 girders (43 inches deep), spanning over 70 ft, with concrete strengths of 8,490 and 11,990 psi and with added composite decks on top (7.5 in thick and as wide as the top flange of the girder). The investigators also used combinations of draped strands and shielded strands, and various types of shear reinforcement such as conventional reinforcement bars, vertical welded wire fabric and orthogonal welded wire fabric.
To improve anchorage of the strands in the end region, the strands were bent at a 90 degree angle and an end block was cast later, embedding the bent strands into concrete. In this way, the researchers sought to create similar conditions to those of an end diaphragm in bridges. This factor is a key factor in this investigation as, by adding end blocks, the investigators assured that their specimens would not fail in a horizontal shear/bond-slip failure mode like those from previous research projects such as Shahawy and Batchelor, and others. Since diaphragms are not used in Texas, the results of the tests conducted on beams with end blocks and bent-strands cannot

9
be directly applied to Texas bridges and bridge design practices. Additionally, for one of the test specimens (specimen A) an end region was cut after the test and a fifth test was conducted on this new end region without an end block. This test represents the conditions in which no end diaphragm is used -such as prestressed concrete bridges in Texas.
For all of the four test regions with end blocks the maximum shear carried by test specimens exceeded the shear strength estimations obtained through the use of the AASHTO Standard Specification (practically equivalent to ACI 318) and the AASHTO LRFD Specifications. Figure 2- 3 illustrates the comparison between the strength estimations obtained by using AASHTO Standard and AASHTO LRFD and the shear forces calculated at failure. The conservativeness of the upper limits imposed by both codes can be observed in Figure 2- 3.
323
330
510
510
348 370
533
762
629
593
590
46054
5
536
536
545
277 304
301
301
304
280
(Not
repo
rted)
312
(Not
repo
rted)
>820
506
(Vp i
s in
clud
ed)
0
100
200
300
400
500
600
700
800
900
AR05908X AVW14408X BVW20408X BOW20408X AVW14608Y(Not in original
plot)
Shea
r (ki
ps)
Vn Predicted by AASHTO Standard Vn Predicted by AASHTO LRFDExperimental Shear at Failure EQ1EQ dbf wc
'12vwc dbf '25.0
Figure 2- 3: Maximum shear Force Comparison (Ma et al., 2000)
One observation that could be missed by the reader is that for the fifth test (Specimen AVW14608Y), where the end region had no end block, the maximum applied shear (459.86 kips) did not reach the upper limit imposed by the AASHTO LRFD Specification (545 kips) suggesting that a lower maximum shear strength limit should be used in cases where bond-slip and horizontal shear at bottom flange to web

10
interface may occur. Ma et al. called this failure mode shear bond failure. Despite the “shear bond failure” of this specimen, strength predictions by both AASHTO design specifications resulted in conservative estimates.
2.2.3 Teoh, Mansur and Wee (2002)
The research presented by Teoh, Mansur and Wee (2002) dealt with the adequacy of the minimum shear reinforcement requirements defined by various codes, including ACI 318-99, 1994 version of the Canadian code, 1997 version of the British code and the 1994 version of the Australian code.
In their research program, several approaches were taken in order to find appropriate criteria for the determination of a minimum amount of shear reinforcement. Ultimately, Teoh et al. used the minimum reserve shear strength index approach previously proposed by Johnson and Ramirez (1989). In this context, the minimum reserve shear strength index, can be taken as the ratio of the ultimate shear stress over shear cracking stress ( cu νν / ). The researchers followed through the proposal of Ozcebe, Ersoy and Tankut (1999) and used a value of 1.3 for the minimum reserve strength index. In this way, Teoh et al. found a trend when comparing the reserve strength index versus the Vs/Vc,ACI ratio as can be seen in
Figure 2- 4.

11
Figure 2- 4: Reserve shear strength index versus shear reinforcement index (Teoh et. al., 2002).
Based on this, the authors proposed that the minimum shear reinforcement shall be given by:
ACIcs VV ,min, 35.0= Equation 2- 1
or df
sVA
yv
ACIcv
⋅= ,
min,
35.0 Equation 2- 2
Assuming a minimum concrete shear strength of dbf wc'2 , Equation 2-2 can
be rewritten as follows:
12
yt
wcv f
sbfA
⋅=
'
min,
70.0 Equation 2- 3
The expression given in Equation 2-3 is very similar to one of the current minimum shear reinforcement requirements of ACI 318-08 shown in Equation 2-4:
yt
wcv f
sbfA
⋅=
'
min,
75.0 Equation 2- 4
It will be shown in chapter 5 that a similar approach can be used to define the upper limit on the amount of shear that can be carried by a prestressed concrete beam with shear reinforcement.
2.2.4 Hawkins, Kuchma, Mast, Marsh and Reineck (2005)
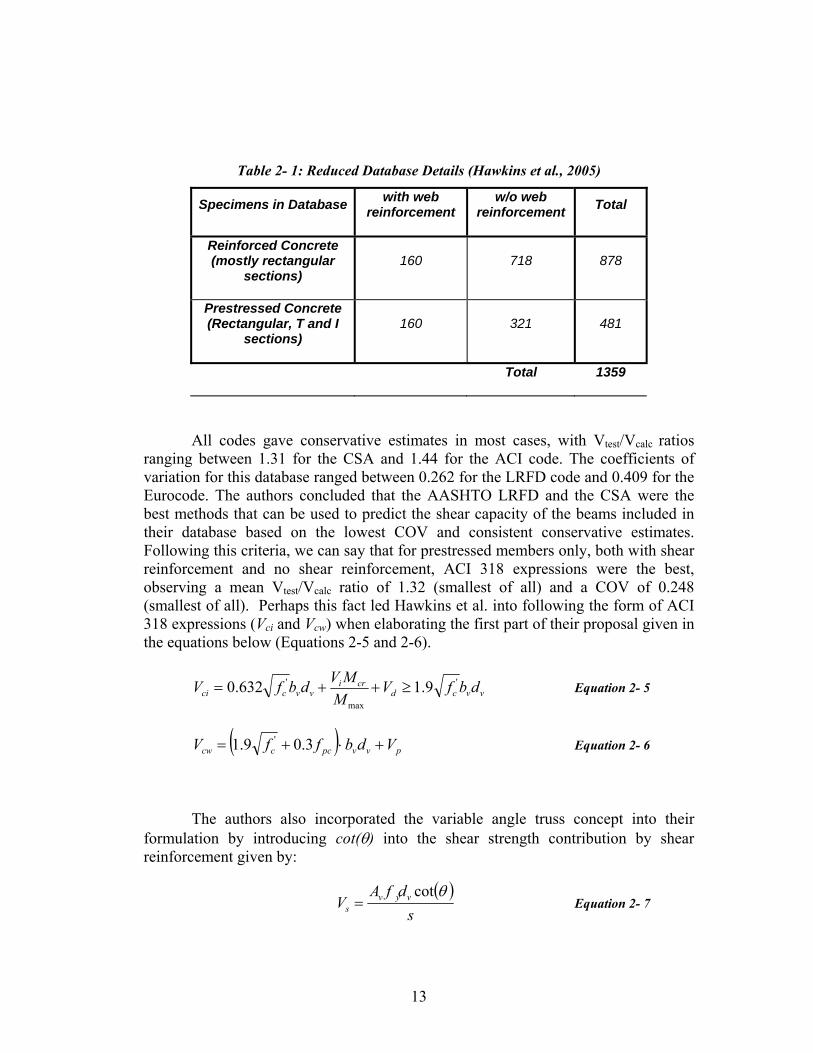
As part of a National Cooperative Highway Research Program (NCHRP) research project (NCHRP Project 12-61, Report 549), Hawkins et al. developed a shear design procedure applicable for both reinforced and prestressed concrete members. This effort was intended to supplement the Modified Compression Field Theory (MCFT) based shear design procedure found in AASHTO LRFD Bridge Design Specifications with a simpler method. The authors gathered a large database of shear tests on reinforced and prestressed concrete members and measured the accuracy of predictions made with the ACI Code (ACI-318-02), the AASHTO LRFD Specifications (2002), the Canadian Code (CSA-1994), the Japanese Code (JSCE-1986), the Eurocode 2 (EC2-1991) and the German Code (DIN-2001). The database used for this evaluation consisted of 1,359 tests, mostly simply supported and over 80% of specimens had depths of less than 20 inches. Details of their database are shown in Table 2- 1. It should be noted that this database excluded specimens where significant arch action or flexural failures occurred. The original database included more than 2,000 test results.
13
Table 2- 1: Reduced Database Details (Hawkins et al., 2005)
Specimens in Database with web reinforcement
w/o web reinforcement Total
Reinforced Concrete (mostly rectangular
sections) 160 718 878
Prestressed Concrete (Rectangular, T and I
sections) 160 321 481
Total 1359
All codes gave conservative estimates in most cases, with Vtest/Vcalc ratios ranging between 1.31 for the CSA and 1.44 for the ACI code. The coefficients of variation for this database ranged between 0.262 for the LRFD code and 0.409 for the Eurocode. The authors concluded that the AASHTO LRFD and the CSA were the best methods that can be used to predict the shear capacity of the beams included in their database based on the lowest COV and consistent conservative estimates. Following this criteria, we can say that for prestressed members only, both with shear reinforcement and no shear reinforcement, ACI 318 expressions were the best, observing a mean Vtest/Vcalc ratio of 1.32 (smallest of all) and a COV of 0.248 (smallest of all). Perhaps this fact led Hawkins et al. into following the form of ACI 318 expressions (Vci and Vcw) when elaborating the first part of their proposal given in the equations below (Equations 2-5 and 2-6).
vvcdcri
vvcci dbfVM
MVdbfV '
max
' 9.10.632 ≥++= Equation 2- 5
( ) pvvpcccw VdbffV +⋅+= 3.09.1 ' Equation 2- 6
The authors also incorporated the variable angle truss concept into their formulation by introducing cot(θ) into the shear strength contribution by shear reinforcement given by:
( )s
dfAV vyv
s
θcot= Equation 2- 7
14
where:
( ) 8.1095.00.1cot'
≤+=c
pc
f
fθ Equation 2- 8
and
( ) 0.1cot =θ in flexure-shear regions
By setting the upper limit of 1.8 on cot(θ), a minimum crack angle of 30 degrees is set. Crack angles as low as 18 degrees (cot(18°) = 3.08) can be obtained by using the MCFT based approach defined in the AASHTO LRFD Specifications.
This proposal was not compared to the 1359 specimen database. Instead, it was compared to a selected database consisting of 83 prestressed concrete members and 64 reinforced concrete members. All members had depths of at least 20 inches, contained at least the minimum amount of shear reinforcement established in accord with ACI 318 provisions. Specimens with concrete strengths below 4,000 psi were excluded from their analysis. This part of their proposal was adopted by AASHTO and included in the 2007 LRFD Specifications.
Regarding the upper limit for the nominal shear capacity, the proposed changes to the AASHTO LRFD Specifications presented in NCHRP Report 549 did not include a change to this provision (Equation 2-9). However, Hawkins et al. suggested that, based on the results that would be later published in NCHRP Report 579, the change proposals included in NCHRP Report 549 should be accompanied by a lower limit as given in Equation 2-10.
Upper limit in the AASHTO LRFD Specifications (2007):
pvvcsc VdbfVV +≤+ '25.0 Equation 2- 9
Suggested upper limit:
pvvcsc VdbfVV +≤+ '18.0 Equation 2- 10
where Vc is the lesser of Vci and Vcw.
The second part of their proposal was not adopted by AASHTO. In that part of their study, the MCFT based procedure was modified to include the CSA

15
expressions for estimating β, θ and εx. If the new equations were adopted, the MCFT-based shear design procedure of AASHTO LRFD would have been simplified by eliminating iterations. The CSA expressions are as follows:
( ) ( )xex s++=
3951
150018.4
εβ for members with Av < Av,min Equation 2- 11
( )xεβ
150018.4
+= for members Av ≥ Av,min Equation 2- 12
xεθ 700029 += Equation 2- 13
( )pspss
popoppuuvux AEAE
fAVVNdM+
−−++=
25.0/ φ
ε Equation 2- 14
2.2.5 Hawkins and Kuchma (2007)
The main purpose of Hawkins and Kuchma’s research published in NCHRP Report 579, was to investigate the applicability of AASHTO-LRFD shear design specifications to high strength concrete (concrete strengths up to 18,000 psi). In addition, Hawkins and Kuchma carried out a comprehensive examination of a shear database with 1,874 test results (1,287 Reinforced Concrete and 587 Prestressed Concrete) in an effort to point out problematic areas where more research is needed.
Hawkins and Kuchma analyzed how the shear strength ratio (Vtest/VLRFD) varied with respect to several factors such as concrete strength, ultimate shear stress, compliance with minimum shear reinforcement requirements, overall member height and percentage of longitudinal reinforcement. The investigation of the shear strength ratio versus the ultimate shear stress is of special interest given the current disagreement in the engineering community and design codes regarding appropriate upper limits for the maximum shear strength of prestressed concrete members.
After examining the database of existing tests, Hawkins and Kuchma tested both ends of 10 specimens resulting in a total of 20 tests. 50-ft-long bulb tees tested by Hawkins and Kuchma were 63 in. deep. 10 inch thick decks as wide as the top flanges of the test specimens were added to all specimens. Concrete strength ranged between 10 ksi and 18 ksi and varying amounts of shear reinforcement were used in the test specimens. The pretensioned bulb tees tested in their study contained 26 to

16
42 straight strands combined with 0 to 8 draped strands. The researchers also studied the effects of the staggered shear design methodology on the structural performance of the beams. Some of the conclusions reached by Hawkins and Kuchma can be summarized as follows:
• Both shear design procedures given in the AASHTO LRFD Bridge Design Specifications (MCFT based procedure and the simplified procedure as presented in NCHRP Report 549) can be safely used for design of concrete members with concrete strengths up to 18 ksi (at the time, the AASHTO-LRFD Code limited the concrete strength to 10 ksi).
• The minimum shear reinforcement requirements of the LRFD Code are adequate for concrete strengths up to 18 ksi.
• The maximum shear stress limit should be reduced from pcf ν+'25.0 to
pcf ν+'18.0 unless the end region is designed by strut and tie procedures or the end of the member is built integrally into its support.
Current maximum shear strength limits, both ACI’s dbf wc'8 limit on Vs and
AASHTO-LRFD’s limit of pvc Vdbf +⋅⋅'25.0 on Vn, are intended to prevent failure of diagonal struts that form in the web. Many specimens tested in shear have failed prior to reaching “ pvc Vdbf +⋅⋅'25.0 ”. In most of the tests where failure occurred
prior to a shear stress level of '25.0 cf , crushing of diagonal struts was not observed but, instead shear-slip failures or bond-slip failures were reported. In strut and tie terms, these specimens failed by insufficient anchorage in the CCT node located at the support. Conversely, specimens that performed satisfactorily above the
pvc Vdbf +⋅⋅'25.0 limit are those that included either end blocks, end diaphragms or some other special anchorage devices or mechanism. This fact is of special concern for the current investigation given the fact that Texas’ new family of prestressed girders (Tx girders) will be used in conditions where no special anchorage mechanism is used. Therefore, bond-slip or shear-slip failures are a real possibility near the end regions. In addition, an unconservative upper limit on the shear strength of members can exacerbate serviceability issues. By allowing large amounts of shear reinforcement to be used and hence making the contribution of shear reinforcement (Vs) a larger part of the total shear strength, it is possible to have significant shear cracks under service loads. Hawkins and Kuchma suggested that the designer should use alternative methods, such as the Vci and Vcw approach from the NCHRP Report 549, to evaluate if the section is cracked under service loads. They also proposed a modification of the Vcw equation previously proposed in the NCHRP Report 549. Their modified Vcw equation is shown in Equation 2-14.
17
( ) pvvpccCW VdbffV +⋅+= 3.016.3 ' Equation 2- 15
It should be noted that, even before the introduction of the AASHTO-LRFD Specifications, Hartmann et al (1988) found that shear capacities estimated with the AASHTO Standard Specifications or ACI 318 Provisions became unsafe once Vs reached about '3.19 cf . The compressive strength of concrete for Hartmann et al.’s
specimens were around 10,800 psi, and thus '3.19 cf is equivalent to '19.0 cf . The
concrete contribution for Hartmann et al.’s specimens was equivalent to '08.0 cf . Therefore, based on Hartmann’s work on specimens with end blocks, an upper limit of '27.0 cf could be justified. The ratio of the cracking load to the failure load for Hartmann et al.’s specimens was around 32%. Such a low ratio of cracking load to ultimate load may lead to diagonal cracks under service loads particularly for dead load dominated designs.
Based on the results of Hawkins and Kuchma’s tests, the researchers also recommended that the staggered shear design methodology be removed from the commentary of the AASHTO LRFD Specifications as it yielded unsafe results near the end regions of their test specimens.
2.3 CODE PROVISIONS: ACI AND AASHTO
2.3.1 ACI 318-08
The ACI 318 design equations for estimating concrete contribution to the shear strength of prestressed concrete members date back to 1963. In ACI 318’s so called detailed method, first introduced in 1963, the concrete contribution to shear strength (Vc) has to be taken as the lesser of the shear needed to transform a flexural crack into a diagonal crack (Vci) and the shear needed to form diagonal tension cracks in the web of the member (Vcw). The concrete contribution to shear strength (Vc) need not to be taken less than pwc dbf '7.1 . The effective depth of shear area (dp) is defined as the distance from the extreme compression fiber to the centroid of the prestressing steel and that distance need not be taken less than 0.8h where h is the overall depth of the member. The equations of this method are as follows:
The total Shear Capacity:

18
scn VVV += Equation 2- 16
Vc is the lesser of Vci and Vcw given by:
pwcdMAX
CREipwcci dbfV
MMVdbfV '' 7.16.0 ≥++= Equation 2- 17
( ) ppwpcccw VdbffV +⋅+= 3.05.3 ' Equation 2- 18
where: Vci = Shear that causes flexure-shear cracks (lb)
'cf = Concrete strength (psi)
bw = minimum width of web of a flanged member (in)
dp = distance from the extreme compression fiber to the centroid of tension reinforcement and needs not to be taken less than 80% of the total height of the section (h)
Vi = Ultimate Shear minus dead load shear
MCRE = Cracking Moment minus dead load moment given by ( )( )dpectCRE fffyIM −+= '6/ Equation 2- 19
MMAX = Ultimate Moment minus dead load moment
Vd = Dead load shear
I = Moment of Inertia of the section resisting external loads
yt = Distance from the centroid of the section to the extreme tension fiber
fpe = Stress at the extreme tension fiber due to prestressing force after all losses
fd = Stress at the extreme tension fiber due to dead load
fpc = Stress at the centroid of the section resisting external loads, due to prestressing force after all losses

19
Vp = Vertical component of the force in the prestressing strands
Although this approach is based on principles from classic elasticity and beam theory, it is considered an empirical approach since it does not explain the mechanism through which shear is resisted once the section has cracked. Regardless, it has been accepted as a practical and safe solution for shear design of prestressed members because it yields reasonable results when compared to experimental data. The initial database to which this method was calibrated consisted of small specimens (6 to 12 inches deep) with concrete strengths below 6,000 psi. However, over the course of time, several researchers have found that conservative estimates are obtained for larger members with higher concrete strengths as well. The ability of the detailed method to predict cracking shear, along with its relative simplicity, is one of the reasons it is found appealing by designers.
MacGregor and Hanson (1969) suggested a simpler method for estimating concrete contribution to shear strength. This method has been found even more conservative than the detailed method but does not serve as a tool for predicting cracking shear. The simple method suggested by MacGregor and Hanson (1969) is included in ACI 318 and is given in Equation 2-20:
dbM
dVfV w
u
pucc ⎟⎟
⎠
⎞⎜⎜⎝
⎛+= 7006.0 ' Equation 2- 20
The ACI 318 expression for shear reinforcement contribution to shear strength (Vs) is based on a 45 degree truss model like the one suggested by Ritter (1899). Although many argue that smaller angles could be more accurate, the 45° truss model results in a conservative estimate by minimizing the amount of stirrups that cross a diagonal crack. Where shear reinforcement perpendicular to the longitudinal axis of the element is used, the shear reinforcement contribution to shear strength can be estimated as:
sdfA
V ytvs = Equation 2- 21
This contribution is limited in the ACI Code and AASHTO Standard Specifications to pwc dbf '8 to avoid diagonal crushing of the web. This limit has been considered too restrictive by some researchers (Ma et al., 2000). Further discussion on the appropriateness of this limit is included in chapter 5.

20
2.3.2 AASHTO-LRFD Bridge Design Specifications 4th Edition (2007)
2.3.2.1 General Procedure
Based on the Modified Compression Field Theory (MCFT), a general procedure was introduced in the first AASHTO LRFD Bridge Design Specifications in 1994. This method has been praised by many due to the fact that it provides a rational approach, based on deformation compatibility and constitutive equations for the cracked concrete. The method provides an estimate for the ability of diagonally cracked concrete to transmit tension and it is applicable to both prestressed and reinforced concrete.
Some simplifications had to be made in order to put MCFT in an explicit form in the LRFD Specifications. These simplifications are: (i) shear stress is considered uniformly distributed over an effective shear area (bv wide by dv deep), (ii) the direction of the principal compressive stresses remain constant over dv and (iii) it is assumed that the shear strength of the section can be determined in terms of the state of biaxial stress of only one point in the section (the geometric centroid). Despite these simplifying assumptions, this method is still found to be extremely complicated and hard to use by many practitioners in part due to its iterative nature.
In the AASHTO LRFD Specifications, the nominal shear resistance is given by:
pvvcpscn VdbfVVVV +≤++= '25.0 Equation 2- 22
Concrete contribution to shear strength (Vc) can be calculated by two procedures (General and Simplified Procedures). In the General Procedure, Vc is given by:
vvcc dbfV '0316.0 β= Equation 2- 23
where:
'cf = Concrete Strength (ksi)
bv = width of the effective shear area (in)
dv = distance, measured perpendicular to the neutral axis, between the resultants of the tensile and compressive forces due to flexure; it need not be taken less than 0.9d or 0.72h (in)

21
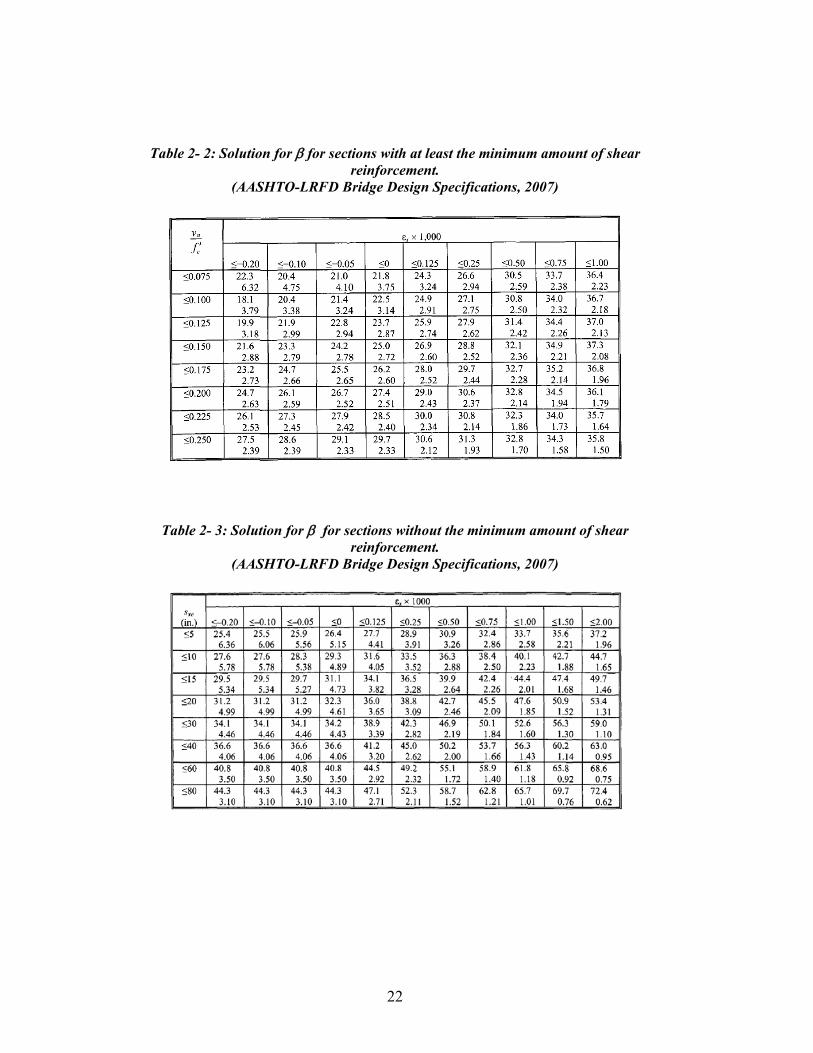
They key factor in the AASHTO LRFD MCFT based sectional shear model is the proper calculation of β ; which is a factor to estimate the ability of diagonally cracked concrete to transmit tension. When it was first introduced, β was obtained from graphs as shown in Figure 2- 5. In the subsequent AASHTO-LRFD Specifications this graphic solution for β was replaced with a tabulated solution as shown in Table 2- 2 and Table 2- 3.
(a) (b)
Figure 2- 5: Graphs used to obtain β: (a) for sections with at least the minimum amount of shear reinforcement. (b) for sections without the minimum amount of shear reinforcement.
(AASHTO-LRFD Bridge Design Specifications, 1994)
22
Table 2- 2: Solution for β for sections with at least the minimum amount of shear reinforcement.
(AASHTO-LRFD Bridge Design Specifications, 2007)
Table 2- 3: Solution for β for sections without the minimum amount of shear reinforcement.
(AASHTO-LRFD Bridge Design Specifications, 2007)

23
Shear reinforcement’s contribution to shear strength in the general procedure is given by:
( )s
dfAV vyv
s
ααθ sincotcot += Equation 2- 24
where:
θ = angle of inclination of diagonal compressive stresses
α = angle of inclination of transverse reinforcement to longitudinal axis.
It is not the intention of this document to instruct the reader in the use of any particular method. As such, the process of estimating shear resistance using MCFT is avoided here. The AASHTO LRFD Specifications provide a detailed flow chart, shown in Figure 2- 6, to facilitate the use of this method.

24
Figure 2- 6: Flow chart for the use of the MCFT-based Sectional Model as given
in AASHTO-LRFD Bridge Design Specifications (2007)
2.3.2.2 Simplified Procedure
In the 2007 edition of the AASHTO-LRFD Bridge Design Specification, a simplified procedure was introduced as presented in NCHRP Report 549 by Hawkins et al. This procedure combines the simplicity of the Vci and Vcw equations of ACI’s traditional approach with the variable angle truss approach when estimating shear reinforcement’s contribution to shear strength (Vs). Details of this method can be found in section 2.2.4 of this document.
25
2.3.3 AASHTO Guide Specifications for Design and Construction of Segmental Concrete Bridges, 2nd Edition, (Interim 2003)
The AASHTO Guide Specifications for Design and Construction of Segmental Concrete Bridges, which will be referred to as the AASHTO Segmental Specifications, presents a very simple approach in their provisions to estimate the shear capacity of prestressed concrete beams.
In the AASHTO Segmental Specifications, the nominal shear resistance is given by:
dbfVVV wcscn'12≤+= Equation 2- 25
Concrete contribution to shear strength is calculated according to an expression introduced by Ramirez and Breen (1983) as follows:
dbfKV wcc'2= Equation 2- 26
where K is a factor to adjust for the increased uncracked strength due to prestressing force, compared to a reinforced concrete element where dbfV wcc
'2= . The K factor can be derived from the Mohr circle of an element at the neutral axis of a prestressed concrete element and is given by:
0.22
1'
≤+=c
pc
f
fK Equation 2- 27
where:
fpc = Stress at the centroid of the section resisting external loads, due to prestressing force after all losses.
The reasoning that was used to derive this expression was the same reasoning that was used to obtain the original expression for Vcw which was linearized in
( ) ppwpcccw VdbffV +⋅+= 3.05.3 '
Equation 2- 18. In the AASHTO Segmental Specification’s Vc expression, the maximum diagonal tensile stress was

26
assumed to be '2 cf , compared to the assumption of '5.3 cf made for the Vcw expression.
The K factor in the segmental code is limited to a value of 1 if the section is cracked in tension. That is, if the stress at the outer most tension fiber exceeds '6 cf . This limit in the AASHTO Segmental Specifications is aimed at providing a similar provision to the Vci and Vcw approach used in AASHTO Standard and LRFD Specifications and ACI 318 by making Vc the lesser of Vci and Vcw. Ramirez and Breen (1983) introduced this limit after obtaining unconservative strength estimations by the use of their equation in two specimens with draped strands and no shear reinforcement tested by MacGregor et al. (1960). The reduced shear strength of these specimens was attributed to the reduced flexural strength due to strand harping and consequent development of flexural cracks that lead to a flexure-shear mode of failure. Further discussion on the appropriateness of this limit is presented in chapter 5.
Ramirez and Breen (1983) also proposed a linear reduction of concrete contribution after diagonal cracking had occurred, similar to procedures included in the Swiss Code (1976), the CEB-refined procedure (1978) and a procedure proposed by Thürlimann. This reduction is not included in the AASHTO Segmental Code.
Shear reinforcement contribution to shear strength is calculated as in the AASHTO Standard Specifications or the ACI 318-08 Specifications, by assuming a 45 degree truss, following Ritter’s (1899) truss analogy. Where shear reinforcement perpendicular to the longitudinal axis of the element is used, the shear reinforcement contribution to shear strength can be estimated as:
sdfA
V ytvs = Equation 2- 28
The amount of transverse reinforcement is not limited explicitly in the AASHTO Segmental Specifications but the Specifications have limits of 2≤K and
dbfV wcn'12≤ . These limits work as an indirect limit of dbf wc
'8 on Vs when K =
2; however, for a K value of 1, Vs can be as much as dbf wc'10 .

27
2.4 EXPERIMENTAL RESULTS DATABASE
The primary objective of this project is to examine the shear performance of new Tx girders. To achieve that goal, recent research projects that are closely related to this objective were previously summarized. In addition, ACI 318 and AASHTO LRFD shear design procedures were previously outlined. In an effort to obtain a better understanding of shear behavior, a prestressed concrete shear database was assembled as a part of this project. Prior to testing the new Tx girders in shear, our team sought to find previous tests on prestressed concrete beams with geometric properties similar to those of the new Tx girders. In this way, the current project can benefit from more than 50 years of shear research.
2.4.1 Database Description
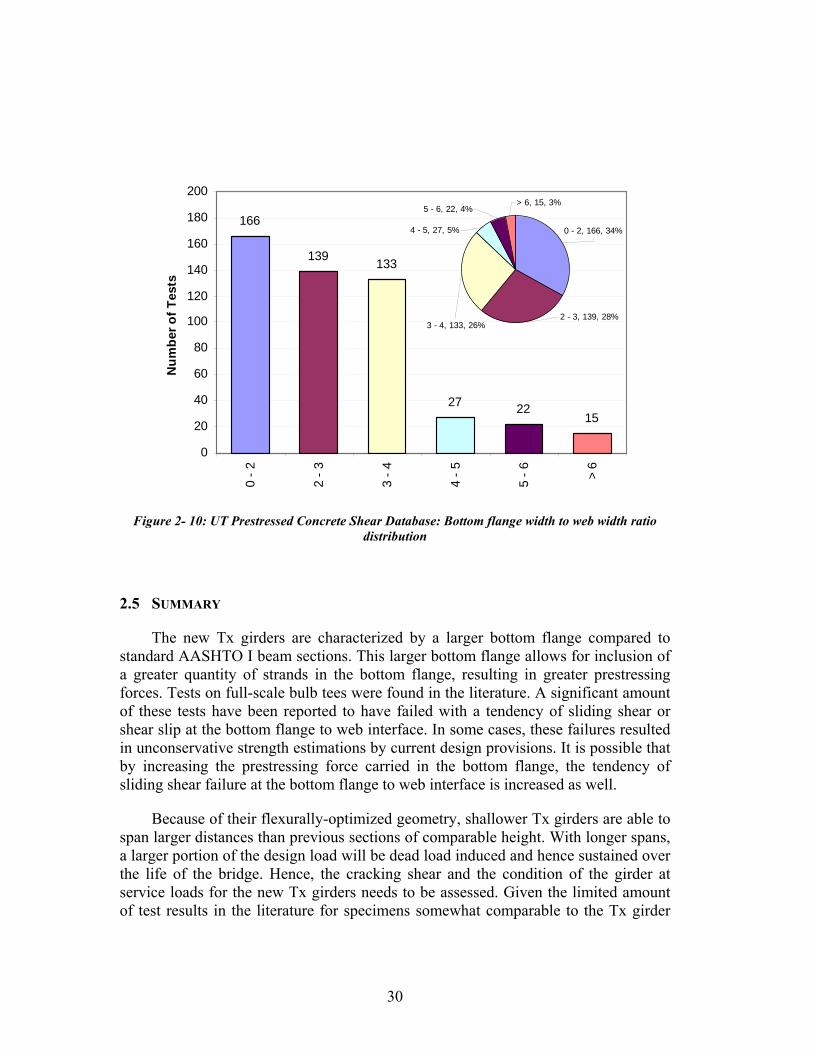
The University of Texas prestressed concrete shear database contains data from 29 references dated from 1954 to 2008, for a total of 502 shear tests. Once the results from the shear tests on the Tx28 specimens are included in the database, the total will increase to 506 tests. The database includes the results of shear tests on rectangular, I shaped and T shaped sections with concrete strengths between 1,750 psi and 17,800 psi. Overall member depth varies between 6 in. and 80.6 in.. The length of the beams varies between 28 in. and 78 ft. Both pretensioned and post-tensioned members are included in the database. Most specimens are simply supported but continuous specimens are included as well. Most specimens are subjected to concentrated loads but distributed loading cases are included as well. For a better appreciation of the database and distribution of previously conducted tests, Figure 2- 7 through Figure 2- 10 illustrate histograms for concrete strength, overall member height, shear span to depth ratio and flange width to web width ratio.
The flange width to web width ratio can be used to characterize one aspect of the geometry of the section. For rectangular beams, this ratio would be equal to 1. For the new Tx girders, it is approximately equal 4.6. An examination of the test results included in the database shows that sections with a higher flange width to web width ratio are more likely to fail with a tendency of sliding shear failure at the bottom flange to web interface. To this date, there is no practical way of estimating the shear at which sliding shear will take place. There is ample evidence, however, that the sliding shear failure will control the maximum shear stress that can be carried within a simply supported pretensioned beam. There is a reduced likelihood of sliding shear failures for pretensioned beams with end blocks and end diaphragms; however, this does not represent the conditions in which the Tx girders will be used in Texas’ bridges.

28
For the analysis and recommendations presented in chapter 5, some filters will be applied to the database in order to evaluated relevant specimens. 3 sub sets of tests will be frequently used:
• 367 (tests with confirmed shear failures) out of the 506 total will be used to evaluate current shear strength provisions.
• 153 (tests with confirmed shear failures, overall depth greater than 12 inches and including web reinforcement) out of the 506 total will be used as a sample more representative of current bridges.
• 123 (tests with reported first cracking shear and including web reinforcement) out of the 506 total will be used to evaluate minimum and maximum shear reinforcement provisions.
160 156
97
19
45
187
0
20
40
60
80
100
120
140
160
180
< 4
ksi
4 -
6 k
si
6 -
8 k
si
8 - 1
0 ks
i
10 -
12 k
si
12 -
14 k
si
> 14
ksi
Num
ber o
f Tes
ts
Figure 2- 7: UT Prestressed Concrete Shear Database: Concrete Strength Distribution
< 4 ksi, 160, 32%
6 - 8 ksi, 97, 19%
8 - 10 ksi, 19, 4%
10 - 12 ksi, 45, 9%
12 - 14 ksi, 18, 4%
4 - 6 ksi, 156, 31%
> 14 ksi, 7, 1%

29
31
47
109
275
40
0
50
100
150
200
250
300
0 - 12 in 12 - 24 in 24 - 36 in 36 - 48 in > 48 in
Num
ber
of T
ests
Figure 2- 8: UT Prestressed Concrete Shear Database: Overall Member Depth Distribution
3 715
79
325
73
0
50
100
150
200
250
300
350
400
0 - 2 2 - 4 4 - 6 6 - 8 > 8 Movingloads
Num
ber
of T
ests
Figure 2- 9: UT Prestressed Concrete Shear Database: Shear span to depth ratio distribution.
24 - 36 in, 47, 9%
0 - 12 in, 275, 55%
12 - 24 in, 109, 22%
> 48 in, 31, 6%36 - 48 in, 40,
8%
4 - 6, 73, 15%
6 - 8, 15, 3%
> 8, 3, 1% Moving loads, 7, 1%
2 - 4, 325, 64%
0 - 2, 79, 16%
30
166
139 133
27 2215
0
20
40
60
80
100
120
140
160
180
200
0 - 2
2 - 3
3 - 4
4 - 5
5 - 6 >
6
Num
ber o
f Tes
ts
Figure 2- 10: UT Prestressed Concrete Shear Database: Bottom flange width to web width ratio distribution
2.5 SUMMARY
The new Tx girders are characterized by a larger bottom flange compared to standard AASHTO I beam sections. This larger bottom flange allows for inclusion of a greater quantity of strands in the bottom flange, resulting in greater prestressing forces. Tests on full-scale bulb tees were found in the literature. A significant amount of these tests have been reported to have failed with a tendency of sliding shear or shear slip at the bottom flange to web interface. In some cases, these failures resulted in unconservative strength estimations by current design provisions. It is possible that by increasing the prestressing force carried in the bottom flange, the tendency of sliding shear failure at the bottom flange to web interface is increased as well.
Because of their flexurally-optimized geometry, shallower Tx girders are able to span larger distances than previous sections of comparable height. With longer spans, a larger portion of the design load will be dead load induced and hence sustained over the life of the bridge. Hence, the cracking shear and the condition of the girder at service loads for the new Tx girders needs to be assessed. Given the limited amount of test results in the literature for specimens somewhat comparable to the Tx girder
3 - 4, 133, 26%
4 - 5, 27, 5%
5 - 6, 22, 4%> 6, 15, 3%
2 - 3, 139, 28%
0 - 2, 166, 34%
31
sections, experimental evaluation of the cracking shear, condition at service loads and maximum shear capacity of the new Tx girders proves to be necessary.
In addition, the Tx Girders are introduced in an era where the use of high strength concrete is increasing. While high strength concrete is typically not specified for pretensioned girders in Texas, it may be expected that the Tx girders will be fabricated using somewhat higher concrete strengths. A relatively small amount of tests conducted on high strength concrete specimens was found. Experimental evidence suggests that there is no reason to believe that the use of high strength concretes (up to 18,000 psi) reduces conservativeness of shear strength estimates. However, given the limited amount of experimental verifications in this range, it is prudent to conduct more experimental investigations in the shear strength of prestressed girders fabricated with high strength concretes. Given the fact that release strength is the controlling factor of Texas’ Class-H concrete mixture designs, the 28-day compressive strength of beams fabricated in commercial plants typically range between 8,000 psi to 14,000 psi, rendering all pretensioned girders used in Texas bridges made of high strength concrete.

32

33
CHAPTER 3 Experimental Program
3.1 OVERVIEW
The fabrication of the girders tested in the experimental program, instrumentation regarding temperature monitoring and match-curing process for the girders, design and fabrication of concrete decks on top of the girders to be tested in shear and the shear tests performed on the Tx-28 specimens are discussed in this chapter. The experimental investigation summarized in this chapter was conducted in the Phil M. Ferguson Structural Engineering Laboratory of the University of Texas. The experimental program was funded by the Texas Department of Transportation.
3.2 TEST SPECIMEN DETAILS
As part of an IAC testing contract, four specimens were fabricated; two Tx28 Girders, one Tx46 and one Tx70, all of them thirty foot long. The amount of prestressing force in all specimens was considerable, ranging between 1,590 kips and almost 2,000 kips. To concur with typical fabrication practices, concrete mixtures with Type III cement were used in all specimens, resulting in final concrete strengths ranging between 11,375 psi and 13,825 psi.
3.2.1 Tx Girders Sections
TxDOT’s new girder sections are optimized for better use of new materials and construction practices, allowing longer spans for shallower beams and fewer beams per span. The main differences between the new sections and traditional AASHTO sections can be summarized as follows:
• A wider and deeper bottom flange in the new Tx girders allows the use of a greater number of strands. With the increased acceptance and availability of high strength concretes, larger prestressing forces can be introduced in sections, maximizing flexural capacity, reducing deflections and delaying cracking.
• A thinner top flange maximizes the advantages obtained from composite construction.
• The section is wider than previously used AASHTO sections, increasing the moment of inertia around the weak axis and therefore reducing the probability of problems during erection.

34
Section properties and dimensions are shown in Table 3- 1 and Figure 3- 1.
Table 3- 1: Section Properties for new Tx Girders (TxDOT Bridge Division: Prestressed Concrete I-Girder Detail)
Girder Type
Depth yt* yb** Area Ix Iy Weight
(in) (in) (in) (in2) (in4) (in4) (plf)
Tx28 28 15.02 12.98 585 52772 40559 610
Tx46 46 25.9 20.1 761 198089 46478 793
Tx70 70 38.09 31.91 966 628747 57579 1006
*yt is the distance from the centroid of the section to the extreme top fiber.
**yb is the distance from the centroid of the section to the extreme bottom fiber.

35
Figure 3- 1: Tx Girder Sections
3.2.2 Prestressing Strand Properties
For all specimens, 0.6 inch diameter low-relaxation prestressing strands with 270 ksi nominal ultimate strength were used. The stress-strain curve for the strands were obtained through testing of samples from each spool resulting in an average yield stress of 245 ksi and an average ultimate strength of 285 ksi. The measured modulus of elasticity was 29500 ksi. These values were used in all calculations for better results. Figure 3- 2 shows a typical stress-strain curve for the prestressing strands used in this experimental program. The curve shown corresponds to spool 1,

36
used for specimens Tx28-I, Tx28-II and Tx-46. Strands used in specimen Tx70 correspond to spool 2.
0
50
100
150
200
250
300
0.00 0.01 0.02 0.03 0.04 0.05
Strain
Stre
ss (k
si)
Figure 3- 2: Typical measured stress-strain curve for prestressing strands
To minimize any possible differences between strands within the same specimen, all strands in each specimen come from only one spool. In addition, the strand samples for testing were obtained from the start, middle and end of the spool to account for any possible differences within the same spool. No major difference between strand properties was found. Strands were spaced two inches on center with the first row located 4 inches (to center of the strand) from the bottom.
3.2.3 Concrete Properties and Mixture Design
As mentioned earlier, Type III cement was used for all specimens. In order to do achieve this goal, concrete was mixed in the laboratory. To replicate current practice in precast beam fabrication plants, admixtures were used to ensure workability while trying to achieve 6,500 psi compressive strength within the first 24 hours from the casting time. Quantifiable factors such as moisture content of the aggregate and the initial slump as well as other not-so-technical factors such as the sound of the mixer as it turns or the smell of the fresh concrete had to be taken into account to obtain consistent results. Concrete mixture designs are presented in Table
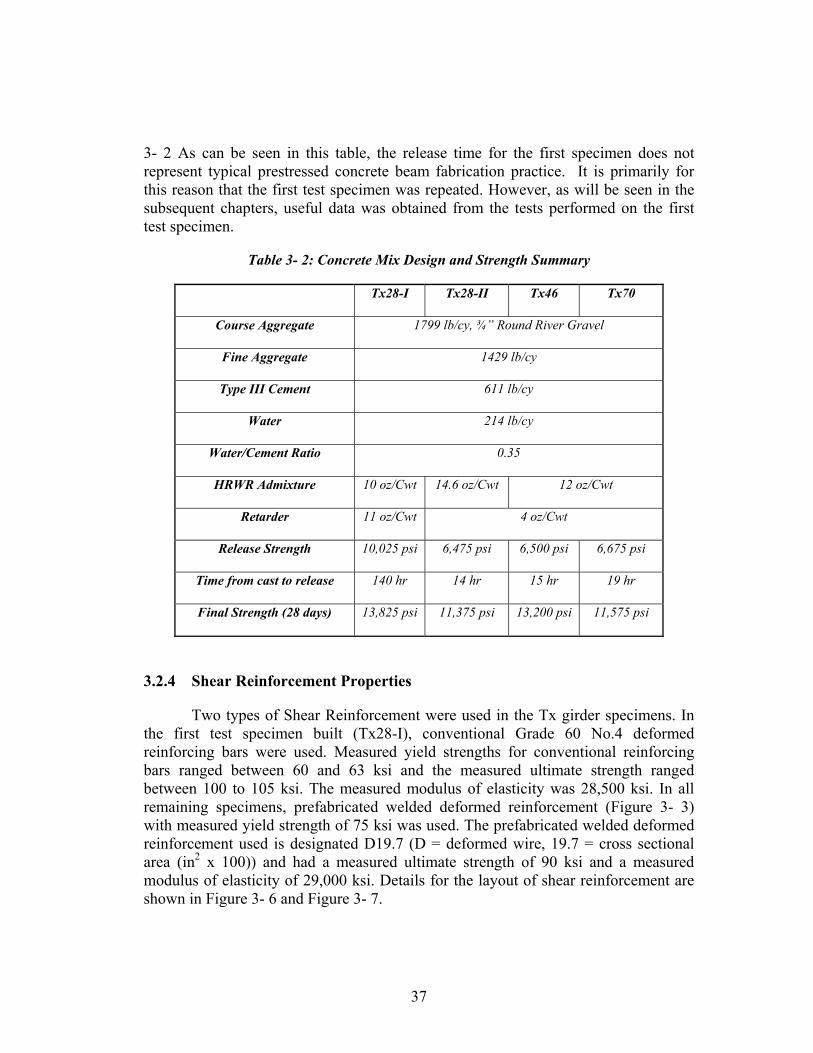
37
3- 2 As can be seen in this table, the release time for the first specimen does not represent typical prestressed concrete beam fabrication practice. It is primarily for this reason that the first test specimen was repeated. However, as will be seen in the subsequent chapters, useful data was obtained from the tests performed on the first test specimen.
Table 3- 2: Concrete Mix Design and Strength Summary
Tx28-I Tx28-II Tx46 Tx70
Course Aggregate 1799 lb/cy, ¾” Round River Gravel
Fine Aggregate 1429 lb/cy
Type III Cement 611 lb/cy
Water 214 lb/cy
Water/Cement Ratio 0.35
HRWR Admixture 10 oz/Cwt 14.6 oz/Cwt 12 oz/Cwt
Retarder 11 oz/Cwt 4 oz/Cwt
Release Strength 10,025 psi 6,475 psi 6,500 psi 6,675 psi
Time from cast to release 140 hr 14 hr 15 hr 19 hr
Final Strength (28 days) 13,825 psi 11,375 psi 13,200 psi 11,575 psi
3.2.4 Shear Reinforcement Properties
Two types of Shear Reinforcement were used in the Tx girder specimens. In the first test specimen built (Tx28-I), conventional Grade 60 No.4 deformed reinforcing bars were used. Measured yield strengths for conventional reinforcing bars ranged between 60 and 63 ksi and the measured ultimate strength ranged between 100 to 105 ksi. The measured modulus of elasticity was 28,500 ksi. In all remaining specimens, prefabricated welded deformed reinforcement (Figure 3- 3) with measured yield strength of 75 ksi was used. The prefabricated welded deformed reinforcement used is designated D19.7 (D = deformed wire, 19.7 = cross sectional area (in2 x 100)) and had a measured ultimate strength of 90 ksi and a measured modulus of elasticity of 29,000 ksi. Details for the layout of shear reinforcement are shown in Figure 3- 6 and Figure 3- 7.

38
Shear reinforcement anchorage to the bottom flange is provided differently for conventional reinforcement bars and for prefabricated welded-deformed reinforcement as illustrated in Figure 3- 8. For conventional reinforcement bars, 90° hooks are included. For the welded-deformed reinforcement, two longitudinal anchorage wires at a 2 inch separation are welded to the bottom end of the main transverse D19.7 bars.
Figure 3- 3: Prefabricated welded-deformed rebar

Figure 3- 4: Shear Reinforcement Layout for Live of Tx28-II (Test 1)
39

Figure 3- 5: Shear Reinforcement Layout for Dead end of Tx28-II (Test 2)
40

Figure 3- 6: Shear Reinforcement Layout for Dead end of Tx28-I (Test 3)
41

Figure 3- 7: Shear Reinforcement Layout for Live end of Tx28-I (Test 4)
42

43
Figure 3- 8: Typical Shear Reinforcement Bar Detail
3.2.5 Instrumentation
Instrumentation constitutes an important part of this project. Each girder contained approximately 48 strain gages installed in the end regions to measure bursting and spalling stresses (O’Callaghan, 2007), 48 strain gages installed on the prestressing strands to measure the stress on the strands during the gang stressing operation and to evaluate transfer lengths (O’Callaghan, 2007), 24 strain gages installed on the reinforcing bars within the top flange for overhang tests (Clifton, 2008) and 24 thermocouples for the match curing process and section temperature profiling as will be shown later in this document.
Once the girders were fabricated, both Tx28 girders were tested in shear. Tx28 girders are calculated to carry highest levels of shear stresses at service loads
Conventional Reinforcement Bar
Av = 2x0.2 in2, fy = 60 ksi
Prefabricated Welded-deformed rebar
Av = 2x0.197 in2, fy = 75 ksi
Two Longitudinal Anchorage wires
One Longitudinal Anchorage wire

44
and as such were the focus of the shear study. These tests required additional external instrumentation. A 1,000 kip load cell was used to measure the load applied through a hydraulic ram with an 800 kip capacity. As backup load measurements, digital pressure transducers and analog pressure dials were added to the main pump to ensure accuracy of load readings.
3.2.5.1 Temperature Monitoring
There is an immense variety of thermocouple wires for different applications. For the temperature range typical of precast beam applications and maximum temperatures, copper-constantan wire with Teflon sheathing was selected as the appropriate wiring for the application. Proper electrical isolation (water proofing) of the thermocouple was critical for adequate functioning of thermocouples and their respective data acquisition systems. Heated shrink tubing was wrapped with 3 to 4 layers of electrical tape to obtain the acceptable isolation and protection during casting. This method presented no problems.
While curing, the measured temperatures from six points in one cross section located 4 feet away from the end of the girder were transmitted wirelessly from the prestressing bed to the match curing setup within Ferguson Laboratory where 48 cylinders (8 cylinders per each point in the cross section) were cured at the corresponding temperature. For comparison purposes, 18 additional thermocouples were installed in each specimen.
The match curing setup was capable of heating special cylinders to match the temperature of any given point in the specimen where a thermocouple was installed. Temperature readings were updated within seconds continuously throughout the whole curing process and a reading was stored every 6 minutes for later study. Previous research has proven the benefits of using this technology, as it allows precast beam plants to release strands and remove forms in shorter periods of time with a greater degree of confidence in the results from standard cylinder tests. Section 3.3.2 of this document provides further information on the match curing process.
3.2.5.2 Deflection Measurements
For the shear tests of specimens Tx28-I and Tx28-II, the deflection under the load point was of interest. A total of 4 linear potentiometers were used; one 2-inch. linear potentiometer at each support as illustrated in Figure 3- 9 and two 6-inch linear potentiometers under the load point as illustrated in Figure 3- 10. The two linear potentiometers under the load point were located at each corner of the bottom flange allowing the experimental investigation team to detect twisting of the girder in the case of any load eccentricity. No twisting was noted in experiments. The effective deflection under the load was obtained through the average of the deflections

45
measured by the two linear potentiometers under the load minus the average of the two linear potentiometers under the supports –i.e. the rigid body movements were filtered out. With these deflection measurements and the load measurements from the load cell mentioned above, load-deflection plots were obtained and will be presented in the subsequent sections of this document.
Figure 3- 9: 2” Linear Potentiometer at the support.
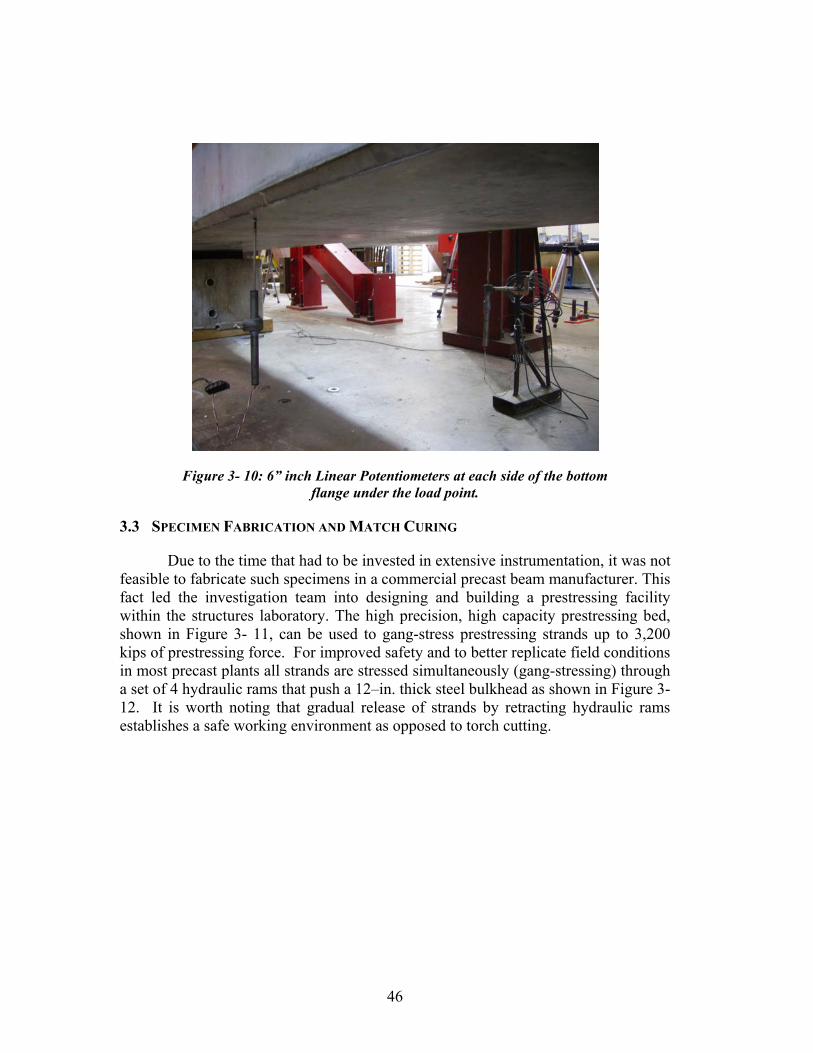
46
Figure 3- 10: 6” inch Linear Potentiometers at each side of the bottom flange under the load point.
3.3 SPECIMEN FABRICATION AND MATCH CURING
Due to the time that had to be invested in extensive instrumentation, it was not feasible to fabricate such specimens in a commercial precast beam manufacturer. This fact led the investigation team into designing and building a prestressing facility within the structures laboratory. The high precision, high capacity prestressing bed, shown in Figure 3- 11, can be used to gang-stress prestressing strands up to 3,200 kips of prestressing force. For improved safety and to better replicate field conditions in most precast plants all strands are stressed simultaneously (gang-stressing) through a set of 4 hydraulic rams that push a 12–in. thick steel bulkhead as shown in Figure 3- 12. It is worth noting that gradual release of strands by retracting hydraulic rams establishes a safe working environment as opposed to torch cutting.

47
Figure 3- 11: FSEL High Capacity Prestressing Bed (O’Callaghan, 2007)
Figure 3- 12: Live End Bulkhead and set of 4 hydraulic rams. (O’Callaghan, 2007)

48
3.3.1 Girder Design and Fabrication
All girders were designed according to the AASHTO LRFD Bridge Design Specification (2007). Strand patterns were determined in order to maximize prestressing force and, therefore, end zone stresses. Standard shear reinforcement details were used, varying the amount of additional web reinforcement in the end zone due to bursting stresses. Results and conclusions reached from the end zone experiments are reported elsewhere (O’Callaghan, 2007).
Fabrication of all specimens took place in the Phil M. Ferguson Structural Laboratory, located in the J.J. Pickle Research Campus of the University of Texas at Austin. First, each strand was run individually through end blocks and enough force to take the slack of the strands was applied to each strand (roughly 1 kip/strand). Top strands were added later, prestressed with a force of 5 kips each. Then, shear reinforcement and additional bursting reinforcement was tied in place followed by instrumentation of the specimen and data acquisition system setup.
Once the specimen was ready, the casting operation was scheduled. In the morning of the day of cast, strands were gang stressed to their desired jacking stress. Typically, a force of 44 kips was introduced into each strand, while being monitored by strain gages and displacement transducers to measure the total elongation.
Casting took place in the afternoon (Figure 3- 13), with the whole operation taking approximately one hour from the time the water was added to the mix to the completion of casting. Concrete cylinders (48) were placed in a match curing facility located within the laboratory. Tx girder specimens were covered with soaked burlap and plastic sheets until forms were removed and strands were released.
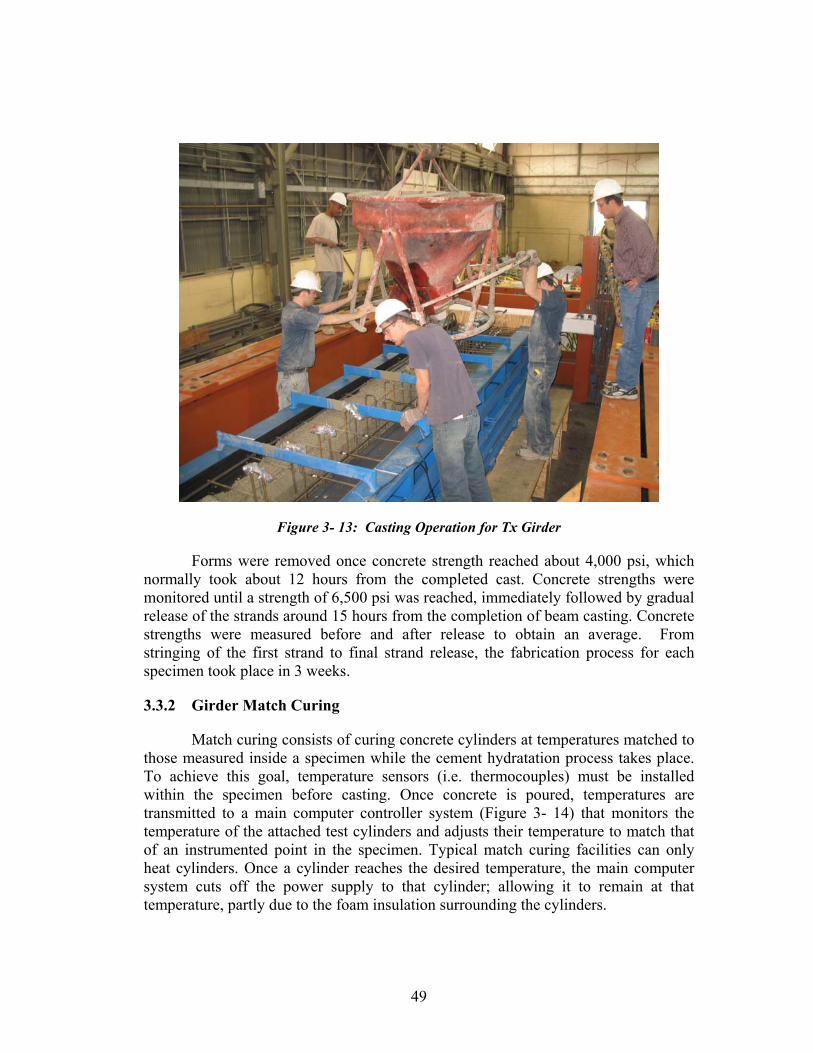
49
Figure 3- 13: Casting Operation for Tx Girder
Forms were removed once concrete strength reached about 4,000 psi, which normally took about 12 hours from the completed cast. Concrete strengths were monitored until a strength of 6,500 psi was reached, immediately followed by gradual release of the strands around 15 hours from the completion of beam casting. Concrete strengths were measured before and after release to obtain an average. From stringing of the first strand to final strand release, the fabrication process for each specimen took place in 3 weeks.
3.3.2 Girder Match Curing
Match curing consists of curing concrete cylinders at temperatures matched to those measured inside a specimen while the cement hydratation process takes place. To achieve this goal, temperature sensors (i.e. thermocouples) must be installed within the specimen before casting. Once concrete is poured, temperatures are transmitted to a main computer controller system (Figure 3- 14) that monitors the temperature of the attached test cylinders and adjusts their temperature to match that of an instrumented point in the specimen. Typical match curing facilities can only heat cylinders. Once a cylinder reaches the desired temperature, the main computer system cuts off the power supply to that cylinder; allowing it to remain at that temperature, partly due to the foam insulation surrounding the cylinders.

50
Figure 3- 14: Match Curing Controller and Cylinders (O’Callaghan, 2007)
Figure 3- 15: Match Curing Cylinders

51
Six temperature readings per specimen cross section were match cured. Previous experience has shown that the hottest spot in I girder sections of comparable dimensions is located 4 inches from the bottom of the girder. On the other hand, coldest spots are usually located on the top flange corners. These points along with others were monitored in order to obtain the temperature profiles for the new Tx Girders and to determine an optimal location for a single thermocouple that is “representative” of the beam itself.
In addition to the six match-cured temperature reading points, 18 additional thermocouples were located in different points along the length of a specimen but in the same location relative to the specimen’s cross section. Thermocouple locations are shown in Figure 3- 16 for all specimens. For reference purpose, ambient temperatures were measured and recorded as well.
Figure 3- 16: Thermocouple Locations
3.3.3 Deck Design and Fabrication
The concrete deck is reinforced according to Texas Department of Transportation standard details for typical transverse sections. Figure 3- 17 illustrates reinforcement size and spacing for the composite deck. Typical of standard bridge construction, conventional Grade 60 reinforcing bars were used in the deck.
Match Cured Temperature Reading
Secondary Temperature Reading
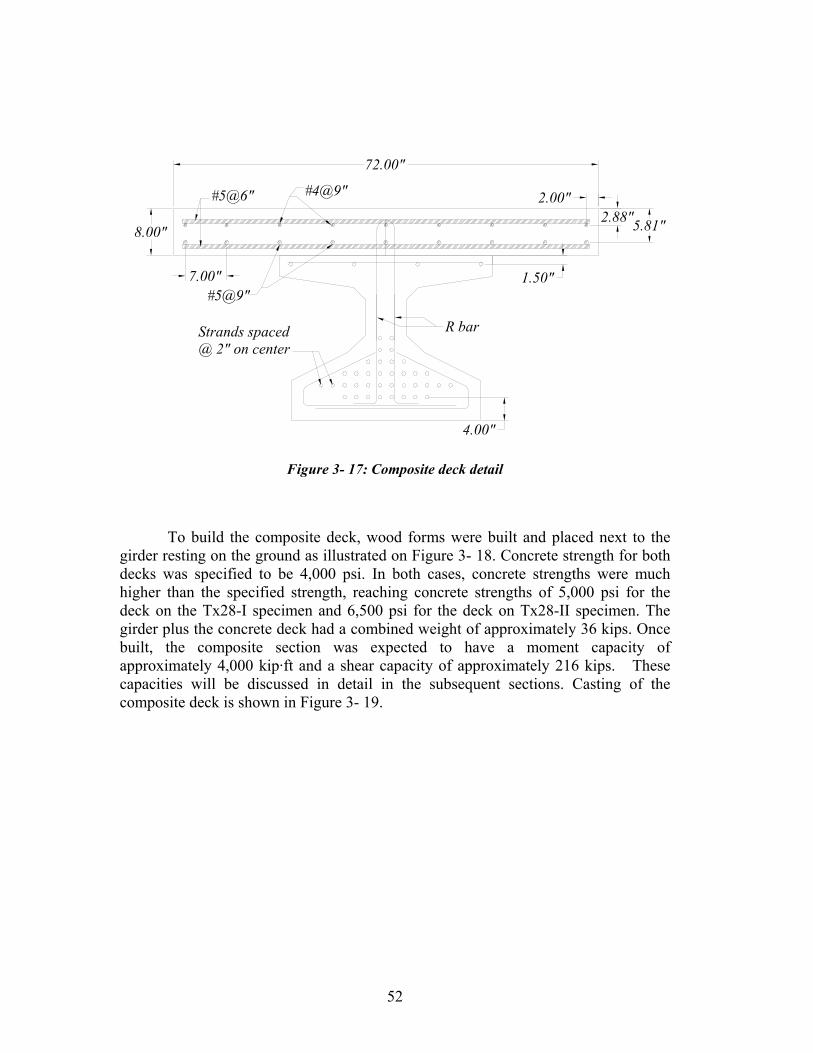
52
Figure 3- 17: Composite deck detail
To build the composite deck, wood forms were built and placed next to the girder resting on the ground as illustrated on Figure 3- 18. Concrete strength for both decks was specified to be 4,000 psi. In both cases, concrete strengths were much higher than the specified strength, reaching concrete strengths of 5,000 psi for the deck on the Tx28-I specimen and 6,500 psi for the deck on Tx28-II specimen. The girder plus the concrete deck had a combined weight of approximately 36 kips. Once built, the composite section was expected to have a moment capacity of approximately 4,000 kip·ft and a shear capacity of approximately 216 kips. These capacities will be discussed in detail in the subsequent sections. Casting of the composite deck is shown in Figure 3- 19.

53
Figure 3- 18: Tx28 girder before casting of deck.
Figure 3- 19: Casting of composite concrete deck.

54
In order to meet the primary objectives, the specimens had to be designed to fail in shear (web shear, flexure-shear or bond related failure) rather than in a flexure mode (concrete crushing or strand rupture). It is well-known that current strength estimation procedures for the flexural capacity of concrete elements are fairly accurate. There is much to investigate on the estimation of the shear capacity of concrete elements. With this in mind, the maximum shear at the load that would cause flexural failure was compared to the estimated shear capacity yielding a ratio of 2.8. In other words, as long as the actual shear capacity of the girder was not greater than 2.8 times the estimated shear capacity, the girder would fail in shear.
3.4 SHEAR TESTS
Shear tests were conducted by pushing down on the girder through a hydraulic ram that reacted on a steel frame as shown in Figure 3- 20. The steel frame was connected to the strong floor and was designed to support 800 kips safely. To better represent the working conditions of prestressed girders in bridges, a composite concrete deck was added. Compared to the girder with no deck, the moment capacity and shear capacity were increased approximately 37% and 33% respectively by the addition of the topping deck. Each specimen was loaded until a load drop of approximately 30% of the load being carried was registered.
Figure 3- 20: Tx28-II under Test Frame
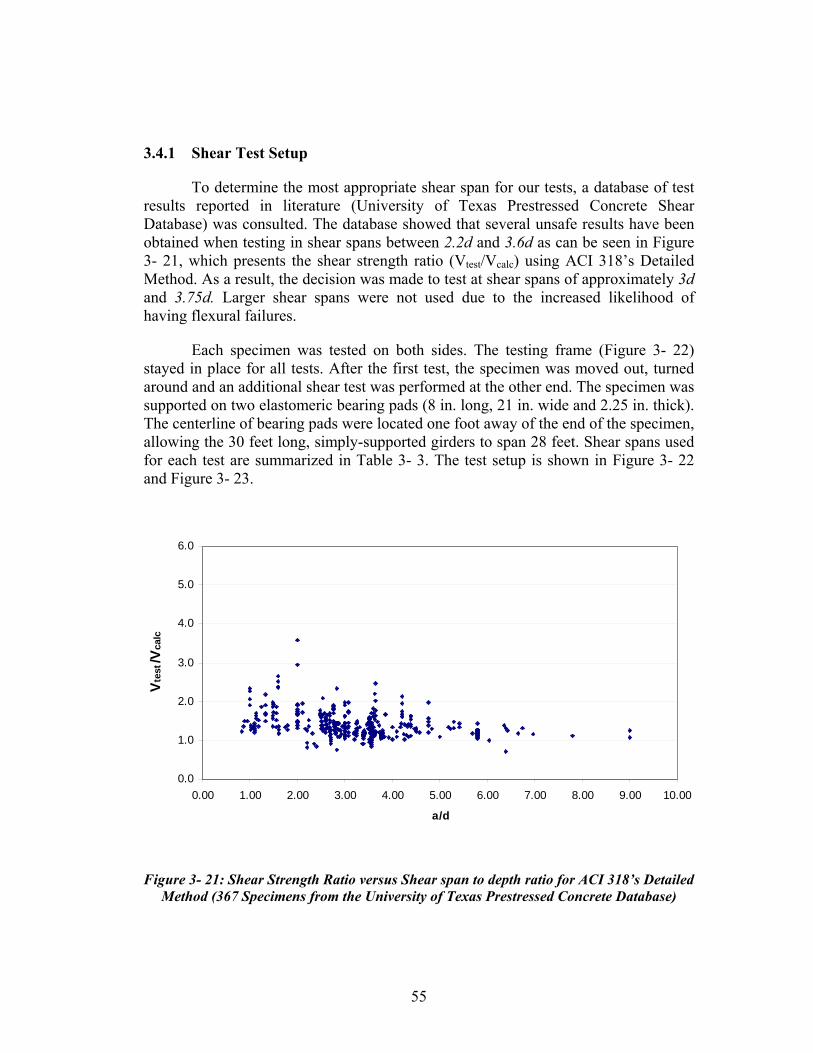
55
3.4.1 Shear Test Setup
To determine the most appropriate shear span for our tests, a database of test results reported in literature (University of Texas Prestressed Concrete Shear Database) was consulted. The database showed that several unsafe results have been obtained when testing in shear spans between 2.2d and 3.6d as can be seen in Figure 3- 21, which presents the shear strength ratio (Vtest/Vcalc) using ACI 318’s Detailed Method. As a result, the decision was made to test at shear spans of approximately 3d and 3.75d. Larger shear spans were not used due to the increased likelihood of having flexural failures.
Each specimen was tested on both sides. The testing frame (Figure 3- 22) stayed in place for all tests. After the first test, the specimen was moved out, turned around and an additional shear test was performed at the other end. The specimen was supported on two elastomeric bearing pads (8 in. long, 21 in. wide and 2.25 in. thick). The centerline of bearing pads were located one foot away of the end of the specimen, allowing the 30 feet long, simply-supported girders to span 28 feet. Shear spans used for each test are summarized in Table 3- 3. The test setup is shown in Figure 3- 22 and Figure 3- 23.
0.0
1.0
2.0
3.0
4.0
5.0
6.0
0.00 1.00 2.00 3.00 4.00 5.00 6.00 7.00 8.00 9.00 10.00
a/d
Vtes
t/Vca
lc
Figure 3- 21: Shear Strength Ratio versus Shear span to depth ratio for ACI 318’s Detailed Method (367 Specimens from the University of Texas Prestressed Concrete Database)

56
Table 3- 3: Shear spans used for each test.
Test Specimen End a (in)
1 Tx28-II Live 108
2 Tx28-II Dead 108
3 Tx28-I Dead 84
4 Tx28-I Live 84
Figure 3- 22: Typical setup for Shear Tests.

57
Figure 3- 23: Test setup cross section view

58
3.4.2 Test Specimens: Preliminary Analysis
Before tests were conducted, a preliminary analysis was performed in order to estimate flexure-shear cracking, web-shear cracking shear and the shear capacity of the test specimens. For simplicity, ACI 318’s Detailed Method (Vci and Vcw) was used. The properties of test specimens are summarized in Table 3- 4. Some values were also obtained by layered section analysis (moment-curvature analysis) in order to have more precise values.

59
Table 3- 4: Test Specimen Properties
TEST 1 2 3 4 Specimen ID Tx28-II-L Tx28-II-D Tx28-I-D Tx28-I-L Shear Reinforcement
Area (in2) 0.394 0.394 0.4 0.4 fy (ksi) 75 (wwf) 75 (wwf) 60 60
Spacing (in) [email protected], 12@4
[email protected], 4@3, 8@4
[email protected], 12@4
[email protected], 4@3, 8@4
Prestressing Steel (Low Relaxation, Nominal fpu = 270 ksi, Measured fpu = 285 ksi, Measured fpy = 245 ksi, Eps= 29500 ksi) Bottom (36 strands)
Area (in2) 7.76 7.76 7.76 7.76 Initial Stress( ksi) 217.59 217.59 204.6 204.6
Effective Stress (ksi) 195.73 195.73 188.53 188.53 d (in)** 28.28 28.28 28.28 28.28
Top (4 strands) Area (in2) 0.864 0.864 0.864 0.864
Initial Stress( ksi) 23.15 23.15 23.15 23.15 Effective Stress (ksi)* 20.82 20.82 21.33 21.33
d (in)** 9.5 9.5 9.5 9.5 Concrete (Type III Cement, ¾” max aggregate size for the girder and Type I Cement, ¾” max aggregate size for the deck)
Girder 'cf (psi) 11375 11375 13825 13825
Girder Release Strength (psi) 6475 6475 10025 10025
Deck 'cf (psi) 6550 6550 5050 5050
Cross Section Properties Girder Only
Area (in2) 585 585 585 585 Gross Moment of Inertia (in4) 52772 52772 52772 52772
Height to Centroid (in) 12.98 12.98 12.98 12.98 Weight (plf) 610 610 610 610
Composite Transformed Section Moment of Inertia (in4) 154374 154374 141016 141016 Height to Centroid (in) 20.84 20.84 19.85 19.85
Weight (plf) 1209 1209 1209 1209 Loading
a (ft) 9 9 7 7 a/d 3.75 3.75 2.92 2.92
Span (ft) 28 28 28 28 *Estimated Value, **Measured in the composite section
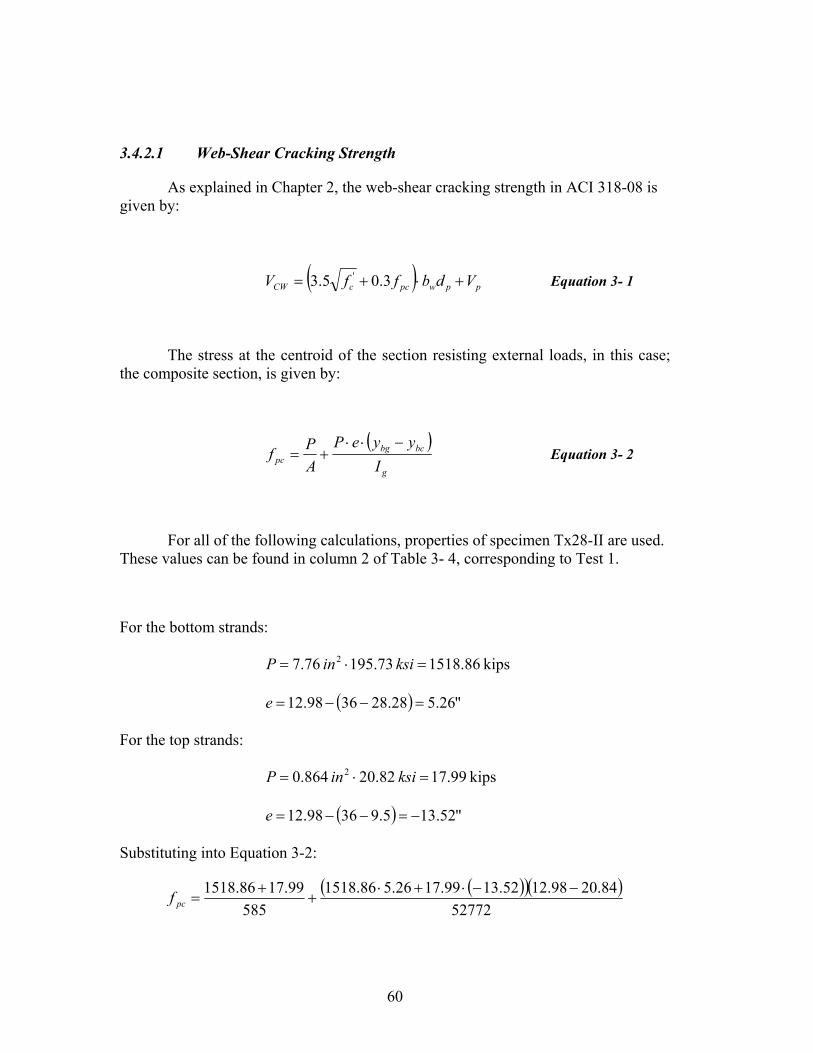
60
3.4.2.1 Web-Shear Cracking Strength
As explained in Chapter 2, the web-shear cracking strength in ACI 318-08 is given by:
( ) ppwpccCW VdbffV +⋅+= 3.05.3 ' Equation 3- 1
The stress at the centroid of the section resisting external loads, in this case; the composite section, is given by:
( )g
bcbgpc I
yyePAPf
−⋅⋅+= Equation 3- 2
For all of the following calculations, properties of specimen Tx28-II are used. These values can be found in column 2 of Table 3- 4, corresponding to Test 1.
For the bottom strands:
kips 86.1518 73.195 76.7 2 =⋅= ksiinP
( ) "26.528.283698.12 =−−=e
For the top strands:
kips 99.17 82.20 864.0 2 =⋅= ksiinP
( ) "52.135.93698.12 −=−−=e
Substituting into Equation 3-2:
( )( )( )52772
84.2098.1252.1399.1726.586.1518585
99.1786.1518 −−⋅+⋅+
+=pcf

61
ksif pc 473.1=
Substituting into Equation 3-1:
( ) 001.08.28714733.0113755.3 ⋅⋅⋅⋅+=CWV
kips 34.164=CWV
3.4.2.2 Flexure-Shear Cracking Strength
As explained in Chapter 2, the flexure-shear cracking strength in ACI 318-08 is given by:
pwcdMAX
CREipwcci dbfV
MMVdbfV '' 7.16.0 ≥++= Equation 3- 3
where:
( )( )dpectCRE fffyIM −+= '6/ Equation 3- 4
and:
g
bgpe I
yePAPf
⋅⋅+= Equation 3- 5
g
bdd I
yMf ⋅= Equation 3- 6
Substituting data from column 1 of Table 3- 4 into Equation 3-5:
( )( )( )52772
98.1252.1399.1726.586.1518585
99.1786.1518 −⋅+⋅+
+=pef
ksi 532.4=pef .

62
Substituting data from column 1 of Table 3- 4 into Equation 3-6:
( )( )( )452772
in 98.12/ 12ftkip 84.68in
ftinfd⋅
=
ksi 203.0=df
Substituting the values of fpe and fd into Equation 3-4:
( )( )203453211375684.20/154374 −+=CREM
694,807,36=CREM lb in
ftkip 7.3067 ⋅=CREM
The value of Vci is highly variable along the length of the test specimen. At a distance from the center line of the support to half of the shear span:
in 542
108==x , Vu = 232.06 kips, Mu = 1061.35 kips*ft,
Vd = 11.5 kips, Md = 68.84 kips*ft
Substituting these values into Equation 3-3:
( )( ) 5.11
84.6835.10617.30675.1106.232001.08.287113756.0 +
−⋅−
+⋅⋅⋅=ciV
kips 1.706=ciV
These values obtained from beam theory are compared to the ones obtained by layered section analysis in Table 3- 5.
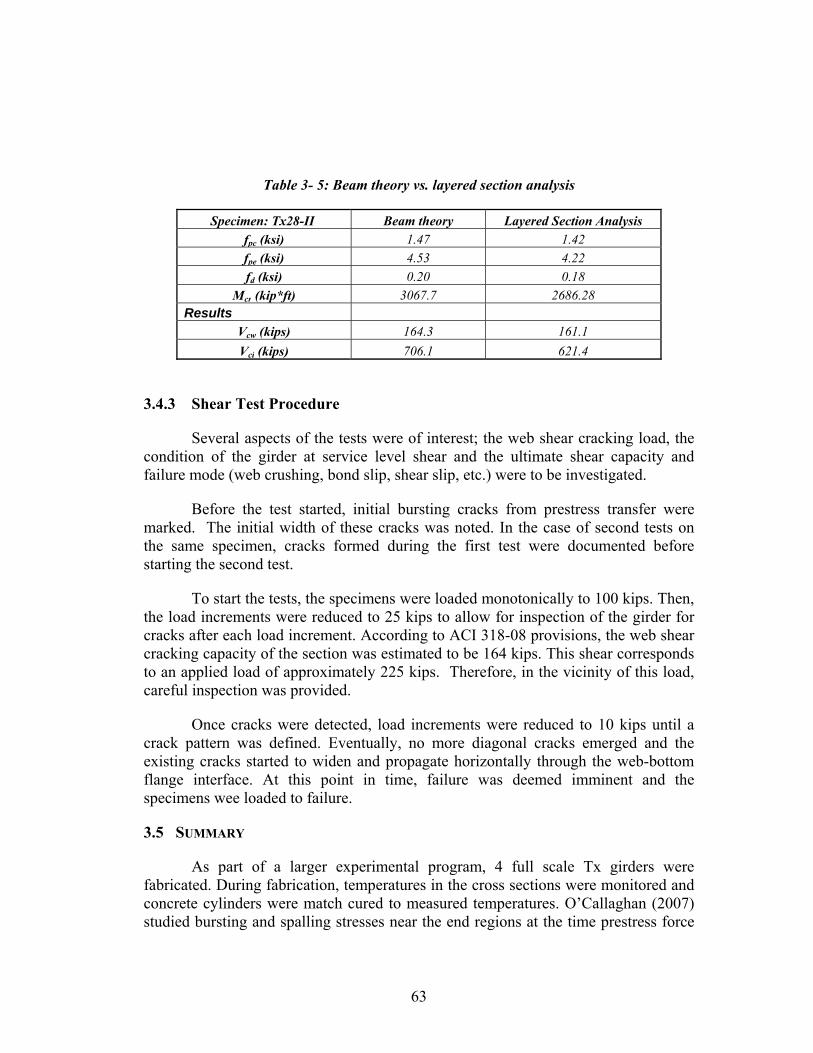
63
Table 3- 5: Beam theory vs. layered section analysis
Specimen: Tx28-II Beam theory Layered Section Analysis fpc (ksi) 1.47 1.42 fpe (ksi) 4.53 4.22 fd (ksi) 0.20 0.18
Mcr (kip*ft) 3067.7 2686.28 Results
Vcw (kips) 164.3 161.1 Vci (kips) 706.1 621.4
3.4.3 Shear Test Procedure
Several aspects of the tests were of interest; the web shear cracking load, the condition of the girder at service level shear and the ultimate shear capacity and failure mode (web crushing, bond slip, shear slip, etc.) were to be investigated.
Before the test started, initial bursting cracks from prestress transfer were marked. The initial width of these cracks was noted. In the case of second tests on the same specimen, cracks formed during the first test were documented before starting the second test.
To start the tests, the specimens were loaded monotonically to 100 kips. Then, the load increments were reduced to 25 kips to allow for inspection of the girder for cracks after each load increment. According to ACI 318-08 provisions, the web shear cracking capacity of the section was estimated to be 164 kips. This shear corresponds to an applied load of approximately 225 kips. Therefore, in the vicinity of this load, careful inspection was provided.
Once cracks were detected, load increments were reduced to 10 kips until a crack pattern was defined. Eventually, no more diagonal cracks emerged and the existing cracks started to widen and propagate horizontally through the web-bottom flange interface. At this point in time, failure was deemed imminent and the specimens wee loaded to failure.
3.5 SUMMARY
As part of a larger experimental program, 4 full scale Tx girders were fabricated. During fabrication, temperatures in the cross sections were monitored and concrete cylinders were match cured to measured temperatures. O’Callaghan (2007) studied bursting and spalling stresses near the end regions at the time prestress force

64
was transferred to the beams for all specimens. O’Callaghan (2007) also studied transfer lengths for the 0.6 inch diameter strands used. Results of his studies are reported elsewhere. Clifton (2008) performed tests on several overhang bracket devices and corresponding anchorage embeds to be used with the new Tx girders. Additionally, Clifton (2008) investigated the feasibility of a precast overhang alternative for bridge girders. Results of Clifton’s (2008) studies are reported elsewhere. Finally, the current program was to test the Tx28 specimens in shear, evaluate the applicability of current design provisions to the design of the Tx girders and incorporate the results from the shear tests to the University of Texas Prestressed Concrete Database for further analysis. Chapter 4 will present the results from the shear tests conducted on the Tx28 specimens followed by analysis of the shear database in chapter 5 and some final conclusions on chapter 6.

65
CHAPTER 4 Test Results
4.1 OVERVIEW
Two ends of two full scale Tx28 girders were tested. The 30 feet long Tx28 girders were topped with a composite deck that was 8 inches thick and 6 feet wide. Each end of the girder is identified as either the live end or the dead end. The live end refers to the end of the girder located in the live end of the pretensioning bed during the fabrication of the specimen. As different bursting stresses and crack patters were documented by O’Callaghan (2007) for the live end and dead end of each specimen, the effects of initial bursting stresses on the overall shear performance was closely followed. For both specimens, bursting stresses in the live end were greater than those observed in the dead end.
The first two tests (Test 1 and Test 2) were conducted on specimen Tx28-II, fabricated on January 19 of 2007. Both tests on this specimen were conducted at a shear span of 9 feet, resulting in a shear span to depth ratio of 3.75. Test 1 was conducted on the live end of specimen Tx28-II. Test 2 was conducted on the dead end of the same specimen. Tests 3 and 4 were conducted on specimen Tx28-I, fabricated on December 11 of 2006. For these tests, a shear span of 7 feet was used, resulting in a shear span-to-depth ratio of 2.9. Tests 3 and 4 correspond to the dead and live ends of Tx28-I, respectively.
The cracks that formed in the end regions of the test specimens at release were documented prior to conducting shear tests on Tx-I and Tx-II. The formation of new cracks and growth of older cracks were documented throughout. Of particular interest was the load stage corresponding to the service level shear for a bridge with Tx28 girders spaced at 10 feet, with a 75 feet span and a 45° skew. This configuration is very unlikely for girders of this size so it is considered as a worst case scenario.
The girders were loaded until a load drop of approximately 30% of the load being carried was registered after the peak load. All failures presented localized web crushing, horizontal shear failure (sliding shear) at the web to bottom flange interface and evidence of strand slip. All specimens failed at a load higher than that predicted using current design provisions from the ACI 318-08 and the AASHTO LRFD Bridge Design Specifications, with a minimum test to estimated shear strength ratio of 1.59 and a maximum of 2.52. Details of all tests are presented in this chapter.

66
4.2 TEST RESULTS
Before the shear tests, stress at the end zones of these specimens were previously studied in the first phase of this experimental program by O’Callaghan (2007). O’Callaghan (2007) observed that at the moment the strands were released and the prestress force was transferred into the concrete section, transverse bursting stresses in the section were resisted by the transverse reinforcement. It was found that shear reinforcement (R-bars in Figure 3-12) was stressed up to 32 ksi in some cases. These transverse stresses caused longitudinal cracks, with the most critical ones located at the bottom flange-web interface. While loading the Tx28 girders to shear failure, the experimental investigation team observed that the primary bursting cracks at the bottom flange-web interface opened up and extended into the girder and inclined up into the web. Furthermore, the ultimate failure crack in all cases was an extension of the primary or critical bursting crack at the bottom flange to web interface. Although, all tests yielded conservative results, the failure mode for all specimens was related to bond slip and sliding of the web along the bottom flange-web interface (horizontal shear) leading the investigation team to believe that the initial bursting stresses at the end zones of the girders decreased the shear carrying capacity of the member.
4.2.1 Tx28-II Shear Test Results
4.2.1.1 Evaluation after Release
At the time of shear testing, the compressive strength of concrete for specimen Tx28-II was 11,400 psi. The compressive strength of concrete at release was 6,500 psi. The cracks that formed at prestress transfer were measured and documented before the shear tests as shown in Figure 4- 1 and Figure 4- 2. The maximum crack width before the test was approximately 0.009 inches, but most cracks were not wider than 0.007 inches.

67
Figure 4- 1: Tx28-II Live End before Test 1.
Figure 4- 2: Tx28-II Dead End before Test 2.
Max width of 0.009”
Max width of 0.009”
Cracks from Test 1 shown in red
Release Cracks shown in blue
Release Cracks shown in blue
Critical Bursting Crack before tests (Below dashed blue line)
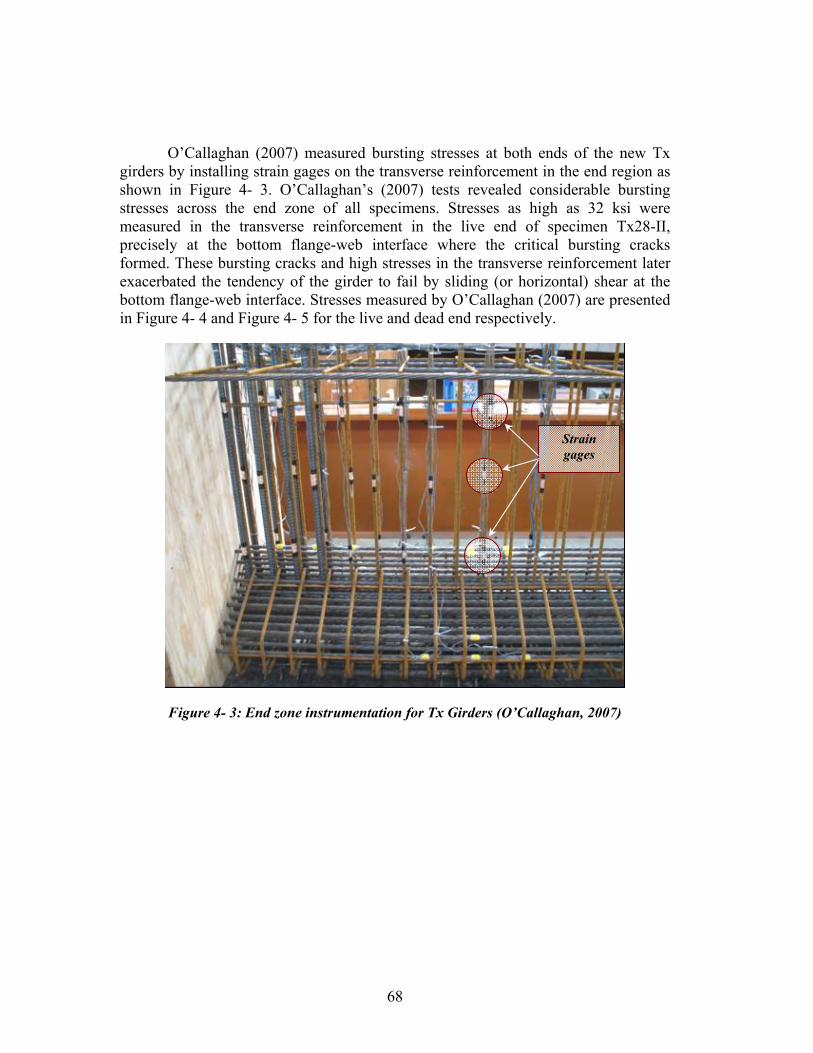
68
O’Callaghan (2007) measured bursting stresses at both ends of the new Tx girders by installing strain gages on the transverse reinforcement in the end region as shown in Figure 4- 3. O’Callaghan’s (2007) tests revealed considerable bursting stresses across the end zone of all specimens. Stresses as high as 32 ksi were measured in the transverse reinforcement in the live end of specimen Tx28-II, precisely at the bottom flange-web interface where the critical bursting cracks formed. These bursting cracks and high stresses in the transverse reinforcement later exacerbated the tendency of the girder to fail by sliding (or horizontal) shear at the bottom flange-web interface. Stresses measured by O’Callaghan (2007) are presented in Figure 4- 4 and Figure 4- 5 for the live and dead end respectively.
Figure 4- 3: End zone instrumentation for Tx Girders (O’Callaghan, 2007)
Strain gages

0
5
10
15
20
25
30
35
0 5 10 15 20 25 30 35Distance from Face of Girder (in)
Stre
ss (k
si)
1721201
2
912"
1'-1"171"
201"
1'-1""
"172
1201
2
912"
1'-1"171"
201"
1'-1""
"221721201
2
912"
1'-1"171"
201"
1'-1""
"172
1201
2
912"
1'-1"171"
201"
1'-1""
"22
Figure 4- 4: Live end bursting stresses for Tx28-II specimen (O’Callaghan, 2007)
69

0
5
10
15
20
25
30
35
0 5 10 15 20 25 30 35Distance from Face of Girder (in)
Stre
ss (k
si)
1721201
2
912"
1'-1"171"
201"
1'-1""
"172
1201
2
912"
1'-1"171"
201"
1'-1""
"221721201
2
912"
1'-1"171"
201"
1'-1""
"172
1201
2
912"
1'-1"171"
201"
1'-1""
"22
Figure 4- 5: Dead end bursting stresses for Tx28-II specimen (O’Callaghan, 2007)
70
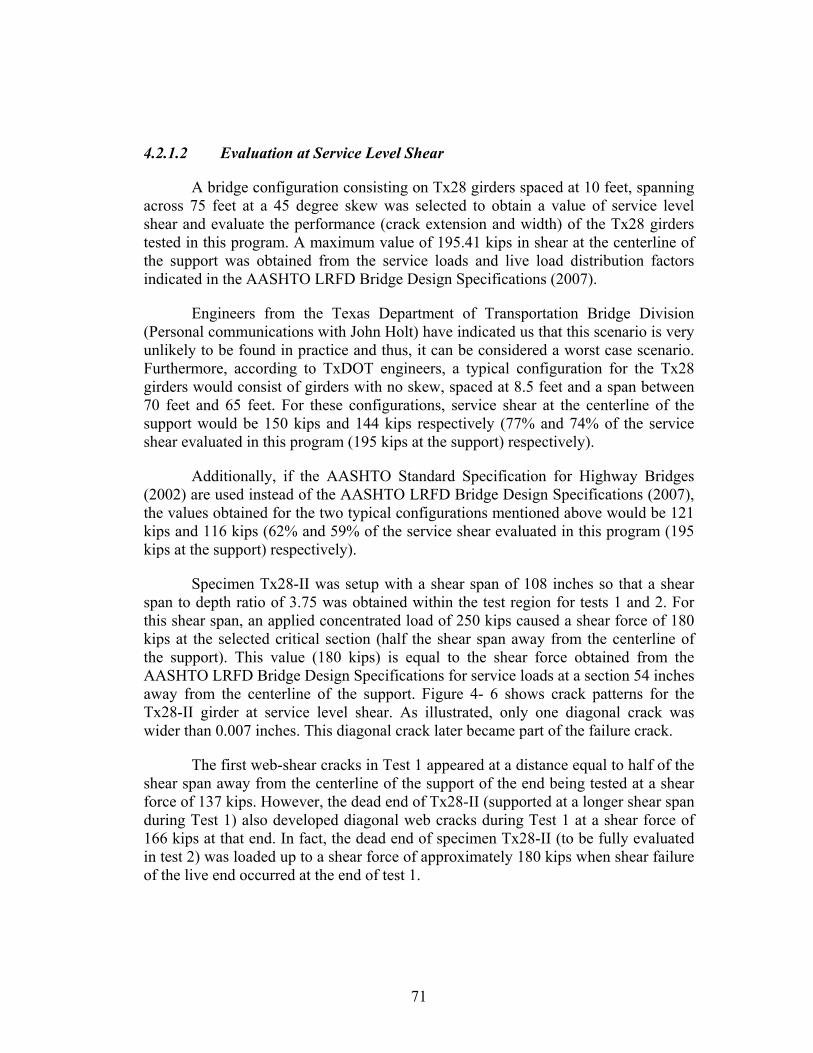
71
4.2.1.2 Evaluation at Service Level Shear
A bridge configuration consisting on Tx28 girders spaced at 10 feet, spanning across 75 feet at a 45 degree skew was selected to obtain a value of service level shear and evaluate the performance (crack extension and width) of the Tx28 girders tested in this program. A maximum value of 195.41 kips in shear at the centerline of the support was obtained from the service loads and live load distribution factors indicated in the AASHTO LRFD Bridge Design Specifications (2007).
Engineers from the Texas Department of Transportation Bridge Division (Personal communications with John Holt) have indicated us that this scenario is very unlikely to be found in practice and thus, it can be considered a worst case scenario. Furthermore, according to TxDOT engineers, a typical configuration for the Tx28 girders would consist of girders with no skew, spaced at 8.5 feet and a span between 70 feet and 65 feet. For these configurations, service shear at the centerline of the support would be 150 kips and 144 kips respectively (77% and 74% of the service shear evaluated in this program (195 kips at the support) respectively).
Additionally, if the AASHTO Standard Specification for Highway Bridges (2002) are used instead of the AASHTO LRFD Bridge Design Specifications (2007), the values obtained for the two typical configurations mentioned above would be 121 kips and 116 kips (62% and 59% of the service shear evaluated in this program (195 kips at the support) respectively).
Specimen Tx28-II was setup with a shear span of 108 inches so that a shear span to depth ratio of 3.75 was obtained within the test region for tests 1 and 2. For this shear span, an applied concentrated load of 250 kips caused a shear force of 180 kips at the selected critical section (half the shear span away from the centerline of the support). This value (180 kips) is equal to the shear force obtained from the AASHTO LRFD Bridge Design Specifications for service loads at a section 54 inches away from the centerline of the support. Figure 4- 6 shows crack patterns for the Tx28-II girder at service level shear. As illustrated, only one diagonal crack was wider than 0.007 inches. This diagonal crack later became part of the failure crack.
The first web-shear cracks in Test 1 appeared at a distance equal to half of the shear span away from the centerline of the support of the end being tested at a shear force of 137 kips. However, the dead end of Tx28-II (supported at a longer shear span during Test 1) also developed diagonal web cracks during Test 1 at a shear force of 166 kips at that end. In fact, the dead end of specimen Tx28-II (to be fully evaluated in test 2) was loaded up to a shear force of approximately 180 kips when shear failure of the live end occurred at the end of test 1.
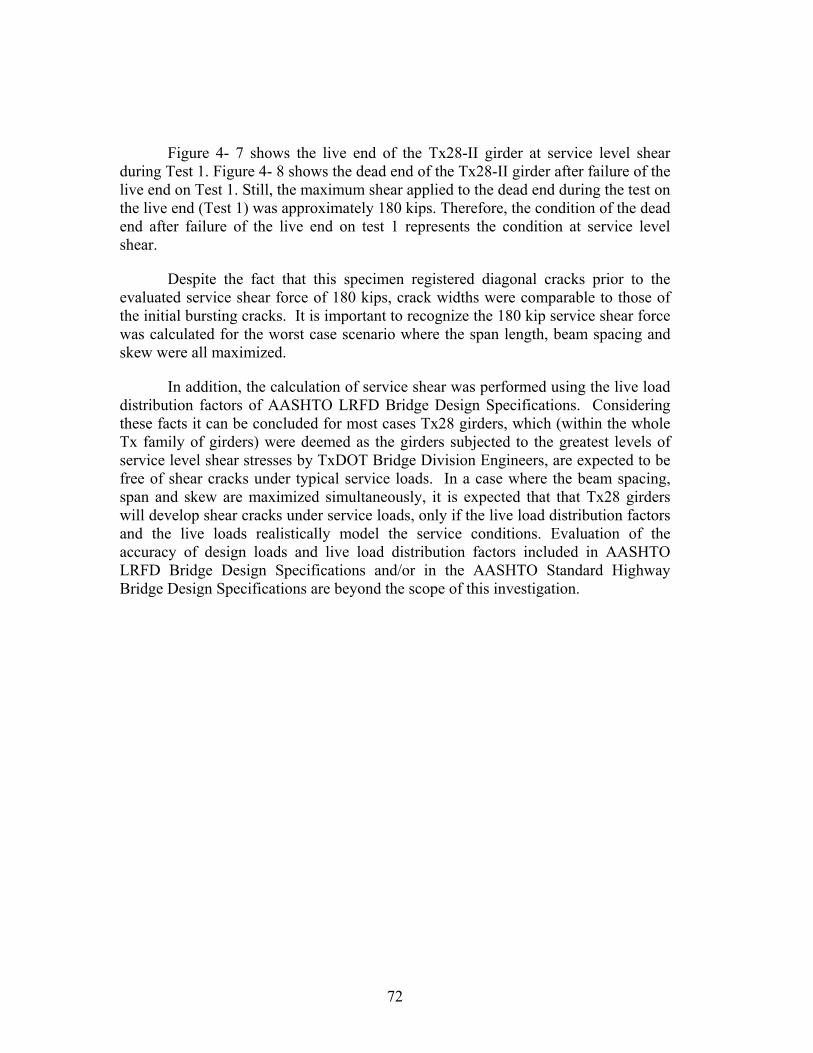
72
Figure 4- 7 shows the live end of the Tx28-II girder at service level shear during Test 1. Figure 4- 8 shows the dead end of the Tx28-II girder after failure of the live end on Test 1. Still, the maximum shear applied to the dead end during the test on the live end (Test 1) was approximately 180 kips. Therefore, the condition of the dead end after failure of the live end on test 1 represents the condition at service level shear.
Despite the fact that this specimen registered diagonal cracks prior to the evaluated service shear force of 180 kips, crack widths were comparable to those of the initial bursting cracks. It is important to recognize the 180 kip service shear force was calculated for the worst case scenario where the span length, beam spacing and skew were all maximized.
In addition, the calculation of service shear was performed using the live load distribution factors of AASHTO LRFD Bridge Design Specifications. Considering these facts it can be concluded for most cases Tx28 girders, which (within the whole Tx family of girders) were deemed as the girders subjected to the greatest levels of service level shear stresses by TxDOT Bridge Division Engineers, are expected to be free of shear cracks under typical service loads. In a case where the beam spacing, span and skew are maximized simultaneously, it is expected that that Tx28 girders will develop shear cracks under service loads, only if the live load distribution factors and the live loads realistically model the service conditions. Evaluation of the accuracy of design loads and live load distribution factors included in AASHTO LRFD Bridge Design Specifications and/or in the AASHTO Standard Highway Bridge Design Specifications are beyond the scope of this investigation.

Figure 4- 6: Crack patterns for Tests 1 and 2 on Tx28-II at Service Level Shear. West face is shown.
73

74
Figure 4- 7: Live end of Tx28-II at Service Level Shear during Test 1. East face is shown.
Figure 4- 8: Dead End of Tx28-II after shear failure of live end in Test 1. East face is shown.
4.2.1.3 Evaluation at Failure
At failure, for both tests, the critical bursting crack extended longitudinally from the end of the girder to approximately 48 inches from the center line of the bearing pad where it inclined up into the web at an angle of about 26°. This diagonal crack crossed the centroid of the cross section at approximately 54 inches away from the center line of the bearing pad. This distance coincides with half of the shear span thus, for comparison purposes, given that the applied shear and the predicted shear capacity are variable along the length of the member, the critical section is taken at a distance equal to half the shear span away from the centerline of the bearing pad.
Future failure crack (above dashed blue line)
Future failure crack (above dashed blue line)

75
Estimated shear strengths and measured shear values are detailed in Table 4- 1. As depicted in Table 4- 1, all predictions were conservative, with the AASHTO Segmental Specifications being the most conservative.
Table 4- 1: Estimated and experimental shear strength at the critical section for shear tests conducted on specimen Tx28-II
V (kips)
Estimated Shear Strength
Test ACI 318 AASHTO LRFD
AASHTO Segmental Simple
Method Detailed Method
General Procedure
Simplified Procedure
TEST 1 (Live end Tx28-II)
156.4 232.1 232.5 228.9 155.1 370.5
TEST 2 (Dead end
Tx28-II) 156.4 232.1 232.5 228.9 155.1 375.4
Figure 4- 9 and Figure 4- 10 show the variation of the applied shear and the predicted shear capacity (Vn) along the length of the member for test 1 and test 2 respectively. At failure, crack patterns provided no additional information to the behavior of the beam. Crack patterns at the evaluated service level shear are shown. The usual variation of the nominal capacity along the length of the member is attenuated by the fact that the web-shear capacity (Vcw) governs throughout the whole shear span, i.e. the test region.

Figure 4- 9: Shear Diagram at failure for Test 1
-300
-200
-100
0
100
200
300
400
500
600
0 12 24 36 48 60 72 84 96 108 120
Distance from CL of BRG (in)
Shea
r (k
ips)
Applied Shear Vn (ACI Simple) Vn (ACI detailed) Vn (LRFD General) Vn (LRFD Simplified)
Critical Section
76
• Crack pattern showed corresponds to V = 180 kips • Critical Failure Crack is indicated in dashed Orange

Figure 4- 10: Shear Diagram at failure for Test 2
-300-200-100
0100200300400500600
0 12 24 36 48 60 72 84 96 108 120
Distance from CL of BRG (in)
Shea
r (k
ips)
Applied Shear Vn (ACI Simple) Vn (ACI detailed) Vn (LRFD General) Vn (LRFD Simplified)
Critical Section
77
• Crack pattern showed corresponds to V = 180 kips • Critical Failure Crack is indicated in dashed Orange

78
Figure 4- 11 and Figure 4- 12 show the Tx28-II girder after failures in test 1 and test 2 respectively. Due to the fact that the dead end of the girder had cracks that formed during test 1, a different colored marker (green) was used to accentuate the cracks that formed during test 2. Spalling can be observed in both cases due to localized web crushing. Failure was accompanied by a loud sound that is more typical of concrete splitting than concrete crushing. Subsequently, the load carried by the specimen dropped.
After the completion of Test 1, the specimen was carefully examined. Extensive cracking on the live end of the girder was observed as shown in Figure 4- 13. Cracks at the ends of the girder for tests 1 and 2 can be compared in Figure 4- 13 and Figure 4- 14 respectively. No obvious strand slip was observed during test 1 and, at the time, no special instrumentation was provided to measure strand slip. However, given the amount of cracks observed in Figure 4- 13 (Test 1), a video camera was set up at end of the girder to try to capture strand slip in the subsequent tests. Figure 4- 15 illustrates the video frames just before and just after the failure in Test 2. By using photogrammetry the strand slip was estimated to be ¼ in.
As previously mentioned, for tests 1 and 2 the girder failed through sliding along the bottom flange-web interface –i.e. horizontal shear failure. Figure 4- 16 illustrates the critical bursting crack developed at release, inclining down into the bottom flange at the end of the girder and separating the bottom flange from the rest of the beam as much as an eighth of an inch after test 2. This wide separation was evident all along the length of the failure crack (blue dashed line in Figure 4- 16).

Figure 4- 11: Live end of Tx28-II at failure for Test 1.
Localized spalling
Localized spalling
79
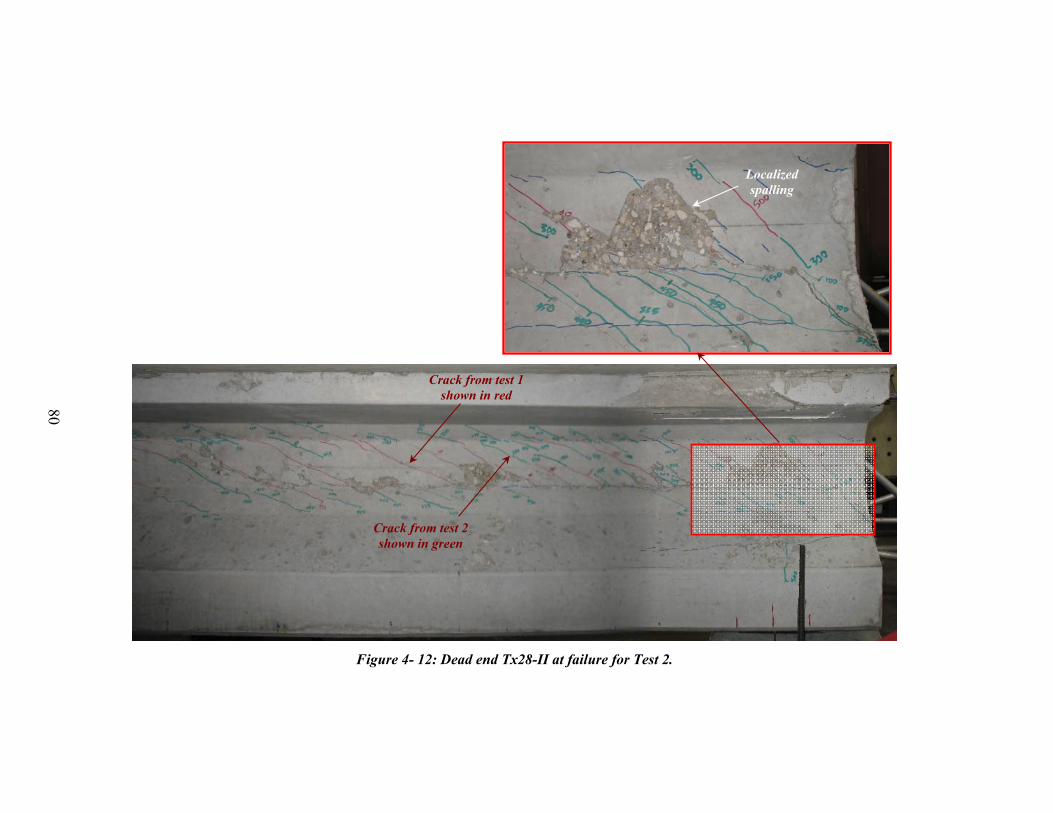
Figure 4- 12: Dead end Tx28-II at failure for Test 2.
Crack from test 1 shown in red
Crack from test 2 shown in green
Localized spalling
80

81
Figure 4- 13: Live end of Tx28-II after Test 1.
Figure 4- 14: Dead end of Tx28-II after Test 2.
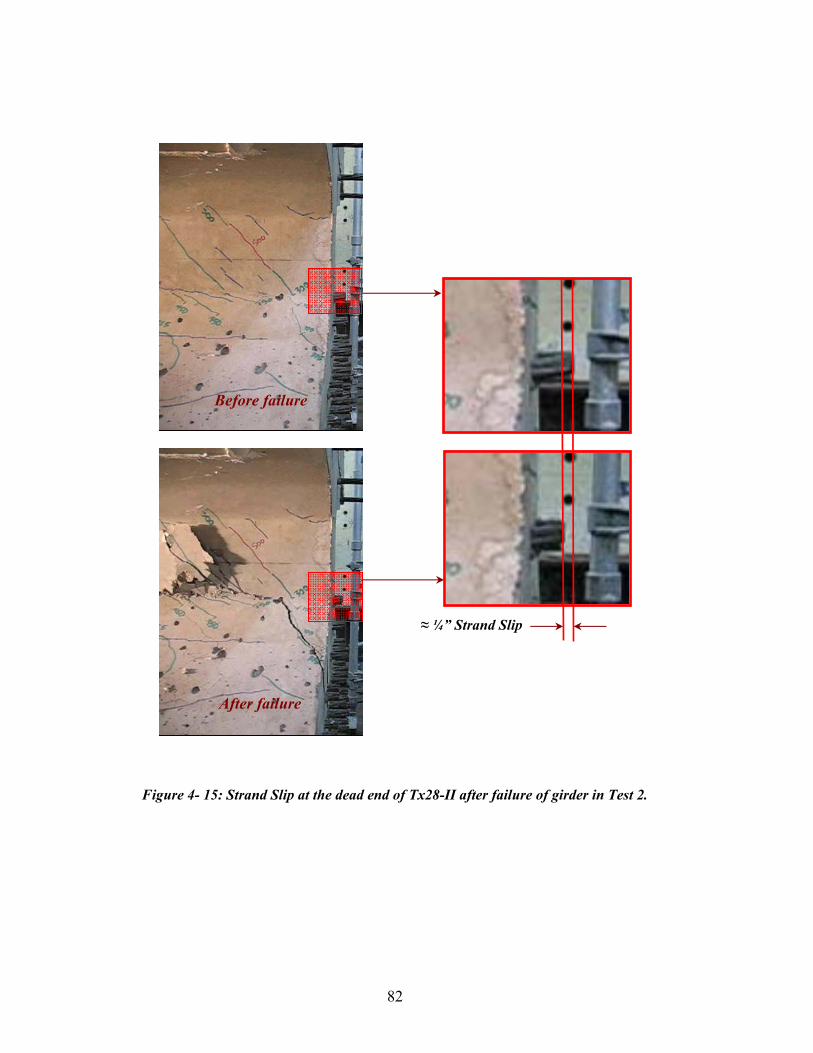
82
Figure 4- 15: Strand Slip at the dead end of Tx28-II after failure of girder in Test 2.
≈ ¼” Strand Slip
Before failure
After failure

83
Figure 4- 16: Splitting through the bottom flange at the dead end of Tx28-II after failure of girder (Test 2).
Critical Bursting Crack after test 2 (Below dashed blue line)

84
Load-deflection curves, obtained in tests 1 and 2 were very similar as shown in Figure 4- 17. Deflections measured under the load point were slightly greater in Test 2. This behavior is attributed to the loss of stiffness associated with cracking during Test 1. The maximum applied load was 529.0 kips and 536.3 kips for Test 1 and Test 2 respectively.
Test 1 Test 2
0
100
200
300
400
500
600
0 0.2 0.4 0.6 0.8 1 1.2
Deflection under the load point (in)
Load
(kip
s)
Figure 4- 17: Load-Deflection Curves for tests 1 and 2 on Tx28-II.

85
4.2.2 Tx28-I Shear Test Results
4.2.2.1 Evaluation after release
At prestress transfer, the compressive strength of concrete was 10,000 psi for Specimen Tx28-I. At the time of shear testing the compressive strength of concrete was measured to be 13,800 psi. The higher release strength resulted in fewer and narrower cracks, compared to those of Tx28-II which had a release strength of 6,475 psi. In Tx28-I, all crack widths were smaller than 0.005 inches. The difference in the amount of cracking can be observed by comparing Figure 4- 1 to Figure 4- 18 which show specimens Tx28-II and Tx28-I respectively.
Figure 4- 18: Tx28-I dead end before Test 3.
Figure 4- 19 shows the live end of Tx28-I before test 4. Release cracks are marked in blue, as well as one crack formed during test 3 shown in red.
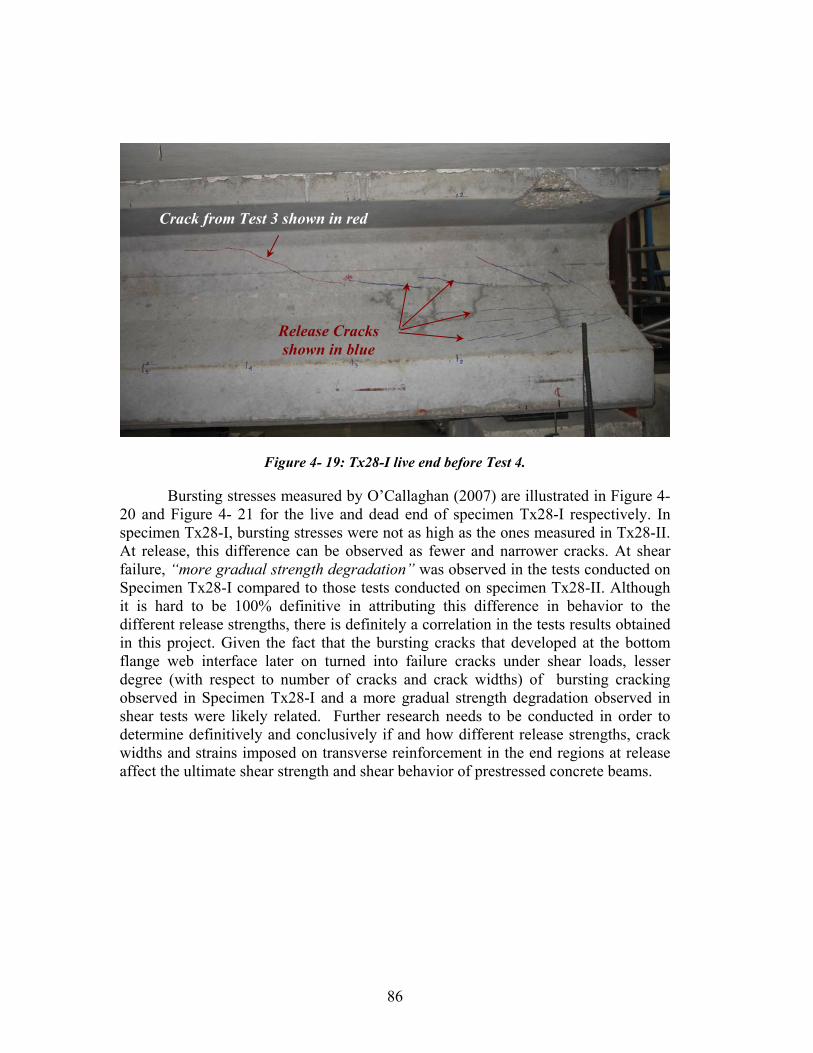
86
Figure 4- 19: Tx28-I live end before Test 4.
Bursting stresses measured by O’Callaghan (2007) are illustrated in Figure 4- 20 and Figure 4- 21 for the live and dead end of specimen Tx28-I respectively. In specimen Tx28-I, bursting stresses were not as high as the ones measured in Tx28-II. At release, this difference can be observed as fewer and narrower cracks. At shear failure, “more gradual strength degradation” was observed in the tests conducted on Specimen Tx28-I compared to those tests conducted on specimen Tx28-II. Although it is hard to be 100% definitive in attributing this difference in behavior to the different release strengths, there is definitely a correlation in the tests results obtained in this project. Given the fact that the bursting cracks that developed at the bottom flange web interface later on turned into failure cracks under shear loads, lesser degree (with respect to number of cracks and crack widths) of bursting cracking observed in Specimen Tx28-I and a more gradual strength degradation observed in shear tests were likely related. Further research needs to be conducted in order to determine definitively and conclusively if and how different release strengths, crack widths and strains imposed on transverse reinforcement in the end regions at release affect the ultimate shear strength and shear behavior of prestressed concrete beams.
Crack from Test 3 shown in red
Release Cracks shown in blue

0
5
10
15
20
25
0 5 10 15 20 25 30 35Distance From Girder Face (in)
Stre
ss (k
si)
1'-1"171
2"201
2"
1'-1"171
2"201
2"
0
5
10
15
20
25
0 5 10 15 20 25 30 35Distance From Girder Face (in)
Stre
ss (k
si)
1'-1"171
2"201
2"
1'-1"171
2"201
2"
Figure 4- 20: Live end bursting stresses for Tx28-I specimen (O’Callaghan, 2007)
87

0
5
10
15
20
25
0 5 10 15 20 25 30 35Distance From Girder Face (in)
Stre
ss (k
si) 1'-1"
1712"201
2"
1'-1"171
2"201
2"
0
5
10
15
20
25
0 5 10 15 20 25 30 35Distance From Girder Face (in)
Stre
ss (k
si) 1'-1"
1712"201
2"
1'-1"171
2"201
2"
Figure 4- 21: Dead end bursting stresses for Tx28-I specimen (O’Callaghan, 2007)
88

89
4.2.2.2 Evaluation at Service Level Shear
Specimen Tx28-I was set up so that a shear span to depth ratio of 2.9 was obtained, smaller than that used for tests on Tx28-II (a/d = 3.75).The first web-shear cracks in Test 3 appeared at a shear force of 144.0 kips. For test 4, the first web-shear cracks appeared at a shear of 162.7 kips. For a shear span to depth ratio of 2.9, an applied load of 225 kips caused a shear force of 181.5 kips, close to the service level shear to be evaluated. Cracks at service level shear can be observed in Figure 4- 22 through Figure 4- 24. The amount of cracks and corresponding crack widths caused by the applied loads for Tests 3 and 4 are similar to those observed in Tests 1 and 2. The difference in the amount of cracks developed at release makes specimen Tx28-II appear to be relatively more deteriorated than specimen Tx28-I, but if release cracks are filtered out, the similarity of the crack patterns at service load near the critical section is evident as shown in Figure 4- 25.

Figure 4- 22: Crack patterns for Tests 3 and 4 on Tx28-I at Service Level Shear. West face is shown.
90

91
Figure 4- 23: Dead End of Tx28-I at Service Level Shear for Test 3 East Face is shown.
Figure 4- 24: Live End of Tx28-I at Service Level Shear for Test 4 East Face is shown.
Future failure crack (above dashed blue line)
Future failure crack (above dashed blue line)

Figure 4- 25: Comparison of cracks caused by applied load at service level shear for tests 1 and 3 (Release cracks are not shown)
92

93
4.2.2.3 Evaluation at Failure
Similarly to Tests 1 and 2, at failure, the critical bursting crack at the bottom flange-to-web interface extended longitudinally from the end of the girder to approximately 31 inches from the center line of the bearing pad where it inclined up into the web at an angle of about 21°. This diagonal crack crossed the centroid of the section at approximately 45 inches away from the center line of the bearing pad. Once again, this distance is approximately half of the shear span which is 84 inches for tests 3 and 4. Thus, for comparison purposes, the critical section is taken at a distance equal to half the shear span away from the centerline of the bearing pad (the same definition of the critical section used in Tests 1 and 2). Estimated shear strengths and experimentally measured values are presented in Table 4- 2. All predictions were conservative, with AASHTO Segmental Specifications being the most conservative. For this specimen, predictions with different provisions were not as consistent as they were for specimen Tx28-II.
Table 4- 2: Estimated and experimental shear strength at the critical section for shear tests conducted on specimen Tx28-I
V (kips)
Estimated Shear Strength
Test ACI 318 AASHTO LRFD
AASHTO Segmental Simple
Method Detailed Method
General Procedure
Simplified Procedure
TEST 3 (Dead end
Tx28-I) 165.3 216.6 226.4 202.2 150.9 416.8
TEST 4 (Live end
Tx28-I) 165.3 216.6 226.4 202.2 150.9 400.1
Figure 4- 26 and Figure 4- 27 show the variation of the applied shear (applied concentrated load plus distributed self weight) and the predicted shear capacity (Vn) along the length of the member for test 3 and test 4 respectively. At failure, similar to the first two tests, crack patterns provided no additional information on the behavior of the beam. Crack patterns at the evaluated service level shear are shown with the critical failure crack accentuated.

Figure 4- 26: Shear Diagram at failure for Test 3
-200
-100
0
100
200
300
400
500
600
0 12 24 36 48 60 72 84 96 108 120
Distance from CL of BRG (in)
Shea
r (k
ips)
Applied Shear Vn (ACI Simple) Vn (ACI detailed) Vn (LRFD General) Vn (LRFD Simplified)
Critical Section
94
• Crack pattern showed corresponds to V = 180 kips • Critical Failure Crack is indicated in dashed Orange

Figure 4- 27: Shear Diagram at failure for Test 4
-200
-100
0
100
200
300
400
500
0 12 24 36 48 60 72 84 96 108 120
Distance from CL of BRG (in)
Shea
r (k
ips)
Applied Shear Vn (ACI Simple) Vn (ACI detailed) Vn (LRFD General) Vn (LRFD Simplified)
Critical Section
95
• Crack pattern showed corresponds to V = 180 kips • Critical Failure Crack is indicated in dashed Orange

96
Figure 4- 28 and Figure 4- 29 show the Tx28-I specimen after failure in test 3 and 4 respectively. As can be observed in these figures, the amount of localized spalling was small compared to that of tests 1 and 2. The loud concrete splitting sound that was heard in Tests 1 and 2 was not as loud in test 3 and did not occur in test 4. For the first two tests, this loud sound and the extensive cracking of the end face of the girder were both signs of strand slip. For test 2, strand slip was actually captured on video. For tests 3 and 4, the amount of cracking on the end faces of the girder was much less extensive, localized or discrete as can be seen in Figure 4- 30 and Figure 4- 31.
The deflections measured under the load point in Tests 3 and 4 were greater after the peak load compared to tests 1 and 2. The decrease in deflections prior to the peak load is attributed to the different shear span-to-depth ratios used in Tests 3 and 4. In tests 1 and 2, deflections increased 20% after the peak load dropped 38% on average for both tests. Conversely, in tests 3 and 4, deflections increased 51% after the peak load dropped 24% before the tests were stopped for safety reasons. The differences in the post-peak performances can be observed by comparing the slopes of the descending branches of the load-deflection curves for all the tests as shown in Figure 4- 33. The difference in the post-peak response can be attributed to (i) the different shear span-depth-ratios used in Tests 1, 2 and 3, 4 and (ii) different levels of stresses imposed (lesser for Tx28-I, i.e. Tests 3 and 4) on the shear reinforcement at release. Additional research should be conducted to determine whether or not different release strengths and associated shear rebar stresses at release measured in both specimens is of primary importance. This is considered beyond the scope of the current study.

97
Figure 4- 28: Dead end of Tx28-I at failure for Test 3.
Figure 4- 29: Live end of Tx28-I at failure for Test 4.

98
Figure 4- 30: Dead end of Tx28-I after Test 3.
Figure 4- 31: Live end of Tx28-I after Test 4.

99
Test 3
Test 4
0
100
200
300
400
500
600
0 0.2 0.4 0.6 0.8 1 1.2
Deflection under the load point (in)
Load
(kip
s)
Figure 4- 32: Load-Deflection curves for tests 3 and 4 on Tx28-I.

100
Test 1 Test 2
Test 3Test 4
0
100
200
300
400
500
600
0 0.2 0.4 0.6 0.8 1 1.2
Deflection under the load point (in)
Load
(kip
s)
Figure 4- 33: Load-Deflection curve for all tests.
4.3 SUMMARY
Four shear tests were conducted on two Tx28 girder specimens. The shear strength estimations obtained through the use of AASHTO LRFD, AASHTO Segmental and ACI 318 Design Specifications were conservative. Figure 4- 34 shows comparisons between shear strength estimations obtained using different provisions, with the AASHTO Segmental Specifications being the most conservative. The Detailed Method presented in ACI 318, the General Procedure (MCFT based) and the Simplified Procedure presented in the AASHTO-LRFD Bridge Design Specifications yielded consistent and conservative strength estimations. The Simple Method presented in ACI 318 and the AASHTO Segmental Specifications yielded consistent results with a greater degree of conservatism compared to the remaining design provisions. Shear strength ratios (Vtest/Vcalc) for the four tests ranged between 1.59 and 2.76 (Figure 4- 35).

101
156.
4
165.
3
165.
3232.
1
232.
1
216.
6
216.
6
232.
5
232.
5
226.
4
226.
4
228.
9
228.
9
202.
2
202.
2
155.
1
155.
1
150.
9
150.
9
370.
5
375.
4 416.
8
400.
1
156.
4
0
50
100
150
200
250
300
350
400
450
TEST 1 TEST 2 TEST 3 TEST 4
She
ar (k
ips)
Simple Method Detailed Method General ProcedureSimplified Procedure Segmental Specifications Test
Figure 4- 34: Shear strength: Estimations vs. Experiments
2.37 2.40 2.
52
2.42
1.60
1.62
1.92
1.85
1.59 1.61 1.
84
1.77
1.62
1.64
2.06
1.98
2.39 2.42
2.76
2.65
0.0
0.5
1.0
1.5
2.0
2.5
3.0
TEST 1 TEST 2 TEST 3 TEST 4
V tes
t/Vca
lc
ACI Simple ACI Detailed LRFD General LRFD Simplified Segmental
Figure 4- 35: Shear strength ratio comparison for all tests.

102
Cracking shear was best estimated by the web-shear strength equation for Vcw, given in ACI-318-08. The Vcw equation given in the AASHTO-LRFD Bridge Design Specifications underestimated the cracking shear on average by 37% while the AASHTO Segmental Specifications underestimated the cracking shear on average by almost 70%. Results for cracking shears are summarized in Table 4- 3. Figure 4- 36 shows comparisons of estimated cracking shear and the experimental cracking shear for all tests. ACI 318’s simple method and the general procedure included in the AASHTO LRFD Bridge Design Specifications were not evaluated on their ability to predict cracking shear because these methods are not intended to predict cracking shear. The ratio of the experimental to estimated cracking shear (Vcrack/Vcalc) for all the tests is presented in Figure 4- 37.
Table 4- 3: Summary of Cracking Shear Results
Vc (kips)
ACI Detailed
LRFD Simplified
AASHTO Segmental Test
TEST 1 161.1 114.0 86.0 137.0
TEST 2 161.1 114.0 86.0 166.0
TEST 3 159.0 108.9 94.8 144.0
TEST 4 159.0 108.9 94.8 163.0
161.
1
161.
1
159.
0
159.
0
114.
0
114.
0
108.
9
108.
9
86.0
86.0 94
.8
94.8
137.
0
166.
0
144.
0 163.
0
0
20
40
60
80
100
120
140
160
180
TEST 1 TEST 2 TEST 3 TEST 4
Cra
ckin
g Sh
ear (
kips
)
ACI Detailed LRFD Simplified AASHTO Segmental Test
Figure 4- 36: Cracking shear: Estimates vs. Experiments

103
1.03 1.031.20
1.461.32
1.501.59
1.93
1.52
1.72
0.85 0.91
0.0
0.2
0.4
0.6
0.8
1.0
1.2
1.4
1.6
1.8
2.0
TEST 1 TEST 2 TEST 3 TEST 4
V cra
ck/V
calc
ACI Detailed LRFD Simplified AASHTO Segmental
Figure 4- 37: Experimental to estimated cracking shear ratio
Regarding serviceability, although all girders had some diagonal cracks at the evaluated service shear level (V = 180 kips), maximum crack widths at this point were not wider than the cracks formed initially after the prestress transfer.
Furthermore, considering that the shear at which the evaluations were performed represents a worst case scenario, it is anticipated that Tx28 girders will not present serviceability problems for typical bridge superstructure configurations used in Texas.
Figure 4- 38 shows comparisons between the experimental cracking shear, the estimated capacity using the Detailed Method from the ACI 318 code and the experimental failure shear. It can be seen how, for the amount of shear reinforcement (2 #4 bars spaced at 12 inches for specimen Tx28-I or 2 D19.7 deformed welded wires spaced at 12 inches for specimen Tx28-II) and the level of prestressing force used in the specimens, the Tx28 section remained uncracked for at least 59% of the estimated shear strength. Thus, as long as the ratio of the service shear to the ultimate shear is smaller than 59%, Tx28 girders should remain uncracked under service loads. In practice, the actual compressive strength of concrete used in the fabrication of prestressed girders will normally by higher than that used for design calculations, hence, cracking shear estimations should normally be on the conservative side. However, it is possible to have prestressed girders with relatively low concrete strengths (i.e. 8,000 psi) compared to the strengths of the girders tested within this program (11,375 psi and 13,825 psi). Given that Vcw is a function of the root of the

104
compressive strength of concrete and the applied prestressing force, smaller compressive strengths do not change drastically the cracking shear. For the Tx28-II girder, a 30% lower compressive strength (8,000 psi) would cause a drop in the estimated cracking shear of 7.5%. For the Tx28-I girder, a 42% lower compressive strength (8,000 psi) would cause a drop in the estimated cracking shear of 12%. These lower estimated cracking shears (159 kips and 139 kips) due lower concrete compressive strengths are comparable to the typical service shear levels described in section 4.2.1.2. It is very unlikely to have lower strength concretes and at the same time having that girder used in a maximized span, with maximum girder separation and skew. Hence, the lower estimated cracking shears (159 kips and 139 kips) need not to be compared to the worst case scenario service level shear of this program (180 kips).
Finally and perhaps most important, given the degree of accuracy of the Vcw equation given in ACI 318 or in the AASHTO Standard Specifications, bridge designers have the ability to change their designs in order to have their sections remain uncracked under service loads when appropriate with an acceptable degree of confidence in their estimations.
Vcrack =137.0 k 37% of Vtest
59% of Vn
Vcrack =166.0 k44% of Vtest72% of Vn
Vcrack =144.0 k35% of Vtest66% of Vn
Vcrack =163.0 k41% of Vtest75% of Vn
Vn = 232.1 k Vn = 232.1 kVn = 216.6 k Vn = 216.6 k
Vtest = 370.5 k Vtest = 375.4 kVtest = 416.8 k Vtest = 400.1 k
0
50
100
150
200
250
300
350
400
450
TEST 1 TEST 2 TEST 3 TEST 4
Shea
r (ki
ps)
Cracking Shear Vn (ACI Detailed) Experimental
Figure 4- 38: Cracking shear to nominal and maximum shear comparison for all tests.
Regarding the failure mode, it was found that for the Tx28 girders, bond slip and sliding along the bottom flange-web interface controlled the capacity of the section near the end region. The use of the upper limit on shear strength included in

105
the AASHTO LRFD Bridge Design Specifications ( pvvc Vdbf +'25.0 ), which is intended to prevent diagonal web crushing, is not recommended for the shear design of Tx girders. The shear design strength of the beams tested in this study obtained through the use of the AASHTO LRFD Bridge Design Specifications is not governed by the previously mentioned upper limit. In order to increase the section’s shear capacity beyond the allowed upper limit, an increased amount of shear reinforcement may be assumed as the only option considering that the prestressing force (and hence Vc) in the section was already maximized for flexural capacity. However, the authors believe that even with the addition of more shear reinforcement, failure of the section tested in this study would still be governed by bond slip and sliding shear along the bottom flange-web interface, leading to failures similar to those observed in this project.
Until further research is conducted on the shear capacity of Tx sections with maximized amounts of shear reinforcement, a limit of pvvc Vdbf +'16.0 is recommended to account for the possibility of bond slip-sliding shear failure modes. This design recommendation is a lower bound limit for the shear capacity of the specimens tested in this study (Figure 4- 39). Furthermore, it is important to recognize that with additional testing of different girder depths, prestressing force and the presence of draped strands this limit may need to be further adjusted to obtain a safe lower bound.
In a similar manner, Hawkins et al. (2007) found that for the shear tests on bulb-tee girders presented in NCHRP 579, a limit of pvvc Vdbf +'18.0 was needed for non-integral beam ends. This limit proposed by Hawkins et al. (2007) resulted from a series of tests that included specimens with maximized shear reinforcement. Shear tests on Tx sections with maximized shear reinforcement could reveal further agreement with Hawkins et al. (2007) findings.

106
0.18 0.180.17
0.16
0.00
0.02
0.04
0.06
0.08
0.10
0.12
0.14
0.16
0.18
0.20
TEST 1 TEST 2 TEST 3 TEST 4
'max
cfv
Figure 4- 39: Maximum shear stress ratio for all tests.
While it is possible to make recommendations for designing Tx Girders and such recommendations were made within this chapter, it is not possible to make general design recommendations in light of four shear tests. Consequently, the results of the tests conducted on Tx28 girders are added to the University of Texas Prestressed Shear Database in Chapter 5. General design recommendations will be based on the analysis of the prestressed concrete shear database.
107
CHAPTER 5 Recommendations for Shear Design
5.1 INTRODUCTION
By including the results for the four shear tests conducted on Tx28 girders, the total number of specimens included in the University of Texas prestressed concrete shear database was augmented to 506. Shear failure could be confirmed for 367 of the 506 tests reported in the literature by a thorough examination of the shear database.. Data from 367 tests are considered to be more than sufficient to evaluate current design provisions with respect to strength and serviceability.
Five different shear design provisions from ACI and AASHTO are critically examined in this chapter. In light of extensive experimental data, nominal shear capacity provisions, minimum shear reinforcement requirements and the provisions for the upper limit imposed on the stirrup contribution to shear strength are examined for all of the aforementioned design provisions or procedures.
5.2 EVALUATION OF CURRENT SHEAR DESIGN PROVISIONS FOR STRENGTH
The shear capacities of all specimens were estimated using the relevant provisions of different design codes. Subsequently, the estimated capacities (Vcalc) were compared to the maximum shear forces carried by test specimens (Vexp) to obtain the shear strength ratio that can be described as follows:
Shear strength ratio = calcV
Vexp
This ratio can later be plotted against any other variable while looking for a distinctive trend in the prestressed concrete shear database. For the purposes of this investigation, only data from tests with confirmed shear failures were considered. Flexural failures, premature failures, anchorage failures and failure modes other than shear related failures were filtered out of the database. This filtering reduced the total number of specimens to 367. Using the results from these 367 tests, the following shear design provisions are examined:
a) ACI 318-08, Simple Method (MacGregor and Hanson, 1969)
b) ACI 318-08, Detailed Method (Vci and Vcw)
c) AASHTO-LRFD 2007, General Procedure (MCFT based)
d) AASHTO-LRFD 2007, Simplified Procedure (NCHRP 549)

108
e) AASHTO Guide Specifications for Design and Construction of Segmental Concrete Bridges 2nd Edition (1999)
Desirable design provisions should comply with the following characteristics:
• Most experiments should have a shear strength ratio of 1.
• Reasonable scatter should be expected with the majority of the points concentrated between shear strength ratios of 1 and a reasonable upper limit, i.e. 2. Scatter can be measured numerically through the coefficient of variation of the distribution.
• For reasonable statistical distribution of data, the percentage of unconservative estimates should be virtually equal to zero when an appropriate φ-factor is used.
• No pronounced biases should be found within the spectrum of possible designs, materials, techniques, geometries and applications.
5.2.1 Effect of shear span-to-depth ratio
Figure 5- 1 illustrates the relationship between the shear strength ratio and the shear span-to-depth ratio for all five shear design provisions and procedures. Specimens tested at relatively low shear spans (i.e. a/d < 2) can exhibit behavior that is not consistent with sectional shear design provisions. To this end, 65 % of the 367 tests with confirmed shear failures had a shear span-to-depth ratio ranging between 2 to 4. It is interesting to observe in Figure 5- 1 that while most of the unconservative estimations for the shear strength of the test specimens are for shear span-to-depth ratios greater than 2 for ACI 318 and AASHTO Segmental Specifications, the use of AASHTO LRFD design provisions yielded unconservative estimates for shear strength for a/d < 2.

109
0.0
1.0
2.0
3.0
4.0
5.0
6.0
0.0 2.0 4.0 6.0 8.0 10.0
a/d
Vtes
t/Vca
lc
0.0
1.0
2.0
3.0
4.0
5.0
6.0
0.0 2.0 4.0 6.0 8.0 10.0
a/d
Vtes
t/Vca
lc
Figure 5- 1: Shear Strength Ratio versus shear span-to-depth ratio for different design code provisions. (a) ACI 318-08 Simple Method, (b) ACI 318-08 Detailed Method,
(a) ACI 318-08 Simple Method
dbM
dVfV w
u
pucc ⎟⎟
⎠
⎞⎜⎜⎝
⎛+= 7006.0 '
scn VVV +=
dbfs
dfAV wc
ytvs
'8<=
dbfVdbf wccwc'' 52 ≤≤
(b) ACI 318-08 Detailed Method scn VVV +=
dMAX
CREipwcci V
MMVdbfV ++= '6.0
( ) ppwpcccw VdbffV +⋅+= 3.05.3 '
dbfs
dfAV wc
ytvs
'8<=
pwcci dbfV '7.1≥

110
0.0
1.0
2.0
3.0
4.0
5.0
6.0
0.0 2.0 4.0 6.0 8.0 10.0
a/d
Vtes
t/Vca
lc
0.0
1.0
2.0
3.0
4.0
5.0
6.0
0.0 2.0 4.0 6.0 8.0 10.0
a/d
Vtes
t/Vca
lc
Figure 5- 1 Continued: Shear Strength Ratio versus shear span-to-depth ratio for different design code provisions. (c) AASHTO-LRFD General Procedure, (d) AASHTO-LRFD Simplified Procedure
(c )AASHTO-LRFD General Procedure
vvcc dbfV '0316.0 β=
sdfA
V vyvs
θcot=
pvvcpscn VdbfVVVV +<++= '25.0
(d) AASHTO-LRFD Simplified Procedure
dcri
vvcci VM
MVdbfV ++=max
'0.632
( ) pvvpcccw VdbffV +⋅+= 3.09.1 '
( )s
dfAV vyv
s
θcot=
pvvcscn VdbfVVV +<+= '25.0
pwcci dbfV '9.1≥

111
0.0
1.0
2.0
3.0
4.0
5.0
6.0
0.0 2.0 4.0 6.0 8.0 10.0
a/d
Vtes
t/Vca
lc
Figure 5- 1 Continued: Shear Strength Ratio versus shear span-to-depth ratio for different design code provisions. (e) AASHTO-Segmental Specifications
5.2.2 Effect of concrete strength
Given the increased availability and use of higher strength concretes, design provisions have to be evaluated for high strength concrete as well.. In almost all the beams fabricated within the state of Texas, release strengths govern the concrete mixture design. The beam fabrication plants seek to achieve high concrete strengths to be able to release pretensioned beams within the first 12 to 18 hours. Such accelerated strength gains at early ages is what renders precast concrete beams economically feasible. At the same time, 28-day compressive strengths, or design strengths, are routinely exceeded. Regarding this matter, the research presented in NCHRP Report 579 proved that concrete strengths up to 18,000 psi can be used safely when using the design provisions from the AASHTO-LRFD Bridge Design Specifications and the AASHTO-Standard Specifications (Similar to ACI 318-08). As such, the primary purpose of plotting the experimental data in the format shown in Figure 5- 2, is not to re-examine the AASHTO LRFD or Standard Bridge design provisions, but to examine the shear design provisions for ACI 318 and AASHTO Segmental Specifications. As seen in Figure 5- 2 ACI 318 and AASHTO Segmental Specifications for shear strength of prestressed concrete beams perform well for concrete strengths up to 18,000 psi.
(e)AASHTO Segmental Specifications
dbfVVV wcscn'12<+=
dbfKV wcc'2=
dbfs
dfAV wc
ytvs
'8<=

112
0.0
1.0
2.0
3.0
4.0
5.0
6.0
0 2000 4000 6000 8000 10000 12000 14000 16000 18000 20000
f'c (psi)
Vtes
t/Vca
lc
0.0
1.0
2.0
3.0
4.0
5.0
6.0
0 2000 4000 6000 8000 10000 12000 14000 16000 18000 20000
f'c (psi)
Vtes
t/Vca
lc
Figure 5- 2: Shear Strength Ratio versus concrete strength for different design code provisions. (a) ACI 318-08 Simple Method, (b) ACI 318-08 Detailed Method,
(a) ACI 318-08 Simple Method
dbM
dVfV w
u
pucc ⎟⎟
⎠
⎞⎜⎜⎝
⎛+= 7006.0 '
scn VVV +=
dbfs
dfAV wc
ytvs
'8<=
dbfVdbf wccwc'' 52 ≤≤
(b) ACI 318-08 Detailed Method scn VVV +=
dMAX
CREipwcci V
MMVdbfV ++= '6.0
( ) ppwpcccw VdbffV +⋅+= 3.05.3 '
dbfs
dfAV wc
ytvs
'8<=
pwcci dbfV '7.1≥
cf ′
cf ′

113
0.0
1.0
2.0
3.0
4.0
5.0
6.0
0 2000 4000 6000 8000 10000 12000 14000 16000 18000 20000
f'c (psi)
Vtes
t/Vca
lc
0.0
1.0
2.0
3.0
4.0
5.0
6.0
0 2000 4000 6000 8000 10000 12000 14000 16000 18000 20000
f'c (psi)
Vtes
t/Vca
lc
Figure 5- 2 Continued: Shear Strength Ratio versus concrete strength for different design code provisions. (c) AASHTO-LRFD General Procedure, (d) AASHTO-LRFD Simplified Procedure,
(c )AASHTO-LRFD General Procedure
vvcc dbfV '0316.0 β=
sdfA
V vyvs
θcot=
pvvcpscn VdbfVVVV +<++= '25.0
(d) AASHTO-LRFD Simplified Procedure
dcri
vvcci VM
MVdbfV ++=max
'0.632
( ) pvvpcccw VdbffV +⋅+= 3.09.1 '
( )s
dfAV vyv
s
θcot=
pvvcscn VdbfVVV +<+= '25.0
pwcci dbfV '9.1≥
cf ′
cf ′

114
0.0
1.0
2.0
3.0
4.0
5.0
6.0
0 2000 4000 6000 8000 10000 12000 14000 16000 18000 20000
f'c (psi)
Vtes
t/Vca
lc
Figure 5- 2 Continued: Shear Strength Ratio versus concrete strength for different design code provisions. (e) AASHTO-Segmental Bridge Procedure
5.2.3 Effect of transverse reinforcement
It is well-established the mechanics of shear transfer mechanisms in beams with and without transverse reinforcement are different. MacGregor’s textbook “Reinforced Concrete: Mechanics and Design” (MacGregor and Wight, 2004) provides information on the different shear transfer mechanisms and their importance. In order to study the conservativeness of five sets of design expressions from ACI, and AASHTO for various amounts of transverse reinforcement, data from the University of Texas prestressed concrete shear database are plotted in a different format. Figure 5 - 3 shows the relationship between the shear strength ratio and the transverse reinforcement index, given by:
fysb
Avfyw
⋅⋅
=⋅ρ Equation 5- 1
ACI 318-08 Section 11.5.6.3 specifies a minimum value of 50 psi for this index. The AASHTO-LRFD Bridge Design Specifications uses the same value for
(e)AASHTO Segmental Specifications
dbfVVV wcscn'12<+=
dbfKV wcc'2=
dbfs
dfAV wc
ytvs
'8<=
cf ′cf ′

115
post-tensioned concrete box girder bridges as well. The AASHTO Segmental Specifications require this for all sections.
Figure 5 - 3 illustrates that large scatter exists for specimens with no shear reinforcement ( 0=⋅ fyρ ) compared to the scatter found for specimens with shear reinforcement. The use of the simple method included in ACI 318-08 yielded conservative estimates for all specimens with shear reinforcement. A similar observation can be made for the detailed method included in ACI 318-08. Except for a few slightly unconservative estimates obtained for specimens with psify 200≤⋅ρ , consistently conservative shear strength estimates were obtained through the use of the ACI 318-08’s detailed method. In contrast, the slight unconservatism associated with the AASHTO LRFD General Method or Simplified Method estimates, was observed for a wide range of fy⋅ρ values. AASHTO Segmental Specifications can be regarded as conservative for estimating the shear strength of specimens with transverse reinforcement. Since the use of shear reinforcement is commonly used in pretensioned girders used in bridges all ACI and AASHTO expressions can be regarded as conservative for use in design.

116
0.0
1.0
2.0
3.0
4.0
5.0
6.0
0.0 500.0 1000.0 1500.0 2000.0 2500.0
ρ fy (psi)
Vtes
t/Vca
lc
0.0
1.0
2.0
3.0
4.0
5.0
6.0
0.0 500.0 1000.0 1500.0 2000.0 2500.0
ρ fy (psi)
Vtes
t/Vca
lc
Figure 5- 3: Shear Strength Ratio versus transverse reinforcement index for different design code provisions. (a) ACI 318-08 Simple Method, (b) ACI 318-08 Detailed Method,
(a) ACI 318-08 Simple Method
dbM
dVfV w
u
pucc ⎟⎟
⎠
⎞⎜⎜⎝
⎛+= 7006.0 '
scn VVV +=
dbfs
dfAV wc
ytvs
'8<=
dbfVdbf wccwc'' 52 ≤≤
(b) ACI 318-08 Detailed Method scn VVV +=
dMAX
CREipwcci V
MMVdbfV ++= '6.0
( ) ppwpcccw VdbffV +⋅+= 3.05.3 '
dbfs
dfAV wc
ytvs
'8<=
pwcci dbfV '7.1≥

117
0.0
1.0
2.0
3.0
4.0
5.0
6.0
0.0 500.0 1000.0 1500.0 2000.0 2500.0
ρ fy (psi)
Vtes
t/Vca
lc
0.0
1.0
2.0
3.0
4.0
5.0
6.0
0.0 500.0 1000.0 1500.0 2000.0 2500.0
ρ fy (psi)
V tes
t/Vca
lc
Figure 5- 3 Continued: Shear Strength Ratio versus transverse reinforcement index for different design code provisions. (c) AASHTO-LRFD General Procedure, (d) AASHTO-LRFD Simplified
Procedure
(d) AASHTO-LRFD Simplified Procedure
dcri
vvcci VM
MVdbfV ++=max
'0.632
( ) pvvpcccw VdbffV +⋅+= 3.09.1 '
( )s
dfAV vyv
s
θcot=
pvvcscn VdbfVVV +<+= '25.0
pwcci dbfV '9.1≥
(c )AASHTO-LRFD General Procedure
vvcc dbfV '0316.0 β=
sdfA
V vyvs
θcot=
pvvcpscn VdbfVVVV +<++= '25.0
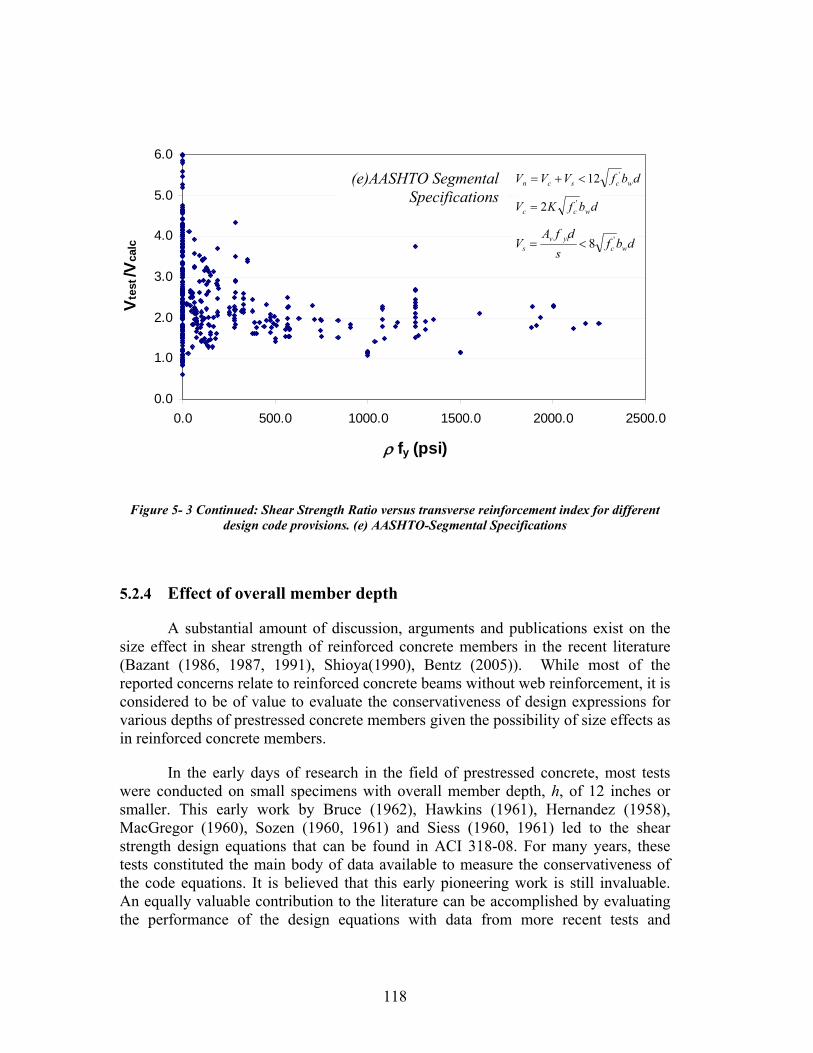
118
0.0
1.0
2.0
3.0
4.0
5.0
6.0
0.0 500.0 1000.0 1500.0 2000.0 2500.0
ρ fy (psi)
Vtes
t/Vca
lc
Figure 5- 3 Continued: Shear Strength Ratio versus transverse reinforcement index for different design code provisions. (e) AASHTO-Segmental Specifications
5.2.4 Effect of overall member depth
A substantial amount of discussion, arguments and publications exist on the size effect in shear strength of reinforced concrete members in the recent literature (Bazant (1986, 1987, 1991), Shioya(1990), Bentz (2005)). While most of the reported concerns relate to reinforced concrete beams without web reinforcement, it is considered to be of value to evaluate the conservativeness of design expressions for various depths of prestressed concrete members given the possibility of size effects as in reinforced concrete members.
In the early days of research in the field of prestressed concrete, most tests were conducted on small specimens with overall member depth, h, of 12 inches or smaller. This early work by Bruce (1962), Hawkins (1961), Hernandez (1958), MacGregor (1960), Sozen (1960, 1961) and Siess (1960, 1961) led to the shear strength design equations that can be found in ACI 318-08. For many years, these tests constituted the main body of data available to measure the conservativeness of the code equations. It is believed that this early pioneering work is still invaluable. An equally valuable contribution to the literature can be accomplished by evaluating the performance of the design equations with data from more recent tests and
(e)AASHTO Segmental Specifications
dbfVVV wcscn'12<+=
dbfKV wcc'2=
dbfs
dfAV wc
ytvs
'8<=
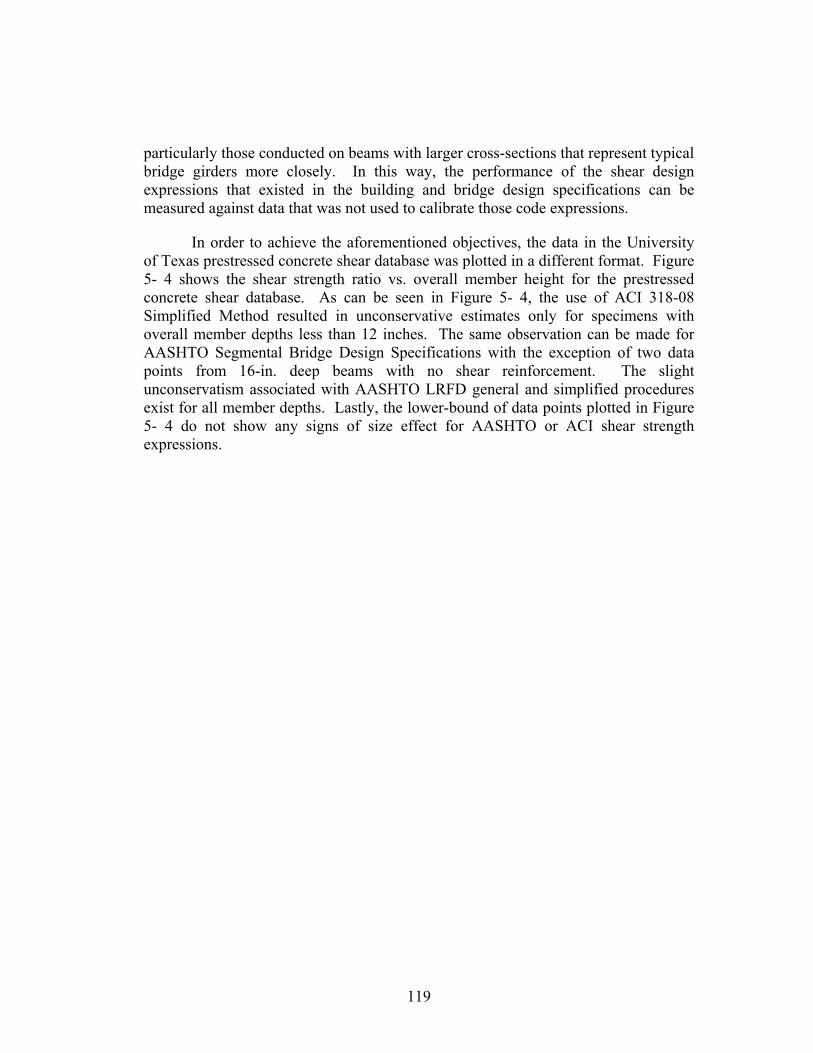
119
particularly those conducted on beams with larger cross-sections that represent typical bridge girders more closely. In this way, the performance of the shear design expressions that existed in the building and bridge design specifications can be measured against data that was not used to calibrate those code expressions.
In order to achieve the aforementioned objectives, the data in the University of Texas prestressed concrete shear database was plotted in a different format. Figure 5- 4 shows the shear strength ratio vs. overall member height for the prestressed concrete shear database. As can be seen in Figure 5- 4, the use of ACI 318-08 Simplified Method resulted in unconservative estimates only for specimens with overall member depths less than 12 inches. The same observation can be made for AASHTO Segmental Bridge Design Specifications with the exception of two data points from 16-in. deep beams with no shear reinforcement. The slight unconservatism associated with AASHTO LRFD general and simplified procedures exist for all member depths. Lastly, the lower-bound of data points plotted in Figure 5- 4 do not show any signs of size effect for AASHTO or ACI shear strength expressions.

120
0.0
1.0
2.0
3.0
4.0
5.0
6.0
0.0 10.0 20.0 30.0 40.0 50.0 60.0 70.0 80.0 90.0
h (in)
Vtes
t/Vca
lc
0.0
1.0
2.0
3.0
4.0
5.0
6.0
0.0 10.0 20.0 30.0 40.0 50.0 60.0 70.0 80.0 90.0
h (in)
Vtes
t/Vca
lc
Figure 5- 4: Shear Strength Ratio versus overall height for different design code provisions. (a) ACI 318-08 Simple Method, (b) ACI 318-08 Detailed Method,
(b) ACI 318-08 Detailed Method scn VVV +=
dMAX
CREipwcci V
MMV
dbfV ++= '6.0
( ) ppwpcccw VdbffV +⋅+= 3.05.3 '
dbfs
dfAV wc
ytvs
'8<=
pwcci dbfV '7.1≥
(a) ACI 318-08 Simple Method
dbM
dVfV w
u
pucc ⎟⎟
⎠
⎞⎜⎜⎝
⎛+= 7006.0 '
scn VVV +=
dbfs
dfAV wc
ytvs
'8<=
dbfVdbf wccwc'' 52 ≤≤
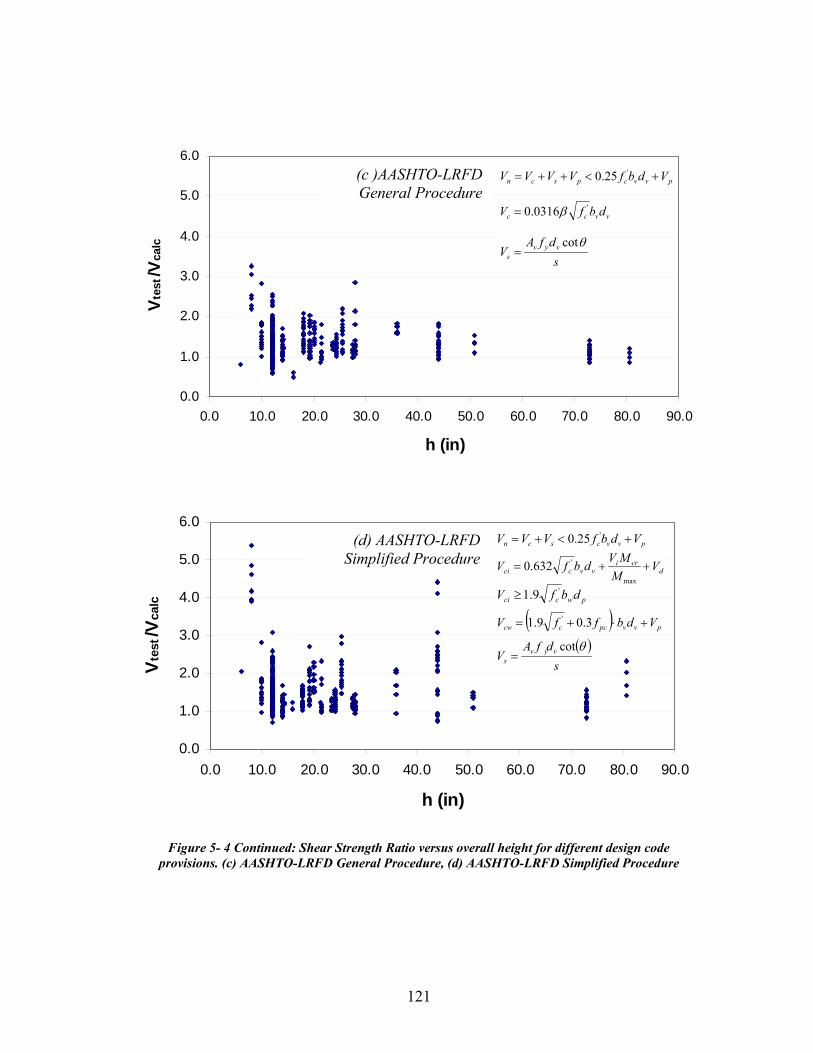
121
0.0
1.0
2.0
3.0
4.0
5.0
6.0
0.0 10.0 20.0 30.0 40.0 50.0 60.0 70.0 80.0 90.0
h (in)
Vtes
t/Vca
lc
0.0
1.0
2.0
3.0
4.0
5.0
6.0
0.0 10.0 20.0 30.0 40.0 50.0 60.0 70.0 80.0 90.0
h (in)
Vtes
t/Vca
lc
Figure 5- 4 Continued: Shear Strength Ratio versus overall height for different design code provisions. (c) AASHTO-LRFD General Procedure, (d) AASHTO-LRFD Simplified Procedure
(c )AASHTO-LRFD General Procedure
vvcc dbfV '0316.0 β=
sdfA
V vyvs
θcot=
pvvcpscn VdbfVVVV +<++= '25.0
(d) AASHTO-LRFD Simplified Procedure
dcri
vvcci VM
MVdbfV ++=max
'0.632
( ) pvvpcccw VdbffV +⋅+= 3.09.1 '
( )s
dfAV vyv
s
θcot=
pvvcscn VdbfVVV +<+= '25.0
pwcci dbfV '9.1≥
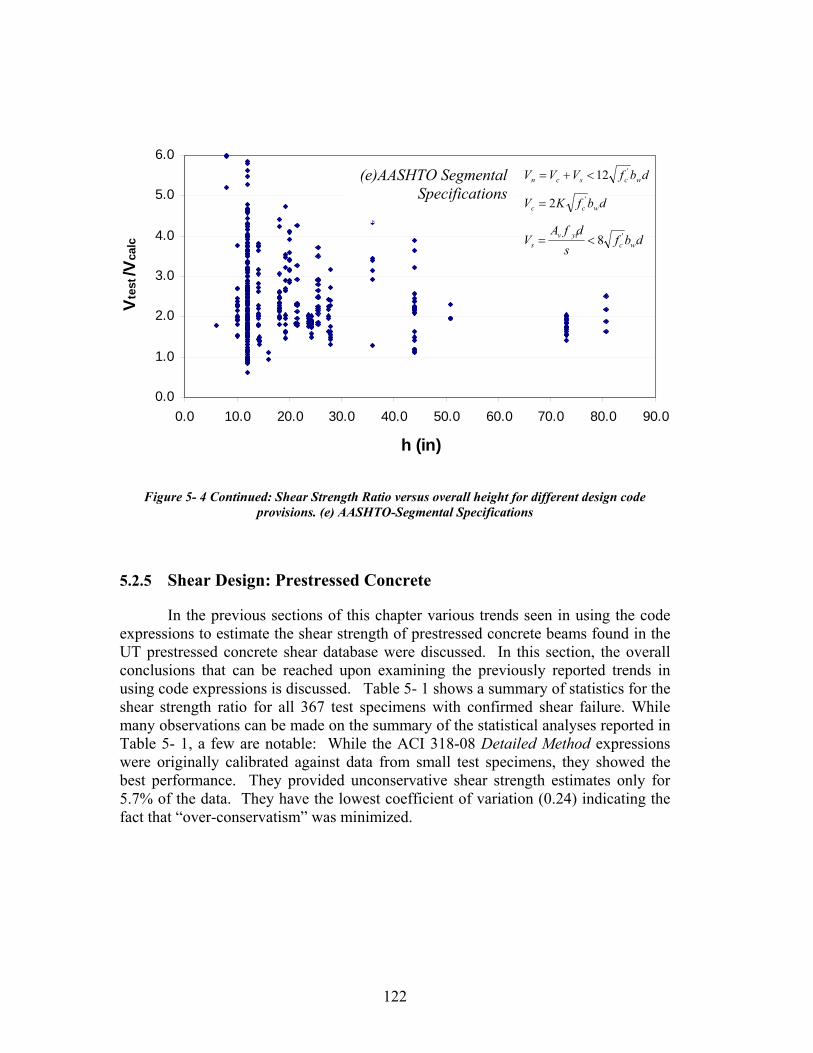
122
0.0
1.0
2.0
3.0
4.0
5.0
6.0
0.0 10.0 20.0 30.0 40.0 50.0 60.0 70.0 80.0 90.0
h (in)
Vtes
t/Vca
lc
Figure 5- 4 Continued: Shear Strength Ratio versus overall height for different design code provisions. (e) AASHTO-Segmental Specifications
5.2.5 Shear Design: Prestressed Concrete
In the previous sections of this chapter various trends seen in using the code expressions to estimate the shear strength of prestressed concrete beams found in the UT prestressed concrete shear database were discussed. In this section, the overall conclusions that can be reached upon examining the previously reported trends in using code expressions is discussed. Table 5- 1 shows a summary of statistics for the shear strength ratio for all 367 test specimens with confirmed shear failure. While many observations can be made on the summary of the statistical analyses reported in Table 5- 1, a few are notable: While the ACI 318-08 Detailed Method expressions were originally calibrated against data from small test specimens, they showed the best performance. They provided unconservative shear strength estimates only for 5.7% of the data. They have the lowest coefficient of variation (0.24) indicating the fact that “over-conservatism” was minimized.
(e)AASHTO Segmental Specifications
dbfVVV wcscn'12<+=
dbfKV wcc'2=
dbfs
dfAV wc
ytvs
'8<=

123
Table 5- 1: Shear Strength Ratio Statistics for all Shear Failures: 367 Tests
calcVVexp ACI
SimpleACI
DetailedAASHTO
LRFD General
AASHTO LRFD
Simplified AASHTO
Segmental
Average 1.77 1.39 1.37 1.56 2.49 Std dev 0.68 0.33 0.40 0.62 1.09
COV 0.38 0.24 0.29 0.40 0.44 Unconservative
Cases 33 17 54 24 13
Total 367 367 367 367 367 %
Unconservative 8.99% 4.63% 14.71% 6.54% 3.54%
As indicated earlier, evaluating the conservativeness of the various design expressions by using data from a “more-realistic” data set for bridge beams is of interest. Pretensioned girders used in bridges are typically large elements and they almost always contain shear reinforcement. As such, the database was filtered to include data from all beams with transverse reinforcement and overall member depths exceeding 12 inches. Keeping these facts in mind, 153 tests were deemed to be representative of the typical bridge girders. Table 5- 2 shows statistics for a total of 153 specimens, all of them with transverse reinforcement and with an overall depth exceeding 12 inches.
Table 5- 2: Shear Strength Ratio Statistics for Specimens with transverse reinforcement and overall depth greater than 12 in. : 153 Tests
calcVVexp ACI
Simple ACI
Detailed
AASHTO LRFD
General
AASHTO LRFD
Simplified
AASHTO Segmental
Average 1.84 1.42 1.32 1.43 2.16 Std dev 0.51 0.29 0.31 0.46 0.66
COV 0.28 0.20 0.23 0.32 0.30 Unconservative
Cases 0 6 17 16 0
Total 153 153 153 153 153 % Unconservative 0.00% 3.92% 11.11% 10.46% 0.00%
φ 0.75 0.75 0.9 0.9 0.75 %SR < φ ∗ 1.6% 1.0% 8.5% 12.3% 1.6%
*%SR < φ is the probability of the shear strength being lower than the design strength, taken as φVn, based on a standard normal probability distribution.

124
The statistical evidence presented in Table 5- 2 can be interpreted as follows: (i) All shear strength estimates obtained through the use of ACI 318-08 Simple Method and AASHTO Segmental Specifications were conservative; (ii) By using a standard normal probability distribution and corresponding φ factors, the probability of the actual shear strength being lower than the design strength (φVn) was evaluated for all design provisions. On this basis, ACI 318’s Detailed Method was found to be the safest shear design provisions; (iii) AASHTO LRFD provisions may be considered acceptable only if the current φ factors are reduced. The current strength reduction factor of 0.9 allows for a high probability of shear designs to be unsafe (8.5% for the general method and 12.3% for the simplified method). By changing the strength reduction factor to 0.75, the probabilities of unsafe designs are greatly reduced to 3.2% and 6.8% for the general and simplified procedures respectively.
Desirable features of shear design provisions were previously outlined in section 5.2. Bearing those features in mind and treating conservativeness and simplicity as the key features of “desirable” design provisions, one can conclude that the Detailed Method, included in ACI 318 provisions, provide the best expressions for estimating the shear strength of prestressed concrete members.
5.2.6 Recommendations for the shear design provisions of the AASHTO Guide Specifications for Design and Construction of Segmental Concrete Bridges, 2nd Edition, 2003 Interim (2003)
Shear design provisions included in the AASHTO Segmental Specifications are outlined in chapter 2. These provisions were used to estimate the shear strength of 506 specimens from the University of Texas Prestressed Concrete Shear Database. After examining shear strength estimates from the AASHTO Segmental Specifications, a great degree of conservatism was observed throughout the database. This great level of conservatism brought our attention to current AASHTO Segmental Specifications for shear design. Specifically, towards the limitation on K = 1 for members in which the tensile stress on the outer most fiber exceeds '6 cf and the
limitation on the value of 'cf to 100 psi for all cases, regardless of the amount of
shear reinforcement provided in the member.
The reasons behind the limit on K for members cracked in flexure can be traced back to unconservative strength estimates obtained for two specimens tested by MacGregor et al. (1960) in a research project evaluating the effects of draped strands in beams with no shear reinforcement. When Ramirez and Breen (1983) first evaluated these two specimens using the expression for concrete contribution to shear

125
strength included in the AASHTO Segmental Specifications without the limit on K for members with flexural tension cracks, the researchers obtained unconservative shear strength estimates in both cases. Shear strength ratios for these two specimens are presented in Table 5- 3. The values illustrated in this table illustrate that the shear strength estimates obtained with all design provisions are grossly unconservative. This fact led the researchers to believe that (i) AASHTO Segmental Specifications without the limit on K for members with flexural tension cracks are as conservative as currently accepted shear design provisions; (ii) Failure of the two specimens tested by MacGregor et al. (1960) has to be related to an unaccounted phenomenon in order for all design provisions to provide unconservative strength estimates; (iii) Setting a limit for the value of K in the AASHTO Segmental Specifications in order to obtain conservative shear strength estimates for the two mentioned specimens is not justified.
Table 5- 3: Shear Strength Ratio for two of MacGregor et al. (1960) specimens.
Specimen ID
ACI Simple Method
ACI Detailed Method
AASHTO LRFD
General Procedure
AASHTO LRFD
Simplified Procedure
AASHTO Segmental Specs (no limit on K)
AASHTO Segmental Specs (with limit on K)
AD.14.37 0.60 0.96 0.60 0.93 0.61 1.22 BD.14.23 0.79 0.84 0.59 0.93 0.77 1.49
As discussed previously, members without transverse reinforcement and small beams (h < 12 in.) were filtered out from the reduced database (367 confirmed shear failures) to better represent prestressed concrete bridge members, leaving the results of 153 tests to be further analyzed. As part of that filtering process, those two specimens tested by MacGregor et al. (1960) were removed from the shear database.
In addition, the validity of introducing tight limits on K and 'cf was re-
examined in light of data from shear test that model bridge elements more closely. In the subsequent analyses, 153 tests on specimens with an overall depth over 12 inches and including shear reinforcement were used to evaluate the AASHTO Segmental Specifications with and without the limit on K. and '
cf . The limit on K is aimed at providing a similar provision to the Vci and Vcw approach used in AASHTO Standard and LRFD Specifications and ACI 318 by making Vc the lesser of Vci and Vcw. For this reason, the selected 153 specimens were broken down into 23 specimens governed by flexure-shear (Vci<Vcw) and 130 specimens governed by web-shear (Vcw<Vci). Results of this analysis are shown in Table 5- 4.
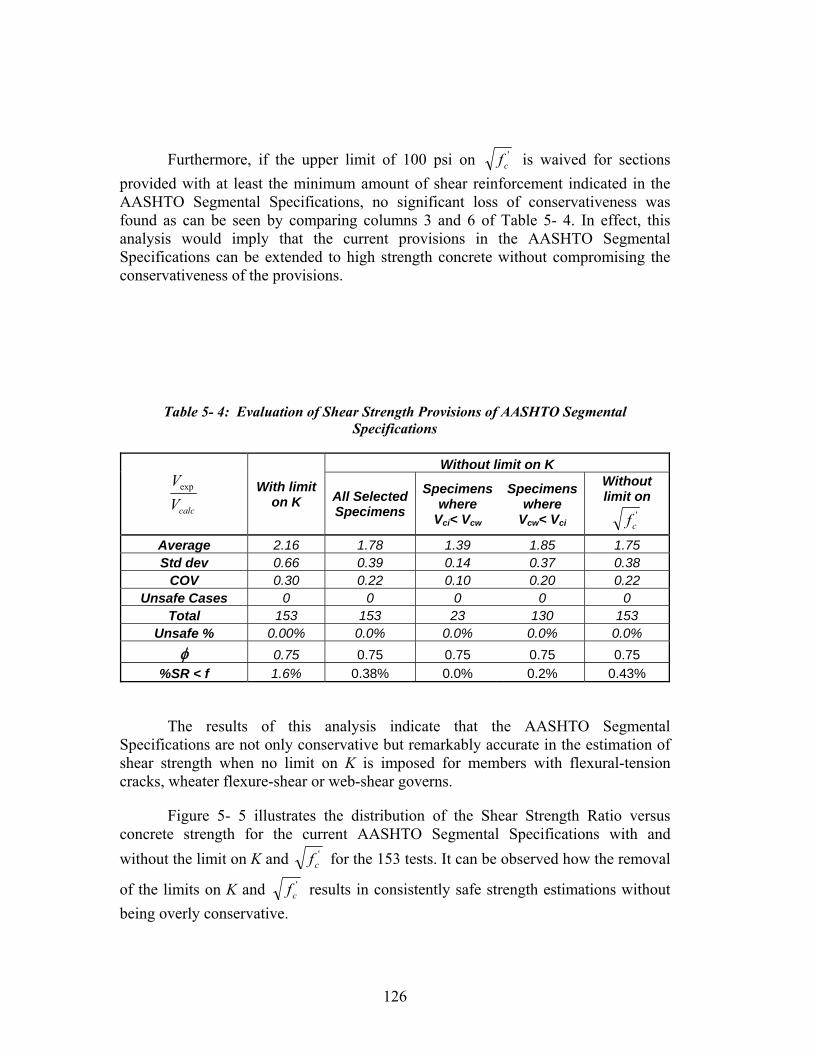
126
Furthermore, if the upper limit of 100 psi on 'cf is waived for sections
provided with at least the minimum amount of shear reinforcement indicated in the AASHTO Segmental Specifications, no significant loss of conservativeness was found as can be seen by comparing columns 3 and 6 of Table 5- 4. In effect, this analysis would imply that the current provisions in the AASHTO Segmental Specifications can be extended to high strength concrete without compromising the conservativeness of the provisions.
Table 5- 4: Evaluation of Shear Strength Provisions of AASHTO Segmental Specifications
calcVVexp With limit
on K
Without limit on K
All Selected Specimens
Specimens where
Vci< Vcw
Specimens where
Vcw< Vci
Without limit on
'cf
Average 2.16 1.78 1.39 1.85 1.75 Std dev 0.66 0.39 0.14 0.37 0.38
COV 0.30 0.22 0.10 0.20 0.22 Unsafe Cases 0 0 0 0 0
Total 153 153 23 130 153 Unsafe % 0.00% 0.0% 0.0% 0.0% 0.0%
φ 0.75 0.75 0.75 0.75 0.75 %SR < f 1.6% 0.38% 0.0% 0.2% 0.43%
The results of this analysis indicate that the AASHTO Segmental Specifications are not only conservative but remarkably accurate in the estimation of shear strength when no limit on K is imposed for members with flexural-tension cracks, wheater flexure-shear or web-shear governs.
Figure 5- 5 illustrates the distribution of the Shear Strength Ratio versus concrete strength for the current AASHTO Segmental Specifications with and without the limit on K and '
cf for the 153 tests. It can be observed how the removal
of the limits on K and 'cf results in consistently safe strength estimations without
being overly conservative.

127
0.0
1.0
2.0
3.0
4.0
5.0
6.0
0 2000 4000 6000 8000 10000 12000 14000 16000 18000 20000
f'c (psi)
Vtes
t/Vca
lc
0.0
1.0
2.0
3.0
4.0
5.0
6.0
0 2000 4000 6000 8000 10000 12000 14000 16000 18000 20000
f'c (psi)
Vtes
t/Vca
lc
Figure 5- 5: Shear Strength Ratio for members with flexural tension cracks: AASHTO
Segmental Specifications with and without the limit on K and 'cf .
(a) AASHTO Segmental Specifications (with limit on K and '
cf ≤100 psi)
(b) AASHTO Segmental Specifications (without limit on K and '
cf )
cf ′
cf ′

128
5.3 MINIMUM SHEAR REINFORCEMENT PROVISIONS
Many forms of the minimum area of shear reinforcement have been used over the years. To investigate the appropriateness of the current code limits, the cracking to strength ratio is defined as max/VVcrack . While the University of Texas prestressed concrete shear database contains results from over 500 tests, diagonal cracking values are not always reported in the literature, hence, the amount of usable data points for this analysis is narrowed. Both crackV and maxV values are reported for 123 specimens in the database, hence, the set of test results used in this section is independent of the set that was previously used in evaluating the design provisions. A high value of
max/VVcrack , i.e. 0.9, would indicate very little reserve strength after the formation of the first diagonal crack. A prestressed concrete beam performing in this range may have no signs of diagonal cracking until the late stages of its useful load carrying capacity. For a given minimum amount of shear reinforcement, the occurrence of sections having small reserve strengths after cracking (high values of max/VVcrack ) should be avoided. Ozcebe et al. (1999) and Teoh et al. (2002) reported a value of 30% as a minimum reserve strength after cracking. Corresponding to this value, a maximum value of 0.75 for max/VVcrack (≈ 1/1.3) will be used to measure to measure desirable behavior.
The simplest form of a minimum amount of shear reinforcement is based strictly on the strength contribution of shear reinforcement. In this case, both for ACI 318-08 and for the AASHTO-LRFD Bridge Design Specifications, the minimum area of shear reinforcement is given by:
yt
wv f
sbA 50min = Equation 5- 2
This limit was first introduced in the 1971 version of the ACI 318 specifications and is illustrated in Figure 5- 6 as a vertical orange dashed line. It can be seen that all specimens with transverse reinforcement below this ratio have very little reserve strength and have cracking to strength ratios above 0.75. There is a group of 3 points in Figure 5- 6 that, despite having shear reinforcement in excess of the minimum, have no reserve strength. These specimens are from the work of Kaufman and Ramirez (1988). In their work, Kaufman and Ramirez (1988) reported a shear tension mode of failure for these specimens, where the anchorage of the transverse reinforcement to the bottom flange failed, resulting in shear failure by splitting along a diagonal crack. The reason for this type of failure was related to the detail of the transverse reinforcement used for this group of specimens. Transverse bars were terminated with straight ends as shown in Figure 5- 7, making the specimen susceptible to an anchorage failure of the transverse reinforcement. Normally, these

129
bars would be terminated with a 90° hook for conventional reinforcement bars or, one or two horizontal anchorage wires are provided when welded wire is used.

130
0.0
0.1
0.2
0.3
0.4
0.5
0.6
0.7
0.8
0.9
1.0
0 500 1000 1500 2000 2500
ρ *fy (psi)
Vcra
ck/V
max
0.4
0.5
0.6
0.7
0.8
0.9
1.0
0 100 200 300 400 500
ρ *fy (psi)
Vcra
ck/V
max
Figure 5- 6: Cracking to Strength Ratio versus shear reinforcement index.
Kaufman & Ramirez (1988)
Equation ACI minimum
Desirable Behavior

131
Figure 5- 7: Reinforcing bar Details used in Kaufman and Ramirez’s Specimens. (Kaufman and Ramirez, 1988)
Poor detail of transverse reinforcement

132
Tests conducted by Roller and Russell (1990) suggested that the minimum transverse reinforcement limit should be proportional to concrete’s strength. This was incorporated into the form of the minimum shear reinforcement given by:
yt
wcv f
sbfKA 'min = Equation 5- 3
This expression appeared for the first time in the 2002 version of the ACI 318 Specifications with a value of K = 0.75 and has remain since. The AASHTO-LRFD Specifications use a value of K = 1. Figure 5- 8 illustrates both these limits and it can be said that the AASHTO-LRFD limit does a better job of separating the cases where undesirable behavior (i.e. low reserve strength) is found. Again in this plot, Kaufman’s specimens do not provide any reserve strength despite having transverse reinforcement in excess of the minimum.
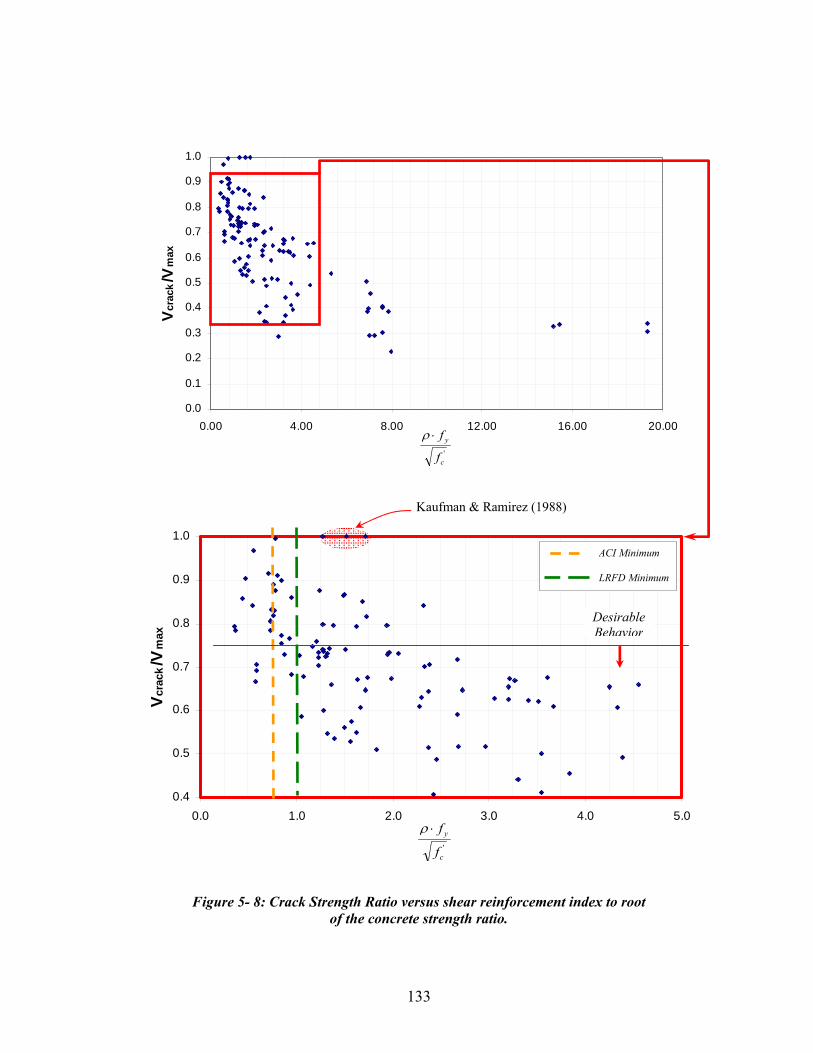
133
0.0
0.1
0.2
0.3
0.4
0.5
0.6
0.7
0.8
0.9
1.0
0.00 4.00 8.00 12.00 16.00 20.00
V cra
ck/V
max
'c
y
f
f⋅ρ
0.4
0.5
0.6
0.7
0.8
0.9
1.0
0.0 1.0 2.0 3.0 4.0 5.0
V cra
ck/V
max
'c
y
f
f⋅ρ
Figure 5- 8: Crack Strength Ratio versus shear reinforcement index to root of the concrete strength ratio.
Kaufman & Ramirez (1988)
ACI Minimum LRFD Minimum
Desirable Behavior

134
The most detailed expression for the minimum amount of shear reinforcement for prestressed concrete beams was first introduced in the 1963 version of the ACI 318 Specifications as result of the research conducted by Sozen and Siess throughout the 1960’s which also yielded the expressions for Vci and Vcw that were first introduced in ACI 318-63. This form of minimum reinforcement requirement is given by:
wyt
pupsv b
ddfsfA
A80min = Equation 5- 4
where:
Aps = area of prestressing steel in flexural tension zone (in2)
fpu = specified tensile strength of prestressing steel (psi)
s = transverse reinforcement spacing (in)
d = distance from extreme compression fiber to centroid of longitudinal tension reinforcement (in)
fyt = specified yield strength of transverse reinforcement (psi)
bw = web width
The minimum transverse reinforcement requirement given in Equation 5-4 is illustrated in Figure 5- 9 as a vertical orange dashed line at a value equal to 0.0125 (= 1/80). As depicted in Figure 5- 9 increasing the 0.0125 value to 0.0150 (= 1/67) appears to do a better job of separating specimens with desirable behavior. Considering the joint probability distribution of two discrete variables given by:
Variable 1 = max/VVcrack Equation 5- 5
and Variable 2 = db
sfAdfA w
pups
ytv , Equation 5- 6
For 120 tests from the database (123 tests with reported cracking shear, minus 3 specimens from Kaufman and Ramirez (1988)), the probability of the specimen having desirable behavior ( max/VVcrack being less than 0.75) given that the section contains less than a given amount of transverse reinforcement can be evaluated.

135
For specimens containing at least the minimum amount of reinforcement given by Equation 5-4 (variable 2 < 1/80), the probability of having desirable behavior is 29% (2 out of 7 specimens in this range). If variable 2 (Equation 5-6) takes a value of 0.0154 (=1/65), the probability of desirable behavior is still 31% (4 out of 13 specimens in this range). For any greater value of variable 2, the probability of desirable behavior is more than 50% (10 out of 20 specimens for variable 2 < 1/64), hence, a value of 0.0154 (=1/65) constitutes an important boundary in the desirable/undesirable behavior probability.
On this basis it seems reasonable to modify the new ACI 318 minimum transverse reinforcement limit as follows:
wyt
pupsv b
ddfsfA
A65min = Equation 5- 7

136
0.0
0.1
0.2
0.3
0.4
0.5
0.6
0.7
0.8
0.9
1.0
0.00 0.05 0.10 0.15 0.20 0.25 0.30
V cra
ck/V
max
db
sfAdfA w
pups
ytv
0.4
0.5
0.6
0.7
0.8
0.9
1.0
0.00 0.02 0.04 0.06 0.08 0.10
V cra
ck/V
max
db
sfAdfA w
pups
ytv
Figure 5- 9: Most detailed approach to minimum shear reinforcement evaluation
Desirable Behavior
Kaufman & Ramirez (1988)
ACI Minimum Proposed Minimum

137
5.4 MAXIMUM SHEAR REINFORCEMENT PROVISIONS
The limit imposed on maximum shear reinforcement contribution to shear strength is substantially different in ACI 318 and AASHTO LRFD Bridge Design Specifications. Currently, ACI 318 limits the contribution of shear reinforcement (Vs) to dbf wc
'8 . In contrast, the AASHTO LRFD Code limits the contribution of shear reinforcement indirectly by limiting the total shear strength (Vc +Vs) to
vvc dbf '25.0 .The maximum limit on the total shear strength presented in the AASHTO LRFD Bridge Design Specifications was compared to the equivalent limit from the ACI 318 provisions, given by dbfV wcc
'8+ , for the 367 specimens with confirmed shear failures included in the University of Texas prestressed concrete shear database. This comparison revealed that for high strength concretes, the maximum from the AASHTO LRFD Specifications can be as much as 2 times the equivalent limit from ACI 318. Figure 5- 10 illustrates how the ratio between the limits described in both specifications varies for different concrete strengths.
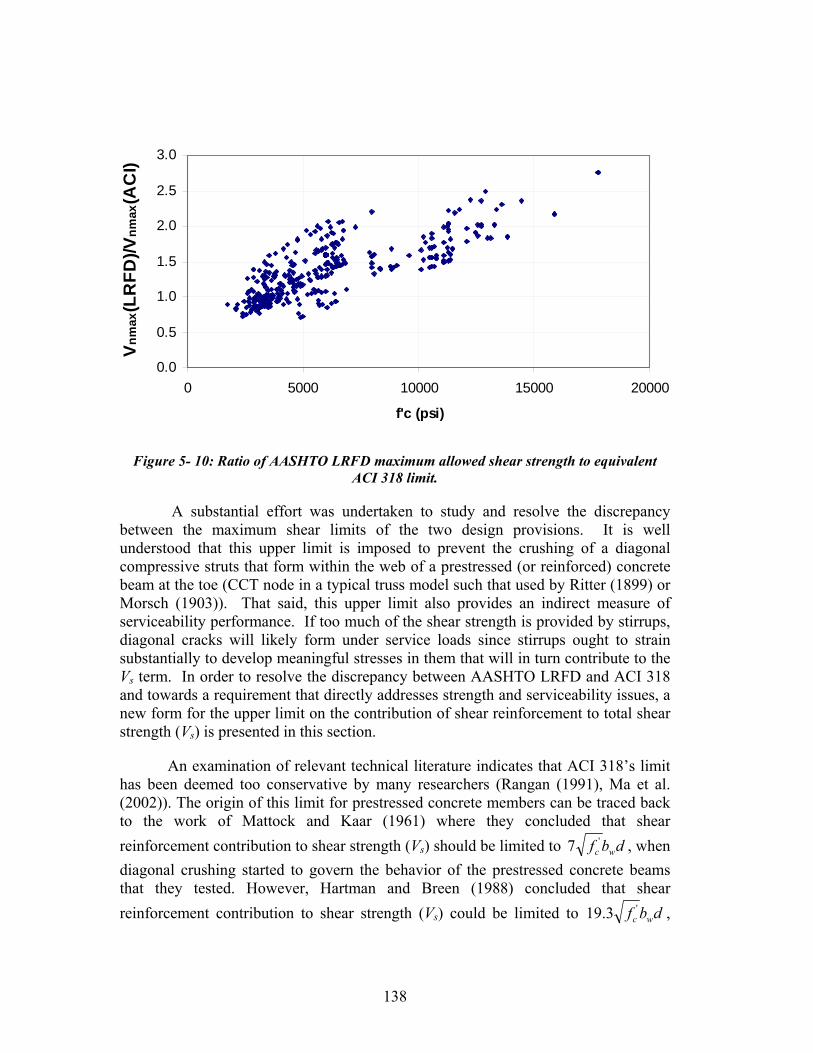
138
0.0
0.5
1.0
1.5
2.0
2.5
3.0
0 5000 10000 15000 20000
f'c (psi)
V nm
ax(L
RFD
)/Vnm
ax(A
CI)
Figure 5- 10: Ratio of AASHTO LRFD maximum allowed shear strength to equivalent ACI 318 limit.
A substantial effort was undertaken to study and resolve the discrepancy between the maximum shear limits of the two design provisions. It is well understood that this upper limit is imposed to prevent the crushing of a diagonal compressive struts that form within the web of a prestressed (or reinforced) concrete beam at the toe (CCT node in a typical truss model such that used by Ritter (1899) or Morsch (1903)). That said, this upper limit also provides an indirect measure of serviceability performance. If too much of the shear strength is provided by stirrups, diagonal cracks will likely form under service loads since stirrups ought to strain substantially to develop meaningful stresses in them that will in turn contribute to the Vs term. In order to resolve the discrepancy between AASHTO LRFD and ACI 318 and towards a requirement that directly addresses strength and serviceability issues, a new form for the upper limit on the contribution of shear reinforcement to total shear strength (Vs) is presented in this section.
An examination of relevant technical literature indicates that ACI 318’s limit has been deemed too conservative by many researchers (Rangan (1991), Ma et al. (2002)). The origin of this limit for prestressed concrete members can be traced back to the work of Mattock and Kaar (1961) where they concluded that shear reinforcement contribution to shear strength (Vs) should be limited to dbf wc
'7 , when diagonal crushing started to govern the behavior of the prestressed concrete beams that they tested. However, Hartman and Breen (1988) concluded that shear reinforcement contribution to shear strength (Vs) could be limited to dbf wc
'3.19 ,

139
when diagonal crushing started to govern the behavior of the prestressed concrete beams they tested. Based on this discrepancy, it can be stated that an upper limit on Vs should not be only based on a multiple of dbf wc
' .
To resolve this discrepancy, a similar approach to the one used to establish the current minimum shear reinforcement requirements of ACI 318 and AASHTO LRFD Bridge Design Specifications will be used. While in the preceding section an upper limit to cracking to strength ratio was sought for, this time setting a lower limit for the cracking to nominal strength ratio will be established. As an example, a low value of
nc VV / , i.e. 0.25, would indicate that a prestressed concrete beam is forming diagonal cracks at a load equal to 25% of the specimen’s nominal shear capacity. In such cases, it is very likely that beams will present diagonal cracks under service loads, given that service loads usually constitute a fraction of the ultimate load higher than 25%.
A lower limit on nc VV / can be established as 0.50. At first the selection of
nc VV / = 0.50 may appear arbitrary. However, it can be argued that for many years, allowable working stress in flexural reinforcement has been defined and accepted as 0.6fy. From this, one could say that working stress should not exceed 60% of the capacity for flexural calculations. Given the brittle nature of shear failures and the current degree of uncertainty associated with our design models, the strength reduction factors for shear (0.75 in ACI 318) are usually lower than those for flexure (0.9 in ACI 318). Hence, working stress for shear design should be lower than the working stress for flexural design. By adjusting the accepted flexural working stress by the ratio of the strength reduction factors for shear and flexure, an estimate on working stress for shear is obtained as follows:
Shear working stress = 5.09.075.06.06.0 =⋅=⋅
b
v
φφ
Equation 5- 8
Designing with a low value for nc VV / such as 0.1 or 0.2 would imply that prestressed concrete beams will be guaranteed to develop undesirable diagonal cracks under service loads. For acceptable performance under service loads, beams should be design such that nc VV / is greater than 0.5. By doing so, beams can remain uncracked under shear working stresses, i.e. service loads. Analysis of the University of Texas Prestressed Concrete Shear Database has exposed a pronounced decreasing trend for the experimental crack strength to nominal strength ratio ( ncrack VV / ) as the ratio of Vs / Vc increases. As can be seen in Figure 5- 11, once the Vs / Vc ratio exceeds 1.5 for ACI 318’s Detailed Method, majority of specimens fall below the suggested lower limit. For the AASHTO LRFD’s Simplified Procedure, Vs is defined

140
differently. The variable angle truss model used implies that the Vs expression includes a cot(θ) term. Therefore, for the Simplified Procedure included in the AASHTO LRFD Bridge Design Specifications, an equivalent limit of 1.5 can be applied to ( ) cs VV /tan θ as shown in Figure 5- 12. It is recognized that only a limited amount of data exists above this limit; and as such, additional testing in that range is recommended for future research. The proposed upper limit of Vs ≤ 1.5Vc is further substantiated next.
0.0
0.5
1.0
1.5
0.00 0.50 1.00 1.50 2.00
Vs/Vc (ACI Detailed Method)
V cra
ck/V
n
Figure 5- 11: Cracking Strength to Nominal shear strength ratio versus Shear Reinforcement Strength to Concrete Shear Strength Ratio for ACI 318 Detailed Method
Desirable behavior
Proposed Upper Limit of Vs ≤ 1.5Vc

141
0.0
0.5
1.0
1.5
2.0
0 0.5 1 1.5 2 2.5 3 3.5
V stan( θ )/V c (AASHTO LRFD Simplified Procedure)
V cra
ck/V
n
Figure 5- 12: Crack Strength to Nominal shear strength ratio versus Shear Reinforcement Strength to Concrete Shear Strength Ratio for AASHTO LRFD Simplified Procedure
The variability of dbfV wcc'/ for 506 specimens included in the UT
Prestressed Concrete Shear Database was studied. This study showed that when using ACI 318 Detailed Method (Vci and Vcw), dbfV wcc
'/ had an average value of 5.2, with a minimum of 1.7 and a maximum of 14.1. This would mean that the proposed limit on Vs would range between dbf wc
'55.2 and dbf wc'21 , compared to
the current fixed upper limits of dbf wc'8 on Vs and vvc dbf '25.0 on Vs + Vc . The
lower end of the proposed limit would apply in regions where Vci governs, i.e. closer to the middle of the span in simply supported beams, where a minimal amount of shear reinforcement is usually used and a reduced upper limit would have no serious design consequences. The upper end of the proposed limit would apply to the end regions of simply supported beams where Vcw usually governs. In this case, the proposed upper limit would allow a significant increase in the amount of shear reinforcement, avoiding the necessity to use deeper beam cross sections.
Figure 5- 13 shows a histogram for dbfV wcc'/ for the 367 tests with
confirmed shear failure included in the University of Texas prestressed concrete shear database. When dbfV wcc
'/ has a value of 5.33, the proposed upper limit would be
Desirable behavior
Proposed Upper Limit of Vs ≤ 1.5Vc/tan(θ)

142
equal to dbf wc'8 . As illustrated, a large portion of the specimens tested have values
of dbfV wcc'/ greater 5.33. For this group of specimens, the proposed limit would
allow the use of greater shear strength than that allowed by the current ACI 318 limit.
1926
57 56
69
61
53
22
4
0
10
20
30
40
50
60
70
80
0 - 2 2 - 3 3 - 4 4 - 5 5 - 6 6 - 7 7 - 8 8 - 12 12 - 15
Num
ber
of T
ests
dbf
V
wc
c
'
Figure 5- 13: Histogram for dbfV wcc'/ for 506 tests.
Furthermore, if the proposed limit were to be applied to Mattock and Kaar’s (1961) specimens, where the concrete contribution to shear strength was
dbf wc'78.4 , an upper limit equal to dbf wc
'17.7 would be found, consistent with Mattock and Kaar’s (1961) original conclusions. Using the same logic for Hartman and Breen’s (1988) specimens, a reasonable upper limit of dbf wc
'12 would be found. For Hartman and Breen’s (1988) specimens, the total shear strength would get up to dbf wc
'20 , which is equal to vvc dbf '19.0 ; which is also close to the new upper
limit of vvc dbf '18.0 , suggested in NCHRP Report 579. In conclusion, if the upper limit proposed here were to be implemented in the ACI 318 and AASHTO LRFD Specifications, the substantial discrepancies between the two design provisions can be reconciled to a great degree. In addition, various research findings reported by several researchers in the history of prestressed concrete shear research can be logically explained. On these bases, it is proposed to establish a limit on Vs, proportional to Vc, for prestressed members. More specifically the following equation

143
should be used to determine the upper limit on Vs in AASHTO LRFD Bridge Design Specifications
( )θtan5.1 c
sVV ≤ Equation 5- 9
where:
Vs = shear reinforcement contribution to shear strength as given in Equation 2-7.
Vc = concrete contribution to shear strength taken as the lesser of equations 2-5 and 2-6.
θ = angle of inclination of diagonal compressive stresses
For ACI 318, given that tan(θ) is equal to 1, Equation 5 - 9 can be reduced to:
cs VV 5.1≤ Equation 5- 10
where:
Vs = shear reinforcement contribution to shear strength as given in Equation 2-21.
Vc = concrete contribution to shear strength taken as the lesser of equations 2-17 and 2-18.
This limit is practical, based on serviceability and it bridges the gap between the limits established in ACI 318 and the AASHTO-LRFD Specifications and hence should be considered for adoption in future revisions of the AASHTO and ACI design specifications.

144

145
CHAPTER 6 Summary and Conclusions
6.1 SUMMARY
A comprehensive interagency testing contract for the development of a new family of prestressed concrete girders was funded by the Texas Department of Transportation. The current investigation was performed as part of that interagency testing contract. The investigation conducted at the Phil M. Ferguson Structural Engineering Laboratory had the following objectives:
a) To investigate the conservativeness of current shear design provisions when applied to the Tx girders: The shear design provisions of ACI 318-08 Building Code Requirements for Structural Concrete, AASHTO LRFD Bridge Design Specifications (2007) and AASHTO Guide Specifications for Design and Construction of Segmental Concrete Bridges (2003) were critically examined
b) To evaluate the serviceability performance of Tx28 girders under worst case scenario service shear loads, and
c) To incorporate the results of this experimental program into the University of Texas Prestressed Concrete Shear Database
A comprehensive study of the literature revealed that current shear design provisions have been applied to sections of similar proportions with conservative results but without a great deal of accuracy. When used without end blocks or end diaphragms, I-shaped and bulb tee bridge girders have been reported to fail with a tendency of sliding of the bottom flange against the web combined with strand bond/anchorage failure, rather than web crushing or flexure shear failures. Results of the experimental program of this project revealed that the Tx girders are also susceptible to the “horizontal sliding shear” failure mode. Evaluation of current shear design specifications revealed an absence of specific provisions to address this “horizontal sliding shear” failure mode for prestressed concrete beams.
Despite the horizontal sliding shear failure mode, shear strength estimations obtained through the use of all design specifications yielded conservative results for the full-scale Tx28 girders tested during the course of this investigation. The most conservative estimates were obtained by using the Simple Method included in ACI 318-08. Hence, it can be concluded that the current shear design provisions can be applied to the design of the new Tx28 girders and conservative shear strength estimations can be expected. Regarding the prediction of cracking shear, the web-shear expression (Vcw) of the Detailed Method included in ACI 318-08 had the best performance.

146
Although diagonal cracks at service loads were found in all tests, the maximum width of the diagonal cracks was comparable to the width of the initial bursting cracks that formed at prestress transfer. Considering the similarity in the crack widths and the fact that the evaluated service shear represents the worst case scenario, the Tx28 girders are expected to have acceptable performance under typical service loads.
The post-peak performance of both specimens was substantially different. The specimen with a higher concrete strength at release (10,000 psi for Tx28-I, Tests 3 and 4) had “more gradual strength degradation” than the one with a typical concrete strength at release (6,500 psi for Tx28-II, Tests 1 and 2). Although limited amount of test data on Tx girders prevents the investigating team from being 100% definitive, this difference in behavior is attributed to the different release strengths. In other words, while the strength degradation trend stipulated above was well-documented and justified for the four shear tests conducted on two beams in this study, the extrapolation of this trend to other tests should be performed with caution until further experimental evidence on Tx girders is obtained.
After the incorporation of the results of the shear tests from this investigation, the University of Texas Prestressed Concrete Shear Database includes a total of 506 shear tests. The database proved to be a valuable tool for the analysis of shear behavior of prestressed concrete members.
6.2 RECOMMENDATIONS FOR CURRENT DESIGN PROVISIONS
Evaluation of the performance of current shear design provisions on tests from the shear database yielded several conclusions and recommendations that can be summarized as follows:
• Both ACI 318 and AASHTO (LRFD and Segmental) provisions yielded conservative shear strength estimations for wide ranges of shear span-to-depth ratios, concrete strengths, amounts of web reinforcement and overall member sizes. No adverse effects were observed for high strength concretes. No size effects were observed. For shorter shear span-to-depth ratios (a/d < 2) ACI shear strength estimations were more conservative than those of the AASHTO LRFD provisions. Conversely, for larger shear spans (a/d > 2), the Simplified Procedure included in the AASHTO LRFD Bridge Design Specifications seemed more conservative than ACI provisions.
• AASHTO LRFD Bridge Design Specifications provisions allow an unacceptable amount of tests to fall below the required design strength. For AASHTO LRFD Bridge Design Specifications, the reduction of the φ-factor from 0.9 to 0.75 is recommended for shear design.

147
• For the AASHTO Guide Specifications for Design and Construction of Segmental Concrete Bridges (2003), it was found that the limit on the K factor for sections where the stress at the outer most tension fiber exceeds '6 cf is unnecessary and results in over-conservative shear strength estimations. Similarly, the limit of 100 psi on the value of '
cf was deemed unnecessarily conservative for prestressed beams with a minimum amount of transverse reinforcement. Removal of these two limits from the AASHTO Segmental Specifications is recommended. When these limits are removed, AASHTO Guide Specifications for Design and Construction of Segmental Concrete Bridges were found to be one of the most conservative and accurate methods to estimate the shear strength of prestressed concrete members. In addition to having the right amount of conservatism, these specifications were found to be the simplest of all provisions for shear design.
• Minimum required amounts of shear reinforcement indicated in the ACI specifications and AASHTO specifications were evaluated and in general they were found to be adequate. However, the requirement of section 11.4.6.4 of the ACI 318-08 Building Code Requirements for Structural Concrete (2008) were found to be slightly unconservative and a modification to Equation 11-14 of ACI 318-08 is recommended so that the provision reads:
wyt
pupsv b
ddfsfA
A65min =
• A new form for the upper limit in the amount of shear reinforcement is proposed. For the AASHTO LRFD Bridge Design Specifications, the proposed upper limit is given by:
( )θtan5.1 c
sVV ≤
For the ACI 318 Building Code Requirements for Structural Concrete (2008), the proposed upper limit is given by:
cs VV 5.1≤

148
6.3 RECOMMENDATIONS FOR FUTURE INVESTIGATION
Although pvvc Vdbf +'16.0 was observed to be a safe lower bound limit for the maximum shear strength of Tx28 girders failing in a “horizontal sliding shear” mode, further investigation is needed to determine the maximum shear stress that can be permitted to act on the whole family of Tx girders. Different depths, differing amounts of shear reinforcement and prestressing force, presence of draped strands are perceived to be some of the key variables.
It was not possible to make definite conclusions on the reasons for the difference in the post-peak behavior of the test specimens in this program, due to the limited number of tests conducted on Tx girders. Further investigation is needed in order to determine definitively and conclusively if and how different release strengths, bursting and spalling crack widths and strains imposed on transverse reinforcement in the end regions at release affect the ultimate shear strength and shear behavior of prestressed concrete beams.
149
APPENDIX A
Temperature Monitoring Results
A1 Overview
A2 Thermocouple Locations
A3 Temperature variation with time
A3.1 Tx28-I
A3.2 Tx28-II
A3.3 Tx46
A3.4 Tx70
A4 Section Temperature Profiles
A4.1 Tx28-I
A4.2 Tx28-II
A4.3 Tx46
A4.4 Tx70
A5 Summary
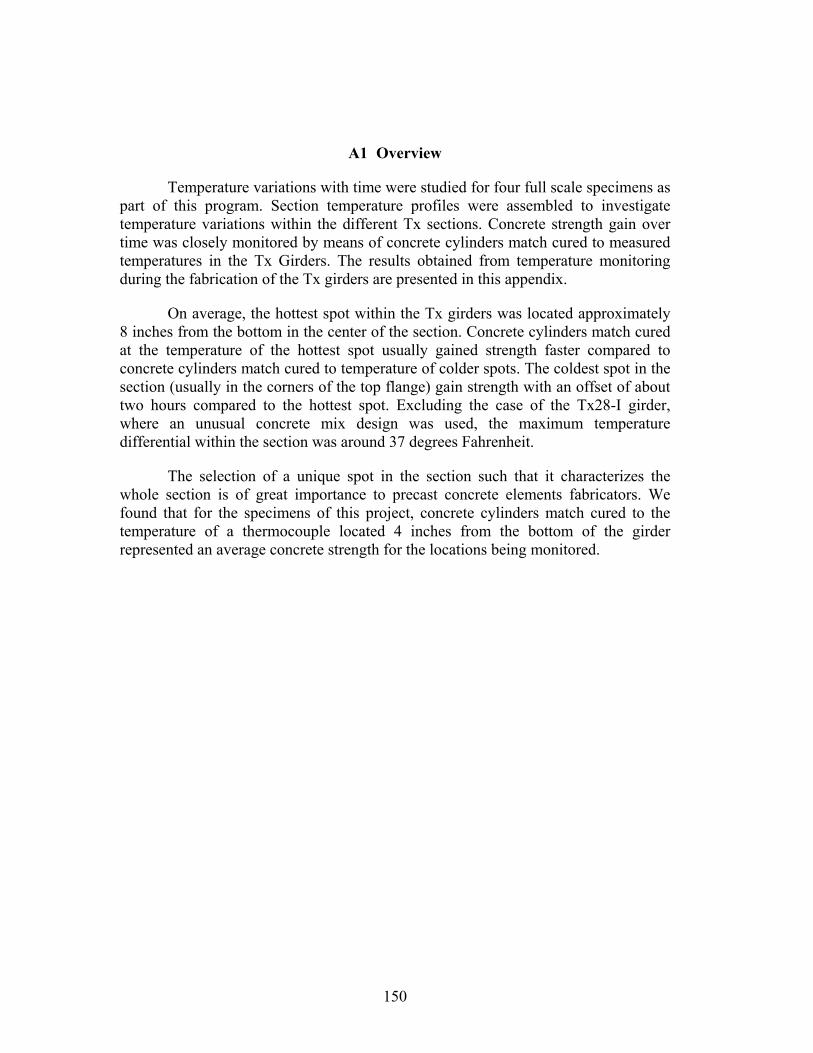
150
A1 Overview
Temperature variations with time were studied for four full scale specimens as part of this program. Section temperature profiles were assembled to investigate temperature variations within the different Tx sections. Concrete strength gain over time was closely monitored by means of concrete cylinders match cured to measured temperatures in the Tx Girders. The results obtained from temperature monitoring during the fabrication of the Tx girders are presented in this appendix.
On average, the hottest spot within the Tx girders was located approximately 8 inches from the bottom in the center of the section. Concrete cylinders match cured at the temperature of the hottest spot usually gained strength faster compared to concrete cylinders match cured to temperature of colder spots. The coldest spot in the section (usually in the corners of the top flange) gain strength with an offset of about two hours compared to the hottest spot. Excluding the case of the Tx28-I girder, where an unusual concrete mix design was used, the maximum temperature differential within the section was around 37 degrees Fahrenheit.
The selection of a unique spot in the section such that it characterizes the whole section is of great importance to precast concrete elements fabricators. We found that for the specimens of this project, concrete cylinders match cured to the temperature of a thermocouple located 4 inches from the bottom of the girder represented an average concrete strength for the locations being monitored.

151
A2 Thermocouple Locations
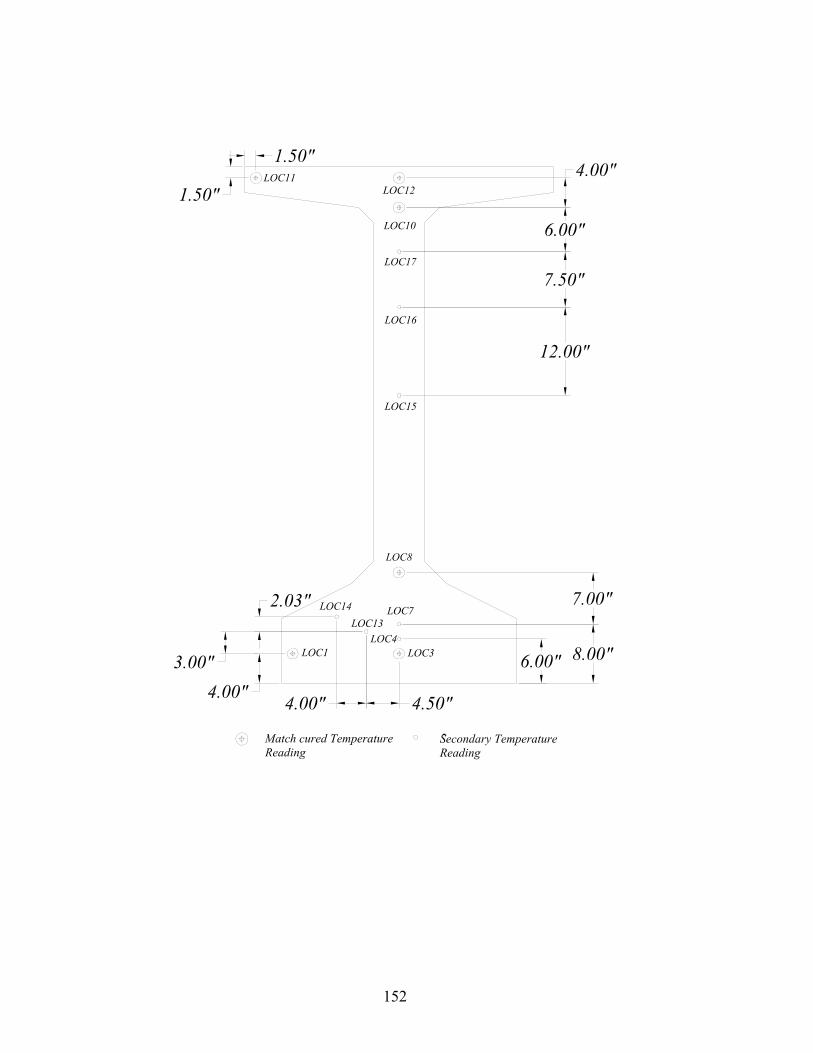
152
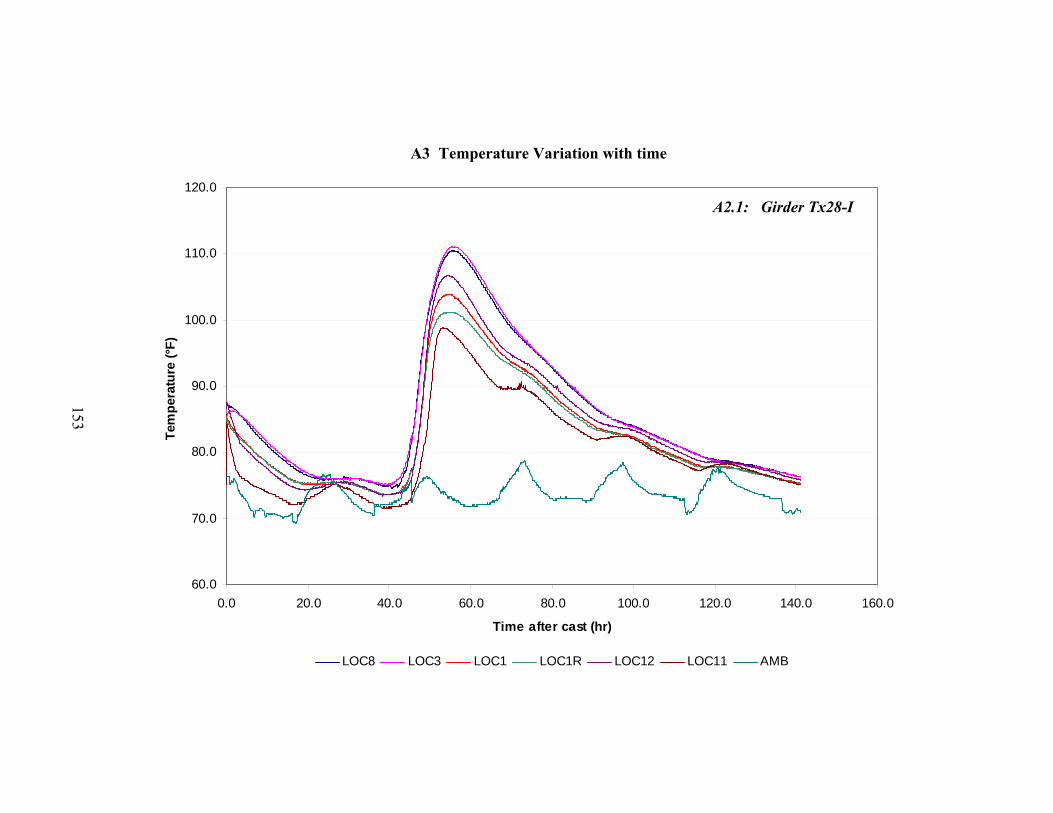
A3 Temperature Variation with time
60.0
70.0
80.0
90.0
100.0
110.0
120.0
0.0 20.0 40.0 60.0 80.0 100.0 120.0 140.0 160.0
Time after cast (hr)
Tem
pera
ture
(°F)
LOC8 LOC3 LOC1 LOC1R LOC12 LOC11 AMB
A2.1: Girder Tx28-I
153

60.0
70.0
80.0
90.0
100.0
110.0
120.0
130.0
0.0 2.0 4.0 6.0 8.0 10.0 12.0 14.0 16.0 18.0
Time after cast (hr)
Tem
pera
ture
(°F)
LOC1 LOC3 LOC8 LOC10 LOC11 LOC12 AMB
A2.2: Girder Tx28-II
154

60.0
70.0
80.0
90.0
100.0
110.0
120.0
130.0
0.0 3.0 6.0 9.0 12.0 15.0
Time after cast (hr)
Tem
pera
ture
(°F)
LOC1 LOC3 LOC8 LOC10 LOC11 LOC12 AMB
A2.3: Girder Tx46
155

60.0
70.0
80.0
90.0
100.0
110.0
120.0
130.0
140.0
0.0 2.0 4.0 6.0 8.0 10.0 12.0 14.0 16.0 18.0 20.0
Time after cast (hr)
Tem
pera
ture
(°F)
LOC1 LOC3 LOC8 LOC13 LOC11 LOC12 AMB
A2.4: Girder Tx70
156

157
A4 Section Temperature Profiles
A3.1: Girder Tx28-I
Temperature Color Code
Time After Cast (hr) 0
Ambient Temperature (°F) 76.5
Max in section (°F) 87.4
Min in section (°F) 75.2
Δt in section(°F) 12.2
Contour Spacing (°F) 1.2
Time After Cast (hr) 49.2
Observations max Δt
Ambient Temperature (°F) 76.5
Max in section (°F) 99.4
Min in section (°F) 82.5
Δt in section(°F) 16.9
Contour Spacing (°F) 2.0

158
Time After Cast (hr) 56.1
Observations max t
Ambient Temperature (°F) 72.8
Max in section (°F) 111.1
Min in section (°F) 72.8
Δt in section (°F) 13.4
Contour Spacing (°F) 3.8
Time After Cast (hr) 140.4
Observations At release
Ambient Temperature (°F) 71.3
Max in section (°F) 76.5
Min in section (°F) 75.3
Δt in section (°F) 1.2
Contour Spacing (°F) 0.5

159
A3.2: Girder Tx28-II
Temperature Color Code
Time After Cast (hr) 0
Observations
Ambient Temperature (°F) 66.3
Max in section (°F) 79.8
Min in section (°F) 74.6
Δt in section (°F) 5.2
Contour Spacing (°F) 1.4
Time After Cast (hr) 9.8
Observations max t
Ambient Temperature (°F) 62.8
Max in section (°F) 119.4
Min in section (°F) 91.1
Δt in section (°F) 28.3
Contour Spacing (°F) 5.7

160
Time After Cast (hr) 12.5
Observations max Δt
Ambient Temperature (°F) 61.8
Max in section (°F) 115.4
Min in section (°F) 78.4
Δt in section (°F) 37
Contour Spacing (°F) 5.4
Time After Cast (hr) 13.9
Observations At release
Ambient Temperature (°F) 61.6
Max in section (°F) 111.7
Min in section (°F) 75.4
Δt in section (°F) 36.3
Contour Spacing (°F) 5.0

161
A3.3: Girder Tx46
Temperature Color Code
Time after cast (hr) 0
Observations
Ambient Temperature (°F) 72.1
Max in section (°F) 76.77
Min in section (°F) 73.36
Δt in section (°F) 3.40
Contour Spacing (°F) 0.5
Time after cast (hr) 13
Observations max t
Ambient Temperature (°F) 71.8
Max in section (°F) 123.44
Min in section (°F) 96.04
Δt in section (°F) 27.40
Contour Spacing (°F) 5.2

162
Time after cast (hr) 14.6
Observations At Release
Ambient Temperature (°F) 71.5
Max in section (°F) 125.04
Min in section (°F) 90.66
Δt in section (°F) 34.38
Contour Spacing (°F) 5.4
Time after cast (hr) 15.5
Observations max Δt
Ambient Temperature (°F) 67.8
Max in section (°F) 123.89
Min in section (°F) 86.56
Δt in section(°F) 37.33
Contour Spacing (°F) 5.6

163
A3.4: Girder Tx70
Temperature Color Code
Time after cast (hr) 0
Observations
Ambient Temperature (°F) 82
Max in section (°F) 85.37
Min in section (°F) 82.15
Δt in section(°F) 3.22
Contour Spacing (°F) 0.3
Time after cast (hr) 13.8
Observations max t
Ambient Temperature (°F) 92
Max in section (°F) 128.39
Min in section (°F) 95.59
Δt in section(°F) 32.80
Contour Spacing (°F) 3.6
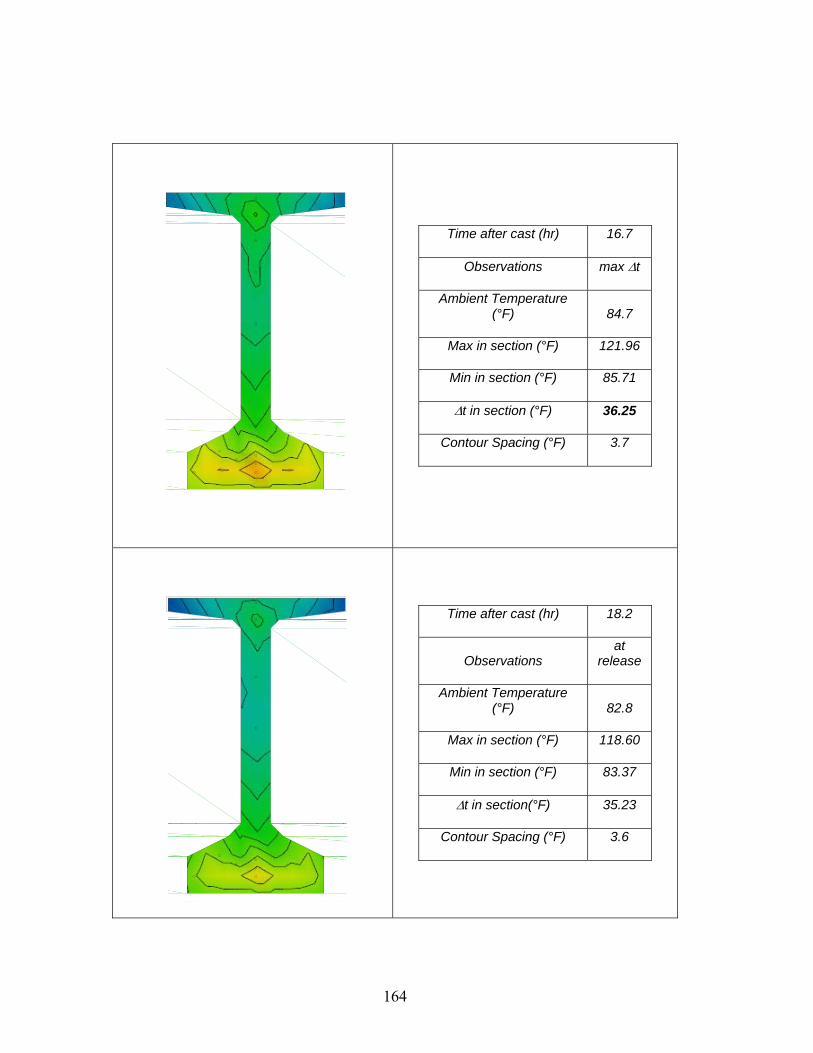
164
Time after cast (hr) 16.7
Observations max Δt
Ambient Temperature (°F) 84.7
Max in section (°F) 121.96
Min in section (°F) 85.71
Δt in section (°F) 36.25
Contour Spacing (°F) 3.7
Time after cast (hr) 18.2
Observations at
release
Ambient Temperature (°F) 82.8
Max in section (°F) 118.60
Min in section (°F) 83.37
Δt in section(°F) 35.23
Contour Spacing (°F) 3.6

165
A5 Summary
Table A1- 1: Summary of important time references in the match curing process.
Time (hr:min) Tx28-I Tx28-II Tx46 Tx70
Immediately after cast 0 0 0 0
Highest temperature in the girder 56:00 10:00 12:00 12:30
Max Spread 49:00 12:30 14:30 16:30
Release 141:00 14:00 13:30 18:00
Table A1- 2: Summary of important temperature references in the match curing process.
Temperature (°F) Tx28-I Tx28-II Tx46 Tx70
Highest temperature in the girder 111.1 119.4 123.4 128.4
Ambient temperature @ highest temperature in girder 72.8 62.8 72 71.5
Max Spread 16.9 37.2 37.3 36.3
Average at release 75.9 95.6 106.3 100.5

166
167
BIBLIOGRAPHY
1. AASHTO, Guide Specifications for Design and Construction of Segmental Concrete Bridges, Interim 2003 Edition, American Association of State Highway and Transportation Officials, Washington, D.C., 2003.
2. AASHTO, Standard Specifications for Highway Bridges, 17th Edition, American Association of State Highway and Transportation Officials, Washington, D.C., 2002.
3. AASHTO, LRFD Bridge Design Specifications, 4th Edition, American Association of State Highway and Transportation Officials, Washington, D.C., 2007.
4. ACI Committee 318, Building Code Requirements for Structural Concrete (ACI 318-08), American Concrete Institute, Farmington Hills, MI, 2008.
5. ACI-ASCE Committee 445, “Recent Approaches to Shear Design of Structural Concrete (ACI 445R-99),” American Concrete Institute, Farmington Hills, MI, 1999, 55 pp.
6. Alshegeir, A., and Ramirez, J. A., “Strut-Tie Approach in Pretensioned Deep Beams,” ACI Structural Journal, Vol. 89, No. 3, May-June 1992, pp. 296-304.
7. Arthur, P. D., Bhatt, P., and Duncan, W., “Experimental and Analytical Studies on the Shear Failure of Pretensioned I-Beams Under Distributed Loading,” PCI Journal, V. 18, No. 1, January-February 1973, pp. 50-67.
8. Bennett, E. W., and Balasooriya, B. M. A., “Shear Strength of Prestressed Beams with Thin Webs Failing in Inclined Compression,” ACI Journal, V. 68, No. 3, March 1971, pp. 204-212.
9. Bruce, R. N., “An Experimental Study of the Action of Web Reinforcement in Prestressed Concrete Beams,” PhD thesis, University of Illinois, Urbana, Illinois, September 1962.
10. Durrani, A. J., and Robertson, I. N., “Shear Strength of Prestressed Concrete T Beams with Welded Wire Fabric as Shear Reinforcement,” PCI Journal, V. 32, No. 2, March-April 1987, pp. 46-61.
11. Elzanaty, A. H., Nilson, A. H., and Slate, F. O., “Shear Capacity of Prestressed Concrete Beams Using High-Strength Concrete,” ACI Journal, V. 83, No. 3, May 1986, pp. 359-368.
168
12. Hartmann, D. L., Breen, J. E., and Kreger, M. E., “Shear Capacity of High Strength Prestressed Concrete Girders,” Research Report 381-2, Center of Transportation Research, University of Texas at Austin, Austin, Texas, January 1988.
13. Hawkins, N. M., and Kuchma, D. A.. 2007. Application of LRFD Bridge Design Specifications to High-Strength Structural Concrete: Shear Provisions. NCHRP Report 579, Transportation Research Board, National Research Council, Washington, D.C.
14. Hawkins, N. M., Kuchma, D. A., Mast, R. F., Marsh, M. L. and Reineck K.H. 2005. Simplified Shear Design of Structural Concrete Members. NCHRP Report 549, Transportation Research Board, National Research Council, Washington, D.C.
15. Hawkins, N. M., Sozen, M. A., and Siess, C. P., “Strength and Behavior of Two-Span Continuous Prestressed Concrete Beams,” Civil Engineering Studies, Structural Research Series, No. 225, University of Illinois, Urbana, Illinois, September 1961.
16. Hernandez, G., “Strength of Prestressed Concrete Beams with Web Reinforcement,” Civil Engineering Studies, Structural Research Series, No. 153, University of Illinois, Urbana, Illinois, May 1958.
17. Kaufman, M. K., and Ramirez, J. A., “Re-Evaluation of Ultimate Shear Behavior of High Strength Concrete Prestressed I-Beams,” ACI Structural Journal, V. 86, No. 4, July-Aug., 1989, pp. 376-382.
18. Laskar, A., Wang, J., Hsu, T.T.C., Mo, Y.L., “Rational Shear Provisions for AASHTO LRFD Specifications,” Technical Report 0-4759-1, Texas Department of Transportation, Houston, Texas, January 2007.
19. Lin, T. Y., “Strength of Continuous Prestressed Concrete Beams Under Static and Repeated Loads,” Journal of the American Concrete Institute, Proceedings. V. 51, No. 6, June 1955, pp. 1037-1059.
20. Lyngberg, B.S., “Ultimate Shear Resistance of Partially Prestressed Reinforced Concrete I-Beams,” Journal of the American Concrete Institute, Proceedings. V. 73, No. 4, April 1979, pp. 214-222.
21. Ma, Z., Tadros, M. K., and Basilla, M., “Shear Behavior of Pretensioned High-Strength Concrete I-Girders,” ACI Structural Journal, V. 97, No. 1, January-February 2000, pp. 185-192.
169
22. MacGregor, J. G., Sozen, M. A., and Siess, C. P., “Strength and Behavior of Prestressed Concrete Beams with Web Reinforcement,” Civil Engineering Studies, Structural Research Series No. 201, University of Illinois, Urbana, Illinois, August 1960.
23. MacGregor, J. G., Sozen, M. A., and Siess, C. P., “Effect of Draped Reinforcement on Behavior of Prestressed Concrete Beams,” Journal of the American Concrete Institute, V. 32, No. 6, December 1960, pp. 649-677.
24. MacGregor, J. G. and Wight, J. K., “Reinforced Concrete: Mechanics and Design”, 4th Edition, Prentice Hall, December 2004.
25. Magnel, G., “Prestressed Concrete,” New York, McGraw Hill, 1954.
26. Maruyama, K. and Rizkalla, S., "Shear Design Consideration for Pretensioned Prestressed Beams," ACI Structural Journal, Vol. 85, No. 5, September-October 1988, pp. 492-498.
27. Mattock, A. H., and Kaar, P. H., “Precast-Prestressed Concrete Bridges – 4: Shear Tests of Continuous Girders,” Journal of the PCA Research Development Laboratories, Jan. 1961, pp. 19-47.
28. Morice, P. B., and Lewis, H. S., “The Ultimate Strength of Two-Span Continuous Prestressed Concrete Beams as Affected by Tendon Transformation and Un-Tensiones Steel,” Second Congress of the Federation Internationale de la Precontrainte, Amsterdam, 1955,
29. O’Callaghan, M. R., “Tensile Stresses in the End Regions of Pretensioned I-Beams at Release”, Masters Thesis, The University of Texas at Austin, Austin, Texas, August 2007.
30. Olesen, S. E., Sozen, M. A., and Siess, C. P., “Investigation of Prestressed Reinforced Concrete for Highway Bridges, Part IV: Strength In Shear Of Beams With Web Reinforcement,” Civil Engineering Studies, Structural Research Series, No. 295. University of Illinois, Urbana, Illinois, August 1965.
31. Ramirez, J. A., and Breen, J. E., “Review of Design Procedures for Shear and Torsion in Reinforced and Prestressed Concrete,” Research Report 248-2, Center of Transportation Research, University of Texas at Austin, Austin, Texas, November 1983.
32. Ramirez, J. A., and Breen, J. E., “Experimental Verification of Design Procedures for Shear and Torsion in Reinforced and Prestressed Concrete,” Research Report

170
248-3, Center of Transportation Research, University of Texas at Austin, Austin, Texas, November 1983.
33. Ramirez, J. A., and Breen, J. E., “Evaluation of a Modified Truss-Model Approach for Beams in Shear,” ACI Structural Journal, Vol. 88, No. 5, September-October 1991, pp. 562-571.
34. Rangan, B. V., “Web Crushing Strength of Reinforced and Prestressed Concrete Beams,” ACI Structural Journal, Vol. 88, No. 1, January-February 1991, pp. 12-16.
35. Raymond, K. K., Bruce, R. N., and Roller, J.J., “Shear Behavior of HPC Bulb-Tee Girders”, Special Publication, V. 228, June 2005, pp. 705-722.
36. Shahawy, M. A., and Batchelor, B., “Shear Behavior of Full-Scale Prestressed Concrete Girders: Comparison between AASHTO Specification and LRFD Code,” PCI Journal, V.41, No. 3, May-June 1996, pp. 48-62.
37. Sozen, M.A., Zwoyer, E. M., and Siess, C. P., “Investigation of Prestressed Concrete for Highway Bridges, Part I: Strength in Shear of Beams Without Web Reinforcement,” Bulletin No. 452, University of Illinois Engineering Experiment Station, April 1959.
38. Teoh, B. K., Mansur, M. A., and Wee, T. H., “Behavior of High-Strength Concrete I-Beams with Low Shear Reinforcement,” ACI Structural Journal, V. 99, No. 3, May-June 2002, pp. 299-307.
39. Xuan, X., Rizkalla, S. and Maruyama, K., "Effectiveness of Welded Wire Fabric as Shear Reinforcement in Pretensioned Prestressed Concrete T-Beams", ACI Structural Journal, Vol. 85, No. 4, July-August 1988, pp. 429-436
40. Zekaria, I., “Shear Failure of Two-Span Continuous Concrete Beams Without Web Reinforcement,” Journal of the Prestressed Concrete Institute, V. 3, No. 1, June 1958.
41. Zwoyer, E. M., and Siess, C. P., “Ultimate Strength of Simply Supported Prestressed Concrete Beams Without Web Reinforcement,” Journal of the American Concrete Institute, V. 26, No. 2, Oct. 1954, pp. 181-200.