SHEAR RESISTANCE OF OIL PALM SHELL CONCRETE BEAMS …
290
SHEAR RESISTANCE OF OIL PALM SHELL CONCRETE BEAMS WITH AND WITHOUT SHEAR REINFORCEMENT MEI YUN CHIN Thesis submitted to the University of Nottingham for the degree of Doctor of Philosophy August 2014
Transcript of SHEAR RESISTANCE OF OIL PALM SHELL CONCRETE BEAMS …

SHEAR RESISTANCE OF OIL PALM SHELL CONCRETE
BEAMS WITH AND WITHOUT SHEAR
REINFORCEMENT
MEI YUN CHIN
Thesis submitted to the University of Nottingham
for the degree of Doctor of Philosophy
August 2014

i
Abstract
In recent years, the use of Oil Palm kernel Shell (OPS) aggregate as coarse aggregate
in concrete has received increasing attention due to its environmental and economic
benefits. To date, considerable amount of research have been carried out to aid the
understanding of its concrete mixture designs and its material properties, but, only
limited amount of works have been carried out to aid the current understanding with
respect to its shear resistance.
The main objective of this research was to investigate the shear resistance of Oil
Palm kernel Shell Concrete (OPSC), and to compare with the conventional Normal
Weight Concrete (NWC) through experimental and analytical study. The experimental
work carried out in this research involved destructive testing of forty-five numbers of
beam specimens, of which twenty-nine beams (24 casted with OPSC and 5 casted
with NWC) were casted without shear reinforcement while the remaining sixteen
beams (11 casted with OPSC and 5 casted with NWC) were casted with shear
reinforcement. The main variables for beams casted without shear reinforcement
were the concrete strength (fcu), overall section depth (h), longitudinal reinforcement
(ρ), and span to depth ratio (a/d). Whilst the main variables for beams casted with
shear reinforcement were concrete strength (fcu), shear reinforcement (ρs) and
inclination of shear cracks (Θ).
For beams casted without shear reinforcement, three distinct failure mechanisms
were observed from the tests: the shear compression mechanism (associated with
a/d < 2.5); the diagonal tension mechanism (associated with a/d = 2.5 and ρ = 0.88%);
and the shear mechanism (associated with a/d ≥ 2.5 and ρ > 0.88%). Whilst for OPSC

ii
beams casted with shear reinforcement, shear compression failure was observed for
the tests.
A comparative study was carried out to investigate if there are any differences on the
ultimate shear resistance and the shear failure mechanism between the OPSC beams
and NWC beams. In general, all specimens (OPSC and NWC) were found to fail in
similar failure mechanism; however, some variations have been noted in the ultimate
resistance with respect to span to depth ratio, concrete strength, and longitudinal
steel ratio (for beams without shear reinforcement) and concrete strength (for
beams with shear reinforcement).
An analytical study was carried out using the upper bound approach to evaluate the
observed shear failure mechanisms, and hence, to predict the failure loads. A
theoretical model was developed for each of the casting condition. In addition,
design models based on Eurocode 2 (EC2) and BS8110 have been developed. In all
cases, the proposed models achieved good agreement with the test results.

iii
Publications
CHIN, M.Y. and LAU, T.L., Shear Resistance of Non-Reinforced Oil Palm Shell Concrete
Beams, Advance Materials Research. Vol.587, 2012, pp. 130-143.

iv
Acknowledgements
I would like to express the deepest gratitude to my supervisor, Associate Professor
Dr. Teck Leong Lau, for his advice, support, and interest in the work. Through him I
have greatly improved my understanding on reinforced concrete beams. Without his
guidance and patience, the present work would not be possible.
I would like to thank the University of Nottingham Malaysia for the scholarship,
which provided me the opportunity to undertake the research programme.
I would like to express my gratitude to the technical staff of Department Civil
Engineering’s laboratory for their friendly assistance during the period of research.
I would like to express my appreciation and gratitude to my family, especially my
parents, for their financial support and encouragement for my education. Without
them, I won’t be who I am today. I would also like to thank my brothers, sister in
laws, and nephews for their support.

v
Table of Contents
Page No.
Abstract i
Publications iii
Acknowledgments iv
Table of Contents v
List of Tables xi
List of Figures xiv
Notations xxiv
Chapter 1 Introduction 1
1.1 Introduction 1
1.2 Problem Statement 2
1.3 Objectives and scope
1.3.1 Objectives
3
3
1.3.2 Scope 3
Chapter 2 Literature Review 7
2.1 Introduction 7
2.2 Shear for Normal Weight Concrete (NWC) beams 8
2.2.1 Shear for NWC beams without shear reinforcement 10
2.2.1.1 Shear transfer mechanism 10
2.2.1.2 Empirical Approach 13
2.2.1.3 Concrete Plasticity Approach 25
2.2.1.4 Building Code Approach 27
2.2.1.4.1 BS8110 Code 27
2.2.1.4.2 Eurocode 2 28
2.2.1.4.3 ACI Code 29
2.2.2 Shear for NWC beams with shear reinforcement 29
2.2.2.1 Shear transfer mechanism 30
2.2.2.2 Empirical Approach 31
2.2.2.3 Concrete Plasticity Approach 39
2.2.2.4 Building Code Approach 41
2.2.4.1 BS8110 Code 41

vi
2.2.4.2 Eurocode 2 42
2.2.4.3 ACI Code 44
2.3 Size effect 45
2.3.1 Beams without shear reinforcement 45
2.3.2 Beams with shear reinforcement 49
2.4 Oil Palm Shell Concrete (OPSC) 51
2.4.1 Properties of Oil Palm Shell (OPS) aggregates 51
2.4.2 Oil Palm Shell Concrete (OPSC) mix design 52
2.4.3 Flexural strength of OPSC 55
2.5 Shear strength of OPSC beams 55
2.5.1 Shear strength of OPSFC beams 56
2.5.2 Shear behaviour of reinforced palm kernel shell concrete beams 57
2.6 Flexural behaviour of OPSC beams 58
2.6.1 Flexural behaviour of reinforced Lightweight Concrete Beams made with
OPS
58
2.6.2 Ductility behaviour of reinforced Palm Kernel Shell Concrete beams 59
2.7 Summary
60
Chapter 3 Experimental Work 80
3.1 Introduction 80
3.2 Concrete Material Properties 81
3.2.1 Oil Palm Shell Concrete (OPSC) 81
3.2.2 Normal Weight Concrete (NWC) 82
3.3 Reinforcement 82
3.3.1 Specimens cast without shear reinforcement 82
3.3.2 Specimens cast with shear reinforcement 83
3.4 Beam specimens cast without shear reinforcement 83
3.4.1 OPSC beam specimens 83
3.4.2 NWC beam specimens 84
3.5 Beam specimens cast with shear reinforcement 85
3.5.1 OPSC beam specimens 85
3.5.2 NWC beam specimens 85
3.6 Fabrication of specimens 86
3.6.1 Mould 86

vii
3.6.2 Casting and curing 86
3.7 Test setup 87
3.7.1 Beam specimens cast without shear reinforcement 88
3.7.2 Beam specimens cast with shear reinforcement 88
3.8 Central deflection 88
3.9 Testing procedures 89
Chapter 4 Failure Mechanisms and Test Results 108
4.1 Introduction 108
4.2 Specimens cast without shear reinforcement 109
4.2.1 Overall behaviour of OPSC beams and NWC beam specimens 109
4.2.2 Central deflection 115
4.2.3 Ultimate Failure Loads 116
4.2.3.1 Span to depth ratio 117
4.2.3.2 Longitudinal steel ratio 119
4.2.3.3 Concrete strength 121
4.2.3.4 Section depth 123
4.3 Specimens cast with shear reinforcement 124
4.3.1 Overall behaviour of OPSC beams and NWC beam specimens 124
4.3.2 Central deflection 127
4.3.3 Ultimate Failure Loads 128
4.3.3.1 Shear reinforcement spacing 129
4.3.3.2 Inclination angle of shear cracks 130
4.3.3.3 Concrete strength 131
4.4 Summary
133
Chapter 5 Theoretical Plastic Models 172
5.1 Introduction 172
5.2 Beams cast without shear reinforcement 173
5.2.1 Theoretical plastic model for concrete beam without shear reinforcement
(CP-I Model)
173
5.2.2 Modification on parameters 175
5.2.2.1 Shear span to height ratio, a/h 175
5.2.2.2 Longitudinal steel ratio, ρ 176

viii
5.2.2.3 Cylindrical concrete strength, σc 177
5.2.2.4 Overall section depth, h 177
5.2.3 Comparisons with test results 178
5.3 Beams cast with shear reinforcement 179
5.3.1 Theoretical plastic model for concrete beam with shear reinforcement
(CP-II Model)
179
5.3.2 Modification on parameters 180
5.3.2.1 Cylindrical concrete strength, σc 181
5.3.2.2 Shear reinforcement ratio, ρs 182
5.3.2.3 Inclination angle of shear cracks, ϴ 182
5.3.3 Comparisons with test results 183
5.4 Summary
183
Chapter 6 BS8110 Design Models 195
6.1 Introduction 195
6.2 Beams cast without shear reinforcement 197
6.2.1 BS8110 design model for concrete beam without shear reinforcement
(BS8110-I Model)
197
6.2.2 Modification on parameters 198
6.2.2.1 Span to effective depth ratio, a/h 198
6.2.2.2 Longitudinal steel ratio, ρ 199
6.2.2.3 Cube concrete strength, fcu 200
6.2.2.4 Beam effective depth, d 201
6.2.3 Comparisons with test results 202
6.3 Beams cast with shear reinforcement 203
6.3.1 BS8110 design model for concrete beam with shear reinforcement
(BS8110-II Model)
203
6.3.2 Modification on parameters 204
6.3.2.1 Shear reinforcement ratio,
204
6.3.2.2 Cube concrete strength, fcu 205
6.3.2.3 Shear to effective depth ratio, a/d 206
5.3.3 Comparisons with test results 206
5.4 Summary 207

ix
Chapter 7 Eurocode 2 Design Models 217
7.1 Introduction 217
7.2 Beams cast without shear reinforcement 217
7.2.1 Eurocode 2 design model for concrete beam without shear reinforcement
(EC2-I Model)
219
7.2.2 Modification on parameters 220
7.2.2.1 Span to effective depth ratio, a/d 220
7.2.2.2 Longitudinal steel ratio, ρ 221
7.2.2.3 Cylindrical concrete strength, fck 222
7.2.2.4 Beam effective depth, d 223
7.2.3 Comparisons with test results 224
7.3 Beams cast with shear reinforcement 225
7.3.1 Eurocode 2 design model for concrete beam with shear reinforcement
(EC2-II Model)
225
7.3.2 Modification on parameters 226
7.3.2.1 Inclination angle of shear cracks, ϴ 226
7.3.2.2 Shear reinforcement ratio,
226
7.3.3 Comparisons with test results 227
7.4 Summary
228
Chapter 8 Conclusions and Future Work 237
8.1 Summary of current study 238
8.2 Mix design of Oil Palm kernel Shell Concrete (OPSC) 238
8.3 Failure Mechanisms and Effect of Variables on OPSC beams 239
8.4 Comparisons between OPSC and NWC beams 240
8.5 Theoretical models 240
8.5.1 CP-I Model 241
8.5.2 CP-II Model 241
8.6 BS8110 design models 242
8.6.1 BS8110-I Model 243
8.6.2 BS8110-II Model 244
8.7 Eurocode 2 design models 244
8.7.1 EC2-I Model 245

x
8.7.2 EC2-II Model 246
8.8 Future works
247
References: 248
Appendices 253

xi
List of Tables
Page No.
Chapter 2
Table 2.1 Properties of OPS Aggregate and Crushed Granite Aggregate 61
Table 2.2 Material properties of OPSC by researchers6 62
Table 2.3 Flexural strength of OPSC6 63
Table 2.4 Vmin for NWC beams without shear reinforcement based on
EC248
63
Chapter 3
Table 3.1 Mix design of Oil Palm Shell Concrete (OPSC) 90
Table 3.2 Mix design of Normal Weight Concrete Beam (NWC) 90
Table 3.3 Details of OPSC beam specimens cast without shear
reinforcement
91
Table 3.4 Details of NWC beam specimens cast without shear
reinforcement
91
Table 3.5 Details of OPSC beam specimens cast with shear
reinforcement
92
Table 3.6 Details of NWC beam specimens cast with shear
reinforcement
92
Table 3.7 Curing and concrete strength for OPSC beam specimens cast
without shear reinforcement
93
Table 3.8 Curing and concrete strength for NWC beam specimens cast
without shear reinforcement
93
Table 3.9 Curing and concrete strength for OPSC beam specimens cast
with shear reinforcement
94
Table 3.10 Curing and concrete strength for NWC beam specimens cast
with shear reinforcement
94
Chapter 4
Table 4.1 Test results of OPSC beam specimens cast without shear
reinforcement
136
Table 4.2 Test results of NWC beam specimens cast without shear
reinforcement
136

xii
Table 4.3 Cracking load of OPSC beam specimens cast without shear
reinforcement
137
Table 4.4 Cracking load of NWC beam specimens cast without shear
reinforcement
138
Table 4.5 Span to effective depth ratio, a/d for OPSC beam specimens
cast without shear reinforcement
138
Table 4.6 Longitudinal steel ratio, ρ for OPSC beam specimens cast
without shear reinforcement
139
Table 4.7 Cube concrete strength, fcu for OPSC beam specimens cast
without shear reinforcement
139
Table 4.8 Overall sectional depth, h for OPSC beam specimens cast
without shear reinforcement
140
Table 4.9 Test results of OPSC beam specimens cast with shear
reinforcement
140
Table 4.10 Test results of NWC beam specimens cast with shear
reinforcement
140
Table 4.11 Cracking load of OPSC beam specimens cast with shear
reinforcement
141
Table 4.12 Cracking load of NWC beam specimens cast with shear
reinforcement
141
Table 4.13 Shear reinforcement spacing, s for OPSC beam specimens
cast with shear reinforcement
142
Table 4.14 Angle inclination, ϴ for OPSC beam specimens cast with
shear reinforcement
142
Table 4.15 Cube concrete strength, fcu for OPSC beam specimens cast
with shear reinforcement
143
Chapter 5
Table 5.1 Comparisons of shear strength predictions with respect to
the test results of OPSC beams cast without shear
reinforcement
185
Table 5.2 Comparisons of shear strength predictions with respect to
the test results of OPSC beams cast with shear
reinforcement
187

xiii
Chapter 6
Table 6.1 Comparisons of shear strength predictions with respect to
the test results of OPSC beams cast without shear
reinforcement
208
Table 6.2 Comparisons of shear strength predictions with respect to
the test results of OPSC beams cast with shear
reinforcement
209
Chapter 7
Table 7.1 Comparisons of shear strength predictions with respect to
the test results of OPSC beams cast without shear
reinforcement
229
Table 7.2 Comparisons of shear strength predictions with respect to
the test results of OPSC beams cast with shear
reinforcement
230

xiv
List of Figures
Page No.
Chapter 1
Figure 1.1 Oil Palm Kernel Shell (OPS) aggregate 5
Figure 1.2 Plantation of palm oil tree 5
Figure 1.3 Cross section of palm oil fruit 6
Chapter 2
Figure 2.1 Three combined actions in reinforced concrete beams without shear reinforcement27
64
Figure 2.2 Hypothesis of systematically failure for beams failed in diagonal tension30
64
Figure 2.3 Formation of diagonal tension crack for beams without shear reinforcement31
64
Figure 2.4 Shear resistance vs a/d ratio for Mattock’s data31 65
Figure 2.5 Reserve shear resistance beyond critical condition (uniform load and no shear reinforcement)34
65
Figure 2.6 Comparisons of calculated and observed critical shear intensities34
66
Figure 2.7 Shear stress at failure vs a/d35 66
Figure 2.8
vs a/d35 67
Figure 2.9 Relation between ρ and vu36 67
Figure 2.10 Ultimate shear force vs moment shear ratio for ρ = 1.7% and ρ = 2.67% for both deformed bars and plain bars38
68
Figure 2.11 Test results of series a/d=1.5, 2.5 and 3.6 with respect to concrete strength39
68
Figure 2.12 Test results of theoretical vs experimental shear strength values41
69
Figure 2.13 Effect of variables: reinforcement ratio, compressive strength and shear span on cracking and ultimate shear strength42
70
Figure 2.14 Plastic approach for reinforced concrete beams without shear reinforcement46
70

xv
Figure 2.15 Four combined actions in reinforced concrete beams with shear reinforcement27
71
Figure 2.16 Diagonal tension cracks crossed one of the shear reinforcement50
71
Figure 2.17 Comparison of test data with proposed formula51 71
Figure 2.18 Shear contributions of shear reinforcement34 72
Figure 2.19 Plastic approach for reinforced concrete beams with shear reinforcement46
72
Figure 2.20 Test results of beams with varying depth55 73
Figure 2.21 Test specimens casted by Kani55 73
Figure 2.22 Test specimens Series C casted by Leonhardt and Walther55 74
Figure 2.23 Test specimens Series D casted by Leonhardt and Walther55 74
Figure 2.24 Test specimens casted by Taylor55 75
Figure 2.25 Illustration of size effect according to theory of linear fracture mechanics and nonlinear fracture mechanics57
75
Figure 2.26 Comparisons of the design formula with literature data57 76
Figure 2.27 Experimental values vs Calculated values of mean nominal shear strength for beams without shear reinforcement58
76
Figure 2.28 Relative nominal shear strength of gravel and lightweight concrete beams as function of the effective cross sectional depth (a/d=3)59
77
Figure 2.29 Shear stresses at inclined cracking and failure vs effective depth for short beams with a/d=159
77
Figure 2.30 Crack patterns in slender beams (a/d=3) with various depth59 78
Figure 2.31 Crack patterns in short beams with various depth59 78
Figure 2.32 Experimental values vs Calculated values of mean nominal shear strength for beams without shear reinforcement60
79
Figure 2.33 Shear stresses vs effective depth for short beams with shear reinforcement59
79
Chapter 3
Figure 3.1 Grading curves of OPS Aggregate for OPSC beam specimens 95

xvi
Figure 3.2 Grading curve of Fine Aggregate for OPSC and NWC beam specimens
95
Figure 3.3 Grading curves of Gravel Aggregate for NWC beam specimens
96
Figure 3.4 General arrangements of beams without shear reinforcement
96
Figure 3.5 General arrangements of OPSC (3A, 3B, 3C) and NWC (NWCA) beams reinforced with 2T14 (compression), 2T16 (tension), and R6@120 mm (shear reinforcement)
97
Figure 3.6 General arrangements of OPSC (4A, 4B, 4C, 4D, 4E) and NWC (NWCB, NWCD, NWCE) beams reinforced with 2T14 (compression), 2T16 (tension), and R6@80 mm (shear reinforcement)
97
Figure 3.7 General arrangements of OPSC (5A, 5B, 5C) and NWC (NWCC) beams reinforced with 2T(14 + 20) (compression), 2T(16+20) (tension), and R6@60 mm (shear reinforcement)
98
Figure 3.8 General arrangements of steel mould for casting of specimens having overall section depth ≤ 200 mm
99
Figure 3.9 Bolting details of steel mould shown in Figure 3.8 100
Figure 3.10 General arrangements of wooden mould for casting of specimens having overall section depth > 200 mm
101
Figure 3.11 Bolting details of steel mould shown in Figure 3.10 102
Figure 3.12 Test setup for OPSC and NWC beam specimens 103
Figure 3.13 Loading rig for OPSC and NWC beam specimens 103
Figure 3.14 Loading arrangement for all beam specimens cast without shear reinforcement
104
Figure 3.15 Location of shear reinforcement were marked to ensure for correct positioning of loads and supports
104
Figure 3.16 Loading arrangement for OPSC and NWC beam specimens cast with shear reinforcement spaced at 120 mm intervals and loaded with 240 mm shear span
105
Figure 3.17 Loading arrangement for OPSC and NWC beam specimens cast with shear reinforcement spaced at 80 mm intervals and loaded with 240 mm shear span
105
Figure 3.18 Loading arrangement for OPSC and NWC beam specimens cast with shear reinforcement spaced at 60 mm intervals and loaded with 240 mm shear span
106
Figure 3.19 Loading arrangement for OPSC and NWC beam specimens cast with shear reinforcement spaced at 80 mm intervals and loaded with 200 mm shear span
106

xvii
Figure 3.20 Loading arrangement for OPSC and NWC beam specimens cast with shear reinforcement spaced at 80 mm intervals and loaded with 160 mm shear span
107
Figure 3.21 Position of mechanical dial gauge for measurements of mid span deflection
107
Chapter 4
Figure 4.1 Failure mechanism of OPSC beam cast without shear reinforcement, 10A
144
Figure 4.2 Failure mechanism of OPSC beam cast without shear reinforcement, S1
144
Figure 4.3 Failure mechanism of OPSC beam cast without shear reinforcement, 12A
144
Figure 4.4 Failure mechanism of OPSC beam cast without shear reinforcement, 12B
144
Figure 4.5 Failure mechanism of OPSC beam cast without shear reinforcement, 12C
144
Figure 4.6 Failure mechanism of OPSC beam cast without shear reinforcement, 12D
145
Figure 4.7 Failure mechanism of OPSC beam cast without shear reinforcement, 12E
145
Figure 4.8 Failure mechanism of OPSC beam cast without shear reinforcement, 12F
145
Figure 4.9 Failure mechanism of OPSC beam cast without shear reinforcement, 16A
145
Figure 4.10 Failure mechanism of OPSC beam cast without shear reinforcement, 16B
145
Figure 4.11 Failure mechanism of OPSC beam cast without shear reinforcement, 16C
146
Figure 4.12 Failure mechanism of OPSC beam cast without shear reinforcement, 16D
146
Figure 4.13 Failure mechanism of OPSC beam cast without shear reinforcement, 16E
146
Figure 4.14 Failure mechanism of OPSC beam cast without shear reinforcement, 20A
146
Figure 4.15 Failure mechanism of OPSC beam cast without shear reinforcement, 20B
146
Figure 4.16 Failure mechanism of OPSC beam cast without shear reinforcement, 20C
147
Figure 4.17 Failure mechanism of OPSC beam cast without shear reinforcement, 20D
147

xviii
Figure 4.18 Failure mechanism of OPSC beam cast without shear reinforcement, 20E
147
Figure 4.19 Failure mechanism of OPSC beam cast without shear reinforcement, AD1
147
Figure 4.20 Failure mechanism of OPSC beam cast without shear reinforcement, AD2
147
Figure 4.21 Failure mechanism of OPSC beam cast without shear reinforcement, F1
148
Figure 4.22 Failure mechanism of OPSC beam cast without shear reinforcement, F2
148
Figure 4.23 Failure mechanism of OPSC beam cast without shear reinforcement, H2
148
Figure 4.24 Failure mechanism of OPSC beam cast without shear reinforcement, S2
148
Figure 4.25 Failure mechanism of NWC beam cast without shear reinforcement, NWC1
148
Figure 4.26 Failure mechanism of NWC beam cast without shear reinforcement, NWC2
149
Figure 4.27 Failure mechanism of NWC beam cast without shear reinforcement, NWC3
149
Figure 4.28 Failure mechanism of NWC beam cast without shear reinforcement, NWC4
149
Figure 4.29 Failure mechanism of NWC beam cast without shear reinforcement, NWC5
149
Figure 4.30 Load (kN) vs Central deflection (mm) for OPSC beam specimens cast without shear reinforcement of a/d = 1 and ρ = 1.08%, 1.92% and 2.99%
150
Figure 4.31 Load (kN) vs Central deflection (mm) for OPSC beam specimens cast without shear reinforcement of a/d = 1.5 and ρ = 1.08%, 1.92% and 2.99%
150
Figure 4.32 Load (kN) vs Central deflection (mm) for OPSC beam specimens cast without shear reinforcement of a/d = 2.5 and ρ = 1.92%
151
Figure 4.33 Load (kN) vs Central deflection (mm) for OPSC beam specimens cast without shear reinforcement of a/d = 2.5 and ρ = 0.75%, 1.08% and 2.99%
151
Figure 4.34 Load (kN) vs Central deflection (mm) for OPSC beam specimens cast without shear reinforcement of a/d = 3 and ρ = 1.08%, 1.92% and 2.99%
152
Figure 4.35 Load (kN) vs Central deflection (mm) for NWC beam specimens cast without shear reinforcement
152
Figure 4.36 Surface texture at the interface of major diagonal shear cracks of OPSC beams cast without shear reinforcement
153

xix
(Sectional view)
Figure 4.37 Diagonal shear cracks of OPSC and NWC beams cast without shear reinforcement (Side view)
153
Figure 4.38 VOPSC (kN) vs Shear span to effective depth ratio, a/d for OPSC beam specimens cast without shear reinforcement
154
Figure 4.39 VTest (kN) vs Shear span to effective depth ratio, a/d for OPSC and NWC beam specimens cast without shear reinforcement
154
Figure 4.40 Surface texture of diagonal shear interface of OPSC beams cast without shear reinforcement tested at a/d=1.5 and a/d=2.5 (Sectional view)
155
Figure 4.41 Surface texture of diagonal shear interface of OPSC and NWC beams cast without shear reinforcement tested at a/d ratio = 1 (Sectional view and Isometric view)
156
Figure 4.42 Surface texture of diagonal shear interface of OPSC and NWC beams cast without shear reinforcement tested at a/d ratio = 2.5 (Sectional view and Isometric view)
157
Figure 4.43 VOPSC(kN) vs Longitudinal steel ratio, ρ (%) for OPSC beam specimens cast without shear reinforcement
158
Figure 4.44 VTest kN) vs Longitudinal steel ratio, ρ (%) for OPSC and NWC beam specimens cast without shear reinforcement
158
Figure 4.45 VOPSC(kN) vs Concrete strength, fcu (N/mm2) for OPSC beam specimens cast without shear reinforcement
159
Figure 4.46 VTest (kN) vs Concrete strength, fcu (N/mm2) for OPSC and NWC beam specimens cast without shear reinforcement
159
Figure 4.47 VOPSC(kN) vs Overall section depth, h (mm) for OPSC beam specimens cast without shear reinforcement
160
Figure 4.48 VOPSC(N/mm2) vs vs Overall section depth, h (mm) for OPSC and NWC beam specimens cast without shear reinforcement
160
Figure 4.49 VTest (kN) vs Overall section depth, h (mm) for OPSC and NWC beam specimens cast without shear reinforcement
161
Figure 4.50 Failure mechanism of OPSC beam cast with shear reinforcement, 3A
161
Figure 4.51 Failure mechanism of NWC beam cast with shear reinforcement, 3B
161
Figure 4.52 Failure mechanism of NWC beam cast with shear reinforcement, 3C
161
Figure 4.53 Failure mechanism of OPSC beam cast with shear reinforcement, 4A
162
Figure 4.54 Failure mechanism of NWC beam cast with shear reinforcement, 4B
162
Figure 4.55 Failure mechanism of NWC beam cast with shear reinforcement, 4C
162

xx
Figure 4.56 Failure mechanism of OPSC beam cast with shear reinforcement, 5A
162
Figure 4.57 Failure mechanism of NWC beam cast with shear reinforcement, 5B
162
Figure 4.58 Failure mechanism of NWC beam cast with shear reinforcement, 5C
163
Figure 4.59 Failure mechanism of OPSC beam cast with shear reinforcement, 4D
163
Figure 4.60 Failure mechanism of OPSC beam cast with shear reinforcement, 4E
163
Figure 4.61 Failure mechanism of NWC beam cast with shear reinforcement, NWCA
163
Figure 4.62 Failure mechanism of NWC beam cast with shear reinforcement, NWCB
163
Figure 4.63 Failure mechanism of NWC beam cast with shear reinforcement, NWCC
164
Figure 4.64 Failure mechanism of NWC beam cast with shear reinforcement, NWCD
164
Figure 4.65 Failure mechanism of NWC beam cast with shear reinforcement, NWCE
164
Figure 4.66 Load (kN) vs Central deflection (mm) for OPSC beam specimens with shear reinforcement of shear reinforcement spacing = 120 mm
165
Figure 4.67 Load (kN) vs Central deflection (mm) for OPSC beam specimens with shear reinforcement of shear reinforcement spacing = 80 mm
165
Figure 4.68 Load (kN) vs Central deflection (mm) for OPSC beam specimens with shear reinforcement of shear reinforcement spacing = 60 mm
166
Figure 4.69 Load (kN) vs Central deflection (mm) for NWC beam specimens with shear reinforcement
166
Figure 4.70 Surface texture of diagonal shear interface of OPSC and NWC beam specimens cast with shear reinforcement (Sectional view)
167
Figure 4.71 Surface texture of diagonal shear interface of OPSC and NWC beam specimens cast with shear reinforcement (Isometric view)
168
Figure 4.72 VOPSC(kN) vs Shear reinforcement spacing, s (mm) for OPSC beam specimens cast with shear reinforcement
169
Figure 4.73 VTest (kN) vs Shear reinforcement spacing, s (mm) for OPSC and NWC beam specimens cast with shear reinforcement
169
Figure 4.74 VOPSC(kN) vs Inclination of shear cracks, ϴ (degree) for OPSC beam specimens cast with shear reinforcement
170

xxi
Figure 4.75 VTest(kN) vs Inclination of shear cracks, ϴ (degree) for OPSC and NWC beam specimens cast with shear reinforcement
170
Figure 4.76 VOPSC(kN) vs Concrete strength, fcu (N/mm2) for OPSC beam specimens cast with shear reinforcement
171
Figure 4.77 VTest (kN) vs Concrete strength, fcu (N/mm2) for OPSC and NWC beam specimens cast with shear reinforcement
171
Chapter 5
Figure 5.1 f(a/h) vs a/h for Existing plastic model (CP-NS Model) and Modified plastic model (CP-I Model)
188
Figure 5.2 f(ρ) vs ρ(%) for Existing plastic model (CP-NS Model) and Modified plastic model (CP-I Model)
188
Figure 5.3 f(σc) vs σc (N/mm2) for Existing plastic model (CP-NS Model) and Modified plastic model (CP-I Model)
189
Figure 5.4 f(h) vs h (mm) for Existing plastic model (CP-NS Model) and Modified plastic model (CP-I Model)
189
Figure 5.5 VOPSC/VCP vs Shear span to height ratio, a/h 190
Figure 5.6 VOPSC/VCP vs Longitudinal steel ratio, ρ (%) 190
Figure 5.7 VOPSC/VCP vs Cylindrical concrete strength, σc (N/mm2) 191
Figure 5.8 VOPSC/VCP vs Overall section depth, h (mm) 191
Figure 5.9 f(σc) vs σc (N/mm2) for Existing CP Model (CP-S Model) and Modified CP Model (CP-II Model)
192
Figure 5.10 f(ρs) vs ρs (%) for Existing concrete plastic model (CP-S Model)
192
Figure 5.11 f(
) vs ϴ(rad) for Existing CP Model (CP-S Model) 193
Figure 5.12 VOPSC/VCP vs Cylindrical concrete strength, σc (N/mm2) 193
Figure 5.13 VOPSC/VCP vs Shear reinforcement ratio, ρs (%) 194
Figure 5.14 VOPSC/VCP vs Inclination angle of shear cracks, ϴ (rad) 194
Chapter 6
Figure 6.1 f(a/d) vs a/d for Existing BS8110 design Model (BS8110-NS Model) and Modified BS8110 design Model (BS8110-I Model)
210

xxii
Figure 6.2 f(ρ) vs ρ (%) for Existing BS8110 design model (BS8110-NS Model)
210
Figure 6.3 f(fcu1/3) vs fcu (N/mm2) for Existing BS8110 design model
(BS8110-NS Model) 211
Figure 6.4 f(d) vs d (mm) for Existing BS8110 design Model (BS8110-NS Model) and Modified BS8110 design Model (BS8110-I Model)
211
Figure 6.5 VOPSC/VBS8110 vs Shear span to effective section depth ratio, a/d
212
Figure 6.6 VOPSC/VBS8110 vs Longitudinal steel ratio, ρ (%) 212
Figure 6.7 VOPSC/VBS8110 vs Cube concrete strength, fcu (N/mm2) 213
Figure 6.8 VOPSC/VBS8110 vs Effective section depth, d (mm) 213
Figure 6.9 f(
) vs
for Existing BS8110 design model (BS8110-S
Model)
214
Figure 6.10 f( 1/3) vs ( ⁄
) for Existing BS8110 design model
(BS8110-S Model)
214
Figure 6.11 f(
vs for Existing BS8110 design model (BS8110-S
Model) and Modified BS8110 design model (BS8110-II Model)
215
Figure 6.12 VOPSC/VBS8110 vs Shear reinforcement ratio,
215
Figure 6.13 VOPSC/VBS8110 vs Cube concrete strength, fcu (N/mm2)
216
Figure 6.14 VOPSC/VBS8110 vs Shear span to effective depth ratio, a/d 216
Chapter 7
Figure 7.1 f(a/d) vs a/d for Existing EC2 design Model (EC2-NS Model) and Modified EC2 design Model (EC2-I Model)
231
Figure 7.2 f(ρ1/3) vs ρ (%) for Existing EC2 design Model (EC2-NS Model) 231
Figure 7.3 f(fck1/3) vs fck (N/mm2) for Existing EC2 design Model (EC2-NS
Model) 232
Figure 7.4 f(k) vs d (mm) for Existing EC2 design Model (EC2-NS Model) and Modified EC2 design Model (EC2-I Model)
232
Figure 7.5 VOPSC/VCP vs Shear span to effective depth ratio, a/d 233
Figure 7.6 VOPSC/VCP vs Longitudinal steel ratio, ρ (%) 233
xxiii
Figure 7.7 VOPSC/VCP vs Cylindrical concrete strength, fck (N/mm2) 234
Figure 7.8 VOPSC/VCP vs Effective section depth, d (mm) 234
Figure 7.9 f(cot ϴ) vs ϴ (degree) for Existing EC2 design Model (EC2-S Model)
235
Figure 7.10 f(
) vs
for Existing EC2 design Model (EC2-S Model) and
Modified EC2 design Model (EC2-II Model)
235
Figure 7.11 VOPSC/VEC2 vs Inclination angle of shear cracks, ϴ (degree) 236
Figure 7.12 VOPSC/VEC2 vs Shear reinforcement ratio,
236

xxiv
Notations
a Length of that part of a member traversed by a shear failure plane
As Cross sectional area of longitudinal steel reinforcement
Asw Cross sectional area of shear reinforcement
b Breadth of section
d Effective depth
d’ Depth to compression reinforcement
fcu Cube concrete strength
fck Cylindrical concrete strength
fyk Characteristic yield strength of reinforcement
fyw Design yield strength of the shear reinforcement
h Overall depth of beam section
L Length or span
M Moment or bending moment
s Shear reinforcement spacing
vc Design cracking stress of the beam
vu Design ultimate shear stress of the beam
V Total shear strength of the beam
Vc Design cracking load of the beam
Vu Design shear force due to ultimate load
ρ Longitudinal steel ratio
ρs Shear reinforcement ratio
ϴ Inclination angle of shear cracks
ϒm Partial safety factor for material strength
ϒc Partial safety factor for concrete strength

1
Chapter 1
Introduction
1.1 Introduction In recent years, the use of Oil Palm kernel Shell (OPS) (see Figure 1.1) as coarse
aggregate in concrete, Oil Palm kernel Shell Concrete (OPSC), has increasingly
become popular in research [1-16] owing to its environmental and economic
benefits. Due to the scale of palm oil production industry in Malaysia, substantial
amount of OPS have therefore resulted. However, these OPS were of no economical
values and were mostly left to decay [1], but, in recent years, it has become
increasing popular as raw burning materials for power production [17].
OPS (see Figure 1.1) is essentially a by-product of palm oil production (see Figure
1.2). OPS has low bulk density, and when it is used in concrete as coarse aggregate,
lightweight concrete is produced. The lightweight nature of the concrete reduces the
overall dead load in a structure, hence, lead to smaller foundation size, and results in
a great amount of saving in the total construction cost [13].
The OPSC constitutes of cement, sand, OPS and water. Since the introduction of
OPSC, considerable amount of research [1-16] have been carried out to aid the
understanding of its concrete mixture designs [1-6] and its material properties [7-11].
OPS is brown coloured in nature and it is basically the hard endocarps encasing the
palm kernel oil from the palm fruit as shown in Figure 1.3. The OPS extracted from

2
palm oil production take the shape of crescent, where the convex part of OPS were
observed to be rougher than the concave part as indicated in Figure 1.1.
1.2 Problem Statement
Previous researchers [1-11] have been focusing on the mix design and material
properties of OPSC. However, only limited amount of works have been carried out to
aid the understanding of the OPSC structural resistance, such as bending resistance
[12-14] and shear resistance [15 & 16]. Hence, due to the OPS promising potential as
lightweight aggregates, and OPSC as lightweight structural concrete, it is apparent
that more research are required to develop a comprehensive understanding,
particularly, in the area of shear transfer mechanism for its structural elements.
Current understanding on shear transfer mechanism, derives from tests on NWC cast
using normal granite aggregates, indicates that shear resistance of reinforced
concrete elements derives from aggregate interlocking, dowel action of the
longitudinal reinforcement, concrete compression zone and concrete tensile
strength. Since the OPS aggregate differed from those of normal aggregates in term
of aggregate impact strength, specific gravity, aggregate shape, and bulk density, the
shear transfer mechanism of OPSC would expected to be different from those of
NWC.
The current design procedures by BS8110 [47] and EC2 [48] for shear transfer
mechanism of both the Lightweight Aggregate Concrete (LWAC) and the Normal
Weight Concrete (NWC) are derived from the understanding of concrete cast using
normal aggregates. Hence, it is apparent that, the current design procedures by
BS8110 [47] and EC2 [48] may not be suitable to predict the ultimate shear resistance

3
of the OPSC beams. Since no guidance has been given from the current codes of
practice [47 & 48], it is therefore essential that a research investigation to be carried
out to aid the current understanding on shear transfer mechanisms of OPSC beams,
both cast without shear reinforcements and with shear reinforcements.
1.3 Objectives and scope
The main objective of this research is to explore the shear resistance of OPSC beams
through experimental and analytical study.
1.3.1 Objectives
Objectives of the research include:
1. To develop mix design of OPSC for structural applications.
2. To observe from experimental testing, the effect of variables considered on
the ultimate shear failure capacities and the shear failure mechanisms.
3. To compare the ultimate shear failure capacities and shear failure
mechanisms between the OPSC beams and NWC beams cast with and
without shear reinforcements, respectively.
4. To develop theoretical prediction models using upper bound plastic approach
[45 & 46] and simple predictive design models, from those based on the
current EC2 [47] and BS8110 [48] to predict the shear carrying resistance of
OPSC beams cast with and without shear reinforcements, respectively.
1.3.2 Scope
For OPSC cast without shear reinforcements, the variables considered are
concrete strength (σc), overall section depth (h), longitudinal steel ratio (ρ),
and shear span to height ratio (a/h). While for OPSC beams cast with shear

4
reinforcements, the effect of variables considered include concrete strength
(fck), shear reinforcements ratio (ρs) and inclined angle of shear cracks (ϴ).

5
Figure 1.1 Oil Palm kernel Shell (OPS) Aggregate.
Figure 1.2 Plantation of Palm Oil Tree.

6
Figure 1.3 Cross Section of Oil Palm Fruit.

7
Chapter 2
Literature Review
2.1 Introduction
In 1990, Okapala [1] introduced the use of Oil Palm kernel Shell (OPS) aggregates in
concrete and subsequently, considerable amount of research have been carried out
to aid the understanding of Oil Palm kernel Shell Concrete’s (OPSC) mixture design
[1-6] and material properties [7-11].
However, the current understanding of OPSC Beam’s structural resistance, such as,
bending resistance [12-14] and shear resistance [15 & 16] carried out by researchers
were found to be limited. In order to improve the current understanding in OPSC
beam’s shear mechanism, the present understanding about the shear mechanism of
reinforced concrete beam elements cast with normal aggregates have been reviewed
to form the fundamental understanding for this research. The shear mechanism and
effect of variables on the shear strength of normal weight concrete beams without
and with shear reinforcement based on various approaches [18-61] were reviewed in
Section 2.2 and Section 2.3.
On the other hand, as this research involves the use of Oil Palm Kernel Shell (OPS) as
coarse aggregates in concrete, therefore, the present understanding about its
mixture design [1-6] were reviewed in Section 2.5 to form the fundamental
understanding for the OPS mixture design of this research.

8
2.2 Shear for normal weight concrete beam
Shear failure mechanism is a rupture and complex failure mechanism; hence, it has
received extensive amounts of attentions among the researchers during the last two
centuries. Numerous tests have been performed to obtain the experimental data as
well as many methods were employed to obtain the shear capacity of both normal
weight concrete (NWC) beams with and without shear reinforcement. From which,
various understanding and design procedures have been reported.
In 1899, Ritter [18] introduced the concept of truss analogy and proposed the design
of shear reinforcement, which was later found to be very similar to that published of
the ACI-ASCE 1962’s design specifications [19]. Later in 1906-1907, MÖrsch [20]
presented an explanation to the diagonal tension mechanism, and further supported
his theory with data from Von Emperger [21] and Probst [22]. MÖrsch [20]
introduced the shear strength concept, Vu/bd and reinforced Ritter’s concept [18] by
stating that contribution from shear reinforcement to the shear resistance of
reinforced concrete members by resisting tensile stresses, and not shear stresses. He
demonstrated that the effectiveness of shear reinforcement is more pronounced
when diagonal crack occurred.
Later in 1909, Talbot [23] disputed the fact that nominal shear strength of the normal
weight concrete beams is only dependent on the concrete compressive strength.
That is, it was demonstrated apart from the material strength, contributions from the
amount of longitudinal steel reinforcement, and the beam length to depth ratios
were also noted [23]. Furthermore, it was reported that diagonal tension failure
occurred not only due to the stresses from bending, but also due to the shear

9
stresses. Talbot presented his concept from analytical studies of 106 NWC beams
without shear reinforcement. Unfortunately, those findings were not expressed in
mathematical terms [18].
According to ACI-ASCE Committee 326 [19], in the years between 1920 and early
1950’s, the investigations by Talbot and other pioneers along with the early research
carried out on the effects of percentage of reinforcement and the length to depth
ratio was forgotten. It was only in the late 1940’s that these forgotten fundamentals
were recalled when Moretto [24] reported on a series of beam tests and proposed an
empirical equation, which considered the variable of percentage of longitudinal steel
reinforcement.
Later in the early 1950’s, Clark [25] introduced the variable of shear span to depth
ratio, a/d ratio into his proposed equation, which was also recognized as a
mathematical expression for the effect of length to depth ratio. In addition, Clark’s
equation also incorporated Talbot’s philosophies by inclusion of the three variables:
percentage of longitudinal steel reinforcement, ratio of length to depth, and concrete
strength [25] into his investigations.
Hence, these pioneer findings had inspired subsequent researchers in realizing the
effects of various variables on the shear failure of normal weight concrete (NWC)
beams cast without shear reinforcement and with shear reinforcement. The
contributions by researchers [18-53] in the prediction of shear capacity of concrete
beam are notable for the current understanding of structural concrete beam element
for shear strength prediction of NWC beams without and with shear reinforcement
(see Section 2.2.1 and Section 2.2.2, respectively).

10
2.2.1 Shear for NWC beams without shear reinforcement
For NWC beams without shear reinforcement, the approaches presented by
researchers consist of basic shear transfer mechanism (see Section 2.2.1.1), empirical
approach (see Section 2.2.1.2), concrete plasticity approach (see Section 2.2.1.3), and
building code approach (see section 2.2.1.4).
2.2.1.1 Basic shear transfer mechanism
In 1973, the ACI-ASCE Committee 426 [26] reported on the contributions from the
concrete shear stress, interface shear transfer (aggregate interlock), dowel action,
arch action and shear reinforcement on the basic shear transfer mechanism of
reinforced concrete members. However, the development of shear transfer
mechanisms in beam was not explained chronologically.
Kong and Evan [27] in 1998 presented the contribution of each internal force on the
shear resistance of both structural reinforced concrete beams casted with and
without shear reinforcement (see Figure 2.1). Furthermore, Kong and Evan reported
on the development of shear transfer mechanism with respect to reinforced concrete
beams cast without shear reinforcement and with shear reinforcement. For concrete
beam cast without shear reinforcement, the applying shear force, V is believed to be
resisted by the combination of three shear actions: (i) the shear force in uncracked
concrete compression zone (Vcz), (ii) the shear force from dowel action of the
longitudinal reinforcement (Vd), and (iii) the vertical component of shear force from
aggregate interlock (Va) (see Figure 2.1). And, the total shear resistance can be
computed as indicated below:

11
V = Vcz + Vd + Va (Eqn 2.1)
The shear force, V (Eqn 2.1) is carried in the approximate ratios stated below:
Shear Vcz in uncracked compression Zone, Vcz = 20 – 40%
Shear Vd from dowel action of the longitudinal reinforcement, Vd = 15 – 25%
Shear Va due to aggregate interlock, Va = 35 – 50%
It was reported that during testing, with the increment of applied loading, dowel
action would first reached its capacity followed by the aggregate interlock and
subsequently, by the concrete compression zone before shear failure occurred. The
consecutive development of the shear transfer mechanisms were described as:
1. The shear cracks were observed to form at the support when the dowel
action began to lose its resistance against the shear force and consequently,
after the dowel action lost its capacity, shear force are transferred to the
aggregate interlock.
2. Upon increment of loading, the shear cracks propagated towards the neutral
axis of the beam when the aggregate interlock began to lose its resistance.
3. The aggregate interlock lost its capacity when the shear cracks passed the
neutral axis of the beams and the shear force is carried by the concrete
compression zone.
4. Upon further loading, the concrete compression zone lost its capacity and
finally, the shear failure occurred.
Furthermore, Kong and Evans [27] presented a summary of the variable’s
contributions towards that shear failure of normal weight concrete beams cast
without shear reinforcement. The variables, which influenced the normal weight
concrete beam without shear reinforcement, consist of:

12
1. Concrete strength
The increment of concrete strength results in increased of the dowel action
capacity, the aggregate interlock capacity and the compression zone capacity.
It is believed that the bond strength between the tension reinforcement and
concrete increased as the concrete strength increased.
2. Aggregate type
The aggregate type influenced the aggregate interlock capacity with different
aggregate crushing strength, impact strength and abrasion strength, which in
turn affects the shear strength of the beam.
3. Beam size
The increased of beam size results in the ultimate shear stress reduction,
which larger beams are weaker than smaller beams. It is believed that the
increments of aggregate interlock capacity are not proportional to the beam
size.
4. Longitudinal steel ratio
The shear strength is affected by the longitudinal steel ratio as lower
longitudinal steel ratio results in the reduction of shear strength with the
decreased of dowel shear capacity and increased of crack widths, which in
turn reduces the aggregate interlocking capacity.
5. Shear span to effective depth ratio
The increment of shear span to effective depth ratio, a/d would results in the
reduction of shear strength. When a beam is loaded with a/d < 2.5, it is
reported that beam assumed to behave like an arch action, which allows the
load to be transferred to the support.

13
Whilst for normal weight concrete with shear reinforcement, the combination of the
shear actions and the consecutive developments of the shear transfer mechanisms
are presented in Section 2.2.2.1.
2.2.1.2 Empirical Approach
Moody et.al [28 & 29] in 1954 presented experimental works on 40 NWC beams
casted without shear reinforcement and 2 NWC beams casted with shear
reinforcement, which were segregated into three series to observe the influence of
the variables: (i) percentage of longitudinal and web reinforcement and method of
anchorage, (ii) size and percentage of longitudinal reinforcement and cylindrical
concrete strength and (iii) concrete mixture and method of curing. The concept of
redistribution of internal stresses was introduced for the predictions of shear failure
for NWC beams. For each of the 3 series, the sizes of the beams were different and
the beams were tested with one or two concentrated load. It was observed that all
beams failed in shear. It is observed that the shear capacity of the NWC beam
specimens increased with the increment of concrete strength and percentage of
longitudinal steel. It was also noted that the test results indicated that the beam
strength tested at higher a/d ratio is governed by the first cracking load whilst the
beam strength tested at lower a/d ratio is governed by the load, which caused
destruction to the concrete compression zone. Hence, it is suggested by Moody et. al
that instead of cracking load, ultimate load should be taken as the measured value
for shear capacity.
Ferguson [30] in 1956 presented two series of tests on (1) the effect of extra and
multiple loads with constant a/d ratio, and (2) variable of shear span to depth ratio

14
(a/d) with identical loading condition, on the ultimate shear capacity of concrete
beams without shear reinforcement. It was found that higher ultimate shear strength
were obtained for beams loaded with four point loads compared to two point loads.
Furthermore, it was found that the beams loaded with point load near the support
(lower a/d ratio) sustained higher ultimate strength compared to beams loaded
further away from the support (higher a/d ratio). Further discussions on the
development of shear failure for concrete beams without shear reinforcement were
indicated systematically, which is shown in Figure 2.2 that:
(1) Initial diagonal crack formed near mid depth and discontinued within the
compression area at 1a, and in tension area somewhere at 1b.
(2) Discontinuation of cracks propagations from 1a towards the compression
zone at 2.
(3) Cracking in the zone around the steel, which might developed simultaneously
with (2).
(4) Sudden failure by an extension of flexural crack at 4a or the shear-
compression failure at 4b, accompanied with a secondary failure in splitting
at bond at 4c.
Taub et.al [31] in 1960 reported the shear failure of concrete beam based upon
redistribution of internal stresses introduced by Moody et. al [24 & 25] and the effect
of each variable considered: (1) types of shear failure and the influence of a/d ratio,
(2) shape and proportions of beam, (3) percentage area of main tension and
compression reinforcement, (4) size of tension bars, (5) cylindrical concrete strength
and (6) arrangement of loading and the magnitude of the bending moment and
shearing force applied, on the shear strength of concrete beam without shear

15
reinforcement. The free body diagram after widening of the diagonal cracks for a
beam without shear reinforcement is shown in Figure 2.3. The redistribution of
internal forces was presented (see Figure 2.3), which when the diagonal cracks were
formed, the force in tension reinforcement, T was assumed to acts in horizontal
direction. Hence, the redistribution of internal forces occurred when the diagonal
tension crack reached section 2-2, where the distribution of forces in tension
reinforcement along the beam varied with the distribution of external moment.
Upon further increment of loading, the diagonal tension crack extended at either end
and ultimately, lead to the failure of the beam.
In addition, Taub et.al [31] categorized shear failure into four distinct types for
normal weight concrete beam without shear reinforcement, which are:
1. Shear compression failure, which occurred by crushing at the concrete
compression zone when compressive stress in concrete become equal to its
ultimate strength due to the extension of diagonal tension cracks followed by
the reduction of compressive block size.
2. Shear tension failure accompanied by anchorage failure at the support, which
occurred when anchorage was not provided.
3. Shear tension failure by total separation of beam at shear span, which occurred
by horizontal splitting of the beam at the shear span tension zone.
4. Crushing of concrete strut connecting the load point with the support, which
occurred when shear span is extremely small.
From the studies carried out for NWC beams without shear reinforcement, Taub et.al
[31] concluded that:

16
1. The shear force increased with the reduction of a/d based on Mattock’s data
(see Figure 2.4), where beams tested at different a/d failed in different type of
shear failure: a/d=0.96 failed in strut like manner, a/d=1.45 failed in shear
compression, a/d=1.93 failed in balanced failure between shear compression
and diagonal tension, a/d=3.83 failed suddenly in shear tension when splitting
along the main steel occurred, and a/d=7.79 failed in flexural failure by yielding
of steel at mid span with results.
2. Experimental works carried out indicated that the concrete beam shear strength
is not affected by the compression reinforcement.
3. Based on the results, the ultimate shear strength of normal weight concrete
beams without shear reinforcement was influenced by concrete strength, which
the shear strength increased with the increment of cylindrical concrete strength.
4. The influence of shape and proportions of beams were reported by increment of
beam width based on the test results of T beams and rectangular beams by
results indicated that shear force were found to be directly proportional to the
width of the web.
5. The resistance to bond failure is higher when a larger number of smaller
longitudinal bars were used instead of smaller number of larger longitudinal
bars for the same longitudinal steel ratio. Hence, the amount of longitudinal
bars adopted by Author in this research was reserved as two numbers to avert
this influence on the OPSC beams test results.
Apart from normal weight concrete beam without shear reinforcement, the
redistribution of internal forces and the observations on the tests conducted on the
normal weight concrete beam with shear reinforcement were also reported by Taub
et. al [50], which are mentioned in Section 2.2.2.2.

17
Mathey and Watsein [32] in 1963 presented the findings of the experimental study
on the effect of yield strength of longitudinal reinforcement ranging from 275 N/mm2
to 690 N/mm2 on the shear strength of the beams and a total of 25 NWC beams
without shear reinforcement were tested. It was found from the investigations that
the shear strengths at the diagonal tension cracking loads were not influenced by the
yield strength of the longitudinal reinforcement. A modified empirical formula based
on Clark’s formula [25] was proposed for a prediction of cracking shear stress, which
is given as:
vc = √
(Eqn 2.2)
It was reported that the proposed formula contributes to a lower bound solution and
is applicable for beams with wide range of concrete strengths, longitudinal steel
ratios, steel stresses, properties of reinforcement, and ratios of external shear to
maximum moment in the shear span.
Acharya and Kemp [33] in 1965 reported the contributions of dowel forces on the
shear resistance of rectangular beams cast without shear reinforcement with a series
of 20 beams. It was reported that the high stresses on the concrete at the top of the
diagonal stress were implied with the assumption of zero dowel force. Hence, it was
indicated that the size and its point of application are important factors in deciding
the mode of shear failure of the beam. Hence, it is understood by Author that
Archary and Kemp acknowledged the influence of longitudinal steel reinforcement
and shear span to effective depth ratio affecting the type of failure for rectangular
beams without shear reinforcement.

18
Krefeld and Thurston [34] in 1966 reported the tests on 152 reinforced concrete
beams without shear reinforcement, in which 78 beam specimens and 74 beam
specimens were subjected to concentrated load and uniform load, respectively. The
tests carried out took into account for the variables: (1) concrete strength, (2) beam
dimensions, (3) longitudinal steel ratios, and (4) span length. All the beams were
subjected to concentrated load and it was observed that the shear strength were
affected by the span length, L/d ratio, which showed that longer span length, L/d
results in lower shear resistance of the beams (see Figure 2.5). It was found that a
good agreement with a mean of 0.96 is achieved between the test results and the
calculated critical average shearing stress, Vx, when the formula is taken
as:
√
⁄ (Eqn 2.3)
Where, fck = cylindrical concrete strength (psi)
V = total shear at a section
M = bending moment at a section
However, it was reported that for common beam dimensions, the suggested Eqn 2.3
varied from 0.77 to 0.91 (see Figure 2.6). Therefore, using a mean of 0.86, the shear
cracking load, Vc, were taken as the maximum applied resistance for common beam
dimensions, which is given as follow:
√
⁄ (Eqn 2.4)
In addition, Krefeld and Thurston also presented formulas for the shear strength
predictions of normal weight concrete beams casted with shear reinforcement,
which are given in Section 2.2.2.2.

19
Kani [35] in 1966 reported the test results of 133 beams without shear reinforcement
to investigate the influence of 3 variables; fck, ρ and a/d ratio. From the
investigations, it was acknowledged that:
1. The change of behaviour for beams tested at a/d < 2.5 and a/d > 2.5 (see Figure
2.7). It was noted that a/d = 2.5 is the minimum point for beam strength, which
the “valley of diagonal failure” is greatly reduced at the region of a/d = 1.5 and
3.5. (see Figure 2.8)
2. The contribution of longitudinal steel reinforcement (ρ) on the ultimate shear
capacity of NWC beams without shear reinforcement as experiments reported
confirmed the effect of percentage of longitudinal steel reinforcement on the
shear capacity of the beams when other variables were kept constant.
3. The influence of concrete strength on the so called shear strength was
insignificant and could be ignored in the analysis of diagonal failure load.
Rajagopalan and Ferguson [36] in 1968 presented the effect of percentage of
longitudinal steel, ρ of the normal weight concrete beams without shear
reinforcement. The experimental consist of 10 normal weight concrete beams tested
at a/d=4 with respect to variable of ρ (%), which the results reported loss of shear
strength with the reduction of ρ (%) (see Figure 2.9). An ultimate shear stress formula
is proposed based on the test results from the experimental works for beams tested
with a/d > 2.75 (see figure 2.9) subjected to ρ ≤ 0.012, and it is given as:
√ (Eqn 2.5)
It was noted that the proposed formula gives a lower bound solution when in
comparisons to the test results (see Figure 2.9).

20
Zsutty [37] in 1971 presented a formula for NWC beam without shear reinforcement
tested at shear span to effective depth ratio, a/d < 2.5 and a/d ≥ 2.5, respectively,
using dimensional analysis and statistical regression analysis of approximately 200
beams test data from different sources It was reported that beam behaviour should
be separated into arch action of short beams and beam actions of slender beams.
The arch action of short beams was categorized for beams tested at a/d < 2.5, which
compressive stress or direct load transfers to support were observed. Whilst for the
beam action of slender beams, it was categorized for beams tested at a/d ≥ 2.5,
which combined bending and shear stress were observed. The primary variables
considered were the concrete strength, the longitudinal steel ratio and the shear
span to effective depth ratio for both NWC beams without shear reinforcement and
with shear reinforcement. The proposed empirical formulas are given as:
For slender beam, a/d ≥ 2.5,
√
(Eqn 2.6)
For short beam, a/d < 2.5,
√
(Eqn 2.7)
However, for value of a/d = 2.5, discontinuity were observed, which he
acknowledged that the results obtained for short beams were not satisfactory. In
addition, another formula for the shear capacity predictions of normal weight
concrete beams with shear reinforcement is reported, which is mentioned in Section
2.2.2.2.
Swamy et al. [38] in 1970 reported on the investigations of five series of tests on the
internal mechanism of shear failure and load distribution of reinforced beams, which
consists of arch action formed in unbonded bar, steel strain distribution of the

21
rectangular and T-beams under various loading conditions, cracking from
compression edge near load points and supports and neutral axis profile throughout
each beam, were comprehensively discussed. In addition, one test series were
reported to discuss the effect of bond conditions and surface conditions of
longitudinal steel on the beam cast without shear reinforcement. It was reported
that for rectangular beams, deformed bars provide higher shear resistance compared
to plain bars for smaller a/d ratios. Whilst for T beams, plain bars provide higher
shear resistance than deformed bars (see Figure 2.10). It was found that the beams
cast with unbonded longitudinal steel reinforcement may also failed in shear or at
the anchorage similarly to beams casted with bonded longitudinal steel
reinforcement. It was also shown that surface conditions of the longitudinal steel,
which consists of either plain or deformed bars, did not contribute significantly
towards the ultimate shear resistance of both rectangular and T-beams.
In 1984, Mphonde and Frantz [39] presented a shear capacity formula for predicting
the ultimate shear capacity of rectangular concrete beams without shear
reinforcement of slender beams (a/d ≥ 2.5) using regression analysis. The variable of
cylinder concrete strength, fck (psi) was considered for the derivations of the formula
whilst other variables: the longitudinal steel ratio, the shear span to effective depth
ratio and the height of the beams were neglected.
The regression ultimate shear capacity formula obtained is as follow:
⁄ (Eqn 2.8)
It was reported that the proposed Eqn 2.8 best predict beams with shear span to
effective depth of 3.6 as shown in Figure 2.11.

22
Kim and White [40] in 1991 presented a cracking shear strength formula using an
approximate analytical approach based on schematical variation of cracking load
along shear span. Test data of more than 100 beams were used and the results
obtained showed good correlation between the measured and predicted values. The
variables considered include (1) longitudinal steel reinforcement, (2) shear span to
effective depth ratio and (3) concrete strength. However, the variable of beam height
is neglected. It was reported that the proposed formula is suitable for all shear span
to effective depth ratio, a/d. In addition, the proposed formula is only valid for the
prediction of cracking shear strength of NWC beams without shear reinforcement
and it is not applicable for the prediction of ultimate shear strength.
√ ( √ ) (
) √ (Eqn 2 9)
It was noted that good agreements were achieved between the shear strength
predictions (see Eqn 2.9) and the test results with the mean value of 1.009 and
standard deviation of 0.148.
Rebeiz [41] in 1999 proposed a formula each for predictions of cracking shear
strength and ultimate shear strength of NWC beams without shear reinforcement
using multiple regression analysis of original ACI formulas. It was reported that no
significant effect was found on and with respect to √ (see Figure 2.12). The
differences in behaviour between short and long beams were taken into account by
using the variable √
.
For ultimate shear strength predictions for is given as:
√
(Eqn 2.10)
For cracking shear strength predictions is given as:

23
√
(Eqn 2.11)
However, for design purpose, the ultimate shear strength prediction is given as:
√
(Eqn 2.12)
Where, shear shape adjustment factor = a/d for 1.0 < a/d < 2.5
or 2.5 for a/d ≥ 2.5
It was observed that good agreements were achieved between the proposed
theoretical predictions (Eqn 2.12) with the measured test data (see Figure 2.12).
Subsequently, Rebeiz [42] in 2001 carried out an analysis on the effects of the
variables: (1) compressive strength (fck), (2) longitudinal steel ratio (ρ) and (3) shear
span to depth ratio (a/d) on the cracking shear strength, vc and ultimate shear
strength, vu of reinforced concrete beams without shear reinforcement. Literature
data of more than 300 beams for normal strength concrete and more than 50 beams
for high strength members were used for the analysis (see Figure 2.13), which It was
found that a/d ratio has much more significant effect on the ultimate shear strength,
vu than to the cracking shear strength, vc of the beams. It was presented in Figure
2.12 that for beams tested at a/d < 2.5, the ultimate shear strength, vu reduced as
the a/d increased whilst for beams tested at a/d ≥ 2.5, both the ultimate shear
strength, vu and the cracking shear strength, vc were not affected with the variations
of a/d ratio. Further, it was observed that the compressive strength influenced both
the ultimate shear strength, vu and the cracking shear strength, vc for beams tested
at all a/d ratio. However, the effect of the longitudinal steel ratio on the cracking
shear strength, vc were negligible for beams tested at a/d < 2.5.

24
Russo [43] in 2005 proposed a concrete contribution to shear strength formula,
based on mechanical analysis approach by the inclusion of parametric expression for
reinforced concrete beams cast without shear reinforcement. Test data of 917 beams
from literature data were included for comparisons with the proposed formula and
the results obtained showed good correlation between the measured and predicted
values with a mean value of 1.00 and a standard deviation of 0.21. The formula is
given as:
= 1.13 ᶓ [
⁄ ] (Eqn 2.13)
Where, fyl = yield strength of longitudinal steel
ᶓ = size effect function = √
√
, where da = maximum aggregate size
Arslan G. [44] in 2007 proposed a cracking shear strength formula for NWC beams
without shear reinforcement, which is given as follow:
√ (Eqn 2.14)
However, the formula only took account into the concrete strength, whereas
other variables: (1) longitudinal steel ratio, (2) shear span to effective and (3) beam
height were omitted in Arslan’s formula. Hence, it is believed by Author that the
proposed formula is not satisfactory as influence of other variables were neglected
and test results from literature data indicated the presence of longitudinal steel ratio,
shear span to effective and beam height on the shear strength contribution of
normal weight concrete beams without shear reinforcement.

25
2.2.1.3 Concrete Plasticity Approach
In 1975, Braestrup [45] reported shear tests on rectangular reinforced concrete
beams and proposed corresponding work formulas. Using upper bound technique of
plasticity theory, he derived a general work formula based on the assumption if a
rigid region I move, for a displacement δ, in a given direction, at an angle α to the
discontinuity, relative to the rigid region II, the work dissipated in the narrow plastic
zone for concrete beam without shear reinforcement (see Figure 2.14), which is given
as:
W =P
(Eqn 2.15)
Where, σc = concrete compressive strength
δ = displacement
ϴ = angle of plane of discontinuity
The above formula was confirmed by Nielsen et. al [46] in 1978 to be exact solution
using the upper bound technique approach. However, it was found that an
agreement was only achieved between the theoretical predictions and the test
results with the modifications of the theoretical prediction by an effectiveness factor,
υ. The effectiveness factor was found that approximate average effectiveness factor,
υ was found to be 0.54 for concrete beams without shear reinforcement mainly
because concrete is not a perfectly plastic material as assumed in this approach,
where concrete is assumed to exhibit perfectly plastic behaviour and has a
compressive strength equal to the peak value on a stress strain curve. It is believed
that it is unlikely that the concrete stress would be equal to the maximum
compressive strength at all points of the failure surface as concrete is not a
homogenous material and has a very limited deformability. However, when in
tension, the concrete exhibits brittle behaviour at low stress and displays monotonic

26
strain softening behaviour at large strain. It was also reported that the value of
effectiveness factor for concrete beam without shear reinforcement were lower than
the value found for concrete beam with shear reinforcement, which was due to the
absence of shear reinforcement. Hence, this led less restraint to concrete could be
achieved.
For concrete beams without shear reinforcement, it was found that better
agreement with the tests when υ was considered to be a function of concrete
cylinder compressive strength (σc), overall section depth (h), longitudinal steel ratio
(ρ) and shear span to height ratio (a/h) as given in the following formula:
υ = f1 (σc) f2 (h) f3 (ρ) f4 (
(Eqn 2.16)
Where, f1(σc) =
√ (σc in N/mm2) (Eqn 2.16.1)
f2(h) = 0.27 (1 +
√ ) (h in m) (Eqn 2.16.2)
f3(ρ) = 0.15ρ +0.58 (ρ < 4.5%) (Eqn 2.16.3)
f4(
= 1 + 0.17 (
(
(Eqn 2.16.4)
The detail of the derivation of these effectiveness factors and the comparisons with
the test result for concrete beams without shear reinforcement could be found in
Nelsen et. al [46] in 1978. In addition to concrete beam without shear reinforcement,
he also derived a work formula and proposed an effectiveness factor for concrete
beam with shear reinforcement, which are mentioned in the following Section
2.2.2.3.

27
2.2.1.4 Building Code Approach
Many codes of practice were introduced for shear strength prediction of normal
concrete beam without shear reinforcement. Some of the well-known codes of
practice discussed here include BS8110 Code [47], Eurocode 2 Code [48], and ACI
Code [49]. However, it is noted by Author that there are variations among the codes
regarding the formulas of the shear strength prediction and the considerations of
variables affecting the shear strength of the beam. Hence, formulas of the shear
strength predictions by the various codes of practice are shown in Section 2.2.1.5.1
to Section 2.2.1.5.2 for BS8110 Code [47], Eurocode 2 Code [48], and ACI Code [49],
respectively.
2.2.1.4.1 BS8110 Code
BS8110 [47] developed a formula each for the shear capacity prediction of normal
weight concrete beam without shear reinforcement loaded with a/d ≤ 2 and a/d >2,
which are given as follow:
For a/d ≤ 2,
VRdc =
⁄
⁄
⁄
b d (Eqn 2.17)
For a/d > 2,
VRdc =
⁄
⁄
⁄
b d (Eqn 2.18)
Where, = partial factor of material = 1.15
The functions of parameters are:
f(
) = 2
(
≤ 2) (Eqn 2.19.1)

28
f(ρ) = =
(ρ < 3%) (Eqn 2.19.2)
f(fcu) =
⁄ ( fcu > 25 MPa) (Eqn 2.19.3)
f(d) = (
(d in mm) (Eqn 2.19.4)
2.2.1.4.2 Eurocode 2
For NWC beam without shear reinforcement, Eurocode 2 [48] took into account the
parameters: cylindrical concrete strength (fck), longitudinal steel ratio (ρ), effective
section depth (k) and shear span to effective depth ratio (a/d) in the shear strength
prediction for normal weight concrete beams without shear reinforcement.
The design shear resistance of a normal weight concrete beam without shear
reinforcement is predicted using the formula as follow:
For a/d ≤ 2,
VRdc = [Crd,c k (100 ρ fck)1/3 + k1 σcp] bw d (
) (Eqn 2.20)
For a/d > 2,
VRdc = [Crd,c k (100 ρ fck)1/3 + k1 σcp] bw d (Eqn 2.21)
Where, k1 = 0.15
Crd,c =
, where = partial factor of concrete
Hence, the functions of parameters are:
f(
) =
(
≤ 2) (Eqn 2.22.1)
f(ρ) = =
(ρ ≤ 0.02) (Eqn 2.22.2)
f(fck) = ( fck in MPa) (Eqn 2.22.3)
f(k) = √
(d in mm) (Eqn 2.22.4)
29
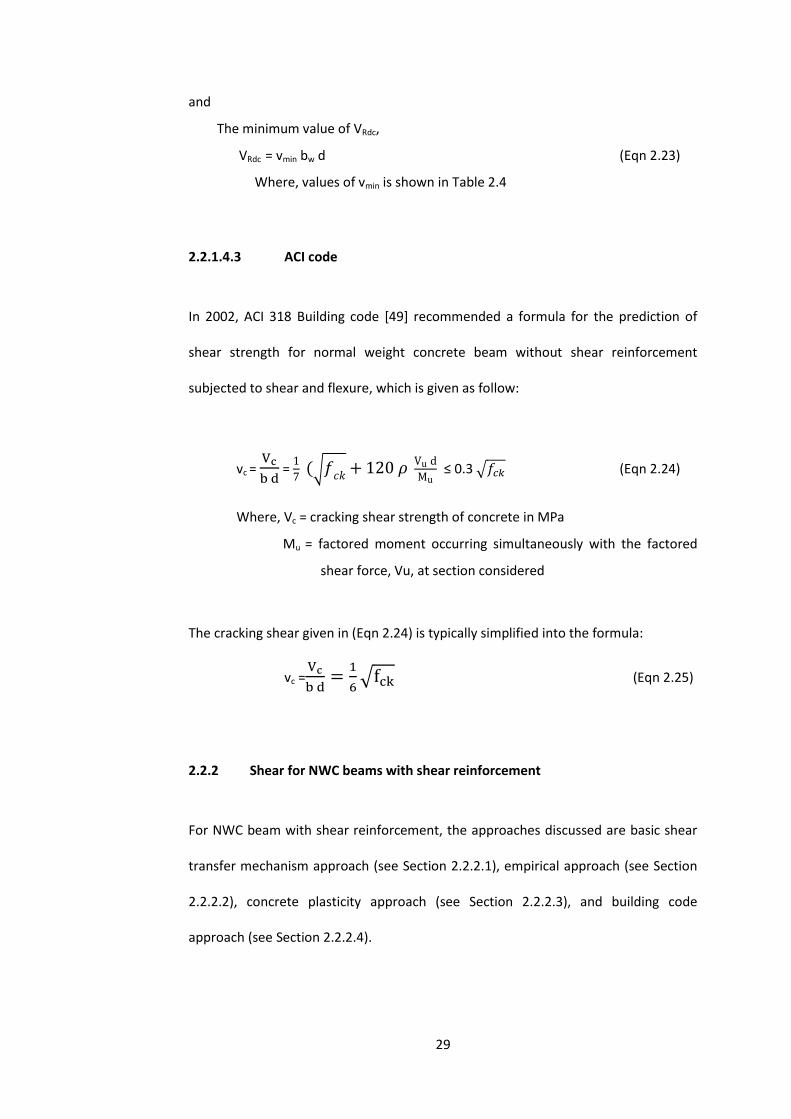
and
The minimum value of VRdc,
VRdc = vmin bw d (Eqn 2.23)
Where, values of vmin is shown in Table 2.4
2.2.1.4.3 ACI code
In 2002, ACI 318 Building code [49] recommended a formula for the prediction of
shear strength for normal weight concrete beam without shear reinforcement
subjected to shear and flexure, which is given as follow:
vc =
=
√
≤ 0.3 √ (Eqn 2.24)
Where, Vc = cracking shear strength of concrete in MPa
Mu = factored moment occurring simultaneously with the factored
shear force, Vu, at section considered
The cracking shear given in (Eqn 2.24) is typically simplified into the formula:
vc =
√ (Eqn 2.25)
2.2.2 Shear for NWC beams with shear reinforcement
For NWC beam with shear reinforcement, the approaches discussed are basic shear
transfer mechanism approach (see Section 2.2.2.1), empirical approach (see Section
2.2.2.2), concrete plasticity approach (see Section 2.2.2.3), and building code
approach (see Section 2.2.2.4).

30
2.2.2.1 Shear transfer mechanism approach
For structural concrete beam cast with shear reinforcement, Kong and Evan [27] in
1998 reported that the shear force, V is resisted by four combined shear action: the
shear in uncracked concrete compression zone (Vcz), the shear from dowel action of
the longitudinal reinforcement (Vd), the vertical component of shear force due to
aggregate interlock (Va) and the shear force carried by the shear links crossed by the
diagonal crack (Vs), (see Figure 2.15) which is given as:
V = Vc + Va + Vd + Vs (Eqn 2.26)
For concrete beam cast with shear reinforcement, the consecutive developments of
the shear transfer mechanisms are reported as:
1. During testing, the shear links would first yielded as the external shear V
increased so that the shear force carried by the shear links crossed by the
diagonal crack (Vs) remained at the yield value, and subsequently, the
increased in V were carried by the shear in uncracked concrete compression
zone (Vc), the vertical component of shear force due to aggregate interlock
(Va) and the shear from dowel action of the longitudinal reinforcement (Vd).
2. Consequently, as the applied load increased, the vertical component of shear
force due to aggregate interlock (Va) becomes less effective as the diagonal
cracks widens, which the shear in uncracked concrete compression zone (Vc),
and the shear from dowel action of the longitudinal reinforcement (Vd) were
forced to increase rapidly.
3. Ultimately, as the applied load was further increased, the shear failure of the
beam occurred either by dowel splitting of the concrete along the

31
longitudinal reinforcement or by crushing of the concrete compression zone
resulting from the combined shear direct stresses.
Kong and Evan reported that the variables, which influenced the shear strength of
normal weight concrete beam without shear reinforcement, would have also
contributed to the shear strength of normal weight concrete beam with shear
reinforcement. It was stated that the function of shear reinforcement is to resist the
diagonal shear failure occurred between point load and support. Hence, the shear
resistances of the beam are considerably increased by the increment of shear
reinforcement, which increased the ductility of the beam and significantly decreased
the possibility of a sudden and catastrophic failure that commonly occurred in
concrete beams without shear reinforcement.
2.2.2.2 Empirical Approach
In 1945, Moretto [24] in 1945, reported on the tested beams with welded shear
reinforcement, which include studies on the systematically effect of the inclination of
shear reinforcement on the shear strength and the investigations of the variables:
concrete strength, longitudinal steel ratio, shear reinforcement ratio, and the
inclination of the shear reinforcement. He proposed two empirical shearing stress
formulas, which are given as follow:
For the load at which the web reinforcement was stressed to the yield point,
Vu = ( + 5000 ρ ) b j d (Eqn 2.27)
For ultimate failure load,
Vu = ( + 5000 ρ) b j d (Eqn 2.28)
Where, fck = cylindrical compressive strength (psi)
fy = yield strength of shear reinforcement (psi)

32
r =
= shear reinforcement ratio, where s = shear
reinforcement
spacing
K = (sin α + cos α) sin α, where α = angle between the inclined
Shear reinforcement and
axis of the beam
It is observed by Author that given two formulas (Eqn 2.27and Eqn 2.28) by Moretto
[24] provided minimal contributions by the concrete on the shear strength
predictions of normal weight concrete beams with shear reinforcement.
Clark in 1951 [25] reported investigations on the normal weight concrete beams with
shear reinforcement, which are noteworthy not only because he introduced an
expression for that shear span to effective depth ratio, a/d, but another three
variables: cylindrical compressive strength, the shear reinforcement ratio, and the
longitudinal steel ratio reported by Moretto [24], which affects the shear strength of
both concrete beams cast without shear reinforcement and with shear
reinforcement, were recognized. It was reported that shear strength of the concrete
beams increased with the reduction of shear span to effective depth ratio. Clark’s
empirical formula was derived from both tests results obtained from investigations
and the tested beams, which was proposed for beams failed in diagonal tension
failure. The cracking shear stress formula, which aid to express Talbot’s philosophies
for the variable of shear span to effective depth ratio [18], consist of a mathematical
term for the nominal shear strength prediction of four variables: (1) the cylindrical
compressive strength, (2) the shear span to effective depth ratio, (3) the shear
reinforcement ratio and (4) the longitudinal steel ratio. The cracking shear stress
formula is given as follow:

33
vc =
+ 2500 √ (Eqn 2.29)
Where,
fck = cylindrical compressive strength (psi)
r =
= shear reinforcement ratio, where s = shear
reinforcement
spacing
It was reported that Eqn 2.29 is only applicable for the shear strength predictions of
beams failed in diagonal tension.
Apart for normal weight concrete beams without shear reinforcement, Taub et.al
[50] in 1960 reported the shear failure of the concrete beam based upon
redistribution of internal stresses introduced by Moody et. al [28 & 29] and the effect
of variables considered which consist of types of shear failure and the influence of
a/d ratio, shape and proportions of beam, percentage area of main tension and
compression reinforcement, size of tension bars, cylindrical concrete strength and
arrangement of loading and the magnitude of the bending moment and shearing
force applied on the shear strength of normal weight concrete beams with shear
reinforcement. The free body diagram after widening of the diagonal cracks for
normal weight concrete beams with shear reinforcement (see figure 2.16) were
discussed, which it was reported that with the increment of applied load, the stress
in the shear reinforcement increased until the shear reinforcement yielded and
subsequently, no further increment of load were resisted by shear reinforcement
although the strain continued to increase. With that, the role of shear reinforcement
ended and the consecutive redistribution of internal forces of normal weight
concrete beams with shear reinforcement are similar to those without shear
reinforcement, which are mentioned in Section 2.2.1.2.

34
For NWC beams with shear reinforcement, he reported three types of shear failure
exist, which was also similar to those found for normal weight concrete beams
without shear reinforcement. However, the difference is that the failure of normal
weight concrete beams with shear reinforcement occurred at higher load compared
to normal weight concrete beams without shear reinforcement. The three types of
shear failure are by:
1. Crushing of the concrete at the top of the diagonal tension crack.
2. The destruction of the tension zone between the lower end of the diagonal
tension crack and the beam support.
3. The opening of a flat-slope crack up to the top surface of the beam.
For normal weight concrete beam with shear reinforcement, Taub et. al [50]
concluded that:
1. Full protection from shear failure would not be provided by the presence of
shear reinforcement if the required minimum shear reinforcement is not
sufficient.
2. The shear capacity of the shear reinforced normal weight concrete beams
increased with the reduction of shear span to effective depth ratio (a/d) based
on the results
3. The shear capacity of shear reinforced normal weight concrete beams increased
with the increment of cylindrical concrete strength of the beam based on the
results.
4. The shear reinforced normal weight concrete beams were not influenced by
compression reinforcement based on the findings by the University of
Manchester.

35
Bresler and Scordelis [51] in 1963 reported the results of nine normal weight
concrete beams with shear reinforcement casted with different concrete strength
and shear reinforcement ratio. The beams were tested at 4 ≤ a/d ≤ 7 under
concentrated loading and it was noted that small amount of shear reinforcement
ratio provided increased the shear strength of the beams. The proposed shear
strength formula for normal weight concrete beam with shear reinforcement is given
as follow:
√ (
) (Eqn 2.30)
or
√ (Eqn 2.31)
Where, percentage of web reinforcement
= yield point stress of the shear reinforcement steel (psi)
fck = cylindrical concrete strength (psi)
M = bending moment at a section
It is observed by Author from Figure 2.17 that the proposed Eqn 2.30 and Eqn 2.31
achieved good agreements between the proposed formulas and the test results by
researchers.
Apart from the two nominal shear strength formulas proposed for normal weight
concrete beam without shear reinforcement mentioned in Section 2.2.1.2, Krefeld
and Thurston 1966 [34] also reported the investigations of 44 concrete beams
specimens casted with shear reinforcement: (i) 37 beam specimens subjected to
concentrated load and (ii) 7 beam specimens subjected to uniform loads. The
variables considered were concrete strength, steel ratio, span length and shear
reinforcement ratio. It was noted that the additional shear reinforcement provided
delayed the horizontal cracking along the bars and the failure by increasing the dowel

36
resistance. It was reported that the contributions by the shear reinforcement are the
most effective when positioned in the vicinity of the critical section, which is at the
shear span section. Krefeld and Thurston presented predictions for normal weight
concrete beams with shear reinforcement based on the test results of beams with
shear reinforcement, which was obtained from the investigations and literature data
(see Figure 2.18). The shear strength of a normal weight concrete beam with shear
reinforcement is predicted using the formula as follow:
(Eqn 2.32)
- 45 (Eqn 2.33)
90 (Eqn 2.34)
Where, percentage of web reinforcement
= yield point stress of the shear reinforcement steel
It was observed by Author that good agreements were achieved between the above
ultimate shear strength predictions and the test results obtained with a mean of 0.99
and standard deviation of 0.10.
Apart from NWC beams without shear reinforcement, Zsutty [34] in 1971 also
presented a formula for NWC beams with shear reinforcement using dimensional
analysis and statistical regression analysis with approximately 200 beams test data
from different sources, which beam behaviour were separated into arch action of
short beams and the beam actions of slender beams. The variables considered for
normal weight beams cast with shear reinforcement were the (1) cylinder concrete
strength, (2) the longitudinal steel ratio and (3) the shear span to effective depth
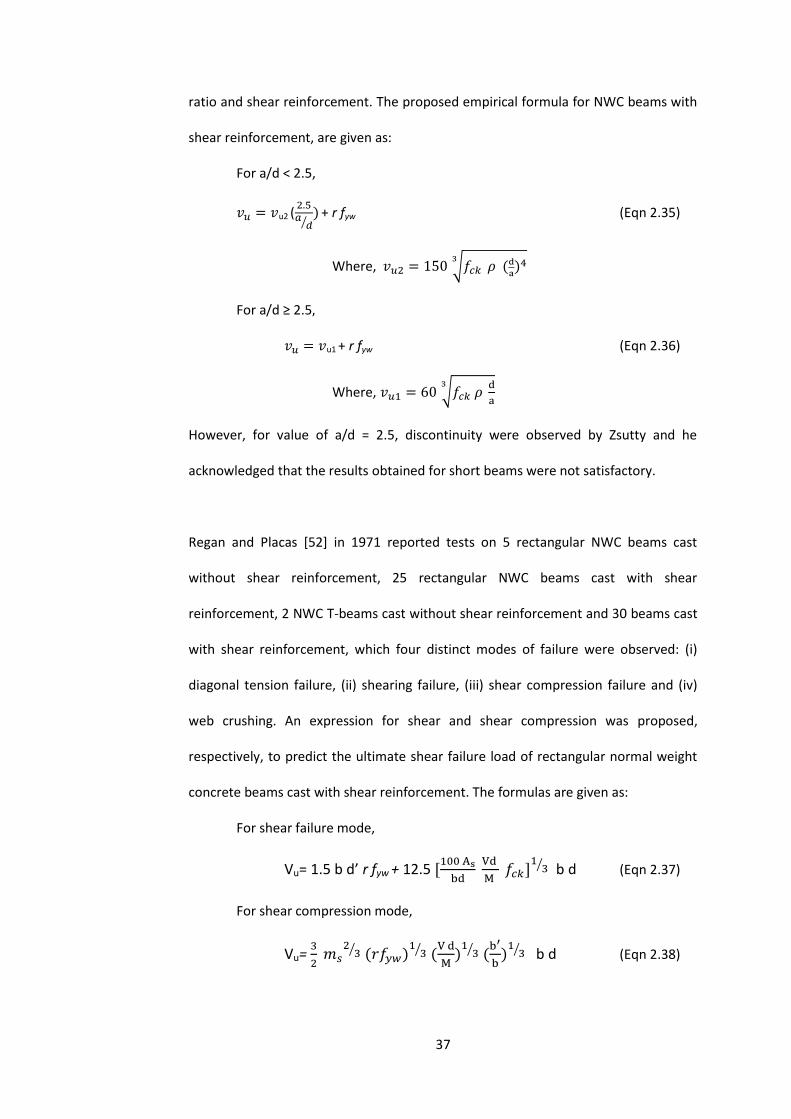
37
ratio and shear reinforcement. The proposed empirical formula for NWC beams with
shear reinforcement, are given as:
For a/d < 2.5,
u2 (
⁄ + r fyw (Eqn 2.35)
Where, √
For a/d ≥ 2.5
u1 + r fyw (Eqn 2.36)
Where, √
However, for value of a/d = 2.5, discontinuity were observed by Zsutty and he
acknowledged that the results obtained for short beams were not satisfactory.
Regan and Placas [52] in 1971 reported tests on 5 rectangular NWC beams cast
without shear reinforcement, 25 rectangular NWC beams cast with shear
reinforcement, 2 NWC T-beams cast without shear reinforcement and 30 beams cast
with shear reinforcement, which four distinct modes of failure were observed: (i)
diagonal tension failure, (ii) shearing failure, (iii) shear compression failure and (iv)
web crushing. An expression for shear and shear compression was proposed,
respectively, to predict the ultimate shear failure load of rectangular normal weight
concrete beams cast with shear reinforcement. The formulas are given as:
For shear failure mode,
Vu= 1.5 b d’ r fyw + 12.5
⁄ b d (Eqn 2.37)
For shear compression mode,
Vu=
⁄
⁄
⁄
⁄ b d (Eqn 2.38)

38
Where, d’ = depth from compressed surface to lowest layer of main steel
=
= yield point stress of the shear reinforcement steel (psi)
fck = cylindrical concrete strength (psi)
M = bending moment at a section
ms = 27
⁄
Using Eqn 2.37 and 2.38, a very satisfactory agreement was achieved with the test
results, which for rectangular concrete beams with shear reinforcement; a mean
value of 0.91 for VPrediction/VTest and standard deviation of 0.058 were obtained whilst
for concrete T-beams with shear reinforcement; a mean of mean of 0.91 for
VPrediction/VTest and standard deviation of 0.007 were obtained.
Apart from the two nominal shear strength formulas proposed for normal weight
concrete beam without shear reinforcement mentioned in Section 2.2.1.2, Arslan
[53] in 2007 proposed two nominal shear strength formulas for normal weight
concrete beams with shear reinforcement, which were categorized into short beams
(for a/d ≤ 2.5) and slender beams (for a/d > 2.5). The proposed formulas are as
follow:
For slender beams, a/d >2.5:
Vn= (0.15 fck½ + 0.02 fck
0.65) + ρw fyw (Eqn 2.39)
For short beams, a/d ≤ 2.5:
Vn= (0.15 fck½ + 0.02 fck
0.65) (
⁄)) + ρw fyw (Eqn 2.40)
Where, ρw fyw = nominal shear strength of shear reinforcement in MPa

39
Arslan [53] achieved good agreement with the test results, which for normal weight
concrete beams with shear reinforcement tested at a/d > 2.55, a mean of 1.34 for
PExp/PProp and a standard deviation of 0.31 were obtained, compared to ACI 318
Building Code Provisions, which achieved a mean of 1.41 for PExp/PACI318 and a
standard deviation of 0.33. For normal weight concrete beams with shear
reinforcement tested at a/d ≤ 2.5, a mean of 1.47 for PExp/PProp and a standard
deviation of 0.22 were achieved compared to ACI 318 Building Code Provisions,
which achieved a mean of 1.84 for PExp/PACI318 and a standard deviation of 0.39.
However, it was noted the ratio of experimental to predicted shear strength was not
significantly influenced with increasing a/d, ρw fyw and fck.
2.2.2.3 Concrete Plasticity Approach
As mentioned in Section 2.2.1.3, Braestrup [44] in 1975 reported shear tests on
rectangular reinforced concrete beams and proposed corresponding work formulas.
He derived a general work formula (Eqn 2.40) using upper bound theorem, based on
the assumption if a rigid region I move, for a displacement δ, in a given direction, at
an angle α to the discontinuity, relative to the rigid region II, the work dissipated in
the narrow plastic zone for concrete with shear reinforcement are shown in Figure
2.19.
Upon simplification, for a concrete beam with shear reinforcement, the work
required to shear the concrete beam is given as:
W =Pδ = δ σf b h cot ϴ +
(Eqn 2.41)
Where, σc = concrete compressive strength
α = angle of movement to plane of discontinuity
= ratio of shear reinforcement

40
δ = displacement
ϴ = angle of plane of discontinuity
σf = yield strength of reinforcement
The above formulas were confirmed by Nielsen et.al [45] in 1978 to be an exact
solution using the lower bound technique approach. However, it was found that an
agreement between the theoretical predictions and test results was achieved only if
the theoretical prediction was modified by an effectiveness factor, υ. The
effectiveness factor, υ was found to be 0.74 for concrete beams with shear
reinforcement mainly because concrete is not a perfectly plastic material as assumed
in this approach, where concrete is assumed to exhibit perfectly plastic behaviour
and has a compressive strength equal to the peak value on a stress strain curve. It is
believed that it is unlikely that the concrete stress would be equal to the maximum
compressive strength at all points of the failure surface as concrete is not a
homogenous material and has a very limited deformability. However, when in
tension, the concrete exhibits brittle behaviour at low stress and displays monotonic
strain softening behaviour at large strain. Hence, it is important to compute the
effectiveness of the concrete compressive strength at failure using the effectiveness
factor.
For concrete beams with shear reinforcement, it was found that better agreement
with the tests when the effectiveness factor, υ was considered to be a function of
concrete cylinder compressive strength, σc, as given in the following formula:
υ = 0.8 -
(Eqn 2.42)
The details of the effectiveness factor derivation and the comparison with the test
results is presented by Neilsen [45] in 1978.

41
2.2.2.4 Building Code Approach
In addition to the shear strength prediction of normal weight concrete beams
without shear reinforcement, codes of practice: BS8110 Code [47], Eurocode 2 Code
[48], and ACI Code [49] also presented the shear strength prediction of normal
weight concrete beams with shear reinforcement. However, it is noted by Author
that there are variations among the codes regarding the formula of shear strength
prediction and the considerations of variables affecting the shear strength of the
structural beam elements. Hence, the formula for shear strength predictions of
normal weight concrete with shear reinforcement are discussed in Section 2.2.2.4.1
to Section 2.2.2.4.3 for BS8110 Code [47], Eurocode 2 Code [48], and ACI Code [49],
respectively.
2.2.2.4.1 BS8110 Code
In 1997, BS8110 design code [47] recommended two formulas for the prediction of
shear capacity of concrete beam with shear reinforcement, which derived from two
components, concrete and shear reinforcement as given as follow:
Vn = Vs + Vc (Eqn 2.43)
Where, Vc = cracking shear strength of concrete in MPa
Vs = shear strength of shear reinforcement based on yield
The two formulas for the shear strength prediction of a normal weight concrete
beam with shear reinforcement are for
and a/d >2, respectively. The formulas
are given as follow:
For

42
VBS8110-S = [
⁄
⁄
⁄
(Eqn 2.44)
For
VBS8110-S = [
⁄
⁄
⁄
] b d (Eqn 2.45)
From Eqn 2.45, the influence of parameters is:
f(
(Eqn 2.46.1)
f(fcu) =
⁄
(fcu > 25MPa) (Eqn 2.46.2)
f(
) =
( a/d ≤ 2) (Eqn 2.46.3)
2.2.2.4.2 Eurocode 2
The shear strength of normal weight concrete beams with shear reinforcement in
Eurocode 2 [48] were formed based on the variable strut inclination method to
determine the shear capacity of reinforced concrete beams with shear
reinforcement.
The design shear resistances of normal weight concrete beam with shear
reinforcement are given by Eurocode 2 are given as follow:
Vn = Vrd,s + Vccd + Vtd (Eqn 2.47)
Where, Vrd,s, = design value of the shear force which can be sustained by the
yielding shear reinforcement
Vccd = Design value of the shear component of the fore in the
compression area, in the case of an inclined compression chord
Vtd = Design value of the shear component of the force in the tensile
reinforcement, in the case of an inclined tensile chord

43
The design value of the shear force which can be sustained by the yielding shear
reinforcement, Vrd,s, for a shear strength prediction of a beam with shear
reinforcement is given as the smaller amount of:
Vrd,s, =
z (Eqn 2.48)
and
Vrd,max =
(Eqn 2.49)
Where, v1 = 0.6 (1-
for fck ≤ 60 MPa = strength reduction factor
for concrete cracked in shear
αcw = coefficient taking account the state of the stress in the
compression chord
fcd = αcc
where αcc = 1 and ϒc = 1 for the OPSC shear
strength predictions.
= the angle between the concrete compression strut and
the beam axis perpendicular to the shear force
From Eqn 2.47, the influence of parameters is:
f(ϴ) = cot ϴ (Eqn 2.50.1)
f(
(Eqn 2.50.2)
From Eqn 2.48, the influence of parameters is:
f(v1) = v1 = 0.6 (1-
(Eqn 2.50.3)
The inclination angle of shear cracks, ϴ given in the prediction of shear strength for
normal weight concrete beam with shear reinforcement by Eurocode 2, are not fixed
as 45 degree but it was limited to the angle between 22 degree to 45 degree, as
given in the Eurocode 2.

44
2.2.2.4.3 ACI code
In 2002, ACI 318 Building code [49] recommended 2 formulas for the prediction of
shear capacity of concrete beam with shear reinforcement, which derived from two
components, concrete and shear reinforcement based on experimental results of
beam test data and given as:
Vn = Vs + Vc (Eqn 2.51)
Where, Vc = cracking shear strength of concrete in MPa
Vs = shear strength of shear reinforcement based on yield
The contribution of Vs is derived from basic equilibrium considerations on a 45
degree truss model with constant effective depth and shear reinforcement spacing.
A formula was given each for short beams (beams tested a/d < 2.5) and for slender
beams (beams tested at a/d ≥ 2.5), respectively, which are further defined as:
For short beams, a/d < 2.5,
Vn = (3.5 – 2.5 a/d)
√ + ρs fyw (Eqn 2.52)
For slender beams, a/d ≥ 2.5,
Vn =
√ + ρs fyw (Eqn 2.53)
Where, = design yield strength of the shear reinforcement
= cylinder concrete strength (psi)

45
2.3 Size effect
2.3.1 Beams without shear reinforcement
It was reported by researches [54-60] that size effect occurs in normal weight
concrete beams, which shear capacity decreases with the size of specimen. Hence,
the shear capacity of a concrete beam is affected by the specimen size.
Kani [54] in 1967 presented a series of tests on large beams, in which the beam
depth was tested between 150 mm to 1220 mm whilst the width was held constant
at 150 mm with longitudinal steel ratio of 2.8%. The variables considered were
absolute size and depth to width ratio, which it was observed that the strength of the
large beam reduced approximately 40 % of the strength that were expected from the
test results on the small beams.
Taylor [55] in 1972 reported the investigations of size effect in beams, which a series
of tested beams with varying depth from 150 mm to 1000 mm whilst the width were
held constant at 40 mm with longitudinal steel ratio casted at 1.35%. Taylor observed
that from the tests from Kani [54] and Leondhart et.al [56], increment of beam size
with particle size kept constant results in a decreased of the total shear capacity,
which occurred due to the reduction in aggregate interlock contribution. Further, it
was reported that the contradict results obtained between Kani [54] and Leondhart
et.al [56] were because of the difference in the depth to width ratios considered for
each beams and also the aggregate size was not scaled. Hence, a series of tests were
carried out and reported to investigate the effect of maximum aggregate sizes on the
beams with varying depth from 150 mm to 1000 mm, which slight reductions in the
shear strength capacity of large beams occurred, when compared with the relative

46
strength of small beams. Further, the tests also showed the effect of aggregate
scaling with respect to beam depth, which it was found that scaling of aggregate
correctly would not cause a loss of strength (see Figure 2.20).
It is observed by Author from Taylor’s [55] report that cracks with respect to the
beams by Kani [54], Taylor [55] and Leondhart et.al [56] increased with the depth
increment (see Figure 2.21) from Kani, Figure 2.22 and 2.23 from Leondhart, and
Figure 2.24 from Taylor, which indicate that loss of interlocking strength are more
significant in larger beams.
Bazant and Kim [57] in 1984 presented a statistical analysis of normal weight
concrete beams without shear reinforcement using data based on nonlinear fracture
mechanics approach to represent the size effect in concrete beams. It was noted that
nonlinear fracture mechanics approach predicts the test results more accurately than
linear fracture mechanics approach as concrete exhibited brittle characteristics in
failure (see Figure 2.25). According to Bazant and Kim, size effect in structure
occurred due to the release of strain energy from the beam into the cracking zone as
the cracking zone lengthens and hence, the increment size of the structure would
lead to higher energy released. A cracking shear capacity (Eqn 2.54) were presented
by Bazant and Kim to represent the size effect for diagonal shear failure of concrete
beams element with longitudinal reinforcement without shear reinforcement, which
it is believed that the energy loss due to cracking is a function of both fracture length
and of cracking zone area assumed to have a constant width at its front, proportional
to the maximum aggregate size. The cracking shear stress of concrete beams without
shear reinforcement is predicted as follow:
vc =
⁄ (Eqn 2.54)

47
Where, = maximum aggregate size
= empirical constants
= material parameter given
The variable formula, in Eqn (2.54) is given as:
=
(√ √
⁄ ) (Eqn 2.55)
Where,
= cylindrical compressive strength in psi
In addition, an ultimate shear capacity formula was derived from the analysis and
summations of arch action for short beam and the composite beam action for
slender beam were proposed, which considered the variables: cylinder concrete
strength, steel ratio, shear span to effective depth ratio, effective depth and
maximum aggregate size. It was reported that Bazant’s law size effect law showed
good agreement with 297 test results available with respect to the increase of
reinforced concrete depth. (see Figure 2.26)
The proposed formula is given as:
√
√
√ √
) (Eqn 2.56)
Where, = maximum aggregate size
α = a/d for concentrated load and α = l/4d for uniform load
= cylindrical concrete strength in psi
In 1987, Bazant and Sun [58] generalized the proposed existing formula (Eqn 2.54),
which took account into the effect of maximum aggregate size, which the proposed
cracking shear strength prediction for concrete beams without shear reinforcement
is given as:

48
vc = (
√
√
(Eqn 2.57)
Where, c0 = 0.2 inch
= 25
= maximum aggregate size
It was reported that good agreements were achieved between the new generalized
proposed formulas (Eqn 2.57) with 461 literature data (see Figure 2.27).
Apart from NWC beams without shear reinforcement, Bazant and Sun [58] also
presented a formula for NWC beams with shear reinforcement, which are mentioned
in Section 2.3.2.
Walvaren and Lehwalter in 1994 [59] reported that size effect occurred in both
normal weight concrete and lightweight concrete beams, which comparisons were
carried out between normal weight concrete (NWC) and light weight concrete (LWC)
beams without shear reinforcement of shear span to effective depth ratio, a/d = 3
with respect to variations of depth. It was reported that the ultimate shear capacity
obtained by the NWC beams were slightly higher than the LWC beams, which would
have due to the difference in aggregate interlocking capacity provided (see Figure
2.28). In Author opinion, NWC beams would have exhibited higher shear capacity due
to the higher impact strength provided by the gravel aggregates compared to
lightweight aggregates.
Walvaren and Lehwalter [59] also presented the investigations on the size effect of
normal weight concrete beams tested with respect to the variables: beam depth,
aggregate size, and shear span to effective depth ratio. It was reported that

49
significant size effect occurred in normal weight concrete beams without shear
reinforcement, which were tested at a/d <2.5 (see Figure 2.29). It was noted by
Walvaren and Lehwalter [59] that the size effect observed in short and slender
beams, of normal weight concrete and lightweight concrete, for effective depths
between 150 mm and 1000mm, can be formulated with the Bazant’s size effect law.
Walvaren and Lehwalter [59] also noted that smaller size beams exhibited smaller
crack widths compared to larger beams, which is believed were due to the
substantial amount of tensile stresses transmitted over the crack faces during
loading. From Author observations, the amount of cracks exhibited by the beam
increased with the increment of beam depth for both short and slender beams tested
by Walvaren and Lehwalter (see Figure 2.30 and 2.31).
2.3.2 Beams with shear reinforcement
For concrete beams with shear reinforcement, Bazant and Sun [58] in 1987 proposed
an ultimate shear stress formula (Eqn 2.58), which consists of combination of
cracking shear stress capacity, vc and contribution of yield forces in shear
reinforcement, vs. The proposed formula is given as follow:
(Eqn 2.58)
The contribution of yield forces in shear reinforcement, vs from Eqn 2.58 was
obtained from plastic limit analysis, which is given as follow:
vs =
(Eqn 2.59)
Where, α = angle between the shear reinforcement and the longitudinal axis
of the beam

50
fyv = yield strength of reinforcement (psi)
It was reported by Bazant and Sun [58] that good agreement were obtained between
the new generalized proposed formula (Eqn 2.58) with 87 test results (see Figure
2.32). However, Bazant and Kazemi in 1991 [60] reported that the scatter of the test
results were too large and hence, another formula for the ultimate shear stress of
concrete failed in diagonal shear failure were proposed (see Eqn 2.60), which
incorporated cracking shear stress formula given by ACI 318 design code with his size
effect law. The proposed formula is given as:
vu = B vc ( (Eqn 2.60)
Where, vc = ( √
√ )
B = size effect variable (see Ref [55])
=
It was reported by Bazant and Kazemi [60] that good agreements with the series with
different size range variation of 1:16, 2: 16 and 2: 8 were achieved between the new
proposed formula (Eqn 2.60) and the experimental results conducted.
In addition to normal weight concrete beams with shear reinforcement, Walvaren
and Lehwalter in 1994 [59] also presented the investigations on the size effect of
normal weight concrete beams with shear reinforcement tested at a/d < 2.5. It was
noted by Walvaren and Lehwalter [59] that the significant size effect also observed in
normal weight concrete beams with shear reinforcement tested at a/d < 2.5 (see
Figure 2.33).

51
2.4 Oil Palm kernel Shell Concrete (OPSC)
Since the introduction of OPS aggregates as coarse aggregates in concrete, extensive
amount of research has been carried out in search of the Oil Palm kernel Shell
Concrete (OPSC) properties. The core materials to cast OPSC consists of ordinary
Portland cement, sand as fine aggregate, Oil Palm kernel shell (OPS) as coarse
aggregate and water. Optional material such as admixtures and cementitious
materials were added into the OPSC mix to achieve higher compressive strength and
workability.
Researchers [1-16] found that OPSC have low bulk densities of 1600 kg/m3 to 1960
kg/m3. Consequently, OPSC is categorized as structural lightweight aggregate, which
satisfies the range specified by ASTM C330 [63]. Teo et.al [13] suggested the
lightweight density of OPSC results in the reduction of the overall dead load in
structures, which in turn significantly reduced the total cost in construction and also
reduced the catastrophic impact caused by earthquake in earthquake prone
countries.
2.4.1 Properties of Oil Palm Shell (OPS) aggregate
In this research, the types of coarse aggregate used were Oil Palm kernel Shell (OPS)
aggregate and crushed granite aggregate. As the material properties of both types of
aggregate differ, it would affect the material and structural properties of the
concrete produced. Therefore, it is crucial to understand the properties of aggregate
prior to mixing.

52
The physical and mechanical properties of OPS aggregate and crushed granite
aggregate obtained from different researchers in the field of OPSC are shown in
Table 2.1. It is noted that OPS aggregate is porous in nature, which results in low bulk
density and high water absorption. Teo [5] suggested that aggregate with high water
absorption is less sensitive to poor curing due to the internal water supply stored by
the porous lightweight aggregate. Teo et.al [5] also stated that low aggregate
abrasion value and aggregate impact obtained indicate that OPS aggregate is good
absorbance to shock.
2.4.2 Oil Palm kernel Shell Concrete (OPSC) mix design
Mannan [3] and Teo et. al [4 & 5] reported that the normal mix design method
suggested by Short and Kinniburgh [61] for lightweight concrete is not applicable to
obtain the targeted OPSC strength because the properties of OPS aggregate differed
with other existing lightweight concrete. Hence, it is suggested that trial mixes should
be adopted to obtain the targeted OPSC strength. With these, contributions by
Okpala [1], Basri [2], Mannan [3, 7-10], Teo [4 & 5] and Alengaram [11 & 16] on the
mix design of OPSC are noteworthy.
In 1990, Okpala [1] proposed 2 mix proportion for OPSC without addition of
admixtures, which were 1:1:2 and 1:2:4 in term of volume of cement: river sand: OPS
aggregate (C: S: OPS) with water/cement (w/c) ratio in range of 0.5 to 0.8. The
highest cube compressive strength achieved at 28 days was 18.9 N/mm2 of mix ratio
1:2:4 (C: S: OPS) of w/c = 0.5. The OPSC has a higher noise absorption capacity and a
low thermal conductivity compared to NWC.

53
In 1999, Basri et.al [2] presented the compressive strength of OPSC under 3 curing
conditions of water cured, air cured and partial water and air cured over 56 days
period and the influence of fly ash as a cement replacement admixture on OPSC
strength, which the highest OPSC compressive strength obtained at 28 days was
water cured with 23 N/mm2 by mix design of 1: 1.71: 0.77 (Cement: Sand: SSD OPS)
and w/c ratio =0.41. The results showed that the addition of fly ash as cement
replacement admixture had a negative effect on the OPSC compressive strength. He
also suggested that as OPS aggregate is hard and organic, it will not contaminate or
leach to produce toxic substances once bound in concrete matrix.
Mannan et.al [3, 7-10] proposed a mix proportion of 1: 1.71: 0.77 (Cement: Sand: SSD
OPS) by weight with w/c ratio of 0.41 and addition of admixtures, FDN
superplasticizer or sikament NN. The highest cube compressive strength obtained at
28 days was 24.2 N/mm2. M.A.Mannan [3] reported that the addition of fly ash as
cement replacement into the OPSC mix results in the reduction of OPSC cube
compressive strength as reported by H.B.Basri [2]. Distinctly, the addition of calcium
chloride of 1% in the OPSC mix managed to increase the OPSC cube compressive
strength to 29.4 N/mm2.
Mannan et.al [7] reported the long term strength of OPSC, which the results obtained
show that OPSC strength continue to increase with time as no retrogression in
strength present even after 365 days. However, it was reported by Mannan that the
increment of rate in OPSC compressive strength is lower than NWC for 365 days
curing period.

54
Teo et.al [4 & 5] proposed a mix proportion for OPSC, which the most suitable mix
proportion were found to be 1: 1.66: 0.6 and 1: 2.14: 1.63 by weight and volume
respectively, with a w/c ratio of 0.41. Additional admixture, Type F-naphthalene
sulphonate superplasticizer (SP) was added into the OPSC mix to improve the
workability of the OPSC mix and The OPSC cube compressive strength recorded at 28
days was 28 N/mm2.
Teo et.al [4] presented a comparison between OPSC and NWC using the proposed
mix proportion of 1: 2.14: 1.60 by volume with a w/c ratio of 0.38 and additional
admixture, Type F-naphthalene sulphonate superplasticizer (SP) was added into the
OPSC mix. The tests conducted on both concrete include compressive strength, split
tensile strength, modulus rupture and modulus of elasticity. The results obtained at
28 days shown that the values obtained for compressive strength, split tensile
strength, modulus rupture and modulus of elasticity by OPSC were approximately
0.52, 0.38, 0.58 and 0.27 times lower respectively compared to NWC.
Teo [5] reported on the bond behaviour and durability performance of the OPSC,
which the bond test results reported that for plain bars, the bond strength obtained
was 10 to 24 % of the cube compressive strength whilst for deformed bars, the bond
strength obtained was 24 to 42 % of the cube compressive strength. It was reported
that the bond strength of OPSC obtained was much higher than the theoretical bond
strength predicted by BS8110.
The durability performance of OPSC was measured by water permeability and water
absorption test. The results reported show that relatively high water content of 4.8%
to 5.5% was observed for OPSC. Observations by Teo [5] also show that OPSC has a

55
high water absorption compared to NWC due to the porous nature of OPS aggregate.
Teo [5] stated that the lightweight concrete with porous aggregate (high water
absorption) are less sensitive to poor curing as compared to normal weight concrete
due to the internal water supply stored by the porous lightweight aggregate.
Alengram and Jumaat [11, 14 -16] adapted OPSC mix proportion of 1:1.2:0.8 by
weight with the w/c ratio of 0.35. Additional admixture and cementitious material
added were 10 % silica fume, 5% fly ash and 1% superplasticizer. The OPSC
compressive strength achieved was 36 N/mm2.
The mix designs adopted by various researchers stated above are summarized by
Alengram [6], which are also shown in Table 2.2 [6].
2.4.3 Flexural strength of OPSC
The flexural strength of OPSC achieved by various researchers was summarized by
Alengram [6], which are also shown in Table 2.3. The flexural strength of OPSC
without additional admixtures are found to be 10% to 13% of the OPSC compressive
strength, in which from Okpala reported 13 %, Teo and Liew reported 11% and
Mahmud et al. reported 10% [6].
2.5 Shear strength of Oil Palm kernel Shell Concrete (OPSC) beams
In addition to the shear strength of NWC beams without shear reinforcement, the
shear strength of Oil Palm kernel Shell Concrete (OPSC) beams reported by
researchers were also reviewed to form the current understanding on the research

56
development of OPSC as structural beam elements, which were reported by Jumaat
et.al [15] and Alengaram et.al [16]. Both researches reported on the comparison
between OPSC beams and NWC beams of the shear strength obtained from their
investigations.
2.5.1 Shear strength of Oil Palm Shell Foamed Concrete (OPSFC) beams
Jumaat et.al [15] in 2009 presented an experimental study carried out to compare
the shear strength of Oil Palm Shell foamed Concrete (OPSFC) beams and normal
weight concrete (NWC) beams casted from concrete having cube compressive
strength, fcu= 20 N/mm2. In this study, a total of eight beam specimens were tested,
of which, four cast without shear reinforcement, while the remaining four cast with
shear reinforcement. Among these four beam specimens, two of each were OPSFC
beams, while the remaining two were NWC beams.
From these investigations, it was found that, in the case of beam cast without shear
reinforcement, the shear strength of OPSFC beam specimens out-perform those of
NWC beam specimens by 10 %. For shear reinforced beam, the shear strength
obtained for both specimens are almost similar. Based on the experimental
observations, it was reported, in comparison to NWC beam specimens, the OPSFC
beam specimens exhibited profound “zig zag” shear cracks on both sides surface of
the beam specimens. Upon further investigations, he found the OPSFC beam
specimens exhibited rougher shear failure surface in comparison to those of NWC
beam specimens. Therefore, it was suggested that the convex nature of oil palm
kernel shell (OPSC) contributed good aggregate interlocking, and hence, a higher
shear resistance was mobilised. Further, it was suggested that the convex portion of

57
the oil palm kernel shell (OPS) allowed for good bonding with the cement mortar,
and hence, provided a higher resistance against bonding failure between OPS and
cement mortar, if otherwise, would have led to a lower shear resistance.
2.5.2 Shear behaviour of reinforced palm kernel shell concrete beams
Alengaram et.al [16] in 2011 reported the shear behaviour of reinforced palm kernel
shell concrete beams and comparisons were carried out between OPSC beams and
NWC beams of cube concrete compressive strength of 30 N/mm2 with respect to the
shear behaviour. In this study, a total of eight beam specimens were tested, of which,
four cast without shear reinforcement, while the remaining four cast with shear
reinforcement. Among these four beam specimens, two of each were OPSC beams,
while the remaining two were NWC beams.
From the investigation, it was concluded that the ultimate shear strength to density
ratios obtained for non-shear and shear reinforced OPSC beams were 22% and 49%
higher than the NWC beams respectively. He further reported that the shear strength
ratios between the experiment and prediction by the BS8110, ACI and EC2 code of
practice were in the range of 1.57 to 2.83. Hence, it was concluded that all the three
codes underestimate the actual shear strength of non-shear and shear reinforced
OPSC and NWC beams.
It was mentioned that good aggregate interlocking suggested by Jumaat et. al [15]
and enhanced dowel action of OPSC beams, of which contributed from the large
tensile stresses in the OPSC between the cracks, produced a higher shear strength of
OPSC beam.

58
2.6 Flexural Behaviour of OPSC beams
The flexural behaviour of concrete beams, which incorporated OPS as coarse
aggregates in concrete, were reported by Teo et.al [13] and Alengaram et.al [14].
Both researchers investigated on the flexural behaviour of OPSC beams and
comparisons were also carried out between the OPSC beams and NWC beams on the
flexural resistance observed.
2.6.1 Flexural Behaviour of Reinforced Lightweight Concrete Beams Made with
OPS
In 2006, Teo [13] reported experimental study on the flexural behaviour of OPSC
beams. Total six similar sizes of under-reinforced OPSC beam specimens were casted:
3 singly reinforced OPSC beams and 3 doubly reinforced OSPC beams.
All the OPSC beam specimens showed typical structural behaviour in flexure and
yielding of the tensile reinforcement occurred before crushing of the compression
concrete in the pure bending zone. For beam specimens up to a reinforcement ratio
of 3.14%, the experimental ultimate moments of 4 % to 35 % higher compared to the
predicted BS8110 moments. For OPSC beam specimens with reinforcement ratio of
3.9%, the experimental ultimate moment obtained are 6 % lower compared to the
predicted BS8110 moment.
For singly reinforced beam specimens, the deflections obtained from the
experimental are acceptable as the span to deflection ratios ranged from 252 to 263
and satisfied the allowable limit provided by BS8110. For doubly reinforced beam
specimens, the span to deflection ratios obtained ranged from 146 to 196 and hence,

59
beam depths should be increased. All OPSC beam specimens showed considerable
amount of deflection, which provides ample warning to the imminence of failure.
2.6.2 Ductility behaviour of reinforced palm kernel shell concrete beams
Alengaram et. al [14] in 2008 reported experimental study on the flexural behaviour
of OPSC beams and comparisons were made between OPSC beams and NWC beams
of grade 30 with respect to mechanical properties and structural behaviour.
Both OPSC and NWC beams displayed flexural failure with yielding of tension steel
occurred prior to crushing of concrete in compression zone. Prior to failure, flexural
cracks were observed and extended to the neutral axis for both types of concrete.
During failure, OPSC beams failed in ductile manner which allowed sufficient warning
whereas NWC beams failed in brittle failure.
The experimental moments obtained by all beams were 5% higher than the
theoretical calculations. However, it was noted that the experimental moments
obtained by OPSC beams were slightly higher than NWC beams. The experimental
deflections obtained at service stage were close to the deflection predicted by
BS8110 code compared to the ACI code and were within the permissible limit of 8.4
mm as stipulated by the BS8110 code for structural use.

60
2.7 Summary
The research carried out in search for the shear transfer mechanism of normal
weight concrete beams with and without shear reinforcement had been covered
thoroughly since the last two centuries.
However, for OPSC beams, the current understanding about the shear resistance of
OPSC beams both cast with and without shear reinforcement were lack and only
small amount of study has been carried out due to its novelty, which research on
OPSC material properties and mix design only took place for the past two decades.
In addition, the design procedures for design against shear of beam cast with and
without shear reinforcement respectively have not been covered in the present
design codes. Advice has been given by some researches to adopt the current design
code of normal weight concrete beam for the shear strength predictions of OPSC
beam. However, the investigations carried out have not been covered adequately to
validate that the design codes for normal weight concrete beams is completely
suitable to be adopted for the shear strength predictions of OPSC beam.
Therefore, it is considered that there is a need for an experimental study to
understand the shear strength of OPSC beams with and without shear reinforcement,
respectively, and to determine whether the current design codes for normal weight
concrete beams are applicable for Oil Palm kernel Shell Concrete (OPSC) beams.

61
Table 2.1 Properties of OPS Aggregate and Crushed Granite Aggregate.
Researcher M.A.Mannan and D.C.L Teo
U.J.Alengaram and
M.Z.Jumaat
Type of aggregate Crushed
granite
aggregate
Oil palm
shell
aggregate
Crushed
granite
aggregate
Oil palm
shell
aggregate
Thickness (mm) 12.50 0.50-3.00 15.00 0.70-3.50
Specific gravity (SSD) 2.61 1.17 2.67 1.27
Water absorption for
24 hours (%)
0.76 23.30 <1 24.50
Bulk Density (kg/m3) 1470 590 1510 620
Fineness Modulus
(F.M)
6.33 6.24 6.57 6.24
Aggregate Impact
Value (%)
17.29 7.86 16.78 3.91
Aggregate Abrasion
Value, L.A. (%)
24.00 4.80 N/A N/A
Flakiness Index (%) 24.94 65.17 N/A N/A
Elongation Index (%) 33.38 12.36 N/A N/A

62
Table 2.2 Material properties of OPSC by researchers6.

63
Table 2.3 Flexural strength of OPSC6.
Researcher (Year)
Mix Proportion
w/c ratio
Compressive strength
(MPa)
Flexural strength
(MPa)
(%)
Okpala (1990)
1:1:2
0.50 0.60
22.20 19.80
2.81 2.53
13% 13%
Teo and Liew (2006)
1:1.12:0.80 0.41 22.00 2.30 11%
Mahmud et al. (2009)
1:1:0.8 0.35 26.98 2.79 10%
Table 2.4 Vmin for NWC beams without shear reinforcement based on EC2 48.
d = 200 d = 400 d = 600 d = 800
C20 0.44 0.35 0.25 0.29
C40 0.63 0.49 0.44 0.41
C60 0.77 0.61 0.54 0.50
C80 0.89 0.70 0.62 0.58

64
Figure 2.1 Three combined actions in reinforced concrete beams without
shear reinforcement27.
Figure 2.2 Hypothesis of systematically failure for beams failed in diagonal
tension30.
Figure 2.3 Formation of diagonal tension crack for beams without shear
reinforcement31.

65
Figure 2.4 Shear resistance vs a/d ratio for Mattock’s data31.
Figure 2.5 Reserve shear resistance beyond critical condition (uniform load
and no shear reinforcement)34.

66
Figure 2.6 Comparisons of calculated and observed critical shear intensities34.
Figure 2.7 Shear stress at failure vs a/d35.

67
Figure 2.8
vs a/d 35.
Figure 2.9 Relation between ρ and 36.

68
Figure 2.10 Ultimate shear force vs moment shear ratio for ρ = 1.7% and ρ
=2.67% for both deformed bars and plain bars 38.
Figure 2.11 Test results of series a/d=1.5, 2.5 and 3.6 with respect to concrete
strength39.

69
(a) Theoretical Ultimate Shear Strength Values vs Experimental Ultimate Shear
Strength Values
(b) Theoretical Cracking Shear Strength Values vs Experimental Cracking Shear
Strength Values
(c) Theoretical Ultimate Design Shear Strength Values vs Experimental Ultimate
Shear Strength Values for normal strength concrete and high strength concrete
Figure 2.12 Test results of theoretical vs experimental shear strength values41.

70
(a) Reinforcement ratio, ρ (b) Compressive strength, f’c (Mpa) (c) Shear span ratio, a/d
Figure 2.13 Effect of variables: reinforcement ratio, compressive strength and
shear span on cracking and ultimate shear strength42.
Figure 2.14 Plastic approach for reinforced concrete beams without shear
reinforcement46.

71
Figure 2.15 Four combined actions in reinforced concrete beams with shear
reinforcement27.
Figure 2.16 Diagonal tension cracks crossed one of the shear reinforcement50.
Figure 2.17 Comparison of test data with proposed formula51.

72
Figure 2.18 Shear contributions of shear reinforcement34.
Figure 2.19 Plastic approach for reinforced concrete beams with shear
reinforcement46.

73
Figure 2.20 Test results of beams with varying depth55.
Figure 2.21 Test specimens casted by Kani 55.

74
Figure 2.22 Test specimens series C casted by Leonhardt and Walther55.
Figure 2.23 Test specimens series D casted by Leonhardt and Walther55.

75
Figure 2.24 Test specimens casted by Taylor 55.
Figure 2.25 Illustration of size effect according to theory of linear fracture
mechanics and nonlinear fracture mechanics57.

76
Figure 2.26 Comparisons of the design formula with literature data57.
Figure 2.27 Experimental values vs Calculated values of mean nominal shear
strength for beams without shear reinforcement58.

77
Figure 2.28 Relative nominal shear strength of gravel and lightweight concrete
beams as function of the effective cross sectional depth (a/d=3) 59.
Figure 2.29 Shear stresses at inclined cracking and failure vs effective depth
for short beams with a/d = 1 59.

78
Figure 2.30 Crack patterns in slender beams (a/d=3) with various depths59.
Short beams
Figure 2.31 Crack patterns in short beams with various depths59.

79
Figure 2.32 Experimental values vs Calculated values of mean nominal shear
strength for beams with shear reinforcement60.
Figure 2.33 Shear stresses vs effective depth for short beams with shear
reinforcement59.

80
Chapter 3
Experimental Work
3.1 Introduction
As pointed out in Chapter 2, current research on Oil Palm kernel Shell Concrete
(OPSC) have been concentrated on the development of understanding with regards
to its material properties, and to author’s knowledge, only limited amount of works
have been conducted to study its bending and shear capacities. As a result, it is felt
that more experimental studies are required to develop the current understanding
with regards to the shear failure mechanisms of OPSC beams.
The experimental studies carried out in this research consisted of destructive shear
tests on Oil Palm kernel Shell Concrete (OPSC) beams and normal weight concrete
(NWC) beams. NWC beams were tested to form the basis of the comparative studies
in this research.
Two types of specimens were cast and tested: specimens cast without shear
reinforcement and specimens cast with shear reinforcement for OPSC and NWC
beams, respectively.
For beams cast without shear reinforcement, variables considered were: shear span
(SP), section depth (HT), longitudinal reinforcement ratio (LR), and concrete strength
(CS). Whilst for beams cast with shear reinforcement, variables considered were:
concrete strength (CG), shear reinforcement ratio (SR) and Inclination angle of shear

81
cracks (PL). During tests, all specimens were centrally loaded with concentrated loads
on top of the beam and simply supported by steel rods at both ends.
Details of beam specimens, steel moulds, materials used, fabrication method,
experimental programme, experimental apparatus, arrangements and the method of
measurement used in this research are presented in this chapter.
3.2 Concrete material properties
3.2.1 Oil Palm Shell Concrete (OPSC)
The oil palm kernel shell concrete (OPSC) cast in this research constituted of Ordinary
Portland Cement (OPC), sand (as fine aggregate), and oil palm kernel shell (OPS) (as
coarse aggregates). Portable water was added to the OPSC mixtures to stimulate the
mixtures binding of OPSC. Several trial mixes were carried out in order to obtain the
desired mixes designs (see Appendix A). The desired mix designs were found to be
suitable as shown in Table 3.1.
All palm oil kernel shells (OPS) were de-oiled with detergent to remove any residual
oil deposits to allow for quality concrete binding. Prior to sieving, all oil palm kernel
shell aggregates were oven dried at 100°C for 24 hours. However, the sieved oil palm
kernel shell aggregates were remixed using the same grading curve (see Figure 3.1),
which was based on the natural distributions of OPS aggregate size on the same
batch of palm oil fruits, in order to achieve uniform concrete in every batch for
worthy comparisons. The aggregate impact value of OPS aggregate is 8.4% whilst the
aggregate crushing value is 5.9% (see Appendix B).

82
The fine aggregates used were natural sand of maximum size passing through 1.18
mm sieve (see Figure 3.2).
3.2.2 Normal Weight Concrete (NWC)
The normal weight concrete (NWC) used for the casting of control beam specimens
constituted of Ordinary Portland Cement (OPC), sand (as fine aggregate), and
crushed granite (as coarse aggregates). The concrete mixes used are shown in Table
3.2. The fine aggregate was natural sand with grading curve as shown in Figure 3.2.
The coarse aggregate was crushed granite having maximum aggregate size of 20 mm
and grading curve as shown in Figure 3.3.
3.3 Reinforcement
In all cases, the flexural reinforcement was designed to avoid flexural failure and to
ensure shear failure (see Appendix C for Beam Design).
3.3.1 Specimens cast without shear reinforcement
For OPSC beam specimens, the sizes of flexural reinforcement include: 10 mm, 12
mm, 16 mm and 20 mm deformed bars. For NWC beam specimens, the flexural
reinforcement used: 12 mm, 16 mm and 20 mm deformed bars. In all cases, these
bars were bent up at both ends in accordance to the anchorage requirements of
Eurocode 2: 2004 [48].
The general arrangement of the flexural reinforcement for OPSC and NWC beam
specimens is presented in Figure 3.4.

83
3.3.2 Specimens cast with shear reinforcement
Tension reinforcement used in this research include: 16 mm, and 20 mm deformed
bars while compression reinforcement were 14 mm deformed bars. Shear
reinforcement used were fabricated from 6 mm plain bars.
In all cases, 14 mm bars were bent down and 16 mm bars were bent up at both ends
in accordance to the anchorage requirements of EC2. The 20 mm bars however
remained as straight bars and 1300 mm and 1350 mm in length when used as tension
reinforcement and compression reinforcement, respectively.
OPSC specimens (3A, 3B, 3C, 4A, 4B, 4C, 4D, 4E) and NWC specimens (NWCA, NWCB,
NWCD, NWCE) were reinforced with 2T14 as compression reinforcement and 2T16 as
tension reinforcement (See Figure 3.5 and Figure 3.6). OPSC beam specimens (5A, 5B,
5C) and NWC specimens (NWCC) were reinforced with 2T14 and 2T20 as
compression reinforcement and 2T16 and 2T20 as tension reinforcement (See Figure
3.7).
All shear reinforcement were 6mm plain bars with yield strength of 410 N/mm2. Link
spacing used in this research include: 60 mm, 80 mm, and 120 mm. (See Figure 3.5 to
Figure 3.7).
3.4 Beam specimens cast without shear reinforcement
3.4.1 OPSC Beam Specimens
A total of twenty-four OPSC beam specimens cast without shear reinforcement, as
indicated in Table 3.3, were tested to investigate the variables considered in this

84
research; shear span to effective depth ratio (Series SP), concrete strength (Series
CS), longitudinal steel reinforcement ratio (Series LR) and section depth (Series HT).
In general, all beam specimens were identical in their overall dimensions; 200 mm in
height, 105 mm in width, and 1500 mm in length; except for specimens 12F and H2,
where, the overall section depths were 113 mm and 313 mm, respectively.
The effect of Span to depth ratio, longitudinal reinforcement, concrete strength and
overall section depth variations on the ultimate shear capacity of OPSC beams
without shear reinforcement were investigated through destructive tests carried out
on fifteen, eighteen, ten and three beams, respectively (see Table 3.3).
3.4.2 NWC Beam specimens
A total of five NWC beam specimens cast without shear reinforcement, as indicated
in Table 3.4, were tested to form the basis for comparisons with the OPSC beam
specimens with respects to the variables considered: span to depth (SP), concrete
compressive strength (CS), longitudinal reinforcement ratio (LR) and overall section
depth (HT).
Specimens (NWC2, NWC3, NWC4 and NWC5) were tested at a/d = 2.5, while
specimen (NWC1) was tested at a/d = 1. The concrete strength for specimens (NWC1,
NWC2, and NWC5) was 33N/mm2, while specimens (NW3 and NWC4) were 29
N/mm2. The overall section depth of specimens (NWC1, NWC2, NWC3 and NWC4)
was 200 mm, while for specimen (NWC5) was 113 mm.

85
3.5 Beam specimens cast with shear reinforcement
3.5.1 OPSC beam specimens
A total of eleven OPSC beam specimens cast with shear reinforcement, as indicated
in Table 3.5 were tested to investigate the variables considered in this research:
concrete strength (CG), shear reinforcement spacing (SR) and shear span (PL). In
general, all beam specimens were identical in their overall dimensions; 200 mm in
height, 105 mm in width, and 1500 mm in length.
The effect of concrete compressive strength, shear reinforcement spacing, and shear
span variations on the ultimate shear capacity of OPSC beams with shear
reinforcement were investigated through destructive tests carried out on nine, nine
and three beams, respectively (see Table 3.5).
3.5.2 NWC beam specimens
A total of five NWC beam specimens cast with shear reinforcement, as indicated in
Table 3.6, were tested to form the basis for comparisons with the OPSC beam
specimens with respects to variables: span to depth ratio (PL), concrete compressive
strength (CG), and shear reinforcement spacing (SR).
Specimens (NWCA, NWCB, NWCC and NWCE) were tested at a/d = 1.69, while
specimen (NWCD) was tested at a/d = 1.06. The concrete strength for specimens
(NWC A, NWC B, NWCC and NWCD) was 30.61 N/mm2, while for specimen (NWCE)
was 35 N/mm2. The shear reinforcement spacing for specimens (NWCB, NWCD and
NWCE) was 80 mm, while for specimen NWCC and NWCA was 60 mm and 120 mm,
respectively.

86
3.6 Fabrication of specimens
3.6.1 Mould
All beam specimens with overall section depth of 200 mm were cast using steel
moulds. Each of these steel moulds consisted of a rectangular steel plate and four
channel sections (see Figure 3.8 and Figure 3.9). The rectangular steel plates, forming
the base plates, were predrilled with holes to receive the channel section, forming
the sides of the mould.
Beam specimens having overall section depth less than 200 mm were cast using the
abovementioned steel moulds. Depth control markings were made available within
the moulds to allow for casting of specimens with lower section depth.
Beam specimens having overall section depth more than 200 mm were cast using
plywood mould. The plywood moulds consisted of five rectangular plywood sections
of various sizes (see Figure 3.10 and Figure 3.11).
In all cases, silicone was used to fill the gaps between the sides and the bases before
every cast of beam specimens. This was done to avoid leakage of concrete.
In this research, standard steel cube moulds were used for the casting of concrete
cubes (100 mm X 100 mm X 100 mm) for compression tests.
3.6.2 Casting and curing
All beam specimens were cast in an upright position so as to stimulate the casting of
the prototype structures. Five cubes and three beam specimens were cast in every

87
single batch. Prior to concreting, all moulds and cubes were cleaned and applied with
de-moulding oil.
For every cast, concrete was poured into the moulds in three equal layers. Every
layers of concrete were poured simultaneously among all cubes and beam specimens
to ensure uniform distribution of concrete. After every layer of pouring, all beam
specimens were compacted using handheld vibrating poker for equal number of
times and until the bubbling subsided. All the cubes were compacted on vibrating
table for three equal layers, and for each layer, compaction were carried out until
bubbling subsided. These were done to ensure for similar compaction between the
cubes and the beam specimens.
All the specimens were de-moulded approximately 24 hours after casting. All
specimens were water cured, together in the same water tank, to ensure for identical
curing conditions. The curing durations and the compressive strengths for all
specimens are summarized and presented in Table 3.7 to Table 3.10.
3.7 Test setup
All beam specimens were tested in an upright manner so as to stimulate the
prototype structures. During tests, all specimens were simply supported at both
ends, as shown in Figure 3.18. The loads were applied at the centre, via spreader
beams with mean of 30 ton hand operated hydraulic jack. (See Figure 3.12 and Figure
3.13)
In general, the loads were applied with increment(s) of 4.21 kN until failure occurred.
Central deflections were measured and recorded after each load increment(s).

88
3.7.1 Beam specimens cast without shear reinforcement
Both OPSC and NWC specimens were loaded at designated positions from the
support to achieve the required span-depth ratio(s), a/d, as stipulated in Table 3.3
and 3.4 (See Figure 3.14).
3.7.2 Beam specimens cast with shear reinforcement
In general, the locations of the shear reinforcement were marked prior to tests to
ensure for correct positioning of supports and applying loads. (See Figure 3.15)
For OPSC specimens; beam specimens tested to investigate concrete strength (CG)
and links spacing (SR), were loaded at distance(s) of 240 mm from the support(s) as
shown from Figure 3.16 to Figure 3.18. Whilst for specimens tested to investigate
shear span (PL) were loaded at distance(s) of 240 mm, 200 mm, and 160 mm from
the support(s), as shown in Figure 3.17, Figure 3.19 and Figure 3.20, respectively.
For NWC control specimens; In general, beam specimens were loaded at distance(s)
of 240 mm from the support(s) (See Figure 3.17). Except for specimen NWCD, it was
loaded at distance(s) 160 mm from the support(s), as shown in Figure 3.19.
3.8 Central deflection
Mechanical dial gauge with a 100 mm strut, reading accuracy to 0.01 mm were used
to measure the central deflection of the beam specimens. The dial gauge was
positioned below the mid span of the beam specimens, as shown in Figure 3.21.

89
3.9 Testing procedures
Prior to testing, all beam specimens were positioned into the correct testing
positioning and dial gauge installed. In all cases, compressive tests on cubes
specimens were performed prior to any beam tests to ensure for the required
concrete compressive strength. The beam tests would be carried out after the
required compressive strength has been achieved.
After all the testing equipment had been accurately installed, the initial readings
from the deflection gauge were recorded.
For all beam specimens, the loads were applied with an increment of 4.21 kN until
failure occurred. Deflection was recorded and the cracks were marked at every load
increments. A series of load vs central deflection curves are presented in Chapter 4.
After testing, some of the specimens were cut open for ease of examine on the shear
crack interface. Details of these investigations are presented in Chapter 4.

90
Table 3.1 Mix design of Oil Palm Shell Concrete (OPSC)
Constitutions Proportions in Volume
A B C
Ordinary Portland Cement 3 4 5
Sand as fine aggregate 1 1 1
Oil Palm Shell as coarse aggregate 3 3 3
Water/Cement ratio 0.44 0.37 0.34
Note: 1 volume Cement = 0.537 kg 1 volume Sand = 0.56 kg 1 volume OPS aggregates = 0.22 kg
Table 3.2 Mix design of Normal Weight Concrete Beam (NWC)
Constitutions
Proportion in Volume
N
Ordinary Portland Cement 1
Sand as fine aggregate 0.58
Crushed gravel aggregate as coarse aggregate 0.79
Water/Cement ratio 0.43
Note: 1 volume Cement = 0.537 kg 1 volume Sand = 0.56 kg 1 volume gravel aggregates = 0.594 kg

91
Table 3.3 Details of OPSC beam specimens cast without shear reinforcement
Specimen No.
Section width, b (mm)
Overall section
depth, h (mm)
Longitudinal steel ratio, ρ
(%)
Shear span to
effective depth,
a/d
Shear span,
a (mm)
Variable considered
10A 105 200 0.75 2.50 425 LR, CS
S1 105 200 0.75 2.50 425 LR, CS
12A 105 200 1.08 1.00 169 SP, LR
12B 105 200 1.08 1.50 254 SP
12C 105 200 1.08 2.50 423 SP, LR, CS
12D 105 200 1.08 3.00 507 SP, LR
12E 105 200 1.08 2.50 423 CS
12F 105 113 1.91 2.89 237 HT
16A 105 200 1.92 1.00 167 SP, LR
16B 105 200 1.92 1.50 251 SP, LR
16C 105 200 1.92 2.50 418 SP, LR, CS
16D 105 200 1.92 3.00 501 SP, LR
16E 105 200 1.92 2.50 418 LR, HT
20A 105 200 2.99 1.00 165 SP,LR
20B 105 200 2.99 1.50 248 SP, LR
20C 105 200 2.99 2.50 413 SP, LR, CS
20D 105 200 2.99 3.00 495 SP, LR
20E 105 200 2.99 2.50 413 LR, CS
AD1 105 200 1.92 1.00 167 SP, LR
AD2 105 200 1.92 2.50 418 SP, LR
F1 105 200 1.92 2.50 418 SP, LR, CS
F2 105 200 1.92 2.50 418 CS
H2 105 313 1.92 2.36 656 HT
S2 105 200 1.92 2.50 418 CS
Table 3.4 Details of NWC beam specimens cast without shear reinforcement
Specimen No.
Section width, b (mm)
Overall section depth, h (mm)
Longitudinal steel ratio, ρ
(%)
Shear span to
effective depth,
a/d
Shear span, a (mm)
To be compared with OPSC specimen
NWC1 105 200 1.91 1 167 AD1
NWC2 105 200 1.91 2.5 418 F1
NWC3 105 200 1.91 2.5 418 16C
NWC4 105 200 2.99 2.5 413 20E
NWC5 105 113 1.90 2.5 237 12F

92
Table 3.5 Details of OPSC beam specimens cast with shear reinforcement
Specimen no.
Section width, b (mm)
Overall section
depth, h (mm)
No. of shear reinforcement within shear
span
Shear reinforcement
spacing, s (mm)
Shear span,
a (mm)
Variable considered
3A 105 200 3 120 240 CG, SR
3B 105 200 3 120 240 CG, SR
3C 105 200 3 120 240 CG, SR
4A 105 200 4 80 240 CG, SR
4B 105 200 4 80 240 CG, SR, PL
4C 105 200 4 80 240 CG, SR
5A 105 200 5 60 240 CG, SR
5B 105 200 5 60 240 CG, SR
5C 105 200 5 60 240 CG, SR
4D 105 200 6 80 200 PL
4E 105 200 6 80 160 PL
Table 3.6 Details of NWC beam specimens cast with shear reinforcement
Specimen no.
Overall section width (mm)
Overall section
depth, h (mm)
No. of shear reinforcement within shear
span
Shear reinforcement
spacing, s (mm)
Shear span, a (mm)
To be compared with OPSC specimen
NWCA 150 200 3 120 240 3B
NWCB 150 200 4 80 240 4B
NWCC 150 200 5 60 240 5B
NWCD 150 200 4 80 160 4E
NWCE 150 200 4 80 240 4C

93
Table 3.7 Curing and concrete strength for OPSC beam specimens cast without shear reinforcement
OPSC beam Specimen No.
Mix design
w/c ratio
Curing duration (days)
Average cube compressive strength,
fcu (N/mm2)
10A B 0.37 28 30.05
S1 C 0.34 28 34.82
12A B 0.37 32 31.03
12B B 0.37 32 31.03
12C B 0.37 32 31.03
12D B 0.37 32 31.03
12E C 0.34 55 39.20
12F B 0.37 38 32.46
16A A 0.44 30 26.14
16B A 0.44 30 26.14
16C A 0.44 30 26.14
16D A 0.44 30 26.14
16E B 0.37 32 32.46
20A A 0.44 28 24.23
20B A 0.44 28 24.23
20C A 0.44 28 24.23
20D A 0.44 28 24.23
20E A 0.44 40 28.00
AD1 B 0.37 32 32.00
AD2 B 0.37 32 32.00
F1 B 0.37 32 32.00
F2 C 0.34 60 40.10
H2 B 0.37 37 32.46
S2 C 0.34 30 35.70
Table 3.8 Curing and concrete strength for NWC beam specimens cast without shear reinforcement
NWC beam Specimen no.
Mix design
w/c ratio
Curing duration (days)
Average cube compressive strength, fcu
(N/mm2)
NWC1 N 0.43 11 33.00
NWC2 N 0.43 11 33.00
NWC3 N 0.43 7 29.00
NWC4 N 0.43 7 29.00
NWC5 N 0.43 11 33.00

94
Table 3.9 Curing and concrete strength for OPSC beam specimens cast with shear reinforcement
OPSC beam
Specimen No.
Mix design
w/c ratio
Curing duration (days)
Average cube compressive strength, fcu
(N/mm2)
3A A 0.44 28 25.79
3B B 0.37 30 31.93
3C C 0.34 28 34.60
4A A 0.44 28 25.79
4B B 0.37 30 31.93
4C C 0.34 28 34.60
5A A 0.44 28 25.79
5B B 0.37 30 31.93
5C C 0.34 28 34.60
4D B 0.37 28 30.15
4E B 0.37 28 30.15
Table 3.10 Curing and concrete strength for NWC beam specimens cast with shear reinforcement
NWC beam Specimen no.
Mix design
w/c ratio
Curing duration (days)
Average cube compressive strength, fcu
(N/mm2)
NWCA N 0.43 7 30.61
NWCD N 0.43 7 30.61
NWCC N 0.43 7 30.61
NWCD N 0.43 7 30.61
NWCE N 0.43 13 35.00

95
Figure 3.1 Grading curve of OPS Aggregate for OPSC beam specimens.
Figure 3.2 Grading curves of Fine Aggregate for OPSC and NWC beam
specimens.

96
Figure 3.3 Grading curve of gravel Aggregate for NWC beam specimens.
Figure 3.4 General arrangements of beams without shear reinforcement.

97
Figure 3.5 General arrangements of OPSC (3A, 3B, 3C) and NWC (NWCA) beams reinforced with 2T14 (compression), 2T16 (tension), and R6@120 mm (shear reinforcement).
Figure 3.6 General arrangements of OPSC (4A, 4B, 4C, 4D, 4E) and NWC (NWCB, NWCD, NWCE) beams reinforced with 2T14 (compression), 2T16 (tension), and R6@80 mm (shear reinforcement).

98
Figure 3.7 General arrangements of OPSC (5A, 5B, 5C) and NWC (NWCC) beams reinforced with 2T(14+20) (compression), 2T(16+20) (tension), and R6@60 mm (shear reinforcement).

99
All dimensions in mm
Figure 3.8 General arrangements of steel mould for casting of specimens having overall section depth ≤ 200 mm.

100
All dimensions in mm
Figure 3.9 Bolting details of steel moulds shown in Figure 3.8.

101
All dimensions in mm
Figure 3.10 General arrangements of wooden mould for casting of specimens having overall section depth > 200 mm.

102
All dimensions in mm
Figure 3.11 Bolting details of wooden moulds shown in Figure 3.10.

103
Figure 3.12 Test setup for OPSC and NWC beam specimens.
Figure 3.13 Loading rig for OPSC and NWC beam specimens.
Deflection Gauge

104
Figure 3.14 Loading arrangement for all beam specimens cast without shear reinforcement.
Figure 3.15 Location of shear reinforcement were marked to ensure for correct positioning of loads and supports.

105
Figure 3.16 Loading arrangements for OPSC and NWC beam specimens cast with shear reinforcement spaced at 120 mm intervals and loaded with 240 mm shear span.
Figure 3.17 Loading arrangements for OPSC and NWC beam specimens cast with shear reinforcement spaced at 80 mm intervals and loaded with 240 mm shear span.

106
Figure 3.18 Loading arrangements for OPSC and NWC beam specimens cast with shear reinforcement spaced at 60 mm intervals and loaded with 240 mm shear span.
Figure 3.19 Loading arrangements for OPSC beam specimen cast with shear reinforcement spaced at 80 mm and loaded with 200 mm shear span.

107
Figure 3.20 Loading arrangements for OPSC and NWC beam specimens cast with shear reinforcement spaced at 80 mm intervals and loaded with 160 mm shear span.
Figure 3.21 Position of mechanical dial gauge for measurements of mid span deflection.

108
Chapter 4
Failure Mechanisms and Test Results
4.1 Introduction
Full details of beam specimens cast in this research and their test setup have been
described in Chapter 3. In this chapter, the observations made during tests, the
measured deflections, the failure mechanisms, and the ultimate failure loads of all
specimens are reported and discussed. In addition, the outcomes of comparative
studies carried out to investigate the observed variations between the Oil Palm
kernel Shell Concrete (OPSC) specimens and the Normal Weight Concrete (NWC)
specimens with regards to variables considered are also presented in this chapter.
In this research, a total of forty five beam specimens were tested, of which, thirty five
were cast from Oil Palm kernel Shell Concrete (OPSC) and ten were cast from Normal
Weight Concrete (NWC). Among the OPSC beams, twenty four were cast without
shear reinforcement, while the remaining eleven were cast with shear
reinforcement. For NWC beams, five were cast without shear reinforcement, while
the remaining five were cast with shear reinforcement.
In general, two distinct failure mechanisms were observed from tests on specimens
cast without shear reinforcement, that is, for specimens loaded with span to depth
ratio, a/d < 2.5, it is observed to fail in shear compression failure mechanism. Whilst
for specimens loaded with span to depth ratio, a/d ≥ 2.5, it is observed to fail in
diagonal tension failure mechanism. However, for specimens cast with shear

109
reinforcement, all specimens were observed to fail in diagonal tension failure
mechanism.
4.2 Specimens cast without shear reinforcement
A total number of twenty four OPSC beam specimens and five NWC beam specimens
cast without shear reinforcement were tested. These specimens were loaded with a
pair of concentrated loads on top of the beam at designated distances, a, away from
the supports, as shown in Figure 3.14.
The observations made during tests, in regard to failure mechanisms and crack
patterns, are presented from Figure 4.1 to Figure 4.24 and Figure 4.25 to Figure 4.29,
for OPSC beam specimens and NWC beam specimens, respectively. The failure loads
of OPSC and NWC beam specimens are presented in Table 4.1 and 4.2, respectively.
Detailed discussions on these observations are presented in Section 4.2.1 to 4.2.3, as
follows.
4.2.1 Overall behaviour of OPSC beams and NWC beams specimens
It is observed from tests that the entire twenty-nine beam specimens cast without
shear reinforcement failed in shear mode of failure at the vicinity of shear span with
the mid span of the beam displaced vertically by the loads applied. Three types of
shear failure were observed: shear compression failure for a/d < 2.5, diagonal tension
failure and shear failure, respectively, for a/d ≥ 2.5. The systematically details
observations from the flexural cracks initiation until the occurrence of the shear
failure for the beams without shear reinforcement are explained herein.

110
Except for specimens 20A and 20B (see Table 4.3), it is observed that the formations
of flexural cracks occurred prior to the shear cracks. The flexural cracks initiated from
the mid-span bottom fibre, coinciding with the maximum tensile stress, and
propagate through the section of the specimens as the applied load increases. The
flexural cracks were noted to occur at 18% to 78% of the ultimate failure loads for
OPSC beam specimens (see Table 4.3), and at 20% to 62% for NWC beam specimens
(see Table 4.4). However, inferred from load deflection curves, the cracking load are
noted to occur at 10% to 56% of the ultimate loads for OPSC beam specimens (see
Table 4.3) and at 12% to 59% of the ultimate loads for NWC beam specimens (see
Table 4.4). The load-deflection curves are presented from Figure 4.30 to Figure 4.34
and Figure 4.35 for OPSC beams and NWC beams, respectively. It is believed that the
discrepancies noted between the observed and the inferred cracking loads were due
to the formation of flexural micro-cracks that could not have been detected by the
naked eye but can be clearly observed via the change of inclination angle on the load
deflection curves.
Further analysis on the test results revealed that the formations of flexural cracks did
not take place under loads having similar percentages to their ultimate failure loads.
These inconsistencies derived from the fact that the percentages for formation of
flexural cracks were determined with respect to the ultimate shear failure loads (Vult)
instead of their flexural failure loads. That is, specimens failed in shear at higher
ultimate failure loads may in fact have been casted with high flexural resistance (such
as specimens 20A, 20B, 20C), thus, appeared to have their flexural cracks formed at
loads that are closer to their ultimate shear failure loads, hence, resulting the high
percentages. In contrast, specimens failed in shear at lower ultimate failure loads
were in fact casted with lower flexural resistance (such as Specimens 12A, 12B and

111
12C), thus, appeared to have their flexural cracks formed at loads that are further
away from the ultimate shear failure loads, hence, resulting the low percentages.
The implication is that the formations of flexural cracks are in fact independent to the
formation of shear failure mechanism.
Upon further loading, the formations of shear cracks were observed to have initiated
at the supports at 48% to 97% of the ultimate failure loads for OPSC beam specimens
(see Table 4.3), and at 60% to 75% of the ultimate failure loads for NWC beam
specimens (see Table 4.4). These inconsistencies deduced from the fact that
specimens failed in shear at higher percentages of the ultimate failure loads were, in
fact, loaded with high shear span to depth, a/d, ratio (such as Specimens 12C, 12D,
16C and 16D), thus, appeared to have their shear cracks formed at loads that are
closer to their ultimate shear failure loads. In contrast, specimens that failed in shear
at lower ultimate failure loads were loaded with low shear span to depth, a/d, ratio
(such as specimens 12A, 12B, 16A and 16B), thus, appeared to have their shear cracks
formed at loads that are far from the ultimate shear failure loads. The implication is
that the formation of shear cracks are dependent on the loading position, that is
beams loaded with high shear span to depth, a/d, ratio would have their shear cracks
formed at loads further from their ultimate as compared to those loaded with a
lower span to depth ratio. After formation of the initial shear cracks at the supports,
these inclining shear cracks were observed to propagate towards the loading
positions through the specimen’s section depth as the applied load increases, upon
further increases in the applied load, the formation of shear failure were observed
with a sudden increase in the width of the shear cracks.
Further comparisons of flexural and shear cracks between OPSC and NWC beam
specimens with similar variables (span to depth ratio (a/d), longitudinal steel ratio

112
(ρ), concrete strength (fcu) and overall section depth (h) ), such as OPSC specimen
AD1 and NWC specimen NWC1 (see Figure 4.19 and Figure 4.25, respectively), and
OPSC specimen F1 and NWC specimen NWC2 (see Figure 4.21 and Figure 4.26,
respectively) shown that the amount of flexural and shear cracks formed in OPSC
specimens were greater than NWC specimens, which it is observed during testing
that the visibility of flexural and shear cracks for OPSC beam specimens were more
evident, hence the shear failure indications in OPSC beam specimens are more
apparent with ample warning to be given before failure occurred.
In general, for specimens loaded with span to depth ratio, a/d < 2.5, it was noted that
shear compression failure occurred by crushing of the concrete at the compression
zone and the ultimate shear failure loads are higher than those specimens loaded
with span to depth ratio, a/d ≥ 2.5. This have been expected that the ultimate loads
are higher for a/d < 2.5 due to the fact that the loads from the loading position were
able to be transferred to the support reaction through the shorter shear span
distance, where diagonal shear cracks were observed to propagate towards the
loading position, prior to the ultimate occurrence of shear compression failure. It is
observed that the crushing of concrete at the compression zone were less evident for
specimens casted with lower percentage of longitudinal steel ratio (ρ) of less than
2.99% (such as Specimen 12A, 12B, 16A, 16B and NWC1) compared to specimens
casted with longitudinal steel ratio, ρ = 2.99% (Specimen 20A and 20B). For beams
casted with lower longitudinal steel ratio, the crushing of concrete at the
compression zone were less pronounced as the mid span of the longitudinal steel
reinforcement would have bent alongside with the vertical displacement of the
specimen as the load was increased, resulting in a limited concrete crushing at the
beam compression zone. In contrast, for specimens casted with higher longitudinal

113
steel ratio, ρ = 2.99%, specifically Specimen 20A and 20B (see Figure 4.14 and Figure
4.15, respectively) concrete crushing at the beam compression zone was more
apparent as the longitudinal steel reinforcement in each specimen would have
remained rigid due to the higher beam stiffness provided, hence, the bending of
longitudinal steel reinforcement were limited with the increment of applied loads.
For beam specimens loaded with span to depth ratio, a/d ≥ 2.5, it is observed that
shear failure took place at the shear span except for OPSC beam specimens cast with
ρ = 0.75% (Specimen 10A and S1 in Figure 4.1 and Figure 4.2, respectively), which
failed in diagonal tension mode. During testing, it is observed that for beams, which
failed in diagonal tension mode (Specimen 10A and S1), the diagonal cracks were
originated from the flexural cracks formed at the mid-span closest to the shear span,
and subsequently, developed into diagonal shear cracks, which propagated to the
loading position prior to diagonal tension failure. Whilst for beams that failed in
shear failure mode, it is observed during testing that the diagonal shear cracks were
initiated from the support reaction and propagated towards the loading position
prior to the shear failure.
The difference of failure mode observed for beams loaded with span to depth ratios,
a/d > 2.5 was due to the longitudinal steel ratio provided. For specimens casted with
lower longitudinal steel ratio, flexural cracks observed were more evident, hence
lower resistance against bending were provided by the lower beam stiffness of the
longitudinal steel reinforcement as bending of the beams were more significant
compared to specimens casted with higher longitudinal steel ratio. As the results, the
beams casted with lower longitudinal steel ratio were observed to fail in diagonal
tension failure mode instead of shear failure mode. The implication is that for beams
loaded with span to depth ratio, a/d > 2.5, the higher longitudinal steel ratio

114
provided increases the beam stiffness, which subsequently increased the resistance
against bending and hence, shear failure occurred.
Further, it is observed that for all beams loaded with span to depth ratio, a/d ≥ 2.5,
both the shear failure: diagonal tension failure and shear failure were abrupt and
explosive. In addition, it is observed that both types of failures also consist of beam
splitting, which horizontal splitting of concrete occurred due to dowel action
between the concrete and surface of longitudinal steel bar from the support reaction
to the shear span. Subsequently, the beam splitting propagated from the shear span
diagonally via the diagonal shear cracks to the loading position, where the concrete
beam were separated into two regions, which is observed in all specimens loaded
with a/d ≥ 2.5 (see Example Figure 4.1 for Specimen 10A, which failed in diagonal
tension failure and Figure 4.5 for Specimen 4.5, which failed in shear failure). After
shear failure, although splitting of the beam occurred, it is observed from all
specimens that the two regions of the beam remained intact as a beam due to the
presence of anchorage at bottom of both end of the beam, which would have
prevented the whole beam from splitting into two sections.
For OPSC specimens, two types of crack mechanisms were observed (see Figure 4.36
and 4.37) at the diagonal shear cracks: (1) crack sheared through the OPS aggregates
and (2) bond failure between cement paste and OPS aggregates in concrete (see
Figure 4.37 for illustrations). However, the occurrence of either one of these two
observed mechanisms depend on the natural alignment of OPS aggregates along
shear crack. The natural alignment of OPS aggregates was found to incline either
towards perpendicular or parallel axis of the diagonal shear crack. It was observed
that the OPS aggregates were sheared through by the crack when the alignment of
OPS aggregates inclined towards the perpendicular axis of the crack. Whilst the bond

115
failure between cement paste and OPS aggregates was observed when the OPS
aggregates inclined towards parallel axis of the diagonal shear cracks. Whilst for NWC
specimens, the crack mechanism was observed to shear through the cement paste
(See Figure 4.38) and in between the normal aggregates (see also Figure 4.60 for
illustration).
4.2.2 Central deflection
The central deflection of all beam specimens were recorded after every increment of
applied load. For every beam specimens cast without shear reinforcement, a graph of
load versus central deflection curve has been plotted and presented in Figure 4.31 to
Figure 4.34, and Figure 4.35, for OPSC beam specimens and NWC beam specimens,
respectively.
In general, these curves exhibit similar load deflection behaviour among the
specimens, that is, a linear elastic behaviour can be inferred up to approximately half
of the ultimate failure loads, and subsequently, the rate of increment in the applied
loads decreased until failure occurred. The increases in the rate of deflection were
due to the formation of flexural cracks at the mid-span bottom tension surface of the
beam specimens.
A comparison between the actual cracking loads inferred from the load-deflection
curves and the observed cracking loads are presented in Table 4.3 and Table 4.4 for
OPSC beam specimens and NWC beam specimens, respectively. From these
comparisons, it is observed that the inferred cracking loads were 4% to 25% and 3%
to 11% lower than the observed flexural cracking loads for OPSC beam specimens
and NWC beam specimens, respectively. It is believed that these discrepancies derive

116
from the fact that the early formation of the micro-cracks could not be detected by
the naked eye.
4.2.3 Ultimate Failure Loads
The ultimate failure loads of beam specimens were derived from the last recorded
loads applied to the specimens prior to failure. For beam specimens cast without
shear reinforcement, the ultimate shear failure loads of specimens cast from OPSC
and NWC are summarized and presented in Table 4.1 and 4.2, respectively. Among
the twenty-nine beam specimens, twenty four were casted from OPSC while the
remaining five were casted from NWC.
Among the twenty-four OPSC beam specimens, four variables were considered in the
tests (See Table 4.1): span to depth ratio (SP), longitudinal steel reinforcement ratio
(LR), concrete strength (CS) and overall section depth (HT). Of which, eighteen out of
the twenty four specimens derived with results that addresses for more than one
variables considered (see Table 4.1).
Whilst, among the five NWC beam specimens, four identical variables were
considered (See Table 4.2): span to depth ratio (SP), concrete strength (CS),
longitudinal steel reinforcement ratio (LR) and overall section depth (HT). These NWC
specimens were designed and tested to form the basis (control samples) from the
current research investigation.
In general, it is apparent that the load carrying capacities of both the OPSC beams
and NWC beams (cast without shear reinforcement) are influenced by the variables
considered. Details of the effects of variables and the comparisons of OPSC

117
specimens with control sample are described fully from Section 4.2.3.1 to Section
4.2.3.4.
4.2.3.1 Span to depth ratio
Among the twenty four OPSC beams casted without shear reinforcement, fifteen
beam specimens (see Table 4.1) were cast and tested to evaluate the effect of shear
span-depth ratio, a/d, with respect to the ultimate shear resistance. These fifteen
OPSC beam specimens have been further sub-categorised into: SP-LR12B, SP-LR16A,
SP-LR16B, and SP-LR20A; to take account for three longitudinal steel reinforcement
ratios and two range of concrete cube compressive strength (see Table 4.5). The
three longitudinal steel reinforcement ratios were: 1.08% (Category SP-LR12B),
1.92% (Category SP-LR16A and SP-LR16B) and 2.99% (Category SP-LR20A). Whilst the
two range of concrete cube compressive strength were: 24 N/mm2 to 26 N/mm2
(Category SP-LR16A and SP-LR20A) and 31 N/mm2 to 32 N/mm2 (Category SP-LR12B
and SP-LR16B).
In general, the observations made from tests indicate that the ultimate shear
resistance increases as the span to depth ratio (a/d) decreases (see Figure 4.38). Such
observations are to be expected, because as the shear span, a, reduces, the shear
inclination angle increases, which in turn, enhance the contribution of aggregate
interlocking towards the ultimate shear capacity, and as a result, a higher shear
resistance could be mobilised.
Comparisons with the NWC beam specimens reveal that the rate of increase in the
ultimate shear resistance of OPSC beam specimens as a result of the decreasing
shear span depth ratio, a/d, are observed to be less significant, as shown in Figure

118
4.39. That is, the shear resistance of NWC specimens (NWC2 to NWC1) increased by
100% as the span to depth ratio, a/d, reduces from 2.5 to 1.0, while the shear
resistance of OPSC specimens (F1 to AD1) increased only by 78% for the same
reduction in span depth ratio. Such discrepancy is believed to be attributed to the
smoother shear surface observed from the OPSC specimen (AD1) (see Figure 4.40
and 4.41), where a lower aggregate interlocking resistance could be mobilised.
However, observations made on specimens loaded with a/d = 2.5 revealed that
specimen cast with OPSC (F1) exhibited rougher shear surface than those cast with
NWC (NWC2) (see Figure 4.40 and 4.42). Although a rougher surface has been
observed in beams cast with OPSC, a lower shear resistance was observed (90% of
that observed in specimen cast with NWC-NWC2) (see Figure 4.39). It is believed that
the lower shear resistance found in OPSC beams is in fact attributed to the lower
aggregate strength found in Oil Palm Kernel Shell (OPSC), which in turn, provide a
lower aggregate interlocking capacity.
On the other hand, it was observed that for the same shear to depth ratio, a/d, the
ultimate failure load obtained by OPSC specimens casted with higher longitudinal
steel reinforcement ratio exhibited higher shear capacity (see Figure 4.39). This result
is as expected, because as the longitudinal steel reinforcement ratio increases, the
contribution of dowel shear capacity on the ultimate shear capacity of the OPSC
beams would have increases, and as a result, higher ultimate failure loads is
obtained.

119
4.2.3.2 Longitudinal steel ratio
Eighteen OPSC beam specimens (see Table 4.6) were selected from the twenty four
OPSC beam specimens without shear reinforcement and are categorized under
Category LR to evaluate the effect of longitudinal steel ratio to the ultimate shear
resistance. These eighteen OPSC beam specimens have been further subcategorised
into: LR-SP1A, LR-SP1B, LR-SP1.5A, LR-SP2.5A, LR-SP2.5B, LR-SP3A and LR-SP3B; to
account for four span to depth ratios and two range of cube compressive strength.
The four shear span – depth ratios consist of a/d = 1 (Category LR-SP1A and LR-SP1B),
a/d = 1.5 (Category LR-SP1.5A), a/d = 2.5 (Category LR-SP2.5A and LR-SP2.5B) and a/d
= 3 (Category LR-SP3A and LR-SP3B). Whilst the two range of cube compressive
strength consists of 24 N/mm2 to 26 N/mm2 (Category LR-SP1A, LR-SP1.5A, LR-SP2.5A
and LR-SP3A) and 31 N/mm2 to 32 N/mm2 (Category LR-SP1B, LR-SP2.5B and LR-
SP3B).
Comparing the test results of ultimate failure load with respect to the variable of
longitudinal steel reinforcement ratio shown in Table 4.6, it is evident that the
ultimate shear resistance increases with the increment of longitudinal steel
reinforcement ratios (see also Figure 4.43). It is generally believed that when the
longitudinal steel reinforcement ratios provided for the beams decreases, the shear
force carried by the dowel action of longitudinal steel reinforcement decreases [27].
Hence, wider shear crack widths is observed on the beams casted with lower
longitudinal steel reinforcement ratio, which is shown on the OPSC specimen 12C
shown in Figure 4.6, compared with the beam casted with higher longitudinal steel
reinforcement ratio (OPSC specimen 20C shown in Figure 4.16). Subsequently, the
wider shear crack widths would reduce the aggregate interlock capacity [27], and, as
a result, the ultimate failure loads obtained are lower. In contrast, OPSC beams

120
casted with higher longitudinal steel reinforcement ratio would lead to increment of
dowel shear capacity, thus, higher aggregate interlock capacity and results in higher
ultimate load obtained.
In comparison to the NWC beam specimens, it was observed from tests that the
ultimate failure load obtained for OPSC beams are lower (See Figure 4.44), which the
ultimate failure load obtained for Specimen F1 and 20E is 10% and 47% lower with
respect to the NWC beam specimen NWC3 and NWC4 for longitudinal steel ratio of
1.92% and 2.99%. For NWC beam specimens casted with lower and higher
longitudinal steel reinforcement (NWC3 and NWC4), it is believed that higher
aggregate impact strength is provided by the gravel aggregates (see Table 2.1), which
observations from the sheared plane of diagonal shear cracks show that the gravel
aggregates remain rigid. This would allow sufficient dowel action of longitudinal steel
reinforcement to be mobilised and subsequently, leads to the increment of
aggregate interlock capacity in NWC beams. As a result, higher ultimate failure load is
obtained by NWC beams compared to OPSC beams. In contrast, lower OPS
aggregates impact strength are provided for OPSC beam specimens, which the OPS
aggregates are observed to be easily fractured in concrete. Therefore, this would
lead to lack of dowel action of the longitudinal steel reinforcement to be mobilised
and also leads to lower aggregate interlocking and as a result, lower ultimate failure
load is obtained by OPSC beams than NWC beams.
Further comparisons with the NWC beam specimens indicate that the increment in
the ultimate shear resistance of OPSC beam specimens as a result of the reduction of
longitudinal steel reinforcement, ρ, are less significant (see Figure 4.44). That is, a
comparisons of OPSC beam specimens (Specimen 16C and 20E) with NWC beam
specimens (Specimen NWC3 and NWC4), show that the shear resistance of NWC

121
specimens increased by 56% as longitudinal steel ratio increased from 1.92% to
2.99%, while the shear resistance of OPSC specimens increased only by 21%. It is
believed that for NWC beams, higher increment rate of dowel action capacity and
aggregate interlock capacity are provided by the contribution of rigid behaviour of
gravel aggregates compared to easily fractured behaviour of OPS aggregates in OPSC
beams. As a result, the rate of ultimate shear strength increment obtained from the
tests for NWC beams is higher than OPSC beams.
4.2.3.3 Concrete strength
From the twenty four OPSC beam specimens without shear reinforcement, ten beam
specimens (see Table 4.7) were selected and are categorized under Category CS to
evaluate the effect of concrete strength to the ultimate shear resistance of OPSC
beams. These ten OPSC beam specimens have been further subcategorised into: CS-
LR10, CS-LR12, CS-LR16 and CS-LR20; to account for four longitudinal reinforcement
ratios. The four longitudinal reinforcement ratios are 0.75% (Category CS-LR10),
1.08% (CS-LR12), 1.92% (CS-LR16) and 2.99% (CS-LR20).
In general, from test results of the selected ten OPSC beam specimens with
parameter of concrete strength (see last column in Table 4.7), it is apparent that as
the concrete strength, fcu, increases, the ultimate shear resistance increases (see
Figure 4.45). For increment of concrete strength in a beam, it is generally believed
that the tensile strength of concrete would increases, in which, bond within the
cement paste and interlocking between the cement paste and aggregates would
grow stronger. Hence, this would delay the rupture of concrete and as a result, the
ultimate failure load increases with the concrete strength.
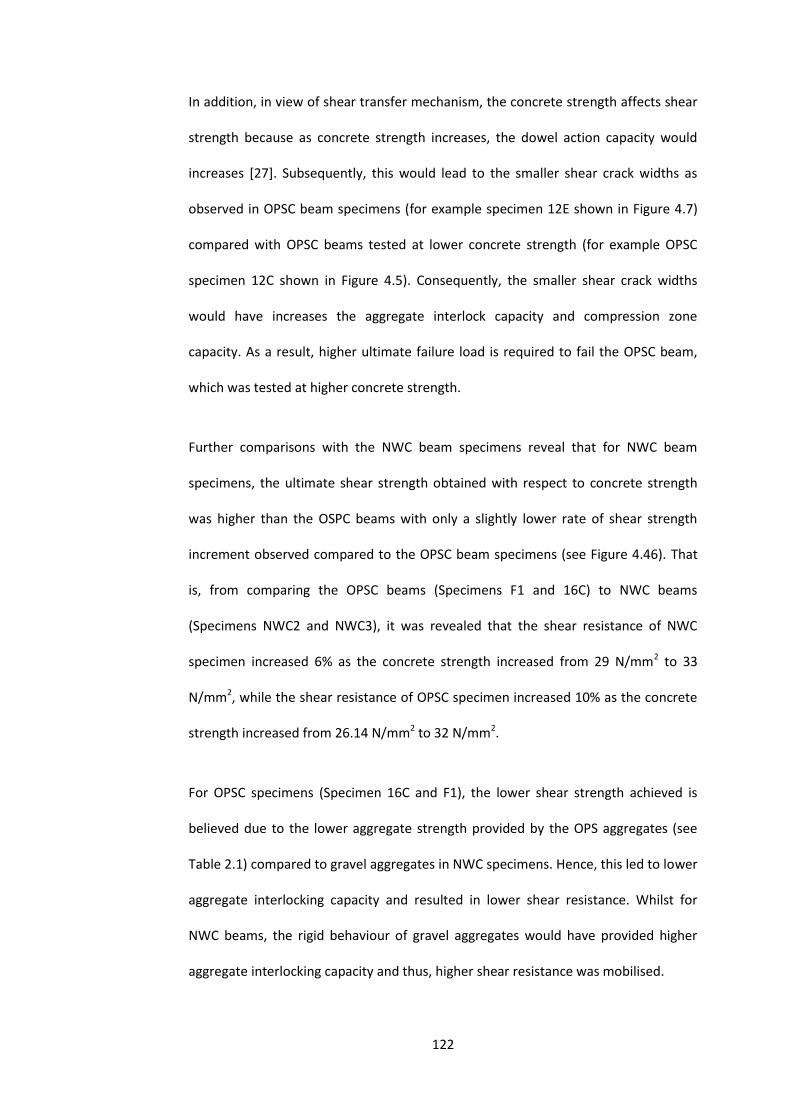
122
In addition, in view of shear transfer mechanism, the concrete strength affects shear
strength because as concrete strength increases, the dowel action capacity would
increases [27]. Subsequently, this would lead to the smaller shear crack widths as
observed in OPSC beam specimens (for example specimen 12E shown in Figure 4.7)
compared with OPSC beams tested at lower concrete strength (for example OPSC
specimen 12C shown in Figure 4.5). Consequently, the smaller shear crack widths
would have increases the aggregate interlock capacity and compression zone
capacity. As a result, higher ultimate failure load is required to fail the OPSC beam,
which was tested at higher concrete strength.
Further comparisons with the NWC beam specimens reveal that for NWC beam
specimens, the ultimate shear strength obtained with respect to concrete strength
was higher than the OSPC beams with only a slightly lower rate of shear strength
increment observed compared to the OPSC beam specimens (see Figure 4.46). That
is, from comparing the OPSC beams (Specimens F1 and 16C) to NWC beams
(Specimens NWC2 and NWC3), it was revealed that the shear resistance of NWC
specimen increased 6% as the concrete strength increased from 29 N/mm2 to 33
N/mm2, while the shear resistance of OPSC specimen increased 10% as the concrete
strength increased from 26.14 N/mm2 to 32 N/mm2.
For OPSC specimens (Specimen 16C and F1), the lower shear strength achieved is
believed due to the lower aggregate strength provided by the OPS aggregates (see
Table 2.1) compared to gravel aggregates in NWC specimens. Hence, this led to lower
aggregate interlocking capacity and resulted in lower shear resistance. Whilst for
NWC beams, the rigid behaviour of gravel aggregates would have provided higher
aggregate interlocking capacity and thus, higher shear resistance was mobilised.

123
4.2.3.4 Section depth
Among the twenty four OPSC beam specimens, three beam specimens (see Table
4.8) were cast and tested (Category HT) to evaluate the effect of overall section
depth, h, with respect to the ultimate shear resistance of OPSC beams.
In general, the observations made from tests demonstrate that the ultimate shear
resistance increases as the section depth increases (see Figure 4.47). Such
observations are to be expected because the area of shear interface would be
increases as the section depth increases, higher shear stress would be transferred by
the aggregates across the shear cracks, and as a result, a higher ultimate shear
strength could be mobilised against shear failure.
However, when the ultimate shear stress is to be considered, it is observed that the
ultimate shear stress of OPSC beams decreases as the section depth increases (see
Figure 4.48). Such observations would be expected due to the fact that size effects
occur in shear mechanism of OPSC specimens (See also Section 2.3).
Comparison with test results of NWC beams indicates less significant increase in the
attainment of the ultimate shear resistance of OPSC beam specimens as the section
depth increases (see Figure 4.49). That is, the ultimate shear resistance of NWC
specimens (NWC5 to NWC2) increased by 42% as the overall section depth increases
from 113 mm to 200 mm, while the shear resistance of OPSC specimens (12F to F1)
increased only by 24% for the same increment of overall section depth. Such
discrepancy is believed to be attributed to the lower aggregate strength found in Oil
Palm kernel Shell (OPS) with respect to that in the normal aggregates. As a result, a

124
lower aggregate interlocking capacity could be mobilised, hence, resulting in a lower
ultimate shear resistance.
4.3 Specimens cast with shear reinforcement
A total of eleven OPSC beam specimens and five NWC beam specimens cast with
shear reinforcement were tested. These specimens were loaded with a pair of
concentrated loads on top of the beam at designated distance(s), a, away from the
supports, as shown in Figure 3.16 to 3.20 .
The observations made from tests, failure mechanisms and crack patterns, are
presented from Figure 4.50 to Figure 4.60 and Figure 4.61 to Figure 4.65, for OPSC
beam specimens and NWC beam specimens respectively. The failure loads of OPSC
and NWC beam specimens are presented in Table 4.9 and Table 4.10 respectively.
Detailed discussions on these observations are presented in the Sections 4.3.1 to
4.3.3 as follow.
4.3.1 Overall failure behaviour of OPSC and NWC beam specimens
It is observed from tests that, all the sixteen beam specimens cast with shear
reinforcement failed in mode of shear compression failure, which is evident and
foreseeable during failure. The systematically details of observations for the beams
with shear reinforcement from the flexural cracks initiation until the occurrence of
the shear failure are explained herein.
For all beam specimens, the formation of flexural cracks occurred prior to formation
of shear cracks during testing, which is observed to initiate from mid-span bottom

125
fibre of the specimens, this has been as expected, to coincide with the maximum
tensile stress. These appearances of flexural cracks were first noted from 28% to 37%
of the ultimate failure loads for OPSC beam specimens (see Table 4.11), and from
36% to 46% for NWC beam specimens (see Table 4.12). The load-deflection curves
are presented from Figure 4.66 to Figure 4.68 for OPSC beams and Figure 4.69 for
NWC beams. However, it was observed that the inferred cracking load deflection
curves occurred from 17% to 30% of the ultimate loads for OPSC beam specimens
(see Table 4.11) and from 28% to 38% of the ultimate loads for NWC beam
specimens (see Table 4.12). It is believed that the discrepancies noted between the
observed and the inferred cracking loads were due to the formation of micro-cracks,
which could not have been detected by the naked eye but can be visibly observed
through the change of inclination angle on the load deflection curves.
Further analysis on the test results revealed that the formations of flexural cracks did
not occur under loads having similar percentages to their ultimate failure loads.
These discrepancies derived from the fact that the percentages for formation of
flexural cracks were determined with respect to the ultimate shear failure loads (Vult)
instead of their flexural failure loads. That is, specimens failed in shear at higher
ultimate failure loads have been casted with high flexural resistances (such as
Specimens 5A, 5B, 5C), thus, appeared to have their flexural cracks formed at loads
that are close to their ultimate shear failure loads, hence resulted in the high
percentages. On the other hand, specimens failed in shear at lower ultimate failure
loads have been casted with lower flexural resistance (such as specimens 3A, 3B and
3C), hence, appeared to have their flexural cracks formed at loads that are further
away from the ultimate shear failure loads, hence resulting in the low percentages.

126
The implication is that the formations of flexural cracks are in fact independent to the
formation of shear failure mechanism.
As the applied loads were further increased, the formation of shear cracks were
observed to have appeared at the neutral axis of shear span vicinity, where shear
reinforcement are provided. The shear cracks were observed to occur from 53% to
68% of the ultimate failure loads for OPSC beam specimens (see Table 4.11), and
from 49% to 54% of the ultimate failure loads for NWC beam specimens (see Table
4.12). These inconsistencies deduced from the fact that, specimens which failed in
shear at higher ultimate failure loads were loaded with span distance closer to the
supports (such as specimens 4D, 4E, and NWCD), thus, the formation of shear cracks
were observed to appear at loads that are close to their ultimate shear failure loads.
On the other hand, specimens failed in shear at lower ultimate failure loads were
loaded with span distances further from the supports (such as Specimens 4A, 4B, 4C,
3A, 3B, 3C, 5A, 5B, 5C, NWCA, NWCB, NWCC, and NWCE), therefore, the formation of
shear cracks were observed to appear at loads that are far from their ultimate shear
failure loads. The inference is that the formations of shear cracks are in fact
subjected to the loading position, where higher percentage of shear cracks formation
were observed in beams tested with low a/d ratio compared to high a/d ratio. After
the formation of initial shear cracks at neutral axis section of the shear span vicinity,
it was observed that the diagonal shear cracks propagated diagonally towards the
loading positions and supports, respectively, which was as expected, to coincide with
the maximum shear stresses where shear compression finally took place. It was
observed that concrete crushes at the compression region of the beam where
loading was applied. All specimens were observed to remain intact even after failure
as the inclusion of shear reinforcement in the specimens would have formed a cage

127
with the presence of anchorage at both end of the beam, hence, keeping the
specimens to be intact (see Figure 4.50 to Figure 4.65).
In view of crack mechanism, beams with shear reinforcements exhibit similar
observations to those of beams without shear reinforcement (See Section 4.2.1). For
OPSC specimens with shear reinforcement, two types of crack mechanisms were
observed (see Figure 4.70 and 4.71) at the diagonal shear cracks: (1) cracks sheared
through the OPS aggregates and (2) bond failure between cement paste and OPS
aggregates in concrete (see Figure 4.37 for illustrations). Either one of these two
cracking mechanisms observed from OPSC specimens depend on the natural
alignment of OPS aggregates along shear cracks: (1) crack sheared through the OPS
aggregates when OPS is inclined perpendicular to the diagonal shear crack and (2)
bond failure between cement paste and OPS aggregates in concrete when OPS is
inclined parallel to the diagonal shear cracks, as mentioned in Section 4.2.1 (See also
Figure 4.37 for illustrations). Whilst for NWC specimens, the crack mechanism
occurred through the cement paste (See Figure 4.70 and 4.71), which the shear
cracks was observed to occur in between the normal aggregates (see also Figure 4.70
and 4.71).
4.3.2 Central deflection
The central deflection of all beam specimens were recorded after every increment of
applied load. For every beam specimen cast with shear reinforcement, the load-
deflection curves are plotted and presented in Figure 4.66 to Figure 4.68, and Figure
4.69, for OPSC beam specimens and NWC beam specimens, respectively.

128
In general, the curves exhibit similar load deflection behaviour among the specimens,
that is, a linear elastic behaviour up to approximately half of the ultimate failure
loads, and subsequently, the rate of increment in the applied loads decreases until
failure occurs. The increases in the rate of deflection were due to the formation of
flexural cracks at the mid-span bottom tension surface of the beam specimens.
A comparison between the actual cracking loads inferred from the load-deflection
curves and the observed cracking loads are presented in Table 4.11 and Table 4.12
for OPSC beam specimens and NWC beam specimens, respectively. From these
comparisons, it is observed that the inferred cracking loads were 2% to 12% and 3%
to 18% lower than the observed flexural cracking loads for OPSC beam specimens
and NWC beam specimens, respectively. It is believed that these discrepancies
between the observed and the inferred cracking loads were due to the formation of
flexural micro-cracks that could not have been detected by the naked eye but can be
clearly observed via the change of inclination angle on the load deflection curves.
4.3.3 Ultimate Failure Loads
The ultimate failure loads of beam specimens were derived from the last recorded
loads prior to failure. For beam specimens cast with shear reinforcement, the
ultimate failure loads of specimens cast from OPSC and NWC are summarized and
presented in Table 4.9 and Table 4.10, respectively. Among the sixteen beam
specimens, eleven were casted from Oil Palm kernel Shell (OPSC) while the remaining
five were casted from Normal aggregate Concrete (NWC).
Among the eleven OPSC beam specimens, three variables were considered in the
tests (see Table 4.9); shear reinforcement spacing (SR), inclination angle of shear

129
cracks (PL) and concrete strength (CG). Of which, nine of the eleven OPSC beam
specimens derived with results that addresses for more than one variables
considered (see Table 4.9).
On the other hand, three identical variables were also considered among the five
NWC beam specimens (see Table 4.10; shear reinforcement spacing (SR), inclination
angle of shear cracks (PL), and concrete strength (CG). These NWC beams were
designed and tested to form the basis (control samples) for the current research
investigation.
In general, it is apparent that the load carrying capacities of both the OPSC and NWC
beam specimens (cast with shear reinforcement) are influenced by the variables
considered. Effects of the variables considered and their comparisons with control
specimens are described in detail from Section 4.3.3.1 to 4.3.3.3.
4.3.3.1 Shear reinforcement spacing
Among the eleven OPSC beam specimens casted with shear reinforcement, nine
beam specimens (see Table 4.13) were cast and tested to assess the effect of shear
reinforcement spacing, s to the ultimate shear resistance. These nine OPSC beam
specimens have been further subcategorized into: SR-CG26, SR-CG32 and SR-CG35;
to take account for three concrete cube compressive strengths. The three concrete
cube compressive strengths were: 25.8 N/mm2 (category SR-CG26), 31.9 N/mm2
(category SR-CG32) and 34.6 N/mm2 (category SR-CG35).
From the test results shown in Figure 4.72, it is apparent that the ultimate shear
resistance increases with the reduction of shear reinforcement spacing, s. Such

130
observations are to be expected, because when the shear reinforcement spacing
reduces, the shear reinforcement ratio increases, and, hence, the shear force carried
by the dowel action of shear reinforcement increases. That is, comparison to
Specimen 3A from Figure 4.50, Specimen 5A from Figures 4.56 exhibited lower crack
width which allowed for a better aggregate interlocking to be mobilised between the
crack interfaces, and as a result, higher ultimate shear resistance was mobilised.
Comparisons with NWC beam specimens indicate that the ultimate shear resistance
of OPSC beams are higher than the NWC beams for all the shear reinforcement
spacing: 120 mm, 80 mm and 60 mm (see Figure 4.73). That is, the shear resistance
of OPSC beam specimens (3B, 4B and 5B) are 3%, 10% and 7% higher compared to
the NWC beam specimens (NWCC, NWCB and NWCA) for shear reinforcement
spacing of 120 mm, 80 mm and 60 mm, respectively. Such discrepancy is believed to
be attributed to the rougher shear surface observed from the OPSC beam specimen
compared to NWC beam specimen(see Figure 4.70 and 4.71), where, a higher
aggregate interlocking could be provided and resulted in higher shear resistance.
4.3.3.2 Inclination angle of shear cracks
Among the eleven OPSC beams casted with shear reinforcement, three specimens
(see Table 4.9) were cast and tested to evaluate the effect of inclination angle of
shear cracks ϴ (deg) to the ultimate shear resistance. These specimens have been
categorized as PL (see Table 4.14). In general, it is apparent that from the
observations made from tests indicate the ultimate shear resistance increases as the
inclination angle of shear cracks (ϴ) increases (see Figure 4.74). Such observations
are to be expected due to the fact that the shear span would have decreased as the

131
inclination angle of shear cracks increases, which in turn, allowed for a better
aggregate interlocking to be mobilised, and hence, resulting in a higher shear
resistance.
In comparison to NWC beam specimens, the test observations reveal that the rate of
increase in the ultimate shear resistance of OPSC beam specimens as a result of the
increases in the inclination angle of shear cracks, ϴ, are less pronounce (see Figure
4.75). That is, the shear resistance of NWC specimen (NWCB to NWCD) increased by
14% as the inclination angle of shear cracks,ϴ, increased from 39.8 degree to 51.8
degree, while the shear resistance of OPSC specimen (4B to 4E) increased only by
11% for the same increase in the inclination angle in shear cracks. However, in all
cases, the OPSC beam specimens exhibited higher ultimate shear resistance
compared to NWC specimens, that is, at inclination angle, ϴ = 39.8 degree, the shear
strength achieved by OPSC specimen (4B) is 11% higher than NWC specimen (NWCB)
whilst at ϴ = 51 degree, the shear strength achieved by OPSC specimen (4E) is 4%
higher than NWC specimen (NWCD). Such discrepancy is believed to be attributed to
the rougher shear surface observed from the OPSC specimen (see Figure 4.70 and
4.71), which in turn, provided with a higher aggregate interlocking, and as a result, a
higher shear resistance were achieved.
4.3.3.3 Concrete strength
Among the eleven OPSC beam specimens casted with shear reinforcements, nine
specimens (see Table 4.15) were casted and tested to evaluate the effect of concrete
cube compressive strength (fcu) to the ultimate shear resistance. These specimens

132
have been further subcategorised into: CG-S60, CG-S80 and CG-S120 to account for
three shear reinforcement spacing: 60 mm, 80 mm and 120 mm, respectively.
In general, observations from test indicate that the ultimate shear resistance
increases with the concrete cube compressive strength (see Figure 4.76). Such
observations are to be expected due to the fact that as the concrete compressive
strength increases, the concrete tensile strength would also be increased, which in
turn, the bond between the cement paste and OPS aggregate increases and hence,
delayed the rupture of concrete and resulting in higher shear resistance. In addition,
in view of shear transfer mechanism, the increment of concrete strength would
enhance the dowel capacity of the beams and thus, smaller shear cracks were
observed in OPSC beams (see Specimen 4A in figure 4.53 in comparison to Specimen
3A in Figure 3.50). Hence, this leads to higher shear resistance from the aggregate
interlock capacity and compression zone capacity and resulting in a higher shear
resistance of OPSC beams.
Comparisons with the NWC beam specimens (NWCB and NWCE) reveal that the
increase in ultimate shear resistance of OPSC beam specimens (from 4B and 4C) as
the concrete compressive strength increased from 31 N/mm2 to 35 N/mm2 are more
pronounce (see Figure 4.77). That is, the ultimate shear resistance of OPSC beam
specimens (4B and 4C) increased by 15.19% as the concrete strength increases, while
the shear resistance of NWC beam specimens (NWCB and NWCC) increased only by
13.33%. Such discrepancies are believed to be attributed to the rougher shear
surface observed from the OPSC specimen (see Figure 4.70 and 4.71), which in turn,
provide with higher lower aggregate interlocking ability, thus, a higher ultimate shear
resistance would be mobilised.

133
4.4 Summary
For OPSC beam specimens without shear reinforcement, three distinct shear failure
mechanisms have been observed from the tests, which are the shear compression
mechanism, the diagonal tension mechanism and the shear mechanism. Whilst for
NWC beam specimens without shear reinforcement, two distinct shear failure
mechanisms have been observed from the tests, which are the shear compression
mechanism and the shear mechanism.
The shear compression mechanism is observed for both OPSC and NWC beam
specimens tested at shear span to effective depth ratio, a/d < 2.5, which the
formation of shear cracks was initiated from the support and propagated through the
shear span towards the loading position before ultimate failure occurred by crushing
of concrete at the compression zone.
The diagonal tension mechanism is observed for OPSC beam specimens as there are
two specimens casted with longitudinal steel ratio, ρ = 0.75% and tested at shear
span to effective depth ratio, a/d ≥ 2.5. The formation of shear cracks was initiated
from the flexural cracks at the bottom of the beam and propagated towards the
loading position prior to failure by splitting of the beam occurred along the
longitudinal tensile steel reinforcement towards the support.
The shear mechanism is observed for both OPSC and NWC beam specimens casted
with longitudinal steel ratio, ρ ≥ 1.08% and tested at shear span to effective depth
ratio, a/d < 2.5. The formation of shear cracks is observed to initiate from the support
and propagated through the shear span to the loading position before ultimate
failure occurred by splitting of the beam occurred along the longitudinal tensile steel
reinforcement towards the support.

134
Whilst for OPSC and NWC beam specimens with shear reinforcement, shear
compression failure mechanism have been observed from the tests, which shear
cracks appeared at the Neutral Axis of the beam and subsequently, propagated
towards the support and loading position, respectively, before shear failure occurred
by crushing of concrete at the compression zone at the loading position. However, it
is observed that the beam remained intact due to the presence of shear
reinforcements in the beams, which formed a cage to prevent the beam from
separated.
Comparisons were carried out on the ultimate shear failure capacities and the shear
failure mechanisms between OPSC beams and NWC beams cast with and without
shear reinforcement, respectively. It was found that the ultimate shear strength of
OPSC beams and NWC beams is comparable for the parameters: effective depth (for
beams without shear reinforcement), and shear reinforcement spacing and
inclination angle of shear cracks (for beams with shear reinforcements). However,
discrepancies were observed in ultimate shear strength between the OPSC beams
and NWC beams for the parameters: span to depth ratio, longitudinal steel ratio and
concrete strength (for beams without shear reinforcement) and concrete strength
(for beams with shear reinforcement).
In view on the theoretical models and the design models for OPSC beams cast with
and without shear reinforcement, it was undefined whether the current theoretical
models based upon plastic approach and the design models: BS8110 Code and
Eurocode 2 based upon upper bound approach are applicable for the ultimate shear
strength predictions of OPSC beams. Hence, detailed studies were carried out on
OPSC beam with and without shear reinforcement, respectively in Chapter 5 for
theoretical plastic models, Chapter 6 for BS8110 design models and Chapter 7 for

135
Eurocode 2 (EC2) design model. Subsequently, this results in other contributions in
this research, where a model has been proposed each for OPSC beam with and
without shear reinforcement in Chapter 5, 6, and 7, respectively.

136
Table 4.1 Test results of OPSC beam specimens cast without shear reinforcement.
Specimen No.
Section width, b (mm)
Section effective
depth, d (mm)
Shear span to
effective depth ratio, a/d
Cube strength, fcu
(N/mm2)
Steel ratio, ρ (%)
=
Ultimate Failure Load VOPSC
(kN)
Variables
considered
10A 105 170 2.50 30.05 0.75 18.95 LR, CS S1 105 170 2.50 34.82 0.75 21.05 LR, CS
12A 105 169 1.00 31.03 1.08 54.73 SP, LR 12B 105 169 1.50 31.03 1.08 40.00 SP 12C 105 169 2.50 31.03 1.08 27.37 SP, LR, CS 12D 105 169 3.00 31.03 1.08 25.26 SP, LR 12E 105 169 2.50 39.20 1.08 31.58 CS 12F 105 82 2.89 32.46 1.91 26.31 HT 16A 105 167 1.00 26.14 1.92 56.80 SP, LR 16B 105 167 1.50 26.14 1.92 42.10 SP, LR 16C 105 167 2.50 26.14 1.92 29.50 SP, LR, CS 16D 105 167 3.00 26.14 1.92 26.32 SP, LR 16E 105 167 2.50 32.46 1.92 35.79 LR, HT 20A 105 165 1.00 24.23 2.99 73.68 SP,LR 20B 105 165 1.50 24.23 2.99 52.63 SP, LR 20C 105 165 2.50 24.23 2.99 33.68 SP, LR, CS 20D 105 165 3.00 24.23 2.99 27.37 SP, LR 20E 105 165 2.50 28.00 2.99 35.79 LR, CS AD1 105 167 1.00 32.00 1.92 58.19 SP, LR AD2 105 167 3.00 32.00 1.92 32.33 SP, LR F1 105 167 2.50 32.00 1.92 32.67 SP, LR, CS F2 105 167 2.50 40.10 1.92 47.41 CS H2 105 278 2.36 32.46 1.91 52.53 HT S2 105 167 2.50 35.70 1.92 36.64 CS
Table 4.2 Test results of NWC beams cast without shear reinforcement.
Specimen No.
Section width
b (mm)
Overall section depth
h (mm)
Shear span to
effective depth Ratio a/d
Cube compressive
strength fcu (N/mm
2)
Steel ratio ρ (%)
=
NWC Ultimate Failure Load VNWC
(kN)
Compared
with
OPSC
specimen
Variable
considered
NWC1 105 200 1 33.00 1.92 71.57 AD1
SP
NWC2 105 200 2.5 33.00 1.92 35.79 F1
SP, CS, HT
NWC3 105 200 2.5 29.00 1.92 33.69 16C LR, CS
NWC4 105 200 2.5 29.00 2.99 52.63 20E LR
NWC5 105 113 2.5 33.00 1.91 25.26 12F HT

137
Table 4.3 Cracking load of OPSC beam specimens cast without shear reinforcement.
Specimen No.
Vultimate (kN)
Vcrack
(kN)
Inferred
Vflexural crack
(kN)
Observed
Vshear crack (kN)
Observed
10A 18.95 2.11 11%
6.32 33%
10.53 56%
S1 21.05 2.11 10%
4.21 20%
12.63 60%
12A 54.73 10.53 19%
16.84 31%
33.68 62%
12B 40.00 6.32 16%
12.63 32%
31.58 79%
12C 27.37 4.21 15%
8.42 31%
5.26 92%
12D 25.26 10.53 42%
16.84 67%
23.16 92%
12E 31.58 8.42 27%
10.53 33%
25.26 80%
12F 26.31 10.53 40%
11.58 44%
12.63 48%
16A 56.80 10.53 19%
14.74 26%
35.77 63%
16B 42.10 18.95 45%
25.25 60%
33.68 80%
16C 29.50 6.32 21%
8.42 29%
21.05 71%
16D 26.32 6.32 24%
8.42 32%
25.26 97%
16E 35.79 8.42 24%
10.53 29%
31.58 88%
20A 61.05 21.05 35%
- 48.15 79%
20B 52.63 27.37 52%
40.00 76%
31.58 60%
20C 33.68 4.21 13%
12.63 38%
27.37 81%
20D 27.37 6.32 23%
12.63 46%
25.26 92%
20E 35.79 17.74 50%
- 31.58 88%
AD1 58.19 10.53 18%
14.74 25%
37.89 65%
AD2 32.33 21.05 65%
25.24 78%
27.37 85%
F1 32.67 8.42 26%
12.63 39%
25.26 77%
F2 47.41 8.42 18%
12.63 27%
27.37 58%
H2 52.53 25.26 48%
27.37 52%
29.47 56%
S2 36.64 6.32 17%
12.63 34%
33.68 92%

138
Table 4.4 Cracking load of NWC beam specimens cast without shear reinforcement.
Specimen No. Vultimate (kN)
Vrack
(kN) Inferred
Vflexural crack
(kN) Observed
Vshear crack (kN)
Observed
NWC1 71.57 42.1 59%
44.21 62%
48.42 68%
NWC2 35.79 8.42 24%
12.63 35%
25.26 71%
NWC3 33.69 14.74 44%
16.84 50%
23.16 69%
NWC4 52.63 6.32 12%
10.53 20%
31.58 60%
NWC5 25.26 6.32 25%
8.42 33%
16.84 66%
Table 4.5 Span to effective depth ratio, a/d for OPSC beam specimens cast without shear reinforcement.
Category SP
Specimen no.
Shear span to effective depth ratio,
a/d
Concrete strength
fcu (N/mm
2)
Steel ratio ρ (%)
=
Ultimate Failure Load
VOPSC (kN)
VOPSC b d
(N/mm2)
SP-LR12B
12A 1.0 31.03 1.08 73.68 4.15
12B 1.5 31.03 1.08 40.00 2.25
12C 2.5 31.03 1.08 27.37 1.54
12D 3.0 31.03 1.08 25.26 1.42
SP-LR16A
AD18 1.0 32.00 1.92 58.19 3.32
F1 2.5 32.38 1.92 32.67 1.86
AD28 3.0 32.00 1.92 32.33 1.84
SP-LR16B
16A 1.0 26.14 1.92 56.80 3.24
16B 1.5 26.14 1.92 42.10 2.40
16C 2.5 26.14 1.92 29.50 1.68
16D 3.0 26.14 1.92 26.32 1.50
SP-LR20A
20A 1.0 24.23 2.99 73.68 4.25
20B 1.5 24.23 2.99 52.63 3.04
20C 2.5 24.23 2.99 33.68 1.94
20D 3.0 24.23 2.99 27.37 1.58

139
Table 4.6 Longitudinal steel reinforcement, ρ for OPSC beam specimens cast without shear reinforcement.
Category LR
Specimen no.
Shear span to effective depth ratio,
a/d
Concrete strength
fcu (N/mm
2)
Steel ratio ρ (%)
=
Ultimate Failure Load VOPSC (kN)
VOPSC b d
(N/mm2)
LR-SP1A
20A 1.0 24.23 2.99 73.68 4.25
16A 1.0 26.14 1.92 56.80 3.24
LR-SP1B
12A 1.0 31.03 1.08 54.73 3.08
AD1 1.0 32.00 1.92 58.19 3.32
LR-SP1.5A
20B 1.5 24.23 2.99 52.63 3.04
16B 1.5 26.14 1.92 42.10 2.40
LR-SP2.5A
20C 2.5 24.23 2.99 33.68 1.94
16C 2.5 26.14 1.92 29.50 1.68
LR-SP2.5B
10A 2.5 30.05 0.75 18.95 1.06
S1 2.5 34.82 1.08 21.05 1.19
12C 2.5 31.03 1.08 27.37 1.54
16E 2.5 35.70 1.92 35.79 2.04
F1 2.5 32.38 1.92 32.67 1.86
20E 2.5 24.23 2.99 35.79 2.07
LR-SP3A
20D 3.0 26.14 2.99 27.37 1.58
16D 3.0 31.03 1.92 26.32 1.50
LR-SP3B
12D 3.0 32.00 1.08 25.26 1.42
AD2 3.0 24.23 1.92 32.33 1.84
Table 4.7 Cube concrete strength, fcu for OPSC beam specimens cast without shear reinforcement.
Category CS
Specimen no.
Shear span to effective depth ratio,
a/d
Concrete strength
fcu (N/mm
2)
Steel ratio ρ (%)
=
Ultimate Failure Load
VOPSC (kN)
VOPSC b d
(N/mm2)
CS-LR10
10A 2.5 30.05 0.75 18.95 1.06
S1 2.5 34.83 0.75 21.05 1.18
CS-LR12
12C 2.5 31.03 1.08 27.37 1.54
12E 2.5 39.20 1.08 31.58 1.78
CS-LR16
16C 2.5 26.14 1.92 29.50 1.68
F18 2.5 32.38 1.92 32.67 1.86
S2 2.5 35.70 1.92 36.64 2.09
F28 2.5 40.10 1.92 47.41 2.70
CS-LR20
20C 2.5 24.23 2.99 33.68 1.94
20E 2.5 28.00 2.99 35.79 2.07

140
Table 4.8 Overall sectional depth, h for OPSC beam specimens cast without shear reinforcement.
Category HT
Specimen no.
Overall section depth,
h (mm)
Shear span to overall height ratio, a/h
Concrete strength
fcu
(N/mm2)
Reinforcement ratio ρ (%)
=
Ultimate Failure Load VOPSC
(kN)
VOPSC b d
(N/mm2)
HT
12F 113 2.10 32.46 1.91 26.31 3.06
16E 200 2.10 32.46 1.92 35.79 2.04
H2 313 2.09 32.46 1.92 52.53 1.80
Table 4.9 Test results of OPSC beam specimens cast with shear reinforcement.
Specimen no.
Cube concrete strength, fcu
(N/mm2)
Shear reinforcement
spacing, s (mm)
Angle,
ϴ (degree)
Ultimate Failure Load
VOPSC (kN)
Assigned to variable
3A 25.79 120 39.8 75.78 CG, SR
3B 31.93 120 39.8 88.41 CG, SR
3C 34.60 120 39.8 92.62 CG, SR
4A 25.79 80 39.8 79.99 CG, SR
4B 31.93 80 39.8 94.73 CG, SR, PL
4C 34.60 80 39.8 107.36 CG, SR
5A 25.79 60 39.8 88.41 CG, SR
5B 31.93 60 39.8 107.36 CG, SR
5C 34.60 60 39.8 119.99 CG, SR
4D 30.15 80 45.0 101.04 PL
4E 30.15 80 51.3 105.25 PL
Table 4.10 Tests results of NWC beam specimens cast with shear reinforcement.
Specimen no.
Cube Concrete
strength, fcu
(N/mm2)
Shear reinforcement
spacing, s (mm)
Angle, ϴ (degree)
Ultimate Failure Load
VNWC (kN)
Compared with OPSC specimen
Variable considered
NWCA 30.61 120 39.8 82.10 3B SR
NWCB 30.61 80 39.8 88.41 4B CG, SR, PL
NWCC 30.61 60 39.8 99.99 5B SR
NWCD 30.61 80 51.3 101.04 4E PL
NWCE 35.00 80 39.8 98.94 4C CG

141
Table 4.11 Cracking load of OPSC beam specimens cast with shear reinforcement.
Specimen no.
Vultimate (kN)
Vcrack
(kN) Inferred
Vflexural crack (kN)
Observed
Vshear crack (kN)
Observed
3A 75.78 12.63 17%
21.05 28%
42.10 56%
3B 88.41 18.95 21%
27.37 31%
54.73 62%
3C 92.62 16.84 18%
25.26 27%
48.42 52%
4A 79.99 24.21 30%
25.26 32%
46.31 58%
4B 94.73 25.26 27%
29.47 31%
54.73 58%
4C 107.36 29.47 27%
31.58 29%
56.84 53%
5A 88.41 25.26 28%
29.47 33%
56.63 64%
5B 107.36 27.37 25%
33.68 31%
56.84 53%
5C 119.99 23.16 20%
37.89 32%
63.15 53%
4D 101.04 27.37 27%
31.58 31%
67.36 67%
4E 105.25 31.58 30%
37.89 37%
71.57 68%
Table 4.12 Cracking load of NWC beam specimens cast with shear reinforcement.
Specimen no.
Vultimate (kN)
Vcrack
(kN) Inferred
Vflexural crack (kN)
Observed
Vshear crack (kN)
Observed
NWCA 82.10 23.16 28%
37.89 46%
40.00 49%
NWCB 88.41 29.47 33%
31.58 36%
46.31 52%
NWCC 99.99 37.89 38%
44.21 44%
50.52 51%
NWCD 101.04 35.79 35%
- 54.72 54%
NWCE 98.94 37.89 38%
44.21 45%
50.52 51%

142
Table 4.13 Shear reinforcement spacing, s for OPSC beam specimens cast with shear reinforcement.
Category SR
Specimen no.
Spacing of shear
reinforcement, s (mm)
Cube concrete
strength, fcu
(N/mm2)
Angle, ϴ
(deg)
Ultimate Failure Load VOPSC (kN)
VOPSC b d
(N/mm2)
SR-CG26 5A 60 25.79 39.8 88.41 5.36
4A 80 25.79 39.8 79.99 4.48
3A 120 25.79 39.8 75.78 4.25
SR-CG32 5B 60 31.93 39.8 107.36 6.51
4B 80 31.93 39.8 94.73 5.31
3B 120 31.93 39.8 88.41 4.95
SR-CG35 5C 60 34.60 39.8 119.99 7.28
4C 80 34.60 39.8 107.36 6.01
3C 120 34.60 39.8 92.62 5.19
Table 4.14 Inclination angle of shear cracks, ϴ for OPSC beam specimens cast with shear reinforcement.
Category PL
Specimen no.
Cube concrete strength, fcu
(N/mm2)
Shear span, a (mm)
Angle, ϴ
(deg)
Ultimate Failure Load
VOPSC-S (kN)
VOPSC-S b d
(N/mm2)
PL 4B 31.93 240 39.8 94.73 5.31
4D 30.15 200 45.0 101.04 5.66
4E 30.15 160 51.3 105.25 5.90

143
Table 4.15 Cube concrete strength, fcu (N/mm2) for OPSC beam specimens cast with shear reinforcement.
Category CG
Specimen no.
Spacing of shear
reinforcement, s (mm)
Concrete strength,
fcu
(N/mm2)
Angle, ϴ (deg)
Ultimate Failure Load VOPSC (kN)
VOPSC b d
(N/mm2)
CG-S60
5A 60 25.79 39.8 88.41
107.36
5.36
5B 60 31.93 39.8 107.36 6.51
5C 60 34.60 39.8 119.99 7.28
CG-S80
4A 80 25.79 39.8 79.99 4.48
4B 80 31.93 39.8 94.73 5.31
4C 80 34.60 39.8 107.36 6.01
CG-S120
3A 120 25.79 39.8 75.78 4.25
3B 120 31.93 39.8 88.41 4.95
3C 120 34.60 39.8 92.62 5.19

144
Figure 4.1 Failure mechanism of OPSC beam cast without shear reinforcement,
10A.
Figure 4.2 Failure mechanism of OPSC beam cast without shear reinforcement,
S1.
Figure 4.3 Failure mechanism of OPSC beam cast without shear reinforcement,
12A.
Figure 4.4 Failure mechanism of OPSC beam cast without shear reinforcement,
12B.
Figure 4.5 Failure mechanism of OPSC beam cast without shear reinforcement,
12C.

145
Figure 4.6 Failure mechanism of OPSC beam cast without shear reinforcement,
12D.
Figure 4.7 Failure mechanism of OPSC beam cast without shear reinforcement,
12E.
Figure 4.8 Failure mechanism of OPSC beam cast without shear reinforcement,
12F.
Figure 4.9 Failure mechanism of OPSC beam cast without shear reinforcement,
16A.
Figure 4.10 Failure mechanism of OPSC beam cast without shear
reinforcement, 16B.

146
Figure 4.11 Failure mechanism of OPSC beam cast without shear reinforcement,
16C.
Figure 4.12 Failure mechanism of OPSC beam cast without shear reinforcement,
16D.
Figure 4.13 Failure mechanism of OPSC beam cast without shear reinforcement,
16E.
Figure 4.14 Failure mechanism of OPSC beam cast without shear reinforcement,
20A.
Figure 4.15 Failure mechanism of OPSC beam cast without shear reinforcement,
20B.

147
Figure 4.16 Failure mechanism of OPSC beam cast without shear reinforcement,
20C.
Figure 4.17 Failure mechanism of OPSC beam cast without shear reinforcement,
20D.
Figure 4.18 Failure mechanism of OPSC beam cast without shear reinforcement,
20E.
Figure 4.19 Failure mechanism of OPSC beam cast without shear reinforcement,
AD1.
Figure 4.20 Failure mechanism of OPSC beam cast without shear reinforcement,
AD2.

148
Figure 4.21 Failure mechanism of OPSC beam cast without shear reinforcement,
F1.
Figure 4.22 Failure mechanism of OPSC beam cast without shear
reinforcement, F2.
Figure 4.23 Failure mechanism of OPSC beam cast without shear reinforcement,
H2.
Figure 4.24 Failure mechanism of OPSC beam cast without shear reinforcement,
S2.
Figure 4.25 Failure mechanism of NWC beam cast without shear reinforcement, NWC1.

149
Figure 4.26 Failure mechanism of NWC beam cast without shear
reinforcement, NWC2.
Figure 4.27 Failure mechanism of NWC beam cast without shear reinforcement,
NWC3.
Figure 4.28 Failure mechanism of NWC beam cast without shear reinforcement,
NWC4.
Figure 4.29 Failure mechanism of NWC beam cast without shear reinforcement,
NWC5.

150
Figure 4.30 Load (kN) vs Central deflection (mm) for OPSC beam specimens cast without shear reinforcement of a/d = 1 and ρ = 1.08%, 1.92% and
2.99%.
Figure 4.31 Load (kN) vs Central deflection (mm) for OPSC beam specimens cast without shear reinforcement of a/d = 1.5 and ρ = 1.08%, 1.92%
and 2.99%.

151
Figure 4.32 Load (kN) vs Central deflection (mm) for OPSC beam specimens cast without shear reinforcement of a/d = 2.5 and ρ =1.92%.
Figure 4.33 Load (kN) vs Central deflection (mm) for OPSC beam specimens cast without shear reinforcement of a/d = 2.5 and ρ = 0.75%, 1.08%,
and 2.99%.

152
Figure 4.34 Load (kN) vs Central deflection (mm) for OPSC beam specimens cast without shear reinforcement of a/d = 3 and ρ = 1.08%, 1.92% and
2.99%.
Figure 4.35 Load (kN) vs Central deflection (mm) for NWC beam specimens cast without shear reinforcement.

153
Figure 4.36 Surface texture of diagonal shear cracks interface of OPSC and NWC beams cast without shear reinforcement (Sectional View).
Figure 4.37 Diagonal shear cracks of OPSC and NWC beams cast without shear reinforcement (Side view).
Shear cracks passed through the OPS aggregate when OPS aggregate is perpendicular to the breakage path.
Shear cracks occurred between cement paste and OPS aggregate when OPS aggregate is parallel to the breakage path.
OPSC NWC
Shear cracks occurred between the cement paste and gravel aggregates.

154
Figure 4.38 VOPSC (kN) vs Shear span to effective depth ratio, a/d for OPSC beam specimens cast without shear reinforcement.
Figure 4.39 VTest (kN) vs Shear span to effective depth ratio, a/d for OPSC and NWC beam specimens cast without shear reinforcement.

155
Figure 4.40 Surface texture of diagonal shear interface of OPSC beams cast without shear reinforcement tested at a/d=1.5 and a/d=2.5 (Sectional view).
Smooth surface of sheared plane were observed for OPSC beams with a/d <2.5.
Rough surface of sheared plane were observed for OPSC beams with a/d=2.5.

156
Figure 4.41 Surface texture of diagonal shear interface of OPSC and NWC beams cast without shear reinforcement tested at a/d ratio = 1 (Sectional view and Isometric view).
NWC beam tested at a/d =1, Rougher surface texture of
gravel aggregates
OPSC beam tested at a/d =1, Smoother surface texture of
OPS aggregates

157
Figure 4.42 Surface texture of diagonal shear interface of OPSC and NWC beams cast without shear reinforcement tested at a/d ratio = 2.5 (Sectional view and Isometric view).
OPSC beam tested at a/d = 2.5, Rougher surface texture of OPS
aggregates
NWC beam tested at a/d =2.5, Smoother surface texture of
gravel aggregates

158
Figure 4.43 VOPSC (kN) vs Longitudinal steel ratio, ρ (%) for OPSC beam specimens cast without shear reinforcement.
Figure 4.44 VTest (kN) vs Longitudinal steel ratio, ρ (%) for OPSC and NWC beam specimens cast without shear reinforcement.

159
Figure 4.45 vOPSC (N/mm2) vs Concrete strength, fcu (N/mm2) for OPSC beam specimens cast without shear reinforcement.
Figure 4.46 VTest (kN) vs Concrete strength, fcu (N/mm2) for OPSC and NWC beam specimens cast without shear reinforcement.

160
Figure 4.47 VOPSC (kN) vs Overall section depth, h (mm) of OPSC beam specimens without shear reinforcement.
Figure 4.48 vOPSC (N/mm2) vs Overall section depth, h (mm) of OPSC beam specimens without shear reinforcements.

161
Figure 4.49 VTest (kN) vs Overall section depth, h (mm) for OPSC and NWC beam specimens cast without shear reinforcement.
Figure 4.50 Failure mechanisms of OPSC beam cast with shear reinforcements,
3A.
Figure 4.51 Failure mechanisms of OPSC beam cast with shear reinforcements,
3B.
Figure 4.52 Failure mechanisms of OPSC beam cast with shear reinforcements,
3C.

162
Figure 4.53 Failure mechanisms of OPSC beam cast with shear reinforcement,
4A.
Figure 4.54 Failure mechanisms of OPSC beam cast with shear reinforcement,
4B.
Figure 4.55 Failure mechanisms of OPSC beam cast with shear reinforcement,
4C.
Figure 4.56 Failure mechanisms of OPSC beam cast with shear reinforcement,
5A.
Figure 4.57 Failure mechanisms of OPSC beam cast with shear reinforcement,
5B.

163
Figure 4.58 Failure mechanisms of OPSC beam cast with shear reinforcement,
5C.
Figure 4.59 Failure mechanisms of OPSC beam cast with shear reinforcement,
4D.
Figure 4.60 Failure mechanisms of OPSC beam cast with shear reinforcement,
4E.
Figure 4.61 Failure mechanisms of NWC beam cast with shear reinforcement,
NWCA.
Figure 4.62 Failure mechanisms of NWC beam cast with shear reinforcement,
NWCB.

164
Figure 4.63 Failure mechanisms of NWC beam cast with shear reinforcement,
NWCC.
Figure 4.64 Failure mechanisms of NWC beam cast with shear reinforcement,
NWCD.
Figure 4.65 Failure mechanisms of NWC beam cast with shear reinforcement,
NWCE.

165
Figure 4.66 Load (kN) vs Central deflection (mm) for OPSC beam specimens with shear reinforcement of shear reinforcement spacing = 120 mm.
Figure 4.67 Load (kN) vs Central deflection (mm) for OPSC beam specimens with shear reinforcement of shear reinforcement spacing = 80 mm.

166
Figure 4.68 Load (kN) vs Central deflection (mm) for OPSC beam specimens with shear reinforcement of shear reinforcement spacing = 60 mm.
Figure 4.69 Load (kN) vs Central deflection (mm) for NWC beam specimens with shear reinforcement.

167
Figure 4.70 Surface texture of diagonal shear interface of OPSC and NWC beam
specimens cast with shear reinforcement (Sectional view).
Bond failure between gravel aggregates and
cement paste
Shear force sheared through OPS aggregates
Bond failures between OPS aggregates and
cement paste
NWC beam OPSC beam

168
Figure 4.71 Surface texture of diagonal shear interface of OPSC and NWC beam
specimens cast with shear reinforcement (Isometric View).
NWC beam
OPSC beam
Bond failure between gravel aggregates and cement
paste
Shear force sheared through OPS aggregates
Bond failures between OPS
aggregates and cement paste

169
Figure 4.72 VOPSC (kN) vs Shear reinforcement spacing, s (mm) for OPSC beam specimens cast with shear reinforcement.
Figure 4.73 VTest (kN) vs Shear reinforcement spacing, s for OPSC and NWC beam specimens cast with shear reinforcement.

170
Figure 4.74 VOPSC (kN) vs Inclination angle of shear cracks, ϴ (degree) for OPSC beam specimens cast with shear reinforcement.
Figure 4.75 VTest (kN) vs Inclination angle of shear cracks, ϴ (degree) for OPSC and NWC beam specimens cast with shear reinforcement.

171
Figure 4.76 VOPSC (kN) vs Concrete strength, fcu (N/mm2) for OPSC beam specimens cast with shear reinforcement.
Figure 4.77 VTest (kN) vs Concrete strength, fcu (N/mm2) for OPSC and NWC beam specimens cast with shear reinforcement.

172
Chapter 5
Theoretical Plastic Models
5.1 Introduction
In Chapter 4, the test observations, the test results, the failure mechanisms and the
effect of parameters were fully described. It was noted that variations on the
ultimate shear strength do occurred between the Oil Palm kernel Shell Concrete
(OPSC) beams and Normal Weight Concrete (NWC) beams, both cast with and
without shear reinforcement. Since the existing upper bound plastic models have
been proposed for the predictions of shear resistance of NWC beams, both with and
without shear reinforcement, it is therefore sensible to adopt these models as the
basis of the theoretical models proposed in this chapter.
As mentioned in Section 2.2, although the upper bound plastic approach for
predicting concrete shear resistance of reinforced concrete structural beam elements
was first introduced in 1975 by Braestrup [45], agreement with the test results were
only found with the inclusion of effectiveness factor, υ, in 197 for beams without
shear reinforcement) 8 by Neilsen et.al [46]. For concrete beam specimens cast
without shear reinforcement, better agreement with tests were found when the
effectiveness factor, υ, was considered to be a function of concrete cylindrical
compressive strength (σc), overall section depth (h), longitudinal steel ratio (ρ), and
span to overall depth ratio (a/h). Whilst for concrete beam specimens cast with shear
reinforcement, the effectiveness factor, υ, was considered to be limited to the
function of concrete cylindrical compressive strength (σc), as the effects of other
parameters were considered to be nominal [46]. However, as described in Chapter 4,

173
it was found that the shear reinforcement’s ratio, and the inclination angle of
shear cracks, ϴ, influenced the shear resistance of the OPSC beam cast with shear
reinforcement. Hence, further investigations were carried out in the current research
to determine the need for modification to the existing prediction model.
In this chapter, investigations on the requirements for modification on shear strength
parameters’ are reported for both cases of casting with and without shear
reinforcement. From the current research, two theoretical concrete plastic model:
CP-I Model and CP-II Model, which adopt the upper bound plastic approach as their
fundamental basis, are proposed for OPSC cast without and with shear
reinforcement, respectively.
For OPSC beam without shear reinforcement, CP- I Model modified the parameters’
equations of concrete compressive strength (σc), overall section depth (h),
longitudinal steel ratio (ρ), and span to overall depth ratio (a/h). Whilst for OPSC
beam with shear reinforcement, CP-II modified the parameter’s equation: concrete
compressive strength (σc). Full detail of the prediction models, CP-I Model and CP-II
Model,, are presented in Section 5.2 and 5.3, respectively.
5.2 Beams cast without shear reinforcement
5.2.1 Theoretical plastic model for concrete beam without shear reinforcement,
(CP-I Model)
The proposing (CP-I Model) is developed to predict for the ultimate shear resistance
of a reinforced concrete beam element cast using Oil Palm kernel Shell (OPSC) as
coarse aggregate. The model is essentially the existing upper bound plastic approach

174
(Eqn 2.15) with some modifications to its effectiveness parameters. That is, both the
concrete and the reinforcement are assumed to be rigid plastic materials with plastic
strains and yield condition assumed to follow the associated flow law (normality
condition) and modified Coulomb failure criterion, respectively. At failure, a concrete
beam is assumed to be separated into rigid regions by the shear failure surfaces (as
shown in Figure 2.14). These regions are considered to remain rigid and to move
relative to each other. The discontinuities are assumed to be narrow rigid-plastic
region of concrete as shown in Figure (2.14).
Since a significant similarity has been adopted in the failure mechanism, the test
results were then compared with the predictions of the existing model (Eqn 2.16.1 to
2.16.4) to evaluate whether the existing model is relevant (see Column 2 and 3 in
Table 5.1). The comparisons have been summarised and presented in Table 5.1 (see
Column 5). It can be noted that the existing model overestimate the test results by
11%. The test results were then further evaluated with respect to the associating
parameters of the effectiveness factor (as shown in Figure 5.1 to Figure 5.4). The
outcomes of these evaluations review that the existing model, as it is, does not give
good agreement with the ultimate shear resistance of OPSC beam specimens. As a
result, it is decided to carry out modifications to the effectiveness parameters to
reflect the observation derive from tests. The parameters modified are; span to
overall depth ratio (a/h), longitudinal steel ratio (ρ), concrete compressive strength
(σc), and overall section depth (h). Such modifications are required to accommodate
for the variations observed from tests, such as overestimations of the parameters
shear span to depth ratio (a/h) ≤ 2, longitudinal steel ratio, concrete strength and
underestimation of overall section depth (h) < 150 mm.

175
5.2.2 Modification on parameters
5.2.2.1 Span to overall depth ratio, a/h
It can be noted from Figure 5.1 that, the shear failure loads of OPSC specimens
loaded with span to overall depth ratio, a/h ≤ 2, are observed to be lower than those
casted with NWC. As such, the prediction values derived from the existing theoretical
plastic model (CP-NS Model) (Eqn 2.16.1) are therefore observed to overestimate the
failure loads of OPSC specimens. It is believed that such phenomenon was attributed
to the lower aggregate interlock ability resulting from the smoother shear crack
interface observed in OPSC specimen AD1 with respect to NWC specimen NWC1 (see
Figure 4.41).
Whilst for OPSC specimens loaded with a/h > 2 (a/d ≥ 2.5), the shear failure loads
were noted to be similar to that of NWC specimens. As such, the prediction values
derived from the existing theoretical plastic model (CP-NS Model) (Eqn 2.16.1) agree
with the failure loads of OPSC specimens. Such phenomenon is believed to be
attributed to the higher aggregate interlock ability resulting from the rougher shear
interface observed in OPSC specimen F1 with respect to NWC specimen NWC2 (See
Figure 4.42), as highlighted in Section 4.2.3.1.
In view of the discrepancy noted in shear behaviour of OPSC specimens as the shear
span reduces, modification to the existing parameter, a/h, is required. The existing
expression was therefore revised to be Eqn 5.1.1 to accommodate for the smoother
shear crack interface observed in the OPSC specimens. With the revised expression
for span ratio (Eqn 5.1.1), good agreement with test results are achieved, as shown in
Figure 5.1.

176
f(
) = 1 + 0.05 (
- 2.6)2 (
≤ 2.54) (Eqn 5.1.1)
5.2.2.2 Longitudinal steel ratio, ρ
In general, it can be noted from Figure 5.2 that the test results with respect to the
longitudinal steel ratio, f(ρ), of OPSC beam specimens cast without shear
reinforcement are observed to be lower than the predictions derived from the
existing theoretical plastic model (CP-NS Model) (Eqn 2.16.2). Furthermore, it is
observed that the rate of increases in shear strength of OPSC specimens with respect
to the longitudinal steel ratio (ρ) were observed to be less significant for beam
specimens casted with ρ = 2.99%, while the control samples (NWC) were observed to
be consistent with the theoretical prediction (see figure 4.44).
Such discrepancies are believed to be attributed to the differences found in the
fracture strength of coarse aggregates (See Section 2.1). That is, a lower fracture
strength found in Oil Palm kernel Shell (OPS) (see Table 2.1) would have led to a
lower shear stress being transferred across the shear crack interface, which in turn,
resulted in a lower shear resistance been mobilised.
In view of the discrepancies noted in OPSC, a modification has been proposed to the
existing plastic model (CP-NS Model) (Eqn 2.16.2) to account for the losses observed
in shear strength, which would resulted from the increase in reinforcement ratio.
With the revised expression for longitudinal steel ratio (Eqn 5.1.2), good agreement
with test results are achieved, as shown in Figure 5.2.
f(ρ) = 0.13 ρ + 0. 53 (ρ <3.14 %) (Eqn 5.1.2)

177
5.2.2.3 Cylindrical concrete strength, σc
In general, it can be noted from Figure 5.3 that the shear strength of OPSC with
respect of the cylindrical concrete strength, f(σc), of specimens cast without shear
reinforcement are observed to be lower than the predictions of the existing
theoretical plastic model (CP-NS Model) (Eqn 2.16.3). As such, the prediction values
derived from the existing theoretical plastic model (CP-NS Model) (Eqn 2.16.3) are
therefore observed to overestimate the failure loads of OPSC specimens. It is
believed that such phenomenon was attributed to the lower fracture strength of OPS
aggregates (see Section 2.1). That is, a lower fracture strength found in Oil Palm
kernel Shell (OPS) (see Table 2.1) would have led to a lower shear stress being
transferred across the shear cracks interface, and hence, resulted in a lower shear
resistance been mobilised.
In view of the discrepancies noted in OPSC, a modification has been proposed to the
existing plastic model (CP-NS Model) with respect to the influence of cylindrical
concrete strength in shear strength, to accommodate for the shear strength
provided. With the revised expression for concrete strength (Eqn 5.1.3), good
agreement with test results are achieved, as shown in Figure 5.3.
f(σc) =
√ (19 < σc <33 MPa) (Eqn 5.1.3)
5.2.2.4 Overall section depth, h
It can be noted from Figure 5.4 that, the shear failure loads of OPSC specimens
loaded with overall section depth, h < 160 mm, are observed to be higher than those
casted with NWC. As for OPSC specimens with increase of overall section depth, it is

178
observed that the rate of reduction in shear strength of OPSC specimens with respect
to the overall section depth are more significant, while the control samples (NWC)
were observed to be consistent with the theoretical prediction of existing plastic
model (CP-NS Model) (Eqn 2.16.4).
Such discrepancies are believed to be attributed to the differences found in the
fracture strength of coarse aggregates (See Section 2.1). That is, a lower fracture
strength found in Oil Palm kernel Shell (OPS) (see Table 2.1) would have led to a
lower aggregate interlock capacity accumulated as the overall section depth
increases, which in turn, resulted in a lower ultimate shear resistance.
In view of the discrepancies noted in OPSC, a modification has been proposed to the
existing plastic model (CP-NS Model) to account for the losses observed in shear
strength, which would resulted from the increase in overall section depth. With the
revised expression for overall section depth (Eqn 5.1.4), good agreement with test
results are achieved, as shown in Figure 5.4.
f(h) =
) (0.113m ≤ h ≤ 0.313m) (Eqn 5.1.4)
5.2.3 Comparisons with test results
It can be observed from the Figure 5.5 to Figure 5.8 that with the proposing
theoretical plastic model (CP-I Model) with respect to the parameters: span to overall
depth ratio (a/h), longitudinal steel ratio (ρ), concrete strength (σc), and overall
section depth (h) (Eqn 5.1.1 to 5.1.4) exhibits good agreement (mean value of 1.07
and standard deviation of 0.15) with the test results (see also Table 5.1 Column 6).

179
5.3 Beams cast with shear reinforcement
5.3.1 Theoretical plastic model for concrete beam with shear reinforcement, (CP-
II Model)
The proposing (CP-II Model) is developed to predict for the ultimate shear resistance
of a reinforced concrete element with shear reinforcement cast using Oil Palm kernel
Shell (OPSC) as coarse aggregate. The model is essentially the existing upper bound
plastic approach (Eqn 2.41) with some modifications to its effectiveness parameter.
That is, both the concrete and the reinforcement are assumed to be rigid plastic
materials with plastic strains and yield condition assumed to follow the associated
flow law (normality condition) and modified Coulomb failure criterion, respectively. A
concrete beam is assumed to be separated into rigid regions by the shear failure
surfaces at failure (as shown in Figure 2.19). These regions are considered to remain
rigid and to move relative to each other and the discontinuities are assumed to be
narrow rigid-plastic region of concrete as shown in Figure 2.19.
Since similarity has been observed in the failure mechanism of OPSC and NWC
beams, the test results of OPSC beams were compared with the predictions of the
existing model (Eqn 2.42) to evaluate whether the existing model is relevant (see
Column 2 and 3 in Table 5.2). It can be noted that the existing model overestimate
the test results by 8%. The test results were then further evaluated with respect to
the associating parameter of the effectiveness factor (as shown in Figure 5.9). In
addition to the effectiveness parameter, additional parameters of shear
reinforcement ratio and inclination angle of shear cracks were investigated (see
Figure 5.10 and 5.11). The outcomes of these evaluations review that the existing
model, as it is, does not give good agreement with the ultimate shear resistance of
OPSC beam specimens. The model is essentially the existing upper bound plastic

180
model (Eqn 2.41) with a modification to its effectiveness parameter: concrete
strength.
Hence, detailed investigations were carried out on the shear strength predictions
given by the existing theoretical plastic model (CP-S Model) with respect to the OPSC
beam’s test results to investigate the requirement for modifications on the shear
strength parameters. The results of these investigations are shown in Table 5.2
(Column 5), which it is found that the existing theoretical plastic model (CP-S Model)
overestimated the shear strength capacity of OPSC beam specimens cast with shear
reinforcement with a mean value of 0.92 and standard deviation of 0.05.
5.3.2 Modification on parameter
From Section 5.3.1, it was found that the existing theoretical plastic model (CP-S
Model) overestimated the shear strength of the OPSC beam cast with shear
reinforcement. Hence, detailed investigations were carried out on the parameter of
cylindrical concrete strength (σc), which governed the effectiveness factor, υ to
investigate the requirement for modification on parameter. Apart from the concrete
strength parameter suggested by Nielsen et.al [46], it is observed from the test
results in Section 4.3.3 that two other parameters: (1) shear reinforcement ratio (ρs)
and (2) inclination angle of shear cracks(ϴ), also influence the ultimate shear
strength obtained for the OPSC beam with shear reinforcement.
Hence, further investigations on the two parameters: (1) cylindrical concrete strength
(σc) (see Figure 5.21) (2) inclination angle of shear cracks (ϴ) (see Figure 5.22), and (3)
shear reinforcement ratio (ρs) (see Figure 5.23) were carried out to observe the
comparisons between the shear failure loads of the OPSC beams without shear

181
reinforcement and the shear strength predictions derived from the existing
theoretical plastic model (CP-S Model), to examine the requirement for the
modification.
5.3.2.1 Cylindrical concrete strength, σc
It can be noted from Figure 5.9 that the shear failure loads of OPSC beams with shear
reinforcement with respect to the parameter: cylindrical concrete strength are lower
than the predictions derived from the existing CP Model (CP-S Model) (Eqn 2.42).
However, it is observed from tests that the ultimate shear strength achieved by the
OSPC beam specimens (Specimen 4B and 4C) are slightly higher compared to the
ultimate shear strength by NWC beam specimens (Specimen NWCB and NWCE) (see
Figure 4.77). It is believed the that the higher shear strength achieved by OPSC
beams is due to the rougher shear cracks interface of OPSC beams (See Figure 4.70
and 4.71) compared to those of NWC beams. Therefore, this would lead to higher
aggregate interlocking capacity and resulted in higher shear resistance in OPSC
beams. Hence, it can be noted that the existing plastic model (CP-S Model)
overestimated the shear failure loads of the OPSC beams.
A modification has therefore been proposed to the existing plastic model (CP-S
Model) to account for the variations observed between the shear strength of the
OPSC specimens and the predictions by CP-S Model. With the revised expression for
concrete strength (Eqn 5.2), good agreement with test results are achieved, as shown
in Figure 5.9.
f( ) =
( 20.5 MPa ≤ fck ≤ 27.7 MPa) (Eqn 5.2)

182
5.3.2.2 Shear reinforcement ratio, ρs
It can be noted from Figure 5.10 that the shear failure loads of OPSC beams with
respect to shear reinforcement ratio are higher than those of NWC control specimens
(See also Figure 4.73). It is believed that such discrepancy is due to the rougher
surface interface observed at the surface texture of diagonal shear cracks of the
OPSC beams compared to NWC beams (see Figure 4.70 and 4.71), which in turn,
would have enhanced the aggregate interlocking capacity, and resulted in higher
shear resistance of OPSC beams.
However, it can be noted from Figure 5.10 that the shear failure loads of the OPSC
beams are in good agreement with the predictions derived from the existing plastic
model (CP-S Model) (Eqn 2.42). Therefore, there is no requirement for the parameter
shear reinforcement modification. The predictions of the CP-S Model with respect to
the parameter: shear reinforcement ratio are reasonable to be included to the
proposed modified plastic model (CP-II Model) without any requirement of
modification to the parameter.
5.3.2.3 Inclination angle of shear cracks, ϴ
It can be noted from Figure 5.11 that the shear failure loads of OPSC beams with
respect to shear reinforcement ratio are higher than those of NWC control specimens
(See also Figure 4.75). Such discrepancy is believed attributed to the rougher surface
interface observed at the surface texture of diagonal shear cracks of the OPSC beams
compared to NWC beams (see Figure 4.70 and 4.71), which in turn, would have
enhanced the aggregate interlocking capacity, and resulted in higher shear resistance
of OPSC beams.

183
However, it can be noted from Figure 5.11 that the shear failure loads of OPSC beams
with respect to inclination angle of shear cracks, f(ϴ) are in good agreement with the
predictions derived from the existing plastic model (CP-S Model) (Eqn 2.41). Hence,
no requirement of modification on the parameter: inclination angle of shear cracks is
recommended. The existing parameter formula is therefore acceptable to be
included to the proposed modified plastic model (CP-II Model).
5.3.3 Comparisons with test results
It can be observed from Figure 5.12 to Figure 5.14 that good agreement between the
test results and the prediction derived from the proposed modified theoretical plastic
model with respect to parameters: cylindrical concrete strength (σc), inclination angle
of shear cracks (ϴ) and shear reinforcement ratio (ρs) are achieved (mean value of
1.03 and standard deviation of 0.05, as shown Table 5.2 Column 6).
5.4 Summary
Two theoretical models based upon the modification of the existing theoretical
concrete plastic models via the parameters equations were proposed in this chapter
for the shear strength predictions of the OPSC beams cast with and without shear
reinforcement, respectively.
For OPSC beams cast without shear reinforcement, the proposed CP-I Model took
into account the variables: concrete cylindrical compressive strength (σc), overall
section depth (h), longitudinal steel ratio (ρ), and span to overall depth ratio (a/h),
which governed the effectiveness factor, υ, from the existing plastic model (CP-NS

184
Model), which each shear strength parameters were modified for the ultimate shear
strength predictions of the OPSC beams without shear reinforcement.
Whilst for OPSC beams cast with shear reinforcement, the proposed CP-II Model are
the results of the modified parameter equations of cylindrical compressive strength
(σc) for the ultimate shear strength predictions of the OPSC beams with shear
reinforcement. In general, all the modified theoretical concrete plastic models (CP-I
Model and CP-II Model) achieved good agreement with the OPSC beam test results.

185
Table 5.1 Comparisons of shear strength predictions with respect to the test results of OPSC beams cast without shear reinforcement
1 2 3 4 5 6
Specimen No
VOPSC
(kN) VCP-NS
(kN)
VCP-I
(kN)
VOPSC VCP-NS
VOSPC VCP-I
10A 18.95 25.30 22.44 0.75 0.84
S1 21.05 27.23 24.16 0.77 0.87
12A 54.73 83.91 57.73 0.65 0.95
12B 40.00 53.59 40.71 0.75 0.98
12C 27.37 27.74 24.51 0.99 1.12
12D 25.26 22.57 20.49 1.12 1.23
12E 31.58 31.18 27.54 1.01 1.15
12F 26.31 23.16 21.30 1.14 1.24
16A 56.80 91.12 62.17 0.62 0.91
16B 42.10 58.37 43.93 0.72 0.96
16C 29.50 30.22 26.46 0.98 1.11
16D 26.32 24.52 22.11 1.07 1.19
16E 35.79 33.68 29.49 1.06 1.21
20A 73.68 105.29 71.27 0.70 1.03
20B 52.63 67.65 50.46 0.78 1.04
20C 33.68 35.04 30.43 0.96 1.11
20D 27.37 28.35 25.41 0.97 1.08
20E 35.79 37.67 32.71 0.95 1.09
AD1 58.19 100.81 68.78 0.58 0.85
AD2 32.33 27.13 24.47 1.19 1.32
F1 32.67 33.63 29.45 0.97 1.11
F2 47.41 37.43 32.78 1.27 1.45
H2 52.53 52.43 23.69 1.00 0.80
S2 36.64 35.32 30.93 1.04 1.18
Mean 0.89 1.07
S.D. 0.19 0.15
VOPSC (kN) = Ultimate shear failure load of OPSC beam specimens cast without shear reinforcement
VCP-NS (kN) = Shear resistance of Existing Concrete Plastic Model (CP-NS Model)
VCP-NS
Which, υ = f1 (σc) f2 (h) f3 (ρ) f4 (
Where, f1(σc) =
√ (σc in N/mm
2)
f2(h) = 0.27 (1 +
√ ) (h in m)
f3(ρ) = 0.15ρ +0.58 (ρ < 4.5%)
f4(
= 1 + 0.17 (
(

186
VCP-I (kN) = Shear resistance of proposing Modified Concrete Plastic Model (CP-I
Model)
VCP-I
Which, υ = f1 (σc) f2 (h) f3 (ρ) f4 (
Where, f1(σc) =
√ (19 MPa ≤ σc ≤ 33 MPa)
f2(h) = 0.25 (1.1 +
) (0.113m ≤ h ≤ 0.313 m)
f3(ρ) = 0.13ρ +0.53 (ρ < 3.14%)
f4(
= 1 + 0.17 (
(

187
Table 5.2 Comparisons of shear strength predictions with respect to the test results of OPSC beams cast with shear reinforcement
1 2 3 4 5 6
Specimen No
VOPSC
(kN) VCP-S
(kN)
VCP-II
(kN)
VOPSC VCP-S
VOSPC VCP-II
3A 75.78 78.04 72.70 0.97 1.04
3B 88.41 88.67 82.89 0.95 1.07
3C 92.62 93.01 87.14 0.95 1.06
4A 79.99 89.73 84.29 0.87 0.95
4B 94.73 100.36 94.49 0.91 1.00
4C 107.36 104.70 98.73 0.98 1.09
5A 88.41 101.42 95.88 0.81 0.92
5B 107.36 112.05 106.08 0.89 1.01
5C 119.99 116.39 110.33 0.95 1.09
4D 101.04 98.94 93.98 0.95 1.08
4E 105.25 103.15 98.61 0.93 1.07
Mean 0.92 1.03
S.D. 0.05 0.05
VOPSC (kN) = Ultimate shear failure loads of OPSC beam specimens cast with shear reinforcement
VCP-S (kN) = Shear resistance of Existing Concrete Plastic Model (CP-S Model)
VCP-S = σf b h cot ϴ +
Where, υ = 0.8 -
VCP-II (kN) = Shear resistance of proposing Modified Concrete Plastic Model (CP-
II Model)
VCP-II = σf b h cot ϴ +
Where, υ = 0.7 -

188
Figure 5.1 f(a/h) vs a/h for Existing plastic model (CP-NS Model) and Modified
plastic model (CP-I Model).
Figure 5.2 f(ρ) vs ρ(%) for Existing plastic model (CP-NS Model) and Modified
plastic model (CP-I Model).
f(𝒂 𝒉
) =
𝐕𝐓𝐞𝐬𝐭
𝐬𝐢𝐧
𝜭
𝟎 𝟓
𝝈𝒄 𝟏
𝐜𝐨𝐬𝚹
𝐛 𝐡
𝐟 𝝆
𝐟 𝐡 𝐟 𝝈𝒄
f(ρ
) =
𝐕𝐓𝐞𝐬𝐭
𝐬𝐢𝐧
𝜭
𝟎 𝟓
𝝈𝒄 𝟏
𝐜𝐨𝐬𝚹
𝐛 𝐡
𝐟(𝐚 𝐡) 𝐟 𝐡 𝐟 𝝈𝒄

189
Figure 5.3 f(σc) vs σc (N/mm2) for Existing plastic model (CP-NS Model) and Modified plastic model (CP-I Model).
Figure 5.4 f(h) vs h (mm) for Existing plastic model (CP-NS Model) and
Modified plastic model (CP-I Model).
f (σ
c) =
𝐕𝐓𝐞𝐬𝐭
𝐬𝐢𝐧
𝜭
𝟎 𝟓
𝝈𝒄 𝟏
𝐜𝐨𝐬𝚹
𝐛 𝐡
𝐟(𝐚 𝐡) 𝐟 𝝆 𝐟 𝒉
f(h
) =
𝐕𝐓𝐞𝐬𝐭
𝐬𝐢𝐧
𝜭
𝟎 𝟓
𝝈𝒄 𝟏
𝐜𝐨𝐬𝜭
𝐛 𝐡
𝐟(𝐚 𝐡) 𝐟 𝝆 𝐟 𝝈𝒄
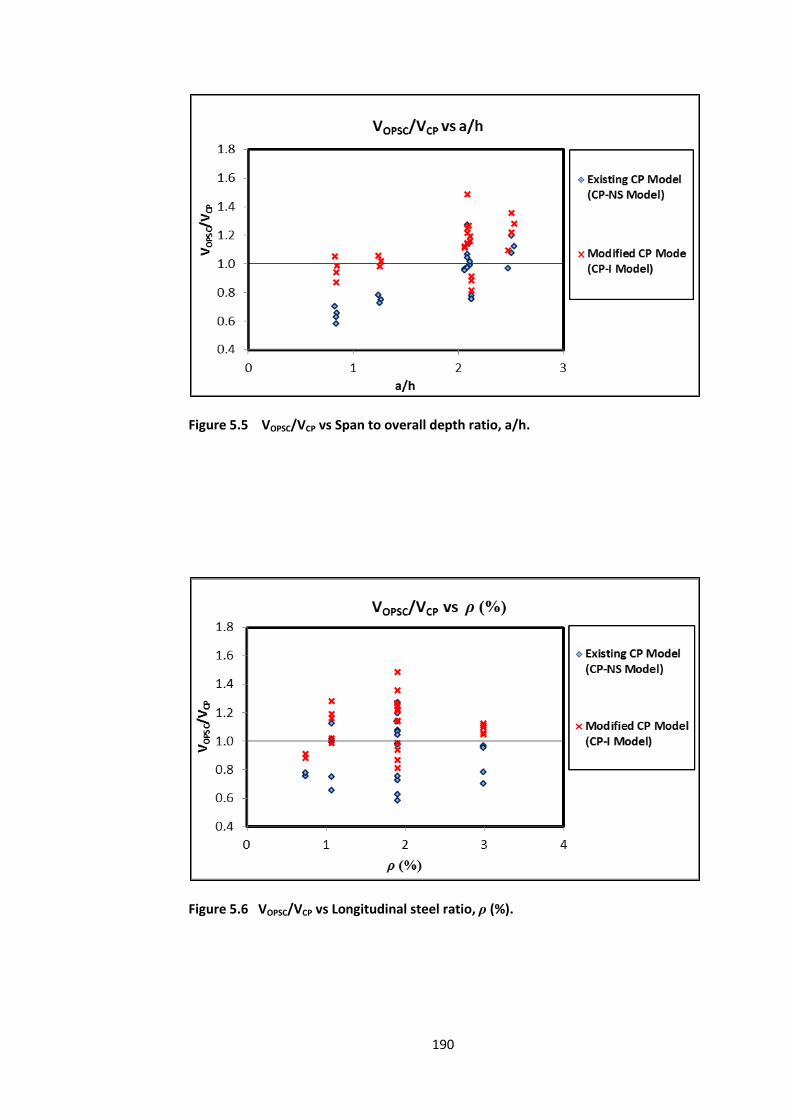
190
Figure 5.5 VOPSC/VCP vs Span to overall depth ratio, a/h.
Figure 5.6 VOPSC/VCP vs Longitudinal steel ratio, ρ (%).

191
Figure 5.7 VOPSC/VCP vs Cylindrical concrete strength, σc (N/mm2).
Figure 5.8 VOPSC/VCP vs Overall sectional depth, h (mm).

192
Figure 5.9 f(σc) vs σc (N/mm2) for Existing CP Model (CP-S Model) and Modified
CP Model (CP-II Model).
Figure 5.10 f(ρs) vs ρs (%) for Existing CP Model (CP-S Model).
f(𝝆𝒔)
= 𝐕𝐓𝐞𝐬𝐭
(𝟎
𝟓 𝟏−𝐜𝐨𝐬𝜭
𝛖 𝛔𝐜 𝐛
𝐡
𝐬𝐢𝐧𝜭
)
𝒇𝒚𝒌𝐛𝐡
𝟏
𝐭𝐚𝐧𝜭
f(𝛔𝐜)
= 𝐕𝐓𝐞𝐬𝐭
(𝒇
𝒚𝒌𝐛 𝐡
𝛖 𝝆𝒔
𝟏
𝐭𝐚𝐧𝜭)
𝐬𝐢𝐧
𝜭
𝟎 𝟓
𝟏 𝐜𝐨𝐬𝚹
𝛔𝐜𝐛 𝐡

193
Figure 5.11 f(
) vs ϴ(rad) for Existing CP Model (CP-S Model).
Figure 5.12 VOPSC/VCP vs Cylindrical concrete compressive strength, σc (N/mm2).
f(
𝛳)
= 𝐕𝐓𝐞𝐬𝐭
(𝟎
𝟓 𝟏−𝐜𝐨𝐬𝜭
𝛖 𝛔𝐜 𝐛
𝐡
𝐬𝐢𝐧𝜭
)
𝒇𝒚𝒌 𝐛
𝐡 𝝆𝒔
f(
vs ϴ(rad)

194
Figure 5.13 VOPSC/VCP vs Shear reinforcement ratio, ρs (%).
Figure 5.14 VOPSC/VCP vs Inclination angle of shear cracks, ϴ (rad).

195
Chapter 6
BS8110 Design Models
6.1 Introduction
In Chapter 4, the test observations, the test results, the failure mechanism and the
effect of parameters were fully described. It was noted that variations on the
ultimate shear strength was observed between the Oil Palm kernel Shell Concrete
(OPSC) beams and Normal Weight Concrete (NWC) beams, both cast with and
without shear reinforcement. Hence, in Chapter 5, two modified theoretical models
based on upper bound plastic approach were proposed for predicting the ultimate
shear capacity of Oil Palm kernel Shell Concrete (OPSC) beams cast with and without
shear reinforcement, respectively, which good agreement with test results have been
achieved
The existing BS8110 design model (BS8110-NS Model) [46] took into account the
parameter of span to effective depth ratio (a/d), longitudinal steel ratio (ρ), cube
concrete compressive strength (fcu), and effective section depth (d), for the ultimate
shear strength predictions of NWC beam cast without shear reinforcement (see
Section 2.2.1.4.1). Whilst for NWC beam cast with shear reinforcement, the existing
BS8110 model (BS8110-S Model) considered the parameter of concrete cylinder
compressive strength (fck), span to effective depth ratio (a/d) and shear
reinforcement ratio (ρs) to be the function of the ultimate shear strength predictions
(see Section 2.2.2.4.1).

196
In this chapter, investigations on the requirements for modification on shear strength
parameters are reported for both cases of beams cast with and without shear
reinforcement. From the current investigations, two BS8110 design model: BS8110-I
Model and BS8110-II Model are proposed for OPSC beam cast without and with
shear reinforcement, respectively.
For OPSC beam without shear reinforcement, BS8110-I Model modified the
parameters’ equations of span to effective depth ratio (a/d), and effective section
depth (d). Whilst for OPSC beam with shear reinforcement, BS8110-II Model
modified the parameter: span to effective depth ratio (a/d). Full detail of the
predictions models: BS8110-I Model and BS8110-II Model are presented in Section
6.2 and 6.3, respectively.
A point to note in this chapter is that the partial safety factor, for both concrete
and steel reinforcement is equal to 1 in the ultimate shear strength equation.
Furthermore, it is to be noted that the concrete strength, fcu in both the existing and
modified BS8110 design models is based on the cube compressive strength of
concrete, which were obtained from the tested 100 mm cubes specimens. The tested
100 mm cube specimens were casted from the same concrete batch with the
concrete beam specimens.

197
6.2 Beams cast without shear reinforcement
6.2.1 BS8110 design model for concrete beam without shear reinforcement,
(BS8110-I Model)
The proposing “BS8110-I” Model is developed to predict the ultimate shear
resistance of a reinforced concrete beam element cast using Oil Palm kernel Shell
(OPS) as coarse aggregate. Since a significant similarity has been observed in Section
4.2.1 for both failure mechanisms of OPSC and NWC beams cast without shear
reinforcement, the test results of OPSC beams were then compared with the
predictions of the existing BS8110 design model (BS8110-NS Model) to evaluate
whether the model is relevant (see Column 2 and 3 in Table 6.1).
Summary of the comparisons are presented in Table 6.1 (Column 5). It can be noted
that the existing model underestimated the ultimate shear strength capacity of OPSC
beam specimens cast without shear reinforcement with a mean value of 1.35 and
standard deviation of 0.16. The test results were then further evaluated with respect
to the associating parameters: span to effective depth ratio (a/d), longitudinal steel
ratio (ρ), cube concrete compressive strength (fcu), and effective section depth (d).
The results of these evaluations review that the existing BS8110 model (BS8110-NS
Model) does not give good agreement with the ultimate shear resistance of OPSC
beam specimens. Therefore, it is decided to carry out modifications to the
parameters to reflect the observations made from the test. The modifications of
parameters consist of span to effective depth ratio (a/d), and effective section depth
(d). The parameters modified are; span to effective depth ratio (a/d), and effective
section depth (d). Such modifications are required to accommodate for the variations

198
observed from tests, such as underestimations of the parameters span to effective
depth ratio, a/d ≤ 2.5, and effective section depth, d = 82 mm.
6.2.2 Modification on parameters
In was noted from Section 6.2.1 that the existing BS8110 design model (BS8110-NS
Model) underestimated the ultimate shear strength of OPSC beams cast without
shear reinforcement. Hence, further analyses were carried out to assess the
relevancy of the parameters: (1) span to effective depth ratio (a/d), (2) cube concrete
strength (fcu), (3) longitudinal steel ratio (ρ) and (4) effective section depth (d),
governing the existing BS8110 design model and to provide with appropriate
modifications, which full details are elaborated in Section 6.2.2.1 to 6.2.2.4.
6.2.2.1 Span to effective depth ratio, a/d
It can be noted from Figure 6.1 that the existing BS8110 design model (BS8110-NS
Model) underestimated the rate of increase in the ultimate shear strength of OPSC
beams as span to effective depth, a/d, decreases. Such discrepancy is believed to be
attributed to expression (Eqn 2.19.1) given by the existing BS8110 model (BS8110-NS
Model), which took into account the increment of ultimate shear strength with the
reduction of span to effective depth ratio for beams loaded with a/d ≤ 2.
In general, from the current research (Section 4.2.3.1), it is noted that the failure
modes varied for OPSC beams loaded with a/d < 2.5 and a/d ≥ 2.5, respectively. That
is, shear compression failure occurred for beams loaded with a/d < 2.5 whilst shear
failure or diagonal tension failure occurred for beams loaded with a/d ≥ 2.5.
Therefore, the existing expression was revised to be Eqn 6.1.1 to accommodate for

199
both the rate of increase in shear capacity as span to effective depth (a/d) reduces
and the two distinct failure modes observed for beams loaded with a/d < 2.5 and a/d
≥ 2.5. With the revised expression for span ratio (Eqn 6.1.1), good agreement with
test results are achieved (see Figure 6.1).
f(
) = 2.5
(
< 2.5) (Eqn 6.1.1)
6.2.2.2 Longitudinal steel ratio, ρ
It can be noted in Figure 6.2 that the shear failure loads of OPSC specimens are lower
than the NWC control specimens. Test observations also indicate that the ultimate
shear strength obtained by OPSC specimens (Specimen 16C and 20E) were lower
than those of NWC beam specimens (Specimen NWC1 and NWC4) (see Figure 4.44).
It is believed such discrepancy observed in the shear strength between NWC and
OPSC beams is due to the variations found in the fracture strength of coarse
aggregates. That is, lower fracture strength found in the OPS aggregates (see Table
2.1) would have led to lower aggregate interlocking capacity, and resulted in lower
shear resistance mobilised by OPSC beam.
However, it can be observed from Figure 6.2 that the shear failure loads of OSPC
specimens are slightly higher than the predictions derived from the existing BS8110
design model (BS8110-NS Model) (Eqn 2.19.2).Thus, the existing expression (Eqn
2.19.2) are satisfactory since the f(ρ) of the ultimate shear strength predictions
derived from the existing BS8110 design model (BS8110-NS Model) slightly
underestimated the shear failure loads of the OPSC beams. Hence, adequate
predictions of shear strength increment would be provided for the OPSC beams as
longitudinal steel ratio increases. The existing parameter longitudinal reinforcement

200
ratio’s equation (Eqn 2.19.2) is therefore adopted into the modified BS8110 design
model (BS8110-I Model) to accommodate for the increment of the ultimate shear
strength of OPSC beam as longitudinal steel ratio increases.
6.2.2.3 Cube concrete strength, fcu
It can be noted from Figure 6.3 that the shear failure loads of OPSC specimens with
respect to cube concrete strength parameter, f(fcu) were observed to be lower to
those of NWC control specimens. Observations found from test indicate that the
ultimate shear strength obtained by OPSC beam specimens (Specimen 16C and F1)
were lower than those of NWC control specimens (Specimen NWC2 and NWC3) (see
Figure 4.46). It is believed that the lower shear failure loads of OPSC beams is
believed due to the lower fracture strength found in the OPS aggregates (see Table
2.1) would have led to shear stress to be transferred across the shear cracks, and
resulted in lower shear resistance mobilised by OPSC beam.
However, it can be noted from Figure 6.3 that the shear failure loads of OPSC
specimens with respect to the cube concrete strength f(fcu) are slightly higher in
comparison to the predictions derived from the existing BS8110 model (BS8110-NS
Model) (Eqn 2.19.3). Since the predictions derived from the existing BS8110 design
model (BS8110-NS Model) with respect to f(fcu) slightly underestimated the shear
failure loads of the OPSC beams, the existing expression are therefore acceptable.
Hence, the existing parameter cube concrete strength’s equation (Eqn 2.19.3) are
adopted into the modified BS8110 design model (BS8110-I Model) to take into
account for the increment in the ultimate shear strength of OPSC beam as the
concrete compressive strength increase.

201
6.2.2.4 Beam effective depth, d
It can be noted from Figure 6.4 that the shear failure loads of both OPSC specimens
and NWC control specimens with effective section depth, d = 82 mm (h=113 mm) are
higher compared to the existing BS8110 design model (BS8110-NS model) (Eqn
2.19.4). However, observations from test observations indicate that for beams with d
= 82mm, the ultimate shear failure loads obtained by the OPSC and NWC beams
(Specimen 12F and NWC5) are comparable with variances of 4% (see Figure 4.48).
Whilst for beams with effective depth, 165 ≤ d ≤ 167, the shear failure loads of OPSC
beam specimens were noted to be lower than those of NWC control specimens (See
Figure 6.4). It is believed that such discrepancy is due to the lower aggregate strength
found in Oil Palm kernel Shell (OPS) compared to that found in normal aggregates.
Hence, this would have led to lower aggregate interlocking capacity, and as a result,
lower ultimate shear resistance was mobilised.
Therefore, the existing equation was revised to be Eqn 6.1.2 to take into account for
the rate of increase in shear capacity with respect to the reduction in effective
section depth, d. With the revised expression for effective section depth (Eqn 6.1.2),
good agreement with test results are achieved, as shown In Figure 6.4.
f(d) =
⁄ (d in mm) (Eqn 6.1.4)

202
6.2.3 Comparisons with test results
From the modifications of parameters proposed in Section 6.2.2 for the shear
strength predictions of OPSC beams without shear reinforcement, the proposing
modified BS8110 design model (BS8110-I Model) is given as:
For a/d ≤ 2,
VRdc =
⁄
⁄
⁄
b d (Eqn 6.2)
For a/d > 2,
VRdc =
⁄
⁄
⁄
b d (Eqn 6.3)
Where,
= partial factor of material
It can be noted from Figure 6.5 to 6.8 that the modified BS8110 design model
(BS8110-I Model) (Eqn 6.2 and 6.3 for beams loaded with a/d < 2.5 and a/d ≥ 2.5,
respectively), with respect to parameters: shear span to height ratio (a/h),
longitudinal steel ratio (ρ), concrete strength (σc), and overall section depth (h),
exhibited good agreement with the test results (mean value of 1.03 and standard
deviation of 0.15 as shown in see Table 6.1 Column 6).

203
6.3 Beams cast with shear reinforcement
6.3.1 BS8110 design model for concrete beam with shear reinforcement, (BS8110-II
Model)
The proposing (BS8110-II Model) is developed to predict for the ultimate shear
resistance of a reinforced concrete beam element with shear reinforcement cast
using Oil Palm kernel Shell (OPS) as coarse aggregate. The BS8110-II model is
basically the existing upper bound BS8110 design model (BS8110-S Model) (Eqn 2.44
and 2.45) with approximate modifications to its parameters.
Since both of the OPSC and NWC beams exhibited similar failure mechanism (see
Chapter 4.3), hence, the test results were then compared with the predictions of the
existing BS8110-S model (Eqn 2.44 and Eqn 4.45) to determine whether the relevancy
of the existing model (see Column 2 and 3 in Table 6.2). The comparisons have been
summarized and presented in Column 5 of Table 6.2. It can be noted that the existing
model underestimated the ultimate shear strength capacity of OPSC beam specimens
cast with shear reinforcement with a mean value of 1.25 and standard deviation of
0.18. The results of these evaluations indicate that the existing model does not give
good agreement with the ultimate shear resistance of OPSC beam specimens. The
test results were then further evaluated with respect to the parameters (see Section
6.3.2.1 to 6.3.2.4). As a result, a modification to the parameter was carried out on the
parameters to reflect the observations derive from the analyses and test. The
parameter modified is span to depth ratio (a/d). Such modification is required to
allow better agreement to be achieved between the BS8110 design model and OPSC
beams with shear reinforcement for the increased rate of shear failure when the
specimens as the load was loaded near to the support, a/d < 2.5.

204
6.3.2 Modification on parameters
From Section 6.3.1, it was noted that the existing BS8110 design model (BS8110-S
Model) for the ultimate shear strength predictions of OPSC beam with shear
reinforcement underestimated the ultimate shear strength of the OPSC beams with
shear reinforcement. Hence, further analyses were carried out to evaluate the
relevancy of the parameters: (1) Shear reinforcement ratio (
), (2) Cube concrete
strength, (fcu) and (3) span to effective depth ratio (a/d), and to provide appropriate
modifications of the parameters as described in Section 6.3.2.1 to 6.3.2.3,
respectively.
6.3.2.1 Shear reinforcement ratio,
In general, it can be noted from Figure 6.11 that the shear failure loads of OPSC
beam specimens with respect to Shear reinforcement ratio, f(
were observed to
be slightly higher to those of NWC control samples. It is believed that higher shear
strength noted in OPSC beams is attributed to the rougher surface texture observed
in OPSC beams compared to NWC beams (See figure 4.70 and 4.71). Therefore, this
would have led to higher shear stress to be transferred across the shear cracks, and
as a result, higher shear resistance was mobilised.
However, it can be noted from Figure 6.11 that the mean shear failure loads of OPSC
beams is slightly higher than the predictions derived from the existing BS8110 design
model (BS8110-S Model). Therefore, modification was not recommended for the
parameter shear reinforcement ratio since the existing expression (Eqn 2.46.1) is
satisfactory. The existing expression (Eqn 2.46.1) is therefore adopted into the

205
proposed modified BS8110 design model (BS8110-II Model) to take into account for
the increment of ultimate shear strength of OPSC beam as the shear reinforcement
ratio increases.
6.3.2.2 Cube concrete strength, fcu
In general, it can be noted from Figure 6.12 that the shear failure loads of OPSC beam
specimens with respect to cube concrete strength parameter, f(fcu) were observed to
be slightly higher to those of NWC control samples. It is believed that such
discrepancy in shear strength between NWC and OPSC beams is attributed to the
rougher surface texture observed in OPSC beams compared to NWC beams, as
shown in Figure 4.70 and 4.71. Hence, this would have led to higher shear stress to
be transferred across the shear cracks, and as a result, higher shear resistance was
mobilised.
However, from the Figure 6.12, observation exhibit that the mean shear failure loads
of OPSC specimens with respect to the cube concrete strength f(fcu), of specimens
cast with shear reinforcement is slightly higher than the predictions derived from the
existing BS8110 design model (BS8110-S Model) (Eqn 2.46.2). Since the predictions
derived from the existing BS8110 design model (BS8110-S Model) with respect to
f(fcu) marginally underestimated the mean of shear failure loads of OPSC beams, the
existing expression are therefore acceptable. Hence, the existing parameter concrete
compressive strength’s equation (Eqn 2.46.2) are adopted into the proposed
modified BS8110 design model (BS8110-II Model) to account for the increment in the
ultimate shear strength of OPSC beam as concrete compressive strength increases.

206
6.3.2.3 Span to effective depth ratio, a/d
In general, it can be noted from Figure 6.13 that as the span to effective depth ratio
(a/d) decreases, the rate of increase of ultimate shear strength for OPSC specimens
are more pronounce than the prediction derived from the existing BS8110 design
model (BS8110-S Model) (Eqn 2.46.3). That is, the existing BS8110 design model
(BS8110-S Model) underestimated the increment of the ultimate shear strength of
OPSC beams with respect to low a/d ratio of 2.5. Such discrepancies arose due to the
existing expression given by the existing BS8110 model (BS8110-S Model), which took
into account for the rate of increment in ultimate shear strength as the span to
effective depth ratio reduces for beams loaded at a/d ≤ 2.
Therefore, the existing expression (Eqn 2.46.3) was revised to be Eqn 6.4 to allow for
better agreement with the test results for the rate of increase in shear capacity as
span to effective depth ratio (a/d) decreases. With the revised expression for span
ratio (Eqn 6.4), good agreement with test results are achieved (see Figure 6.14).
f(
) = 2.5
(
< 2.5) (Eqn 6.4)
6.3.3 Comparisons with test results
From the modifications of parameters proposed in Section 6.3.2 for the shear
strength predictions of OPSC beams with shear reinforcement, the proposing
modified BS8110 design model (BS8110-II Model) is given as:
For
VBS8110-I = [
⁄
⁄
⁄
(Eqn 6.5)

207
For
VBS8110-I = [
⁄
⁄
⁄
] b d (Eqn 6.6)
From Figure 6.15 to Figure 6.17, it can be observed that the modified BS8110 design
model based upon upper bound approach (BS8110-II Model) (Eqn 6.5 and 6.6), which
adopted the modification via the parameter’s equation of span to effective depth
(a/d), exhibited good agreement with the test results, where a mean value of 1.11
and standard deviation of 0.16 is achieved (see also Table 6.2 Column 6).
6.4 Summary
Two empirical BS8110 design models based upon the modification of existing BS8110
design models have been proposed in this chapter: BS8110-I Model for OPSC cast
without shear reinforcement and BS8110-II Model for OPSC cast with shear
reinforcement.
The BS8110-I Model were proposed for OPSC beams cast without shear
reinforcement, which resulted from the modification of parameters’ equations of the
existing BS8110 Model. The modified parameters’ equations were the span to
effective depth ratio (a/d), and the effective section depth (d), for the ultimate shear
strength predictions.
Whilst for OPSC beams cast with shear reinforcement, modified BS8110-II Model
were proposed, which were based upon the modified parameter’s equation of span
to effective depth (a/d) of the existing BS8110 Model, for the ultimate shear strength
predictions. In general, all the modified BS8110 design models have achieved good
agreement with Author’s test results for OPSC beams.

208
Table 6.1: Comparisons of shear strength predictions with respect to the test results of OPSC beams cast without shear reinforcement
1 2 3 4 5 6
Specimen No
VOPSC
(kN) VBS8110-NS
(kN)
VBS8110-I
(kN)
VOPSC VBS8110-NS
VOSPC VBS8110-I
10A 18.95 16.80 21.48 1.06 0.88
S1 21.05 18.69 22.56 1.13 0.93
12A 54.73 40.52 61.24 1.35 0.89
12B 40.00 26.02 40.83 1.48 0.98
12C 27.37 20.26 24.50 1.35 1.12
12D 25.26 20.26 24.50 1.25 1.03
12E 31.58 21.90 26.48 1.44 1.19
12F 26.31 15.22 22.04 1.73 1.19
16A 56.80 46.13 69.92 1.23 0.81
16B 42.10 30.76 46.62 1.37 0.90
16C 29.50 23.07 26.97 1.28 1.05
16D 26.32 23.07 26.97 1.14 0.94
16E 35.79 24.79 30.06 1.44 1.19
20A 73.68 52.48 78.96 1.40 0.93
20B 52.63 34.99 52.64 1.50 1.00
20C 33.68 26.24 31.58 1.28 1.07
20D 26.37 26.24 31.58 1.04 0.87
20E 35.79 26.25 33.14 1.31 1.08
AD1 58.19 49.35 74.80 1.18 0.78
AD2 32.33 24.68 29.92 1.31 1.08
F1 32.67 24.77 30.04 1.32 1.09
F2 47.41 26.60 32.26 1.78 1.47
H2 52.53 35.58 45.21 1.48 1.16
S2 36.64 25.05 31.03 1.43 1.18
Mean 1.35 1.03
S.D. 0.18 0.15
VOPSC (kN) = Ultimate shear failure load of OPSC beam specimens cast without shear
reinforcement
VBS8110-NS (kN) = Shear resistance of Existing BS8110 design Model (BS8110-NS Model)
For a/d ≤ 2, V BS8110-NS =
⁄
⁄
⁄
b d
For a/d > 2, V BS8110-NS =
⁄
⁄
⁄
b d
VBS8110-I (kN) = Shear resistance of proposing Modified BS8110 design Model (BS8110-I Model)
For a/d < 2.5, VBS8110-I=
⁄
⁄
⁄
b d
For a/d ≥ 2.5, VRdc =
⁄
⁄
⁄
b d

209
Table 6.2: Comparisons of shear strength predictions with respect to the test results of OPSC beams cast with shear reinforcement
1 2 3 4 5 6
Specimen No
VOPSC
(kN) VBS8110-S
(kN)
VBS8110-II
(kN)
VOPSC VBS8110-S
VOSPC VBS8110-II
3A 75.78 57.41 65.00 1.32 1.17
3B 88.41 59.65 67.79 1.48 1.30
3C 92.62 60.53 68.90 1.53 1.34
4A 79.99 70.94 78.53 1.13 1.02
4B 94.73 73.18 81.33 1.29 1.16
4C 107.36 74.07 82.43 1.45 1.30
5A 88.41 98.35 110.24 0.90 0.80
5B 107.36 101.86 114.63 1.05 0.94
5C 119.99 103.24 116.36 1.16 1.03
4D 101.04 78.96 88.55 1.28 1.14
4E 105.25 88.55 100.53 1.19 1.05
Mean 1.25
1.11
S.D. 0.18 0.16
VOPSC (kN) = Ultimate shear failure load of OPSC beam specimens cast with shear reinforcement
VBS8110-S (kN) = Shear resistance of Existing BS8110 design Model (BS8110-S
Model) For
VBS8110-S = [
⁄
⁄
⁄
For
VBS8110-S = [
⁄
⁄
⁄
] b d
VBS8110-II (kN) = Shear resistance of proposing Modified BS8110 design Model
(BS8110-II Model) For
VBS8110-I = [
⁄
⁄
⁄
For
VBS8110-I = [
⁄
⁄
⁄
] b d

210
Figure 6.1 f(a/d) vs a/d for Existing BS8110 design Model (BS8110-NS Model)
and Modified BS8110 design Model (BS8110-I Model).
Figure 6.2 f(ρ) vs ρ(%) for Existing BS8110 design Model (BS8110-NS Model).
f(𝝆
𝐕𝐓𝐞𝐬𝐭
𝟎 𝟏𝟖
𝐛 𝐝
𝟐𝐝𝐚⁄
𝟒𝟎𝟎
𝒅
𝟏𝟒⁄ 𝒇𝒄𝒖
𝟐𝟓
𝟏𝟑
f(𝐚 𝐝
𝐕𝐓𝐞𝐬𝐭
𝟎 𝟕𝟗
𝒃 𝒅
𝟒𝟎𝟎
𝒅
𝟏𝟒⁄
𝝆𝟏𝟑
⁄𝒇𝒄𝒖
𝟐𝟓
𝟏𝟑

211
Figure 6.3 f(fcu) vs fcu (N/mm2) for Existing BS8110 design Model (BS8110-NS
Model).
Figure 6.4 f(d) vs d (mm) for Existing BS8110 design Model (BS8110-NS Model)
and Modified BS8110 design Model (BS8110-I Model).
f(𝒇𝒄𝒖
𝐕𝐓𝐞𝐬𝐭
𝟎 𝟕𝟗
𝐛 𝐝
𝟐𝐝𝐚⁄
𝟒𝟎𝟎
𝒅
𝟏𝟒⁄ 𝝆𝟏𝟑
f(
𝐕𝐓𝐞𝐬𝐭
𝟎 𝟕𝟗
𝐛 𝐝
𝟐𝐝𝐚⁄
𝝆𝟏𝟑⁄𝒇𝒄𝒖
𝟐𝟓
𝟏𝟑

212
Figure 6.5 VOPSC/VBS8110 vs Shear span to effective section depth, a/d.
Figure 6.6 VOPSC/VBS8110 vs Longitudinal steel ratio, ρ (%).

213
Figure 6.7 VOPSC/VBS8110 vs Cube concrete strength, fcu (N/mm2).
]
Figure 6.8 VOPSC/VBS8110 vs Effective section depth, d (mm).

214
Figure 6.9 f(
vs
for Existing BS8110 design Model (BS8110-S Model)
and Modified BS8110 design Model (BS8110-II Model).
Figure 6.10 f( 1/3) vs ( ⁄
) for Existing BS8110 design Model
(BS8110-S Model).
f(𝒇𝒄𝒖𝟏 𝟑
) =
𝐕𝐓𝐞𝐬𝐭
𝟎
𝟖𝟕 𝒇𝒚𝒗 𝐀𝐬𝐰
𝐛 𝐬
𝟎 𝟕𝟗
𝐛 𝐝
𝟐𝐝𝐚⁄
𝟒𝟎𝟎
𝒅
𝟏𝟒⁄ 𝝆𝟏𝟑
f(𝑨𝒔𝒘 𝒔
) = 𝐕𝐓𝐞𝐬𝐭
(𝟎 𝟕𝟗 𝝆𝟏 𝟑𝒇𝒄𝒖
𝟐𝟓
𝟏 𝟑
√𝟒𝟎𝟎
𝒅
𝟒)
𝟎 𝟖𝟕 𝒇𝒚𝒗
𝐛 𝐬
f(
vs

215
Figure 6.11 f( vs for Existing BS8110 design Model (BS8110-S Model)
and Modified BS8110 design Model (BS8110-II Model).
Figure 6.12 VOPSC/VBS8110 vs Shear reinforcement ratio,
.
VOPSC/VBS8110 vs
f(
vs
f(𝐚 𝐝)
= 𝐕𝐓𝐞𝐬𝐭
(𝟎
𝟖𝟕 𝒇𝒚𝒗 𝐀𝐬𝐰
𝐛 𝐬
)
𝟎 𝟕𝟗 𝝆𝟏 𝟑𝒇𝒄𝒖
𝟐𝟓
𝟏 𝟑
√𝟒𝟎𝟎
𝒅
𝟒
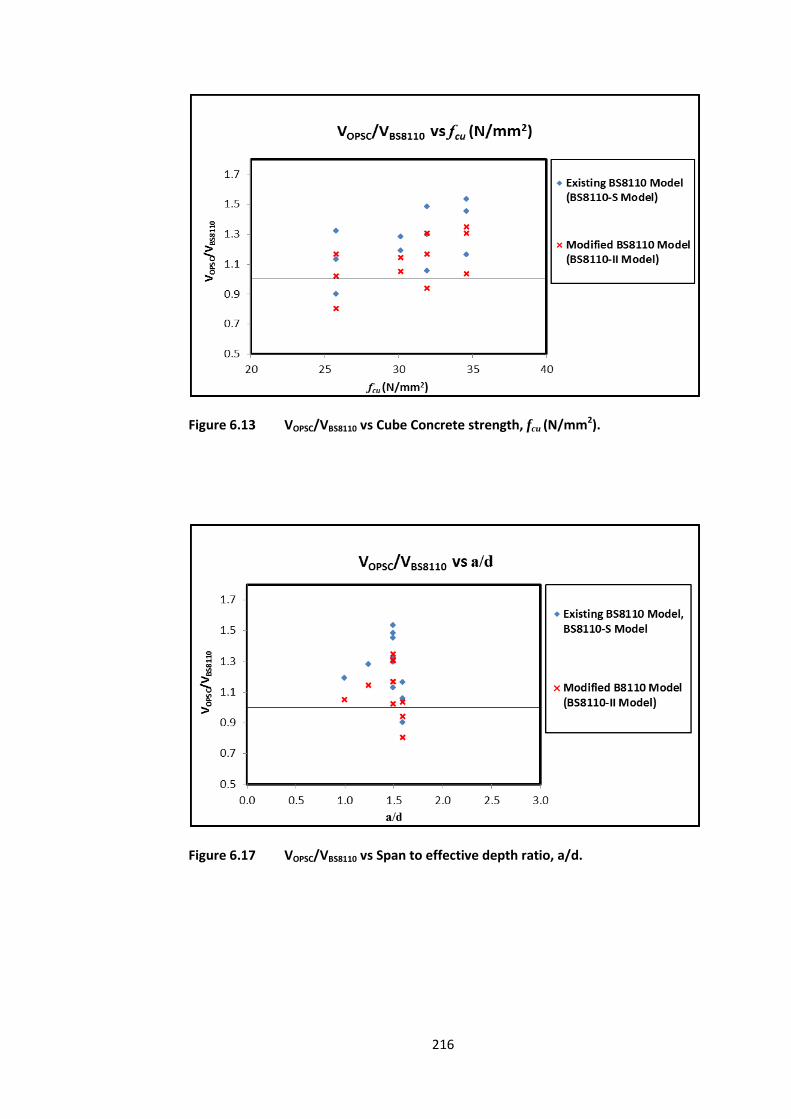
216
Figure 6.13 VOPSC/VBS8110 vs Cube Concrete strength, fcu (N/mm2).
Figure 6.17 VOPSC/VBS8110 vs Span to effective depth ratio, a/d.

217
Chapter 7
Eurocode 2 Design Models
7.1 Introduction
The test observations, the test results, the failure mechanisms and the effect of
parameters were fully described in Chapter 4. It was noted that variations on the
ultimate shear strength do occurred between the Oil Palm kernel Shell Concrete
(OPSC) beams and Normal Weight Concrete (NWC) beams, both cast with and
without shear reinforcement. In Chapter 5 and 6, two theoretical plastic models and
two empirical BS8110 design models were presented, respectively. In Chapter 5 and
6, a model was proposed each for OPSC beams with and without shear reinforcemen
and it was noted that good agreement with the test results were achieved.
In this chapter, Eurocode 2 design model are considered for the shear strength
predictions of the OPSC beam specimens. As mentioned in Section 2.2.1.4.2, the
existing Eurocode 2 design model (EC2-NS Model) considered the shear strength
predictions to be a function of parameters: (1) shear span to effective section depth
ratio (a/d), (2) longitudinal steel ratio (ρ), (3) concrete cylindrical compressive
strength (fck), and (4) effective section depth (d), to account for common variations
that would occur in NWC beam cast without shear reinforcement. Whilst for NWC
beam cast with shear reinforcement, the existing EC2 design model (EC2-S Model)
considered the (1) concrete cylindrical compressive strength (fck), (2) inclination angle
of shear cracks (Θ), and (3) shear reinforcement ratio (ρs) as the parameters, which

218
influenced the ultimate shear resistance of NWC Beams with shear reinforcement
(see Section 2.2.2.4.2).
In this chapter, investigations on the requirements for modification on shear strength
parameters are reported for both cases of OPSC beams casting with and without
shear reinforcement. From the investigations, two empirical design models (EC2-I
Model and EC2-II Model), which are the results of modifications of the parameters,
are proposed to predict for the ultimate shear capacity of Oil Palm kernel Shell
Concrete (OPSC) beams cast without and with shear reinforcement, respectively.
For OPSC beam without shear reinforcement, EC2-I Model modified the parameters’
equations of shear span to effective section depth ratio (a/d), longitudinal steel ratio
(ρ), concrete compressive strength (fck), and effective section depth (d). Whilst for
OPSC beam with shear reinforcement, EC2-II Model modified the parameter of shear
reinforcement ratio (ρs) for the prediction of ultimate shear capacity of the beams.
Full detail of the prediction models, EC2-I Model and EC2-II Model are presented in
Section 7.2 and 7.3, respectively.
A point to note in this chapter is that the partial safety factor, for both concrete
and steel reinforcement is equal to 1 in the ultimate shear strength equation. In
addition, it is to be noted that the concrete strength, fck in both the existing and
modified Eurocode 2 design models is based on the cylindrical compressive strength
of concrete, fck. Hence, a multiplication of 0.8 to the cube compressive strength, fcu
from the test data were adopted to convert the cube size of 100 mm wide and 100
mm height to cylindrical size of 150 mm diameter and 300 mm height to obtain the
cylindrical compressive strength of concrete, fck, as suggested by Bill et. al [63] for
concrete strength conversion of 100 mm cube to 150 diameter cylindrical.

219
7.2 Beams cast without shear reinforcement
7.2.1 Eurocode 2 design model for OPSC beam without shear reinforcement,
“EC2- I model”
The proposing “EC2-I” Model is developed to predict for the ultimate shear
resistance of a reinforced concrete beam element without shear reinforcement cast
using Oil Palm kernel Shell Concrete (OPSC) as coarse aggregate.
The existing Eurocode 2 (EC2-NS Model) presented a formula for the ultimate shear
strength predictions of NWC beam without shear reinforcement. The parameters
considered by EC2-NS Model are (1) shear span to effective section depth ratio (a/d),
(2) longitudinal steel ratio (ρ), (3) concrete cylindrical compressive strength (fck), and
(4) effective section depth (d).
Since a significant similarity has been observed in Section 4.2.1 for both failure
mechanisms of OPSC and NWC beams cast without shear reinforcement, the test
results of OPSC beams were therefore compared with the predictions of the existing
EC2 Model (Eqn 2.19) to evaluate whether the existing model is relevant (see Column
2 and 3 in Table 7.1). Summary of the comparisons are presented in Table 7.1
(Column 5), which it can be noted that the existing Eurocode 2 design model (EC2-NS
Model) underestimated the ultimate shear capacity of OPSC beam specimens cast
without shear reinforcement with a mean value of 1.29 and standard deviation of
0.17. As a result, modifications were decided to be carried out to the parameters to
reflect the observation derived from the tests. The parameters modified are; span to
effective depth ratio (a/d), and effective section depth (d). Such modifications are
required to accommodate for the variations observed from tests, such as

220
underestimations of the parameters span to effective depth ratio, a/d ≤ 2.5, and
effective section depth, d = 82 mm.
7.2.2 Modification on parameters
From Section 7.2.1, it was noted that the existing Eurocode 2 model (EC2-NS Model)
underestimated the ultimate shear strength of OPSC beam cast without shear
reinforcement. As a result, further analyses were carried out to evaluate the
relevancy of the parameters: (1) span to effective section depth ratio (a/d), (2)
longitudinal steel ratio (ρ), (3) cylindrical concrete strength (fck), and (4) effective
section depth (d), which influence the shear capacity predictions of the beams.
7.2.2.1 Span to effective depth ratio, a/d
It can be noted from Figure 7.1 that as the span to effective depth ratio (a/d)
decreases, the rate of increase of ultimate shear strength for both OPSC and NWC
beam specimens are more pronounce than the prediction values derived from the
existing EC2 design model (EC2-NS Model). That is, the existing EC2 design model
(EC2-NS Model) (Eqn 2.22.1) underestimated the increment of the ultimate shear
strength with respect to a/d ratio of less than 2.5. It is believed that such discrepancy
arose due to the existing expression given by the existing EC2 model (EC2-NS Model),
which took into account the increment of ultimate shear strength for the reduction
of span to effective depth ratio for beams loaded with a/d ≤ 2 instead of a/d ≤ 2.5.
In view from the observations from experiments (Section 4.2.1), it is noted that the
failure modes for concrete beams without shear reinforcement, varied for a/d < 2.5

221
and a/d ≥ 2.5, respectively, which shear compression failure occurred at a/d < 2.5
whilst shear failure and diagonal tension failure occurred at a/d ≥ 2.5. Therefore, the
existing expression was revised to be Eqn 7.1.1 to accommodate for both the rate of
increase in shear capacity as span to effective depth (a/d) reduces and the two
distinct failure modes observed for a/d < 2.5 and a/d ≥ 2.5. With the revised
expression for span ratio (Eqn 7.1.1), good agreement with test results are achieved
(see Figure 7.1).
f(
) = 2.5
(
< 2.5) (Eqn 7.1.1)
7.2.2.2 Longitudinal steel ratio, ρ
In general, it can be noted in Figure 7.2 that shear strength of OPSC specimens with
respect to longitudinal steel ratio’s parameter, f(ρ) were observed to be lower to
those of NWC control samples as observations from tests indicate that for beams
casted with higher longitudinal steel ratio (ρ = 3.63 %) (see Figure 4.44), higher
ultimate shear strength were obtained by NWC beam (Specimen NWCE) compared to
OPSC beam (Specimen 20E). It is believed such discrepancies occurred due to the
higher aggregate impact strength provided by the gravel aggregates (See Table 2.1),
and, as a result, higher shear resistance was mobilised by NWC beam.
It can also be noted from Figure 7.2 that the shear failure loads of OPSC beams with
respect to the longitudinal steel ratio’s are slightly higher in comparison to the
predictions derived from the existing EC2 design model (EC2-NS Model) (Eqn 2.22.2).
Since the f(ρ) of the ultimate shear strength predictions derived from the existing EC2
design model (EC2-NS Model) marginally underestimated the shear failure loads of
the OPSC beams, the existing expression are therefore acceptable. That is, adequate

222
predictions of the shear strength increment with respect to the increment of
longitudinal steel ratio are provided for OPSC beams. Thus, the existing parameter
longitudinal reinforcement ratio’s equation (Eqn 2.22.2) are adopted into the
modified EC2 design model (EC2-I Model) to account for the increment of the
ultimate shear strength of OPSC beam as longitudinal steel ratio increases.
7.2.2.3 Cylindrical concrete strength, fck
In general, it can be observed that the shear strength of OPSC beam specimens
without shear reinforcements with respect to cube concrete strength parameter,
f(fcu) were observed to be lower to those of NWC control samples as observations
from tests indicate that the ultimate shear strength obtained by NWC beam
specimens (Specimen NWC2 and NWC3) were higher than those of OPSC beam
specimens (Specimen 16C and F1) (see Figure 4.46). It is believed that such
discrepancy in shear strength between NWC and OPSC beams is due to the
differences in the fracture strength of coarse aggregates. That is, higher fracture
strength found in the gravel aggregates (see Table 2.1) would have enhance the
aggregate interlocking capacity, and, as a result, higher shear resistance was
mobilised by NWC beam.
In addition, it can be noted from Figure 7.3 that the shear failure loads of OPSC
beams with respect to the cylindrical concrete strength are f(fck), are slightly higher in
comparison to the predictions derived from existing Eurocode 2 model (EC2-NS
Model) (Eqn 2.22.3). Furthermore, since the predictions derived from the existing
EC2 design model (EC2-NS Model) with respect to f(fck) marginally underestimated
the shear failure loads of the OPSC beams, the existing expression therefore

223
satisfactory. Therefore, the existing parameter concrete compressive strength’s
equation (Eqn 2.22.3) are adopted into the modified EC2 design model (EC2-I Model)
to account for the increment in the ultimate shear strength of OPSC beam as
concrete compressive strength increases.
7.2.2.4 Beam effective depth, d
In Figure 7.4, it is observed that the predictions derived from the existing EC2 design
model (EC2-NS model) (Eqn 2.22.4) with respect to effective section depth, f(k), were
lower than the shear failure loads of OPSC specimens with effective section depth, d
= 82 mm (h=113 mm). Test observations show that for d = 82mm, the ultimate shear
failure loads obtained by both beams (Specimen 12F and NWC5) are comparable
with differences of 4% (see Figure 4.49).
Whilst for OPSC specimens with effective depth, 165 ≤ d ≤167, the shear failure loads
were noted to be lower to that of NWC control specimens. Such discrepancy is
believed to be attributed to the lower aggregate strength found in Oil Palm kernel
Shell (OPS) compared to that found in normal aggregates, which in turn, would have
led to lower aggregate interlocking capacity, and as a result, lower ultimate shear
resistance could be mobilised. In addition, from Figure 7.5, for effective section
depth, d ≥ 165, it is noted that the predictions of the existing EC2 design model is
lower than shear failure loads of OPSC specimens.
Hence, the existing equation was revised to be Eqn 7.1.2 to accommodate for both
the rate of increase in shear capacity as the effective section depth, d reduces. With
the revised expression for effective section depth (Eqn 7.1.2), good agreement with
test results is achieved, as shown In Figure 7.4.

224
f(k) =
(d in mm) (Eqn 7.1.2)
7.2.3 Comparisons with test results
From the modifications of parameters proposed in Section 7.2.2 for the shear
strength predictions of OPSC beams without shear reinforcement, the proposing
modified EC2 design model (EC2-NS Model) is given as:
For a/d < 2.5,
VRdc = [0.18
(100 ρ fck)
1/3 + k1 σ cp] bw d (
) (Eqn 7.2)
For a/d ≥ 2.5,
VRdc = [0.18
(100 ρ fck)
1/3 + k1 σcp] bw d (Eqn 7.3)
Where,
k1 = 0.15
Crd,c =
, where = partial factor of concrete
It can be observed from Figure 7.5 to 7.8 that the proposing Eurocode 2 design
model (EC2-I Model) (Eqn 7.2 and 7.3 for beams loaded with a/d < 2.5 and a/d ≥ 2.5,
respectively) with respect to parameters: shear span to height ratio (a/h),
longitudinal steel ratio (ρ), concrete strength (σc), and overall section depth (h)
exhibit good agreement with the test results, in which a mean value of 1.05 and
standard deviation of 0.15 are achieved (see also Table 7.1 Column 6).

225
7.3 Beams cast with shear reinforcement
7.3.1 Eurocode 2 design model for cocnrete beam with shear reinforcement, (EC2-
II Model)
The proposing “EC2-II” Model is developed to predict for the ultimate shear
resistance of a reinforced concrete beam element with shear reinforcement cast
using Oil Palm kernel Shell Concrete (OPSC) as coarse aggregate.
The existing Eurocode 2 (EC2-S Model) presented two formulas for the predictions of
ultimate shear strength for NWC beam with shear reinforcement (see Eqn 2.48 and
Eqn 2.49). Eqn 2.47 considered the yielding of shear reinforcement via the
parameters: (1) inclination angle of shear cracks (ϴ) and (2) the shear reinforcement
ratio (
), whilst Eqn 2.48 considered the crushing of concrete compression strut via
the parameters: (1) concrete strength (2) inclination angle of shear cracks (ϴ).
Since a significant similarity has been observed in Section 4.3.1 for both failure
mechanisms of OPSC and NWC beams cast with shear reinforcement, hence, further
analyses were carried out to examine the relevancy of the existing EC2 model (EC2-S
Model) (Eqn 2.48 and 2.49) for the predictions of shear strength of OPSC beam
specimens. Comparisons were summarized and presented in Table 7.2. which it is
observed that the ultimate shear strength predictions given by the Equation 2.49
achieved good agreement with the test results of OPSC beam specimens with shear
reinforcement (see Table 7.2 Column 8) with a mean of 1.02 and standard deviation
of 0.21. Whilst for the shear strength predictions given by Equation 2.48 (see Table
7.2 Column 4), it is noted that the existing EC2 design model underestimated the

226
shear strength of OPSC beam with shear reinforcement (see Table 7.2 Column 7) with
a mean of 2.43 and standard deviation of 0.48.
7.3.2 Modification on parameter
It was noted from Section 7.3.1 that the Eqn 2.47 in the existing Eurocode 2 design
model (EC2-S Model) underestimated the ultimate shear capacity of OPSC beams
with shear reinforcement. Hence, further analysis were carried out to evaluate the
relevancy of parameters: (1) inclination angle of shear cracks (ϴ) and (2) the shear
reinforcement ratio (
), governing the shear strength predictions of EC2-S Model
and to provide with appropriate modifications (see Section 7.3.2.1 and 7.3.2.2).
7.3.2.1 Inclination angle of shear cracks, ϴ
In general, it can be noted from Figure 7.9 that the predictions derived from the
existing EC2 design model (EC2-S Model) (Eqn 2.50.1) with respect to f(ϴ) are in good
agreement with the shear failure loads of the OPSC beams. Therefore, the existing
expression (Eqn 2.50.1) are acceptable and are adopted into the proposed EC2 design
model (EC2-II Model) to account for the increment of the ultimate shear strength of
OPSC beam as inclination angle of shear cracks increases.
7.3.2.2 Shear reinforcement ratio,
It can be noted in Figure 7.10 that the prediction values derived from the existing EC2
design model (EC2-S Model) are observed to underestimate the failure loads of OPSC
specimens. Test results indicate that the shear failure loads achieved by OPSC beams

227
are slightly higher than those of NWC control specimens (see Figure 4.73). It is
believed that such discrepancy was attributed to the rougher surface texture
observed from the OSPC beams compared to NWC beams (see Figure 4.70 and 4.71).
Consequently, this would have led to higher aggregate interlocking resistance, and,
as a result, higher shear resistance was mobilised.
In view of the discrepancies noted between the test results and the existing EC2-S
Model (Eqn 2.50.2), a revised expression has been proposed to the EC2-S Model (See
Eqn 7.4) to account for the increment of shear strength observed, which would be
resulted from the increase of shear reinforcement ratio. With the revised expression
for shear reinforcement ratio (Eqn 7.4), better agreement with test results are
achieved, as shown in Figure 7.10.
f(
(Eqn 7.4)
7.3.3 Comparisons with test results
From the modifications of parameters proposed in Section 7.3.2 for the shear
strength predictions of OPSC beams with shear reinforcement, the proposing
modified EC2 design model (EC2-II Model) is given as:
VEC2-II = 0.87 (
(Eqn 7.5)
Comparisons between the modified Eurocode 2 design model (EC2-II Model) (Eqn
7.5) and the test results with respect to parameters: (1) inclination angle of shear
cracks (ϴ) and (2) the shear reinforcement ratio (
), indicate that agreement are

228
achieved (see Figure 7.11 and 7.12) (mean value of 1.10 and standard deviation of
0.21 as shown in see Table 7.2, Column 9).
7.4 Summary
Two Eurocode 2 (EC2) design models (EC2-I Model and EC2-II Model) based upon the
modification of the existing Eurocode 2 design models have been proposed in this
chapter for the ultimate shear strength predictions of OPSC beams cast with and
without shear reinforcement, respectively.
The proposed EC2-I Model took into account the parameters: span to effective
section depth ratio (a/d), cylindrical concrete strength (fck), longitudinal steel ratio (ρ)
and effective section depth (d), which each parameter were modified for the
ultimate shear strength predictions of the OPSC beams without shear reinforcement.
Whilst for OPSC beams with shear reinforcement, the proposed EC2-II Model are the
outcomes of the modified parameter of shear reinforcement ratio
) for the
ultimate shear strength predictions.
Generally, the modified EC2 design models (EC2-I Model and EC2-II Model) achieved
good agreement with the test results for OPSC beams without and with shear
reinforcement, respectively.

229
Table 7.1 Comparisons of shear strength predictions with respect to the test results of OPSC beam specimens cast without shear reinforcement
1 2 3 4 5 6
Specimen No
VOPSC
(kN) VEC2-NS
(kN)
VEC2-I
(kN)
VOPSC VEC2-NS
VOSPC VEC2-I
10A 18.95 18.53 20.23 1.02 0.94
S1 21.05 19.46 21.25 1.08 0.99
12A 54.73 42.19 57.68 1.30 0.95
12B 40.00 28.13 38.45 1.42 1.04
12C 27.37 21.09 23.07 1.30 1.19
12D 25.26 21.09 23.07 1.20 1.09
12E 31.58 22.80 24.94 1.38 1.27
12F 26.31 17.22 22.41 1.62 1.17
16A 56.80 48.04 65.87 1.18 0.86
16B 42.10 32.02 43.91 1.31 0.96
16C 29.50 24.02 26.35 1.23 1.12
16D 26.32 24.02 26.35 1.10 1.00
16E 35.79 25.82 28.32 1.39 1.26
20A 73.68 54.08 74.40 1.36 0.99
20B 52.63 37.06 49.60 1.46 1.06
20C 33.68 27.04 29.76 1.25 1.13
20D 27.37 27.04 29.76 1.01 0.92
20E 35.79 28.38 31.23 1.26 1.15
AD1 58.19 51.39 70.47 1.13 0.83
AD2 32.33 25.69 28.19 1.26 1.15
F1 32.67 25.79 28.30 1.27 1.15
F2 47.41 27.70 30.39 1.71 1.56
H2 52.53 37.13 43.52 1.41 1.21
S2 36.64 27.65 29.23 1.38 1.25
Mean 1.29 1.09
S.D. 0.17 0.16
VOPSC (kN) = Ultimate shear failure loads of OPSC beam specimens cast without shear
reinforcement
VEC2-NS (kN) = Shear resistance of Existing EC2 design model (EC2-I Model)
For a/d ≤ 2, VRdc = [0.18( √
(100 ρ fck)
1/3 + k1 σ cp] bw d (
)
For a/d> 2, VRdc = [0.18 √
(100 ρ fck)
1/3 + k1 σcp] bw d
VEC2-I (kN) = Shear resistance of proposing Modified EC2 design model (EC2-I Model)
For a/d < 2.5, VRdc = [0.18( √
(100 ρ fck)
1/3 + k1 σ cp] bw d (
)
For a/d ≥ 2.5, VRdc = [0.18 √
(100 ρ fck)
1/3 + k1 σcp] bw d

230
Table 7.2 Comparisons of shear strength predictions with respect to the test results of OPSC beams cast with shear reinforcement
1 2 3 4 5 6 7 8 9
Specimen No
Measured angle
inclination of shear cracks
(degree)
Test results
EC2-S Model
VEC-S (kN) EC2-II Model
VOPSC V EC-S
VOSPC VEC2-II
VOPSC VRd,s
VOPSC VRd,max
VOPSC
(kN) VRd,s
(kN) Eqn 2.48
VRd,max
(kN) Eqn 2.49
VEC2-II
(kN)
3A 34 75.78 36.11 80.11 79.44 2.10 0.95 0.95
3B 35 88.41 34.78 98.37 76.52 2.54 0.90 1.16
3C 40 92.62 29.03 110.65 63.86 3.19 0.84 1.45
4A 41 79.99 42.03 85.56 92.46 1.90 0.93 0.87
4B 41 94.73 42.03 103.66 92.46 2.25 0.91 1.02
4C 45 107.36 36.53 112.35 80.37 2.94 0.96 1.34
5A 38 88.41 58.47 78.63 128.64 1.51 1.12 0.69
5B 42 107.36 50.74 97.64 111.62 2.12 1.10 0.96
5C 44 119.99 47.31 105.31 104.08 2.54 1.14 1.15
4D 50 101.04 36.53 90.76 80.37 2.77 1.11 1.26
4E 53 105.25 36.53 85.49 80.37 2.88 1.23 1.31
Mean 2.43 1.02
0.97
1.10
S.D. 0.48 0.21 0.21
VOPSC (kN) = Ultimate shear capacity of the tested OPSC beam with shear reinforcement
VEC-S (kN) = Shear resistance of Existing EC2 design model (EC2-S Model)
VRd,s (kN) = Shear resistance of Existing EC2 design model (EC2-S Model), which considered the yielding of shear reinforcement
VEC2-II = 0.87 (
VRd,max (kN) = Maximum shear resistance of Existing EC2 design model (EC2-S Model),
which considered the crushing of compression struts
Vrd,max =
VEC2-II (kN) = Shear resistance of proposing Modified EC2 design model of VRd,s (EC2-II
Model)
VEC2-II = 0.87 (

231
Figure 7.1 f(a/d) vs a/d for Existing EC2 design model (EC2-NS Model) and Modified EC2 design model (EC2-I Model).
Figure 7.2 f(ρ) vs ρ(%) for Existing EC2 design model (EC2-NS Model).
f(𝝆
𝐕𝐓𝐞𝐬𝐭
𝟎 𝟏𝟖
𝐛 𝐝
𝟐𝐝𝐚⁄
𝟏 𝟐𝟎𝟎
𝒅
𝒇𝒄𝒌
𝟏𝟑
f(𝐚 𝐝
𝐕𝐓𝐞𝐬𝐭
𝟎 𝟏𝟖
𝐛 𝐝
𝐤 𝝆
𝟏𝟑⁄
𝒇𝒄𝒌
𝟏𝟑

232
Figure 7.3 f(fck) vs fck (N/mm2) for Existing EC2 design model (EC2-NS Model).
Figure 7.4 f(k) vs d (mm) for Existing EC2 design model (EC2-NS Model) and Modified EC2 design model (EC2-I Model).
f(𝒇𝒄𝒌
𝐕𝐓𝐞𝐬𝐭
𝟎 𝟏𝟖
𝐛 𝐝
𝟐𝐝𝐚⁄
𝟏 𝟐𝟎𝟎
𝐝 𝝆𝟏𝟑
f(𝐤
𝐕𝐓𝐞𝐬𝐭
𝟎 𝟏𝟖
𝐛 𝐝
𝟐𝐝𝐚⁄
𝝆𝟏𝟑⁄
𝒇𝒄𝒌
𝟏𝟑

233
Figure 7.5 VOPSC/VEC2 vs Shear span to effective section depth, a/d.
Figure 7.6 VOPSC/VEC2 vs Longitudinal steel ratio, ρ (%).

234
Figure 7.7 VOPSC/VEC2 vs Cylindrical concrete strength, fck (N/mm2).
Figure 7.8 VOPSC/VEC2 vs Effective section depth, d (mm).

235
Figure 7.9 f(cot ϴ) vs ϴ (degree) for Existing EC2 design model (EC2-S Model).
Figure 7.10 f(
) vs (
for Existing EC2 design model (EC2-S Model) and
Modified EC2 design model (EC2-II Model).
f(co
t θ
) =
𝐕𝐓𝐞𝐬𝐭
𝟎 𝟖𝟕 𝒇𝒚𝒘
𝐳 𝐀𝐬𝐰 𝐬
f(𝑨𝒔𝒘 𝒔
) =
𝐕𝐓𝐞𝐬𝐭
𝟎 𝟖𝟕 𝒇𝒚𝒘 𝐳
𝐜𝐨𝐭 𝜽
f(
) vs
f(cot θ) vs Θ (degree)

236
Figure 7.11 VOPSC/VEC2 vs Inclination of shear cracks, ϴ (degree).
Figure 7.12 VOPSC/VEC2 vs Shear reinforcement ratio,
.
VOPSC/VEC2 vs
VOPSC/VEC2 vs (degree)
ϴ (degree)

237
Chapter 8
Conclusions and Future Work
8.1 Summary of current study
In recent years, Oil Palm Shell Concrete (OPSC), which use the oil palm kernel shell
(OPS) aggregate as the full replacement for coarse aggregate, has received a great
deal of attention from researchers. Considerable amount of research have been
carried out to aid the understanding of its concrete mixture designs [1-6] and its
material properties [7-11]. However, only limited amount of works have been carried
out to aid the understanding of the OPSC structural resistance, such as bending
resistance [12-14] and shear resistance [15-16]. It is apparent that more research is
required to develop a comprehensive understanding for its structural element,
particularly in the shear transfer mechanism.
The main objective of this research was to explore the shear resistance of OPSC
beams cast with and without shear reinforcement through experimental and
analytical study. Mix designs of OPSC were proposed for structural applications. The
experimental work carried out in this research involved destructive testing of OPSC
beams and NWC beams casted with and without shear reinforcements. Three distinct
failure mechanisms were observed from the tests: the shear compression
mechanism; the diagonal tension mechanism; and the shear mechanism. The effect
of variables on the ultimate shear failure loads of OPSC beams case with and without
shear reinforcement were investigated.

238
Comparisons were carried out on the ultimate shear failure capacities and shear
failure mechanisms between the OPSC beams and NWC beams cast with and without
shear reinforcements, respectively, which it was found that the shear strength of
OPSC beams and NWC beams were comparable when the beams were tested with
respect to the variables: effective depth (for beams without shear reinforcements),
and shear reinforcement ratio and inclination angle of shear cracks (for beams with
shear reinforcements).
Since significant similarity were observed for both OPSC and NWC beams in term of
failure mechanism, the test results of OPSC were therefore compared with respect to
the theoretical plastic model, Eurocode 2 design model, and BS8110 design model, to
investigate the requirement for the model’s parameters’ modification. As results,
two models were developed each from the modification of the existing models with
respect to theoretical plastic model, Eurocode 2 design model, and BS8110 design
model, for the ultimate shear failure predictions of OPSC beams with and without
shear reinforcements, respectively. In all cases, the proposed models achieved good
agreement with the test results.
8.2 Mix Design of Oil Palm kernel Shell Concrete (OPSC)
Three mix designs had been proposed for Oil Palm kernel Shell concrete (OPSC) for
structural applications. The proposed mix designs include: 3:1:3 and 4:1:3 and 5:1:3
of Ordinary Portland Cement: Sand: OPS aggregate.
239
8.3 Failure Mechanisms and Effect of Variables on OPSC beams
The experimental work carried out in this research involved destructive testing of
twenty-four numbers of OPSC beam specimens casted without shear reinforcement
and eleven numbers of OPSC beams casted with shear reinforcement. For OPSC
beams casted without shear reinforcements, three distinct failure mechanisms were
observed from the tests: the shear compression mechanism; the diagonal tension
mechanism; and the shear mechanism. Whilst for OPSC beams casted with shear
reinforcements, shear failure mechanism was observed from the tests.
It was observed from tests that all the beam specimens cast without shear
reinforcement failed in shear mode of failure. Three modes of shear failure were
observed: shear compression failure for a/d < 2.5, diagonal tension failure and shear
failure, respectively, for a/d ≥ 2.5 for OPSC beams without shear reinforcement.
Whilst for OPSC beams with shear reinforcement, shear compression failure were
observed.
The effect of variables to the ultimate failure loads of OPSC beams with and without
shear reinforcement were investigated, respectively. For OPSC beams without shear
reinforcement, the ultimate failure loads increases with respect to the reduction of
span to depth ratio (a/d), increment of concrete strength (fcu), longitudinal steel ratio
(ρ) and section depth (h). Whilst for OPSC beams with shear reinforcement, the
ultimate failure loads increases with the inclination angle of shear cracks (ϴ),
concrete strength (fcu) and shear reinforcement spacing (s), respectively.

240
8.4 Comparisons between OPSC and NWC beams
Comparisons were carried out on the ultimate shear failure capacities and the shear
failure mechanisms between OPSC beams and NWC beams cast with and without
shear reinforcement, respectively. It was found that the ultimate shear strength of
OPSC beams and NWC beams are comparable for the parameters: section depth (for
beams without shear reinforcement), and shear reinforcement spacing and
inclination angle of shear cracks (for beams with shear reinforcement). However,
discrepancies in ultimate shear strength between the OPSC beams and NWC beams
were observed for the parameters: span to depth ratio, longitudinal steel ratio and
concrete strength (for beams without shear reinforcement) and concrete strength
(for beams with shear reinforcement).
8.5 Theoretical models
The existing plastic models: CP-NS Model and CP-S Model presented by Braestrup
[45] and Neilsen et.al [46] were developed for NWC beams without and with shear
reinforcements, respectively. Since significant similarity was observed for OPSC and
NWC beams in the failure mechanism, therefore, investigations were carried out
using the existing CP models to evaluate the relevancy of the models for the shear
resistance predictions of OPSC beams. It was found that the CP-NS Model and CP-S
Model underestimated the ultimate shear capacity of the OPSC beams cast with and
without shear reinforcements, respectively. Hence, further analytical studies were
carried out using the existing models with respect to each tested variables.
As a result, appropriate modifications were carried out as required on the existing
parameters to allow for the ultimate shear strength predictions of OPSC beams with

241
and without shear reinforcement, respectively. Two theoretical models were
proposed for predicting the ultimate shear failure load of the OPSC beams: CP-I
Model for OPSC beams without shear reinforcements and CP-II Model for OPSC
beams with shear reinforcements.
8.5.1 CP-I Model
From the analytical studies carried out by comparisons of test results with the
existing concrete plastic Model (CP-NS Model), it was found that the existing plastic
model overestimated the ultimate shear failure load of OPSC beams without shear
reinforcements with a mean value of 0.89 and standard deviation of 0.19. Therefore,
analytical studies were carried out respect to each parameter (span overall depth
ratio, longitudinal steel ratio, concrete strength and overall section depth) to
determine the requirement for modifications on the parameters.
Hence, CP-I Model, which was the results of the modification on each parameter, was
proposed for the ultimate shear strength predictions of OPSC beams without shear
reinforcements. The proposed CP-I model achieved good agreement (mean of 1.07
and standard deviation of 0.15) with the test results.
8.5.2 CP-II Model
Comparison studies were carried out between the ultimate shear strength
predictions of OPSC beams with shear reinforcements given by the existing CP-S
Model and the test results of OPSC beams with shear reinforcements. It was found
that the existing plastic model overestimated the ultimate shear failure load of OPSC

242
beams without shear reinforcements with a mean value of 0.92 and standard
deviation of 0.05. Hence, analytical studies were carried out respect to each tested
parameters (shear reinforcement ratio, concrete strength and inclination angle of
shear cracks) to determine the requirement for the modification of the parameters.
It was found that modification was required for parameter: concrete strength and
subsequently, the modified parameter was incorporated into the proposed modified
CP design model (CP-II Model) for the ultimate shear strength predictions of OPSC
beams with shear reinforcements. It was found that very good agreement between
the proposed CP-II model and the test results is achieved (mean of 1.03 and standard
deviation of 0.05).
8.6 BS8110 design models
The existing BS8110 design models (BS8110-NS Model and BS8110-S Model) are
based on the ultimate shear strength predictions of NWC beams with and without
shear reinforcements, respectively. Since significant similarity were observed for
both OPSC and NWC beams for its failure mechanism, the test results were therefore
compared with the existing BS8110 design models to evaluate the relevancy of the
model in predicting the shear failure loads of OPSC beams. It was found that these
EC2 models underestimated the ultimate shear strength of OPSC beams cast with
and without shear reinforcements, respectively. Therefore, investigations were
carried out using the existing BS8110 design models with respect to each tested
variables.
Hence, the existing BS8110 design models were modified to allow for the ultimate
shear strength predictions of OPSC beams with and without shear reinforcement,

243
respectively. Two BS8110 design models were proposed for predicting the ultimate
shear failure load of the OPSC beams: BS8110-I Model for OPSC beams without shear
reinforcements and BS8110-II Model for OPSC beams with shear reinforcements.
8.6.1 BS8110-I Model
Analytical studies were carried out using the existing BS8110 design model (BS8110-
NS Model) for the ultimate shear strength predictions of OPSC beams without shear
reinforcements, which the predicted values were compared with the test results of
OPSC specimens. It was found that the existing BS8110 design model underestimated
the ultimate shear failure load of OPSC beams without shear reinforcements with a
mean of 1.35 and standard deviation of 0.18. Therefore, further investigations were
carried out to identify the requirement for the parameters’ modification with respect
to parameters considered: (span to effective depth ratio, longitudinal steel ratio,
concrete strength and effective section depth).
It was found that modification was required for the parameters: span to effective
depth ratio (a/d), and effective section depth (d). The modified BS8110 design model
(BS8110-I Model), which incorporated both the modified parameters and unaltered
parameters, was proposed for the ultimate shear strength predictions of OPSC beams
without shear reinforcements. It was found that the proposed BS8110-I Model
achieved good agreement with the test results (mean of 1.03 and standard deviation
of 0.15).

244
8.6.2 BS8110-II Model
Comparison studies were carried out between the ultimate shear strength
predictions of OPSC beams with shear reinforcements given by the existing BS8110
design model (BS8110-S Model) and the test results of OPSC beams with shear
reinforcements, which it was found that the existing plastic model underestimated
the ultimate shear failure load of OPSC beams without shear reinforcements with a
mean value of 1.25 and standard deviation of 0.18. Hence, analytical studies were
carried out respect to each tested parameter (shear reinforcement ratio, concrete
strength and span to effective depth ratio) to determine the requirement for the
modification of parameters.
It was found that modification was required for the parameter: span to effective
depth ratio and subsequently, the modification was adopted into the proposed
BS8110-II Model for the shear strength predictions of OPSC beams with shear
reinforcements. A good agreement was found between the proposed BS8110-II
model and the test results are achieved (mean of 1.11 and standard deviation of
0.16).
8.7 Eurocode 2 design models
The existing Eurocode 2 design models (EC2-NS Model and EC2-S Model) are based
on the ultimate shear strength predictions of NWC beams with and without shear
reinforcements. Since significant similarity was observed for OPSC and NWC beams in
the failure mechanism, therefore, the relevancy of the existing Eurocode 2 design
models for the shear strength predictions of OPSC beams were evaluated. It was
found that the models underestimated the ultimate shear strength of OPSC beams

245
cast with and without shear reinforcements, respectively. Further investigations were
carried out with respect to each tested variables to determine the requirement for
the shear strength parameters’ modification.
Hence, the existing Eurocode 2 design models were modified to allow for the
ultimate shear strength predictions of OPSC beams with and without shear
reinforcement, respectively. Two Eurocode 2 design models were proposed for
predicting the ultimate shear failure load of the OPSC beams: EC2-I Model for OPSC
beams without shear reinforcements and EC2-II Model for OPSC beams with shear
reinforcements.
8.7.1 EC2-I Model
Investigations were carried out using the existing EC2 design model (EC2-NS Model)
for the ultimate shear strength predictions of OPSC beams without shear
reinforcements, which the predicted values were compared with the test results of
OPSC specimens.
It was found that the existing EC2 design model (EC2-NS Model) underestimated the
ultimate shear failure load of OPSC beams without shear reinforcements with a mean
of 1.29 and standard deviation of 0.17. Therefore, further investigations were carried
out to identify the requirement for modification with respect to the parameters. It
was found that modification were required for the parameters’ of span to effective
depth ratio (a/d) and effective section depth (d).
Upon modification, EC2-I Model, which incorporated both the modified parameters
and unaltered parameters, was proposed for the ultimate shear strength predictions

246
of OPSC beams without shear reinforcements. It was found that very good
agreement between the proposed EC2-I Model and the test results is achieved (mean
of 1.09 and standard deviation of 0.16).
8.7.2 EC2-II Model
Investigations were carried out using the existing Eurocode 2 design model (EC2-S
Model) for the shear strength predictions of OPSC beams without shear
reinforcements, which the test results achieved by OPSC beams were compared with
the shear strength predictions derived from the EC2-S Model.
It was found that the EC2-S Model, which considered the yielding of shear
reinforcement, has underestimated the ultimate shear failure loads of OPSC beams
with shear reinforcements (mean of 2.43 and standard deviation of 0.48). Hence,
further investigations were carried out on each parameter (shear reinforcement ratio
and inclination angle of shear cracks) to determine the requirement for the
parameters’ modification.
Subsequently, a modified EC2 design model (EC2-II Model) was proposed as the
results of the modification on the parameter: shear reinforcement ratio
for the
ultimate shear strength predictions of OPSC beams with shear reinforcements. It was
found that good agreement between the proposed EC2-I Model and the test results
is achieved (mean of 1.10 and standard deviation of 0.21).

247
8.8 Future work
The following work is proposed for the future,
1. Since this study has not involved uniform loading, it is proposed to carry out
experimental testing to study the effect of uniform loading on the shear
transfer mechanism of OPSC beams cast with and without shear
reinforcements.
2. Since this study has only involved small-scale model specimen testing, it is
desirable to carry out testing on larger scale model specimens, because it is
known that significant size effects are associated with shear failure.
3. Since this study has only carried out on rectangular OPSC beams with and
without shear reinforcements and promising results were noted, it is
desirable to carry out further testing on other type of structural concrete
elements, for example T beams, slabs, columns, and other concrete elements
to expand the use of OPS aggregates as coarse aggregates in concrete. With
these studies, new design equations specifically for the structural concrete
elements can be proposed if required.

248
References:
1. Okpala D.C., Palm Kernel Shell as Lightweight Aggregate in Concrete.
Construction and Building Materials, Vol.25, No.4, 1990, pp. 291-296.
2. Basri. H.B., Mannan.M.A., and Zain. M. F. M.., Concrete using waste oil palm
shells as aggregate. Cement and Concrete Research, Vol.29, 1999, pp. 619-622.
3. M.A.Mannan, C. Ganapathy, Mix design for Oil Palm Shell Concrete. Cement and
Concrete Research, Vol. 31, 2001, pp. 1323-1325.
4. Teo D.C.L., Mannan M. A., and Kurian V.J., Production of Lightweight Conrete
Using Oil Palm Shell (OPS) Aggregates. s.l., 4th International Conference on
Construction Materials: Performance, Innovations and Structural Implications.
5. Teo D.C.L., Mannan M. A., Kurian V.J., and Ganapathy C., Lightweight concrete
made from oil palm shell (OPS): Structural bond and durability properties.
Building and Environment, Vol. 42, 2007, pp. 2614-2621.
6. Alengaram U.J., and Muhit B.A.A., and Jumaat M.Z., Utilization of oil palm kernel
shell as lightweight aggregate in concrete- A review. Construction and Building
Materials, Vol. 38, 2013, pp. 161-172.
7. Mannan M.A., and Ganapathy C.,. Long-term strengths of concrete with oil palm
shell as coarse aggregates. Cement and Concrete Research, Vol. 31, 2001, pp.
1319-1321.
8. Mannan M.A,, and Ganapathy C.,. Engineering properties of concrete with oil
palm shell as coarse aggregate. Construction and Building Materials, Vol. 16,
2002, pp. 29-34.
9. Mannan M.A., Basri H.B., Zain M.F.M, and Islam M.N., Effect of curing
conditioons on the properties of OPS concrete. Building and Environment, Vol.
37, pp. 2002, 1167-1171.
10. Mannan M.A., Alexander J., Ganapathy C., and Teo D.C.L. Quality improvement
of oil palm shell (OPS) as coarse aggregate in lightweight concrete. Building and
Environment, Vol. 41, 2006, pp. 1239-1242.

249
11. Alengaram U.J, Mahmud H., and Jumaat M.Z., Comparison of mechanical and
bond properties of oil palm kernel shell concrete with normal weight concrete.
International Journal of the Pyysical Sciences, Vol.5, No.8, 2010, pp. 1231-1239.
12. Teo D.C.L., Mannan M. A., and Kurian V.J, Structural Concrete Using Oil Palm
Shell (OPS) as Lightweight Aggregate,Turkish J. Eng. Env. Sci, Vol. 30, 2006, pp.
251-257.
13. Teo D.C.L., Mannan M. A., and Kurian V.J, Flexural Behaviour of Reinforced
Lightweight Concrete Beams Made with Oil Palm Shell (OPS). Journal of
Advanced Concrete Technology, Vol. 4, No.3, 2006, pp. 459-468.
14. Alengaram U.J, Mahmud H., and Jumaat M.Z., Ductility Behaviour of Reinforced
Palm Kernel Shell Concrete Beams. European Journal of Scientific Research, Vol.
23, No.3, 2008, pp. 406-420.
15. Jumaat M.Z., Alengaram U. J, and Mahmud H.., Shear strength of oil palm shell
foamed concrete beams. Materials and Design, Vol. 30, 2009, pp. 2227-2236.
16. Alengaram U.J., Jumaat M.Z., Mahmud H., and Fayyadh M.M.. Shear behaviour
of reinforced palm kernel shell concrete beams. Construction and Building
Mateials, Vol. 25, 2011, pp. 2918-2927.
17. Choong M.Y., Waste not the palm oil biomass, The Star Online, 27 March 2012.
18. Ritter, W. , Die Bauweise Hennebique.” Schweizerische Bauzeitung , Zurich,
Switzerland, 1899, pp-59-61.
19. ACI-ASCE Committee 426 (326), Shear and Diagonal Tension, ACI Journal, Vol.
59, No.3, Mar 1962, pp 353-396.
20. MÖrsch, E., Der Eisenbetonbau, seine Anwendung und Theorie, 1st Ed., Wayss &
Freytag, A.G., Im Selbstverlag der Firma, Neustadt, A. D. Hardt, Germany, 1902.
21. Von Emperger F., Einige Versuche über die Würfelfestigkeit von armiertem
Beton.’’ Beton und Eisen, Vol. 4, 1903, pp -268–269.
22. Von Probst E, Ergebnisse Neuerer Untersuchungen und ein Vergleich mit den
bisher bekannten versuchsergebnissen, 1903.
23. Talbot A.N., Tests on Reinforced Concrete Beams, University of Illinois
Engineering Experiment Station, 1909.

250
24. Moretto O., An Investigation onof the Strength of Welded Stirrups in Reinforced
Concrete Beams, ACI Journal, Nov 1945, Proceedings V. 42, No. 2, pp. 141-162.
25. Clark A.P., Diagonal Tension in Reinforced Concrete Beams. ACI Journal, Vol.23,
No.2, Oct 1951, pp. 145-156.
26. ACI-ASCE Committee 426, Suggested Revisions to Shear Provisions for Building
Code, ACI Journal, Proceedings Vol. 74, No.9, Sept 1977, pp. 458-469.
27. Kong F.K. and Evans R.H., Reinforced and Prestressed Concrete. 3rd Edition ed.
Cambiridge: E & FN Spon, 1998.
28. Moody K.G., Viest I.M., Elstner R.C.and Hognestad E., Shear Strength of
Reinforced Concrete Beams Part 1-Tests of Simple Beams. ACI Journal, Vol. 26,
No.4, Dec 1954, pp. 317-332.
29. Moody K.G., and Viest I.M., Shear strength of Reinforced Concrete Beams Part 4-
Analytical Studies. ACi Journal, Vol.26, No.7, Feb 1964, pp. 697-732.
30. Ferguson P.M., Some Implications of Recent Diagonal Tension Tests, ACI Journal,
Vol.28, No.2, Aug 1956, pp. 157-172.
31. Taub J., and Neville A.M., Resistance to Shear of Reinforced Concrete Beams
Part 1-Beams without Web Reinforcement, ACI Journal, Vol. 32, No.2, Aug 1960,
pp. 193-298.
32. Mathey R.C. and Watsein D., Shear Strength of Beams Without Web
Reinforcement Containing Deformed Bars of Different Yield Strengths, ACI
Journal, Vol. 60, No.2, Feb 1963, pp.184-206.
33. Acharya D.N. and Kemp K.O., Significance of Dowel Forces on the Shear Failure
of Rectangular Reinforced Concrete Beams Without Web Reinforcement, ACI
Journal, Vol. 62, No. 10, Oct 1960, pp. 1265-1279.
34. Krefeld W.J. andThurston C.W., Studies of the Shear and Diagonal Tension
Strength of Simply Supported Reinforced Concrete Beams, ACI Journal, Vol.63,
No.4, Apr 1966, pp. 451-476.
35. Kani G.N.J., Basic Facts Concerning Shear Failure, ACI Journal, Vol.63, No.6, June
1966, pp. 675-692.
36. Rajagopalan K.S. and Ferguson P.M., Exploratory Shear Tests Emphasizing
Percentage of Longitudinal Steel, ACI Journal, Aug 1968, pp. 634-638.

251
37. Zsutty T.C., Shear strength prediction for separate categories of simple beam
tests, ACI Journal, Feb 1971, pp. 138-143.
38. Swamy R.N., Andriopoulus A., and Adepegba D., Arch action and bond in
concrete shear failures, Journal of the Structural Division, ASCE Proceedings,
Vol.96, No. ST6, June 1970, pp.1069-1091.
39. Mphone A.G. and Frantz G.C., Shear Tests of High and Low Strength Concrete
Beams Without Stirrups, ACI Journal, June 1984,pp. 350-357.
40. Kim W., and White R.N., Initiation of Shear Cracking in Reinforced Concrete
Beams with No Web Reinforcement, ACI Structural Journal, Vol.88, No.3, June
1991, pp. 301-308.
41. Rebeiz K.S., Shear Strength Prediction for Concrete Members, Journal of
Structural Engineering, Vol.125, No. 3, Vol.125, No. 3, March 1999, pp. 301-308.
42. Rebeiz K.S.. Fente J., and Frabizzio M.A., Effect of Variables on Shear Strength of
Concrete Beams, Journal of Materials in Civil Engineering, ASCE, Vol. 13, No.6,
Dec 2001, pp. 467-470.
43. Russo G., Somma G. and Mitri D., Shear Strength Analysis and Prediction for
Reinforced Concrete Beams without Stirrups, Journal of Structural Engineering,
ASCE, Vol.131, No. 1, Jan 2005, pp. 66-74.
44. Arslan G., Cracking shear strength of RC slender beams without stirrups, Turkish
Journal of Engineering & Environmental Sciences, 2007.
45. Braestrup M.W., Plastic analysis of shear in reinforced concrete, Magazine of
Concrete Research, Vol. 26, No. 89, Dec 1974, pp 221-228.
46. Nielsen M.P., Braestrup M.W., Jensen B.C. and Bach F., Concrete Plasticity -
beam shear - shear in joints - punching shear, Copenhagen: Danish Society for
Structural Science and Engineering, Oct 1978.
47. British Standard Institution, BS8110: The structural use of concrete, Part 1, 1997.
48. Eurocode 2, BS EN1992 -1-1: Design of concrete structures. General rules and
rules for buildings, 2004.
49. American Concrete Institute Committee, ACI 318, Building code requirement for
reinforced concrete, ACI, Detroit, 1963.

252
50. Taub J. and Neville A.M., Resistance to Shear of Reinforced Concrete Beams Part
2-Beams with Vertical Stirrups, ACI Journal, Vol. 32, No.3, Sept 1960, pp. 315-
336.
51. Bresler B. and Scordelis A.C., Shear Strength of Reinforced Concrete Beams, ACI
Journal, Vol. 60, No.1, 1963, pp. 51-72.
52. Regan P.E., and Placas A., 1971. Shear Failu Ferguson P.M., Some Implications of
Recent Diagonal Tension Tests, ACI Journal, Vol.28, No.2, Aug 1956, pp. 157-172.
53. Arslan G., Shear Strength of Reinforced Concrete Beams with Stirrups, Materials
and Structures, 2008, pp. 113-122.
54. Kani G.N.J., How safe are Our Large Concrete Beams?, ACI Journal, Proceedings,
Vol.64, No. 3, Mar. 1967, pp. 128-141.
55. Taylor H.P.J., Shear Strength of Large Beams, Journal of the Structural Division,
Proceedings of the ASCE, Vol.98, No.ST11, Nov 1972, pp. 2473-2490.
56. Leonhardht F. and Walther R., The Struttgart Shear Tests 1961, C.& .CA, Library
Translation No.111: Cement and Concrete Association, London, England, 1961.
57. Bazant Z. P. and Kim J.K., Size Effect in Shear Failure of Longitudinally Reinforced
Beams, ACI Sturctural Journal, Vol. 81, No.5, Oct 1984, pp. 456-468.
58. Bazant Z.P. and Sun H.H., Size effect in diagonal shear failure: Influence of
Aggregate and Stirrups, ACI Journal, Aug 1987, pp 259-272.
59. Walraven J. and Lehwalter N., Size Effects in Short Beams Loaded in Shear, ACI
Structural Journal, Vol. 91, No.5, Oct 1994, pp. 585-592.
60. Bazant Z.P. and Kazemi T., Size Effect on Diagonal Shear Failure of Beams
without Stirrups, ACI Structural Journal, Vol.88, No.3, June 1991, pp. 268-276.
61. Short A., and Kinniburgh W., Lightweight Concrete, Third Edition, Applied Science
Publishers, London, 1978.
62. Cossio R.D.Z., and Siess C.P., Behavior and Strength in Shear of Beams and
Frames Without Web Reinforcment, ACI Journal, Vol. 56, No.41, Feb 1960.

253
Appendix A
OPSC Trial Mixes
Trial Mix no.
Mix Proportion (by volume 400ml)
(Ordinary Portland Cement : Sand : Oil Palm Shell)
Water (ml)
Dry Weight
(kg)
Saturated Dry
Weight (kg)
Compressive Strength (7days) N/mm2
Remarks
1 2 : 1 : 3.5
500 1.733 17.60
Looked solid.
2 2.5 : 1 : 3.5
500 1.774 18.80 Looked
solid.
3 1.5 : 1 : 3
400 1.678 11.60
4 1.5 : 1 : 4
500 1.571 6.50
Too watery
mix
5 1.5 : 1 : 4
425 1.610 1.692 10.55
6 1.5 : 1 : 3.5
400 1.633 1.715 11.20
7 1.5 : 1.5 : 3.5
450 1.688 1.762 8.60
8 2 : 1.5 : 3.5
500 1.735 1.806 15.50
9 2.5 : 1.5 : 4.5
600 1.705 1.781 14.00
10 2.5 : 1.5 : 3.5
550 1.765 1.834 17.50
11 2 : 1 : 4
520 1.660 1.736 12.20
12
2 : 2 : 4 550 1.719 1.797 11.47
13
3 : 1 : 4 600 1.714 1.798 16.48 Too
watery.
14
3 : 2 : 4 670 1.794 1.866 16.22
15
2 : 1 : 3 440
1.704 1.776 14.65
Too watery.
16 2.5 : 1 : 3 500
1.767 1.843 19.17
Too watery.
17
1.5 : 1.5 : 3 390 1.723 1.797 11.16
18 2 : 1.5 : 3 465
1.756 1.838 15.25
Too watery.
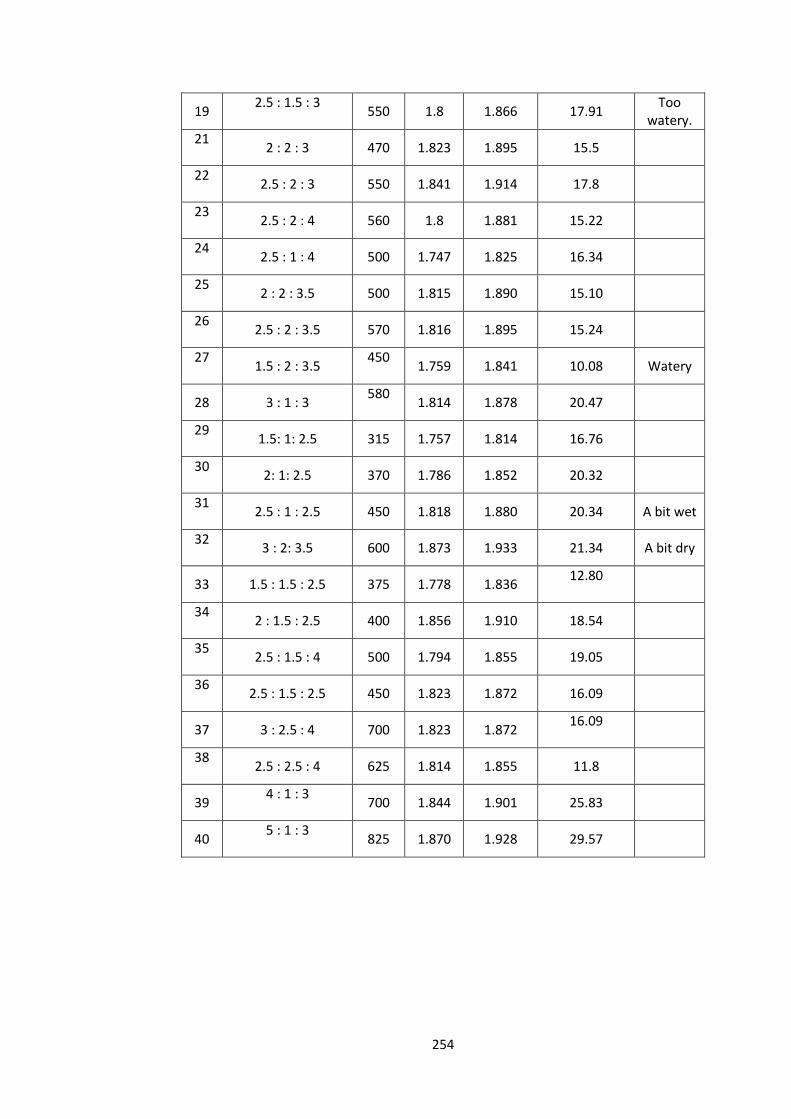
254
19 2.5 : 1.5 : 3
550 1.8 1.866 17.91
Too watery.
21
2 : 2 : 3 470 1.823 1.895 15.5
22
2.5 : 2 : 3 550 1.841 1.914 17.8
23
2.5 : 2 : 4 560 1.8 1.881 15.22
24
2.5 : 1 : 4 500 1.747 1.825 16.34
25
2 : 2 : 3.5 500 1.815 1.890 15.10
26
2.5 : 2 : 3.5 570 1.816 1.895 15.24
27
1.5 : 2 : 3.5 450
1.759 1.841 10.08 Watery
28 3 : 1 : 3 580
1.814 1.878 20.47
29
1.5: 1: 2.5 315 1.757 1.814 16.76
30
2: 1: 2.5 370 1.786 1.852 20.32
31
2.5 : 1 : 2.5 450 1.818 1.880 20.34 A bit wet
32
3 : 2: 3.5 600 1.873 1.933 21.34 A bit dry
33 1.5 : 1.5 : 2.5 375 1.778 1.836 12.80
34
2 : 1.5 : 2.5 400 1.856 1.910 18.54
35
2.5 : 1.5 : 4 500 1.794 1.855 19.05
36
2.5 : 1.5 : 2.5 450 1.823 1.872 16.09
37 3 : 2.5 : 4 700 1.823 1.872 16.09
38
2.5 : 2.5 : 4 625 1.814 1.855 11.8
39 4 : 1 : 3
700 1.844 1.901 25.83
40 5 : 1 : 3
825 1.870 1.928 29.57

255
Appendix B
OPS Aggregate Testing

256

257

258

259
Appendix C
Yield strength of Steel Reinforcement
Stress strain for mild steel 6mm

260
Appendix C
Beam design
Beams were designed to fail in Shear. The beam design is as follow:
1) Beams without shear reinforcement
To ensure the beam to fail in shear, MRd > Mmax
Beam length = 1.5 m, width = 105 mm and height = 200 mm
d = 200 mm – 25 mm – 0.5 (20 mm) = 160 mm z = 0.9 d = 144mm
Using the variable strut inclination method from EC2 [48] for beams without shear
reinforcement,
VRd max =
=
= 70.90 kN
For a/d ratio = 2.5, the shear span length, a = 425 mm
Self-weight of concrete = 0.2 m X 0.105 m X 25 MPa = 0.525 kN/m X 1.5 m = 0.75 kN
Mmax =
+ 70.90 kN
= 15.21 kNm
Using reinforced concrete beam stress block design,
Adopt 2T20 for tension reinforcement,
d
Let say k = 0.14, z = d (0.5 + √
= 137 mm

261
s = 2 (d-z) = 50 mm
x = s/ 0.8 = 62.5
MRd = 0.87 fyk As z
= 0.87 X 500 N/mm2
X 2 π (10)2 X 137 mm
= 37449498 Nmm = 37.45 kN m
(MRd = 37.45 kN) > (Mmax = 15.21 kNm) , Hence the beam would fail in shear.
2) Beams with shear reinforcement
To ensure the beam to fail in shear, MRd > Mmax
Beam length = 1.5 m, width = 105 mm and height = 200 mm
d = 200 mm – 25 mm – 0.5 (16mm) = 167 mm z = 0.9 d = 150mm
Using the variable strut inclination method from EC2 [48] for beams with shear
reinforcement,
VRd max =
=
= 73.85 kN
Using R6- 120 mm spacing,
VRd s = 0.87
z cot ϴ = 0.87
X 150mm X cot = 62.41kN
The shear span length, a = 240mm
Self-weight of concrete = 0.2 m X 0.105 m X 25 MPa = 0.525 kN/m X 1.5 m = 0.75 kN
Mmax =
+ 73.85 kN
= 43.08 kNm

262
Using reinforced concrete beam stress block design,
Adopt 2T16 for tension reinforcement and 2T14 for compression reinforcement,
d = 200 mm – 25 mm – 0.5 (16mm) = 167 mm d’ = 25 mm + 7 mm = 32 mm
d
As = 2 π 82 = 402.18 mm
2
As’ = 2 π 72 = 307.72 mm
2
Fst = Fcc + Fsc
0.87 fyk As = 0.567 fck b s + 0.87 fyk As’
s = (0.87 fyk (As – As’)) / (0.567 fck b)
= (0.87 X 500 N/mm2 X (402.18 mm
2 - 307.72 mm
2)) / (0.567 X 25 MPa X 105 mm)
= 27.6 mm
Taking moment about the tension steel,
MRd = 0.87 fyk As’ (d-d’) + 0.567 fck b s (d – s/2)
=[ 0.87 X 500 N/mm2
X 2 π (7)2 X (167 mm – 32 mm) ]+ [0.567 X 25 MPa X 27.6 mm X
(167-27.6/2)]
= 18082367 N mm + 59936436 Nmm = 78.01 kN m
(MRd = 78.01 kNm) > (Mmax = 43.08 kNm) , Hence the beam would fail in shear.

263
Appendix C
Theoretical Plastic Models
A.1 Beams without Shear Reinforcement A.2 Beams with Shear Reinforcement
f(
) =
f(ρ) =
(
)
f (σc) =
(
)
f(h) =
(
)
f( ) = (
)
f( ) = (
−
)
f(
) =
( −
)

264
Appendix D
BS8110 Design Models
B.1 Beams without Shear Reinforcement B.2 Beams with Shear Reinforcement
f(
⁄
⁄
f(
⁄
⁄
f(
⁄
⁄
f(
⁄
⁄
f(
) =
(
√
)
f( ) =
⁄
⁄
f(
) =
(
)
√

265
Appendix E
Eurocode 2 Design Models
C.1 Beams without Shear Reinforcement C.2 Beams with Shear Reinforcement
f(
⁄
f(
⁄
f(
⁄
f(
⁄
⁄
f(cot ϴ) =
f(
) =