She Figures– Statistics and Indicators on Gender Equality...
48
She Figures– Statistics and Indicators on Gender Equality in Science EU vs. Taiwan Yen-Wen Peng, Associate Professor, Public Affairs Management National Sun Yat-Sen University, Taiwan
Transcript of She Figures– Statistics and Indicators on Gender Equality...

She Figures– Statistics and Indicators on Gender Equality in Science
EU vs. Taiwan
Yen-Wen Peng, Associate Professor, Public Affairs Management
National Sun Yat-Sen University, Taiwan

before the Introduction
• The tasks of my team in the NSC 2011-2013 project (Chair: Prof. Wu, Chia-Li) 1. Construct a Gender and S&T database of Taiwan,
which shall enable international comparison. 1. Design the framework 2. Collect the data
2. Construct a new website to publish the database. 3. Institutionalize the updating of the
database/website (also in English).

Introduction
• She Figures 2009 is the third publication (following She Figures 2003 and She Figures 2006) of a key set of indicators that are essential to correctly comprehend the situation of women in science and research.
• The She Figures data collection is undertaken every three years as a joint venture of the Scientific Culture and Gender Issues Unit of the Directorate-General for Research of the European Commission and the group of Statistical Correspondents of the Helsinki Group.

Introduction • She Figures reflects a clear wish to develop pan-
European harmonised statistics facilitating cross-national comparisons and to build a base of gender disaggregated data available at the EU-level that allows to track changes over time and that has great value both to increase knowledge and to inform policies.
• Researchers and R&D expenditure data are collected through the R&D Survey, which since 2004 has been carried out as a joint data collection between Eurostat and the OECD.
• R&D data for Japan and the United States come from the OECD’s Main Science and Technology Indicators (MSTI).

Table of Contents • Chapters 1 and 2 are concerned with horizontal segregation,
and chapters 3 and 4 with vertical segregation. • General Introduction • Chapter 1 Setting the scope • Chapter 2 Scientific fields • Chapter 3 Seniority • Chapter 4 Setting the scientific agenda • Annex 1-4 • Annex 5 Methodological Notes • Annex 6 List of the Statistical Correspondents of the Helsinki Group
on Women and Science

Chapter 1: Setting the scope
Assesses the presence of women in research career from a cross-country
perspective

employed as
professsionals or
technicians
total employmentemployed scientists&
Engineers
0
10
20
30
40
50
60
% woman
F1.1 Proportion of women in the EU-27 for (1) tertiary educated and employed(HRSTC), (2)total employment,and (3)scientists and engineers in 2007
女性在(1)(受高等教育)被僱用為研發人力,(2)所有就職人口中,(3)擔任科學家與工程師的比例
TW 31.93 49.89
EU-27 52 45 32
employed as professsionals or
technicianstotal employment employed scientists& Engineers
*source: Council of Labor Affairs (2010)DATA: TW(2010) EU27(2007)Data unavailable: employed scientists & engineers of TWHRSTC:P125TW (1):HRSTO,not necessarily tertiary educated
プレゼンター
プレゼンテーションのノート
受高等教育之女性比一般女性更容易找到工作,但受雇為科學家和工程師的比率卻下降,顯現出教育的性別落差。

プレゼンター
プレゼンテーションのノート
受高等教育受雇為專業及技術人員的男女性別比例沒有明顯差異。但大致上女性還是高於男性一些

Taiwan Data unavailable
プレゼンター
プレゼンテーションのノート
科學家與工程師在所有勞動力之比例, 歐盟平均有32%女性科學家與工程,比1-2低許多。女性達一半只有三個國家。台灣無資料

19.5
30
12
0
5
10
15
20
25
30%
F1.4 Proportion of female researchers女性研究員所佔比例
TW2009 19.5
EU-27 2006 30
JP 2006 12
propotion of female researchers
Source: National Science Council (2010)RESEARCHER: 18
プレゼンター
プレゼンテーションのノート
女性研究員平均比例與1-3比例差不多,但各國歧異大。在日本、盧森堡、荷蘭分別12%、18%、18%;羅馬尼亞、保加利亞、葡萄牙等國有40%

プレゼンター
プレゼンテーションのノート
the gender gap in growth rates is generally smaller in low-growth countries and higher in high-growth countries. (add EU-15 data)

プレゼンター
プレゼンテーションのノート
在歐盟國家女性研究人員勞動力皆低於男性研究員勞動力,台灣差異更大

プレゼンター
プレゼンテーションのノート
在歐盟,女性研究員在高等教育37%,政府部門39%較高;在台灣也是;在日本僅高等教育部門高,但仍以企業最低

プレゼンター
プレゼンテーションのノート
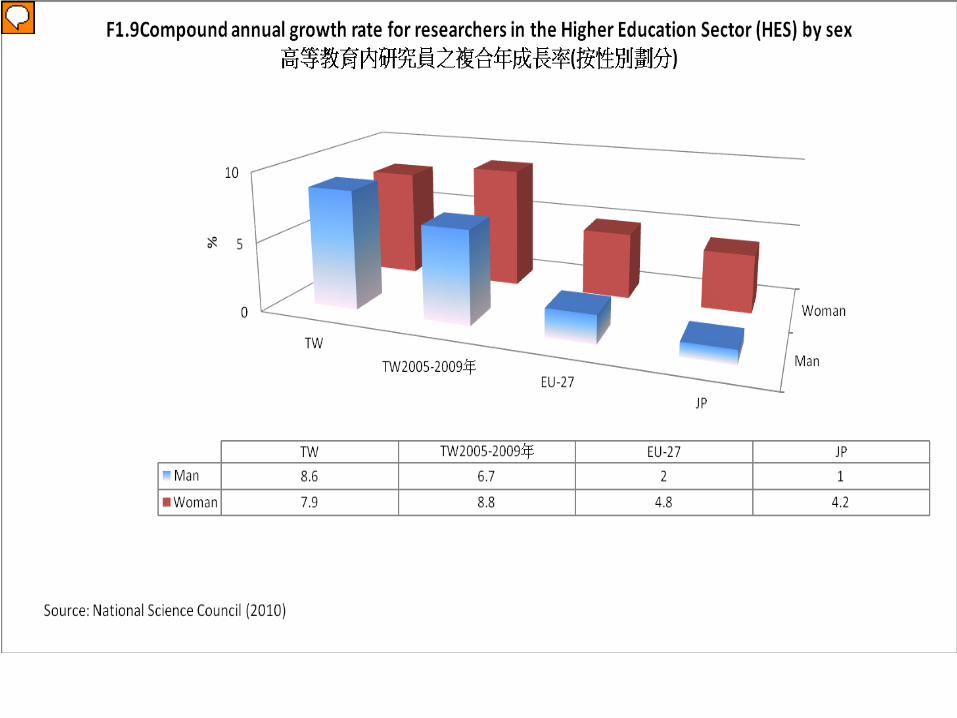
歐盟大多數國家高等教育內,女性研究員的複合年成長率明顯超過男性。

プレゼンター
プレゼンテーションのノート
2002-2006 公部門與高等教育部門的型態大致上相同,除拉脫維亞(M19.8%,F8.7%)和盧森堡(M10.8%F5.9%)兩國男性的複合年成長率是大於女性。

プレゼンター
プレゼンテーションのノート
普遍上在企業部門女性的複合年成長率是低於男性,但2002-06年卻和以往不同,超過一半的國家呈現女性成長率大於男性的情況顯現出在此部門漸趨於平等。

Chapter: 2 Scientific fields
Shows that a rapid catching up movement by women graduate
students is taking place


MAN
WOMAN0
2
4
6
8
10
12
14
16
TWTW2005-5009
EU-27JP
11.4
4.4
3.22.8
15.3
7.56.8 7.9
%
TW TW2005-5009 EU-27 JPMAN 11.4 4.4 3.2 2.8WOMAN 15.3 7.5 6.8 7.9
MAN
WOMAN
F2.2 Compound annual growth rate of PhD (ISCED 6) graduates by sex, 2002-2006博士複合式年成長率*性別
Source: Minstry of Education (2010)
プレゼンター
プレゼンテーションのノート
女性的比例已追上男性,至少在教育程度上越趨公平,甚至比男性更突出。

TW W TW M EU-27 W
EU-27 M JP W JP M
Health&welfare 0.7 0.1 21.5 15 47 32Engineering,manufacturing&construction 15.6 49.1 7.9 19.2 8 5Argriculture&veterinary 4.1 2.8 5 4 8 30Science,mathematics&computing 30.9 24.5 26.4 30.6 10 17Social sciences,business&law 19.9 12.9 19.1 17.6 10 9Humanities&arts 15 5.2 45 13 15 5Education 13 5.2 5 2.3 5 2
135.2 5 2.3 5 2
15
5.2
45
1315
5
19.9
12.9
19.1
17.6 10
9
30.9
24.5
26.4
30.6
10
17
4.1
2.8
5
4
830
15.6
49.17.9
19.2
8
5
0.7 0.1
21.5 15
4732
0%
10%
20%
30%
40%
50%
60%
70%
80%
90%
100%
F2.3 Distribution of PhD (ISCED6) graduates across the broad fields of study by sex, 2006
各學門中博士的性別分佈(按性別劃分)

T2.2 Compound annual growth rates of PhD (ISCED6) graduates by narrow field of study in natural science and engineering (fields 400 & 500) by sex, 2002-2006 自然科學與工程中,各學科內博士複合式年成長率*性別 (生命科學,物理學、數學與統計、電算,工程、製造與製成、建築)
EU27
Science,Mathematics &Computing Engineering.Manufacturing&processing
Life Science
Physical Science
Mathematics& Statistics
Computing
Engineering& engineering trades
Manufacturing&processing
Architecture& building
Woman
Man Woman
Man Woman
Man Woman
Man Woman
Man Woman
Man Woman
Man
3 0 6 1 12 7 13 9 11 5 3 0 10 3 TW
Life Science Mathematics& Statistics Engineering& engineering trades
Manufacturing&processing
Architecture& building
Woman Man Woman Man Woman
Man Woman
Man Woman
Man
39.4 23.4 15.3 14 22 18 18.9 7.4 -8 4.9
プレゼンター
プレゼンテーションのノート
Table 2.2 shows the compound annual growth rate of the number of male and female PhD graduates within subfields of natural science and engineering.

EU 27
Science,Mathematics &Computing Engineering, Manufacturing & processing
Life Science
Physical Science
Mathematics& Statistics
Computing
Engineering& engineering trades
Manufacturing&processing
Architecture& building
2002
2006
2002
2006
2002
2006
2002
2006 2002 2006 2002 2006 2002 2006
53 56 31 35 30 34 16 18 18 22 30 32 31 37
TW Life Science Mathematics& Statistics
Engineering& engineering trades
Manufacturing & processing
Architecture& building
2002 2006 2002 2006 2002 2006 2002 2006 2002 2006
14.2 21.2 21.2 12.6 4.4 5.1 14.3 20 26.9 17.9
T2.3 Evolution of the proportion of female PhD (ISCED6) graduates by narrow field of study in natural science and engineering (fields 400 & 500), 2002-2006 自然科學與工程中女博士比例演變

TW man TW woman EU27 man EU27 woman Humanities 11.9 27.7 14 18 social science 24.6 36.3 22 20 Argiculture sciences 3 2.4 5 3 Medical science 9.5 14.9 17 23 Engineering and technology 35.8 8.4 22 13 Natual science 15.3 10.3 24 19
15.3 10.3 24 19
35.8
8.4
22
13
9.5
14.9
17
23
3
2.4
5 3
24.6
36.3
22 20
11.9
27.7
14 18
0%
10%
20%
30%
40%
50%
60%
70%
80%
90%
100%
Humanities
social science
Argiculture sciences
Medical science
Engineering and technology
Natual science
source: Ministry of Education (2010) TW:2010 EU:2006 台灣:高等教育部門內的學者
F2.4 Distribution of researchers in the Higher Education Sector (HES) across fields of science高等教育中,科學學門內女性研究員分佈(自然科學、工程、醫學科學、農業、社會科學、人文)
プレゼンター
プレゼンテーションのノート
Figure 2.4 focuses on the Higher Education Sector showing the distribution of male and female researchers across the different fields of science in 2006. In the Higher Education Sector, female researchers were best represented in the medical sciences (23% on average in the EU-27) and the least present in agriculture (5% on average in the EU-27).

Chapter 3: Seniority
Illustrates the workings of a Glass Ceiling that women hit during their
ascent in the academic hierarchy (Pay gender gap is also illustrated here)

ISCED 6 students ISCED 5A Students ISCED 5A Graduates Grade C Grade B Grade ATW Women 2002 24.1TW men 2002 75.9TW Women 2006 26.7 32 27.3 16.6TW Men 2006 73.3 68 72.7 83.4TW Women 2010 28.9 31.4 29.3 17.9TW Men 2010 71.1 68.6 70.7 82.1EU27 Women 2002 41 46 42 40 33 16EU27 Men 2002 59 54 58 60 67 84EU27 Women 2006 48 45 41 44 36 18EU27 Men 2006 52 55 59 56 64 82
24.1
75.9
26.732
27.3
16.6
73.368
72.7
83.4
28.9
31.429.3
17.9
71.168.6 70.7
82.1
41
4642
40
33
16
5954 58
60
67
84
4845
4144
36
18
52
55 5956
64
82
0
10
20
30
40
50
60
70
80
90
%Figure 3.1 Proportions of men and women in a typical academic career, students and
academic staff 在典型學術生涯內,男性與女性學生和學者的性別比例
プレゼンター
プレゼンテーションのノート
Although women are more successful than men in completing tertiary education programmes (European Commission 2008a), they are less successful in entering the PhD level and the lowest steps of the academic career. The question is thus to know why women fall victim to such rarefaction: is it because of direct discrimination that derives from choices and decisions made by selection committees that are composed mainly of men, because of indirect discrimination that operates through gender-biased selection criteria or because of self-censuring rooted in gender stereotypes? The proportion of women is the smallest at the top of the academic hierarchy, falling back to just 18% of grade A academic staff (the highest grade/post at which research is normally conducted). This figure clearly indicates the existence of a Glass Ceiling composed of difficultly identifiable obstacles that hold women back from accessing the highest positions in the hierarchy.

31 34 36 36 33
22
1130 34 36 33
29
17823
16 15.611.8 8
0
10
20
30
40
%
TW Women 2010
EU-27 2002
EU27 Women 2006
Figure 3.2: Proportions of men and women in a typical academic career in science andengineering, students and academic staff 在工程及科學典型學術生涯中,男性女性學生
﹑教學人員之性別比例
TW Women 2010 23 16 15.6 11.8 8
EU-27 2002 30 34 36 33 29 17 8
EU27 Women 2006 31 34 36 36 33 22 11
ISCED 5A
Students
ISCED 5A
Graduates
ISCED 6
Students
ISCED 6
GraduatesGrade C Grade B Grade A
プレゼンター
プレゼンテーションのノート
The under-representation of women is even more striking in the field of science and engineering


プレゼンター
プレゼンテーションのノート
Table 3.1 indicates that female representation is on average higher in the new EU Member States than in the EU-15

プレゼンター
プレゼンテーションのノート
the share of female grade A staff among all women working in academia is always lower than the share of male grade A staff among all men working in academia.

プレゼンター
プレゼンテーションのノート
This GCI index measures the relative chance for women, as compared with men, of reaching a top position. A GCI of 1 indicates that there is no difference between women and men being promoted .The higher the value, the thicker the Glass Ceiling and the more difficult it is for women to move into a higher position. On average, throughout the EU-27, the GCI equals 1.8. In no country is the GCI equal to or below 1.

Natural Science 自然科學
Engineering and
technology 工程與科技
Medical Science 醫學科學
Agricultural Science 農業科學
Social Science 社會科學
Humanity 人文
(2010) EU27 (2007)
16.2 13.4
4.3 7.2
24.9 17.0
14.21 16.8
24.1 18.6
36.5 27.0
Table 3.2 Proportion of female grade A staff by main field of science, 主要科學領域內女性A級學者所佔比例
プレゼンター
プレゼンテーションのノート
When looking at the different fields of study separately , it can be noted that on average throughout the EU-27, the proportion of women among grade A academic staff was the highest in humanities and social sciences (respectively 27.0% and 18.6%). In contrast, in engineering and technology, the underrepresentation of women was most striking, with 7.2% of women among academic personnel at grade A.


2007 <35 歲 35-44歲 45-54 歲 55+ 歲 Total
30.7 20.7 15.4 9.6 16.6
EU27 25 23 21 18 19
Table 3.3: Proportion of female A grade staff by age group A級學者各年齡層內,女性佔總數之比例


Chapter 4: Setting the scientific agenda
Shows that women’s under-representation at the highest hierarchical levels of the
academic career severely cuts their chances of being at the head of higher education
institutions


2010 Women Men
% EU27
22.2 9
77.8 91
Table 4.1: Proportion of female heads of universities or assimilated institutions based on capacity to deliver PhDs 授予博士學位之大學或類似機構中由女性擔任校長的比例
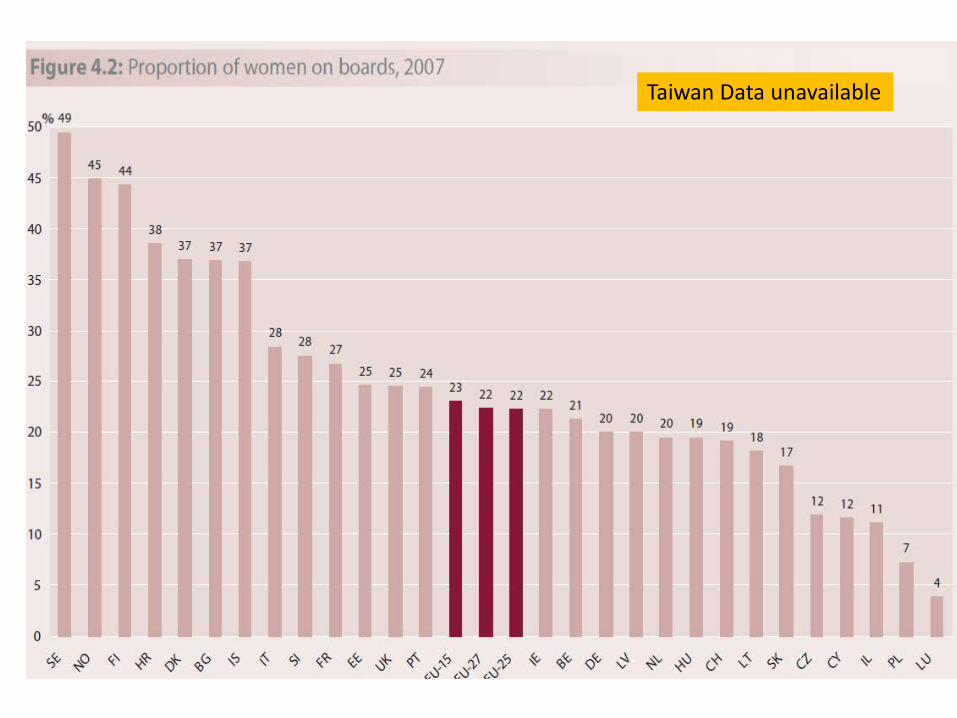
Taiwan Data unavailable

プレゼンター
プレゼンテーションのノート
Taiwan data to be added.

To be discussed…
• Shall we use the framework of She Figures, or shall we develop a pan-East Asian framework/themes?
• Are standardized statistics available in each country? In particular the International Standard Classification of Education (ISCED 97) and International Standard Classification of Occupations (ISCO 88).
• What are the main research purposes and questions?
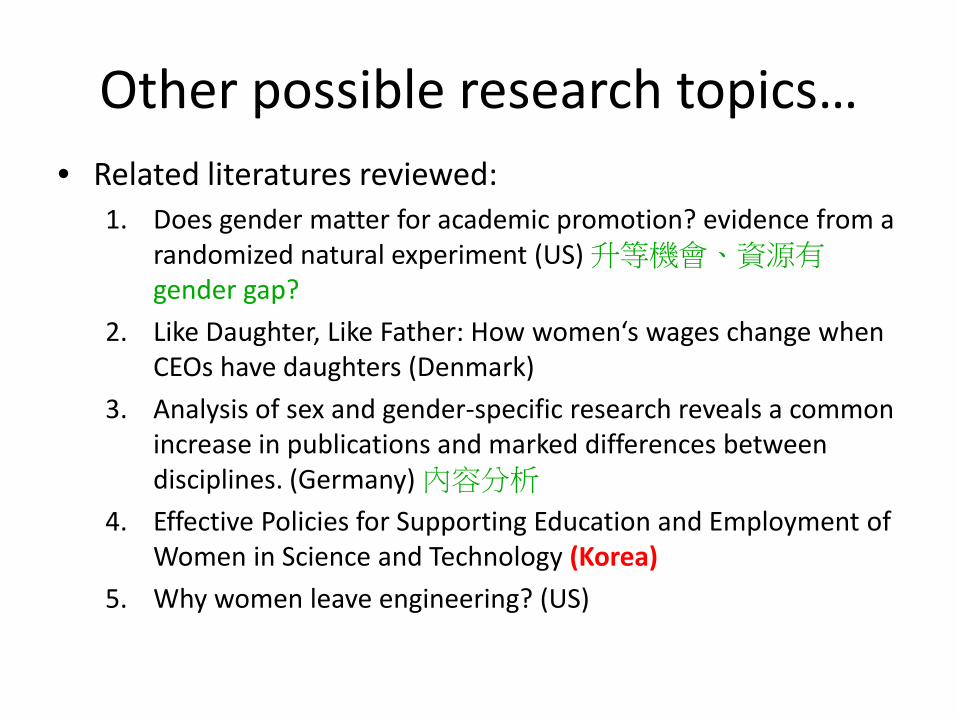
Other possible research topics… • Related literatures reviewed:
1. Does gender matter for academic promotion? evidence from a randomized natural experiment (US) 升等機會、資源有gender gap?
2. Like Daughter, Like Father: How women‘s wages change when CEOs have daughters (Denmark)
3. Analysis of sex and gender-specific research reveals a common increase in publications and marked differences between disciplines. (Germany) 內容分析
4. Effective Policies for Supporting Education and Employment of Women in Science and Technology (Korea)
5. Why women leave engineering? (US)


![HIGHLIGHTS OF PRESCRIBING INFORMATION ...saigaiin.sakura.ne.jp/sblo_files/saigaiin/image/zepatier_pi.pdf · Precautions (5.3), Drug Interactions (7),and Clinical Pharmacology (12.3)].](https://static.fdocuments.us/doc/165x107/61197a9fa474fc68a009b7ce/highlights-of-prescribing-information-precautions-53-drug-interactions-7and.jpg)