Sharing the Carbon Revenue by Mainstreaming Markets for ... › files › 33837247 › ... · for...
348
Sharing the Carbon Revenues: Mainstreaming Carbon and Credit Markets for Renewable Energy Technologies in Nepal A thesis submitted for the degree of Doctor of Philosophy at Charles Sturt University Samir Bahadur Thapa Master of Science, Energy Systems and Management School of Management and Marketing Faculty of Business, Justice and Behavioural Sciences CHARLES STURT UNIVERSITY March 2019
Transcript of Sharing the Carbon Revenue by Mainstreaming Markets for ... › files › 33837247 › ... · for...

Sharing the Carbon Revenues:
Mainstreaming Carbon and Credit Markets
for Renewable Energy Technologies in
Nepal
A thesis submitted for the degree of Doctor of Philosophy at Charles Sturt University
Samir Bahadur Thapa
Master of Science, Energy Systems and Management
School of Management and Marketing
Faculty of Business, Justice and Behavioural Sciences
CHARLES STURT UNIVERSITY
March 2019

Table of Contents
Chapter 1 Introduction ................................................................................................. 1
1.1 Background ........................................................................................................ 1
1.2 Research Context ................................................................................................ 4
1.3 Research Questions ............................................................................................ 6
1.4 Methodological Approach .................................................................................. 7
1.5 Thesis Structure .................................................................................................. 8
Chapter 2 Development of Energy Access Finance in Nepal.................................... 13
2.1 Introduction ...................................................................................................... 13
2.1.1 Renewable energy use ............................................................................... 14
2.1.2 Present status and potential ....................................................................... 15
2.1.3 GHG emission, mitigation and adaptation ................................................ 17
2.2 Renewable Energy Finance – Historical Development .................................... 19
2.2.1 Financing facility and mechanisms ........................................................... 23
2.2.2 Subsidies and credit finance ...................................................................... 25
Chapter 3 Emissions Trading, Carbon Markets and Carbon Credits ........................ 29
3.1 Emissions Trading ............................................................................................ 29
3.2 Carbon Markets ................................................................................................ 34
3.3 Emissions Trading and Distributional Impacts ................................................ 41
3.3.1 General distributional impacts .................................................................. 41
3.3.2 Health impacts .......................................................................................... 42
3.3.3 Revenue recycling and use ........................................................................ 43
3.4 Emissions Trading, Carbon Credits, and Payment for Environmental
Services ....................................................................................................................... 45
3.4.1 Introduction ............................................................................................... 45
3.4.2 Institutional context of PES distribution ................................................... 46
3.4.3 Use of carbon revenues and distributional impacts .................................. 49

ii
3.5 Discussion and Conclusion .............................................................................. 51
Chapter 4 Renewable Energy and Energy Access Financing .................................... 52
4.1 Climate and Renewable Energy Policies.......................................................... 52
4.2 Innovation, Research and Development in RE ................................................ 54
4.3 Renewable Energy Financing and Investment ................................................. 56
4.3.1 Introduction ............................................................................................... 56
4.3.2 Market subsidy mechanisms ..................................................................... 57
4.3.3 Behavioural and structural context ........................................................... 60
4.4 Financing Energy Access in Developing Countries ......................................... 61
4.4.1 Introduction ............................................................................................... 61
4.4.2 Subsidy financing ...................................................................................... 62
4.4.3 Debt and equity financing ......................................................................... 64
4.5 Discussion and Conclusion .............................................................................. 73
Chapter 5 Non-Market Valuation, Stated Preference and Renewable Energy .......... 75
5.1 Introduction ...................................................................................................... 75
5.2 Stated Preference and Revealed Preference Methods ...................................... 77
5.2.1 Contingent valuation – preference elicitation ........................................... 78
5.2.2 Choice experiment and conjoint analysis - new approaches..................... 81
5.3 Stated Preference in Developing Countries ..................................................... 84
5.3.1 Empirical applications .............................................................................. 85
5.3.2 Theoretical considerations ........................................................................ 93
5.3.3 Applications to benefit transfer ................................................................. 96
5.4 Renewable Energy, Energy Access and Stated Preference Methods ............... 98
5.4.1 Developed countries .................................................................................. 99
5.4.2 Developing countries .............................................................................. 104
5.5 Discussion and Conclusion ............................................................................ 119
Chapter 6 Theoretical Framework and Methodological Issues ............................... 124
6.1 Theoretical Framework for the Methods ........................................................ 124

iii
6.1.1 Contingent valuation ............................................................................... 124
6.1.2 Choice experiment .................................................................................. 125
6.2 Methodological Issues - Contingent Valuation .............................................. 127
6.2.1 Hypothetical valuation ............................................................................ 127
6.2.2 Assuring true values – Reducing hypothetical bias ................................ 129
6.2.3 Rationality and theoretical consistency .................................................. 131
6.2.4 Assuring rationality - theoretical constructs and convergent validity..... 133
6.2.5 Calibration ............................................................................................... 137
6.3 Methodological Issues - Choice Experiment ................................................. 138
6.3.1 Design issues and considerations ............................................................ 140
6.4 Discussion and Conclusion ............................................................................ 141
Chapter 7 Survey and Questionnaire Design ........................................................... 144
7.1 Sampling Frame and Sample Size .................................................................. 144
7.2 Questionnaire Design ..................................................................................... 148
7.3 Pre-test ............................................................................................................ 158
7.4 Discussion and Conclusion ............................................................................ 159
Chapter 8 Econometric Framework and Model Specification ................................ 161
8.1 Non-Parametric Specification – Turnbull Estimator ...................................... 161
8.2 Parametric Specification ................................................................................ 165
8.2.1 Contingent valuation ............................................................................... 166
8.2.2 Choice experiment .................................................................................. 169
8.3 Discussion and Conclusion ............................................................................ 174
Chapter 9 Descriptive Statistics ............................................................................... 177
9.1 Introduction .................................................................................................... 177
9.2 Household Characteristics .............................................................................. 178
9.3 Energy Consumption Status ........................................................................... 181
9.4 Access to Finance ........................................................................................... 183
9.5 Discussion and Conclusion ............................................................................ 184

iv
Chapter 10 Contingent Valuation Results ................................................................. 186
10.1 Non-parametric Estimation ............................................................................ 186
10.2 Parametric Estimation .................................................................................... 188
10.2.1 Binary logit models ................................................................................. 188
10.2.2 Willingness to pay using parametric models .......................................... 193
10.2.3 Willingness to pay and environmental income ....................................... 194
10.3 Market Share .................................................................................................. 199
10.4 Discussion and Conclusion ............................................................................ 201
Chapter 11 Choice Experiment Results ..................................................................... 203
11.1 Independent Variables .................................................................................... 203
11.2 Conditional Logit Model ................................................................................ 204
11.3 Random Parameter Logit Model .................................................................... 207
11.4 Latent Class Model ......................................................................................... 209
11.5 Comparison with Dummy Variable Models .................................................. 212
11.6 Market Share Analysis ................................................................................... 214
11.7 Discussion and Conclusion ............................................................................ 217
Chapter 12 Qualitative Analysis ................................................................................ 220
12.1 Introduction .................................................................................................... 220
12.2 Findings .......................................................................................................... 221
12.2.1 Biogas plant installation .......................................................................... 221
12.2.2 Loan investment conditions and business models .................................. 222
12.2.3 Supply and demand conditions for finance ............................................. 227
12.2.4 Subsidy and credit issues ........................................................................ 232
12.2.5 Governance and access to finance .......................................................... 237
12.3 Discussion and Conclusion ............................................................................ 242
Chapter 13 Conclusion .............................................................................................. 244
13.1 Summary ........................................................................................................ 244
13.2 Key Findings .................................................................................................. 248

v
13.3 Managerial and Policy Implications ............................................................... 249
13.4 Research Caveats ............................................................................................ 251
13.5 Future Research .............................................................................................. 252
13.6 Conclusion ...................................................................................................... 253
References
Appendices
Appendix 1: Direct Black Carbon radiative forcing from residential kerosene lighting
(W/m2) .......................................................................................................................... 290
Appendix 2: Multi–tier matrix for measuring access to electricity .............................. 291
Appendix 3: Multi-tier matrix for measuring access to cooking solutions ................... 292
Appendix 4: AEPC implemented Projects and Programs ............................................. 293
Appendix 5: Validity Measures .................................................................................... 294
Appendix 6: Household Survey Questionnaire ............................................................. 295
Appendix 7: Picture Set I – Traditional Cooking ......................................................... 306
Appendix 8: Picture Set II -Climate Change Impact .................................................... 307
Appendix 9: Picture Set III – Biogas Plant ................................................................... 308
Appendix 10: Interview Questionnaire for Financing Entities ..................................... 309
Appendix 11: Utility difference Random Utility Model Specification for CV ............ 321
Appendix 12: Collinearity Diagnostics ......................................................................... 324
Appendix 13 Probability with Increase in Educational Qualification for Respondents
with and without Knowledge about Health Impacts ..................................................... 325
Appendix 14 Probability for Male and Female Respondents with Different Attitude
towards Mortgaging Property ....................................................................................... 326
Appendix 15 Probability with Increase in Firewood Consumption for Respondents with
and without knowledge about the Climate Change Impact .......................................... 327
Appendix 16 Probability with the Increase in Firewood for Respondents with and
without the Knowledge about the Government Subsidy .............................................. 328
Appendix 17 Model with and without Willingness to Take out Credit ........................ 329
Appendix 18 Heckman’s Selection Model Parameter Estimates.................................. 330
Appendix 19: Dummy Variable Modelling .................................................................. 332

vi
List of Tables
Table 2-1: Potential Reduction in GHG from Various Sectors in Nepal ........................ 18
Table 3-1: Emission Trading and Credit Programs in US .............................................. 31
Table 3-2: Carbon Trading Schemes with International Credits .................................... 36
Table 4-1: Category of Subsidies for RE ........................................................................ 58
Table 5-1: CV and CE Comparison ................................................................................ 82
Table 5-2: CV in Environment and Natural Resources .................................................. 86
Table 5-3: CE in Environment and Natural Resources ................................................... 87
Table 5-4: CV in Health Applications ............................................................................ 89
Table 5-5: CE in Health Applications ............................................................................. 90
Table 5-6: Summary Literature on WTP for ICS ......................................................... 106
Table 5-7: Summary Literature using CV in the context of RE in developing countries
....................................................................................................................................... 110
Table 5-8: Summary Literature using CE in the context of RE in developing countries
....................................................................................................................................... 116
Table 7-1: Proportion of Households and Energy used for Cooking ............................ 146
Table 7-2: Attributes and Levels ................................................................................... 155
Table 7-3: Matrix design for the Constructed Variable – Annual Payback Amount:... 156
Table 7-4: A Choice Set Example................................................................................. 157
Table 9-1: Names of Sampled Locations ...................................................................... 177
Table 9-2: Household Characteristics ........................................................................... 179
Table 9-3: Energy Status ............................................................................................... 182
Table 9-4: Financing Status .......................................................................................... 184
Table 10-1 Turnbull Lower Bound Estimates without Pooling .................................... 187
Table 10-2 Definition of Variables ............................................................................... 188
Table 10-3: Binary Logit Estimations ........................................................................... 190
Table 10-4 Marginal Effects ......................................................................................... 191
Table 10-5: Marginal Effects with Interaction .............................................................. 192
Table 10-6 WTP Estimates ........................................................................................... 193
Table 10-7 WTP Estimates with and without Willingness to Take out Credit ............. 194
Table 10-8 Binary Logit Estimations with Yearly Environmental Income .................. 195
Table 10-9: Heckman’s Probit Model Estimations ....................................................... 198
Table 11-1: Definition of Variable................................................................................ 203

vii
Table 11-2: CL Model with Attributes only – Model 1 and ASC Interactions – Model 2
....................................................................................................................................... 205
Table 11-3: RPL Model with Attributes only – Model 3 and ASC Interactions – Model
4 ..................................................................................................................................... 208
Table 11-4: Minimum Class Speciation........................................................................ 210
Table 11-5 Latent Class Model with Two Classes – Model 5 ...................................... 211
Table 11-6: Utility and Market Share ........................................................................... 215
Table 11-7 Market share values as % (Continuous variable model) ............................ 216
Table 11-8 Market share values as % (Dummy variable model) .................................. 217
Table 12-1: List of Banks and Financing Entities ........................................................ 220
Table 12-2: Loan Investment Status ............................................................................. 225
Table 12-3: Status of CREF Funds Used by Banks ...................................................... 235

viii
List of Figures
Figure 1-1: Structure of the Thesis ................................................................................. 12
Figure 2-1: Map of Nepal ............................................................................................... 13
Figure 2-2: Energy Consumption by Fuel-types, 2014/15 .............................................. 15
Figure 4-1: Technology Innovation and Market Expansion ........................................... 54
Figure 7-1 Map of Nepal with Location of Field Sites ................................................. 145
Figure 7-2: Structure of the DC questions .................................................................... 153
Figure 10-1: WTP and Bid Values ................................................................................ 187
Figure 10-2: Probability with Increase in Yearly Environmental Income for
Respondents with Different Initial WTP ...................................................................... 197
Figure 10-3: Market Share Scenario with Initial Bid Values........................................ 199
Figure 10-4: Market Share Scenarios with Yearly Environmental Income .................. 200
Figure 11-1: Relationship between Instalment Frequency and Effects Codes ............. 213
Figure 11-2: Relationship between Yearly Environmental Income and Effects Codes 214
Figure 11-3: Market share with different levels of environmental income and interest
rates (Continuous variable model) ................................................................................ 216
Figure 11-4: Market share with different levels of environmental income and interest
rates (Dummy variable model) ..................................................................................... 217
Figure 12-1: Trend of Biogas Plant Installation, Cost and Share of Subsidy Per Plant 221
Figure 12-2: Credit Supply for Clean Energy Access .................................................. 222
Figure 12-3: Biogas Installation Using Credit .............................................................. 228
Figure 12-4: Technology Installation Achieved by the CleanStart Program ................ 229

ix
List of Boxes
Box 4-1: An Example of a PAYG scheme ..................................................................... 71
Box 7-1: Flow of Information and the Question for Question No. 1 ............................ 149
Box 7-2: Flow of Information and the Question for Question No. 2 ............................ 150
Box 7-3: Flow of Information and the Question for Question No. 3 ............................ 150
Box 7-4: Flow of Information and the Question for Question No. 5 ............................ 151
Box 7-5: Flow of Information and the Question for Question No. 5 ............................ 152

x
Certificate of Authorship
I hereby declare that this submission is my own work and to the best of my knowledge
and belief, it contains no material previously published or written by another person,
nor material which to a substantial extent has been accepted for the award of any other
degree or diploma at Charles Sturt University or any other educational institution,
except where due acknowledgement is made in the thesis. Any contribution made to the
research by colleagues with whom I have worked at Charles Sturt University or
elsewhere, during my candidature, is fully acknowledged.
I agree that this thesis be accessible for the purpose of study and research in accordance
with normal conditions established by the Executive Director, Division of Library
Services or nominee, for the care, loan and reproduction of theses.
Samir Bahadur Thapa

xi
Acknowledgements
My PhD would not have been possible without the support and love from numerous
people and institutions. First of all, I would like to thank the Australia Awards for
awarding me its scholarship to pursue my PhD in Australia. It was a wonderful
experience, and I will cherish the memories.
I would like to thank my principal supervisor, Professor Kevin Parton, for his guidance
during the research, without which the thesis would not have been possible. I am
grateful for your patience in allowing me the space and time to explore during the
research, especially during the literature review and research design.
I would like to thank my co-supervisor, Professor Mark Morrison, for his guidance,
particularly with the methodology, questionnaire design and its implementation. It was
a novel experience to pre-test the questionnaire with the Nepalese community in
Australia on a topic related to Nepal, which was nostalgic to many participants. Further,
I want to thank you for giving me the work as a Research Officer; it was very helpful.
I would also like to thank my co-supervisor, Dr Roderick Duncan, for his guidance,
particularly during the initial period; for providing me the right learning materials on
environmental economics and choice modelling, which were important in guiding my
PhD.
I would like to thank the enumerators for their time and sincere efforts in collecting the
data. I’m thankful to colleagues in AEPC, and in the energy access business in Nepal,
who provided their valuable time, information, and expertise. I am also thankful to my
friends in the Faculty, in the School, and in the Learning Commons in CSU, Bathurst.
I wanted my PhD to be a bit of a personal journey, in an attempt to explore the
academic implications of my experience as a practitioner of renewable energy and
energy access business. Of course, the supervision from my supervisors were
invaluable. However, any mistakes are all mine.
Lastly, I would like to dedicate this thesis to my beautiful family: my son, Samyak, my
daughter, Trishna, and my wife, Sangeeta. It would not have been possible without your
love and support. I am thankful for the little pleasures that we were able to enjoy while
being part of the family of an international PhD student. I am grateful for the upbringing
and for the love that I have received from my Parents, Dawa Lama and Durga Thapa.

xii
Abstract
Nearly 3 billion people, almost one-third of the world population, lack access to clean
energy for cooking and/or lighting. As per the objectives set by the UN Sustainable
Development Goals, governments and international agencies are providing financial and
technical assistance to enhance clean and renewable energy access. Such assistance can
involve decentralised solutions such as biogas plants and solar home systems, primarily
in rural and remote locations. These technologies not only provide access to clean
energy, but also reduce carbon emissions. These reductions can be verified and certified
as credits, and traded in carbon markets or through separate bilateral agreements.
Carbon credits from developing countries are primarily bought to offset emissions in
industrialised countries. This trade results in money flowing to developing countries as
carbon revenues, and is expected to continue and increase with the implementation of
the Paris Agreement beyond 2020. However, in many cases, the current supply-chain
operations for carbon credits have overlooked the rights of clean technology users for
the carbon revenues, during registration, issuance and use of the carbon revenues.
There has been a growing understanding of the need for commercial finance to meet the
scale of energy access objectives. This is primarily true in contexts where the continued
use of public funding has resulted in inefficient market development, especially in the
developing countries. This is because of the lack of technology and financing
innovations such as the use of feed-in-tariffs and renewable portfolio standards, which
encourages innovative ways of financing clean and renewable energy promotion. In
most developing countries, direct subsidy supports are used for extending energy access
in rural areas, for which path dependencies which lead to technology lock-ins are
considered problematic, resulting in substantial welfare losses. Further, existing
investment patterns show that the investments have been more for electricity and
lighting technologies, rather than cooking solutions, which are most relevant for women
and children. Within the climate-change context, this investment pattern is skewed since
cooking solutions have a larger impact on limiting greenhouse gas emissions.
Therefore, innovative mechanisms to scale-up commercial investments are required to
meet the goal of energy access equitably.
The research tested the potential of distributing carbon revenues as environmental
incomes to consumers, within the broader context of climate finance, in conjunction

xiii
with access to appropriate credit at the local level, to enhance both equity and
efficiency. The test was carried out with respect to biogas plants which is a mature clean
cooking technology used extensively in the rural areas of developing countries
including Nepal, and which is a technology contributing to emissions reductions
trading, within the Clean Development Mechanism and other voluntary standards. The
study area was the South Western region of Nepal with good potential for market
expansion of the biogas plants. Stated preference discrete choice contingent valuation
and choice experiment methods were used to estimate consumers’ willingness to pay
through implied and explicit measures of credit availability along with carbon revenues.
The findings indicated that consumers are willing to pay for biogas plants, at full market
prices, using available credit products from banks and other financial institutions, and
this willingness to pay improves when the carbon revenues are distributed to the
households. The findings help to support the emphasis put on results-based financing as
a substitute for upfront subsidy payments, which could lead to improved efficiency and
equity in the practise of climate financing.

Chapter 1 Introduction
1.1 Background
The subject matter for this thesis is the market for household biogas plants, which is a
clean cooking technology in Nepal. To understand the contemporary situation in this
market, it is necessary to be aware of its context within the broader development of
renewable energy1 both in the developing world and in Nepal. Significant components
of that situation include slow progress towards clean energy access goals, poverty as a
common delimiter for the adoption of clean technologies, limited government subsidies,
and a growing realisation about the need for commercial private sector financing. This
section provides a general background of the energy access situation in the developing
countries, and a more specific research context is provided in the next section, Section
1.2. The research questions are provided in Section 1.3. The methodological approach
and an outline of the thesis structure are contained in Sections 1.4 and 1.5, respectively.
The lack of access to clean energy is one of the critical challenges to sustainable
development. In the developing countries, about four million people – mostly women
and children – die every year because of exposure to indoor air pollution from
inefficient use of biomass fuel used for cooking. This includes almost one million
deaths of children under the age of five from pneumonia (Bates et al., 2018; Ezzati &
Baumgartner, 2017; World Health Organisation, 2012). The situation is also aggravated
due to hardship and drudgery associated with the collection and management of fuels,
which further result in large foregone benefits with loss of valuable time and effort
which otherwise may be used productively. Similarly, lack of electricity and lighting
services affects various livelihood opportunities – primarily related to education, health
and income generation (Winther, 2008). Without electricity, children cannot study as
much at home and in schools, critical health services cannot be administered, and
business enterprises suffer due to lack of value addition.
Besides, the existing energy consumption further results in environmental externalities,
such as land degradation, loss of water tables, and local and regional air pollution
(Bolaji, 2012). Recent studies have shown significant climate change impacts due to
1 “Clean Energy”, “Renewable Energy” and “Alternative Energy” are energy sources that are clean at the
point of use and at the point of production in the context of the study, in Nepal. However, it may not be
the case in situations where energy is produced from fossil fuel power plants, which is clean at the point
of use but not at the point of production.

2
greenhouse gas emissions from the firewood used from unsustainable biomass stock,
and the use of kerosene for lighting. The estimated emissions from firewood use in
South Asia and East Africa, considered the unsustainable ‘hotspots’, are around 1.0-1.2
billion tonnes of carbon dioxide equivalent per year, which is 1.9-2.3% of the global
emissions (Bailis, Drigo, Ghilardi, & Masera, 2015). Further, estimated climate forcing
due to black carbon emissions from kerosene wick lamps used for lighting in the
developing countries is estimated at 22 mW/m2 (Appendix 1), or 7% of forcing by all
energy-related sources (Lam et al., 2012).
Information on the energy access situation shows that it has an intricate relationship
with the overwhelming poverty in developing countries. According to the UN Human
Development Report 2014, 2.2 billion people worldwide are poor or near-poor. Out of
this, 1.5 billion live in 91 developing countries facing overlapping deprivations in
health, education and living standards. Income wise, nearly 1.2 billion people live on
$1.25 or less per day, of which nearly 80% are from sub-Saharan Africa and developing
Asia (United Nations Development Program, 2014). Worldwide around 1 billion people
continue to live without access to electricity, more than 90% of whom live in sub-
Sahara and developing Asia (World Bank, 2018b). Further, 3 billion people, live
without access to clean cooking services, and about half of those are living in sub-
Sahara and developing Asia (World Bank, 2018b). In summary, more than 95% of the
population without access to electricity and clean cooking facilities are either in sub-
Sahara or developing Asia, and 84% are in rural areas. While the rate of electrification
was able to match the population growth in 2017, access to clean cooking is still lagging
(Sustainable Energy for All, 2017b).
Various studies have found a correlation, often in a two-way relationship, between the
lack of access to clean energy services and poverty (Winther, 2008; Wolde-Rufael,
2006; Yoo, 2006). Studies show that electricity use is interconnected through complex
causal relationships with multiple dimensions of socio-economic development (Riva,
Ahlborg, Hartvigsson, Pachauri, & Colombo, 2018). One of the reasons is because
households without clean energy services often use a significant amount of their limited
income and other resources to purchase and/or obtain traditional energy resources,
which helps to sustain a re-enforcing cycle of deprivation and lower incomes
(Johansson, Patwardhan, Nakicenovic, & Gomez-Echeverri, 2012; Lahimer et al.,
2013). Therefore, the existing energy access situation in the developing countries
affects inter alia different aspects of livelihood, which leads to a cumulative effect that

3
curtails and inhibits efforts towards achieving shared prosperity. In this context, the
United Nations (UN) launched the global Sustainable Energy for All initiative in
November 2011 with three core objectives: 1) to ensure universal access to modern
energy services; 2) to double the share of renewable energy in the global energy mix;
and 3) to double the rate of energy efficiency, by 2030.
In this context and in retrospect, it can be stated now that any drive to improve access to
clean energy through conventional grid extension would be costly and time consuming.
Globally, the growing use of coal in utilities has seen only marginal reductions in the
emissions intensity of the electricity system since 1990, primarily due to energy
efficiency measures rather than fuel and technology switching (Ang & Su, 2016). This
intensity may increase if the present grid system is extended to provide rural
electrification, especially in relation to the tier-based energy access proposed (Appendix
2 and Appendix 3). In contrast, evidence shows that most indicators of electricity access
are binary indicators, and do not actually provide information on the quality of the
supply. Therefore, where indicators show 90% access, this could be as low as 30% due
to extensive limitations in supply, unscheduled blackouts and voltage fluctuations. It is
estimated that nearly one billion people suffer from unreliable electricity networks
(World Bank, 2015).
The condition mentioned above with respect to electricity access has increased the cost
of cooking with electricity in the developing countries. Therefore, for cooking and other
thermal purposes, use of liquid petroleum gas is the obvious and aspirational choice
compared to other alternatives, but large-scale transition to such modern fuels in rural
areas would require significant improvement in the supply chain, with adequate
suppliers and retailers as well as a positive policy and regulatory framework in place to
generate significant investment. The transitions to liquid petroleum gas use would
significantly increase commercial energy consumption, but this would also increase
fiscal incentives, requiring significant economic growth and investment for this to
happen on its own (Kojima, 2011).
Therefore, the strategy should not only be to increase access to modern energy services,
but to do so by improving the share of renewable energy and related energy efficiency

4
measures. In this context, decentralised energy solutions2 such as improved cook
stoves, biogas plants, solar home systems and/or local mini-grids could offer effective
means of providing sustainable energy access in the developing countries (Deichmann,
Meisner, Murray, & Wheeler, 2011). Recently approved global Sustainable
Development Goal 7 with the call to ensure access to affordable, reliable, sustainable
and modern energy services by 2030, and Sustainable Development Goal 13, which
calls for urgent actions to combat climate change and its impacts to limit the climate
warming to below 2ºC, in line with the Paris Climate Agreement, has aligned these
renewed objectives. These goals have helped to emphasise the need for technological
and financial innovation in the promotion of energy access and renewable energy.
1.2 Research Context
In order to achieve the goals stated in the previous section, a major hurdle is the lack of
access to adequate and appropriate financing. So far, energy access has primarily
depended on public subsidies in their various forms. The literature shows that the
reliance on public funding support has led to limited success, with large welfare losses,
and in many cases, also impacting the mobilisation of commercial finance, where path
dependencies, and behavioural and structural contexts in developing countries have
further added to the welfare losses. The focus started shifting towards sustainable
finance after 2000 (Sovacool, 2017), with an emphasis on private finance and the need
for new business models and innovations in technology and finance (United Nations
Environment Program, 2015, 2016). Recently, the Green Climate Fund has emerged as
the funding facility to meet the energy access and Paris Agreement objectives, together
with the existing climate and energy financing facilities such as the Clean Investment
Fund managed by the multilateral development banks (N. Rai, Best, & Soanes, 2016).
While earlier facilities such as the Adaptation Fund, established through the Global
Environment Facility, after the Earth Summit in 1992, primarily used only grant
instruments, the Green Climate Fund is expected to spur innovative financing,
especially through its private sector facility. This has a menu of financial instruments
including grants, concessional loans, guarantees, and equity/impact investments. The
focus therefore has shifted from a focus only on the public funding support to also
2 Decentralised RETs that are in use in Nepal include (i) micro/mini hydro (ii) solar or wind mini-grids
(iii) solar PV water pumps (iv) solar PV home systems (iv) solar thermal water heaters, solar dryers, solar
cookers, and (iv) biogas plants, improved cook stoves, coal briquettes.

5
including the private sector banks and financial institutions. However, at present, much
of the finance is being sourced by the multilateral organisations (Owens, 2018). Further,
national and local eligible entities in many developing countries are also in the process
of accessing the fund.
Financing from the carbon markets after the ratification of the Kyoto protocol in 2005
has also expanded energy access in many developing countries (Glemarec, 2012). The
Kyoto Protocol in 2005 encouraged flexible mechanisms to link carbon markets with
carbon credits produced by various energy access projects in low income and
developing countries, including in Nepal (Boyd et al., 2009). In this, the European
Union Emissions Trading Scheme within the Kyoto framework of Clean Development
Mechanism, became the hallmark trading scheme in linking and purchasing carbon
credits from developing countries. The on-going trade of carbon credits via the Clean
Development Mechanism and various other voluntary standards, and the future potential
of linking such carbon credits through ongoing market developments based on the Paris
Agreement protocols expected post-2020, provides opportunities for carbon markets to
fund further promotion of energy access in developing countries. In this, while the
market for carbon credit offsets is at its lowest at the moment3, there is an expectation
that the market will pick up with the implementation of a sustainable development
mechanism post-2020 as part of Article 6 of the Paris Agreement that seeks to promote
the mitigation of greenhouse gas emissions while fostering sustainable development,
and voluntary international transfer of such mitigation outcomes to meet the nationally
determined contributions.
The theoretical principles behind the above market linkages point to the dual benefits of
transformational climate change and sustainable development. The use of carbon credits
can facilitate this transformation at lower costs, especially for economies heavily
dependent on fossil fuels. Moreover renewable energy technologies are becoming less
costly and appropriate for decentralised use such as in rural developing countries.
However, despite the theoretical potential, critics have argued that the carbon market so
far has overlooked matters of equity and integrity, and describe it as yet another process
of commodification and accumulation (Bumpus & Liverman, 2008). In this context, a
major concern is that the carbon revenues generated through various carbon markets
3 The price of a certified emission reductions credit used for offset compliance is less than a dollar per
tonne of CO2e in 2019(World Bank, 2019).

6
under the Clean Development Mechanism and other voluntary mechanisms do not reach
the households that use the clean energy technologies that reduce carbon emissions,
such as biogas plants. Nonetheless, it is expected that efforts to enhance the market
linkage to increase the equity of carbon revenue distribution would lead towards the
equating of marginal costs and benefits, thereby improving the efficiency of the market.
More importantly, market linkages with appropriate benefit sharing can lead to positive
impacts on behavioural outcomes as consumers become aware about their contribution
to the environment and the market, leading to increased adoption of the technologies
(Boyd et al., 2009; Caney & Hepburn, 2011; Y. Wang & Corson, 2015).
1.3 Research Questions
Within the above context, the study is focused on the financing of household biogas
plants (Appendix 9) in Nepal. In Nepal, about two-third of households still use solid
biomass fuel for cooking, in which firewood is the most prevalent fuel source (Ministry
of Health, New Era, & United States Agency for International Development, 2016).
Nepal’s electrification rate of about 76% is comparable to that of other countries in the
region. About 97% of the urban population, and only about 72% of the rural population
has access to electricity. Out of this, around 12% of the rural population has access to
electricity through decentralised energy technologies (Asian Development Bank, 2017).
However, the use of electricity for cooking is limited due to supply constraints and
higher cost, especially in relation to peak demand. Biogas plants have been in use since
the 1970s, and are a major technology to replace and/or reduce firewood use for
cooking in rural Nepal. Biogas plants result in a higher amount of emissions reduction
compared to other household technologies, and there are many biogas projects
registered with both compliance and voluntary mechanisms (Gold Standard, 2018;
United Nations Framework Convention on Climate Change, 2018). So far, more than
400,000 biogas plants have been installed in Nepal, and the total potential is estimated
at more than 1 million plants (World Bank, 2017).
The research survey was carried out in the Western Terai region of Nepal, which has
enabling conditions for biogas plant adoption with respect to the climate, access to
credit and the existing energy consumption. Two principal research questions were
tested in the study.
1) What is the influence of access to credit on the uptake of biogas plants?

7
The first research question seeks to test the impact of access to credit on the uptake of
biogas technology. There is much grey literature which shows that access to credit
enhances the ability and willingness to initiate small and micro enterprises. However,
there has not been any specific academic study on the impact of access to credit in
relation to a renewable energy technology adoption in Nepal.
2) What is the influence of distributing carbon revenues on the uptake of biogas
plants?
The second research question seeks to test the impact of carbon revenue distribution on
the uptake of biogas plants. The use of carbon revenues generated from renewable
energy technologies has received limited attention. The study results provide insights to
understand the potential efficiency gains of a result-based payment mechanism
compared to direct upfront subsidy mechanisms. Also analysed are, scenarios involving
various levels of access to credit and carbon revenues.
The research questions are relevant in relation to the academic context where scholars
have emphasised the need for a balance between efficiency and equity in environmental
governance in the developing countries (Kosoy & Corbera, 2010; Muradian et al.,
2013). Recent literature also suggests that equity considerations could actually enhance
the efficiency of outcomes because of the current extreme income inequalities in the
developing countries (Thorbecke, 2016). The findings of this study recommend that
such considerations in the form of carbon revenue distribution could lead to effective
financing of energy access services, thereby enhancing environmental stewardship and
market outcomes.
The research question is also relevant in the renewed political context in Nepal post the
promulgation of the Constitution in 2015, which has provided an executive mandate to
the newly formed local rural and municipal councils to implement relevant renewable
energy projects. This is especially relevant in the context where the local councils are
facing budget deficits in implementing their energy access and other relevant project
activities.
1.4 Methodological Approach
The literature review and the methodology forms the two basic analytical pillars of the
study (Figure 1-1). The literature review focused on both the published and grey
literature pertaining to emissions trading, and the impact of different revenue

8
distribution mechanisms on the social welfare. Further, the review also focused on
analysing the impacts of direct subsidy distribution to bring down the capital costs of
energy access technologies. Lastly, a systematic review of the use of stated preference
methods, especially that of Contingent Valuation (CV) and Choice Experiment (CE),
was carried out to assess their applications in the sphere of energy access and renewable
energy use, both in the developing and industrialised countries. While many stated
preference studies have been conducted in the developing countries, there were no
specific studies focused on understanding the preferences for financing, and credit
needs. Similarly, while there are a number of studies carried out in Nepal, there were
none in relation to the adoption of renewable energy technologies.
The methodology section focused on understanding the issues related to the use of CV
and CE methods, and their proper use in the context of the study. The basic random
utility framework was used to specify both the CV and CE framework for the study
(Haab & McConnell, 2002; McFadden, 1973). Multiple single-bound dichotomous
choice elicitation formats were used for the CV study, and binary logit models were
used to analyse the data (Mitchell & Carson, 1989), and estimate the willingness to pay
for the biogas plant. In the case of CE, an unlabelled design as per the D-efficient
design parameters was considered. Conditional logit, random parameter logit and a
scale-adjusted latent class logit models were used to analyse the data. These models
form the basic simulation tools to carry out the discrete choice analysis, and were used
to understand consumers’ preference for credit and carbon revenue parameters. The
parameter estimates were used to analyse potential market shares of the biogas plant
technology to test the research questions. A qualitative analysis was also carried out
with the banks and financing institutions to assess the investment status in energy access
in Nepal. These findings corroborated with the results from the literature review in
terms of confirming the lack of adequate financing in the energy access space in Nepal.
1.5 Thesis Structure
The structure of the thesis is as shown in Figure 1-1.
Chapter 1, the current chapter, provides an introduction and overview of the entire
thesis. It briefly explains the impact of inadequate access to clean energy. This is
followed by the overarching objective of the thesis, the broad research questions, and an
outline of the various parts of the thesis and its chapters.

9
Chapter 2 introduces the energy consumption situation, and the energy access financing
and investment situation in Nepal. The chapter discusses the contribution of renewable
energy technologies towards energy access. This is followed by a brief history of energy
access financing, the different financing facilities available for investments in renewable
energy, and the current situation with subsidy and credit financing. The aim of the
chapter is to provide a description of the energy access financing situation in Nepal as a
backdrop for the thesis.
Chapter 1 and 2 form the introductory section of the thesis.
Part I of the thesis, which contains Chapters 3, 4 and 5, provides a review of the
literature. The literature review explains the emergence of carbon markets, and the
theoretical perspective of carbon credits as part of the Payment for Environmental
Services literature. The review also explains the need for renewable energy policies, and
examines issues related to renewable energy finance. Lastly, the review elaborates on
the use of stated preference methods within the field of renewable energy promotion.
Chapter 3 describes the evolution of international emissions trading and carbon markets.
This evolution is explained in the context of the potential for carbon credits from the
developing countries in an interlinked global carbon market. The chapter provides the
findings from the literature about the distributional impacts of auction revenues in
developed countries as well as carbon revenues in the developing countries. In this, the
chapter reviews the benefits of renewable energy technology based carbon credits
compared to the, more widely analysed, forestry based credits.
Chapter 4 presents the need for renewable energy policies together with carbon pricing
policies within an overview of the financing situation for renewable energy and energy
access. In this, the emphasis is on presenting the implications of subsidies in relation to
the mitigation, and research and development outcomes. The chapter also highlights the
impact of behavioural and structural issues with investments. Most importantly, the
chapter describes the existing financing practices such as micro-credit and pay-as-you-
go models used for energy access financing.
Chapter 5 describes the applications of CV and CE in the developing countries together
with their theoretical basis and applications to benefit transfer. The chapter further
reviews the applications of CV and CE in the renewable energy sector both in the
developed and developing countries. An important purpose of the review of these

10
methods is to understand their use in measuring local acceptance and valuation of
renewable energy technologies.
Part II of the thesis, which contains Chapters 6, 7 and 8, presents the details pertaining
to research methodology and design. Part II explains the theoretical framework and the
issues related with the methods, followed by the econometric specifications of the
methods. The details on the survey and questionnaire design are also presented in this
part.
Chapter 6 provides the theoretical framework, and the methodological issues related to
CV and CE methods. The issues related to hypothetical bias, and the theoretical and
rational inconsistencies associated with the methods are presented. The chapter also
presents the techniques used to deal with the hypothetical biases, and explains the
inconsistencies related to the methods.
Chapter 7 provides the sampling frame, sample size, and the parameters considered
during the design of the questionnaires used for the household survey and interviews of
the financing entities. The discussion of the design for the household survey
questionnaire describes the parameters used to minimise the biases and understand the
household and respondent characteristics. These issues are incorporated into the
elicitation formats and structure used for the CV and the design of the choice tasks for
the CE.
Chapter 8 presents the non-parametric and parametric models used for the estimation of
CV and CE results. First, the specifications of the Turnbull estimator used for non-
parametric estimation of CV results is explained. Second, the specifications of a
parametric discrete choice random WTP model used for CV is explained. Lastly, the
specifications of the conditional logit, random parameter logit and latent class logit
models used for parametric estimation of the CE results are explained.
Part III of the thesis, which contains Chapters 9, 10, 11, and 12, presents the detailed
results. This part provides the descriptive statistics, and the results from the quantitative
and qualitative analysis.
Chapter 9 presents the respondent and household characteristics in comparison with the
regional and/or national data, as available. The respondent characteristics are described
based on age and literacy and the household characteristics are based on income and

11
wealth. Further, the households’ energy consumption and access to finance are also
analysed. This involved assessing the fuel used for household cooking and the type of
credit used by the households together with the measurement of households’
commitment to use credit to purchase a biogas plant.
Chapter 10 presents the results from the CV analysis. The Turnbull approach and the
binary logistic regression model results are described together with the estimates of the
mean and median willingness to pay for a biogas plant. The binary logit model results
used to assess the willingness to pay the market price with and without the potential of
earning yearly environmental incomes are also explained. The chapter also presents the
marginal effects of various interactions, as well as the potential market share of the
biogas plant technology.
Chapter 11 presents the results from the CE study. Various model results are used to
analyse the heterogeneity in preferences and the potential cluster of respondents given
those different preferences. The preferences are analysed based on the credit attributes
of interest rate, payback period, and the instalment frequency together with the potential
yearly environmental income. The chapter also presents the potential market share of
the biogas plant technology estimated with different credit products and yearly
environmental income.
Chapter 12 presents the findings from the qualitative survey. The chapter analyses data
and information obtained from the interviews with the banks, financing institutions and
experts. The data and information obtained present the status of investment in energy
access technologies, demand and supply conditions of energy access finance, issues
with existing subsidy and credit provisions, and the governance issues around access to
finance.
Chapter 13 synthesises the discussions and results from the previous chapters. The
chapter provides a summary of the work conducted under various chapters, key
findings, research caveats and future research.

12
Figure 1-1: Structure of the Thesis

13
Chapter 2 Development of Energy Access Finance in Nepal
This chapter describes, 1) the existing situation of energy access and the greenhouse
gas emission and mitigation potential in Nepal, and 2) the overall renewable energy
financing situation in Nepal. In this context, the chapter contains a brief history of
energy access financing, the different financing facilities available for energy access,
and the existing situation with the subsidy and credit financing.
2.1 Introduction
Nepal is the youngest Federal democratic republic, and had its Constitution approved in
December, 2015. It is in South Asia, and is a land-locked country situated between the
Himalayan ranges in the north bordering the Tibetan region of China, and India in the
south, east, and west. It lies between 80°04’ to 88°12’ east longitude and 26°22’ to
30°27’ north latitude. Nepal covers an area of 147,181 sq. km (56,827 sq. mi). It
consists of three main geo-ecological regions, the Mountains in the north, the Middle
Hills and the Terai4 in the south. These three regions contain 35, 42 and 23% of the total
land area accommodating respectively 7, 43, and 49% of the total population (Central
Bureau of Statistics, 2014a). As shown in Figure 2-1, the new Constitution has created
administrative divisions at the provincial and local levels, with seven provinces and 753
local councils5.
Figure 2-1: Map of Nepal
Source: (Survey Department, 2018)
4 The Terai, also spelt Tarai, is a low, flat, fertile land in southern Nepal, adjacent to the northern border
of India, which runs parallel to the lower ranges of the Himalayas. 5 460 village councils (VCs) and 293 municipal councils (MCs).

14
The climate varies ranging from tropical in the southern Terai plains to alpine in the
northern Himalayas, with wide ranging climates in between. Nepal’s landmass is
composed of more than 80% rugged hills and mountainous terrain. Eight of the ten
highest mountains in the world are located either wholly or partly in this area with
Mount Everest at 8,848 m above sea level as the highest in the world. The current land
use cover composition is estimated at 39.1% forest, 29.83% cropland, 7.90% grassland,
8.20% snow/glacier cover, 3.40% shrub land, 10.65% barren land, 0.60% lakes and
rivers, and 0.32% built-up areas (Paudel et al., 2016). It has a population of 26.5 million
with more than 60 different caste/ethnic groups (Central Bureau of Statistics, 2014b).
The population growth rate is 1.35%, which is a decrease compared to earlier census
results, because of a decline in fertility and youth migration. More than 70% of the
population live in rural and regional areas and the literacy rate is 52.6% (Central Bureau
of Statistics, 2014a, 2014b). The economy is largely agrarian with more than 80% of the
population engaged in agricultural activities. The agriculture sector contributes 40% of
GDP and more than 42% of export earnings. Agriculture and forest based industries
account for more than 82% of all industrial establishments (Central Bureau of Statistics,
2014c). The UN has classified Nepal as one of the least developed counties (LDCs) out
of 47 LDCs, and the World Bank country ranking puts Nepal as a low-income
developing country, with an estimated national income per capita of US $1003.646 in
July 2018, which is 8.55% of the world average of US $11,730. About 33% of the
population is below the poverty line.
2.1.1 Renewable energy use
The use of Renewable Energy (RE) provides a marginal contribution to the overall
energy mix in Nepal. The off-grid Renewable Energy Technologies (RETs), used
primarily for energy access, provide 3% of the total energy consumption (Water and
Energy Commission Secretariat, 2017) (see Figure 2-2). As in many other countries, the
use of renewables in Nepal started primarily after the 1970’s oil crisis, when soft loan
and subsidy support were introduced by the Nepalese government (Karki, 1978).
Awareness about the environmental impacts of traditional energy use, and the
possibility of poverty reduction combined with the high cost and time required for rural
6 Nepal's GDP Per Capita reached 1,003.64 USD in Jul 2018, compared with 866.48 USD in Jul 2017.
Nepal GDP Per Capita data is updated yearly, available from Jul 1960 to Jul 2018. The data reached an
all-time high of 1,003.64 USD in Jul 2018 and a record low of 46.24 in Jul 1964.

15
grid extension also became drivers for the expansion of off-grid renewables. The
electricity from the national grid, categorised as commercial energy, provides another
3% of the total energy consumption.
A total of around 1,0737 MW
(Pun, 2018) of installed
hydropower capacity feeds the
national integrated grid,
providing electricity to almost
97% of the urban population,
and around 72% of the rural
population (Asian
Development Bank, 2017).
However, Nepal’s energy use
is characterised by a high
degree of reliance on
traditional biomass resources8especially firewood, which provides around 70% of total
energy consumed. This firewood consumption is primarily in the residential sector,
where about two-thirds households still use firewood for cooking (Ministry of Health et
al., 2016). Data shows that some 63% of rural households and 17% of urban households
rely on firewood for cooking. About 78% households in urban areas use LPG compared
to 17% households in rural areas (World Bank, 2017).
2.1.2 Present status and potential
Nepal’s electricity grid is operated by generation from both the run-of-river and
reservoir-based hydro-electric plants. Although around 70% (Ministry of Finance, 2018)
of the population and most industries and commercial firms are connected to the grid, it
has been highly unreliable due to the shortfall of generation capacity. The current
demand for electricity is estimated at 1,721 MW (Water and Energy Commission
Secretariat, 2017). There is a shortfall in supply, which started in 2008, and is worse
during low discharge in dry seasons. This led to nearly 14 hours of load shedding during
7 562 MW installed by NEA, 511 MW installed by private power producers, and power purchased up to a
capacity of about 450 MW from India. 8 In Nepal, traditional biomass resources are the firewood, agriculture waste, and cattle dung(Government
of Nepal, 2017).
Figure 2-2: Energy Consumption by
Fuel-types, 2014/15

16
2016. Starting from 2017, the situation has improved and regular electricity supply to
urban areas has resumed. Several factors, including an innovative load management
system, with emphasis on reducing leakage, adopted by the state utility, Nepal
Electricity Authority (NEA), and increased domestic supply due to commissioning of a
few new power plants has contributed to regular electricity supply. Independent power
producers provide nearly half of the total generation based on power purchase
agreements with the NEA. Yet, many parts of the country still face load shedding and
demand from industrial customers is as yet unmet (Timilsina, Sapkota, & Steinbuks,
2018). Per capita demand is projected to increase to 717 kWh in 2030, from the current
consumption of 138 kWh. Similarly, demand for firewood is also expected to grow with
the population growth, especially in the Terai region. The total current firewood
demand is about 10.5 million tons per year. The demand is expected to increase to about
13 million tons by 2030, with excess demand of 202 thousand cubic meters, which will
exert increased pressure on forests resources (Forest Action Nepal, 2014). About 55%
of the households are expected to use solid biomass as their primary fuel in 2030 even
under the most optimistic scenario, which is a mild decline from the current scenario of
66%.
At present, while RETs provide only around 3% of the total energy consumption, these
technologies provide a substantial number of households with basic energy access
services. RETs have benefitted around 31% of the population, and 18% of the
population have access to electricity and lighting facilities from RETs (Ministry of
Finance, 2018). The total hydro power potential in Nepal at 83 GW far exceeds current
consumption. However, the additional potential from micro and mini-hydro from small
perennial rivers and creeks that constitutes the major input towards off-grid hydro has
not been estimated yet. An assessment of solar and wind energy found a total potential
of 3 GW from wind, and 1.8 GW from solar Photo Voltaic (PV), with an additional 2.1
GW from grid connected PV (Alternative Energy Promotion Centre, 2008b). These
theoretical estimates suggest that Nepal could become a net exporter of electricity based
on RETs. The Alternative Energy Promotion Centre (AEPC), the nodal agency for
renewable energy promotion in Nepal is implementing several RE programs to increase
and enhance the use of RETs. More than 1.5 million households have benefited from
different RETs used for household cooking, lighting, and for productive purposes in
small and medium enterprises (Parshuram and Associates, 2016). So far, around 23 MW
of micro-hydro capacity has been installed in Nepal, benefitting around 250,000 rural

17
households (Acharya & Bajracharya, 2013) with electricity supply. Another popular
off-grid technology used for lighting purposes is the Solar Home System (SHS), which
has a total installed capacity of around 12 MW, and benefits around 513,000 households
(Parshuram and Associates, 2016). Biogas and Improved Cook Stoves (ICS) are the
principal technologies promoted for clean cooking. Studies suggest a potential of
installing biogas in 1.3 million typical rural households (Alternative Energy Promotion
Centre, 2014), and to date biogas digesters are installed in 350,000 households (World
Bank, 2017). Further, ICSs have replaced traditional cooking devices in more than
800,000 households. Besides, larger commercial-scale applications of the RETs are
slowly gaining momentum in Nepal in both the urban and rural areas, resulting in
applications such as commercial compressed biogas distribution (The Kathmandu Post,
2018), and hybrid solar and wind mini-grids for rural electrification (Parshuram and
Associates, 2016).
2.1.3 GHG emission, mitigation and adaptation
Nepal has a relatively low level of greenhouse gas (GHG) emissions. The per capita
GHG emission in Nepal is 0.284 metric tonnes (World Bank, 2014), which is around
5% of the world average. The first account of the GHG emissions in Nepal was carried
out as part of the First/Initial National Communication in 2004, which was prepared
following the IPCC guidelines, with a base year of 19949. This estimate shows that the
net total GHG emissions were 39.263 million tonnes of carbon dioxide equivalent
(tCO2e) in 1994. The largest emissions were from the agriculture sector at 27.197
million tCO2e, at 70%, followed by land use changes and the energy sector. The energy
sector contributed less than 10% of total emissions. Later analysis carried out on
changes between 1995 to 2008 shows that the total GHG emissions from the energy
sector increased from 4.1 million tCO2e to 6.1 million tCO2e (Centre for Energy
Studies, 2013)10. This is due to an increase in fossil fuel use, which has seen the largest
percentage increase in transport, industrial and agriculture sectors, and has more than
doubled. Further, the substantial increase in the energy intensity of 25 percentage points
also indicates fuel substitution towards fossil fuels in sectors such as transport and
industry (Pokharel, 2007), which are accommodating an increasing urban population11.
9 The Second National Communication was submitted in 2014, with a base year of 2000/01. 10 This estimate of 4.1 million tCO2e in 1995 corresponds to the 3.266 million tCO2e in 1994 from the
first national communication. 11 The urban population growth is 3.38 % compared to 0.98 % in the rural areas.

18
However, the emissions from the residential sector are still the largest, declining only
relatively from 66.2% to 54.9%. Firewood used for cooking and other thermal purposes
in rural areas is the major source of these GHG emissions. The emission pattern is
typical of a LDC, with a continuing trend towards a higher proportion of firewood
consumption in the rural sector, but also an increasing intensity of fossil fuel use.
In Nepal, various sectors can contribute to carbon mitigation. A summary of the
estimates of potential for carbon mitigation is shown in Table 2-1. Nepal’s forestry
sector is expected to sequester substantial carbon with increased biomass stock, even
though the forest area is shrinking. It is estimated that marginal increase in stock and
reduction in deforestation during 2000 to 2005 could have saved 19 million tCO2e (S.
Dhakal & Raut, 2010) compared to the actual loss of biomass stock. The agriculture
sector with a system of rice intensification techniques, show a conservative potential
estimate of 3.3 million tCO2e reduction annually (S. Dhakal & Raut, 2010).
While hydro-power struggles with the current demand and lack of generation capacity at
present, the future pipeline of projects and construction provides surplus power, in
which case electricity exported could be nearly at 700 MW by 2027 (S. Dhakal & Raut,
2010). It is estimated that the savings in GHG emissions from such electricity export
could be around 15 million tCO2e per year by 2027. Given the coal base in power
production in India, such potential carbon revenue could make a policy case for cross-
border power export and mutual power production in the region.
Further, with the growing urbanisation and waste management issues, there is potential
of developing analogous waste to energy projects. Despite the growing brick and
cement consumption in real estate and industrial activities, there is still the potential to
Table 2-1: Potential Reduction in GHG from Various Sectors in Nepal
Sector
Annual reductions in
emissions (Mt
CO2e/year)
Source
Forestry 3.66 (S. Dhakal & Raut, 2010)
Agriculture (rice
intensification) 3.33 (S. Dhakal & Raut, 2010)
Export of hydropower
(2027) 15 (S. Dhakal & Raut, 2010)
Technology improvement
in cement industry 1.6 (Singh & Shakya, 2016)

19
save large amounts of carbon emissions through technological advances. The CO2
emissions of the cement industry for the base year 2014 is estimated to be 365.40
thousand MT. This could increase by as much as 78.06% under a high-growth scenario
(Singh & Shakya, 2016). The estimated reduction through conversion of all existing
Bull’s Trench Brick Kiln to Vertical Shaft Brick Kiln is 1.6 million tCO2e.
Nepal began its involvement with the carbon market in 2001, with the registration of its
first biogas project under the Clean Development Mechanism (CDM). Since then, Nepal
has registered six small-scale projects with the CDM, and one small-scale project with
the voluntary gold standard. Further, since the acceptance of the programmatic
approach, four programme of activities (PoAs) have been registered with the CDM.
These projects amount to a cumulative reduction of 394,734.6 tCO2e per annum (United
Nations Framework Convention on Climate Change, 2018). It is estimated that
altogether 4.17 million tCO2e can be mitigated per annum if the full potential is reached
of the different off-grid technologies (Centre for Energy Studies, 2013) with 2012 as the
base year. This would require an annualised initial technology investment of US $0.60
to 14.61 per tonne of CO2e mitigated, depending on the technologies, with a higher cost
share for lighting and electricity compared to cooking and other thermal applications.
This indicates that a moderate level of initial investment, especially for cooking
technologies, can result in quite promising mitigation. While there is substantial
potential in other sectors, and a forestry sector plan is being prepared as part of the
Reducing Emissions from Deforestation and Forest Degradation (REDD+)
preparedness, it is also important to pursue low-hanging projects in sectors such as in
waste management and the cement industry.
2.2 Renewable Energy Finance – Historical Development
The earliest initiatives for establishing rural finance services date back to late 1950s and
early 1960s when the first credit cooperatives started emerging in Nepal (H. D. Pant,
2009). The earliest investment in the RE sector began with state subsidies and credit for
biogas and micro-hydro, starting in the early 1970s, after the establishment in 1968 of
the government-owned Agriculture Development Bank Nepal (ADBN). The bank
through its regional and rural branches was directed to couple low interest loans with
the state subsidy on capital costs (Pokharel, 2007). The biogas support started from
1974 and the micro-hydro support started from 1981 (Mainali & Silveira, 2011). In
subsequent periods, the central bank introduced various policies such as directed credit
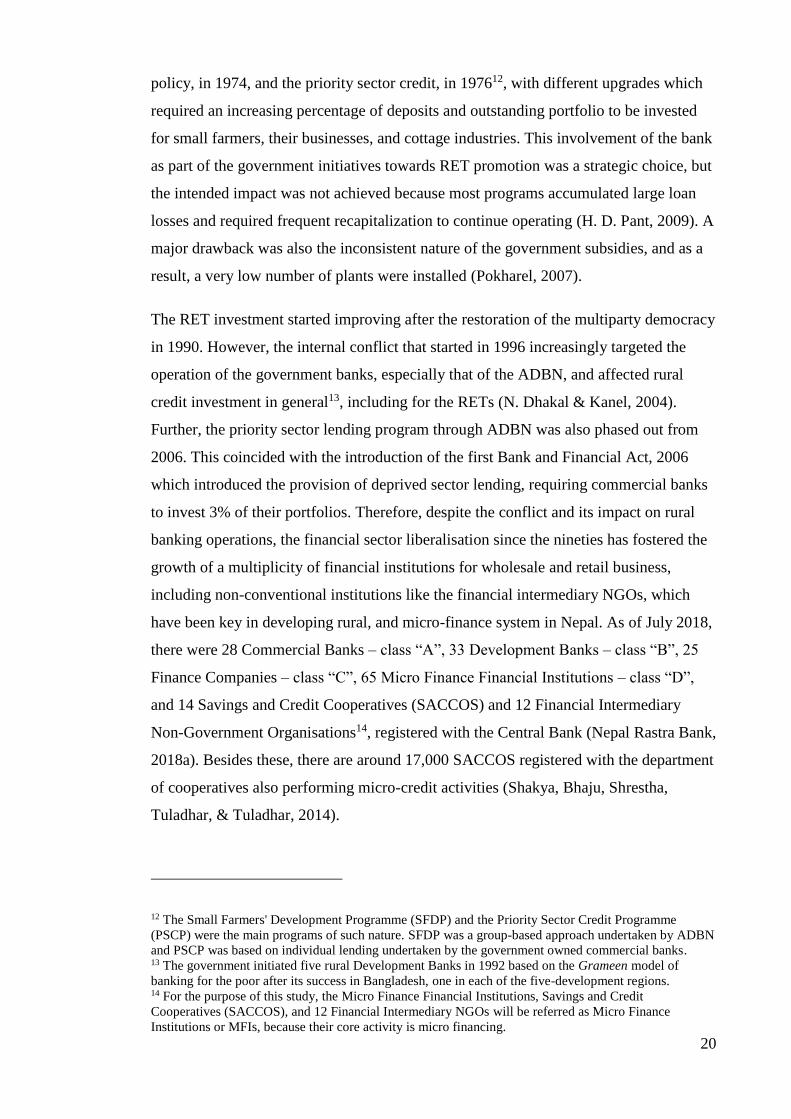
20
policy, in 1974, and the priority sector credit, in 197612, with different upgrades which
required an increasing percentage of deposits and outstanding portfolio to be invested
for small farmers, their businesses, and cottage industries. This involvement of the bank
as part of the government initiatives towards RET promotion was a strategic choice, but
the intended impact was not achieved because most programs accumulated large loan
losses and required frequent recapitalization to continue operating (H. D. Pant, 2009). A
major drawback was also the inconsistent nature of the government subsidies, and as a
result, a very low number of plants were installed (Pokharel, 2007).
The RET investment started improving after the restoration of the multiparty democracy
in 1990. However, the internal conflict that started in 1996 increasingly targeted the
operation of the government banks, especially that of the ADBN, and affected rural
credit investment in general13, including for the RETs (N. Dhakal & Kanel, 2004).
Further, the priority sector lending program through ADBN was also phased out from
2006. This coincided with the introduction of the first Bank and Financial Act, 2006
which introduced the provision of deprived sector lending, requiring commercial banks
to invest 3% of their portfolios. Therefore, despite the conflict and its impact on rural
banking operations, the financial sector liberalisation since the nineties has fostered the
growth of a multiplicity of financial institutions for wholesale and retail business,
including non-conventional institutions like the financial intermediary NGOs, which
have been key in developing rural, and micro-finance system in Nepal. As of July 2018,
there were 28 Commercial Banks – class “A”, 33 Development Banks – class “B”, 25
Finance Companies – class “C”, 65 Micro Finance Financial Institutions – class “D”,
and 14 Savings and Credit Cooperatives (SACCOS) and 12 Financial Intermediary
Non-Government Organisations14, registered with the Central Bank (Nepal Rastra Bank,
2018a). Besides these, there are around 17,000 SACCOS registered with the department
of cooperatives also performing micro-credit activities (Shakya, Bhaju, Shrestha,
Tuladhar, & Tuladhar, 2014).
12 The Small Farmers' Development Programme (SFDP) and the Priority Sector Credit Programme
(PSCP) were the main programs of such nature. SFDP was a group-based approach undertaken by ADBN
and PSCP was based on individual lending undertaken by the government owned commercial banks. 13 The government initiated five rural Development Banks in 1992 based on the Grameen model of
banking for the poor after its success in Bangladesh, one in each of the five-development regions. 14 For the purpose of this study, the Micro Finance Financial Institutions, Savings and Credit
Cooperatives (SACCOS), and 12 Financial Intermediary NGOs will be referred as Micro Finance
Institutions or MFIs, because their core activity is micro financing.

21
Despite the progress gained through financial sector liberalisation, the intended
financial inclusion – access to quality, affordable financial services – is not adequate,
making many rural households constrained by credit, savings, insurance, and remittance
services. Out of 138 economies, Nepal is ranked at 65th in terms of ease of access to
credit and 84th with respect to affordability of financial services (B. Pant, 2016). At
present, in terms of access, around 40% of the adult population use banking services,
21% use non-bank formal services, 21% use informal services, and 18% are excluded
from any financial services15 (Shakya et al., 2014). In this, most non-bank formal, and
informal services are local/locally based, which has limited the range of choice and
competition, and also the entry of commercial banks. This has made products more
expensive since providers cannot leverage economies of scale, despite the easing of
eligibility barriers for consumers. Currently large parts of the country remain excluded
from formal financial services, because the majority of banks and financial institutions
are clustered around urban and semi-urban areas. Province 3, which is the most
urbanised of the provinces, has had the largest expansion of credit, 57%, and now has
more than two-thirds, 72%, of total deposits16 (Ministry of Finance, 2018). So far, 71%,
of urban adults are formally financially included compared to a lower 58% of rural
adults (Finmark Trust, 2014). This shows that there is inequitable access to finance
across the rural and urban divide, and across the provinces. Therefore, enhancing and
deepening proximity to formal providers across Nepal is a challenge to address.
A range of barriers impedes Nepalese customers and firms from accessing financial
services. These are similar to many other Asian countries. Lower access and usage of
formal credit from the banks is attributed to the requirement of collateral, and to
information asymmetries where potential customers must show proper legal identity and
proof of income (B. Pant, 2016). Another issue constraining credit from formal sources
is the relatively high cost of client screening and due diligence for even a modest credit
application such as with MFIs, especially in relation to maladaptation and over
indebtedness (Fenton, Paavola, & Tallontire, 2017). Regulatory caps on interest rates
further reduce the ability of price to internalise risks, thereby limiting the ability to
15 The banks (Class A, B, C, D) are regulated by the Central Bank and non-bank formal institutions
(Savings and Credit Cooperatives, FINGOs) are regulated by both the Central Bank and the Department
of Cooperatives. Informal services include saving clubs/groups, private money lenders which are not
regulated. 16 Province 3 includes the capital of Nepal, Kathmandu, around which most of the economic activities is
concentrated.

22
expand. On the other hand, a number of barriers exist in both the ability to access
products and their subsequent usage. Even if there is access to financial services, low
income levels, low literacy rates, high reliance on farming, and the need for small credit
packages, lowers the potential for high-value and meaningful engagement with service
providers (Upadhyay, Ghimire, & Sharma, 2018). Out of the total adult population of
15.4 million, only 27% claim to earn a monthly income, and 42% reported earning less
than US $2 per day. This is reflected in the data where the major reasons to refrain from
savings is the lack of net savings, and, for borrowing is to meet basic household
expenses17(Finmark Trust, 2014). Further, the major customer segment is the farmers,
which accounts for 32%, 4.6 million of the adult population, and out of this, 65% use
only informal financial services. In addition, cultural and psychological barriers,
especially with respect to credit, also limits the extent of financial inclusion18. These
constraints are partly overcome by products that cater for low-value inputs and by local
peer-to-peer lending such as through MFIs or saving groups. However, the majority are
still excluded from the formal financial services, especially with respect to credit, and
are using informal services rather than the formal services, especially in rural areas19.
Therefore, while the barriers remain a consideration, the use of local and informal
services overall also shows a latent demand for the expansion of formal services, with
the right tools, products and services.
With regards to RE promotion, the Nepalese introduced a public-private partnership
based approach for market expansion in 1992, after the restoration of the multiparty
democracy, called the Biogas Support Program and popularly known as BSP. The
program was implemented with support of the Netherlands Development Organisation
(N. Dhakal, 2008). This approach motivated private vendors and financing institutions
to provide technical and financial services, through capital and interest rate subsidies,
tax waivers on equipment imports, and capacity building. This core approach has
evolved over the years through take up by various subsequent programs administered by
AEPC. The approach resulted in increased energy access through expanded donor
17 Savings are the most commonly used product, 59% use the financial services to save, and 46% for
accessing credit (Finmark Trust, 2014). 18 40% of the households thought it embarrassing to borrow or buy on credit (Finmark Trust, 2014). 19 Out of the total adult population, while 40% save with the bank and formal services and 17% save with
the informal services, only 18% take credit from the banks and formal services and a larger, 28% take
credit with the informal sources. Therefore, households have preference for informal sources with regards
to credit which is opposite in the case of savings. Further, when the overlaps are considered, 57% of the
adult population prefer to use the informal services (Shakya et al., 2014).

23
support, technology diversification, including also the participation of banks and
financial institutions. However, so far, the achievements have been possible largely by
accessing the ‘low hanging fruits', and Nepal’s goal to achieve universal access remains
unlikely without additional investments and access to finance. This is because for the
remaining harder-to-reach rural and low-income consumers, existing policies and the
institutional framework will be less efficient but more resource intensive. Private
vendors that have so far provided the installation services typically consider the low-
income consumers as risk-prone and costly. Moreover, the existing subsidy-driven
market suffers from a supply shortfall, where in services provided are constrained and
limited.
2.2.1 Financing facility and mechanisms
Nepal has three dedicated financing facilities for subsidy and credit administration,
which are administered by AEPC. They are the Central Renewable Energy Fund
(CREF), Biogas Credit Fund (BCF), and Micro Hydro Debt Fund (MHDF). The CREF,
is an overall financing facility established with the objective of up-scaling RETs. CREF
was established as part of the multi-donor funded National Rural and Renewable
Energy Program (NRREP). The fund is an improved version of the earlier Rural Energy
Fund which was housed in AEPC to primarily manage the subsidy funds provided by
the government and its development partners. In its improved version, the CREF has
expanded its mandate to include credit financing of RETs as well as subsidies, and
operates at arm’s length from AEPC. The CREF secretariat started its work in January
2015 (Central Renewable Energy Fund Investment Committee, 2015). The initial
operating fund in CREF was US $116.3 million, with 45% funding support from
various donors (Central Renewable Energy Fund, 2013). The CREF investment
committee provides the necessary strategic vision and its secretariat supports daily
activities. CREF works with a handling bank20, which is a class “A” bank contracted by
and reporting to the CREF Investment Committee. The secretariat is a lean unit, and is
housed within the handling bank. The handling bank carries out three core functions: 1)
Wholesale lending to prequalified partner banks; 2) Subsidy fund management; and 3)
Investment management. The Investment Committee and the handling bank jointly
select partner banks which serve as the retailers of the CREF credit facilities. At present,
20 The first handling bank was the Global IME bank, and recently Nepal Merchant Bank has been selected
as the handling bank.

24
CREF has seven partner banks, which are operating as direct retailers and/or also
providing wholesale loans to micro-finance institutions (MFIs) for RET investments.
The Biogas Credit Fund (BCF) was established in early 2002 with Euro 2.5 million
support from KfW, a German development bank (N. Dhakal, 2008). The fund has
guidelines approved by the Ministry of Finance, and its main objectives is to grow as a
secure capital fund to provide wholesale loans to financial institutions, especially MFIs,
to provide micro-credit for household biogas plant installations. The Biogas
Coordination Committee coordinates, guides and monitors the BCF. The fund is
managed by a Biogas Credit Unit housed in AEPC. BCU manages and operates the fund
as per the standard credit accounting principles. A broad range of financial institutions
registered under the Cooperative Act - 2017, Financial Intermediary Act - 1999, Bank
and Financial Institution Act - 2006, and Nepal Rastra Bank Act – 2002 are eligible to
obtain loans from the BCF (Centre for Microfinance, 2013). The credit mechanism
expects the Nepal Biogas Promotion Association, the association of vendors, to provide
quality installation and timely after sales services, make potential farmers aware of
biogas and motivate them, and also coordinate with MFIs. So far, the fund has provided
wholesale loans to more than 400 MFIs, resulting in nearly 35% of the total plants being
installed with credit support.
The Micro Hydro Debt Fund (MHDF) was established in 2008 with Euro 5 million
support from the GiZ, the German agency for international development. The fund was
placed in two class “A” commercial banks, to provide project financing loans to micro-
hydro projects. Micro-hydro projects which are approved for the government subsidy,
but do not have the necessary up-front capital, can get loans from the banks. The fund
and the banks share the risks equally, provided that the projects are insured against risks
(Sharma, no date). By June 2017, 26 micro-hydro projects, with a total capacity of 965
kW were funded by the banks.
The experiences of the BCF and MHDF in credit provision for specific technologies
have influenced the formulation of the overall CREF. The CREF operational guidelines
have also, in principle, approved the merger of BCF and MHDF (Central Renewable
Energy Fund Investment Committee, 2015), including the carbon revenues received due
to the various RET projects, with the CREF, thus streamlining the financing for RET

25
promotion in Nepal. The total accumulated carbon revenue stands at US $8.5 million21.
However, the mechanism of its use has not been formulated so far by the government.
2.2.2 Subsidies and credit finance
The subsidy provision for RETs is guided by the Renewable Energy Subsidy Policy,
2016 (Alternative Energy Promotion Centre, 2016), which is the fourth revision by the
Nepal government. Under this policy, the subsidies are channelled through pre-qualified
licensed companies. The subsidy is based on different categories such as the number of
households connected, energy consumed, and/or technology capacity based on ex ante
technology standards. Historically, subsidies have covered around 40% of the upfront
payments, and around 60% is covered by the end-users, through credit, cash and in-kind
support. Subsidies are provided for stand-alone mini-grids, with both the public and
private ownership, for SHS, for biogas and ICS, and for biogas-based waste-to-energy
projects. Mini-grids of up to 1 MW capacity projects are subsidised either based on
actual capacity or energy production. Besides, subsidies are also provided for off-grid
SHSs of up to 50 Wp capacity for household lighting22. The comparison of direct
subsidies in Nepal with similar subsidies provided in other nations for Solar PV such as
China (US$1.5 per Wp), Sri Lanka (US$ 100 per system), and Indonesia (US$ 75 in
Java), shows that the Nepalese subsidy is attractive (Mainali & Silveira, 2011).
Household biogas and improved cooking stoves are subsidised for cooking, irrespective
of the grid supply situation. Improved cooking stoves are provided subsidies based on
the type of stoves such as metallic and rocket stoves, while biogas digesters are
provided subsidies depending on the digester capacity. Besides, urban waste to energy
biogas projects are also subsidised based on their type such as commercial or
institutional projects, for the purposes of thermal energy or electricity generation. The
subsidy increases with the remoteness of the project locations, and top-up subsidies are
provided based on the category of household owners.
The evolution in the deprived sector lending program has increased the credit
investment in RETs by banks and financial institutions. However, studies of credit
impact show that despite the credit lending support such as of the BCF, nearly 72% of
21 Data supplied by AEPC in 2018. 22 Further, under a Special Subsidy Policy introduced in October 2016, subsidies are also provided for
larger on grid solar systems, as initiatives due to irregular electricity supply. Commercial use and
domestic use receive interest subsidy of 50% and 75% respectively.

26
the biogas plants are still constructed with cash investment (Centre for Microfinance,
2013). The ratios of plants installed with cash to total plants increased steadily starting
from 6% in 1992 to the highest, 99% in 2012. Besides the government-supported
facilities, banks have also tried to expand RET credits. In 2010, a model of solar
financing was trialled by AEPC by linking the commercial banks and MFIs, in which
capacity building support was provided to MFIs in selected districts. Participating banks
extended wholesale loans at market rates of 12% to 15% to the MFIs, which further
retailed to individual clients at 18% to 22%. Under this modality, more than 9,000 SHSs
were installed. Then in 2012, the Clean Energy Development Bank (CEDB) developed
a vender financing model and partnered with biogas vendors to install nearly 650 biogas
plants. In this model, CEDB provided the necessary technical support and finance to the
vendors, and the vendors provided credit support to the biogas users. Further, the Bank
of Kathmandu, a commercial bank, developed an agent-based model where two MFIs
were trained to provide biogas loans and collect the instalments, through fee-based
incentives at NPR 75/plant/year for monitoring the loan. Further, 6% of the loan
disbursed was fixed as guarantee and 46% of interest income was shared equally
(Centre for Microfinance, 2013).
So far, a total of US $327 million worth of RET programs have been implemented in
Nepal since the establishment of AEPC in 1996 (Alternative Energy Promotion Centre,
2018). These various programs are listed in the Appendix 4. A major proportion of
these investments has been for direct subsidies to reduce the upfront costs of the RETs.
In the example of the NRREP program from 2012 to 2017, out of the total US $91.56
million investment from various partners, US $82.53 million, nearly 90% was disbursed
for subsidy23. The program was able to mobilize only US $1.5 million, 1.6% of the total
investment, as credit (National Rural and Renewable Energy Program, 2017). Further,
out of total subsidy disbursed, 60.55% was for electricity/lighting applications and
31.83% was for clean cooking facilities. Despite this, the clean cooking applications not
only benefitted a higher proportion, 56.21% of the total households benefitted by the
program across Nepal, but also resulted in nearly 95.75% of the total emissions reduced
23 The initial planned NRREP budget was US $170.1 million, out of which, US $109.85 million, 64.5%,
was earmarked for subsidy. The list in Appendix 4 provides the estimated budget, and not the actual
expenses.

27
by the program24. Therefore, the existing investment pattern is skewed with respect to
climate change outcomes, and further, the different approaches trialled for credit
mobilisation so far have not been able to sustain commercial credit and financing. In
this context, a major policy gap has been the lack of robust research-based inputs into
RE financing initiatives.
24 Nearly, 96% of the total subsidy for cooking applications is disbursed for household biogas digesters,
and the rest is for metallic improved cookstoves. The mud-based ICS which provides cleaner cooking is
promoted without subsidy.
28
Part I Literature Review
The first part of the thesis contains the literature review. This part is divided into three
chapters. The first chapter (Chapter 3) explains the emergence of emissions trading and
carbon markets, and the theoretical perspective of renewable energy based carbon
credits as part of the larger literature based on Payment of Environmental Services. The
second chapter (Chapter 4) elaborates on the interaction between the emissions
reduction and renewable energy policies, and issues related to renewable energy
finance. The third chapter (Chapter 5) analyses the use of choice modelling, within the
field of renewable energy promotion. The status of its use in various theoretical and
empirical applications is presented as the foundation for the study.

29
Chapter 3 Emissions Trading, Carbon Markets and Carbon Credits
This chapter describes the evolution of emissions trading and carbon markets, and the
potential for carbon credits, especially from the developing countries, in an interlinked
global carbon market. The chapter also describes the distributional impacts of
allowance auction revenues in developed countries as well as carbon revenues in the
developing countries, and identifies the benefits of RET based carbon credits compared
to the forestry based credits, within the context of Payments for Environmental Services.
3.1 Emissions Trading
According to the recent Intergovernmental Panel on Climate Change report
(Intergovernmental Panel on Climate Change, 2018), the rise in global temperature and
change in climate systems due to GHG emissions continue to be the most crucial and
immediate concerns, due to their projected irreversible impacts, threatening the very
basis of human existence. The main cause is the extant local and global air pollution,
caused by fossil fuel use and deforestation that has resulted in emissions and the rise in
global temperature beyond the biological assimilative capacity. Prior to climate change,
emissions concerns from the broader energy system25 were limited to air pollution and
they were dealt within the context of local and regional pollution and health hazards,
whereas today they are transitive, cross boundary and of global nature, and therefore
also impacting the choice of environmental policies.
The use of market-based emissions trading emerged in the mid-1970s in the US. This
was due to the lack of flexibility, innovation and cost-efficiencies of regulatory
approaches implemented thus far (Andrews, 2006; Goulder & Schein, 2013; Stavins,
2007; Tietenberg, 2006). Emissions trading has a theoretical base in Coase (1960) who
defined the central role of property rights, and the impact of transaction costs, in treating
market externalities. This provided a more flexible shift in dealing with market
externalities compared to the earlier consideration of a Pigouvian tax to check the social
costs. Dales (1968) proposed the first use of market-based caps and tradable allowances
to address emissions. Further, the work carried out by various scholars, most notably by
Daly and Crocker based on Coase’s seminal work was instrumental in leveraging
emissions trading. However, Tietenberg (2006) suggested that emissions trading
25 Energy system as understood to provide for the human energy needs of lighting, cooking, heating,
cooling, and transportation.
30
emerged organically due to favourable conditions created by the regulators, and the
trading system extended, rather than replaced, the regulatory system established under
the Clean Air Act 1970 (Hahn & Hester, 1989). The compelling nature of air pollution
due to its impact, primarily on human health, and the political need to balance the
interests of industry and environmentalists forced the regulators to take up emissions
trading. A credit-based emissions trading policy commenced in 1976 (Tietenberg,
2006).
Cap and trade has equity benefits as well as efficiency benefits over other forms of
emissions regulation (Farber, 2012). A major advantage of emissions trading is that
there are many design elements viz. auctions, banking, offsets which can be used to
address the equity and political concerns (Farber, 2012; Schmalensee & Stavins, 2017;
Stavins, 2007). One of the reasons markets preferred emissions trading compared to a
pollution tax is because it encourages new, smaller and efficient companies to achieve
the target by trading and revenue earnings, as against the condition of paying uniform
taxes under a tax regime. Further, the cost of emission reduction is lower compared to
technology and tax regulations (Schmalensee & Stavins, 2017). This is also evident
from the comparison of carbon prices under different regulatory regimes in different
countries (Kossoy et al., 2015). Therefore, since trading allows society to obtain
comparable environmental benefits at a lower cost, this feature can have implications
for social equity as well as for regulatory efficiency. Lower program costs can mean
less cost to be passed along to consumers and this has significance for low-income
consumers. Table outlines the emissions credit and trading schemes that emerged in the
US.
Emissions trading has incorporated innovative market designs over the years starting
with the introduction of bubble, banking, and netting policies in the 1980s. These
mechanisms allowed flexibility in reducing emissions through aggregation of emissions
from different sources, and allowed future credits for optional use or sale. This was
followed by the successful implementation of the tradable permit approach for the
phase-out of lead in gasoline (Ellerman & Harrison Jr, 2003; Hahn & Hester, 1989;
Tietenberg, 2006). These early successes led to implementation of the Acid Rain
program, to control sulphur dioxide (SO2) emissions at the US Federal level. Some
regional trading programs, notably the Regional Clean Air Incentives Market
(RECLAIM) and Nitrogen Oxides (NOx) Budget Trading program (NBP) were also
initiated at this time (Ellerman & Harrison Jr, 2003; Schmalensee & Stavins, 2015).

S.N Name Period Pollutants Coverage Allowance Estimated Reduction Actual
Reduction Domestic Offset
1 Baseline and
Credit, Offset
Policy
1976 Various
Pollutants
National,
Stationary
Tradable credits-
certification26
Domestic Offsets
2 Lead Phase
Out
1982-1987 Lead National, gasoline Lead standards with
banking, averaging
Total phase out of
lead
NA
3 Acid Rain
Program
Phase I
1995-99,
Phase II
2000-10
SO2 National, electric
Utilities
Revenue neutral
auction, 3%Ϯ
10 million tons from
1980 level by 2010Ϯ
~ 8 million tons
from 1980 levels
by 2010, ~ 50%
reductionҰ
NA
4 RECLAIM 1994-
Ongoing
NOx, SO2 Regional, electric
utilities and
industrial sources
Free allocation 1) NOx by 87%, from
40,187 to 5,312 tons,
from 1994 to 2023Ѱ
2) SO2 by 78%, from
10,559 to 2,219 tons,
from 1994 to 2020 Ѱ
1) NOx by 71%,
from 25,420 to
7,328 tons, until
2016 Ѱ
2) SO2 by 72%,
from 7,230 to
NA
26 The new sources were required to secure credits from existing sources for 120% of the emissions they would add; the extra 20% would be “retired” as an improvement in air
quality (Tietenberg, 2006).
Table 3-1: Emission Trading and Credit Programs in US

32
2,024 tons, until
2016 Ѱ
5 NOx Budget
Trading
Phase II
1999-2002,
Phase III
2003-200827
NOx Regional,
Seasonal, Boilers
and Electric
Utilities
Free allocation 55-65% from 1999-
2002ǂ
75-85% from 2003-
2008ǂ
In phase I,
280,000 tons
from 1990
baseline, 60%
reductionƞ
NA
6 RGGI 2009-2030 CO2 (446.0
million tCO2 in
2012)*
Regional, Electric
utilities (20%)*
~ 100 % auction* By 2020: 50% below
2005 level*
By 2030: 30% below
2020, reduction of 3%
annually*
3.3% from 2021
to 2030*
7 California
Cap-and-
Trade (AB 32)
2012-2030 CO₂, CH₄,
N2O, SF₆,
HFCs, PFCs,
NF₃ (440.4
million tCO2e
in 2015)*
California State
Economy wide
(85%)*
60 - 80% auction By 2020: Return to
1990
By 2030: 40% below
1990, reduction of 4%
annually*
Up to 2020, 8%*
Up to 2030, 4-
6%*
Ϯ(Tietenberg, 2006) Ұ(United States Environment Protection Agency, 2018) Ѱ(South Coast Air Quality Management District, 2018) ǂ(A. Farrell, 2001) ƞ(Napolitano, Stevens, Schreifels, & Culligan, 2007) *(International Carbon Action Partnership, 2018)
27 In Phase I, sources were required to reduce annual rates of NOx emissions to meet Reasonably Available Control Technology requirements. The cap-and-trade was initiated in
Phase II (Tietenberg, 2006).

Despite initial controversy among industry and environmental groups, the “acid rain
program” was a resounding success with a 36% reduction in emissions causing acid rain
from 1994 to 2000, with 100% industry compliance (Schmalensee & Stavins, 2017).
Similarly, the NBP reduced NOx emissions by 60% from its 1990 baseline by 2002 (A.
Farrell, 2001; A. Farrell, Carter, & Raufer, 1999; Napolitano et al., 2007). RECLAIM
was instrumental in reducing NOx and SO2 emissions by 54% and 40% during 1994 to
2011 (Lurmann, Avol, & Gilliland, 2015) despite a 38% increase in regional vehicle
activity and a 30% population increase. Besides the abatement, cost savings were also
substantial. A. Farrell (2001) indicated a cost saving of nearly 50% with NBP compared
with conventional regulation28.
These US experiences laid the groundwork for the wider adoption of emissions trading,
with valuable lessons learned regarding allowances, auctions, spatial and temporal
implementation, banking, and the importance of energy and associated market
liberalisation such as the railway markets (Schmalensee & Stavins, 2013; Schmalensee
& Stavins, 2017). This early success in the US was due to the crucial bipartisan support
for emissions trading at the Federal level, as a flexible market mechanism for local
pollutants. In hindsight these seemed to be the marginal low hanging fruits in the air
pollution and environmental markets. Subsequent efforts to reduce greenhouse gases
have proven to be more difficult and have resulted in deep partisan politics within
countries such as the US and Australia, and in tough negotiations between developing
economies and industrialised countries on the appropriate level of commitment and
responsibilities. Nevertheless, there has been progress with voluntary participation
through Nationally Determined Contributions (NDCs) by a majority country for the
Paris Agreement in December 2015. Following this agreement, voluntary local level
initiatives such as the Regional Greenhouse Gas Initiatives and Chinese National ETS,
together with linking them directly are considered the way forward (A. Farrell, 2001;
Fujimori et al., 2017; Ranson & Stavins, 2016; X. Zhang, Qi, Ou, & Zhang, 2017).
Numerical simulations indicate that a linked emissions trading system covering the
28 The different programs were phased in with the Clean Air Interstate Rule, which started in 2009. CAIR
purpose was to mitigate the continuing nonattainment of the ozone due to the interstate effects of NOx
emissions, and the fine particular matter (PM2.5) due to the interstate effects of both NOx and S02
emissions. In doing so, the intention for CAIR was to subsume the other programs. CAIR was replaced by
Cross State Air Pollution Rule in January 2015 (Moren, 2009).

34
power and industry sectors in all countries could reduce the mitigation costs by more
than 72% (Rose, Wei, Miller, Vandyck, & Flachsland, 2018).
3.2 Carbon Markets
The US experiences have provided useful examples for understanding the potential and
challenges in the design of an international carbon emissions trading market (Convery,
Ellerman, & De Perthuis, 2008; A. Farrell, 2001). Despite this, it is the European Union
(EU) carbon market that has become the largest in the world. International carbon29
emissions trading emerged after the global consensus to tackle climate change at the Rio
Earth Summit in 1992 (Bodansky, 1999) with the adoption of the United Nations
Framework Convention on Climate Change (UNFCCC). While there was minimal
debate in terms of the use of a pricing mechanism compared to a regulatory mechanism,
the US experience shifted negotiation towards the use of emissions trading, while the
EU initially emphasised more domestic actions with stronger targets30 (Convery et al.,
2008). In this debate, most developing countries argued for coupling GHG reduction
with development, and emphasised increasing financial aid. Most importantly, the
rapidly emerging economies avoided taking responsibilities citing the issue of common,
but differentiated responsibilities (United Nations, 1998). The literature suggests that
the EU agreed on emissions trading to enhance the possibility of US ratification
(Newell, Pizer, & Raimi, 2013), but eventually the first international carbon emission
reduction policy - the Kyoto Protocol- was agreed without US participation in 199731.
The Kyoto protocol completed its first commitment period from 2005 to 2012, and the
second commitment period extended from 2013 to 2020. Under its first phase, the
aggregate emissions reduced significantly, reported as 24% below the 1990 level. This
is a huge reduction compared to the target of only a 5% reduction. Three main factors
are considered for this level of reduction 1) a growing share of the service sector; 2) a
less polluting industrial sector; and 3) a higher use of imported goods – often known as
“outsourced emissions”. Further, the emissions reductions were also already happening
29 The trading is generally carried out based on carbon dioxide equivalent (CO2e) of six different
greenhouse gases: Carbon dioxide (CO2), Methane (CH4), Nitrous oxide (N2O), Chlorofluorocarbons
(CFCs), Hydrofluorocarbons (HFCs), and Perofluorocarbons (PFCs)(Mayer, 2018). 30 This was despite the push for a tax based regime for GHG emissions, since some of the first set of
carbon pricing instruments were taxes in Scandinavia in the early 1990s. Finland adopted a carbon tax in
1990; Sweden and Norway followed suit in 1991; and Denmark enacted its carbon tax in 1992. 31 The Kyoto Protocol was adopted in Kyoto, Japan, on 11 December 1997 and entered into force on 16
February 2005, after the required ratification condition was met with the ratification by Russia.

35
due to RE and Energy Efficiency (EE) initiatives prior to the Kyoto commitment period.
Further, the apparent success with Kyoto was nullified due to emissions in the rest of
the world, and, when carbon footprints due to outsourced emissions are considered, the
emissions in industrialised countries increased by more than 7%. The achievement in
Kyoto is also attributed to a generous over-allocation of allowances to the former USSR
countries, which is popularly known as “hot air”.
While the US non-participation was a major setback because of its large carbon
emissions, a block of North eastern states in the US created the Regional Greenhouse
Gas Initiatives (RGGI), the first market-based effort to reduce carbon dioxide (CO2)
emissions in the US in 2005. The European Union started the European Union
Emissions Trading Scheme or EU ETS in 2005, in line with the Kyoto commitment
period32, and has also completed its first commitment from 2005 to 2012, and is running
in its second commitment period from 2013 to 2020. A principle reason for favouring
an ETS was due to the certainty in reduction that can be achieved through declining
caps. This was important given the sensitivity and necessity of GHG reductions, its
lower direct impacts on the poorer in the economy compared to a tax regime, and its
encouraging trade and market development. Further, an important factor with carbon
trading was also the possibility of sourcing carbon credits at lower costs and linking
with clean development objectives in the developing and least developed countries.
Theoretically, carbon trading with credits is an expanded equitable version of the
“polluters pay principle” that allowed international trading and development
opportunities to emerge from the climate change crisis, and was therefore essentially
laissez faire compared to a carbon tax33. Table 3-2 presents the ETS schemes with
options for linking with international credits or has expressed possibilities of such
linking beyond 2020.
As of 2017, there were 25 ETSs covering approximately 15% of global emissions, 7.4
billion tCO2e34(World Bank, 2018a). To date, the EU ETS is the largest
32 EU ETS implementation was not made contingent on the Protocol entering into force. 33 Taxes are rejected due to their sensitivity to economic and political cycles, i.e. lesser sensitivity to
economic cycles means the risk of being a large drag on the economy when it is weak or failing to
constrain GHG emissions increases when the economy is strong. Political cycles relate to uncertainty due
to partisan politics often seen as inherent to a carbon tax compared to trading markets. 34 There are 51 carbon pricing initiatives, including 26 carbon taxes, which together cover 11 billion
tCO2e, about 20% of global GHG emission.

S.N Name Period Pollutants Coverage Allowance Estimated Reduction Actual Reduction International Offset
1 EU ETS
1.1 Phase I 2005-07 CO2 Power &
industry
Only four member
states used auctioning,
auctioned allowances
accounted for 0.13% of
the total allocationҰ
NA
50 to 100 million
tons, 2.5 to 5% of
BAU Ұ
Unlimited use of
CDM and JI credits,
but not actually
used#
1.2 Phase II 2008-12 CO2, NOx Power &
industry ~4% auctioned^ 8% below the 1990 levelҰ
Average annual
rate of 2.1%*
(2004-2014)
11% of Compliance*
1.3 Phase III 2013-20
CO2, N2O,
PFCs (4,367
million tCO2e
in 2015)#
Power,
industry &
domestic
aviation
(45%)#
~57% auction
estimated^
By 2020: 20% below
1990, a reduction of
1.74% annually#
1.4 Phase IV 2021-30 NA NA
By 2030: 40% below
1990, a reduction of 2.2%
annually#
New Market
Mechanisms^
2 Swiss
ETS
Phase I:
2008-12
Phase II:
2013-20
CO₂, NO₂,
CH4, HFCs,
NF3, SF6,
PFCs (48.14
Industry
(11%)#
Phase I: Free allocation
Phase II: 20%
auctioned in 2013, 70%
auction by 2020#
By 2020: 20% below
1990, a reduction of
1.74% annually#
4.5% between 2013-
20#
Table 3-2: Carbon Trading Schemes with International Credits

37
million tCO2e
in 2015)#
By 2030: 50% below
1990 level#
3 NZ ETS 2008-30
CO₂, CH4,
N2O, SF₆,
HFCs, PFCs
(80.2 million
tCO2e in
2015)
Economy
wide (52%)#
A maximum of 40%
auction depending on
the source type#
By 2020: 5% below
1990#
By 2030: 30% below
2005#
Limited international
credits beyond 2020#
4 KETS
Phase I:
2015-17
Phase II:
2018-20
Phase
III:
2021-25
CO₂, CH₄,
N₂O, PFCS,
HFCs, SF₆
(690.6 million
tCO2e in
2014)#
Economy
wide, except
forestry
(67.7%)#
Phase I: 100% free#
Phase II: 3% auction#
Phase III: > 10%
auction#
By 2020: 30% below
BAU#
By 2030: 37% below
BAU#
Maximum of 5% in
2021-25#
Ұ(Convery et al., 2008) *(Ellerman, Marcantonini, & Zaklan, 2016) ^(European Union Emissions Trading Scheme, 2018) #(International Carbon
Action Partnership, 2018)

instrument which covers 2 billion tCO2e, and the US and China are the two individual
countries with the largest ETSs, with 0.5 and 1.3 billion tCO2e respectively (Vivid
Economics, 2016). At present, the EU ETS, which covers around 45% of total European
emissions, is the main market for international credits from developing countries
(Ellerman et al., 2016). The total use of credits for Phase II and III may amount up to
50% of the overall reduction under the EU ETS, or approximately 1.6 billion tCO2e
(International Carbon Action Partnership, 2018). However, the EU ETS has used 1.5
billion tCO2e of allowed international credits, and therefore actually has surplus credits
which it has put aside as the Market Stability Reserve35. Since 2012, new credits have
only been accepted from the LDCs. Besides the EU ETS, the Swiss ETS, which is in
due process of linking with the EU ETS, also caters to the international credits36. The
scheme allows industries entering the ETS in the mandatory phase, 2013-20, to cover
4.5% of their actual emissions from international credits. Further, the New Zealand ETS
which used international credits until 2015, plans to use limited credit beyond 2020.
Similarly, the newly introduced South Korean ETS foresees use of international credits
of up to 5% of compliance obligations during 2021 to 2025.
There are 21 more ETSs in operation. Many of these allow compliance to be met
through domestic credits. One such is the California ETS, which could consider using
international credits in future. Considering that 88 Nationally Determined Contributions
include proposals for carbon pricing, which in total account for 61% of global GHG
emissions, there is a growing market for credits. It is expected that the demand for
international credits will be from these emerging carbon pricing initiatives scheduled
beyond 2020. In this context, the demand from the Carbon Offsetting and Reduction
Scheme for International Aviation (CORSIA) (Mayer, 2018; Thomson Reuters, 2018)
as well as the initiatives around results-based finance (RBF) (Vivid Economics, 2017),
are expected to raise the demand for international credits to more than 30 million tCO2e
per year.
Existing carbon prices vary significantly. Nearly half of the traded emissions are priced
at less than US $10 per tCO2e, which is considerably lower than the price needed for
35 The surplus happened also due to the global financial crisis that unfolded in 2008. However,
allowances in MSR will be gradually cancelled from January 2019 at 24% of the surplus each year up to
2023 and 12% thereafter (International Carbon Action Partnership, 2018). 36 Negotiations between the EU and Switzerland opened in 2010, and a linking agreement was initialled
in January 2016. The agreement was signed on 23 November 2017. The link is expected to happen in 1
January 2020 when all criteria in the agreement are met.

39
transformative changes (Ellerman et al., 2016) to meet the targets envisaged by the Paris
Agreement (World Bank, 2018a). It is expected, that as more systems emerge, the share
of emissions covered by ETSs will grow, and at the same time, increasing caps and
auctioning, and market certainty through banking (Daskalakis, 2018) and price
containment measures37 will lead to increasing prices (Thomson Reuters, 2018). This is
evident in the case of the EU ETS where the price is expected to reach Euro 25-30 per
tonne by 2020-21(World Bank, 2018a). However, most scenario analyses indicate a
global average carbon price between US $40 and US $80 per tCO2e in 2020 as being
consistent with a 2°C (World Bank, 2018a). Pursuing deeper cuts for a 1.5°C
containment would increase the price further. The Paris agreement38 with its two
elements, namely Internationally Transferred Mitigation Outcomes (ITMOs) and the
Sustainable Development Mechanisms (SDMs)(Gavard & Kirat, 2018; United Nations,
2015), provides new avenues for a dynamic global carbon market based on sectoral and
geographical linking of ETSs. As the new mechanisms develop and as countries seek to
meet their targets, it is expected that the market will grow, creating spaces and
opportunities for many bottom-up carbon credits (Dransfeld, Hoch, Honegger, &
Michaelowa, 2015).
Besides the compliance markets, voluntary markets constitute a smaller, but niche
market for credits. Even though small, these markets have been a major contributor to
the growth of carbon markets. The voluntary trading started, especially after the US
pull-out from negotiations in 1991 Kyoto Protocol, when a whole range of market
actors at multiple scales started to emerge around offsets (Bumpus, Liverman, & Lovell,
2010), leading to different carbon standards and exchange registries such as the Verified
Carbon and Gold Standards. Firms with large carbon footprints and subsequent
financial exposure to regulation, normally acquire credits in advance. Carbon neutrality
at various levels drives the voluntary markets, and while forestry and land use credits
are favoured by most buyers, RE and EE credits now make up 48% of the credits issued
(Forest Trends, 2018). The voluntary markets have so far been an incubator for market
innovation, often for later adoption by the compliance markets. Some developing
37 Such as the Market Stability Reserve of EU ETS, Price Ceiling in the California Cap and Trade, and 5-
year auction notice in NZ ETS. 38 Paris Agreement was ratified on November 2016, one year after the Agreement, and will enter into
force starting 2021. Compared to this, the Kyoto Protocol was adopted on 11 December 1997, was
ratified on, and entered into force on 16 February 2005.

40
country projects have set the stage for a few out-of-the-box contributions, such as the
results-based payments scheme which is receiving increasing attention (Dransfeld et al.,
2015). In general, a large portfolio of credits has resulted due to new technologies and
procedures learnt from bottom-up voluntary carbon projects. The voluntary markets
offer lower costs and complexity, and consider development co-benefits, while taking-
up risk and trialling new technologies. Even though the total amount of transactions in
voluntary markets is small, it is seen as a self-regulating temperate market, sometimes
outside of formal states, creating hybrid and new forms of public-private governance
that enhances links between North and South.
In 2017, voluntary markets issued all-time high credits for 62.7 million tCO2e, which is
a 70% increase over 2016 (Forest Trends, 2018). While many factors contribute to the
volume issued and retired in a given year, one reason for this uptick in 2017 may have
been the Paris Agreement, as more awareness led businesses to make new
commitments. Since 2005, projects have helped to reduce, sequester, or avoid over
437.1 million tCO2e. However, the lower average price, ranging from US $3 to 6 per
tCO2e has negative impacts on the supply of voluntary credits, compared to the
relatively consistent price in the compliance market. The role of credits that have
historically been generated for voluntary offsetting purposes might shift to compliance
under some of the emerging initiatives, such as CORSIA, which could be a major
source of demand for voluntary credits, depending on the eligibility rules for such
credits (Vivid Economics, 2017). However, as of now, credits generated under
voluntary standards are facing increased competition from the surplus compliance
credits, which increased to 4.8 million tCO2e in 2016 compared to 0.8 million tCO2e in
2015 (Forest Trends, 2016). There is considerable uncertainty about the role of the
voluntary market under the Paris Agreement regime (Thomson Reuters, 2018), and
therefore, the market could exist outside the scope of sectoral emissions intended by
Nationally Determined Contributions (Vivid Economics, 2017), in such sectors as land
use and forestry, or in countries outside the Paris Agreement, such as the US and
Australia. However, it is expected that there will always be a market for voluntary
credits as part of larger equitable concerns driven by voluntary environmental
stewardship and existence values. The above developments suggest an increasing direct
linkages between emissions markets and credits, where the least developed countries
can seek to benefit.
41
3.3 Emissions Trading and Distributional Impacts
Emissions trading results in distributional impacts in both the countries purchasing
carbon credits, and in the countries, where the carbon credits (offsets) are generated, and
sold. In this sub-section, attention is focused on the distributional effects in the countries
purchasing carbon credits. The review of the distributional effects in countries where
the carbon credits are generated requires a prior discussion of payments for
environmental services (PES). Hence, the PES discussion and the consideration of the
distributional impacts in countries generating carbon credits is contained in Section 3.4.
3.3.1 General distributional impacts
Calculating the precise distributional effects of an ETS is complex and uncertain
(Roberts, 2010). Most emissions markets started with the free allocation of allowances,
based on historical emissions, known as “grandfathering”. While some literature has
positioned grandfathering as transition relief, the practice in many circumstances has
undermined the goals of the policy change, particularly in the case of the energy
wholesale market where free allocations were passed on at a price to the consumers,
which allowed the companies to earn windfall profits (Burtraw, Palmer, Bharvirkar, &
Paul, 2001; Ellerman et al., 2016; Farber, 2012; A. Farrell, 2001; N. Farrell & Lyons,
2016). In the EU ETS, utilities with free allowances initially responded to the program
by raising consumer energy prices, generating millions in profits while consumers faced
higher energy prices (Point Carbon, 2008). The aftermath of this initial free allocations
was also felt in the prices for the carbon credits at the end of the Phase II of the EU
ETS39, when considerable surplus credits were available that plunged the price to less
than one Euro. Subsequent implementation of the phased allowance auctions has been
an improvement on grandfathering, because it reduces tax distortions, provides more
flexibility in the distribution of costs, provides incentives for innovation, and reduces
the politically contentious arguments over the allocation of rents, while generating
revenues that can help meet economic efficiency and distributional goals (Burtraw et al.,
2001; Cramton & Kerr, 2002; Goeree, Palmer, Holt, Shobe, & Burtraw, 2010).
The idea of putting a price on carbon increases the cost of goods and services as a
reflection of the internalisation of the environmental externalities. This has its largest
39 The end of Phase II EU ETS also coincided with the end of the UNFCCC Kyoto commitment period of
2008-2012, where in there was no agreement by the international community on the continuation of the
compliance protocol, which also affected the CO2e prices.

42
impact in carbon intensive sectors (Dinan & Rogers, 2002). Moreover, in industrialised
countries, these price increases can result in regressive effects with higher financial
burden on poorer households (brennerBarragán-Beaud, Pizarro-Alonso, Xylia, Syri, &
Silveira, 2018; Büchs, Bardsley, & Duwe, 2011; Farber, 2012; Haug, Eden, & de Oca,
2018; Parry, 2004). Conversely, in the case of developing countries, pricing carbon is
expected to result in progressive impacts, leaving the poorer households less burdened
in relative terms (Baumol, 1978; Thorbecke, 2016). This is because of the lack of access
to services by the poor gets translated into higher carbon emissions by richer
households. However, pricing carbon would nevertheless reduce the average disposable
income in absolute terms in all regions.
A few emerging economies, such as in China, have started their pricing mechanisms
with provincial ETSs, while Mexico and Colombia, have started with carbon taxes. The
ex post distributional implications of such mechanisms is yet to be analysed. However,
even if the distributional implications were known, these emerging economies are also
amongst the highest emitters and generalising from them across the developing
countries, especially to the least developed countries40, is likely to lead to an inaccurate
estimation.
3.3.2 Health impacts
Besides some regressive impacts of pricing, another related equity issue is the health
impacts of ETSs on the poor and marginalised. This is because in a deregulated market
there is a tendency to give low priority to capital intensive environmental compliance
(Mauzerall, Sultan, Kim, & Bradford, 2005), and such emission sources tend to be
located in areas with poor and marginalised neighbourhoods that experience
disproportionate exposure to co-pollutants41(Motsinger, Moss, & Fine, 2010; Salihu et
al., 2012). Therefore, trading creates a potential risk of maintaining or exacerbating
existing disparities. In such cases, it is often the health impacts of pollutants like NOx
or particulate matter42 (Kaswan, 2013) rather than the CO2 emissions that cause the
increased incidence of health impacts (Farber, 2012).
40 The CO2e emissions per capita in the LDCs is 0.311 tonnes (World Bank, 2014). 41 Black women exposed to particulate pollution had the greatest odds for all of the morbidity outcomes,
and most pronounced for very low birth weight. 42 These are air pollutant gases beyond the GHG gases that cause the local health impacts

43
The situation is further exacerbated due to substandard medical care, and poor nutrition
and housing facilities for poorer communities, and their reliance on inefficient
appliances such as air conditioners, old refrigerators, polluting vehicles and other
heating and cooking appliances (Mauzerall et al., 2005). This is paradoxical in the
context where one of the principal objectives of ETSs is to mitigate the health impacts,
and while the objectives may be achieved in aggregate, the achievement is at the cost of
health impacts on the poorer in the society. In the developing countries, this impact is
more critical given the increased vulnerability of the poorer communities to such
pollutants (Xiaoyu Chen, Shao, Tian, Xie, & Yin, 2017; Mannucci & Franchini, 2017).
Even though an ETS has no intrinsic tendency to increase emissions in disadvantaged
poorer communities, designers of emissions trading should be alert to possible hot
spots, particularly in low-income and minority communities (Kaswan, 2013).
3.3.3 Revenue recycling and use
There are several revenue recycling policy options to counterbalance the possible
regressive effects of carbon pricing (Büchs et al., 2011; Carl & Fedor, 2016). From an
equity perspective, this would mean a fairer allocation of environmental resources so
that the unfair socio-economic and environmental conditions, especially of the poor and
vulnerable could be addressed. A pertinent issue to focus on is the use of revenue
generated from carbon pricing and the distributional effects associated with alternative
designs of revenue recycling policies (Dinan & Rogers, 2002).
Several studies, bills and policy documents have modelled the impacts of alternative
revenue recycling schemes across households, industries, and across countries with
financial support considered to address adaptation, technology development, RE and
EE, and international support (Blonz, Burtraw, & Walls, 2010; Brenner, Riddle, &
Boyce, 2007; Büchs et al., 2011; Burtraw, Sweeney, & Walls, 2009; Carl & Fedor,
2016; Dinan & Rogers, 2002; Ellerman et al., 2016; Haug et al., 2018; Rose et al.,
2018). The general finding is that the most progressive revenue recycling methods
would be the cap and dividend where firms pay pollution charges to the government and
then pass on price increases to consumers who receive compensating payments from the
government. A lump-sum dividend return on an equal per capita income basis benefits
the low and middle-income households proportionately more, and is simple with

44
predictable and straightforward impacts of distribution, without affecting the price
signals (Blonz et al., 2010; Haug et al., 2018)43.
Another major recommended use of such revenue is to cut different government taxes –
to improve efficiency from the distortionary impacts of such taxes (Dinan & Rogers,
2002; Roberts, 2010; Schmalensee & Stavins, 2017). However, cutting corporate taxes
is found to be regressive, though less so than grandfathering and free allocation (Blonz
et al., 2010; Farber). Burtraw et al. (2009) found that reducing payroll or income taxes
makes things more regressive, but, such policies together with earned income tax cuts
for low income household reverses the regressivity.
Further, (Dinan & Rogers, 2002) analysed the impact of relative benefits due to
international offset trading compared to the domestic trading only scenario. The results
indicate that international trading would make developed country households better off
across all policy alternatives. Also, the lower cost of offsets would lower the
deadweight losses in the carbon and factor markets, and therefore lower the overall
policy costs. In the case of a particular cap and dividend policy, with domestic trading
only, the higher quintile households in the developed countries would be negatively
impacted. The inclusion of international offsets trading would reduce this burden, while
also marginally reducing the potential dividend income earned by the lower quintile
households (Dinan & Rogers, 2002)44. This result holds regardless of the assumptions
that are made about the price of offsets or the speed at which emissions reduce. This
shows that international offset trading not only reduces the aggregate cost (Rose et al.,
2018), but also balances the disproportionate impacts of cap and dividend policy to the
higher income groups in developed countries, which may be important in setting up
national conditions to allow emissions trading (Baranzini, Borzykowski, & Carattini,
2018; Dinan & Rogers, 2002).
43 California Cap and Trade and Swiss ETS recycles the lump sum revenue. California returns the auction
revenues directly to households twice a year on their electricity bills. The amount is independent of the
electricity use, and therefore does not interfere with the carbon price signal. In the Swiss ETS, revenue is
redistributed equally, through the national health insurance system, against the health insurance premium. 44 A lab experiment with 300 undergraduate students in Switzerland prompted respondents to choose the
international credits for its cost-effectiveness and was particularly unresponsive to risks of credibility and
to local benefits associated with domestic credits.

45
3.4 Emissions Trading, Carbon Credits, and Payment for Environmental
Services
3.4.1 Introduction
The generation of carbon credits, and their linkage to the international carbon market
can be analysed from the perspective of Payment for Environmental Services (PES).
While PES remains a multifaceted term with many diverse definitions (Cranford &
Mourato, 2014; Schomers & Matzdorf, 2013)45, its interpretation for this study is within
a broader contextual definition of PES. (Mobarak, Dwivedi, Bailis, Hildemann, &
Miller, 2012); Scherr, Bennett, Loughney, and Canby (2006, p.5) have described PES
“as an umbrella term to include both programmes that rely on one-off deals with rural
landowners who agree to steward ecosystem services, as well as more complex
‘markets’ mechanisms involving credits traded among many buyers and sellers.”
Similarly, Vatn (2010) finds it productive to make a distinction between the wider
concept of PES and the concept of Markets for Environmental Services, which allows
systems in hierarchies and communities, such as in the form of state taxes and subsidies
or community compensations and rewards, to be included. These definitions have
originated from the existing situation where many schemes operating can be termed as
“PES-like” quasi-markets (Fletcher & Breitling, 2012), where there is a lack of
functioning markets but instead state support and substantial government regulation and
intervention inconsistent with the market-based logic (Pirard, 2012). In this context, the
definition of Wunder (2005) is mostly used to define PES as 1) a voluntary transaction
where 2) a well-defined ES 3) is being ‘bought’ by a (minimum one) ES buyer 4) from
a (minimum one) ES provider 5) if and only if the ES provider secures ES provision
(conditionality). Therefore, in practical terms, a PES need not be market-based so long
as it functions effectively. However, theoretically, there is an assertion that movement
towards increasing market-based mechanisms will enhance PES efficiency and
effectiveness (Fletcher & Breitling, 2012).
45 The literature describes PES as “Payment for Ecosystem Services” or “Payment for Ecological
Services”, where payment is made for conservation and preservation outcomes which are valued by the
society. PES and PES labelled literature includes many initiatives in the developing and least developed
countries, but ignores the long standing research on agri-environmental incentive programs in the
industrialised countries.

46
Within the climate change regime, all payments as part of the market transactions or
otherwise for carbon reductions can be considered a PES46, where carbon trading can be
seen as an environmental trade between the ES provider, the developing countries
and/or its entities and the ES users, the industrialised countries and/or their regulated
entities, who pay a price to get those services (Engel, Pagiola, & Wunder, 2008).
Within the literature, international carbon payments are referred to as international
payments for ecosystem services. Most discussed is the carbon sequestration (Schomers
& Matzdorf, 2013) by forest management practices within the mechanisms of voluntary
markets, Kyoto CDM, and REDD+. However, mitigation through RETs or energy
efficiency so far has not featured prominently within the theoretical framework of PES.
Therefore, insights from the PES discourse could be useful in understanding the context
of GHG reduction from RETs, especially with respect to the new market mechanisms.
3.4.2 Institutional context of PES distribution
From a theoretical perspective, carbon trading in its entirety is conceptualised as a mix
of both the Coasean (Coase, 1960) and Pigouvian (Pigou, 1932) concepts in the PES
literature. As discussed in the previous chapter, the advantages of market economics of
the Coasean approach has led to the adoption of domestic and international carbon
trading, where demand for carbon credits is defined by the domestic climate policy in
the industrialised countries47 and the international carbon market conditions. These
conditions depend on 1) the precision of science behind climate change and its
acceptance by parties which will guide the scale of reduction to be achieved; 2) the
allowable limits of offsets to be used as part of emissions trading within and between
governments within the larger carbon budget available as per the degree of reduction to
be achieved; and 3) the international compliance protocols which will direct the
structure of new market mechanisms and market appetite for carbon credits. The linkage
of the larger carbon market to carbon credits happens in a quasi-market or market-like
condition where contractual agreement is carried out as one-off bilateral, mutually-
negotiated trade between the ES buyers and sellers. In this context, theoretically, the
sellers in developing countries like Nepal are open to negotiate with any party in the
46 While the PES discourse has focussed on the land use changes to conserve forests, using a solar PV
system to reduce conventional fossil fuel can be an environmental service. 47 The interaction of climate and renewable energy policy is important in shaping the market demand for
offsets and is explained in greater detail in the next chapter.
47
market, but most often, because of the transaction costs involved, and the anchoring
effect of the projects financed with aid support, contract negotiations are made with the
entities that have supported the project, either technically or financially. In many
contractual agreements, those who generate the offsets do not have the adequate
information about the real buyer/s in terms of their domestic compliance conditions, or
the overall international market conditions, to be able to make informed decisions
beyond basic information like volume and price commitments48. This may lead to
conditions where suppliers are prone to information asymmetries and adverse selection
(van Kooten, 2017). However, it is also observed that in many contexts, benevolent
buyers can offer better prices than the market for the co-benefits of projects, despite
their market power. However, this is not a consolation to the lack of optimal market
conditions offered by pure market linkages, and therefore while the contract conditions,
volume and prices are influenced by the larger carbon market conditions, the actual
trade between a buyer and a seller largely happens because of the political economy in
which vested interests backed by superior knowledge create market distortions
(Angelsen et al., 2017; Dinan & Rogers, 2002).
Many instances of incentives distribution within the developing countries fit within the
Pigouvian concept of PES, where the ES buyers provide funding as an environmental
subsidy to ES providers (Cranford & Mourato, 2014; Schomers & Matzdorf, 2013; Van
Hecken & Bastiaensen, 2010). This is because in most cases local governments are the
immediate buyers, and pay for the PES. In many instances, the government, NGOs and
their apparatus act as a third party for the international ES users/buyers (Engel et al.,
2008; Schomers & Matzdorf, 2013), wherein the ES buyers often also match their
funding for reasons other than the intended outcomes of reducing carbon emissions,
such as improving energy access and/or forest conservation. These institutional
arrangements allow local governments to continue their control over resources, and the
international users to access the ES. The central theme of this supply chain is not that
the user pays, but that the government provider gets to its objectives on the supply-side
(Cranford, 2014; Cranford & Mourato, 2014). However, these conditions for payments
do not normally lead to the payments being equal to the marginal net benefits to achieve
an efficient outcome. The use of environmental pricing and standards procedures,
especially the use of production costs, can lead to sub-optimal allocation of resources
48 There are usually many principal-agent layers between the supplier and buyer of offsets.
48
(Baumol & Oates, 1971; Schomers & Matzdorf, 2013; Van Hecken & Bastiaensen,
2010).
Therefore, PES in theory is closer in spirit to Coase’s critique of Pigou, in which Coase
argues that socially suboptimal situations such as too little environmental services can
be resolved through voluntary market-like transactions, provided that transactions costs
are low and property rights are clear (Ellerman et al., 2016; Pattanayak, Wunder, &
Ferraro, 2010). However, many PES implementations suffer from inadequate tenure and
property rights and high transaction costs (van Kooten, 2017), especially due to
bundling of small services and high costs of measurement, reporting and verification.
Therefore, the actual PES implementation in many developing countries continues to be
within the jurisdictions of the governments, as the property rights are not always clear,
especially with the forestry-based projects, and the commodification of the goods and
maintenance of the environmental integrity are costly. There are nevertheless a few
Coasean PESs operating at the local level. This is because there are ES users/buyers and
providers/sellers trading under clear property rights and low transaction costs49. The
issue with government involvement is that the ES buyers do not always pay for the ES
and the beneficiaries do not always get paid for the ES, which restricts the direct market
linkage.
The push towards the Coasean construct is to move away from the traditional provision
of “providing price supports via subsidies” to make “payments for services at market
rates”, and especially from deficit plagued, subsidised operations that are only able to
survive with aid (Angelsen et al., 2017) towards a trade-based system to result in
equitable and sustainable revenues and sustaining the sector itself (Fletcher & Breitling,
2012). This means also shifting the resource control and financing from the state
towards the non-state actors, more principally towards the financing institutions, given
their comparative advantage in issues of financing. This is in line with the
understanding that aid and government support are intended to be temporary measures
to be replaced over time by self-regulating markets in which the government facilitates
to unravel bottlenecks for efficient and equitable exchanges between producers and
49 France’s Vittel water bottling plants make payments to local farmers to maintain the water quality
(Perrot-Maître, 2006), and examples of logging for timber (Cerutti, Lescuyer, Assembe-Mvondo, &
Tacconi, 2010), and use of local water resources to produce electricity from catchment areas
(Balasubramanya, Giordano, Wichelns, & Sherpa, 2014) are some examples.

49
consumers (García-Amado, Pérez, Escutia, García, & Mejía, 2011). Provided that such
offset markets can be designed and sustained, it will improve the market information
resulting in increased transparency of outcomes and objectives (Landell-Mills, 2002).
These conditions therefore make the Coasean concept closer to what economists would
expect as market-based instruments for management of environmental systems (Pirard,
2012), and not a PES-like quasi-markets as existing in many PES schemes. In this
context, the implementation of a Coasean approach can be better streamlined with the
RET-based credits since the property rights on such carbon credits are often better
defined than in forestry projects and transactions costs have been established (Schomers
& Matzdorf, 2013).
3.4.3 Use of carbon revenues and distributional impacts
The incentives form the crux of all PES schemes despite their variation in definitions
and implementation (Pirard, 2012). While incentives can be used and/or distributed at
various levels (Pascual, Muradian, Rodríguez, & Duraiappah, 2010), and are related to
the sectors in which the revenues are earned, the PES literature has largely focused on
the revenues in relation to the forestry sector. Because of the common property nature
of forestry, revenues are often pooled and used for services and facilities that are
required by the community, such as access roads, school buildings, and community
health centres (Campese, 2012; J. Lee, Ingalls, Erickson, & Wollenberg, 2016;
McDermott & Schreckenberg, 2009). Such amenities represent basic infrastructure
required for livelihood enhancement in the developing countries (Tacconi, Mahanty, &
Suich, 2013). Many such community groups have also started to establish microcredit
(Ahmad & Rahman, 2017; Centre for Microfinance, 2013; Kumari, Kaushal, Sharma, &
Guleria, 2016). In the group-based revenue management, there is a common tendency
towards elite capture, resulting in a small group of villagers, typically those on the
management committee or other local leaders, capturing and retaining benefits to the
detriment of others (Bijaya et al., 2016; Blomley, Maharjan, & Meshack, 2009). Poorer
households would be increasingly priced out despite their contribution. And, also given
the level of awareness, education and governance, most often the methods of revenue
use are fraught with risks in terms of restricted participation, transparency and
accountability (Cerutti, Lescuyer, Assembe-Mvondo, & Tacconi, 2010). Further, this
condition does not seem to differ with the source of revenues, either self-generated or as
incentives from PES schemes, and is not expected to change drastically with the
expected wider international transfers through REDD+ or other bilateral mechanisms.

50
Experience suggests that fair distribution of revenue is difficult in common property
regimes (Corbera, Brown, & Adger, 2007). Most often the revenue is managed by non-
financial entities, which restricts the most efficient use of these resources, in terms of
innovation (Brown & Corbera, 2003). Further, such group management often precludes
the individual rights to the revenue sources in the interest of the community. Nuanced
studies show that egalitarian distribution of the revenues can reduce income inequalities
(García-Amado et al., 2011). However, the process does not significantly improve the
condition of the poorest of the poor, excluded from decision making because of their
traditional exclusion from land rights, a situation common to many developing countries
(Pascual et al., 2010). Against this backdrop, analysis of PES with REDD+ shows that
the schemes that closely align payments with opportunity cost are preferable for cost
effectiveness, but are not necessarily more equitable (Börner et al., 2010; Luintel,
Bluffstone, Scheller, & Adhikari, 2017). Further, Engel et al. (2008) found that
government-financed PESs are much less targeted than the user financed ones, and that
existing social, institutional and political contexts shape the normative constructs of
distribution and fairness (García-Amado et al., 2011). Further, findings suggest that the
extractive nature of institutions in developing countries (Acemoglu & Robinson, 2012)
results in exclusionary and inequitable access, affecting the distribution of revenues.
The literature lacks cross-sectional micro-level references to the use of carbon revenues
earned from off-grid RETs, despite a multiplicity of projects registered with the CDM,
and under voluntary standards. An analysis of the off-grid RET projects registered with
the CDM suggested an institutional mechanism similar to existing PES-like structures,
where the governments and NGOs as proponents provide subsidies and secure property
rights on carbon credits (J. Lee et al., 2016). They then transfer the credits to those
buyers. In this context, distribution of benefits could be more straightforward since the
individual rights are well defined compared to forestry-based PESs, where collective
contribution to environmental services management is contested and can result in
marginalisation of the poorer people. Despite this potential, in Nepal and other LDCs,
the government rarely distributes the revenues to providers of the offsets (United
Nations Framework Convention on Climate Change, 2018). Therefore, while the
inherent constructs of RETs could be beneficial in correcting distributional issues in
existing PES schemes, especially through RETs such as ICS and biogas, which enable
the maintenance of forest stocks and facilitate the provision of ESs, this rarely occurs in
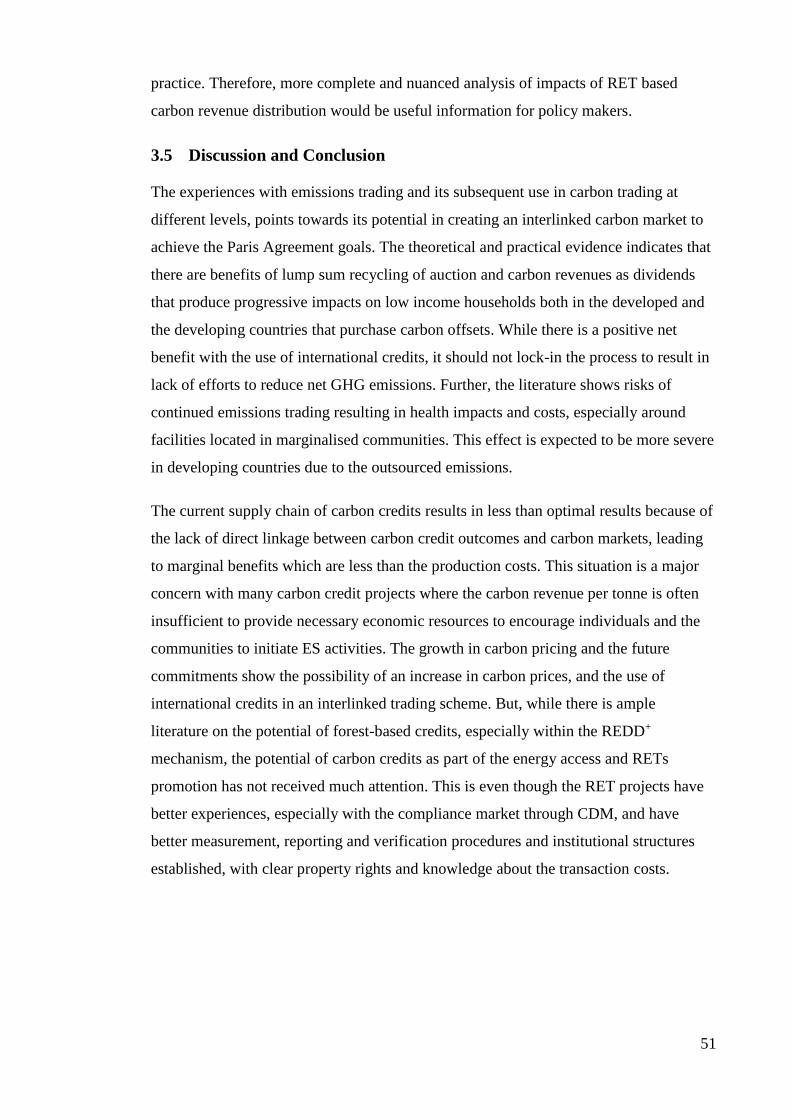
51
practice. Therefore, more complete and nuanced analysis of impacts of RET based
carbon revenue distribution would be useful information for policy makers.
3.5 Discussion and Conclusion
The experiences with emissions trading and its subsequent use in carbon trading at
different levels, points towards its potential in creating an interlinked carbon market to
achieve the Paris Agreement goals. The theoretical and practical evidence indicates that
there are benefits of lump sum recycling of auction and carbon revenues as dividends
that produce progressive impacts on low income households both in the developed and
the developing countries that purchase carbon offsets. While there is a positive net
benefit with the use of international credits, it should not lock-in the process to result in
lack of efforts to reduce net GHG emissions. Further, the literature shows risks of
continued emissions trading resulting in health impacts and costs, especially around
facilities located in marginalised communities. This effect is expected to be more severe
in developing countries due to the outsourced emissions.
The current supply chain of carbon credits results in less than optimal results because of
the lack of direct linkage between carbon credit outcomes and carbon markets, leading
to marginal benefits which are less than the production costs. This situation is a major
concern with many carbon credit projects where the carbon revenue per tonne is often
insufficient to provide necessary economic resources to encourage individuals and the
communities to initiate ES activities. The growth in carbon pricing and the future
commitments show the possibility of an increase in carbon prices, and the use of
international credits in an interlinked trading scheme. But, while there is ample
literature on the potential of forest-based credits, especially within the REDD+
mechanism, the potential of carbon credits as part of the energy access and RETs
promotion has not received much attention. This is even though the RET projects have
better experiences, especially with the compliance market through CDM, and have
better measurement, reporting and verification procedures and institutional structures
established, with clear property rights and knowledge about the transaction costs.

52
Chapter 4 Renewable Energy and Energy Access Financing
This chapter describes the financing situation for RE and how financing links to energy
access, and highlights the implications of RE subsidies in relation to mitigation
outcomes and research and development of RETs. The chapter also highlights the
impact of behavioural and structural issues with RE investments. Most importantly, the
chapter describes the current financing practices such as subsidy, micro-credit, and
pay-as-you-go models in the developing countries, and discusses their potential and
limitations in Nepal. This material forms a basis for developing both the survey
questions that support the CV and CE models of biogas demand, and the qualitative
analysis of financial institutions.
4.1 Climate and Renewable Energy Policies
RETs have a long tradition in many developed and developing countries, where
governments have used various policies such as direct subsidies, feed-in-tariffs (FiT)
and/or public research and development spending to increase the share of RE
(Alternative Energy Promotion Centre, 2015; Kalkuhl, Edenhofer, & Lessmann, 2013;
Karki, 1978). The first government-led policies for RE development were initiated in
the 1970s because of the economic and energy security concerns of the oil crisis.
Moreover, RE developments in developing countries were the first initiatives to address
energy and poverty linkages (Goldemberg, Johansson, Reddy, & Williams, 1987). In
this continuum, RETs received added emphasis after the Rio Earth Summit in 1992,
where RETs were formally recognised as valid mitigation options.
From a policy perspective, it should be possible to define an optimum carbon cap that
would result in the required mitigation, especially when the technologies are well
placed. However, the political economy of the energy sector, which is dominated by
centralised production and conventional utilities, makes it difficult for the textbook-like
application of the emissions trading regime. Therefore, complementary policy
objectives for RE can be justified and include energy security and overcoming energy
poverty, despite mitigation being the overarching objective, (Koseoglu, van den Bergh,
& Lacerda, 2013). Further, in the present context, additional RE policies are also
justified because the carbon pricing mechanisms also do not cover economy-wide
emissions. Therefore, certain excluded sectors can benefit from the additional RE
policies (Kalkuhl, Edenhofer, & Lessmann, 2012). However, in hindsight, it has now
become evident that there was no way around carbon pricing to tackle global climate

53
change, despite earlier initiatives and use of RETs and energy efficiency50(Kalkuhl et
al., 2013).
A limitation with RE subsidy policies in individual countries like Nepal is that they do
not result in net emission reductions beyond a given cap. Adding a mitigation
instrument to the carbon pricing instruments violates the equi-marginal principle, and
this increases the efficiency costs for a given cap, as these additional policies promote
costlier options (Branger, Lecuyer, & Quirion, 2015)51. While the need for
complementary policies to combat global warming efficiently is debated, Kalkuhl et al.
(2012) and Edenhofer et al. (2013) theoretically show that RE subsidies as a substitute
for optimal carbon pricing can be an extremely expensive option. Kalkuhl et al. (2012)
show how there are higher mitigation cost due to the supply response of fossil resource
owners, thereby resulting in a downward spiral of energy prices, known as the green
paradox. Simple modelling results also show that the RE subsidy policies without direct
emissions policies could lead to the unexpected outcomes of reduced fuel prices and
increased GHG emissions (Duncan, 2007), because a lower eventual price for RE with
subsidies could accelerate the consumption of fossil fuels52. Studies suggest that the
subsidy-only policy is twice as expensive as pricing instruments, and mitigation costs
increase by a multiple if carbon prices are not used (Edenhofer et al., 2013).
RE subsidies are therefore essentially limited and risky mitigation substitutes for
optimal carbon prices in the long-run. Therefore, although optimal carbon prices are
difficult and challenging to implement, use of subsidies is also not a desirable long-term
solution. RE incentives should be designed alongside long-term carbon pricing wherein
subsidies should be used as temporary measures to ease market entry of specific
technologies and distributional conflicts at reasonable additional costs (Kalkuhl et al.,
2013; Koseoglu et al., 2013). From a normative perspective, carbon pricing is
indispensable for achieving realistic mitigation outcome, and should be accompanied by
50 Within climate change policies, carbon pricing, results based finance, and offset mechanisms are the
explicit mitigation measures and removal of fossil fuel subsidies, energy taxation, RE and energy
efficiency subsidies are the implicit measures. 51 In Germany, such policies resulted in oversupply of credits thus significantly lowering credit prices by
as much as 15% relative to the situation without additional policies (Koseoglu et al., 2013). 52 The result is similar with only a tax on fuel consumption because if the energy markets anticipate a
future tax on fossil fuel production, producers will accelerate current production, current prices will drop
and GHG emissions will accelerate (Duncan, 2007).

54
temporary policy instruments to address the specific externalities of RE and the energy
sector.
4.2 Innovation, Research and Development in RE
Globally, the energy sector is the major contributor to total emissions, contributing 80%
of emissions, and the forestry and agriculture sectors contribute another 10-15%. In this
situation, major innovations in policy and technology in the RE sector, possibly
interlinked with the forestry and agriculture sectors are needed. Biogas plants in the
developing countries are one example of such inter-linkages between energy,
agriculture and forestry sectors. However, despite maturity in many other technologies
(Edenhofer et al., 2013), further investment in RE research and development (R&D) is
required. Figure 4-1 shows the technology innovation cycle and corresponding role of
government and financial interventions.
Figure 4-1: Technology Innovation and Market Expansion53
Note: Adapted from Wüstenhagen and Menichetti (2012), FFF = Friends, Families and
Fools
53 This concept of technology development and marketing is based on the principle of a pure public and
private partnership with the most common division of responsibility where the public partner sets service
standards (often including determining who receives the service, and at what level or price) and monitors
performance, whereas the private partner raises capital/investments and assumes responsibility for
building and operating (Sovacool, 2013a).

55
It shows that the initial Technology Push is where government policy and grant support
are important (Rolffs, Ockwell, & Byrne, 2015) to create a protective space for the
technology to grow, especially for R&D, to develop technologies to be ultimately taken
up by the market (Hall, Foxon, & Bolton, 2017; Wüstenhagen & Menichetti, 2012).
This manner of technology push has happened for RETs in many applications related to
electricity and transportation, including also for decentralised energy access
technologies such as household biogas plants. Many standard energy access technology
packages, available both for cooking and other electricity services, have crossed the
“first generation barriers” and reached the point of market-level commercialisation
(Bhattacharyya, 2013)54. In this context, Market Pull then should ideally involve a mix
of public markets and private funds to enable full market commercialisation, with
minimum government interventions. This investment pattern is required because of
limited substitution potential between investment options throughout the innovation
cycle (Hall et al., 2017; Koseoglu et al., 2013). However, in many developing countries,
because of a lack of alternative financing instruments such as venture, and equity
capital, governments and donors have provided major funding across the innovation
cycle. This is also because in many developing countries, especially low income
countries like Nepal, functioning innovation systems do not exist (Gollwitzer et al.,
2017).
The efficiency of the investment mix would improve if government funds were directed
to those aspects of RET development that are most subject to market failure, where
private firms find it difficult to appropriate returns on investment55. This should be
complemented with support towards enhancing commercial financing to realise the
expected market pull. In this context, Kalkuhl et al. (2012) suggest that any government
funding could support technology push and innovation in contender superior
technologies due to the propensity of many first generation technologies to be locked-in
(Kalkuhl et al., 2012). For example, uptake of subsidised solar PVs increased rapidly
despite modest technological efficiency compared to other renewables in many
developing countries such as Nepal. In such cases, deliberately subsidising optimal
54 Early R&D activities in the developing countries resulted in the development of many mature
technologies such as rural biogas in China (Song et al., 2014), micro-hydro in Nepal (Cromwell, 1992),
and hybrid mini grids in Africa (Yamegueu, Azoumah, Py, & Zongo, 2011). 55 In this context, some economists believe that, under a right carbon pricing conditions, existing
instruments like patent rights combined with R&D subsidies are sufficient to foster
innovations(Acemoglu, Aghion, Bursztyn, & Hemous, 2012).

56
technologies via R&D measures (Frondel, Ritter, Schmidt, & Vance, 2010), prior to
market grade commercialisation, could have improved overall efficiency. This refers not
just to investment in specific technologies, but to improved processes as well. For Nepal
and many developing countries, this argument is particularly true for infrastructure such
as applied R&D, secure and ethical data management, technology demonstration, and
training of scientists and engineers, which are underprovided by market incentives.
Lastly, the effect of market competition is found to be positive for innovation in new
technological domains, such as RE, especially with respect to second-order innovation
such as that which occurs with market expansion. In particular, the combination of
carbon and RE policies together with market deregulation is considered to be most
effective for inducing innovation, particularly near the technological frontier (Nesta,
Vona, & Nicolli, 2014). Market liberalisation is necessary to also deal with technology
and institutional lock-in, as the energy technologies are particularly path dependent, so
that new players can come in and enhance the competition. Liberalisation favours the
entry of non-incumbents, farmers, small communities, municipalities and
environmentally conscious households into the energy business. This is important in the
case of LDCs, including Nepal, where public energy utilities and their institutional
practices tend to stifle such diversification.
4.3 Renewable Energy Financing and Investment
4.3.1 Introduction
In both the developed and developing countries, there is a transition towards clean
energy technologies (United Nations, 2015). This transition is similar, if not broader, to
previous energy transitions such as from wood/water power to coal in the 19th century,
and from coal to oil in the 20th century. Such major historical energy transitions are
associated with broad social change, such as industrialisation, and consumers’
purchasing decisions are an important driver of this change. Thus the literature suggests
that it is important to understand the drivers of consumers’ choice and investment
decisions (Wüstenhagen & Menichetti, 2012). However, surprisingly contemporary
work on low carbon energy transitions has paid limited attention to questions of
consumer choices with respect to financing options (Hall et al., 2017). This is especially
concerning in the case of RETs for which a lack of investments has continued to be a
major barrier for widespread diffusion (Glemarec, 2012; Mainali & Silveira, 2011),
despite lower energy costs and potential social and environmental co-benefits

57
(Glemarec, 2012). RETs suffer from this lack of investment (Hall et al., 2017;
Sustainable Energy for All, 2017b) because of high upfront costs56.
RETs also suffer from other costs which are more perceived and indirect, than real
(Sawin & Flavin, 2006). These costs associated with distortions resulting from unequal
tax burdens, existing fossil fuel subsidies, and the failure to internalise co-benefits of
RE, often have affected the adoption of RETs. In many developing countries including
Nepal, utilities maintain monopoly rights to produce, transmit and/or distribute
electricity, and lack of standards for inter-connection discourage RE projects. At the
same time, a lack of infrastructure for the transportation and optimum use of energy
produced in remote rural areas of Nepal render RETs commercially infeasible (Thapa,
2003). RETs have to compete within a financial and regulatory system that have
evolved to promote use of conventional fuels, and other incumbent energy systems, and
this system often discriminates against the financial inclusion of RETs. Moreover, there
is no substitute for sustainable commercial financing and investments (United Nations
Environment Program, 2015, 2016), that would promote further technological
development, learning and economies of scale, while continuously correcting RE
market externalities (Sawin & Flavin, 2006).
4.3.2 Market subsidy mechanisms
RE subsidies can be an efficient financing instrument to address the high upfront costs
and associated RET market failures (Edenhofer et al., 2013). Table 4-1 shows the major
categories of subsidies available for supporting RET adoption (Eberhard, Imran, Meier,
Siyambalapitiya, & Vagliasindi, 2014). However, the literature shows that subsidies
should be considered circumspectly (Baumol & Wolff, 1981; Koseoglu et al., 2013).
Inter-temporal general equilibrium modelling of the interactions between technology
type and policy stimuli suggests that lump-sum direct subsidies that are only available
for a limited time, achieve the social optimum (Kalkuhl et al., 2012). Such subsidies are
initially high to encourage the early deployment of RETs, and after an initial activation
phase, when the energy generation shifts from niche to large-scale dissemination, the
subsidy then should be reduced because of diminishing learning effects with increased
cumulative output. However, the study suggests that a deviation from the optimal direct
subsidy of as little as 1% may render the subsidy ineffective in preventing a
56 While the investments have continuously increased and surpassed investments in fossil fuel, both in the
developed and developing countries, the investment are not on track to meet the SE4All objectives.

58
technologies lock-in. Further, a levelised cost of electricity study carried out by Mainali
and Silveira (2013) in Nepal and Afghanistan showed that the cost of electricity from
different technologies tends to converge at higher subsidies, reducing the importance of
market and technology advantages. Further, in many developing countries including
Nepal, governments also provide indirect subsidies in the form of waivers on import
duties and taxes, which helps to reduce the cost of technologies, by as much as 50%
(Lemaire, 2009). Such waivers also support vendors and suppliers during currency
devaluations which affect costs, since technologies and raw materials are mostly
imported (Lemaire, 2009; Sovacool, 2013b). While such waivers support energy access,
the technology-specific nature of such policies adds to the welfare losses due to rent-
seeking, information asymmetry and transactions costs, on top of the direct subsidy
policies. Therefore, such subsidies in developing countries must be gradually phased out
since existing technologies such as biogas digesters no longer exhibit learning-by-doing
and spill-over effects (Glemarec, 2012; Hall et al., 2017; Sustainable Energy for All,
2017b). Even though this is well known prior to support and development of
technology, for political reasons high government subsidies continue to support market
expansion for many mature technologies in developing countries (Bridge, Bouzarovski,
Bradshaw, & Eyre, 2013; Dhital et al., 2016; Koseoglu et al., 2013). Such excess
expansion of subsidies results in critical welfare losses.
Direct Support
Cash support is provided directly to investment in RETs, as a contribution to
capital cost, with finance derives from different sources by governments,
used extensively in developing countries.
Price Incentives
Governments determines preferential output prices, with the result that the
market determines the quantity provided or to be provided at the incentive
price – though in some cases a cap is provided on quantity, e.g. FiT
Quantity Incentives
Government determines a quota for the quantity of energy service/solutions
to be provided/generated, with the result that the market determines the
price, e.g. Renewable Portfolio Standard, Green Certificates
Indirect Support Support is provided through tax rebates and waivers, incentives, low-cost
loans, marginal carbon financing.
Note: Adapted from (Eberhard et al., 2014)
The various categories of subsidies are applied in different ways. The literature shows
that price incentives such as FiTs and quantity incentives such as Renewable Portfolio
Table 4-1: Category of Subsidies for RE

59
Standards (RPOs) mostly occur in developed countries (REN21 Renewable Energy
Policy Network, 2010). These systems incur small welfare losses compared to direct
subsidies, and are fairly robust to small perturbations from optimal policies (Menanteau,
Finon, & Lamy, 2003). FiT is the most prevalent mechanism, and is principally a
results-based mechanism where households are incentivised for adding electricity into
grids with secure floor prices over a longer period57. FiT has been responsible for most
additions of renewable electricity, and has resulted in cost reduction through technology
advancement and economies of scale. Therefore, initially higher costs associated with
FiT are justified claiming it helps to create new pathways, away from the utility-driven
existing pathways and carbon lock-in (Wüstenhagen & Menichetti, 2012). Pricing
system, especially FiT have produced increased reliability of prices in energy markets,
which in turn has increased investment from banks and financial institutions (Sawin &
Flavin, 2006). While pricing can be applied both to utilities and decentralised entities,
the quota system is primarily useful for utilities (Sawin & Flavin, 2006), and despite
economic modelling predicting that quantity mechanisms are an effective approach for
minimising cost, such mechanisms have seldom been implemented. Pricing mechanisms
with FiT can be more easily integrated in the existing payment systems such as through
tax or electricity bills. While under perfect market conditions, both systems would result
in similar outputs, in less than perfect markets their implementation would be impacted
by the structure of existing institutions and other contextual factors (Menanteau et al.,
2003; Wüstenhagen & Menichetti, 2012). FiTs and RPOs have wider application in
countries where grid codes and standards are well developed, and where the energy
market is deregulated, and where RETs have been included within mainstream
investment portfolios (Jacobsson et al., 2009)58. These conditions are not usually
available in many developing countries, and therefore direct subsidies and indirect
support such as tax waivers have been the norms for promoting RETs (Rolffs et al.,
2015). Even though funding is limited, direct subsidies have been used in Nepal.
57 In Germany, as of July 2014, FiTs range from 4.4 ¢/kWh for hydropower facilities over 50 MW to 17.3
¢/kWh for solar installations on buildings up to 30 kW and 25.5 ¢/kWh for offshore wind. The tariffs are
lowered every year to encourage more efficient production of renewable energy. Until July 2014, the
regular reductions were 1.5% per year for electricity from onshore wind and 1% per month for electricity
from photovoltaics. 58 Also, in many middle-income countries such as Ghana and Mexico with sound technical conditions and
standards.

60
4.3.3 Behavioural and structural context
The various subsidy mechanisms used for supporting RETs adoption have not been able
to generate the hoped for trend of commercial investments in the various output
domains of energy security, energy poverty, and climate change mitigation. Therefore,
innovative and diverse financial instruments are considered critical to realise the clean
energy transition (Owens, 2018). Financial innovations are required not only in the
global climate change context to encourage funds flow, but also in the localised context
of carbon credits trading, energy service payments, adaptation benefits of RETs, and
local energy and financial markets. The literature suggests that such innovations have to
be also able to overcome the behavioural and structural effects associated with RET
investments (Glemarec, 2012; Hall et al., 2017; Komendantova, Patt, Barras, &
Battaglini, 2012; Wüstenhagen & Menichetti, 2012).
Research suggests that consumers’ and investors’ a priori beliefs and attitudes, and their
current practices can affect the likelihood of investment in RETs (Gollwitzer et al.,
2017; Kumar, 2018; Masini & Menichetti, 2012; Rolffs et al., 2015). Cognitive biases
such as status quo bias can cause consumers to make an emotional preference for the
current energy consumption such as continuing with the firewood consumption, to
avoid risks and uncertainties with the new RETs, especially because of the higher cost
of RETs. This can be more prevalent in the developing countries where household
income levels are low and accurate market information on the new technologies is not
always available. Therefore, in many such cases, consumers will have to make decisions
based on heuristics which can lead to continuing path dependencies. Further, since
many existing energy practices have an incumbent advantage, it is not sufficient to
create only a level playing field for the choice of technology, but to go beyond, since
investors are reluctant to make strategic choices to give up their existing patterns of
investments. Cognitive biases can be reduced by investing in education and training for
decision makers59, and disseminating metrics of co-benefits of RE investments viz.
health and environmental benefits. For example, information dissemination about higher
biogas production with toilet connection could reduce the cultural biases of some
communities in South Asia against connecting biogas with household toilet facilities.
59 Such trainings can take various forms such as the customised training for an investment manager or
during financial literacy trainings of a micro-credit program.

61
Further, dissemination of timely and truthful information can enhance project viabilities
by reducing transaction costs (Gujba, Thorne, Mulugetta, Rai, & Sokona, 2012).
Most of the literature on RE policy design, strategy and regulation revolve around neo-
classical assumption of efficient markets with respect to technology and finance (Rolffs,
Byrne, & Ockwell, 2014; Rolffs et al., 2015) with limited consideration of behavioural
and structural constraints, especially those found in low income developing countries
(Hall et al., 2017; Hall, Roelich, Davis, & Holstenkamp, 2018). Therefore, nuanced
analysis of consumers’ and investors’ attitudes and preferences, risk perceptions and
cognitive biases would be useful addition to literature. Similarly, heuristics and intuitive
decision making to improve understanding of whether and how consumer behaviour
with respect to RETs adoption deviates from the economic predictions in developing
countries also makes cases for such nuanced analysis (Wüstenhagen & Menichetti,
2012). Such analysis should try to complement the traditional neo-classical market
instruments of price and quantity measures of energy and emission targets. In LDCs like
Nepal with potential of carbon trade, analysis of the adoption of the RETs with respect
to the potential of earning carbon revenues against the direct subsidies as proposed by
this study addresses such aspects of complementary analysis.
4.4 Financing Energy Access in Developing Countries
4.4.1 Introduction
The global tracking of investments to achieve energy access shows a shortfall from the
required investments, estimated at an annual investment of US $50 billion, including
US $45 billion for electricity access, and US $5 billion for clean cooking
access60(Bazilian et al., 2011; Bhattacharyya, 2013; Glemarec, 2012; World Bank,
2018b)61. Recent reports by SE4All shows that finance available for electricity and
clean cooking is not on track to deliver universal energy access by 2030 (Sustainable
Energy for All, 2017b). This report indicates that financial commitments for electricity
60 The investment at this level for energy access is considered to be required to limit the global
temperature rise to 2°C (Rogelj, McCollum, & Riahi, 2013). 61 Bazilian et al. (2011)estimated a need of US $70 billion per year until 2030 for the universal energy
access, and an estimate of around US $11 billion per year only for the LDCs. He expects it to increase
significantly, with increase in consumption at higher tiers, beyond the current binary measures of energy
access. (Hall et al., 2018) states that US $61 trillion of power systems investment is required to meet the
Paris Agreement.

62
access averaged about US $19.4 billion a year62. Further, out of the total investment,
only 1% of the finance tracked actually was invested in decentralized RETs. Financial
commitments for clean cooking solutions reveal a much greater challenge – averaging
just US $32 million a year, a fraction of the US $5 billion annual investment needed
(Sustainable Energy for All, 2017a).
The problematic trend in financial commitments to clean cooking solutions highlight the
need for a paradigm shift in global approaches to achieving clean cooking targets, where
technologies such as biogas plants make up an important technology due to its
appropriateness in the rural areas (Bhattacharyya, 2013; P. S. C. Rao, Miller, Wang, &
Byrne, 2009; Sustainable Energy for All, 2017b). This trend of insufficient investment
as mentioned is also a reflection of current status quo of inequitable distribution of
resources and revenues where the current investments from the governments and
external multilateral and bilateral agencies are largely focused on power generation
(Bhattacharyya, 2013), and do not serve the goal of producing total energy access in the
developing and least developed countries, especially in rural areas (Bazilian et al., 2011;
Bhattacharyya, 2013; P. S. C. Rao et al., 2009; Rehman et al., 2012). Given the current
investment pattern, an eco-system of innovations in various elements beyond
technology and finance is required (Chaurey, Krithika, Palit, Rakesh, & Sovacool,
2012; Rolffs et al., 2015).
4.4.2 Subsidy financing
There are various financing models available across the energy access landscape.
Energy access financing is generally involves a mix of subsidy, equity and debt
financing (Sovacool, 2013a). While the proportion of debt and equity contribution
varies with investment scale and access to finance, the government subsidy is a
common denominator in most cases, both for on-grid and off-grid applications. While
direct subsidies are relevant for many off-grid applications, such subsidies are also often
combined with additional instruments such as FiT63 (Sovacool, 2013b), to increase the
viability in on-grid applications.
62 80% of those without electricity access globally live in 20 countries and 84% of those without clean
cooking access are living in another, largely overlapping, set of 20 countries. Most of these countries are
in Sub-Saharan Africa and Asia. 63 The Cinta Maker Mini-Hydro project in Indonesia received power purchase assurance with 4.5
cents/kWh as well as loan, grant and equity investment. These various combinations may be necessary
since the production costs are higher for micro and mini-hydro.

63
While there are theoretical issues with the use of subsidies discussed earlier, there are
also practical issues of donor fatigue and limited government funding, which have made
subsidy-driven programs unsustainable in many developing countries (Sovacool, 2017;
Zerriffi, 2011). Insufficient government funding combined with procedural delays
associated with the government subsidies has limited timely market expansion
(Lemaire, 2009, 2011; Mainali & Silveira, 2011; Mittal, Ahlgren, & Shukla, 2018;
Rehman et al., 2012)64. This has resulted in only marginal growth in access, as well as,
diminishing the sustainability of energy access technologies (Ellegård, Arvidson,
Nordström, Kalumiana, & Mwanza, 2004). For example, donor and government funded
subsidies have resulted in crowding out of established commercial systems such as for
pay-as-you-go (PAYG) solar schemes in Myanmar, and substantially affected sales of
well-established micro credit programs for solar such as in Bangladesh (Buen, 2018).
In many developing countries, the subsidy required for energy access is funded by
official development assistance matched with funding from national as well as local
governments65 (Chaurey et al., 2012; Gujba et al., 2012; Rolffs et al., 2015; Sovacool,
2013a; Zerriffi, 2011). Therefore, direct market subsidies continue to exist with
financial support from governments, as well as bilateral aid and multilateral financial
assistance66. External financing support is provided in multiple ways but increasingly
results/performance-based financing is used, especially given the need for equitable
access67(Mohideen, 2018). Subsidy payments based on the number of systems installed
such as biogas digesters68 is an example of such results-based financing (Hussain &
Etienne, 2012). Despite variations in financing options, the trend in subsidy investment
show that such funding has predominantly involved financing mini-grids and electricity
access, leading to inequitable access for clean cooking solutions such as biogas
64 In South Africa, in 2006, the cost of a SHS was US $550 compared to the cost of connecting grid at
more than US $1,000. But, the governmental subsidy is substantial at US $350, and therefore there is a
larger demand and waiting list of customers for the SHS connection. 65 Subsidies such as by the local municipalities to pay the monthly bill on top of the up-front national
government subsidy in South Africa has resulted in distortions in relation to those clients who have not
received such from their municipality, leading to arrears by 20% of clients (Lemaire, 2011). 66 While public private partnership is a welcome concept, its actual implementation under multiple
partnership framework such as promoted in (Sovacool, 2013a) is difficult, due to multiple decision
makers at various levels. 67 The key difference from traditional (upfront, non-performance related) support is that with results-
based financing, payments are made only after the service provider has delivered an adequate level of
performance. The performance is normally (independently) verified before the payments are made. This
means that the performance risk is transferred from the subsidy provider to the service provider. 68 Global partnership on output based aid (GPOBA) subsidy support for biogas installations in Nepal.

64
(Bhattacharyya, 2013; Rehman et al., 2012; Zerriffi, 2011), with resulting consequences
for women and children (P. S. C. Rao et al., 2009).
Lastly, the literature suggests that little finance from carbon revenues has actually
flowed to the energy access projects in the developing countries, against initial
expectations (Bhattacharyya, 2013). Out of the nearly US $27 billion of carbon revenue
that flowed to emission reduction projects during the first Kyoto commitment period
(Gujba et al., 2012), most was concentrated in the emerging economies of India, China,
and Brazil for projects that were largely industrial, such as cement and manufacturing
(Bhattacharyya, 2013; Glemarec, 2012; Pode, 2013), and only around 10% of the
projects69 were energy access projects originating from the low income developing
countries. Moreover, even these small carbon revenues flowing to energy access
projects, tend in the longer-term to get locked into inefficient subsidies, and not be used
as additional source of finance for projects that enable energy access, generate
reductions in emissions and eventually return the funds.
4.4.3 Debt and equity financing
Besides subsidies, various financing instruments are used to promote energy access,
specifically a mix of debt and equity investments (Gujba et al., 2012). Fee-for-service,
PAYG, micro-credit, revolving funds, and debt from commercial banks are the mostly
widely used financing models. The choice of the most suitable model to provide upfront
finance depends on the maturity of the financial sector and the socio-economic
conditions of the targeted beneficiaries (Glemarec, 2012). In general, the existing end-
user financing can be broadly categorised under 1) asset-based financing, in which the
Energy Service Companies (ESCOs)70 or ESCO-like entities such as communities
cooperatives are more active, and 2) consumer financing, where MFIs and the banks are
relatively more active (Ellegård et al., 2004; Gujba et al., 2012; Lemaire, 2009, 2011;
Mainali & Silveira, 2011; Palit, 2013).
For many ESCOs, financing capital costs is a critical concern as the ESCOs remain the
owners of the systems while providing energy services to customers (Rolffs et al.,
69 However, energy access projects registered from LDCs have increased with the new methodologies
such under the Program of Activities, which reduces the transaction costs for small scale projects. 70 While the ‘‘full service ESCO’’ model has been more common in North America and was developed
over a longer period of time, simpler models may be more appropriate in developing countries, at least
until the market has a chance to evolve (Sarkar & Singh, 2010).

65
2015). While new and innovative enterprises in developed economies can expect to
benefit from equity and venture capital71, many project developers, vendors/suppliers in
the developing countries do not have access to such financing support. Even though
project and/or non-recourse financing is the primary financing option available, such
financing options are also not readily and widely available (Bhattacharyya, 2013),
which limits the availability of project and working capital. Further, the ESCOs find it
difficult to raise the required capital because commercial banks estimate the risk of
financing a new product in an emerging market as being too high. This includes funding
‘green’ markets in developing countries (Rolffs et al., 2014; Rolffs et al., 2015).
There are several established debt and equity financing models in the developing
countries. The literature shows that the interest rates for energy loans in such models are
lower than for regular loans (Newcombe & Ackom, 2017; Sovacool, 2013a)72. In many
schemes, consumer equity is committed through labour contribution such as through the
household labour contribution to dig the ditch for biogas or a communities’ contribution
to dig the canal for micro-hydro plants. Subsidised interest and in-kind equity have been
important in enhancing consumers’ acceptance and approval of products, and building
confidence of the financial institutions and policy makers. The literature shows
repayment rates are generally satisfactory with low default rates, suggesting that small
regular payments can be spread over time, especially with respect to household-level
technologies (P. S. C. Rao et al., 2009; Sovacool, 2013a). The most widely used debt
financing models are the micro-credit and fee-for-service/PAYG models, which are
explained further below.
Micro-credit
Micro credit has played a liberating role in improving the lives of the poor, since the
first introduction of unsecured loans by Grameen Bank four decades ago. Micro-credit73
started as an adaptive model for rural financing in the absence of access to formal
financial services, and when most available services were onerous and/or informal
71 Such as the Renewable Energy Venture Capital Fund in Australia which has a total fund capacity of
AU $ 60 million (Byrnes, Brown, Foster, & Wagner, 2013). 72 Interest rate for solar home systems in Sri Lanka and for biogas digesters in Nepal have lower interest
rate than for other regular products (Centre for Microfinance, 2013; Sovacool, 2013a). 73 Micro-credit is understood differently in different context, but in the context of this study micro-credit
is a micro loan provided to members only based on group guarantees without the need of collateral.
Micro-credit is widely used within the micro-finance space, while other instruments such as micro-
insurance and remittance use has not been widely studied or used in the energy access space.

66
services (Grameen Bank, 2018; P. S. C. Rao et al., 2009). The model has increased
access to finance among low-income and rural populations, and this fits with the
characteristics and need of energy access, especially when complementary elements
such as the supply chain for appropriate technology is well developed (Groh & Taylor,
2015; Pode, 2013). Many non-financial traditional institutions such as forest
associations, women’s associations74, and NGOs are also involved in providing micro-
credit services (P. S. C. Rao et al., 2009), wholly or partly within the energy access
space. Further, over the last two decades, the success of micro-credit has seen its usage
by many commercial banks (Morris, Winiecki, Chowdhary, & Cortiglia, 2007), where
micro-credit has benefitted from banks’ brand names, financial assets, and existing
systems (Isem & Porteous, 2005), and where energy access has provided opportunities
for new asset classes and customer markets for the commercial banks.
A principal reason for using micro-credit facilities is to benefit from the experience of
existing MFIs (Lemaire, 2011), and if possible learn from their secondary debt services
and expose them to larger primary debt for increased service provision. This is
especially true where the government has established financial regulations for banks and
financial institutions to enhance micro-credit, such that the emphasis on rural access to
finance creates opportunities for renewable energy access to flourish (Nepal Rastra
Bank, 2018b). A multitude of MFIs, both formal and informal, are involved in
dispensing micro-credit in the energy access space, mostly for the household
technologies. In some instances, the energy portfolio contributes as high as 30% of the
MFIs’ portfolio. MFIs focus on expanding financial outreach to the poor that gives them
a comprehensive knowledge of low income consumers who typically have limited
access to traditional banking facilities, and the size of the MFI loans are theoretically
appropriate for all but the most expensive of the off-grid technologies.
Micro-credit is currently being used to finance energy access in many developing
countries including Nepal, and includes a wide range of engagement strategies, product
offerings, and service delivery models. The concentration of micro-credit use for energy
access is the highest in Asia, because of its widespread penetration and earlier adoption
in Asia, especially in Bangladesh (Groh & Taylor, 2015; Lemaire, 2011; Morris et al.,
74 A small group of poor self-employed women residing in Ahmedabad, India, who were members of the
Self Employed Women's Association (SEWA), a trade union of unorganised women workers, realised a
need for promoting their own financial institution (Datta, 2003).

67
2007; Urmee & Harries, 2009). While there are many micro-credit applications, scaled-
up and financially sustainable energy lending programmes based on traditional
microfinance are scarce, with the exception of Bangladesh and Nepal (Groh & Taylor,
2015).
A typically successful form of micro-credit involves partnerships between functioning
MFIs with the vendor/s to supply quality products and services, around which the
financing products are developed by the MFIs (P. S. C. Rao et al., 2009). Successful
micro-financing of energy access builds on the comparative advantages of MFIs and the
vendor/s with clear division of labour to mitigate the credit and technological risks.
While this partnership increases the business volume for the vendors, it also opens up
new investment opportunities for the MFIs (Hilman, Gidwani, Morris, Subedi, &
Chowdhary, 2007; Sovacool, 2013a)75, by attracting new clients for financial services,
but most often helping existing clients to access the clean energy services. A major
drawback with the partnership76 (Groh & Taylor, 2015) is that often there is a lack of
(or difficulty in finding) reliable vendors and suppliers to provide products suited to
clients’ needs, trainings, timely installations, and repair and maintenance services in
new markets, both in rural and urban areas (Bhattacharyya, 2013). Failure in these areas
affects the reliability and brand image of the partner MFIs as well as the reputation of
the energy products and services which ultimately impacts the sustainability of energy
access business (Groh & Taylor, 2015; Gujba et al., 2012; Palit, 2013; Sovacool,
2013a). In this context, scholars recommend that the financing and technical
responsibilities may be handled by a single strong institution through a single window
for service provisions (Groh & Taylor, 2015; Newcombe & Ackom, 2017; Pode, 2013;
P. S. C. Rao et al., 2009).
A successful example of such combined energy and micro-credit services is in
Bangladesh, especially in SHSs promotion, where nearly 4.12 million SHSs have been
installed through special partner organisations which act as a one-stop shop from where
the consumers receive micro-credit, together with the technology and after-sales
75 Partnership between the Self Employed Women’s Association (SEWA) Bank and Solar Electricity
Light Company, Ltd. (SELCO) in India and Sarvodaya Economic Enterprise Development Services
Guarantee Ltd. (SEEDS) and 12 vendors in Sri- Lanka are examples of strong partnerships. 76 In the energy access literature, partnerships are referred to as a two-hand model, and where a single
entity provides both the financing and technology services, it is referred to as a one-hand model.

68
services77 (Infrastructure Development Company Limited, 2018; Palit, 2013; Sovacool,
2013a). This model has created a US $200 million market in Bangladesh, and is
considered the largest off-grid market in the world, with the possibility of replication in
other developing countries (Newcombe & Ackom, 2017). However, this model does not
specifically involve MFIs, and the partner organisations are a mix of NGOs, trained to
carry out the installation, financing, repair and maintenance activities.
Many micro-credit based energy access schemes have been successful because of the
tailored government and donor financial support, including technical assistance in
designing loan products, training of MFIs, and lobbying government (Morris et al.,
2007). This is an improvement to the basic applications of micro-credit through self-
help groups, savings and credit groups, and rotating savings and credit associations,
which have lacked the scale and system to realise the required investments to meet the
energy access targets. Bazilian et al. (2011) considers that the 2030 goal of universal
electrification, and especially access to modern cooking solutions, is unachievable
without microfinance78. Such modelling assumes integrated micro-credit and cooking
solutions because many MFIs such as Grameen and SEWA primarily target women,
who are also responsible for household cooking, especially in South Asia (P. S. C. Rao
et al., 2009). The cross-over potential of micro-credit with cooking solutions comes
from around about 2.7 billion people who lack access to basic financial services, and a
similar number who rely on inefficient solid fuels to meet their basic energy need
(Glemarec, 2012; Groh & Taylor, 2015).
However, despite some success and future potential, there are a few inherent challenges
which limit micro-credit promotion. A major issue is that while energy access in general
is required in rural and remote areas, contrarily, MFIs services have focused on
servicing clients in urban and semi-urban areas (Groh & Taylor, 2015). Further, many
MFIs consider energy access credits as consumptive loans and provide them only to
repeat clients who have demonstrated their credit worthiness with a previous
business/enterprise loan. Further, non-members or individuals with inadequate, or
77 There are 56 partner organisations which source the technology from the certified vendors and
suppliers, and also provide energy services such as installation of biogas digesters, thus diversifying
income streams. Grameen Shakti, a subsidiary of Grameen Bank, is a major partner organisation with
56% of the SHS business, and also investing in biogas and improved cook stoves (Newcombe & Ackom,
2017). 78 Based on modelling at the consumer interest rate of 15%.

69
irregular cash flow are not considered eligible, and the interest rates and maturity
periods offered are not always serviceable by the cash flows of the poorer section of
society (Groh & Taylor, 2015). Such practices have led micro-credit to be described as
financial services for the “rich among the poor”, and such prudential practice can limit
scaled-up penetration of energy access loans despite the assumed potential.
Fee for service and pay as you go
Fee-for-service and PAYG models for financing energy access have proliferated in
Africa. This is because there are fewer micro-credit and banking services for rural
communities (Alexander, Shi, & Solomon, 2017; Lemaire, 2011), and also because the
micro-credit interest rates are high, as high as 40% in many cases (Rolffs et al., 2015).
In countries such as South Africa, Namibia, Senegal and Morocco, fee-for-service and
PAYG schemes have been implemented. However, most of these schemes are for the
adoption of SHSs. These models make use of local ESCOs and provide services akin to
vendor financing, rent/lease-to-own, and hire-purchase models implemented for
financial smoothening, where the upfront costs are borne by service providers. The
customers only pay for the energy services, often based on their ongoing and expected
cash flow. Within this model, fixed amounts are collected regularly, either physically or
through Fintech79 services, by service providers to cover the asset costs (Rolffs et al.,
2015), against the financial, technical and after sales service they provide. These service
providers often also secure finance for project implementation, and can be individual
entrepreneurs, communities, utilities and/or partnerships.
These types of energy service provisions allow consumers to pay for energy access
without having to contract with third-party financing institutions such as MFIs and/or
banks. The literature suggests that low income households may be more interested in
fee-for-service and PAYG models, even though they don’t have ownership of the
systems, since this exerts a lower financial burden compared to the ownership models
(Palit, 2013). Nevertheless, current implementation suggest that the poorer households
may not be able to pay for these services (Collings & Munyehirwe, 2016; Moreno &
Bareisaite, 2015). However, these models can be designed and integrated with other
financing techniques, such as reverse auctions and results-based mechanisms, allowing
79 Fintech (an abbreviation for financial technology) is an umbrella term for any kind of technological
innovation used to support or provide financial services.

70
better potential to lower the affordability barriers. In its basic form, fee-for-service and
PAYG schemes differ from vendor financing, rent-to-own, and hire purchase, in that in
the latter case, the system’s ownership is transferred to consumers after agreed
payments are made, whereas in the case of the former, it might not always be the case80.
Fee-for-service and PAYG models can be designed to cover small areas or larger areas.
Small areas provide easier access to customers, facilitating collection of fees and
maintenance. Larger areas are more likely to lead to economies of scale, but pose
administrative and logistic problems requiring better management skills.
The earliest fee-for-service models were implemented by national utilities in developing
countries to enhance electricity services. These examples can be seen in Papua New
Guinea as early as 1980 and in Argentina in the 1990s. Recent examples are the
deployment of SHSs in Bangladesh and Brazil to remote/isolated rural areas81 because
of financial and technical limitations of grid extension (Zerriffi, 2011). However, the
involvement of national utilities has resulted in institutional constraints and
administrative issues because of the centralised nature of utilities and their lack of
commitment to typically marginal projects. Poor access and often limited
communication from major centres, and most importantly, the modest income from fees
from such projects relative to the fundamental overheads has affected incentives to take
care of these systems.
Ownership of such fee-for-service systems by the local utilities82 has reduced some of
the problems (Lemaire, 2009, 2011). The gradual ownership of the entire service
structure, including purchase of equipment by ESCOs has resulted in growth of the
market (Lemaire, 2009). Local residents trained as operators and technicians, have
solved the problem of repair and maintenance compared to other models where such
services were provided externally. There have been some issues with the deliberate
tampering and battery drawdown, false reporting of failures, and occasional theft of the
80 Gham Power, a vendor in Nepal invested in a solar mini-grid together with the community, and is part
of the management for a set period, 20 years, until the project pays back, after which the ownership is
solely transferred to the community. It demonstrates that vendor financing can be implemented with
larger village/community based projects, as well as being used for small household based systems (Gham
Power, 2017). 81 The Rural Electrification Board (REB) in Bangladesh installed 12,000 SHS under World Bank financed
Program from 2003 to 2009. The project benefitted about 80,000 people (Pode, 2013). 82 In Zambia, farmer’s cooperative and private companies dealing with waste management and farm
products act as ESCOs providing 50Wp SHSs under government-financed fee-for-service schemes
(Lemaire, 2009). The transfer of ownership was gradual since initially the procurement of the SHSs was
carried out by the government, and only then it was supplied to the ESCOs.

71
systems. However, these problems have not impacted sustainable operations. The
literature suggests that the attention to conditions of ownerships transfer can reduce
thefts and tampering, and genuine battery drawdowns can be checked with proper
information dissemination (Lemaire, 2011). Such advantage of local ownership can also
be seen in many micro-hydro and mini-grid projects managed by communities and/or
private entities, as ESCOs which provide electricity services also based on regular
payment of service fees (Sovacool, 2013a). However, problems still remain with these
fee-for-service models. These are of the type often associated with the management of
the common property leading to erratic operations, less income due to lack of
productive use, or simply communities’ inability or disinterest to pay the tariffs. This
has resulted in insufficient cash flow to payback investments, and to provide regular
repair and maintenance, often leading to the closing down of the schemes.
The PAYG model is a relatively recent development and can be considered a disruptive,
but natural evolution, a second order
innovation to the basic fee-for-service
model (Alstone, Gershenson, &
Kammen, 2015). The model has evolved
together with the development and
application of smart meter technologies,
and progress in virtual rural mobile
banking services (Alstone et al., 2015;
Rolffs et al., 2014; Rolffs et al., 2015).
Box 4-1 provides an example of a PAYG
facility. While many PAYG schemes
with household-based technologies also
allow for the transfer of ownership, its
novelty is more in the use of
Information Technology (IT) services to manage the energy use and payment
transactions. This novelty is crucial because the use of real-time IT for energy
transactions allows monitoring of actual energy usage and payment patterns of the
customers, and such big data can be useful to understand consumers’ energy
preferences, which is important across the energy access space, especially with respect
to generating confidence in future investments. The literature so far suggests that the
Box 4-1: An Example of a PAYG
scheme
In one example of PAYG within South Africa,
the customer is expected to make a small
upfront financial commitment ~US $10 to
have the system installed at their house. Once
installed, the customer is then expected to pay
weekly, either through scratch cards or mobile
money to access lighting and phone charging,
at the cost of circa US $1.25 per week. If the
customer successfully tops up weekly for 105
weeks the system permanently unlocks. If the
user does not add credit to the system once in
a 4-week period, they are classed as a
defaulter. By defaulting, the user runs the risk
of having the unit reclaimed by the distributor.

72
success of this market is because it is completely privately led, and is often described as
an unsubsidised market (Buen, 2018; Gollwitzer et al., 2017).
PAYG has emerged as the latest energy access Fintech model, and is therefore of
interest to venture capitalists as well as traditional commercial finance seeking to
increase investment portfolios. However, the technology and business model are more
complex and therefore requires a much more developed market strategy, which
increases costs comparatively. The model requires longer-term planning and
relationships with the customers to ensure regular payments and the sustainability of the
scheme. PAYG models are also considered important with respect to increasing the rate
of energy access with a much faster adoption rate which helps to cover the higher costs
(Barrie & Cruickshank, 2017). An important aspect is the potential to improve the
affordability of energy services, especially to low income households (Hall et al., 2018;
Sovacool & Dworkin, 2015). The various PAYG models currently in use allow
customers different levels of flexibility in their purchase of energy based on their cash
flow (Moreno & Bareisaite, 2015; Rolffs et al., 2015)83. While there are no available
comparisons of production costs, the model is expected to reduce the overheads and
transaction costs incurred with traditional fee-for-service and micro-credit models by
curtailing the need of physical control of energy usage and physical movements for cash
collection. The system effectively reduces technology risk by managing and controlling
the issues of late or no payment often related to the lack of adequate after sales, repair
and maintenance services.
An interesting aspect is that the utility construct of PAYG can also reduce the negative
psychological perceptions often associated with taking loans, such as with micro-credit.
Therefore, the flexibility in payment, potential reduction in costs, and faster adoption
provides PAYG models with an increased potential, especially with respect to
provisioning affordable clean energy for the poor. In many cases, the flexibility offered
will support adoption in areas where previously there have been applied models such as
hire-purchase and micro-credit models (Rolffs et al., 2015). So far, PAYG has been
83 Although some PAYG based on micro-grids offer complete flexibility on when and how much
customers can pay, most impose restrictions on the timing and size of payments. Some require customers
to make weekly or monthly payments, and in some cases customers must pay a total amount over a
predetermined period of time. Some PAYG also limit the amount of energy that a customer can purchase
within a particular period (Moreno & Bareisaite, 2015).

73
exclusively used for a small amount of solar energy transactions, but also provides
opportunities for incremental energy usage with extra capacity added depending on the
demand. Technology innovation could also see integration of PAYG with super-
efficient DC appliances with expected reductions in the size and cost by as much as
50%, which will further help in improving access (Phadke et al., 2017). Further, the
model could be integrated with other services such as biogas and ICS, improving total
energy access, especially in the context where other financing facilities such as micro-
credit are not available.
4.5 Discussion and Conclusion
Although subsidy policies are a major tool to increase the share of RETs, this does not
necessarily add to achieving the optimal mitigation outcomes, until and unless direct
and clear carbon pricing policies are available. Further, longer-term use of subsidies,
especially beyond the research and development phase, and into the commercial stage
of the technology innovation cycle, runs the risk of causing substantial welfare losses,
due to path dependencies leading to technology and institutional lock-ins. This
phenomenon has become evident in the context of the use of carbon revenues for
subsidy provisions in many countries. Despite the expected contributions to reducing
energy poverty and increasing energy security, the prevalence of direct subsidies and
associated policies in many low income developing countries has further drained the
limited financial resources available of governments, and slowed down energy access
across the developing countries. This issue has made it impossible to sustain direct
subsidies for energy access in many developing countries, especially in the context
where the market has not been able to allocate complementary financing, as in Nepal.
Therefore, innovative financial mechanisms such as PAYG which shift the focus away
from subsidies together with the use of new emerging technologies such as Fintech are
required.
Micro-credit, fee-for-service, and PAYG models are the most widely used debt
financing mechanisms for energy access. While micro-credit has seen wider application
in Asia, for both the cooking and lighting solutions, the fee-for-service and PAYG has
seen wider applications in Africa, largely for lighting applications. This may be because
electricity and lighting facilities provide better streamlined opportunities of using IT
services, and SHSs used for lighting facilities are also easier to be dismantled and
removed compared to cooking technologies such as biogas and ICS, if the customers

74
default overtime. Use of a single partner organisation with micro-credit and one-stop
shop ESCOs within a PAYG model has shown much success. Such evolution in
practice may be necessary to improve energy access given constraints in current markets
and the challenges associated with achieving energy access.
It is also notable that the overall investment pattern is skewed towards solar PV lighting,
either through household systems or through mini-grids. This trend reflects the
investment trend in the energy access markets, which limits access to cooking solutions
such as biogas and ICS, or other variants such as solar cookers. This trend also reflects
the literature which focuses on studying solar PV applications, with fewer studies on
cooking technologies. This is even though clean technologies for cooking result in
higher reduction in GHG emissions and have direct health benefits for women and
children.
This study will focus on understanding the consumers’ willingness to pay and credit
preferences for household biogas plant technology installation in relation to the context
of distributing carbon revenues as potential environmental incomes due to the GHG
emission reduction. The biogas plant is selected because of the limited literature with
regards to promotion of clean cooking solutions, especially with regards to energy
access financing, but also because the carbon revenue earning potential is higher due to
higher baseline of firewood compared to kerosene used for lighting applications.
Further, micro-credit practice has some successful precedent of being used for biogas
promotion in Nepal. Further, the test of credit preferences, conducted in the CV and CE
analysis, will also allow the results to be applicable for potential use of PAYG models
for biogas plants.

75
Chapter 5 Non-Market Valuation, Stated Preference and Renewable
Energy
This chapter describes the advent of stated preference methods, particularly CV and
CE, and their applications in the developing countries together with their theoretical
basis and applications to benefit transfer. The chapter also reviews the use of CV and
CE in the valuation and preferences of RE in the industrialised and developing
countries.
5.1 Introduction
The neoclassical economics emphasises a unity of method, following the lead of the
natural sciences. It has a positivistic ontology with an objective view of the world, with
theory based on empirical studies and real market conditions (Veisten, 2007). Of course,
this has not deterred, researchers to go beyond the positivistic standpoint and the
boundary of traditional and pure market conditions. This has been the case, especially in
the environmental sector, wherein different non-market valuation methods have been
developed and used overtime to analyse and understand hypothetical market conditions
to value nature’s common, and often intangible benefits. Their use has been for both ex
ante and ex post situations, especially for economic valuation, primarily through the
cost-benefit analysis of projects and policies. Further, these methods have been used for
additional purposes such as for priority setting, determining marginal damages,
determining discount rates, demonstrating importance of issues, legal damage
assessment, and green national income accounting (Bateman et al., 2002). This shift
from the traditional dependency on actual market observations was required due to the
notion of total economic value that considers social preference orderings for goods and
services that can’t be exchanged in markets. The use of non-market valuation started
gaining momentum after the 1960s, when optional and non-use values were integrated
along with market use values to form the total economic value (Morrison, 1998).
For goods and services that are traded in markets, prices can be observed, and valuation
can be based on the sum of consumer and producer surplus (Morrison, 2009). Such
regular valuation is not usually possible for goods and services not traded in a market.
Clean air, endangered species, and the innovation/invention of a new product all fall
within this category. The spatial and temporal dimensions of such products and services
make them difficult to value. Nevertheless, in the contexts where it is required to
estimate the total costs and benefits to the society, these goods and services need to be

76
valued. While it is sometimes considered unethical and impossible to value each and
every aspects of human life, sometimes valuation is possible using non-market
valuation methods. The literature suggests that there are various reasons why people
value different intangible goods and services, and gain those utilities collectively
referred to as non-use values. Such goods and services are valued for their existence,
stewardship, optional, bequest and altruistic values (Banzhaf, 2019; Krutilla, 1967;
Morrison, 1998; Weisbrod, 1964). The condition of gaining utility beyond market
conditions, without the active use of goods, has been defined as passive use as part of
the economics of valuation, and the term “passive use value” was adopted to encompass
all the frequently used terms such as non-use value, existence value, preservation value,
bequest value, stewardship value, and option value (Carson, Flores, & Mitchell, 1999).
Despite the importance of environmental valuation, there is a philosophical debate that
revolves around whether so-called passive use values can be valued correctly and if
such values should be included in an economic analysis, as economists have
traditionally worked with market goods, where it is necessary for a consumer to
physically use a good to get utility from it. Such passive use inclusion has given rise to
evaluation of goods like a remote wilderness area (Carson, 2000) whereby now the
tendency is to distinguish between use and passive use (Carson et al., 1999), contrary to
when researchers originally defined total economic value as one of the four Hicksian
welfare measures and then distinguished between use and non‐use values (Mitchell &
Carson, 1989). This difference involves a degree of uncertainty between the uses, which
invokes option values. While it is potentially possible for option value to manifest itself
in market transactions, such markets rarely, if ever, exist for environmental goods. A
passive use value then is composed of its variants such as stewardship value and
bequest value, option value and quasi‐option value. Each of these can be explained in
terms of a specific formulation of the individual’s preference structure and a specific
conceptualisation of what is being valued by them, and empirical efforts have led to
valuing each of the variants separately.
Further, while economic valuation has evolved to include different value categories
within market and non-market situations, it is also philosophically understood that
goods of any kind also have intrinsic values, primary values or spiritual values (Biller,
Rogge, & Ruta, 2006). These intrinsic values are related to the human dimensions and
ethical properties, which makes the valuation irrelevant for some goods, but practically,
more difficult, if not impossible for others. In the environmental context, this view is

77
often associated with the standpoint of “deep ecology”, and philosophers argue that the
anthropocentric nature of epistemology related to the economics and other social
science disciplines is not always able to fathom the intrinsic values. From a practical
point of view, such intrinsic value presents formidable problems for decision-making,
because no decision can be made without trade-offs in a world of finite resources.
5.2 Stated Preference and Revealed Preference Methods
The development of non-market valuation techniques has been along two branches:
revealed preference (RP) and stated preference (SP) methods. The valuation techniques
of travel cost, hedonics and contingent valuation were developed in the early 1950s as
part of preference-based methods. The RP methods are based on analysing the
behavioural traits and trails in the market to understand consumers’ preferences for non-
marketed, but related goods. The travel cost method uses data on the travel modes and
behaviours, to evaluate recreational benefits and preferences (Haab & McConnell,
2002). The hedonic pricing techniques reveal the value of an environmental good such
as a waterway and its vegetation conditions through observations of nearby rent and
house prices (Thomy et al., 2017). The method allows for potential valuation of the
environmental goods (Carson, Flores, & Meade, 2001) based on prices derived from
market behaviours. Another example of such would be the inference of economic value
placed on clean air through prices paid for technologies that reduce indoor air pollution
in developing countries. Economically well off houses would pay more for better
services that provide electricity, while poorer households would pay for improved cook
stoves to replace their traditional stoves. However, in such use of RP data and
information, account must be made of endogenous and exogenous dimensions where
households and villages may differ in ways such as access to markets, subsidies, initial
incomes, cultural practices, wealth and level of education (Manning & Loomis, 2016).
Therefore, although sophisticated, RP methods are normally restricted to some primary
variables such as price and cost in estimating the determinants of household energy
transitions (Q. Chen, Yang, Liu, & Zhang, 2016).
In contrast, the SP methods are based on what people infer rather than what they do, and
is more flexible and can potentially be applied in almost any context. Since hypothetical
scenarios are used, situations can be defined and analysed in greater detail in order to
produce conclusions about people’s priority and willingness for either specific aspects
or the entirety of goods, services or other aspects that are relevant for decision making.

78
In this context, SP method can be designed to provide more experimental control, and
also has lower data collection and manipulation costs in terms of application
(Adamowicz, 2004). The simple fact is that the lack of full and flexible markets has led
to the use of hypothetical markets to ascertain values for amenities and externalities, and
SP methods so far have proven to be well placed and time tested in this regard. Further,
since SP can be used for both passive and direct use values, innovation in SP will be
useful. In this context, overtime, the SP method has been introduced for goods and
services which do not necessarily represent passive use, through experimental
economics and simulation studies, especially in the case of both quasi-public and
private goods, and therefore has developed into a more complementary method within
the whole realm of valuation.
While the SP methods used and developed over the years, in principle, go beyond the
requirements of the positivistic traditional framework of neoclassical economics, the
theoretical underpinnings remain rooted to the neoclassical approach in consumer
demand theory, rational choice and utility maximisation. The utility maximisation is
related to principles of enhancing and/or increasing self-interest, whereby such interests
on the part of consumers and producers in a market tend to move towards a general
equilibrium condition, steered by the ‘invisible hand’ of the market. Within economics,
this invisible hand is expected to perform under the assumption that the preferences of
the individuals, even if never fixed over time, will remain fairly stable and consistent.
Against this basic premise, the psychology literature views peoples’ preferences as
labile, and in the case of SP studies impacted by the context of hypothetical scenarios,
wherein the validity (Appendix 5) of the SP studies is questioned. This is considered
crucial for truthful valuations. In this context, SP methods have gained from the
developments in psychology and behavioural economics, such as prospect theory and
endowment effect, in terms of seeking answers to violations and deviations seen in the
basic economics premises of consumer theory.
5.2.1 Contingent valuation – preference elicitation
Contingent Valuation or CV is the most widely used SP method with its largest
application in environmental valuation (Carson & Czajkowski, 2014). Its use primarily
started with the need to value passive use because passive use values typically form a
significant portion of the total economic value of many environmental amenities. CV
uses direct Willingness to Pay (WTP) methods for eliciting the values people place on
goods, services, and amenities (Boyle, 2003). It was first proposed in theory by (Bowen,

79
1943) to value “Social Goods”, and Ciriacy-Wantrup (1947), in his seminal paper on
justifying capital returns for the soil conservation programs. In doing so, Ciriacy-
Wantrup suggested the use of market values as benchmarks to value extra market
benefits and costs such as reduction of siltation in reservoirs, pollution of streams and
impairment of scenic and aesthetic resources. Further, he suggested the need for valuing
collective extra market goods for total economic valuation, by using survey and
referendum methods to understand the WTP for successive additional quantities of a
collective extra-market good. While doing so, he pointed out (1) the validity issues in
terms of the difficulty of understanding marginal utility due to the lumpiness of
collective extra market goods, (2) biases due to use of an increase in taxes in
hypothetical scenarios as a payment vehicle for the environmental goods, and (3) the
proper procedures of scenario and contexts formulation to obtain valid results.
The CV method experienced much of its early development in the US. Its use started in
the 1950s with the need to know people’s WTP for recreational parks, as people
increasingly wanted to recreate after World War II, and it was natural to assess whether
they would pay fees to visit parks. Further, cost-benefit analysis of the water-based
projects in the 1950s and 1960s also brought into focus the need for valuation of water-
based recreation. It was in this area of research that the idea was generated of using
different stated and revealed preference methods for valuation. While academic
works/papers by Wantrup and Bowen, started off the discussion, the PhD dissertation
by Davis (1963) put into test the first practical application of the technique when he
employed CV to estimate the value hunters and tourists placed on a particular recreation
site. The CV application gained its recognition after Randall, Ives, and Eastman (1974)
employed an iterative bidding technique to measure the economic value of visibility
reductions caused by coal-fired steam generating plants in the Four Corners region of
the south western United States. CV filled a substantial void by providing a way to
estimate values when markets do not exist, and RP methods were not applicable. The
method rose to high prominence in the US in the 1980s when the government included
CV as a method together with Travel Cost and Unit Day Value methods to value project
benefits, and government agencies were given the power to sue for damages to
environmental resources, including in the non-use context. The quintessential Exxon
Valdez oil spill in Prince William Sound was the first case where CV surveys were used
for quantitative damage assessment (Carson et al., 2003).

80
The seminal report (Arrow et al., 1993) on the possibility of use of CV methods, was a
milestone for the take-off of CV as a method for environmental valuation, albeit with
careful considerations of the limitations and biases. As of today, more than 7,500 papers
can be found using the method, and discussion of CV has become part of the
environmental text books at all levels of academia (Carson & Czajkowski, 2014). With
this level of understanding of the method, CV studies have declined in the industrialised
countries over the years, and often the results from past studies are used to evaluate new
policy issues in the form of benefits‐transfer exercises (Adamowicz, 2004), including
serving as meta‐analyses inputs. Technically, CV is a value elicitation method that
draws out direct responses from agents to understand their WTP for or willingness to
accept (WTA) marginal changes that result in benefits or losses to their utility. The
method seeks the agents’ understanding of the utility measured against the hypothetical
scenario presented. Theoretically, it is assumed that the measure of utility obtained by
eliciting an individual’s preference through their WTP for hypothetical changes is like
real market conditions, and thus pertains to the neoclassical consumer theory of
demand. The method is easier to implement for single goods and relevant changes and
impacts than for valuing multiple goods (Carson et al., 2003). It is often used for
valuing changes in an environmental context of passive use which is nonexclusive and
non-divisible, and of a pure public good nature. In such contexts, the values of such
goods under consideration are often significant, and there are few or no substitutes.
Over the past 50 years, CV has generated considerable debate and discussion regarding
the theoretical constructs of neoclassical economics. Some argue that the method should
not be used for damage assessment and policy decisions, because of theoretical
inconsistencies relating to scope, endowment and sequence effects84, whereby CV
cannot provide true estimates of value to make any welfare analysis (Desvousges,
Mathews, & Train, 2016; Diamond & Hausman, 1994; Hausman, 2012). Others
maintain that criticisms of CV have helped the method to grow overtime, but it remains
the only tool to value goods and services, especially passive use values, and the debate
is true also for any hypothetical survey used otherwise, such as in marketing (Carson &
Czajkowski, 2014; Haab, Interis, Petrolia, & Whitehead, 2013; Kling, Phaneuf, & Zhao,
2012). CV started receiving scrutiny and criticisms especially after 1980 due to the high
stakes involved with its use in litigation for environmental damage assessment,
84 Dealt with further in the research methodology section.

81
especially with respect to existence values (Arrow et al., 1993; Carson & Czajkowski,
2014; Portney, 1994).
5.2.2 Choice experiment and conjoint analysis - new approaches
Several limitations of CV, including its limited scope for multidimensional changes
(Bennett & Blamey, 2001; McFadden, 1994), led researchers to look for alternatives in
human decision research, marketing, and transportation. The Conjoint Analysis (CA)
was already being used in the marketing and psychology, and transport sectors
(Morrison & Bennett, 2000). The CA has its theoretical basis in the conceptual
description of goods by Lancaster (1966), which proposes that goods possess, or give
rise to, multiple characteristics in fixed proportions and the goods are chosen based on
these characteristics, and not based on the goods themselves. The CA, as a technique,
has its roots in mathematical psychology that evolved out of the “Conjoint
Measurement” technique (Luce & Tukey, 1964). This technique allows for the analysis
of the goods through their decomposition into attributes or characteristics across varying
levels or part-worths, as proposed by Lancaster. The method also allows for estimation
of marginal WTP for changes in the part-worth, which is a distinctive feature of the
conjoint measurement technique. Therefore, the decomposition of the goods allows CA
to be applied in surveys to obtain values of the attributes, as against the total valuation
in the case of CV. Since both the techniques cater to preference elicitation/s, CE shares
many characteristics and techniques with CV, and therefore also the biases. Table 5-1
presents a comparison of CV and CE methods.
In empirical studies, the respondents are presented with a questionnaire with a
description of the study site, details of the proposed changes and a series of debrief
questions. The main difference is in the form of the elicitation questions. While in the
case of CV, the respondents are typically posed with their WTP or WTA compensation
for the changes through different question formats, in choice modelling, respondents are
presented with a series of choice sets, each containing two or more alternatives, together
with the status quo alternative. The alternatives in the choice sets are defined using a
common set of attributes, the levels of which vary from one alternative to another. The
levels of the attributes are systematically varied using an experimental design to create
the alternatives and choice set, which is part of the conjoint measurement technique.
From each choice set, respondents are asked to choose their preferred alternative,
making a discrete choice.

82
Traditionally, use of CA techniques has involved contingent ranking and contingent
rating, where the respondents would have to rank, or rate the alternatives along a
numeric or a semantic scale, to either understand the sequence of preferences or to
understand the strength of preferences. Another version is the paired comparison, where
respondents would be forced to rate between two alternatives without a status quo
alternative. The paired comparison involves combining elements of a choice
experiment, in terms of choosing the most preferred alternative, and a rating exercise, in
terms of rating the strength of preference (Bateman et al., 2002).
Louviere, Flynn, and Carson (2010) believes that despite the possibility of the use of
traditional conjoint measurement theory to study human preferences, mainstream CA
has evolved away from neoclassical utility theory into other innovations of ratings and
rankings. This also is a departure from the contexts of choice made by consumers in the
real world (Bennett & Blamey, 2001). Nevertheless, while the rating and ranking
exercises are product-focused, and are driven by the need to understand market share,
the choice experiments involving participants making consequential choices from the
different alternatives can be based on the theory of choice behaviour, as proposed by
Table 5-1: CV and CE Comparison
Contexts Contingent Valuation Choice Experiment
Theoretical Basis WTP elicitation to
understand the Hicksian
surplus, primarily in terms
of income and utility
comparison, binary choice
formats concomitant with
the random utility model
Good theoretical basis with
random utility theory, used
to understand utility based
on part worth attributes in
psychology, market and
transport sector extensively
Goods and Services
Valued
Primarily non-market Market and non-market
Value Estimates Primarily passive use Use and Option
Useful Total economic value
generation, cost benefits
Understanding attributes
and levels, trade-offs,
diverse usage such as
priority and policy setting
Sampling Larger samples required Smaller samples required
Major Bias Hypothetical bias Hypothetical bias

83
Thurstone (1927). This originates from the field of psychology as the law of
comparative judgement, postulating fundamentally the judgments of a single observer
who compares a series of stimuli by the method of paired comparison, wherein no equal
judgments are allowed, meaning choices need to be made. Thurstone’s work was
introduced into economics by Marschak (1974), who developed the theoretical
implications for choice probabilities of utility maximisation, but which contained
random elements. Marschak called this the Random Utility Maximization model, and as
of today, it is widely known as the Random Utility Theory. McFadden (2001) extended
the theory from paired comparisons to multiple comparisons with the introduction of the
Conditional Logit Model (McFadden, 1973).
In essence, choice modelling can be seen as the amalgamation of the law of comparative
judgement and the concepts of part-worth of goods brought together by the statistical
techniques of conjoint measurement, and henceforth developed to understand
neoclassical utility as consumer surplus, but considering the randomness of choice.
Choice theoretic models provide behaviourally justifiable ways to model preferences
that contrast with the non-behavioural statistical underpinnings of conjoint analysis.
They also have an associated error theory and can be applied to real (revealed) or
hypothetical (stated) choices (Louviere & Lancsar, 2009). These theoretical
developments in the microeconomic choice theory were possible largely due to the
development of computer processing which made it possible to study more attributes
and levels with increasing effectiveness. In the 1990s, development of hierarchical
Bayesian estimates through computationally intensive statistical methods made it
possible to estimate a complete set of part-worth scores on each attribute level for each
respondent, which was fundamentally impossible to do otherwise (Orme, 2010). This
led to better choices than with the contingent rating and ranking, and therefore the
resulting market simulation became more accurate in predicting the actual market
choices.
Louviere and Hensher (1982, 1983) are credited with the first SP choice modelling in
the transport and marketing sectors (Morrison & Bennett, 2000). The use and
development of choice modelling has primarily been in health, environment, marketing,
and transport sectors. McFadden (2014) has suggested its integration with the fields of
psychology and behavioural economics, with the objective of further understanding the
nature of choices under conditions of risk and uncertainty, as issues of focus across
different fields.

84
5.3 Stated Preference in Developing Countries
The period of intense methodological development between 1970s and 1990s saw the
broadening of CV and its applications beyond the environment into other areas, and its
use in the developing countries (Haab et al., 2013). SP methods are now used
extensively in the environmental and health sector in the developing countries. But,
compared to its application in the developed economies, its use is still limited. Out of
around 4,000 CV studies conducted since 1990, Durand-Morat, Wailes, and Nayga
(2016) found that only 146 were in the developing countries. Whittington (2002) further
points out that many studies are of less than good quality. The studies using CE seems
to be fairly recent compared to the use of CV, and increasingly preferred by many
academics and practitioners (Boxall, Adamowicz, Swait, Williams, & Louviere, 1996;
Mahieu, Andersson, Beaumais, Crastes, & Wolff, 2014). However, researchers have
pointed out the issue of cognitive burden introduced when assessing attribute trade-offs
of respondents who have low levels of education in the developing countries (Alberini
& Cooper, 2000), especially in rural areas.
Nevertheless, the deteriorating state of the environment and infrastructure in the
developing countries has created an urgent need for their economic valuation.
Unfortunately, policies and programs are seldom evaluated through proper and robust
economic valuation (Biller et al., 2006). Moreover, seeking preferences from the public
is sometimes a completely new context in terms new concept (Yesuf, Mekonnen,
Köhlin, & Carlsson, 2005). Despite these problems, CV and CE including other SP
methods would be relevant, especially in the low income, least developed countries
where a general lack of proper market structures and standards limit other forms of
analysis that depend on real market data, such as hedonic wage/property values.
However, given the immediate need for food, shelter, health and education, conceptual
understanding of environmental amenities such as clean air and biodiversity
preservation and conservation receives less priority by consumers, especially in low
income, least developed economies. In most cases, goods of a public nature are the
responsibility of governments, with attitudes of free riding and moral hazard prevailing
due to low income, education, and low level or awareness. Therefore, results from any
SP studies need to be properly validated. Biller et al. (2006)’s quantitative analysis of
CV studies showed that its largest application was in the middle income countries, with
a higher proportion of studies related to environment and natural resources

85
management85. Biller et al. (2006) also found that lower income countries had a higher
proportion of infrastructure-related studies, and within that86, more than 50% of studies
are related to water, sanitation and the health sector, with only 5% in the energy sector.
The results support Kuznet’s theory of environmental degradation and income growth
over time. Geographically, Biller et al. (2006) found that in the developing world the
highest number of studies were conducted in Sub-Sahara, and the lowest in the Middle
East and North Africa.
5.3.1 Empirical applications
The literature shows that the empirical applications of CV and CE are increasing in the
developing countries. The other variants such as contingent ranking, rating or
contingent behaviour studies are limited. CV is used extensively in its single policy
form to understand WTP/WTA (Alberini & Cooper, 2000), despite the empirical and
methodological criticisms (McFadden & Train, 2017). There is an extensive use of CV
and CE in the environmental, natural resources management sector (Baral, Stern, &
Bhattarai, 2008; Hadker, Sharma, David, & Muraleedharan, 1997; Navrud &
Mungatana, 1994). Many of these studies are used to value the active use potential in
relation to direct consumption of goods such as firewood (Amiri, Emadian, Fallah,
Adeli, & Amirnejad, 2015; Gelo & Koch, 2015), or in relation to tourism and recreation
(Dong, Zhang, Zhi, Zhong, & Li, 2011; Hearne & Salinas, 2002; Tuan & Navrud, 2008)
to promote the dual goals of environmental and natural resources management and
income generation. Studies also value passive use such as for river restoration (Wendy
Y Chen, Hua, Liekens, & Broekx, 2018; Kahn, Vásquez, & de Rezende, 2017; Khan &
Zhao, 2019), waste management (Iqbal & Milon, 2017; Ó. C. Vásquez, Álvarez, Silva,
& Muga, 2014) and air quality management (Akhtar, Saleem, Nadeem, Shahid, &
Ikram, 2017; Zhengtao Li & Hu, 2018), with a few also designed to understand the
bequest and existence values (Oleson et al., 2015). There is a higher demand of CV and
CE for drinking water and sanitation valuation. This could be due to the investment
interest of many multilateral development banks (Alberini & Cooper, 2000) where the
SP methods are used as part of the cost-benefit analysis. Rapid urbanisation in the
developing economies has resulted in many water supply valuations (Brouwer, Job, van
85 58% of the studies in the green sector such as biodiversity, ecosystem services, and recreation, and 42%
in the brown sector such as the pollution of air, water, soil and coastal areas. 86 Infrastructure related to primarily public services such as transport, water and sanitation, health, energy,
and agriculture.

86
der Kroon, & Johnston, 2015; Orgill-Meyer, Jeuland, Albert, & Cutler, 2018), with
some studies also focusing on rural water supply valuation (Whittington, 2010). Error!
Reference source not found. and Error! Reference source not found. show some
recent applications of CV and CE in the environmental and natural resource sector.
Table 5-2: CV in Environment and Natural Resources
Air pollution (Chien, Huang, & Shaw, 2005),
(Hammitt & Zhou, 2006),
(Grazhdani, 2015), (Filippini &
Martínez-Cruz, 2016), (Akhtar et al.,
2017), (Zhengtao Li & Hu, 2018),
(Donfouet, Cook, & Jeanty, 2015),
(Ndambiri, Mungatana, & Brouwer,
2017)
Albania,
Mexico, China,
Pakistan,
Cameroon
Environmental and
cultural heritage
(Tuan & Navrud, 2008), (W. Y. Chen
& Hua, 2015), (Dong et al., 2011),
(Ariffin, Fazamimah, Ahmad, &
Alias, 2015), (Báez-Montenegro,
Centeno, Lara, & Prieto, 2015), (Ji,
Choi, Lee, & Mjelde, 2018)
Vietnam,
Malaysia, China,
Chile
Ecosystem services and
biodiversity conservation
(Baral et al., 2008), (Hadker et al.,
1997), (Navrud & Mungatana, 1994),
(Le, Lee, Kim, & Lee, 2016), (Ramli,
Samdin, & Ghani, 2017), (Nandagiri,
2015), (Samdeliri & Shahbaz, 2017),
(B. Chen & Qi, 2018),
(Seenprachawong, 2016), (Trujillo,
Carrillo, Charris, & Velilla, 2016),
(Bakar, Radam, Samdin, & Yacob,
2016)
Nepal, Kenya,
Vietnam,
Malaysia, China,
India, Iran,
Thailand,
Colombia
Forest management (Tilahun et al., 2015), (Amiri et al.,
2015), (Gelo & Koch, 2015),
(Thompson, Swallow, & Luckert,
2017), (Tilahun, Birner, & Ilukor,
Ethiopia, Iran,
Cameroon,
China
87
2017), (Xiaodong Chen, Lupi, & Liu,
2017)
Waste management (Ó. C. Vásquez et al., 2014), (H.
Wang, He, Kim, & Kamata, 2014),
(Hazra, Goel, & Maitra, 2015),
(Alhassan, Donkoh, & Boateng,
2017), (Amirnejad, Jahanifar,
Shahpori, & Eshghi, 2018),
(Challcharoenwattana & Pharino,
2016)
Chile, India,
China, Ghana,
Iran, Thailand
Drinking water and
sanitation
(Whittington et al., 1993),
(Whittington, Briscoe, Mu, & Barron,
1990), (Whittington, Lauria, & Mu,
1991), (Choe, Whittington, & Lauria,
1996), (Whittington & Swarna,
1994), (Roy & Chakraborty, 2014),
(Orgill-Meyer et al., 2018), (Brouwer
et al., 2015), (Burt et al., 2017),
(Thanh, Van Minh, Huyen, Chung, &
Hung, 2014), (Simiyu, Swilling,
Rheingans, & Cairncross, 2017),
(Chatterjee, 2015)
Ghana, Haiti,
Nigeria,
Philippines,
India, Jordan,
Kenya,
Tanzania, Nepal
Table 5-3: CE in Environment and Natural Resources
Ecosystems services (Hearne & Salinas, 2002),
(Villalobos & Huenchuleo, 2010),
(Oleson et al., 2015), (Dimal &
Jetten, 2018), (H. Li, Bennett, Jiang,
Zhang, & Yang, 2017), (Xu, Yu, &
Li, 2015), (Raes, Speelman, &
Aguirre, 2017), (Loomis &
Santiago, 2013)
Nepal, Costa
Rica, Sri Lanka,
Madagascar,
Philippines,
China, Ecuador,
Puerto Rico

88
Biodiversity
conservation, forest
management
(E. Wang, Wei, & Zhu, 2017), (R.
K. Rai & Scarborough, 2015),
(Groom, Dehlavi, Khan, & Shahab,
2010), (Grosjean & Kontoleon,
2009), (Kahn et al., 2017),
(Jacobson, Shr, Dalemans, Magaju,
& Ciannella, 2018), (Wendy Y Chen
et al., 2018), (Khan & Zhao, 2019),
(Permadi, Burton, Pandit, Race, &
Walker, 2018), (Scheufele, Bennett,
& Kyophilavong, 2018), (Vollmer,
Prescott, Padawangi, Girot, & Grêt-
Regamey, 2015), (Ratanak & Yabe,
2010), (Selassie & Kountouris,
2010), (Kaffashi et al., 2012)
Pakistan, Brazil,
Kenya; China;
Indonesia, Lao
PDR, Cambodia
Waste management (Das, Birol, & Bhattacharya, 2010),
(Tarfasa & Brouwer, 2018), (Danso,
Otoo, Ekere, Ddungu, & Madurangi,
2017), (Iqbal & Milon, 2017),
(Trang, Rañola, & Van Song, 2018)
India, Ethiopia;
Uganda,
Bangladesh,
Vietnam
Drinking water and
sanitation
(Albert, Luoto, & Levine, 2010),
(Hope, 2006), (Kanyoka, Farolfi, &
Morardet, 2008), (Mu, Whittington,
& Briscoe, 1990), (Snowball, Willis,
& Jeurissen, 2008); (Tarfasa &
Brouwer, 2013), (Dauda, Yacob, &
Radam, 2015), (Brouwer et al.,
2015), (Burt et al., 2017), (Macea,
Amaya, Cantillo, & Holguín-Veras,
2018; W. F. Vásquez & Alicea-
Planas, 2018), (Abou-Ali &
Carlsson, 2004), (Gibson, Rigby,
Polya, & Russell, 2015)
Nigeria, South
Africa, Kenya,
Tanzania,
Ethiopia,
Colombia,
Egypt,
Cambodia

89
The next comprehensive use of CV and CE is in the health sector. Error! Reference
source not found. and Error! Reference source not found. shows the use of CV and
CE in health sector studies. CV is particularly used to estimate a respondent’s WTP for
health insurance. Besides health insurance, the use of CV is in the public health service
domain related to hospital and health service conditions (Weaver et al., 1996), payments
for HIV drugs (Chiwaula et al., 2016; Mbachu, Okoli, Onwujekwe, & Enabulele, 2018;
Nguyen et al., 2017; Tran et al., 2017) and control of diabetes (Haghparast-Bidgoli et
al., 2018; Tharkar, Devarajan, Kumpatla, & Viswanathan, 2010), which are all very
pertinent issues in the developing countries. CV is also used in generic health related
issues such as control of tsetse flies (Echessah, Swallow, Kamara, & Curry, 1997) and
WTP for health risk reduction due to pesticides use (W. Wang, Jin, He, Gong, & Tian,
2018).
Table 5-4: CV in Health Applications
Health insurance (Asenso-Okyere, Osei-Akoto,
Anum, & Appiah, 1997), (Adams,
Chou, & Pu, 2015), (Chanel,
Makhloufi, & Abu-Zaineh, 2017),
(Azhar, Rahman, & Arif, 2018),
(Jofre-Bonet & Kamara, 2018), (Thi
Thuy Nga, FitzGerald, & Dunne,
2018), (Biggeri, Nannini, & Putoto,
2018), (Binam, Nkama, & Nkenda,
2004)
Ghana, St. Vincent
and the grenadines,
Tunisia, Malaysia;
Sierra Leone,
Vietnam, Uganda
Hospital and health
services improvement
(Weaver et al., 1996), (Tharkar et al.,
2010), (Shono, Kondo, Ohmae, &
Okubo, 2014), (Nyamuryekung'e,
Lahti, & Tuominen, 2018),
(Haghparast-Bidgoli et al., 2018),
(Nguyen et al., 2017), (Chiwaula et
al., 2016), (Tran et al., 2017),
(Mbachu et al., 2018), (Saengow,
Birch, Geater, &
Chongsuwiwatvong, 2018)
Central African
Republic, India,
Indonesia,
Tanzania,
Bangladesh,
Vietnam, Malawi,
Nigeria, Thailand

90
WTP for prevention
and control
(Echessah et al., 1997), (W. Wang et
al., 2018)
Kenya, China,
Thailand
The use of CE is more diverse such as for health sector priority setting (Baltussen et al.,
2007; Mirelman et al., 2012), and assessment of women’s preferences for place of
delivery in rural settings (Kruk, Paczkowski, Mbaruku, de Pinho, & Galea, 2009;
Larson et al.) and preferences of health sector jobs for public sector nurses (Blaauw et
al., 2010; Mangham & Hanson, 2008), medical students (Kruk, Johnson, et al., 2010),
and trainee health professionals (Rockers et al., 2012). Lagarde and Blaauw (2009)
carried out a review of the application of CE to inform human resources policy
interventions in the health sector and concluded that CE is appealing because it provides
policy-relevant information in developing country contexts, where detailed evaluations
of policy interventions are costly or rich longitudinal and time series datasets are rare
and difficult to collect. Some of the studies have linked health issues with other sectoral
issues such as air quality (Yin, Pizzol, Jacobsen, & Xu, 2018) and agriculture
(Chowdhury, Meenakshi, Tomlins, & Owori; W. Wang et al., 2018).
Table 5-5: CE in Health Applications
Health priority setting (Mirelman et al., 2012), (Baltussen et
al., 2007)
Nepal, Cuba,
Brazil, Uganda
Health insurance (Ozawa, Grewal, & Bridges, 2016),
(Abiiro, Leppert, Mbera, Robyn, &
De Allegri, 2014)
Cambodia,
Malawi
Women’s preference
for place of delivery
(Kruk et al., 2009), (Larson et al.,
2015), (Kruk, Paczkowski, et al.,
2010)
Tanzania,
Ethiopia
Preferences for health
related jobs
(Kruk, Johnson, et al., 2010),
(Rockers et al., 2012), (Brunie, Chen,
& Akol, 2016; Kolstad, 2011),
(Blaauw et al., 2010), (Mangham &
Hanson, 2008)
Ghana, Uganda,
Tanzania,
Thailand, Kenya,
South Africa,
Malawi
Hospital and health
services quality
(Hanson, McPake, Nakamba, &
Archard, 2005), (Berhane &
Zambia, Ethiopia,
Mozambique

91
Enquselassie, 2015), (Kruk et al.,
2016), (Subramanian et al., 2018)
The literature shows the use of CV to estimate the non-market benefits of cattle grazing
practices in Kenya (Ouma, Obare, & Staal, 2003), economic consequences of post-
harvest insect damage in Rwanda (Jones, Alexander, & Smith, 2018), preservation of
agriculture biodiversity in India (Krishna, Drucker, Pascual, Raghu, & King, 2013),
watershed conservation in Ethiopia (Ayenew & Meride, 2015), preservation of
farmlands against urban pollution in China (X. Wang et al., 2016), crop insurance
against flood and drought in Pakistan and Iran (Arshad, Amjath-Babu, Kächele, &
Müller, 2016; Fahad & Jing, 2018; Ghanbarpour, Saravi, & Salimi, 2014), control
measures and forecasts against climate change in Malaysia (Banna et al., 2016), Nepal
(Khanal et al., 2018), and Benin (Amegnaglo, Anaman, Mensah-Bonsu, Onumah, &
Gero, 2017), and general services for real and perceived values of agriculture such as
for mobile based agriculture information in Benin (Arinloye, Linnemann, Hagelaar,
Coulibaly, & Omta, 2015), improved forage seed and planting material in Ethiopia
(Negassa, Shapiro, Kidane, Abdena, & Hanson, 2015), for local landraces in Nepal
(Poudel & Johnsen, 2016), micronutrient fortified foods in Uganda (Chowdhury et al.,
2011), and green and organic foods in China (Yu, Gao, & Zeng, 2014), and India (Birol,
Roy, Deffner, & Karandikar, 2009).
Similarly, studies using CE can be found on valuing attributes related to indigenous
cattle breeds in Nigeria (Scarpa et al., 2003), practices, and policies for particular
products and crop varieties such as for banana farming in Uganda (Kikulwe, Birol,
Falck-Zepeda, & Wesseler, 2010) and the West Indies (Blazy, Carpentier, & Thomas,
2011), demand for perennial pigeon pea in Malawi (Waldman, Ortega, Richardson, &
Snapp, 2017), preference for sorghum variety in Mali (Waldman & Richardson, 2018),
and environment friendly paddy farming practices in China (N.-n. Wang, Luo, Pan, &
Ni, 2018). Further, a number of studies have looked at people’s preference for insurance
such as weather-indexed insurance in Ethiopia (Hill, Hoddinott, & Kumar, 2013;
McIntosh, Sarris, & Papadopoulos, 2013), river flood insurance in Bangladesh
(Brouwer & Akter, 2010), and generic crop insurance against agricultural and
environmental risks in Ethiopia (Yesuf et al., 2005). The CE studies also value
preferences for generic agriculture related issues such as for multifunctional agriculture

92
compared to mono-functional farming in Thailand (Sangkapitux et al., 2017), shift to a
climate smart agriculture in Nigeria (Shittu & Kehinde, 2018), bio-fortified foods87
(Birol, Meenakshi, Oparinde, Perez, & Tomlins, 2015; Birol et al., 2009), food quality
attributes in relation to green certification, organic, and retail channel (Ortega, Wang,
Wu, & Hong, 2015), and attributes of a dairy business hub in Tanzania (E. J. Rao,
Mtimet, Twine, Baltenweck, & Omore, 2016).
There have been few studies on understanding the priority and preferences for financial
products and innovations, except for the WTP and preference parameters for insurance
schemes for health, environment and agricultural risks. Some use of CE in financing can
be found in Cranford and Mourato (2014) and Anastassiadis, Liebe, and Musshoff
(2015). Cranford and Mourato (2014) studied the different financial attributes of a
proposed credit-based PES in Ecuador that links ecosystem payments with interest
subsidies based on the fulfilment of environmental conditions. This results-based
mechanism is expected to reduce key market constraints, and is different from the
original conceptualisation of direct PES to motivate the provision of environmental
public goods. The study found the option to be promising, meeting multiple desirable
qualities of an incentive and also in line with behavioural economics. Anastassiadis et
al. (2015) examined the factors affecting rural Indian households' choice of credit from
formal financial sources over other credit institutions, namely semi-formal and informal
lenders. The study used household data from six Indian states, and found corroborative
evidence that relatively resource-rich households, even while living at distant locations,
enjoy greater access to formal creditors. It also identified a new factor, interlinked
credit, as a significant variable influencing access to formal credit. These studies have
parallels to the current study because they involve understanding of reversal of negative
environmental trends and relieving market constraints to ensure financial access. Both
also propose to look beyond credit-alone approaches to credit plus-approaches. The
insights from these studies has been helpful in designing a credit-based financial
product for this study by considering the carbon revenue, as a covenant for the
sustainable operation of the RETs.
87 A multi-country study in Africa (Ghana, Nigeria, Rwanda, Uganda and Zambia), Asia (India) and Latin
America (Guatemala).

93
5.3.2 Theoretical considerations
The literature deals with a number of theoretical issues. The theoretical validity
measures are normally tested with the comparison between the CV and CE results, and
the convergence with the RP methods. Several studies with combined CV and CE found
that there is no significant difference between the values derived, confirming the
convergence of the two methods (Jin, Wang, & Ran, 2006; Loomis & Santiago, 2013;
Nam & Son, 2005; Tuan & Navrud, 2007). Boxall et al. (1996) found that the
respondents’ elicitation tends to ignore the substitute alternative in the CV studies, so
that if the CE model is restricted to consider only one alternative, results tend to be
similar to the CV model. Scarpa et al. (2003) compared the value estimates for cattle
attributes from CE with those from hedonic analysis of actual transactions by the same
sample traders. The results indicated that CE estimates pass the external test and appear
to be adequately precise in estimating values that are relevant in market transactions for
the local traders, even after accounting for taste and variance heterogeneity. Nandagiri
(2015) and E. Wang et al. (2017) compared the WTP estimates with the travel cost
method (TCM) respectively in India and China. Nandagiri (2015) used a zonal approach
for valuation in TCM, and an open-ended question format for the CV, with direct
interviews with 500 visitors for a lake visit, and found that the mean WTP value for
improving extra facilities at the lake through CV elicitation was far lower than obtained
through application of TCM. This difference in value was attributed to the visitors’
inhibition to reveal their real WTP values considering political and socio-economic
factors in developing countries like India. However, E. Wang et al. (2017) found
comparable results in comparing CE with the TCM for visits to coastal parks in China
where three categories of attributes (nature, management, and finance) were considered.
Many deviations from the construct validity, could be improved with the survey designs
that seeks to limit the consumers’ strategic biases (Mitchell & Carson, 1989)88.
Another important test of validity is the scope sensitivity, where different WTP formats
can be tested against different bundles of goods and services in relation to the budget
constraints. Memon and Matsuoka (2002) analysed CV scope sensitivity in Pakistan,
and found the WTP estimates from a bidding game format to be statistically significant
to the magnitude of the health benefits of safe drinking water, and per capita income.
88 Memon and Matsuoka (2002) in a study of WTP for health risk reduction of drinking water used a
participatory rural appraisal approach for optimally communicating the risk to the respondent. This
approach helped build the respondent's confidence to reduce potential strategic biases.

94
Similarly, Ndambiri et al. (2017) analysed the scope effects due to respondent
uncertainty by evaluating whether WTP estimates are sensitive to changes in the
magnitudes of motorised emission reductions in Nairobi, Kenya, using three variants of
payment card elicitation format. The results showed that regular payment card
respondents stated significantly larger WTP amounts for larger emission reductions,
while random payment card and polychotomous payment card respondents stated
comparatively smaller amounts for larger emission reductions. The study implied that
though respondents were sensitive to the scope, respondents’ uncertainty lowered their
sensitivity to scope. Further, Heinzen and Bridges (2008) in a comparison of CV WTP
formats with pneumococcal vaccine payments in Bangladesh found varied results. He
found the open-ended elicitation method to produce highly inflated values that were
insensitive to construct validity tests, and the dichotomous choice method produced
quantity (demand) estimates rather than value estimates, with some evidence of yea-
saying. The payment card elicitation method was found to be affected by range bias, and
the bidding game elicitation method was found to be less sensitive to starting point bias
and yea-saying, contrary to the general findings of anchoring or starting point bias with
bidding games. Therefore, these results suggest that proper information dissemination
coupled with the use of sound elicitation format/s is important despite the fact that the
formats used are prone to multiple biases.
Researchers have studied the time-to-think phenomenon over the years both with CV
and CE scenarios (Cook, Jeuland, Maskery, & Whittington, 2012; Whittington, Choe, &
Lauria, 1997). A CV study with respect to the water access in Nigeria (Whittington et
al., 1992) found that the respondents who are allowed time to evaluate the proposal, bid
significantly less than those who are not allowed the time, whether water access is either
from a public tap or a private connection. A multi-country CE study for cholera and
typhoid vaccines (Cook, Whittington, Canh, Johnson, & Nyamete, 2007) also found
similar results where the respondents who were given overnight extra time made fewer
choices that violated internal validity tests of utility theory, and the average WTP was
less by approximately 40%. Such theoretical applications can improve study results,
especially with respect to goods of higher values such as a one-time purchase decision
of the energy access technologies, by reducing information and strategic bias89. But, its
89 However, in real market conditions, there is no possibility of such over-night or prolonged time-to-
think, and such values are estimated based on the influence from family and friends.

95
use also increases the survey cost, and may be imperative for large and sensitive
projects such as the WTP for vaccinations, with larger impacts on cost-benefits.
Khanal et al. (2018) looked at the impact of survey incentives in relation to
psychological influences that affect the way people value the environment. In a face-to-
face CE, the study found that incentive receivers spent more time than incentive non-
receivers in answering the survey, and were more likely to not choose a status quo
option. However, prepaid survey incentives had minimal effect with the results
suggesting that prepaid incentives helped increase response rates, but did not change
welfare estimates. W. Y. Chen and Hua (2015) studied the links to protest responses
with the perceived distrust of the government and found a significant relationship, even
though the protestors and non-protestors shared similar salient values associated with
the goods being valued. However, W. Y. Chen and Hua (2015) also found that low
familiarity of the goods being valued induces distrust of government, leading to protest
responses. Le et al. (2016) found similar results in Vietnam. Therefore, while the pre-
paid incentives especially in the case of developing countries can lead to better response
rates, the distrust of the consumers with the government and or the market operators
such as energy utilities could actually lead to protest responses. Therefore, this study
used a small incentive as token amount for each consumer’s time for completing the
survey, and considered proper design to identify the protest responses.
While WTA estimations are not common, studies have used WTA format both with the
CV and CE technique, especially in studies relating to PES valuation. Shittu and
Kehinde (2018) used a CE best-worst scaling technique to estimate the WTA estimates
in relation to mitigation potential due to the shift to a climate-smart agriculture practice
along with the WTP to avoid shifting to agro-forestry practice in Nigeria. Similarly,
Krishna et al. (2013) used CE to examine the role of direct compensation payments for
agro biodiversity conservation, using minor millet landraces in India. He found it
necessary to simultaneously consider a range of potential interventions, including the
payment options, to realise conservation of a priority portfolio of agro-biodiverse
resources in a predominantly subsistence-based agricultural systems. Mangham and
Hanson (2008) also found a similar result with the use of CE to estimate nurses WTA
increase in salary, where the other attributes of opportunities to upgrade professional
qualifications and government housing were also statistically significant in the nurses’
choice of employment. X. Wang et al. (2016) in a CV study to understand the WTA
compensation of environmental pollution found that the WTA scenario is sometimes

96
necessary and reasonable when relevant property rights are held by those negatively
affected. The study results indicated that the covariates influenced the respondents’
WTA decisions, and showed that WTA compensation decreased with increasing income
and education levels, and that WTA varied with family size and farmland area. Since
the current study has also defined the carbon credits due to the RETs as part of the PES,
and given that the property rights are well-defined, WTA formats were used.
5.3.3 Applications to benefit transfer
Benefit transfer is an analytical process whereby information collected from past
surveyed sites is then transferred to unstudied, policy sites. Such benefit transfer studies
are conducted to save resources. It is important to understand the potential for transfers
of model parameters and value estimates. The benefit transfer application is considered
particularly useful in the case of developing countries because of the cost of economic
valuation, lack of skill sets to carry out such valuation, and simply because of the
inefficiency in conducting multiple primary studies (Chaikumbung, Doucouliagos, &
Scarborough, 2016; Shrestha & Loomis, 2001). Chaikumbung et al. (2016) found in a
meta-regression analysis of wetlands across developing countries that the values
estimated by SP studies are lower than those using market-based methods. The benefit
transfer function was found to be an appropriate and cost-effective policy tool for the
development and analysis of wetland management policy options in developing nations,
with the transfer function having error rates that are lower than most prior meta-studies.
However, the study recommended applying caution when using benefit transfer to
future policy sites across space, time and other dimensions. In particular, the
explanatory variables used may not adequately capture quality and quantity differences
in service provision across sites.
Tuan, Seenprachawong, and Navrud (2009) studied the cultural heritage between two
countries, Thailand and Vietnam, and Barton (2002) studied the coastal water quality
improvements between two towns in Costa Rica. These studies point to the prevalence
of transfer errors resulting from fundamental problems due to physical, cultural and
institutional variables that need to be taken into account in explaining the differences,
aside from the usual income and socio-economic variables captured in CV studies
(Tuan et al., 2009). Barton (2002) finds no basis for the claim that the reliability of
benefit transfer increases with proximity between the study sites. He rejects the claim
that transfer of WTP estimates adjusted by the benefit function outperforms transfers of
unadjusted or simple income-adjusted WTP. These studies point to the importance of

97
evaluating tradeoffs between assuring internal validity at each site and observing benefit
transfer reliability across sites. Such has also been pointed out in the case of benefit
transfer studies carried out in developed countries which have emphasised that the
quantitative adjustment mechanisms to validate value transfer are meaningless if the
more fundamental issue of differences in the very nature of the values elicited is not
addressed at the same time (Brouwer, 2000) 90.
CE is expected to provide better tranferability potential due to advantages of the
multiattribute approach, by allowing for differences in tradeoff between sites as well as
differences in socio-economic characteristics between respondent populations
(Morrison, Bennett, Blamey, & Louviere, 2002). Further, CE provides valid estimates
because of its ability to value marginal changes and because it is more suited for tranfer
of implicit prices (Morrison & Bennett, 2000). Moreover, while Randall et al. (1974)
and Y. Jiang, Swallow, and Mcgonagle (2005) point out that empirical tests for benefit
transfer using CE may be acceptable, and even empirically valid, depending on the
policy objectives and the context, they also emphasise the need to design studies with
benefit tranfer objectives in mind, and not rely on exisitng estimates from studies which
were not designed for such transfer.
Many studies provide insufficient information about valuation parameters such as
wetland ecological and physical characteristics, and population characteristics such as
education and ethniciy to be able to judge the tranferability of CE estimates. However,
the positive signals encourage other tests of the CE method for benefit transfer such as
pooled models for large-scale benefit transfer, where it is not possible to sample all
relevant sites and populations (Colombo, Calatrava-Requena, & Hanley, 2007; Y. Jiang
et al., 2005; Johnston & Rosenberger, 2010; Morrison & Bennett, 2004; Van Bueren &
Bennett, 2004). Further, Morrison and Bergland (2006) suggested the use of a Bayesian
approach as an alternative for evaluating context effects, where the approach
theoretically has the potential to produce for practitioners a distribution of benefit
estimates for different attributes, thus clarifying the influence of site and population
differences on value estimates.
90 Such as the case of air quality benefit transfer comparability between France and Germany, where the
respondents in Germany declared a greater WTP for their health and air quality than respondents in
France, which may be due to the stronger sensitivity to environmental problems in Germany than in
France (Rozan, 2004).

98
Given the burgeoning use of SP methods in developing countries together with
theoretical developments, it can be concluded that SP methods have proven useful
despite the early concerns. Studies have focused on empirical applications, with a fair
amount of focus on the theoretical aspects in terms of understanding the validity,
reliability and overall experimentation, either from a neoclassical perspective or
otherwise. However, use of SP methods in developing economies has not received the
same level of criticism which the method has received in the developed countries,
especially after the Exxon Valdez damage assessment in 1989. But, the issues related to
their use such as the hypothetical context and the validity measures, especially focusing
on the embedding effect, based on scope and order of the goods, and the differences in
WTP and WTA measures would still need to be considered.
5.4 Renewable Energy, Energy Access and Stated Preference Methods
The literature review found substantive use of SP techniques in relation to RE valuation
and its preferences. There are more studies in the developed economies, and while there
are studies conducted in the developing economies, the numbers are small (Soon &
Ahmad, 2015). Both the CV and CE have been used according to their suitability in
relation to the valuation and the design demanded by the hypothetical market and
preference situations. While most studies focus on WTP, many studies have also
elicited WTA compensation, especially with respect to the acceptance of RETs by local
communities (Dimitropoulos & Kontoleon, 2009; Groothuis, Groothuis, & Whitehead,
2008; Hanley & Nevin, 1999). Most CV studies use open-ended and dichotomous
choice formats (Herbes, Friege, Baldo, & Mueller, 2015; Soon & Ahmad, 2015), and
often additions to the monthly electricity bill as the payment vehicle, with a few
divergences such as the increase in yearly income tax (Kim, 2015). CE studies are not
always strictly conducted to estimate values. However, such studies have used implicit
marginal substitution parameters to estimate marginal costs and benefits, despite not
using the price attributes explicitly. A few studies have also used contingent ranking
(Álvarez-Farizo & Hanley, 2002; Johnson & Desvousges, 1997), conjoint analysis
(Álvarez-Farizo & Hanley, 2002) and contingent behaviour (An, Lupi, Liu, Linderman,
& Huang, 2002). Solar PV is the most preferred and studied source of RE followed by
wind, biomass/biogas and hydro. This may be because technically solar is not much
restrained by availability and intermittency, and has comparatively low social welfare
loss in relation to environmental aspects (Herbes et al., 2015; Radmehr, Willis, &
Kenechi, 2014; Ruokamo, 2016; Salm, Hille, & Wüstenhagen, 2016).
99
5.4.1 Developed countries
The literature has increasingly emphasised the local impacts of RE generation as well as
local ownerships and participation (Botelho, Pinto, Lourenço-Gomes, Valente, & Sousa,
2016; Brennan & Van Rensburg, 2016; Carattini, Baranzini, Thalmann, Varone, &
Vöhringer, 2017; García, Cherry, Kallbekken, & Torvanger, 2016; Tabi &
Wüstenhagen, 2017; Vazquez & Iglesias, 2015). Tabi and Wüstenhagen (2017) state
that this development in scholarship is important because it addresses the current
challenges which needs to shift from a valuation only scenario to shifting the energy
paradigm towards democratisation, and towards obtaining a “social license for clean
energy deployment”, with the continuing maturity of RETs. The studies show that the
social, economic and environmental issues trade-off differently with different levels of
participation and ownership. The studies show that while the local residents are willing
to pay for the global benefits of RE, they are sensitive to the local impacts of RETs
development, especially hydro power (Aravena, Martinsson, & Scarpa, 2014;
Klinglmair & Gilbert Bliem, 2012; Tabi & Wüstenhagen, 2017)91. Respondents have
low preference for projects that impact the landscape or results in loss of nature92, but
are also willing to pay extra for environmental amenities such as for recreation
(Klinglmair & Gilbert Bliem, 2012). Further, while Botelho et al. (2016) found that the
local residents acknowledge the welfare losses differently depending on the type,
location, size and operation of the facilities93, respondents in general show a varying
degree of Not In My Backyard effect (Botelho et al., 2016; Gomez, Salgado, Vasquez,
& Chavez, 2014; Vazquez & Iglesias, 2015).
However, local residents are ready to make trade-offs in relation to the economic
opportunities, when such attributes are expressed clearly. Vazquez and Iglesias (2015)
in a WTA CE study of a tidal wave farm project in Spain found that the jobs creation
and tourism benefits outweighed the environmental costs, representing considerable
saving of over 70% in the annual energy expenditure for local households. Bergmann,
Colombo, and Hanley (2008); Bergmann, Hanley, and Wright (2006) found that the
91 Respondents preferred off-shore wind to on-shore wind due to impact on landscape (Aravena et al.,
2014). 92 García et al. (2016) found that about 35% of losses corresponded to non-use values. 93 The WTA compensation estimate as a portion of the monthly electricity bill, was highest with wind at
50% of the electricity bill.q

100
economic job creation is more important for rural than urban respondents. Further, Ek
and Matti (2015) in a CE study for a large wind power in Sweden found that different
groups value the socio-environmental and economic impact differently. Respondents
seeking private utility valued more the local environment and social practice (number of
birds and reindeer hunting) while the respondents seeking social responsiveness, valued
more the economic aspects such as job creation.
Recent studies have further studied the impact of alternative compensation mechanisms
like direct income generation potential compared to jobs creation and other economic
benefits. Some studies suggest that personal income possibilities enhance the
acceptance of RETs, depending on the ownership type, source of income, and
characteristics of the projects. Tabi and Wüstenhagen (2017) in a CE study to
understand the acceptance of hydro power from a representative sample of the Swiss
population found that the respondents did not consider jobs and water tax (paid as
dividend to the local council) as significant over environmental impacts of hydro power,
but analysis suggests that they would have considered it highly if the water tax was
distributed as personal income for the respondents. In contrast, Brennan and Van
Rensburg (2016) in a CE WTA study to measure the effect of wind farm externalities on
local residents in Ireland found that the majority of respondents were willing to make
(monetary) trade-offs to allow for wind power initiatives and that respondents require
less compensation if provision is made for a community representative and wind farm
distance is increased. Similarly, García et al. (2016) in a CE WTA study for
hypothetical wind farm acceptance in Norway found that the local residents prefer to
receive public compensation than private compensation, even if the public
compensation is lower than private compensation.
Salm et al. (2016) further underline the low level of citizens’ ownership of RE
generation, and expects increased ownership through financial participation to result in
a double dividend, in terms of social/environmental acceptance and closing the
investment gap94. Salm et al. (2016) in a CE study of 1,041 potential renewable energy
investors in Germany revealed that while return on investment is important, other
attributes, such as whether the investment is offered by a municipal utility or energy
cooperative rather than a financial institution, also influence investor choices. The study
94Citizens own nearly half the renewable energy generation capacity in Germany and have been important
drivers of the country's energy transition (Salm et al., 2016).

101
identified two distinct segments. One group required higher rates of return with less
pronounced preferences for attributes such as partner or project location, while the other
group had a strong aversion to financial investors and were willing to forego some
returns for participating in local projects.
The studies show that the respondent’s acceptance increases with the potential of
compensation and income generation from the process of RETs development, and
consumers are willing to invest in RETs to benefit economically from the RETs
promotion. This aspect is important for this study because of potential distribution of
carbon revenues as income for the consumers who are ready to invest in energy access
technologies. This is also important in the context that in the developing countries,
energy access technologies have comparatively higher socio-economic and
environmental acceptance in that the technologies do not have to face protests due to
issues such as the Not In My Backyard (NIMBY) effect.
Besides considering participation and ownership issues as above, the traditional
valuation studies in the developed economies have been driven by the policy goals of
GHG emissions reductions, and increasing RE in the energy mix95, primarily in the
electric grid96. Studies have found that average consumers have declining preference for
nuclear energy in countries with higher nuclear energy use such as South Korea, USA
and Japan with significant WTP for RE mix, especially after the Fukushima crisis (Lim,
Lim, & Yoo, 2014; Murakami, Ida, Tanaka, & Friedman, 2015). Further, (Yang et al.,
2015) in a CE study with a representative sample of the Danish population found that
the energy security concerns also trade-off between clean options, where they found that
consumers preferred RE from mixed sources rather than hydro because of the perceived
risks of imported hydroelectricity from Norway. Tabi and Wüstenhagen (2017) found a
similar perceived result with respondents in Switzerland opting for local ownership of
hydro power, compared to regional and foreign ownership. This shows that the
consumers weigh-up the energy security concerns and prefer RE resources with local
ownership. This is relevant to this study since the energy access technologies are local,
95 The policy drivers for valuation include longer term goals like being a fossil fuel free nation by 2050 in
Denmark (Yang, Solgaard, & Haider, 2015), and policy directives for renewable portfolio and renewable
fuel standards such as in South Korea (Huh, Lee, & Shin, 2015). 96 A few valuation studies have also studied increasing the energy mix in transportation and heating
applications.

102
for which the consumers could have comparatively higher marginal WTP than say for
imported LPG.
WTP values for RE vary considerably. Soon and Ahmad (2015) found through a
random-effect meta-analytic approach a summary WTP estimate of US $7.16, as the
premium that the households are willing to pay on top of the existing monthly
electricity payments. They found little correlation of the types of RES on WTP.
However, metropolitan and North American households have higher WTP than their
rural and Asian Counterparts. Some studies have estimated very high figures of as much
as US $85 additional per month (Park, Jung, Kim, & Lee, 2016), which may be due to
the real nature of insecurity with the nuclear and fossil fuels, combined with a higher
portion of their contribution to the base load. On the contrary, Kim, Park, and Yoo
(2016) in a study on the mix of 2% biogas in conventional gas, found a WTP of US $2.5
yearly for the next 10 years, which is a very low value comparatively97. Herbes et al.
(2015)98 found that most studies that estimated WTP as a percentage premium over a
conventional energy mix located the monthly WTP premium between 3% and 19%,
with outliers at 30% and above. Therefore, studies show that both methodological and
exogenous factors influence consumers' WTP which makes it difficult to extract explicit
RE premiums from past research. The methodological issues such as sampling designs,
valuation techniques, scenarios presented, attributes and attribute levels, and types of
RE as well as exogenous factors such as sample characteristics, products and schemes
presented, locations in different countries, in different time scales, with divergent
energy policies, value systems and environmental literacies, affect the WTP estimates.
In this context, studies have used new insights and mechanism to understand the true
WTP, such as the neuro-pricing analysis99 (Herbes et al., 2015), and price vectors100
97 Many WTP studies do not publish or estimate WTP as a percentage premium over a conventional
energy mix, the only premium formulation that generalises across markets. 98 Yang et al. (2015) however points out that while many studies use the premium approach, since
purchasing electricity is low-involvement and non-routine behaviour, consumers desire a total price for
the product instead of a premium or a stable price. 99 In a neuro-pricing experiment using brain signals, higher WTPs were observed than the explicitly
stated WTPs. This is apparently because neuro-pricing avoids the effects of strategic behaviour. As brain
scans exclude any form of socially desirable or strategic behaviour, there is no contingency bias to be
accounted for, so the results become more robust. The stated premium averaged 18.5% and 16.6% for the
solar PV and mixed products respectively, which is at the higher end of the reported WTP from various
RE studies (Herbes et al., 2015). 100 The study results showed that there are no significant differences in most of the marginal WTP
estimates due to the direction of change in the price vector. This means that there are no disparities in
WTP values because individuals’ value gains and losses expressed as price changes from current level
equally, and therefore we find more support to neoclassical theory compared to prospect theory. Further,

103
(Aravena et al., 2014), as part of the WTP experimentation process. Further, various
studies suggest cautious implementation of the study results, due to a fairly large
number of protest and/or zero responses, and opt outs, as large as 50% of the total
responses in some cases (Ek & Matti, 2015; Huh et al., 2015; Lim et al., 2014; Soon &
Ahmad, 2015).
However, WTP is impacted by genuine underlying empirical effects related to increased
information and awareness (Huh et al., 2015; C.-Y. Lee & Heo, 2016), and in some
cases respondents are willing to pay more even though they are paying some of the
highest costs for electricity (Herbes et al., 2015; Yang et al., 2015). Nevertheless, it has
also been shown that consumers who are value seeking and green are willing to pay
more, compared to price sensitive consumers (Yang et al., 2015). Therefore, price
sensitive consumers, especially low income consumers may require additional
incentives. In this context, Carattini et al. (2017) conducted a generic but interesting CE
study on the impact of effective information dissemination in relation to the recycling of
a carbon tax, in the immediate aftermath of the rejection of a proposed carbon tax by
92% of Swiss population. The CE attributes and levels were designed from the general
equilibrium model results of social, economic and environmental impacts at different
tax rates and alternative use of revenues. The study revealed that respondents approve
revenue-neutral carbon tax designs provided that the redistribution is progressive, and
its distributional effects are explained to the public. This finding corroborates the
findings as in Chapter 3 of this Literature Review. Further, the study also found that the
environmental earmarking of the revenue is not necessary, if information on the
environmental effectiveness of the proposed carbon tax, such as in terms of GHG
reduction is provided.
Therefore, while consumers in general are willing to pay more for RE, the literature
emphasises the potential for differing value estimates due to multiple factors, which
might be mitigated with proper information dissemination and correct design to obtain
reliable value estimates. Further, the literature indicates that the price sensitive, low
income consumers may not be willing to pay more for RE, while progressive revenue
the results show that the exclusion of the price vector also results in no significant differences in marginal
estimates between the non-monetary attributes across treatments. However, model estimates obtained
from the experiment without a price vector showed a better fit and higher efficiency. This could be
because of the lower cognitive burden on respondents for not having to evaluate the price vector, and
therefore a lower incentive to engage in strategic behaviour.

104
recycling concepts could lead to increased acceptance, and WTP for RE. This finding is
important in the context of this study in relation to designing the study with focus on
information dissemination, and due to the need of a progressive revenue recycling
through direct lump-sum revenue transfer, proposed for this study. However, it must be
acknowledged that transferring these developed country results to the Nepalese context,
requires some caution.
5.4.2 Developing countries
So far, existing generic micro-level studies of energy access have largely focused on
qualitative and cross-sectional cost-benefit analysis and simple linear regression of fuel
substitution and technology adoption (Heltberg, 2004; L. Jiang, O'Neill, & C., 2004;
Karekezi, 2002; Kowsari & Zerriffi, 2011; Lewis & Pattanayak, 2012; Malla, Bruce,
Bates, & Rehfuess, 2011; Palit & Chaurey, 2011; Peter, Ramaseshan, & Nayar, 2002;
Pohekara, Kumar, & Ramachandrana, 2004), and the use of SP in RE related valuation
in the developing economies is limited. In a quantitative analysis of CV studies based
on the comprehensive references by Carson (2012), Biller et al. (2006) found only five
energy related valuation studies for developing countries101. The recent literature shows
that the number of SP studies is increasing, and the number of CV studies is more than
CE studies. The literature show that both CV and CE are used within the context of
Theory of Planned Behaviour (Mitchell & Carson, 1989), and while some have used it
explicitly (Chan, Oerlemans, & Volschenk; Liu, Wang, & Mol, 2013), it is otherwise
implied in most studies through understanding of the attitude and socio-psychological
view, along with the socio-demographic characteristics of the respondents. Table 5-7
and Table 5-8 shows some recent literature on CV and CE studies conducted in the
developing countries. China and Sub-Sahara are in the forefront, with a balanced spread
of rural and urban studies, and CV is used more in the urban dimension for valuation
related to electricity consumption, while CE is used more in the rural context in relation
to clean cooking technologies and services. Some of the studies have also used the non-
parametric Turnbull estimator to estimate the lower bound WTP values (Abdullah &
Jeanty, 2011; Guo et al., 2014). However, while most CE studies have used price and
cost attributes, the WTP are not always estimated.
101 Out of 5571 studies, Biller et al. (2006) identified 250 studies in developing countries and 992 studies
in developed countries used distinctively for valuation purpose, while the rest analysed the theoretical
issues related to methodology and estimators.

105
While there are not many CV WTP studies with respect to adoption of improved
cookstoves, comprehensive field experiments, especially randomised controlled trials,
are being carried in developing Africa and Asia to understand the ICS adoption
(Beltramo, Blalock, Levine, & Simons, 2015; Hanna, Duflo, & Greenstone, 2016;
Pattanayak et al., 2019; Robinson & Baumgartner, 2011; Rosenbaum, Derby, & Dutta,
2015). Many of these studies have studied ICS WTP, and it’s financing, along with the
other factors that affect household cooking behaviours. Table 5-6 provides the list of
some of these studies. While some of the WTP designs are not as sophisticated as found
in economic valuations in state-of-the-art CV and CE studies, these studies are reviewed
given the relevance of ICS adoption with respect to the adoption of biogas as proposed
in this study. The studies found that the ICS does reduce cooking time and use of
firewood and other biomass fuels. However, the WTP estimates are generally not
sufficient to cover the full payment of the ICS stoves, and in most cases the WTP values
were less than 50% of retail prices. This is despite the cost of the ICS being relatively
cheaper than other means such as biogas, LPG and electric cooking stoves. However,
the literature shows that different sales offers, especially those that ease budget
constraints, increase the probability of purchases significantly (Beltramo et al., 2015;
Cundale et al., 2017; Levine, Beltramo, Blalock, Cotterman, & Simons, 2018;
Rosenbaum et al., 2015).
An experimental study conducted in rural Uganda to test the effect of time payments on
WTP for fuel-efficient cookstoves, Beltramo et al. (2015) through a Vickery auction
process, found that allowing consumers to pay in four equal payments over 4 weeks
raised the adoption significantly by about 40%, compared to a lump sum payment
within a week. In this study, 5% of participants bid the full market price. Further,
Levine et al. (2018) conducted a study of experimental sales offers in both urban and
rural settings in Uganda. In this study, it was also found that the time payments
significantly increased the sales in both the urban and rural settings. In an urban setting,
the uptake of fuel-efficient stoves increased from 4% for a cash-and-carry offer (similar
to a retail setting with a posted price) to 46% for a free trial and four equal weekly time
payments. Similarly, in a rural setting, the sales increased from 5% for a cash-and-carry
offer to 57% for the free trial plus time payments offer. In both the cases, defaults were
also low, with up to 99% of the stove sales price recovered.

Paper Country/Region Stove Type Format Values
(Levine et al., 2018) Uganda/Kampala,
Urban (1863 HHs)
Uganda/Mbarara
Rural (1404 HHs)
Ugastove
Envirofit
G3300
Stated fixed
price and BDM
procedure
Village Sales
Meeting
Retail price of US $ 20, subsidised price of US $6, $8, $10 for three
types offered, 4% accepted the cash & carry offer, 29% accepted the
free-trial offer, 26% accepted the time payment offer, 46% accepted
the free-trial and time payment offer
Retail price of US $35, subsidised price US $16, 5% accepted the cash
& carry offer, 57% accepted the free-trial and time payment offer
(Cundale et al.,
2017)
Malawi/ Chilumba ,
Rural (100 HHs)
Philips
HD4012
OE Retail price of US $65, the median WTP estimate was US $10. The
treatment group’s WTP was US $26.06 compared to the control
group’s WTP of US $16.42.
(Lambe &
Senyagwa, 2015)
Nairobi/Kibera,
Urban Slum, (26
HHs)
Jiko,
Charcoal
Stove
DC with a
single value
option
In total, 10 households (38%) said that they would be willing to pay
US $30 (retail price) for a highly efficient charcoal cookstoves.
(Rosenbaum et al.,
2015)
Bangladesh, Rural
(120 HHs)
Eco Chula,
Prakti,
Envirofit,
EcoZoom,
and
Greenway
Vickery
Auction
One half to one quarter of the market value of US $19 to US $54 for 5
different ICS in five groups.
(Beltramo et al.,
2015)
Uganda/Mbarara,
Rural (2292 HHs)
Envirofit
G3300
Vickery
Auction
Retail price of US $19, the average bids were US $4.86 and US $6.83
for the pay within a week and time payments auction. The average
winning bid was US $15.78 and US $23.03, while the second price
Table 5-6: Summary Literature on WTP for ICS

107
paid was US $12.87 and US $16.78 for the pay within a week and
time payments auctions, respectively.
(Adkins, Tyler,
Wang, Siriri, &
Modi, 2010)
Uganda/Ruhiira (30
HHs) & Tanzania/,
Rural (30 HHs)
Ugastove,
StoveTec,
Envirofit &
Advent
OE Retail Price, US $20-35, at US $10, almost 40% (Ugastove) - 60%
(StoveTec) of respondents were willing to purchase the stoves
All the studies reviewed found that the WTP estimates were lower than the retail price,
and the sales offer including payments in instalments helped to increase WTP estimates
slightly (Beltramo et al., 2015), but increases the adoption rate substantially (Beltramo
et al., 2015; Levine et al., 2018). However, in a design-led ethnographic study
conducted by Lambe and Senyagwa (2015) in Kibera, the largest urban slum in Africa,
with 26 sampled households, when households were asked about their WTP the full
retail price (US $30) for a 50% fuel efficient stove, all the households indicated positive
WTP of the full retail price provided that they could pay in instalments. This was
considered possible because many of the households were already involved in savings-
groups, and also indicated an opportunity to take loans from friends and family. Further,
the study found that in cases where fuel expenditure had not been discussed earlier
during the interview, households were more unwilling to pay, and when the WTP
question was asked in the context of fuel expenditure, the respondent was more likely to
express a WTP of the retail price. The 26 respondents had never heard about a fuel
efficient stove prior to the study. Overall these findings suggest the importance of
investigating not just WTP for alternative technologies, but finance options.
Lastly, studies have demonstrated that ICS stoves are often an insufficient replacement
for traditional stoves. Rosenbaum et al. (2015) found a dramatic decrease in the use of
the ICS from Day 3 to Day 21 because the participants resented having to chop wood
into small pieces, and having to continuously sit by the stove and add wood rather than
being able to multitask which is possible with traditional stoves. Further, households
often cook on more than one fire per meal, but are able to afford only one ICS (Adkins
et al., 2010). Consequently, experimental studies have found that households continue
to use traditional stoves, together with the ICS (Pattanayak et al., 2019), and many have
subsequently stopped using the ICS over time (Hanna et al., 2016). In summary, this
shows that the ICS impacts can be contextual, where households may use the stoves
irregularly and inappropriately, may fail to maintain them, and usage can decline with
time, suggesting a need to investigate other alternatives such as biogas stoves.
Other CV studies in developing country contexts have focused on electricity
connection, improvement in electricity supply, and inclusion of RE in the energy mix
(see Table 5-7). The studies reveal that rural respondents WTP values are higher for
new connections (Abdullah & Jeanty, 2011; Manning & Loomis, 2016), compared to
generic RE mix or improvement in electricity reliability. Manning and Loomis (2016)

109
estimated rural households’ values for new electricity connection through a community
grid using payment card together with a

Paper Country/Region Modelling Format Values
(Abdullah &
Jeanty, 2011)
Kenya/ Kisumu,
Rural, (200 HHs)
Interval data
Logit*
DBDC Grid connection US $12.92 & Solar PV US $10.15 per month
(Liu et al., 2013) China/ Shandong,
Rural (212 HHs)
Logit PC as % range 10% increase in yearly electricity cost for renewable energy
development
(Manning et al.,
2015)
Rwanda/Muhanga,
Rural (200 HHs)
Interval
regression
and random
effect
PC with
contingent
behaviour
Electricity connection US $0.19 to 0.97 (fixed supply) US $6.90 to
17.56 (flexible supply) per month
(L. Zhang & Wu,
2012)
China/Jiangsu,
Urban (1188 HHs)
MNL PC US $1.15 to 1.51 per month for green electricity development
(Guo et al., 2014) China/Beijing,
Urban (700 HHs)
Logit SBDC US $3.3 per month premium for increasing renewable energy mix to
6%
(Chan et al., 2015) South Africa, Urban
(890 PG students)
Tobit DBDC and OE US $3.75 & 13.75 per month premium for electricity from renewable
sources
(Ren, Che, Yang, &
Tao, 2016)
China/Shanghai,
Urban (748 HHs)
Logit DC – WTA WTA estimate not provided.
(Taale &
Kyeremeh, 2016)
Ghana/Cape Coast,
Urban (958 HHs)
Tobit OE US $3.42 per month premium for reliable electricity
Table 5-7: Summary Literature using CV in the context of RE in developing countries

111
(Osiolo, 2017) Kenya/Generic
(3665 HHs, 1669
SMEs)
Probit OE Quality levy - US $6.53, 3.85 & $ 6.34 for fuelwood, charcoal,
electricity
US $355.92 for electricity
(Ghosh, Goyal,
Rommel, &
Sagebiel, 2017)
India, Hyderabad
Urban (260 SMEs)
Probit DBDC 20% premium on existing bill for reliable electricity

contingent behaviour model in two villages in Rwanda, and found that the WTP was
much higher for flexible supply compared to a fixed supply of electricity. The fixed
supply is where electricity is considered as a public good and where respondents can
use a fixed quantity of electricity for a fixed number of hours (e.g. evening), and the
flexible supply is considered as a private good, where respondents can use electricity
continually like a grid supply, with cost per unit of consumption. Further, Abdullah and
Jeanty (2011) also found high WTP for solar PV systems, which provide a fixed
quantity of electricity for private lighting, but allow the flexibility of use at any time
during daylight hours, especially for other purposes such as mobile charging. The study
results suggest that higher benefits due to flexible use with private consumption may
justify paying higher costs for electricity. This is because of higher shadow values and
opportunity costs otherwise associated with the existing energy use pattern such as
travelling long distances to charge mobile phones or collect firewood. This aspect may
be further impacted by opportunities to start small businesses and enterprises (Manning
& Loomis, 2016).
Further, both CV and CE are used to value and understand the preferences for a reliable
supply of electricity. An et al. (2002) and Abdullah and Mariel (2010) studied the rural
context, with An et al. (2002) specifically focusing on cooking in China, while Taale
and Kyeremeh (2016) and Ghosh et al. (2017) studied the urban context, with Ghosh et
al. (2017) specifically focusing on small firms in India. The findings show that
electricity is a composite product with voltage, frequency, and duration of outages and
their interaction being significantly important parameters for WTP extra for reliability.
In a Kenyan context, Abdullah and Mariel (2010) found that there was no trade-off
between the private and public distribution of electricity, and found that respondents
who are engaged in farming and who have bank accounts have higher WTP. This
showed that higher income groups or those who seek to benefit from reliable electricity
supply value electricity more than their counterparts. An et al. (2002) found that reliable
electricity demand is more price sensitive at lower prices than higher prices, and found
that the households located farther from the forests were more likely to switch than the
others. Further, Taale and Kyeremeh (2016) found that urban residents are willing to
pay a premium of approximately US $3.42 per month for reliability, which is
approximately 44% more than the mean monthly electricity bill, and Ghosh et al. (2017)
estimated a WTP premium of 1.78 to 3.09 US cents per unit, which are approximately
20% of the average tariff that firms paid during the survey period. Further, in a generic

113
study including both rural and urban respondents in Kenya, Osiolo (2017) also found
significant WTP for improving the quality of the fuel types, with values of US$6.53,
3.85 and 6.34 for improved firewood, charcoal, and electricity respectively, and US $
355.92 by enterprises for improved electricity. The values were estimated as a one-time
quality levy, and therefore could have been comparatively higher compared to monthly
premium estimates. All of the studies indicated that income affects the WTP for
electricity reliability significantly, either explicitly through the income variable, or
implied in terms of proxies such as the farm size and business ownership (Abdullah &
Mariel, 2010; Taale & Kyeremeh, 2016). Further, planned power outages and
information on such outages was found to be important for both the rural and urban
consumers (Abdullah & Mariel; Taale & Kyeremeh, 2016), as well as the enterprises
(Ghosh et al., 2017). Osiolo (2017) and Ghosh et al. (2017) found that type of
enterprises such as manufacturing, number of employees, and enterprises with higher
production hours and back-up power expressed higher WTP for reliability in electricity
supply. Taale and Kyeremeh (2016) and Osiolo (2017) revealed that education and
awareness significantly affect WTP estimates, and Osiolo (2017) recommended that
education should move beyond creating awareness of the available energy sources and
technologies, by providing more depth by focusing on the energy challenges and
proposed solutions that households can abide by. The focus on challenges and proposed
solutions will be considered while designing the survey questionnaire for this study.
Another application for SP is to assess the WTP and preferences for RE additions into
the grid, such as in relation to the government RE policies (Guo et al., 2014), wherein
most cases the actual source of the electricity cannot be distinguished (Chan et al.,
2015; Guo et al.; L. Zhang & Wu, 2012). In a market segmentation study in China, L.
Zhang and Wu (2012) reported WTP range from US $1.15 to US $1.51 per month
which was found to be significant in absolute terms to be able to compensate for the
government subsidy provided to green electricity suppliers in Jiangsu province. The
study results suggest that marketing companies should focus on market segmentation
and introduce a flexible multistep electricity price strategy for different consumers
because of the Veblen effect in the market, where generic green electricity was
considered a luxury good with high income households willing to pay more. Guo et al.
(2014) found a WTP premium of US $3.30 for increasing share of RE electricity to 6%
in Beijing, and revealed that the respondents were willing to pay significantly higher on
average if the payments were mandatory than voluntary. Further, they found that 53%

114
respondents revealed a participation effect whereby neighbours’ participation impacted
their respective WTP for the scheme.
Chan et al. (2015) investigated the construct validity (convergent and theoretical) of two
widely used WTP measures, Double Bound Dichotomous Choice (DBDC) and Open
Ended (OE), within the framework of the theory of planned behaviour with 890 South
African postgraduate university students. He found very different, but significant WTP
at US $3.75 (DBDC) and 13.75 (OE) premium per month, indicating a low measure of
convergent validity with different independent variables affecting the WTP values. This
result corresponds to the findings of other international studies, which reveal that WTP
values elicited by the DC technique are systematically lower as compared to the OE
technique. Chan et al. (2015) found a much higher coefficient of variation with OE, and
suggested that OE questions may be prone to strategic bias, in relation to strategic free-
riding behaviour where the respondent was aware that green electricity would be
provided on a voluntary basis. Further, differences between DC and OE formats may
have occurred due to complexity of the latter, where a cue value is not provided making
it cognitively difficult. Zhao, Cai, Li, and Ma (2018), in a rural-urban mix of
respondents, investigated the preference for electricity generated particularly from
various biomass resources, and found a premium of US $3.90 per month, nearly one-
third of the average monthly bill. The respondents preferred electricity produced from
agriculture, forestry biomass, and biogas, with least preference for waste-to-energy
facilities due to emission toxicity. All the above estimated values are lower compared to
the values revealed by the respondents in Europe and United States, but bear similarity
in the range estimated in South Korea (Guo et al., 2014).
Further, Ren et al. (2016) studied the WTA probability of the respondents living within
3 km of a real waste-to-electricity facility (Ren et al., 2016). The study found a high
proportion, 50.9%, of protest responses. They were believed to be real preferences than
any research deficiency. However, while Ren et al. (2016) concluded that they were
protesting for ethical reasons, they may still have had a need for compensation. This
was evidenced in similarities between protest respondents and non-protesters who
selected a positive WTA. The study depicts a lack of procedural and distributional
fairness, whereby results revealed that poor risk communication together with limited
education fostered protests to a certain degree. Therefore, the WTA may be similar to
the estimated mean WTA. However, proper compensation should be reached only after
effective risk communication in reducing the psychological resistance to WTA. The

115
results indicate the importance of participatory processes in RE management practice,
and the advantage of ex ante cost-benefit communication against ex post situations of
protests and ethical stances. Further, a number of WTP studies also experienced
significant negative WTP, sometimes up to 80%, especially with the use of Heckman’s
two-step model used to correct for selection bias (Ghosh et al., 2017; Osiolo, 2017).
However, the negative WTP resulted more from genuine zeros than the protest
responses. The genuine zero responses were due to low income (Manning & Loomis,
2016; Osiolo, 2017; L. Zhang & Wu, 2012), especially in rural areas, while the protest
responses resulted due to lack of proper awareness and education about RE, and its
impacts. Further, protest responses also resulted due to lack of trust in the government
institutions (Ghosh et al., 2017; Manning & Loomis, 2016; Ren et al., 2016; Taale &
Kyeremeh, 2016) in relation to the use of funds and belief in the actual provision of
services.
Some SP studies have also focused on household cooking preferences, with a higher
number of CE methods used for the purpose (See Table 5-8). The study design
parameters and attributes are based around the theory of the energy ladder and energy
stacking, the basic premises for understanding cooking choice behaviour (Masera,
Saatkamp, & Kammen, 2000). However, the studies try to provide further insights in
terms of trying to tease out socioeconomic and product-specific attributes that affect the
behavioural nuances of choice beyond the well-known impacts of income, as per the
energy ladder principle, and fuel availability and scarcity dimensions, as per the energy
stacking principle.
An important consideration to make in understanding cooking choice behaviour is that
rural households cannot afford electricity for cooking and heating because of the high
amount of energy needed, in contrast to using electricity for lighting and other
appliances, which has a much smaller effect on the household budget (An et al., 2002).
In addition, electricity supply is not satisfactory for heating and cooking purposes in
many instances, due to limited generation capacity and/or low voltage and frequent
outages, especially in winter.

Paper Country/Region Model & Design Product Attributes
(An et al., 2002) China/ Nature Reserve,
Rural (220 HHs)
Open cards, Binary
Logit
Grid electricity to switch
to cooking & heating
Monthly price per unit, voltage,
outage frequency
(Abdullah & Mariel,
2010)
Kenya/ Kisumu, Rural (202
HHs)
SPSS Orthogonal main
effect, RP Logit
Reliable grid electricity Incremental Price, provider1,
provider2, planned blackouts, outage
duration
(Mobarak et al., 2012) Bangladesh, Rural (2397
HHs)
NA NA Improved Cookstoves – fuel
efficient and chimney cookstoves –
value not presented
(van der Kroon,
Brouwer, & van
Beukering, 2014)
Kenya/Nakuru County,
Rural & Peri-urban (592
HHs)
D-efficient fractional
factorial*, RP Logit
Fuelwood, charcoal,
ethanol for cooking
Fuel cost/week, time reduction,
smoke level, environmental impact,
stove costs
(Q. Chen et al., 2016) China/Sichuan, Rural (556
HHs)
SPSS Orthogonal main
effect, ASC Logit ^
Traditional biomass,
biogas, coal, electricity
for cooking
Device usage cost/yr, energy usage
cost/yr, smoke level, safety risk
(Zhao et al., 2018) China, 22 Provinces
Rural & Urban (548 HHs)
D-efficient fractional
factorial**, Mixed Logit
Biomass based electricity
to replace coal-fired
electricity
CO2 reduction, acid rain reduction,
haze, emissions toxicity, price
Premium/ month
(US $ 3.9 premium per month)
*Sawtooth software **Ngene software
Table 5-8: Summary Literature using CE in the context of RE in developing countries

Takama, Tsephel, and Johnson (2012) studied preferences of urban residents of Adis
Ababa with the attributes designed on a market analysis of fuel wood, ethanol and
kerosene stoves. They considered three wealth groups: high, medium and low. The
study found that low income households were more sensitive to stove price and
usage/operational cost than higher income groups. Moreover, the higher income groups
were willing to pay considerably more for reductions in smoke and increased safety,
while due to their price sensitivity, lower income households were not averse to using
smoky fuel/stoves. The results were found to be broadly consistent with the energy
ladder theory. However, van der Kroon et al. (2014) did not find these kinds of
preferences across households in a similar study carried out in Kenya. They did not
detect significant differences in preference between charcoal and ethanol stoves.
Instead, they found that the charcoal and ethanol would more likely function as
additional fuels, in line with the current energy stacking behaviour. Further, the results
showed that not only did the prices and usage cost play a significant role in choice
behaviour, but also the households’ internal and external decision environment. The
external decision environment was mainly driven by the market context, and less by
biomass scarcity or abundance. The results confirmed the study hypothesis that the fuel-
stove alternatives were valued highest in the peri-urban location, and least in the rural
locations where people had adapted to the relative scarcity of firewood by exploiting
their farmland resources. But, in locations with firewood markets, most households
sourced firewood from the market, suggesting that the presence of market structures and
pricing fire wood are important drivers for clean cook stove adoption. The study of the
internal decision environment revealed the financial decision making privileges of men.
Nevertheless, men valued the clean stove alternatives, even though the kitchen remained
a women’s domain.
A further exploration with respect to the choice of stove/fuel for cooking was analysed
by Q. Chen et al. (2016). The study carried out in rural China used both the CE and a
RP method. The RP asked the respondents their choice of cooking alternatives, the
attributes of which were used for the CE. The results found that household fuel
switching is not a simple unidirectional process, and while households prefer to use
fuels with lower cost, higher safety and lower indoor air pollution, household fuel
choice is affected by interactions among these and other multiple factors. The pooled
RP data results showed a preference shift from biomass energy (traditional solid
biomass energy and biogas) to commercial energy (coal and electricity) with increase in

118
income level. Further, interestingly, the CE data analysis indicated that households have
potential preferences for coal over other types, biogas and electricity, for cooking. The
findings indicated that compared to the households from hilly areas, households located
in mountainous areas were more likely to use traditional biomass energy (firewood,
straw) and less likely to use modern fuels (biogas and electricity), whilst households
living in plains areas were less likely to use traditional biomass energy.
While the above studies do not specifically focus on the RE credit financing, in terms of
either valuation or attribute preferences, Abdullah and Jeanty (2011) attempted the
valuation through a monthly payment scheme for solar PV systems and grid connection
in comparison to a lump-sum payment, and found that people prefer a monthly
payment. This implies a preference for linking RET adoption with frequent payments
such as either hire purchase or bank/micro credit. They recommend providing one-third
of the connection cost through a smart subsidy provision, which could be on a
decreasing scale relative to the increasing household income level. Further, the study
proposes establishing appropriate financial services for increasing electricity
connection, since the commercial loans cater only to high income customers and the
micro-finance is not available to first-time users. The study also suggests that the higher
WTP and the higher implied discount rates for both PV and grid connection constitute
potential for long-term finance instead of upfront payments.
Mobarak et al. (2012) used a combination of stated preference, revealed preference, and
an actual experiment to understand the preference for improved cook-stoves in rural
Bangladesh102. The SP was used to understand the perception of the health impact
caused by indoor smoke, and a ranking analysis is also used to understand how the
respondents value the different attributes of improved cookstoves. The result shows that
the clear majority of respondents (94%) believed that indoor smoke is harmful, but the
majority also correctly believed that indoor smoke is less harmful than polluted water
and spoiled food. Further, the ranking analysis showed that only 9% valued the attribute
of smoke reduction as the most valuable, and many (47%) valued the ability of
cookstoves to reduce fuel costs as their most valuable characteristic103. This showed that
102 However, the CV results are not presented. 103 Although only ∼35% of respondents reported spending money on fuelwood, there is significant time
cost associated with collecting fuel, so even those who report not spending money may value the time
saved in accessing firewood, and its implied health effects.

119
household budgetary constraints were more important in cook-stove decision making
than health benefits. This aspect of decision making was also evident through a
hypothetical cash transfer RP experiment, where households were found to be more
price sensitive for improved cookstoves compared to other services such as regular
doctor visits, better schools, and improved road facilities. This result was expected, and
corroborates finding from the above SP studies which show that respondents are more
price sensitive to RETs, especially in relation to cooking. Mobarak et al. (2012) further
conducted a final real purchase experiment between a fuel-efficient stove and smoke-
efficient cookstove, and found low orders at full prices of 23% and 31%, respectively.
However, the orders increased by up to 25% when 50% subsidies were assigned
randomly. But, the actual purchase rate was low. The purchase without the subsidy was
at 5% for fuel-efficient cookstoves and 2% for smoke-efficient cookstoves. The subsidy
provision raised the purchase of fuel-efficient cookstove by 8-12 percentage points and
smoke-efficient cookstove purchases by 5-6 percentage points. The results found that
the refusal to purchase rates were highly correlated with cookstove price suggesting
households faced liquidity constraints, and most households refused to take delivery and
stated their lack of cash as the primary reason.
5.5 Discussion and Conclusion
The literature shows that the number of studies using SP methods is increasing in the
developing countries, following a similar trend of application as in the developed
countries. Further, its use is important in the context that the methods introduce a
participatory process to understand citizens’ preferences and valuation parameters on
diverse development needs such as health services and drinking water, which constitute
the basic needs for the majority. In the developing countries, this aspect together with
the proper allocation of costs and benefits is important since such participatory
processes are not always the norm. Many decisions are still made based on experts’
advice and a top-down development approach, and pseudo-participatory processes can
most often be customary rituals. However, the literature also indicates that many SP
studies conducted in developing countries are not sufficiently robust, and therefore care
may be taken, especially in relation to introducing mechanisms to test the WTP values,
and effects of cognitive bias and misspecifications. Further, the literature emphasises
the limitations of benefit transfer approaches in relation to cultural, temporal and spatial
differences between policy sites. The lack of proper market structures, and the low level
of rural inclusion in the overall market structure, with increased reliance on subsidies

120
together with high information asymmetry can lead to revealed preferences from the
existing markets which may not always be reflective of true underlying values.
The review of studies on the WTP and purchase of ICS shows that flexible sales offers
and easing of liquidity constraints, can enhance consumers’ WTP for stoves even at
market prices. Thus, unless transaction costs are very high, it could be suggested that
any subsidy available should be used first to cover the transaction costs to reduce the
market constraints for successful stove adoption over time before they are used to
reduce the purchase price. Thus, broad dissemination of cookstoves will require
reducing the transaction costs of extending credit and payments over time. It is possible
that vendor financed time payment models, mobile phone payments, switching to
layaway systems where consumers make some early payments, linking with
microfinance or other agent-based models where regular payments are already
collected, can reduce transaction costs substantially. More innovation and testing are
required to identify effective business models in different settings. Further, the literature
shows that despite adoption, use of ICS has not sustained to result in expected
development benefits. One of the possible reasons may be because ICS do not totally do
away with the firewood requirement since it is not a fuel switch but an improvement on
the existing practice, and therefore any setbacks can cause households to revert back to
the practices of using traditional stoves. Comparative studies show that consumers
aspire to switch to technology attributes that LPG and electric stoves possess when
market failures are corrected. Therefore, adoption of ICS has to be looked at within the
framework of energy ladder and energy stacking practices and what factors can actually
switch the households towards better technology and fuel choices.
The RE studies in the developed economies show an increasing trend of studies valuing
RETs and projects in relation to local socio-economic and environmental impacts.
Recent studies show that the economic benefits can trade-off positively in relation to
local environmental and cultural benefits in general, and further economic benefits
depend on how they are rendered, such as through public and/or private institutions.
Further, the literature shows that the economic benefits such as through jobs creation,
cash compensation and ownership types trade-off differently. However, communities
prefer lump-sum transfers from a carbon tax, earnings through feed-in-tariffs, and
financial participation such as through capital investment. The studies have attempted to
analyse scales and depth of participation and subsequent benefit allocation, in order to
understand the potential of RE viability and growth. This aspect is important as it allows

121
promotion of RE from a proper sustainability perspective through a cycle of
participation that allows for economic prosperity as well as social and environmental
integrity. The literature shows that the lack of such participation can lead to less than
optimal results, especially when the technology is not fully developed such as with
urban waste-to-energy. The communities being studied can express ethical reservations
against such projects.
The majority of the studies in the developed countries focus on valuing electricity
through a mix of RE. A primary driver for WTP for such electricity is the perceived
energy security situation as well as generic objectives of GHG reductions. There are
fewer studies in relation to fuel mix or substitution in household cooking, transportation
and heating applications. The studies in the developing countries are varied and focus
on specific issues such as new electricity connection or improvement in the reliability of
electricity supply. The studies suggest that the rural households in developing countries
are willing to pay a significant amount for new electricity connections, especially for
flexible use of electricity. It is interesting to note that some of these values are higher
than what consumers in developed countries are willing to pay for RE electricity.
Similarly, small firms in developing countries are willing to pay substantial premiums
per month for improvement in electricity. Further, both the rural and urban households,
have positive WTP for increasing the RE mix in their electricity supply, but this WTP is
less than in most developed countries. However, a significant number of households
also expressed an inability to pay due to low income. While an individual’s income
level is positively related to their WTP for electricity connection and improvement in
reliability, the studies show that the implied income through savings in back-up fuels,
use of electricity in income generating activities and enterprises are important
considerations. Further, most of the studies expressed that proper and transparent
education, awareness, and information dissemination are key to increased acceptance
and promotion of RE, irrespective of the household and location parameters.
There are sizeable numbers of studies focusing on household cooking. Most household
cooking related studies focus on valuing the attributes of cooking technology and fuels
with electricity being considered in only a few studies. With respect to firewood, results
indicate that households value the reduction in cost and time more than the health
benefits, especially in the context when the firewood is priced. The households show a
mix of behaviour predicted by both the theories of energy ladder and energy stacking.
Therefore, income is not the only factor affecting the switch in fuels and stove types,

122
but other socio-economic dimension of energy use, availability and scarcity, also affect
the households’ cooking preferences.
The literature shows that market-based incentives and household internal environments
are important in cooking fuel choices. In many cases, forests are managed by local
communities and pricing of fuel wood104 may not be an option. Therefore, in order to
switch, other credible incentives may be required. Budget constraints and low income,
and competing demands for a limited budget, are seen as major constraints to adoption
of RE in general, expressed through higher price sensitivity for RE use among the poor.
The literature results imply that access to credits and/or subsidies can help to fill in any
gap between expressed WTP and actual real payments, and possibly would also explain
the theoretical difference between stated intentions and actual payments. However, not
many SP studies both within RE and other sectors, have attempted to understand the
impact of different credit parameters on RE adoption. At the same time, even given
increased adoption of RETs as carbon credit projects, not many studies have attempted
to understand any linkages between carbon revenues and technology adoption. In
general, the literature shows scant studies about the financing aspects considering the
fact that the upfront payments and installation cost are considered to be a major barrier
for wider RE adoption, especially in the developing countries. Most mention of
financing aspects are cursory attempts both within SP and other studies. Therefore, the
proposed study to understand the credit preferences and the WTP of the biogas plants
will be a new addition to the SP literature. The design of this study will benefit from the
findings from the literature review, specifically, in terms of inclusion of techniques to
understand the protest responses, and the elicitation formats to be used. However,
despite its significance, the literature also suggests that financial strategy alone may not
result in optimal adoption rates, as long as the technology and services marketed are not
“improved” in terms of fuel and cost savings, emission reductions, and in terms of
fulfilling changing attributes of energy demand.
104 Similarly taxing fossil fuel emissions and/or reducing energy subsidies may not be always possible.

123
PART II Research Methodology and Design
The second part of the thesis contains the details pertaining to research methodology
and design. This part is divided into three chapters: the first chapter (Chapter 6) explains
the theoretical frame of CV and CE methods, followed by a discussion of issues related
to the methods considered. The second chapter (Chapter 7) elaborates on the survey and
questionnaire design. It includes description of the survey sites, key design features of
CV and CE, and pre-test. The third chapter (Chapter 8) specifies the parametric and
non-parametric econometric frameworks of discrete choice CV and CE methods.

124
Chapter 6 Theoretical Framework and Methodological Issues
This chapter describes the theoretical framework and the methodological issues of the
CV and CE methods. The issues related to the hypothetical nature of the methods, and
the theoretical and rational inconsistencies with respect to the neoclassical
understanding are presented in this chapter.
6.1 Theoretical Framework for the Methods
6.1.1 Contingent valuation
The theoretical framework for CV method can be derived from the standard consumer
theory. The valuation in CV involves understanding consumer preferences or WTP in
relation to the difference between the baseline condition, status quo, and the proposed
condition. Following the standard economic theory, the indirect utility function, V(ˑ) of
an agent is a function of their income, 𝑌, price of the good and/or service, 𝑃, the agent’s
individual and household socio-demographic factors, 𝑆, and the change due to the
provision of good, 𝑄. As per Bateman et al. (2002), this can be written in the general
form as,
V = 𝑉(𝑌, 𝑃, 𝑆, 𝑄) (1)
Normally, a CV study assumes that the baseline condition without the CV scenario, Q0
is less desirable than the expected condition, Q1, hence
𝑉(𝑌, 𝑃, 𝑆, 𝑄1) > 𝑉(𝑌, 𝑃, 𝑆, 𝑄0 ) (2)
The approach in CV is to measure the indirect utility between the two different
conditions through the estimation of a monetary value that the respondents are WTP to
realise the change from 𝑄0 to 𝑄1. This monetary value represents the maximum value
that the households are willing to compensate for the change. It is the understanding that
while households are willing to compensate a certain amount, a higher monetary
compensation, however, would reduce their utility. The monetary compensation,𝐶, can
be represented as,
𝑉(𝑌 − 𝐶, 𝑃, 𝑆, 𝑄1) = 𝑉(𝑌, 𝑃, 𝑆, 𝑄0) (3)
The monetary value represents a compensating variation as per the standard welfare
economics (Boyle, 2003). By manipulating the equation, the compensating variation can
be further represented as a function of the other parameters in the model as C (ˑ),

125
𝐶 = 𝐶 (𝑄0, 𝑄1, 𝑃, 𝑆, 𝑌) (4)
C (ˑ) is defined as the bid or WTP function, and represents the main theoretical
framework of CV analysis. Such compensating payment cannot be more than the
household discretionary income, 𝑌𝑑 , i.e. the income that remains after the household’s
other expenditure are accounted for. This can be represented as,
𝐶 (𝑄0, 𝑄1, 𝑃, 𝑆, 𝑌) < 𝑌𝑑 (5)
Further, normally households will maintain the expected change from Q0 to Q1 as an
improvement in the condition of the household and beneficial to the household
members. However, the households may be indifferent or would not consider the
change as effective. This situation may result if the households think that such
provisions would be the responsibilities of the public entities and so households are not
willing to pay for the change. In such cases, households can opt not to pay any amount.
Thus, such a situation can be formally written as:
0 ≤ 𝐶 (𝑄0, 𝑄1, 𝑃, 𝑆, 𝑌) < 𝑌𝑑 (6)
Therefore, the WTP as per the CV is a non-negative constrained value, which is a
function of the household’s income, its socio-demographic characteristics, and the
characteristics of the change.
6.1.2 Choice experiment
The theoretical framework for CE is derived from two distinct consumer choice theories
in economics. An important anchor to CE’s implementation is the Lancaster’s
characteristics theory of value (Bateman et al., 2002), which provides a classical
consumer choice approach to concepts developed by Thurstone (1927) and Marschak
(1974) in various fields of psychology. Lancaster postulated that consumer choices are
driven by discrete commodity attributes and their levels. As such, when an
individual, 𝑛, faces a number of alternatives, 𝐽, with each alternative 𝑗 composed of a
number of attributes and their levels, the utility derived by each alternative is
represented by,
𝑈𝑛𝑗 𝑤ℎ𝑒𝑟𝑒 𝑗 = 1 𝑡𝑜 𝐽 (7)

126
The individual would choose alternative 𝑖 if the utility due to alternative 𝑖, considering
its set of attributes and their levels, is greater than the other alternative, say 𝑗, when only
two alternatives are presented to the individual. This can be expressed as,
𝑈𝑛𝑖 > 𝑈𝑛𝑗 ∀ 𝑖 ≠ 𝑗 (8)
In many situations, a consumer’s choice is subject to his/her vagaries or whim and
perception (Holmes & Adamowicz, 2003; McFadden, 1986), and may not always be
consistent as expected. This individual can also make decisions based on all possible
alternatives, other than the ones presented, which is possible considering that the utility
is known to the individual, but is unobserved by the analyst. Therefore, the researcher
may be unable to correctly set the attributes and levels. In such a situation, McFadden
suggested that the decision, or the choice, of the individual can be disaggregated as a
deterministic component (𝑉𝑛𝑗) and a random error component Ɛ𝑛𝑗, which can be
represented as,
𝑈𝑛𝑗 = 𝑉𝑛𝑗 + Ɛ𝑛𝑗 (9)
This equation represents the simplest form of the random utility theory, and is
understood to represent a more realistic behavioural approach to consumer choices as
against the pure utility theory or the consumer choice theory. The deterministic
component 𝑉𝑛𝑗 is observed by the analyst (Hensher, Rose, & Greene, 2005). The
deterministic component is representative of the decision maker and can be further
described as a function of the characteristics of the decision maker, such as,
𝑉 𝑛𝑗 = 𝑉(𝑋𝑛𝑗, 𝑆𝑛) (10)
where 𝑋𝑛𝑗 represents the alternative with the attributes, and 𝑆𝑛, represents the socio-
demographics of the individual decision maker. The error term in the random utility
model reflects the uncertainty faced by the respondent and the researcher (Holmes &
Adamowicz, 2003), and, therefore the choice predictions are not precise, due to which,
the analysis becomes one of probabilistic choice.
The probability that any individual will choose alternative 𝑖 to alternative 𝑗, can be
expressed as the probability that the utility associated with alternative 𝑖 will exceed that
associated with alternative 𝑗, and can be stated as,

127
𝑃 [(𝑉𝑛𝑖 + Ɛ𝑛𝑖) > (𝑉𝑛𝑗 + Ɛ𝑛𝑗 )] (11)
𝑂𝑟, 𝑃 [(𝑉𝑛𝑖 − 𝑉𝑛𝑗) > (Ɛ𝑛𝑗 − Ɛ𝑛𝑖)] (12)
Mathematically, the probability of choosing alternative 𝑖 over alternative 𝑗 is when the
utility due to the difference in the deterministic component of the utilities is more than
the difference in the error component of the utilities. The derivation of the estimates of
probability from the model depends on predictions of the distribution of the error terms.
The analysis typically starts with the assumption that the error terms are independently
and identically distributed (IID).
6.2 Methodological Issues - Contingent Valuation
CV is used extensively to value public and private infrastructure in the developing
countries. In this study, CV is used to understand WTP for domestic biogas digesters in
a developing country context. In this, use of CV is like the marketing studies used to
understand the purchase intentions for different levels of energy services. In marketing,
such purchase intention studies are used for existing products to understand whether to
increase or decrease production levels, whether to change the size of the sales force, and
whether to initiate a price change (Haab et al., 2013). Morwitz, Steckel, and Gupta
(2007) used meta-analysis to show the conditions under which stated purchase
intentions and actual sales corresponded closely. This occurred when the products are
existing products, durable goods, and when the time between hypothetical scenario and
real outcome is short. Further, Hausman (2012) revealed that consumers’ familiarity
with new products leads to more successful forecasts of purchase intentions of private
goods. Although CV has been used to value energy services, its use in this study is to
understand the value that respondents put on clean cooking. So far this has not been
carried out. In this context, even though the goods described would not be as abstract as
the concept of passive use, some methodological issues remain which are considered in
this section.
6.2.1 Hypothetical valuation
The CV technique is likely to overestimate “real” WTP both for public and private
goods. Both the valuations and response rates are higher when the contribution is
hypothetical than when the “expressed willingness” means an immediate cash

128
contribution (Arrow et al., 1993). Nevertheless, one large comparative study of the CV
results with estimates derived from actual markets via RP methods found that CV
estimates were on average lower than RP estimates (Hanley, Mourato, & Wright, 2001).
Also, in the case of developing countries, overall WTP estimates are low or negligible
with respect to total income and the cost of service provisions. Analysis suggests that
households have low WTP for environmental services such as cleaning up urban water
systems, conservation and beaches for recreational purposes or health services such as
vaccines, but relatively higher WTP for services for direct use such as latrines and clean
water (Whittington, 2010). Further, in this context, the results show higher WTP for
private use than public use such as piped private taps than public taps. Another reason
for higher estimates especially in the developed countries is considered the warm
glow105 effect which makes people want to pay more, because of an element of self-
approbation (Arrow et al., 1993), and results have shown this to be consistent in both
RP and real payment experiments.
Meta-analysis of lab and field studies that contain both the actual and hypothetical
estimates show hypothetical bias. This conclusion is also supported for field
experiments of private goods that include real and hypothetical elicitations (Kling et al.,
2012). Nevertheless, economic experiments have shown that respondents can be
induced to reveal their true WTP in a properly designed hypothetical situation. In such
experiments, participants are given carefully designed cues or assigned values for an
experimental good wherein their stated WTP distribution from hypothetical votes
matches the induced-value criterion in aggregate (Kling et al., 2012). Conversely, in
non-induced experiments, a consistent finding is that the stated values are higher than
their real counterparts. While such difference in valuation in a hypothetical situation is
attributed to various biases, the literature points to more instances of strategic and
enumerator bias.
Strategic Bias
Strategic bias results from gamesmanship of the respondent (Bishop & Heberlein,
1979). Perceiving that they do not have to pay, respondents may provide values which
105 “Warm glow” is understood to be one of many reasons for pro-social behaviours such as contributing
to a good cause. Also such social norms that regard others’ preferences and reciprocity can also lead
individuals to value or bid higher than the private benefits, in hypothetical as well as real settings.

129
they think will influence the supply or non-supply of a good depending upon their
preferences. In this context, if a respondent believes that the survey will be used to
decide on the ultimate provision of a good they prefer, that person will have an
incentive to report more than their true WTP in order to influence provision.
Enumerator Bias
Enumerator bias occurs when the respondent gives a WTP amount that differs from his
or her true WTP amount to either please or gain status in the eyes of the interviewer.
This is true in the case where yeah saying with respect to enumerator bias could lead to
higher WTP estimates.
6.2.2 Assuring true values – Reducing hypothetical bias
One of the conditions for truthful revelation is to use an elicitation mechanism that
discourages strategic responses, and fielding the survey in a way that encourages
respondents to believe that the study’s results could ultimately affect their well-being,
conditions known as incentive compatibility and consequentiality, respectively (Kling et
al., 2012). Meta-analysis carried out to compare hypothetical and real choices finds that
the degree of discrepancy depends on the elicitation mechanism, the value elicited and
the nature of the good as public or private, and correcting for respondent uncertainty.
The hypothetical scenario and the tendency to overstate WTP affects both passive use
and direct use aspects (Kling et al., 2012). It is important to be aware of this with
regards to the relationship with income and budget constraints, and with respect to the
substitution effect especially for pure public environmental goods (Carson &
Czajkowski, 2014).
Incentive compatibility
The need for incentive compatibility in eliciting responses from the public is not new.
Theorists have long known that departures from single-shot, binary, binding outcome
choices provide an incentive for self-interested participants to depart from selection of
their most preferred option. The last two decades have seen a much more complete
investigation into the many nuanced ways that the design features of an SP survey can
affect choices (Kling et al., 2012). Carson and Groves (2007) show that without
knowing the incentive structure of a survey, it is not possible to predict the nature of the
hypothetical bias, because economic theory of how people make choices relies on
knowing the incentives faced by the respondents. This opens a new exciting line of

130
research for applied, behavioural and experimental researchers to investigate the degree
to which the incentive properties of various question formats can reduce or increase
hypothetical bias (Haab et al., 2013). Incentives should include all the potential direct
and indirect benefits such as better health and time savings, and lifestyle benefits
(Whittington, 2010).
Consequentiality
Consequentiality is the condition where the respondent believes that the responses will
influence the outcome, and where because of this belief, the respondents devote effort to
answer the question (Kling et al., 2012). Only for such consequential surveys with well-
defined incentives can economic theory make predictions about the respondent’s
behaviour, and therefore whether one should expect hypothetical bias (Haab et al.,
2013). This means that a person will have the incentive to bid a true WTP if she
believes that such an act will influence the probability of the good being provided, and
if she desires such good to be provided. Estimates show that the economic value from
people who received a consequentiality reminder are systematically different from those
who did not, and empirical work both in the field and lab contexts, supports the
consequentiality paradigm (Haab et al., 2013). While the importance of consequentiality
is increasing, the empirical methods used to measure and control for it vary in the
literature, with mixed results, and more studies on consequentiality and incentive
compatibility are required (Haab et al., 2013). A good CV survey should be
consequential and not hypothetical, in the sense of having a policy impact, and a purely
hypothetical response is only as good as a random response (Carson & Czajkowski,
2014).
Cheap talk, oaths and scenario adjustments – Ancillary mechanisms
Different ancillary mechanisms are also used to reduce the hypothetical bias. One of the
approaches is to use “cheap talk”, or more recently used “oaths taking” (Haab et al.,
2013). One approach of cheap talk could be to warn the respondents explicitly of the
tendency among people to inflate or deflate hypothetically reported values. But Kling et
al. (2012) report that more than 30 lab and field experiments find that while cheap talk
can be moderately effective in some circumstances, its net impact varies with the
characteristics of participants and the commodity, and the type of script used, and has
advocated lesser use of cheap talk scripts, to manage hypothetical bias. More recently,

131
researchers have also investigated the use of a solemn oath to tell the truth and find it
effective in reducing hypothetical bias (Haab et al., 2013).
Surveys about behaviour often have systematic biases relative to the behaviour asked
about (Diamond & Hausman, 1994). In a developed country context, most often the
conditions for higher WTP are in the context of public goods. It is presumed that
respondents do not have to face a budget constraint as in a developing country context,
and if warm glow effects and other biases are considered, the estimates are prone to be
inflated. In the developing countries, given the conditions of significant income
constraint, WTP for any goods or services is expected to be low. In the context of this
study, furthermore, since the goods considered are private goods, with better
consequentiality and bargaining conditions compared with public goods, the
hypothetical bias is expected to be less.
6.2.3 Rationality and theoretical consistency
Another major concern with CV use is related to its failure to meet the rationality test of
standard economic theory (Hausman, 2012). The issue of compatibility with respect to
rational choice frequently put forth is the embedding106 effect (Hausman, 2012;
Kahneman & Knetsch, 1992) that leads to inconsistent WTP and WTA valuations. The
embedding effect is also variously labelled as the “part-whole effect”, “order effect”,
“symbolic effect”, or “disaggregation effect”107. The inconsistency due to this effect,
together with the higher estimates due to the hypothetical bias, is summarily attributed
to the moral satisfaction that people get from having done some good and the resultant
feeling of “warm glow” (Hausman, 2012).
Another theoretical inconsistency encountered is the difference between WTP and
WTA, in theoretical terms the Hicksian compensating and equivalent variation
measures, for the same good. Critics contend that CVs do not measure the equivalent
dollar value of respondent’s marginal utilities, because people do not value things for
purely selfish motives, and are not just worried about the outcomes and prices, but the
process and payment provisions (Hanemann, 1994). Thus, the violations as seen are
106 Carson and Mitchell (1995) recommend that the term “embedding” not be used because of ambiguity
in its meaning and relationship to theoretical predictions. 107 Diamond and Hausman (1994)} point out that there is a history of anomalous results in CV surveys
that is tied to the embedding effect, and conclude that CV methods cannot be used for damage assessment
or cost-benefit analysis.

132
evidence of construct invalidity (Kling et al., 2012), severely undermining the CV
method (Kahneman & Knetsch, 1992). Rationality is contested primarily based on the
following effects.
Scoping or Size effect
The scoping effect occurs when WTP estimates are elicited for goods in varying sizes.
The WTP is often substantial for the smallest scenarios, but then becomes largely
independent of the size of the good, rising slightly if at all for large changes in size
(Arrow et al., 1993).
Sequence or Order effect
Kahneman and Knetsch (1992) elaborated on the order effect which occurs when the
values of several goods are elicited in succession. The same good elicits a higher WTP
if it is first in the list rather than valued after others.
Part-Whole Effect
Part-whole bias is different from a scoping effect wherein the value elicited becomes
less when the goods are posed as part of an inclusive whole than when they are posed
independently (Kahneman & Knetsch, 1992). 108
WTP and WTA differences
The studies show a persistent gap between the two measures, WTP and WTA, and more
importantly the size of the differences in many studies seems simply implausible (Kling
et al., 2012). Based on this anomaly, among others, Hausman (2012) has categorically
denied the credibility of CV, especially with respect to its use in benefit-cost analysis.
He considers that both the neoclassical and behavioural explanations have been
attempted, but contends that the foundations of a cost-benefit analysis based on these
alternative theories have not yet been constructed convincingly.
108 A temporal embedding effect is also analysed to understand whether respondents are likely to make
the appropriate discriminations between a one-time payment and a long-term commitment to a series of
payments, and the results indicated that respondents did not discriminate between payment schedules that
differed greatly in total present value.

133
6.2.4 Assuring rationality - theoretical constructs and convergent validity
Economists believe that actual behaviour represents a criterion validity and that the
criterion contains no systematic error, but it has been shown consistently that this
criterion standard is rarely achieved. Therefore, comparisons between SP estimates and
other measurements are treated as a test of convergent validity (Carson & Czajkowski,
2014). In this case, the test of rationality uses estimates from different methods which
follow the same theoretical principle, where comparisons are to understand if values
match or diverge in expected directions for expected reasons (Kling et al., 2012). One
of the underlying issues with rationality when eliciting WTP for environmental goods is
due to the use of conventional intuition of demand and welfare theory to determine price
changes that would result from imposed quantity changes (Carson & Czajkowski,
2014). There is a conditional difference between situations where an agent faces a price
and determines the quantity to purchase (the usual neoclassical economics perspective)
and conversely where someone faces quantity changes to determine WTP (the usual CV
perspective). Many theorists have suggested that behaviour might be different in the
second case (Carson & Czajkowski, 2014), more so in the case of rationed goods.
A large part of the inconsistencies analysed are attributed to the more general use of
earlier methods of understanding theoretical rationality other than comparison with the
RP estimates (Kling et al., 2012). However, newer studies test the convergent validity
especially between RP and SP methods (Hanemann, 1994), where revealed behaviour is
taken from actual markets and economic experiments. Researchers have tested both the
equivalence of econometric parameters and the statistical equality of economic value
estimates, and suggest that economic values are generally consistent (Kling et al.,
2012). Similarly, the results from the contemporary state of the art SP studies are almost
always consistent with economic rationality (Kling et al., 2012), wherein for example,
income effects are always positive and scope criteria are usually met. Further, the
following justifications and solutions are suggested to reduce inconsistencies.
Embedding effect – Scope, order and part-whole bias
As sensitivity to scope became a litmus test for the validity of SP methods after the
Exxon study, many studies were designed to understand the scope tests. Meta-analysis
of these studies shows that scope effects are typically present even in well-executed
studies (Kling et al., 2012). Many tests carried out on to the scope effect have since
shown that scope sensitivity exists, and re-analysis of some of the studies put forward

134
by CV critics suggests that the critics’ claims were in most instances much weaker than
they first appeared, since the studies were based on far from state-of-the-art CV surveys
(Carson & Czajkowski, 2014). Equivalence in a scope test can be checked through an
external test or split sample test where WTP in two different analogous samples for
different products is compared, and the internal scope test can be carried out by
comparison between WTP values for two different products of the same sample size
(Haab et al., 2013).
The results in a scope test depend crucially on how much one trims the data to remove
what are clearly outliers. Moreover, even if there is some evidence of a scope effect,
most CV studies are still insensitive to scope (Hanemann, 1994). Haab and McConnell
(2002) further draw from meta-analysis for the values of changes in visibility and find
estimates of scope. They maintain that scope sensitivity depends on the theoretical
assumptions imposed during model estimation, and is higher if the scope is measured
absolutely than relatively109. For a public good, Haab et al. (2013) suggest that the size
of the scope effect may be limited by the thresholds of diminishing marginal utility and
substitution among nonmarket goods or between nonmarket and market goods.
Hausman (2012) has suggested conducting an adding-up test. However, Haab and
McConnell (2002) considered this inappropriate as it imposes a specific structure on the
preference function. Nevertheless, Desvousges et al. (2016) carried out an application of
the adding-up test using incremental parts as implied by standard utility theory and
Carson and Groves (2007) procedures to induce truthful responses. This test failed, and
the implication is that either the CV method did not elicit truthful answers or that
respondents’ true preferences are inconsistent with standard utility theory.
Sequence and part-whole effects can be explained in terms of the substitution effects
and diminishing marginal rates of substitution. If the goods being valued are normal
goods and substitutes for each other, which is the typical case, then the monetary value
of a good should progressively be smaller the later it is valued in a WTP sequence, and
the implication is that a package of goods should be valued less than the sum of its
independently valued constituents (Carson & Czajkowski, 2014). Similar implications
were a result of the test of the embedding effect in the much cited Kahneman and
109 A regularly cited example is the Desvousges study carried out for a bird population, which resulted in
high scope insensitivity and which is attributed to the elicitation format using percent of bird population
(Desvousges et al., 1993).

135
Knetsch (1992) paper. The results show that respondents have low WTP for goods
when posed as part of the inclusive whole. The same is true but with opposite effects
with the WTA format. The later a good is posed as part of a whole or in a sequence, the
larger its monetary value, because the agent has fewer substitute goods as the sequence
progresses and is compensated for this by more income. The sequence effect is also
predicted by economic theory due to the substitution possibilities between the goods
and the reduction in disposable income that occurs with the purchase of each new good.
This dependence on the order or the part-whole combination of goods is also considered
simply a manifestation of why political control of the agendas such as the order in
which issues are considered is so important (Carson, 2000). However, such effects are
tractable, can be detected and controlled, either by choosing the sequence that produces
a conservative result or by randomising the order of items across interviews
(Hanemann, 1994).
WTA and WTP anomalies
In the case of anomalies with respect to higher WTA than WTP for public goods,
estimates are driven by the ratio of income effect to substitution effect, as against only
an income effect as in the condition of price and quantity change for ordinary private
goods. As the substitutability of public goods with the available private goods becomes
small, the difference between WTP and WTA becomes large (Carson & Czajkowski,
2014; Haab et al., 2013; Kling et al., 2012). The first neoclassical explanation of this
was attempted by Hanemann (1991) where the difference hinges on the relationship of
income elasticity to the Allen Uzawa elasticity of substitution for unique goods, which
is likely to be particularly small. But, even controlling for such substitutability in
repeated trials, significant disparity still remained. Some of the proponents of
Hanemann’s argument consider that this is an issue of auction institution, and not an
issue of neoclassical rationality (Haab et al., 2013).
A second strand of justification in this context is drawn from psychology and
behavioural economics. This is related to prospect theory and an endowment effect.
Prospect theory assumes that losses and gains are valued differently, and thus
individuals make decisions based on perceived gains instead of perceived losses.
The endowment effect is the hypothesis that people ascribe more value to things merely
because they own them. Both approaches depend on the normative psychological
aspect of loss aversion. Some studies have shown this effect is also a result of survey

136
settings and respondents’ experiences. More importantly, loss aversion is considered a
departure from the regular neoclassical economic theory, and findings within the
behavioural economics in this regard are grouped in two broad categories (1) individual
preferences do not behave in the neoclassical sense and/or (2) individuals do not always
optimise when making choices (Kling et al., 2012).
It is important to understand that similar anomalies and violations are present also for
price changes involving private goods, particularly with respect to sensitivity to scope
and the WTP and WTA differences (Kling et al., 2012). Similarly, Carson et al. (2001)
points out that the warm glow and moral satisfaction is also true of other instances
where economists have looked at altruism as a motive, such as overlapping generations
models in macroeconomics and family relationship models in labour economics. Haab
et al. (2013) has suggested trying to detect altruism in the WTP or choice question
responses, and if possible develop value estimates that both include and exclude the
warm glow component for comparison. Particular forms of altruism and its negative
counterpart, envy, have long been known to raise potential problems with aggregate
welfare measures, for use in policy purposes and cost-benefit analysis (Hausman, 2012).
However, if individuals gain utility and are ready to contribute incrementally for good
causes, then there should be no potential conflicts with respect to including altruism-
motivated values as well. In this case, the test of the relationship of the embedding
effect with moral satisfaction found that the respondents are ready to increase the
contribution to acquire more moral satisfaction. Further, the argument is not specific to
either CV or passive use value. Altruism and envy influence private market transactions
as well. In this context, it is noteworthy that the alternative definitions became more
evident because of CV surveys, which were shown to be quite robust across a wide
range of economic behaviour. Therefore, these inconsistencies raise important research
questions about the potential future designs and use of CV and SP methods in cost-
benefit analysis (Haab et al., 2013). Advances in SP studies and other fields have shown
that a combination of neoclassical, psychological and behavioural theory can give a
wider range of predictions consistent with the deviations of the SP studies.
Kling et al. (2012) point out that definitive construct validity tests are now more
difficult to formulate. CV and SP methods cannot eliminate the behavioural effects, but
can only provide carefully administered choices that facilitate careful decision making.
The literature suggests that careful elicitation design will consider the reference points
of gains and losses, and respondents’ expectations (Abeler, Falk, Goette, & Huffman,

137
2011; Knetsch, 1990; Knetsch & Sinden, 1984). Further, a test of rationality through
convergence of estimates is becoming more usual. This involves two types of data in the
same economic model, and earlier studies suggest that for private goods actual
purchases and stated intentions from a CV can be used to estimate the demand for new
products and services. In a similar manner, this study uses the economic model
considered to analyse the WTP results with the existing biogas purchase data, albeit
with subsidies. Since the theoretical inconsistency is not only restricted to passive use
values, scoping sensitivity is important for the study in valuing the WTP for different
levels of energy use. While many studies have used WTA measures to understand
compensation for environmental services, this study also uses a WTA elicitation format
for the carbon emission reductions due to RETs.
6.2.5 Calibration
Overestimates of demand for new goods and a lower proclivity to purchase existing
goods in pricing exercises have long coexisted as forecasting problems due to
hypothetical bias in surveys (Carson & Czajkowski, 2014). The marketing and
transportation literatures especially have seen surveys producing useful, albeit biased
estimates that need to be calibrated with RP behaviour. This is also true for demand
estimates for new products, where it is standard practice to use a calibration factor to
adjust survey responses to produce an estimate for actual demand.
Calibration is particularly difficult with regards to public goods, when the context
includes unfamiliar commodities and transactions. One version of calibration suggested
with respect to such unfamiliar goods is to ask the confidence level of the respondents
about the answer (Diamond & Hausman, 1994). Qualitative ranks and multipoint scales
can be used, but newer vehicles continue to be proposed. Such adjustments can reduce
estimates by 30-40 percent compared to studies without adjustment (Kling et al., 2012;
Whittington, 2010; Whittington et al., 1997). Further, if the CV estimates are treated as
potential demand and not actual demand, then it corroborates the results from field
studies, where the potential demand is fulfilled over a longer-time horizon (Carson &
Czajkowski, 2014). Certainty scales, when properly calibrated, and dissonance
minimisation were found to be most effective in reducing the CV bias (Morrison &
Brown, 2009).
Kling et al. (2012) further suggests using calibration based on the degree of uncertainty,
with a similar proposition in scenario adjustment (Haab et al., 2013) by considering the

138
level of certainty respondents would have if they were to make the same decision in a
real choice situation. Haab et al. (2013) maintains that adjusting for certainty can
produce “hypothetical” results that are often close to “real” values, and these alternative
levels allow for sensitivity testing when CV estimates are used in benefit-cost analysis.
Further, designers have taken opportunities of conducting SP studies in conjunction
with actual binding local referenda for amenities, such as installation of a new water
system, and such studies find that the SP predictions match the outcome of the actual
referenda, without any need for calibration. Given the understanding of behaviours from
psychological and economic perspectives, this corroborates with the temporary stability
of human preferences.
Even though our study is for a private good, the decision to purchase RETs is normally
a one-off event, and is often done based on limited formal information. In a developing
country context with limited disposable income, the responses are likely to be biased
towards the alternatives that have the lowest WTP because of the anchoring effect.
Therefore, CV must be designed carefully to improve the accuracy of the WTP
elicitation. Moreover, by obtaining a more accurate WTP, the effect of distribution of
carbon revenue can be properly calculated.
6.3 Methodological Issues - Choice Experiment
Choice experiments are most often used when there is a need to value more than one
possible change from the status quo, as against valuing a single product or a single
scenario change. The easiest way of doing the CE involves asking the same agent to
choose their most preferred alternative or substitute from more than one choice set
(Boxall et al., 1996) or asking different agents to make choices in a CV (Carson &
Czajkowski, 2014). While such is theoretically possible through a CV, the sampling and
the cost involved would be large. Therefore, CE as a SP technique is often utilised to
obtain more information from each respondent than a Single Binary Choice CV. It
provides a way to value a much larger range of policy options at reasonable cost
(Blamey, Gordon, & Chapman, 1999; Carson & Czajkowski, 2014).
It is useful to see a CE as a natural generalisation of a binary choice CV (Bateman et al.,
2002; Hanley et al., 2001) where CE allows more than one possible change to be
measured in the form of attributes and their levels. The only way a CV study can
estimate such different attributes is to design different valuation scenarios for each level
of each attribute. CE involves a more experimental and involved analysis of choice

139
behaviour (Boxall et al., 1996), and, in principle, the move towards CE is considered a
move away from the focus on values to a focus on behaviour. It is believed that
advances in resource allocation are most likely to materialise from a better
understanding of choices rather than valuation (Adamowicz, 2004).
In addition, as a technique, CE avoids some of the problems encountered with CV
methods. CE does a better job of measuring the marginal value of changes through
different attributes and their levels, which is a more useful focus from a
management/policy perspective than either the gain or loss for single scenario changes
(Mahieu et al., 2014). This is particularly important with respect to benefit transfer
impacts wherein CE models are much easier to pool with either travel cost or hedonic
price models than is a CV model (Bateman et al., 2002). The National Oceanic and
Atmospheric Administration panel’s (Arrow et al., 1993) recommendations for future
research to set up benchmark values for reference spills suggested a choice experiment-
like structure where different damage scenarios with their attributes and levels would be
suited for eliciting evidence for future damage assessment (Morrison & Bennett, 2000).
Further, CE provides more flexibility in terms of attribute selection compared to fixed
attributes such as for travel cost methods, and due to such its application is widespread
in marketing, health and transportation compared to other methods.
CE can avoid the yeah saying as a socially desirable response and to please the
enumerator, or yeah saying as a strategic bias with respect to free riding, since
respondents get multiple chances to elicit a positive preference for a valued good over a
range of payment amounts (Blamey et al., 1999). While open-ended CV designs avoid
the yeah saying, they are viewed as facing respondents with a difficult mental task,
which can lead to non-response or random response or a set of inconsistent responses.
It is also expected that CE designs can reduce the extreme collinearity where different
predictor variables all move together in models based on variations in actual attribute
values, since in CE design, attribute levels are usually designed as orthogonal (Bateman
et al., 2002). The orthogonal choice sets achieved after multiple interactions also
provide a natural internal scope test due to elicitation of multiple responses per
individual (Hanley et al., 2001).

140
6.3.1 Design issues and considerations
While the gains from a high quality implementation of a more complex discrete CE can
be large as it allows exploration of a much larger set of policy options for marginal
changes, any problem seen occurring in a dichotomous choice CV format is also to be
expected in the case of discrete CE (Blamey et al., 1999; Carson & Czajkowski, 2014).
In a CE, the assumption that respondents truthfully treat choice sets independently may
not always be a plausible assumption (Carson & Czajkowski, 2014). The results for the
double bound dichotomous choice elicitation give some idea of what can happen when
the respondent sees the same good offered at different prices. In sequential CE, the
pattern of price relationships within and across choice sets in conjunction with the
pattern of attribute levels can give rise to clear incentives for the respondent to not
truthfully reveal their preferences.
It is not uncommon to see respondents get more price sensitive over time or become
more likely to choose the status quo level when the price offered does not seem like a
good deal relative to alternatives seen earlier. Other beliefs about the objectives of the
sequential CE can yield other patterns of response behaviour that do not appear to be
independent across choice sets. These may sometimes look like various types of
learning, various behavioural effects, and changes in estimated scale across choice sets.
In general, it is hard to uniquely sort out different reasons for observing some type of
lack of independence of responses across choice sets. Because of the large gains in the
amount of preference information collected in sequential CE, more work is required on
how to exploit this information in a way that is robust to correlation among attributes,
types of response effects and biases that might be observed.
Protest responses and nay/yea saying with the CV can look like status quo effects in a
discrete CE with three or more alternatives (Bateman et al., 2002), even though it is
suggested that a CE might reduce the incidence of ethical protesting as the choice
context may be less stark than direct WTP elicitation (Blamey et al., 1999; Mahieu et
al., 2014).The mechanism design framework predicts that ordering effects will be
present when individuals respond to multiple choice tasks. This has been confirmed
empirically (Kling et al., 2012). The arrangement of attributes and levels therefore will
be important for order effects (Carson & Czajkowski, 2014; Kling et al., 2012).
The packaging problem relates to the assumption that the value of the whole is equal to
the sum of its parts. When this assumption is violated whole values derived from CE

141
have to be compared with the values for the same derived from other techniques such as
CV. In many cases, whole values derived from CV methods are found to be lesser than
the sum of component parts, measured using CE surveys (Bateman et al., 2002). It is
difficult for CE to derive values for a sequence of elements implemented by a policy,
and hence valuing the sequential provision of goods in multi-attribute programmes is
probably better undertaken by CV (Bateman et al., 2002).
A defining characteristic of CE is that a respondent completes multiple choice tasks and
selects from two or more options during each task, and while CV and CE share many
design elements, the incentives they present to respondents can differ (Kling et al.,
2012). Therefore, insights from CE represent an increasingly important component of
the literature. The major consideration with the use of CE is the design and subsequent
cognitive difficulty with the use of complex multiple choices with different attributes
and levels in a hypothetical scenario (Blamey et al., 1999; Hanley, Ryan, & Wright,
2003). Hanley et al. (2001) presents empirical evidence that (1) there is a limit to
information processing for a decision choice, (2) complexity leads to increased random
errors, (3) random errors increase with the depth of the choice task, and (4) there are
significant inconsistent responses. This is particularly important with respect to the use
of CE in a developing country context where the level of awareness and education may
significantly impact the cognitive ability of the respondents.
Complex choice sets also result in learning and fatigue effects which can lead to
irrational or less-than-best choices, as respondents also make use of heuristics or rules
of thumb to simplify the decision task. These will filter the information to select choices
which are good enough and not necessarily the best that will affect the underlying utility
maximisation problem. Heuristics often lead to maximin and maximax strategies and
lexicographic orderings (Hanley et al., 2001). This leads to the need to incorporate
consistency tests to detect the different potential effects as mentioned.
6.4 Discussion and Conclusion
The theoretical framework for any CV method is the standard consumer theory, wherein
the indirect utility due to goods and services (the biogas digester for this study) is
compensated by a discrete amount that the consumers are willing to pay. The WTP
amount represents a composite utility derived from the goods and services. In a CV, the
WTP is a function of the discretionary income, as well as the socio-demographic and
psychographic characteristics of the consumers, and the characteristics of the change.

142
The theoretical framework for the CE is more nuanced in that the consumer’s indirect
utility not only depends on the consumer characteristics, but more so on the
characteristics of the goods and services, described in terms of attributes and their
levels. Therefore, while CV is useful for discrete valuation of a single product or a
single scenario, CE is more useful to assess the marginal valuations with respect to the
characteristics of single or multiple products and scenarios.
While the CV allows a much simpler direct valuation of goods and services, its
application has to be considered much more rigorously because of the biases that can
arise due to the hypothetical nature of the SP methods. However, biases due to the
hypothetical nature can impact both the CV and CE methods. These biases could arise
due to the respondents such as strategic and enumerator bias, due to the nature of the
goods such as public or private goods, and due to the nature of surveys such as the
elicitation formats used to understand the consumers’ WTP. These biases can lead to
estimates that do not represent the real values. However, the biases resulting can be
reduced with the use of surveys that encourage respondents’ incentive compatibility and
consequentiality. In this context, the literature has revealed that true preferences are
revealed when cues such as the potential prices are included with single-shot, binary,
binding formats such as the referendum elicitation for goods and services. Further,
ancillary mechanisms such as cheap talk and calibration methods such as certainty
scales can be used to manage the biases.
Another issue with the SP methods, especially with CV, is the theoretical inconsistency
in relation to the scope/size effect, order/sequence effect, and part-whole effect,
collectively known as the embedding effect. Anomalies in relation to scale in the
differences between the WTP and WTA have also led to the denial of SP by many. In
this context, the test of convergent validity with the revealed values from the market and
the experimentation in comparison to the contemporary SP studies have been mostly
consistent. The embedding effect is considered, especially in relation to the non-market
and/or public goods, a phenomenon of the diminishing marginal utility and marginal
rates of substitution. The consistent disparity in WTP and WTA estimates is attributed
to the psychological and behavioural contexts of loss aversion, which is a departure
from regular textbook economics, and suggests that consumers do not always optimise
when making decisions, therefore do not behave as a rational consumer. Further, it is
found that the consumer’s moral parameters such as altruism are also embedded in the
value estimates, leading to increased utility with incremental contributions, even for

143
private goods. This aspect is more prevalent in the developed countries where
consumers do not have to face extreme budget constraints as in the developing
countries. In the developing countries, WTP for any goods are expected to be low and
results have found WTP estimates to be negligible in proportion to the income.
However, WTP estimates are relatively higher for private than for public goods.
CE can be viewed as a natural generalisation of CV. However, the experimental control
and efficiency that the CE provides has enabled its use as a choice tool to understand
consumers’ behaviour rather than a valuation tool. Further, CE also avoids some of the
issues related to CV, but provides an enhanced set of outputs useful for better policy
and management purposes such as for benefit transfer. CE can avoid yeah saying
induced due to strategic and enumerator bias, and provides natural internal scope tests
and reduced collinearity due to the orthogonal designs. However, a major concern of CE
use is the choice complexity, especially in relation to the level of awareness and
education of the consumers. This could lead to respondents using heuristics to make
decisions which are good enough and not necessarily the best.
The analysis of the methodological issues together with the findings from the literature
review of the SP methods provides clear insights into the use of CV and CE for this
study. Since the issues are mostly due to the hypothetical elicitations of public passive
use values, it is expected that these issues will be limited in the case of this study since
the biogas plants being valued is considered a private good. However, while they are
owned privately by households, direct government subsidies have been available so far
for their installation. Therefore, in that context, these technologies have both public and
private goods characteristics. Nevertheless, since the intention of this study is to move
towards commercial purchase by increased private investments with the removal of
direct public subsidy the technology is dealt with as a private good in this study.
Further, the credit products designed for the study will also have private goods
characteristics since rural consumers will have used such credit products formally or
informally.

144
Chapter 7 Survey and Questionnaire Design
This chapter describes the sampling frame, sample size, and the parameters considered
during the design of the questionnaires used for the household survey and interviews of
the financing entities. The design for the household survey questionnaire describes the
parameters followed to minimise the biases, and understand the household and
respondent characteristics. This is done in relation to the elicitation structure and
formats used for the CV and the design of the choice tasks for the CE.
7.1 Sampling Frame and Sample Size
The essential and most important part of SP analysis is the design of the survey,
including the questionnaire (Haab & McConnell, 2002). A clustered multi-stage simple
random sampling was used for the principal quantitative part of the study, since the
household population is large with a hierarchical structure in terms of the categories of
ecological and administrative division (Bateman et al., 2002). Further, a criterion-based
purposive sampling approach (Palinkas et al., 2015) was used in the qualitative part of
the study to identify and select the commercial banks, microfinance banks, savings-
credit cooperatives, and financing experts, involved in energy access financing. For the
study, they were collectively referred to as the financing entities. Semi-structured
interviews were conducted with 18 such entities. This final number was sufficient to
reach the limit of maximum information (i.e. theoretical) saturation.
As shown in Figure 7-1, the western Terai region was selected for the study. In terms of
the administrative division, the region is part of provinces 5 and 7. As mentioned in
Chapter 2, the Terai region of Nepal has the highest population at 50.3%, while the hills
is 43%, and the mountains is 6.7% (Central Bureau of Statistics, 2014a). The higher
population is due to migration from the hills and the mountains, with people attracted by
improved facilities and services in the region. However, the western Terai region has
less population compared to the central and eastern Terai region. The population is
35.9% of the total population of the Terai region, and 18.1% of the total population of
Nepal. The climate in the region is tropical to sub-tropical, with average mean minimum
temperature varying between 16-20ºC and mean maximum temperature above 30ºC.
This range of temperature is extremely suitable for the anaerobic digestion required to
produce the biogas from cattle dung and other bio-waste. The range of temperature for
anaerobic digestion is between 18-55ºC and the range between 30-35ºC is considered

145
optimum for efficient biogas production. The gas production stops below 10ºC and
above 55ºC temperature.
Figure 7-1 Map of Nepal with Location of Field Sites
Note: The green dots indicate the location of the councils and are numbered as in
Table 7-1 in the next page.
In Nepal, village and city councils are the smallest administrative division as per the
new constitution, and are used as the primary sampling units for the study. The
independent households in these council areas are secondary sampling units. Table 7-1
shows the status of use of different fuel types for cooking in the region, in comparison
with the councils selected for the sample survey. The data are from the census survey
2010/11, while the data for biogas use have been taken from the AEPC data until
2016/17. A total of ten councils were selected for the study, and a total of 800110
households111 were selected from these councils. Bateman et al. (2002) has suggested
selecting 250 to 1,000 households for a CV study depending on the elicitation methods
used for the study. And, a smaller number can be used for the CE since CE would utilise
the design advantage to gather more information from the same
110 The sample size selected is large compared to the sample size calculated at 3% standard error, and
therefore the distribution of the estimators is expected to show the characteristics of asymptotic normality. 111 The definition of a household for the survey is adopted from the guidelines laid down by the United
Nations in its “Principles and Recommendations for Population and Housing Censuses, Rev 2” (UN,
2008). According to the guidelines the concept of household is based on the “arrangements made by
persons, individually or in groups, for providing themselves with food or other essentials for living”. A
household may consist of one person or a group of two or more persons. The persons in the group - may
pool their incomes, may have a common budget, may be related or unrelated or may constitute a
combination of persons both related and unrelated.

S.N Location Total households
Firewood and
Dried Dung %
Kerosene and
LPG % Biogas % Electricity %
Others/Not
stated %
1 Punarbas MC 8,135 7,030 86.42 375 5.34 1,060 13.03 - 109 0.013
2 Kailari VC 7,261 6,128 84.40 92 1.51 2,077 28.60 - 54 0.007
3 Bansgadhi MC 11,210 10,052 89.67 456 4.54 885 7.89 - 46 0.004
4 Rapti Sonari VC 10,742 10,428 97.08 98 0.94 840 7.82 - 40 0.004
5 Shantinagar VC 4,957 4,866 98.16 28 0.58 149 3.01 1 0.020 21 0.004
6 Vijayanagar VC 5,670 5,453 96.17 133 2.83 85 1.50 - 0.000 45 0.008
7 Kapilvastu MC 12,094 9,833 81.30 1,742 30.13 576 4.76 4 0.033 144 0.012
8 Kanchan VC 7,084 6,129 86.52 706 12.06 451 6.37 1 0.014 28 0.004
9 Sarawal VC 6,738 5,969 88.59 431 10.38 306 4.54 4 0.059 130 0.019
10 Bardaghat MC 16,868 12,619 74.81 3,256 26.30 1,172 6.95 9 0.053 243 0.014
Total for Councils 90,759 78,507 86.50 7,317 10.27 7,601 8.37 19 0.021 860 0.009
Total for the Region 985,846 766,272 77.73 166,640 16.90 90,370 9.17 350 0.036 8,098 0.008
Table 7-1: Proportion of Households and Energy used for Cooking

or a smaller sample size. The households within the councils were selected based on
their proximity to the forest to ensure that the households had the opportunity to use
firewood for cooking. Apart from this restriction, the individual households were
selected randomly, and the survey was conducted with the household residents at the
time of the survey.
The data shows that the proportion of households using clean fuels is less in the selected
councils than across the region. The average proportion of households using firewood
and dung is 86.50% across the selected samples while it is 77.73% in the region.
However, the proportion of households using kerosene and LPG is 10.27% compared to
16.90% across the region. This difference in fuel use is because the regional average
includes consumption in the urban areas where the consumption of kerosene and LPG is
higher, compared to a better access to firewood and dried dung in the rural areas. The
use of electricity is very low both in the region as a whole and in the selected samples,
with none in four of the selected councils. This is because of the lack of access to
electricity in some areas, while also due to the load shedding because of inadequate
capacity of the grid. Further, the cost of cooking with electricity is comparatively more
than with the other fuel types, mainly because other substitutes are subsidised by the
government. The data shows that the use of biogas is similar across both the region and
the samples selected, at less than 10% of the total households.
The region is relatively homogenous in terms of the livelihood patterns, weather and
climate. The composite HDI of the region is 0.473, and is below the national average of
0.490, calculated based on the census data of 2010/11(National Planning Commission,
2014). In terms of the access to facilities, the region is ranked 4th among nine regions
across Nepal, and the principal component analysis shows a mean absolute value of the
access index of 70.45 with a standard deviation of 11.65112. The comparison shows that
the access to major facilities in the region is above average, and homogenous, compared
to other regions. Further, the census survey of 2011 indicates that 75% of the population
have access to commercial banking facilities (Central Bureau of Statistics, 2014c), and
the livestock situation shows that the average number of cattle and buffalo per
household is 2.2 and 1.2, respectively (Central Bureau of Statistics, 2010a). Therefore,
the basic components in terms of energy mix, livestock ownership, and access to
112 Access to cooperatives was one of variables with the highest weight in the principal component
analysis.

148
facilities, especially with regards to finance is suitable for scaling-up biogas installation
in the region.
7.2 Questionnaire Design
The questionnaire design followed a tailored design method in the sense that the survey
makes use of mixed modes to gather information and data (Dillman, 2011). The survey
used two different questionnaires, one for the households and the other for the financing
entities. The household survey questionnaire is presented in Appendix 6 along with
accompanying pictures in Appendix 7, Appendix 8 and Appendix 9. The household
survey questionnaire made use of pictures and photos as visual aids to stimulate the
responses. It was expected that the use of different question tools and format would
enhance the consequentiality of the proposed scenario - as a desirable change compared
to the status quo (Holmes & Adamowicz, 2003). The second set of questions was used
for the semi-structured interviews with the financing entities. The questionnaire is
presented in Appendix 10. It contained questions designed to obtain information on
energy access investment and a set of open-ended questions designed to understand the
views of the financing entities in areas of subsidy, credit and carbon revenue
investment. Both the household survey and interview with the financing entities were
carried out face-to-face since no other options such as telephone or e-mail surveys were
possible, simply because the infrastructure was not available. Contrarily, the face- to-
face survey was possible because the cost of organising the survey was conducive with
the available budget. Moreover, since the survey and the interview were face-to-face, it
was expected that the data would be of good quality (Alberini & Cooper, 2000) and on
time. A small incentive of NPR 150 (US $1.44)113 was provided to the household
respondents as a token for the time involved during the survey, as a form of social
exchange to motivate participation in the survey (Dillman, 2011).
The household survey questionnaire was divided into four sections. The first section has
a two part objective. The first was to inform the respondents about the scenario under
which the valuation is being carried out – the CV scenario, to communicate the risks
and benefits, motivate the stated behavioural changes required to purchase the biogas to
change the status quo situation for cooking. The second objective involved
113 The exchange rate of US $1 = NPR 103.78, the average exchange rate of November 2017, during
which the field survey was carried out.

149
understanding the awareness and knowledge base of the respondents through binary
“Yes” or “No” dummy variable responses. The first question in this section asked the
respondents if they knew about the health impacts of traditional firewood used for
cooking. The question was asked after giving information on the health impacts of
traditional firewood cooking on women and children, as well as information on yearly
mortality due to firewood used for cooking. The scenario and the relevant questions are
presented in Box 7-1.
Box 7-1: Flow of Information and the Question for Question No. 1
The second question asked the respondents if the respondents knew about the potential
impact of GHG emissions due to firewood use on climate change and climate
variability. The question was preceded by information about extreme precipitation and
flooding in the Western Region in July 2016 that led to the death of more than 50
individuals. The information linked such disasters to the GHG emissions happening due
to the use of firewood for cooking. The scenario and the relevant question are as
presented in Error! Reference source not found..
The third question asked the respondents if the respondent knew about domestic biogas
plants prior to the survey. The question was preceded by information about the technical
aspects of biogas plants in relation to the number of cattle/buffalo, the duration for
which the gas is produced each day, and informs about increase in gas production with
toilet connection. The energy security context with respect to importing LPG is implied,
but not explicitly mentioned. The scenario and the relevant question are as presented in
Error! Reference source not found..
Many rural Nepalese households rely on firewood for cooking. As shown in the pictures [show
picture set I (Appendix 7)], most households collect firewood themselves and cook food using
traditional stoves.
The smoke from traditional stoves goes deep into people’s lungs, which can cause sicknesses such
as pneumonia and tuberculosis. Women are more prone to these sicknesses because they do most of
the cooking, as well as children because they spend a lot of time indoors.
In Nepal, nearly 8,000 people, particularly women and children, die each year because of diseases
such as pneumonia due to indoor air pollution.
Question 1. Prior to this survey, did you know about the health effects of firewood use for cooking?
Yes No

150
The fourth question asked the respondents if the respondents believed that he/she will
be able to earn revenues with the reduction of emissions resulting from biogas
installation. The question follows information on the carbon market and the purchase of
Box 7-2: Flow of Information and the Question for Question No. 2
Box 7-3: Flow of Information and the Question for Question No. 3
Now I will tell you about another disadvantage of using firewood. Use of firewood also
produces gases which are harmful to the environment as they help to increase the world’s
temperature. Increases in these gases across the world are causing changes in weather patterns.
The changing weather pattern has increased storms in some areas causing floods that damage
human lives, properties and agriculture, as shown in the picture [show picture II(Appendix 8)].
Over 50 people were killed by landslides and flash floods in Nepal in the last week of July
alone last year. Use of clean energy technologies such as biogas can reduce the emission of
such harmful gases in the environment, which will help to reduce these changes in weather
patterns.
Question 2. Prior to this survey, did you know that cooking on firewood also emits harmful
gases that cause changes in weather patterns?
Yes No
A biogas plant can be installed at your house to reduce use of firewood for cooking. As shown in the
pictures [show picture set III (Appendix 9)], a biogas plant is a simple technology that produces gas
for cooking. In a biogas plant, water and dung are mixed in equal quantities and fermented for two
months, after which cooking gas is produced.
A household requires two cattle head (buffalo and/or cow) to feed dung daily to generate an adequate
amount of gas. The biogas plant can produce gas for 3 hours each day which can be used for cooking.
The plant produces more gas if you connect household toilet with the biogas plant. The digestion of
cow manure also produces high quality fertiliser, normally known as bio-slurry. The use of bio-slurry
can help to reduce the use of chemical fertiliser.
Once installed, a biogas plant can operate for 15 years. A biogas plant makes your household self-
sufficient for cooking energy, and you don’t have to rely on imported LPG cylinders.
Question 3. Prior to this survey, did you know about household biogas plants?
Yes No
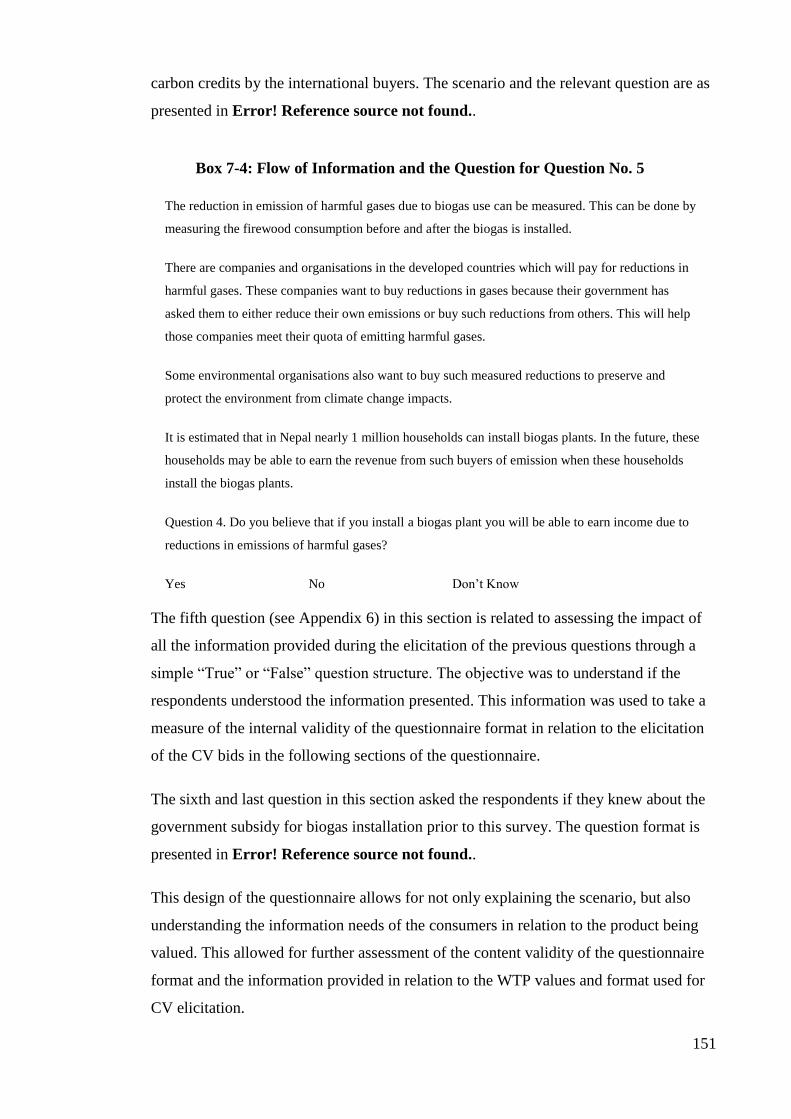
151
carbon credits by the international buyers. The scenario and the relevant question are as
presented in Error! Reference source not found..
The fifth question (see Appendix 6) in this section is related to assessing the impact of
all the information provided during the elicitation of the previous questions through a
simple “True” or “False” question structure. The objective was to understand if the
respondents understood the information presented. This information was used to take a
measure of the internal validity of the questionnaire format in relation to the elicitation
of the CV bids in the following sections of the questionnaire.
The sixth and last question in this section asked the respondents if they knew about the
government subsidy for biogas installation prior to this survey. The question format is
presented in Error! Reference source not found..
This design of the questionnaire allows for not only explaining the scenario, but also
understanding the information needs of the consumers in relation to the product being
valued. This allowed for further assessment of the content validity of the questionnaire
format and the information provided in relation to the WTP values and format used for
CV elicitation.
Box 7-4: Flow of Information and the Question for Question No. 5
The reduction in emission of harmful gases due to biogas use can be measured. This can be done by
measuring the firewood consumption before and after the biogas is installed.
There are companies and organisations in the developed countries which will pay for reductions in
harmful gases. These companies want to buy reductions in gases because their government has
asked them to either reduce their own emissions or buy such reductions from others. This will help
those companies meet their quota of emitting harmful gases.
Some environmental organisations also want to buy such measured reductions to preserve and
protect the environment from climate change impacts.
It is estimated that in Nepal nearly 1 million households can install biogas plants. In the future, these
households may be able to earn the revenue from such buyers of emission when these households
install the biogas plants.
Question 4. Do you believe that if you install a biogas plant you will be able to earn income due to
reductions in emissions of harmful gases?
Yes No Don’t Know

152
The second section of the questionnaire includes the CV elicitation format for the WTP.
A schematic for the flow of the questions is shown in Figure 7-2. A Single Bound
Dichotomous Choice (SBDC) format is used primarily because of the better incentive
compatibility and consequentiality (Carson & Groves, 2007) compared to other formats.
The SBDC is understood to be the most basic and truthful format because any format
larger than a binary message space cannot be incentive compatible without restricting
the space of allowable preference functions. This means that all elicitation formats other
than a SBDC can present situations where it is optimal for some types of respondents to
reveal preferences inconsistent with the true WTP (Carson & Czajkowski, 2014). The
SBDC format also uses a dichotomous choice “Yes” “No” format as per the suggestion
of the NOAA panel (Arrow et al., 1993). However, such a format in a private good
purchase situation should not be used with a referendum format suggested for a public
policy purpose. The use of SBDC simulates a one-time take it or leave it (Holmes &
Adamowicz, 2003) market payment scenario and therefore enhances the incentive
compatibility and consequentiality, not always possible through other forms of
elicitation.
The SBDC format is chosen also because of the large sample size that does not require
the use of DBDC, in terms of gathering more information from a single respondent. The
researcher felt the use of an open-ended questions would result in zero responses or
responses with very low value, in the absence of an anchor with respect to the value of
the biogas digester. The iterative elicitation was simply too cumbersome in terms of the
time and resources, as well as the level of education of the enumerators. Further, the
iterative bidding process is rarely used because of the anchoring effect of the final bid
with the initial bid (Holmes & Adamowicz, 2003). The payment card method could
have been used, but there was risk that the households would be likely to select the
Box 7-5: Flow of Information and the Question for Question No. 5
The government provides subsidies to help people buy and install biogas in their homes. This
subsidy is about one-third of the total cost of the technology. However, access to these government
subsidies is limited. Only about 20,000 biogas plants are subsidised each year. Therefore, many
households like yours may have to wait a long period to receive a government subsidy.
Question 6. Prior to this survey, did you know about government subsidies?
Yes No

153
lowest bid amount, especially in the context when the households were unaware or
quasi-informed about the technology, especially its price and the government subsidy.
Figure 7-2: Structure of the DC questions
The CV section contained two SBDC questions, where the first question asked the WTP
for the biogas digesters, as presented below.
“Question 7: ASK: Would you be willing to pay a one-time payment of NPR X to
install a biogas in your household?”
In the above question, the value of X varied in a random process between participants.
There were five discrete values of X.
An additional question followed the first SBDC question to check for the protest
responses, as presented below.
“If the answer is NO to Question 7, ASK Question 8: How much would you be willing
to pay then? NPR …”
The second SBDC question asks the respondents whether they would be willing to pay
the full price of the biogas digester provided that the respondent household received a
yearly environmental income, as presented below.
“Question 9. If you received an income of NPR Y each year for installing and using the
biogas plant, would you be willing to pay the full price of NPR 45,000 (US $433.79) to
install the biogas in your household?”
In the above question, the value of Y varied in a random process between participants.
There were five discrete values of Y.

154
The bid levels for the WTP of the biogas digester were structured around the existing
value that provides the expectation of the value that the consumers were willing to pay,
and provided a measure of the central tendency for the respondents WTP (Holmes &
Adamowicz, 2003). This value is US $241.07, which is just less than the investment
cost of US $433.79114 minus the government subsidy of US $192.72. Five bid values
were considered as per the suggestion to have a smaller number of bids in the range of 5
to 8 bids (Alberini, 1995; Holmes & Adamowicz, 2003). As suggested by (Boyle,
MacDonald, Cheng, & McCollum, 1998) the bid design levels are kept close together.
The highest bid value was truncated at the full price of the biogas digester.
The question following the WTP question (Question 7) enables identification of the
WTP of the respondents who are not prepared to pay the initial bid amount presented to
them for the biogas plant. A lower WTP value would suggest that the respondent is
budget constrained or has a lower value for the biogas plant while a “No” vote would
suggest that the respondent does not want the biogas at all.
The second WTP elicitation was for eliciting the WTP the full price (US $433.79) based
on a given environmental income posed as bid amounts to the respondents. Five
environmental income values were presented to the respondents. The question ordering
for the CV section was such that the respondents who were presented the lowest bid for
question 7 were also presented the lowest environmental income value. A WTP
followed by a WTA format was used in this context, because the objective of this
elicitation was to understand the market share in relation to the previous elicitation, in
which case no environmental income was proposed.
The CV questions were preceded by a cheap talk section which among others focused
on emphasising the context where the respondents would be willing to pay a higher or a
lower amount contrary to the true WTP amount. The higher WTP is in relation to the
issue of yeah saying, especially with respect to the higher bid values, combined with
enumerator bias in a face-to-face interview situation. Further, in many studies
conducted in the developing countries, Whittington (2010) has cited respondents
consistently stating modest WTP values, especially in a rural setting, so that the
estimated demand for improved services was rarely found to be sufficient to recover the
114 This cost does not include the labour cost which is valued at US $89.70 for digging the ground on
which the biogas is constructed, and this is almost always carried out by the farmers themselves.

155
costs of service provision, and capital subsidies were still needed, especially for lower
levels of infrastructure. The dichotomous choice therefore was also designed to reduce
strategic bias on the part of the respondents, who are likely to state lower values,
especially when OE and payment card elicitation formats are used. The researcher also
tried to use the certainty scale to enhance the certainty of the bid values, but during the
pre-test the enumerators felt that the cognitive burden (Alberini, Bigano, Ščasný, &
Zvěřinová, 2016) introduced would impact the final valuation, particularly for this study
with several DC questions.
The third section of the questionnaire relates to the design of the CE. CE is used in the
study to understand the preferences for a hypothetical situation in which the households
can select alternative financial products where carbon revenue is considered as one of
the attributes. The alternative financial product consists of three other attributes: interest
rate, payback period and instalment frequency. The inclusion of the carbon revenue
provides a new dimension to the regular attributes of a financial product, making it a
niche financial product. The experiment considers the potential market share due to the
different attributes and their levels, and therefore does not require any valuation of the
product. However, marginal WTP can be calculated by taking the basic approach to
measure the welfare change associated with the concerned attribute in relation to the
annual interest rate, where the resulting marginal WTP can be interpreted as the increase
or decrease in the interest rate (Cranford & Mourato, 2014). The attributes and the
levels used for the CE design are presented inError! Reference source not found..
Table 7-2: Attributes and Levels
Attribute Description Levels Values
Interest Rate The interest rate that the
households have to pay on
credit
4 5%, 8%, 12%, 16%
Payback
Period
The years over which the loan,
both principal and interest, has
to be paid back
3 3 years, 5 years, 7 years
Instalment
Frequency
The frequency in terms of how
often the instalment has to be
paid per year
3 monthly, quarterly, each
six months
Environmental
Income
The amount the households
can earn each year for biogas
use
6 0, $12, $20, $40, $60, $72

156
The attributes have a maximum of 6 levels. Bateman et al. (2002) maintains that 4 to 6
choice sets yield the most consistent answers, with more than 8 becoming too complex
for most respondents to handle. Further, the attribute levels represent the market levels
that are existing for banks and MFIs. The bank interests varies between 8 to 12%, while
the government subsidised interest rates are less, in the range of 5 to 6% for agricultural
loans. The normal payback for a MFI is a maximum of 3 years, and banks normally
operate with longer payback period, in the range up to 7 years, which can increase
depending upon the lifetime of the technology. Similarly, the instalment frequency for
most MFIs is weekly/monthly, but for banks the payment can be made every quarter or
six months. The environmental incomes are the same as the ones used in the CV
exercise, and represents the market value for carbon credits in the compliance and
voluntary markets. The values above US $40 per tonne represents higher values,
expected with the market mechanism beyond 2020, the starting of the Paris Agreement
implementation.
The NGene package was used to design the CE, and a fractional factorial D-efficient
design was used to produce the choice sets. The design has also included the attributes
of yearly amount and the total amount to be paid back, consistent with the other
attributes. In this, the attribute yearly amount was created using the other three attributes
of interest rate, payback period and instalment frequency, and then the constructed
variable was included in the utility function in the Ngene software. To minimise
confusion for the respondents, only the 12 annual payback amounts shown in Error!
Reference source not found.Error! Reference source not found. were used in the
questionnaire. In other words, the effect of instalment frequency on total and annual
payback amounts was ignored. The error in this procedure was small, at between 1%
and 3%.
Table 7-3: Matrix design for the Constructed Variable – Annual Payback Amount:
Interest Rate Payback Years
% 3 5 7
5 159.32 100.17 74.93
8 168.00 108.84 83.60
12 180.61 120.67 95.43
16 193.23 132.50 107.26
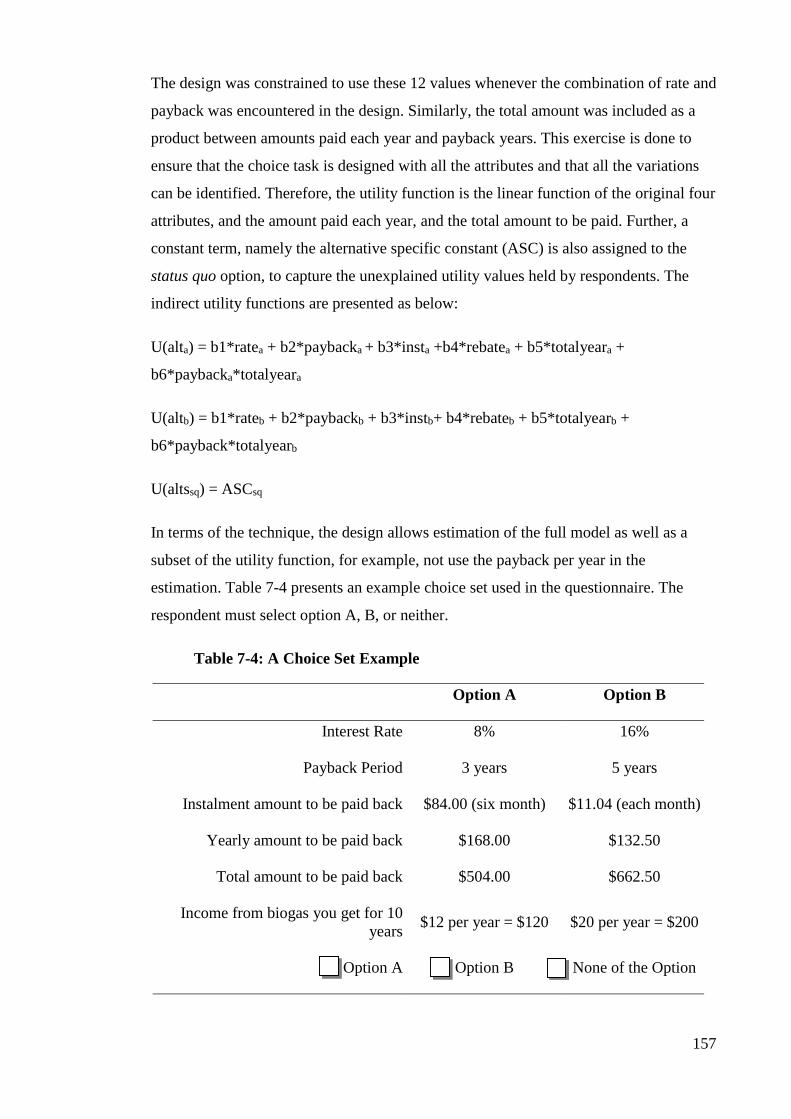
157
The design was constrained to use these 12 values whenever the combination of rate and
payback was encountered in the design. Similarly, the total amount was included as a
product between amounts paid each year and payback years. This exercise is done to
ensure that the choice task is designed with all the attributes and that all the variations
can be identified. Therefore, the utility function is the linear function of the original four
attributes, and the amount paid each year, and the total amount to be paid. Further, a
constant term, namely the alternative specific constant (ASC) is also assigned to the
status quo option, to capture the unexplained utility values held by respondents. The
indirect utility functions are presented as below:
U(alta) = b1*ratea + b2*paybacka + b3*insta +b4*rebatea + b5*totalyeara +
b6*paybacka*totalyeara
U(altb) = b1*rateb + b2*paybackb + b3*instb+ b4*rebateb + b5*totalyearb +
b6*payback*totalyearb
U(altssq) = ASCsq
In terms of the technique, the design allows estimation of the full model as well as a
subset of the utility function, for example, not use the payback per year in the
estimation. Table 7-4 presents an example choice set used in the questionnaire. The
respondent must select option A, B, or neither.
Table 7-4: A Choice Set Example
Option A Option B
Interest Rate 8% 16%
Payback Period 3 years 5 years
Instalment amount to be paid back $84.00 (six month) $11.04 (each month)
Yearly amount to be paid back $168.00 $132.50
Total amount to be paid back $504.00 $662.50
Income from biogas you get for 10
years $12 per year = $120 $20 per year = $200
Option A Option B None of the Option

158
The design produced 24 choice sets, blocked into 6 sets of 4 choice scenarios/tasks.
Given the wider access to credit in the Terai region, it was expected that the
respondents would be conversant with the attributes selected. However, the process of
selecting alternatives with marginal substitution could result in cognitive burden despite
the familiarity. Therefore 6 sets per respondent were considered, since individuals can
engage in a learning process and therefore have the opportunity for later responses to
give better indicators of preference than earlier responses. This aspect is like the
insurance policy considered with the DBDC format with CV, where the second question
allows respondents to correct the first response. The choice sets were checked for
implausible alternatives, given that D-efficient designs often simplifies both optimising
the design and the analysis, sometimes resulting in implausible alternatives (Bateman et
al., 2002). However, implausible design alternatives were not found.
At the end of the section 3 on CE, debriefing questions were used to understand the
respondents’ assessment of the preceding questions. The final section includes auxiliary
questions to record the socio-demographic variables, and also the attitudinal questions
relating the consumers’ attitude towards using credit for biogas installation. The socio-
demographic variables, especially the income and other variables, are important to
derive value estimates, since the answers to the elicitation questions only reveal
intervals where the value resides. Further, the questions are sensitive and therefore, to
reduce the problem of non-response at the beginning of the survey, the attitude and
socio-demographic questions are put at the end of the questionnaire.
7.3 Pre-test
Two pre-tests were carried out before the actual field survey. The first pre-test was
carried with a Nepalese community in Hurstville, a suburb in South Sydney, New South
Wales from 14 to 16 July 2017. There were 14 participants who were primarily relatives
of local Nepalese Australians, and who had experience and good knowledge about the
rural conditions in Nepal. This exercise was useful both as a trial for the questionnaire
and as a means of improving confidence to use SP methods that included financial
attributes with the rural consumers in Nepal.
The second pre-test was conducted in Nepal. The pre-test was conducted together with
training of the enumerators from 2 to 6 October 2017 in Butwal, a city in the western
Terai region. Eight enumerators were trained, and carried out the pre-test as part of the
training. The enumerators were selected from a group of individuals who were

159
previously working as social mobilisers, and while not well educated they were
conversant with the rural context, and had prior experience of working in rural
renewable energy programs. The pre-test was done with 52 households in the villages of
Saljhandi and Motipur, which are 28.7 km and 38.6 km, respectively, from Butwal city.
The villages are typical of the villages selected for the actual household survey. Each
enumerator was able to conduct a pre-test of 6 to 7 households. The household
questionnaire was revised after the pre-test.
The certainty scale question subsequent to the WTP a price (Question 7) was dropped
after the pre-test. Further, priors obtained post pre-test could have been used for CE
design. However, given the results from the pre-test, the existing design was considered
adequate for the purpose of the study. This decision was also made because the sample
size was large (800) for the study, and efficient designs are mostly motivated by the
need to use of small samples. Further, the parameter estimates for the design were
adequate, especially for the D error which was less than 0.01. The S estimate was
adequate, less than 500, without any dominant alternatives, and the balance estimate (B)
was 94%, indicating a very good alternative trade-off balance.
7.4 Discussion and Conclusion
The design and implementation of the survey and interview questionnaire and the actual
conduct of the survey and interviews are a critical component of a SP method. The
survey and the interviews comprised a mixed mode, quantitative and qualitative
approach to the research. The qualitative component used a criterion-based purposive
sampling approach to identify the potential financing entities for the interview. Semi-
structured questionnaires were designed to obtain the data and information on the
investment status, fund flow structure, and potential of carbon revenue use. The
quantitative component used a clustered multi-stage simple random sampling to select
the households for the survey. The survey was carried out in the western Terai region
because of the relatively homogenous nature of the livelihood patterns in terms of
energy consumption, with high degree of dependence on firewood, but potential for
biogas with respect to climate and the livestock situation. The selection was also
suitable in terms of the access to commercial banks and MFIs, and the comparative HDI
situation which was slightly below the national average. Some 800 households were
selected from 10 local councils in the region.

160
The household survey questionnaire contained four sections. The first section informed
the respondents about two potential scenarios, about the existing situation of health
impacts and the climate change impacts of firewood use as well as the government
subsidy situation, and a potential situation where carbon revenues could be earned. The
information coupled with relevant pictures was important both for the respondents who
were aware about the information, and for the respondents who were unaware or partly
aware about the information. This section, together with the combination of the
information and the photographs, comprised the psychographic component, and was
crucial to the survey to improve the incentive compatibility and consequentiality of the
survey. The information in the first section was linked to the CV elicitation and the CE
attributes and levels (choice sets), to provide relevant cues to the respondents to answer
truthfully. The second section and third section used the CV and CE to essentially
understand the consumers WTP for a biogas plant in relation to the yearly
environmental income, with and without explicit credit options. The SBDC format was
used because of its ability to induce a market-like structure, as well as the possibility to
design bid values around the market price of the biogas digester, to provide cues to the
respondents, in terms of obtaining the required demand function. The SBDC was used
to assess an average WTP and the WTP a full price for the biogas digester if the
households earned a regular yearly income due to the carbon emission reduction. The
CE was designed to further analyse the consumers’ willingness to take a credit to pay
for the biogas digester, and, therefore an explicit price attribute was not used. The fourth
section was used to obtain socio-demographic information, especially in relation to the
current energy and credit practices of the households

161
Chapter 8 Econometric Framework and Model Specification
This chapter describes the parametric and non-parametric models used for the
estimation of CV and CE results. First, the specification of the Turnbull estimator used
for non-parametric estimation of CV results is explained. Second, the specifications of
parametric discrete choice model used for CV data is explained. Last, the specifications
of the conditional logit, random parameter logit and latent class logit models used for
parametric analysis of the CE data are explained. Following the research design, the
model for the CV data analysis is used to 1) estimate a WTP value for the biogas plant
and 2) to analyse the WTP the full price of the biogas plant together with potential
yearly environmental income earned by the households. In both the analyses, the
influence of various implicit credit parameters is included. Further, the model for the
CE analysis seeks to understand the influence of various explicit credit measures on the
decision to purchase a biogas digester in conjunction with the yearly environmental
income.
8.1 Non-Parametric Specification – Turnbull Estimator
The non-parametric technique is used when the distribution or the functional forms can
have a substantial impact on the choice parameters and estimates, such as the WTP. The
non-parametric estimation is robust against assumed distributional misspecification
(Nepal, Steltzer, Bohara, & Cullen, 2018) and is easy to compute (Haab & McConnell,
1997), and does not assume a closed form distribution of the parameters to be estimated.
However, the non-parametric approach offers minimal information compared to
parametric estimations115. Several distribution-free estimators are available for discrete
choice data. However, the Turnbull estimator gives a straightforward estimate of the
WTP. The assumption in the Turnbull approach is that the full mass of the distribution
falls at the lower bound of the range of prices for each mass point. This distribution-free
less-restrictive approach is also useful to have as a starting point for the WTP estimate
(Persson & Svensson, 2013). The Turnbull estimator proposed in Turnbull (1976) has
been used frequently for CV studies, from Haab and McConnell (1997) to more recent
uses by Persson and Svensson (2013) and by Nepal et al. (2018). Haab and McConnell
115 The survey uses discrete choice questions for both the CV and CE. Discrete choice results can be
analysed using both the parametric and non-parametric estimation techniques. In this study, the non-
parametric estimation is used for the CV only, since the CE does not involve estimation of WTP values.

162
(1997) and provides the basic model which was adopted from Carson, Wilks, and
Imber (1994) and (1994). A challenge with implementing a distribution-free estimator is
that the No response probability does not necessarily increase with the bid price. The
Turnbull estimator requires such a monotonicity restriction for it to be, and combining
of responses to specific bids can be required to achieve monotonicity.
As per Haab and McConnell (1997) and (2002), in a discrete choice CV elicitation, a
respondent is asked a dichotomous question; “Are you willing to pay $ 𝑡𝑗 for the good
and/or services?” Under this, let WTPn be the willingness to pay for individual n. If the
response is “Yes”, then WTPn ≥ tj and if the response in “No”, then 𝑊𝑇𝑃𝑛 < 𝑡𝑗.
Consider that 𝑀 distinct prices are offered, which are indexed as 𝑡𝑗| 𝑗 = 0,1,2,3, … , 𝑀
to a sample size of 𝑇 respondents. The WTP is unobservable to the researcher, and can
be considered a random variable with a cumulative distribution function of 𝐹𝑤(𝑊),
where the probability of a randomly chosen respondent having WTP less than $ 𝑡𝑗 can
be written as:
𝑃𝑟 (𝑊𝑇𝑃𝑛 < 𝑡𝑗) = 𝐹𝑤(𝑡𝑗) = 𝐹𝑗 (13)
Similarly,
𝑃𝑟 (𝑊𝑇𝑃𝑛 < 𝑡𝑗−1) = 𝐹𝑗−1 (14)
where, 𝐹𝑀+1 = 1 and 𝐹0 = 0 and 𝐹𝑗 represents the proportion of “No” responses for
the 𝑗𝑡ℎ bid price.
Now, let us consider that the WTP is between the intervals of 𝑡𝑗−1 and 𝑡𝑗, then the
probability can be described as:
𝑃𝑟 (𝑡𝑗−1 < 𝑊𝑇𝑃 < 𝑡𝑗) for 𝑗 = 0,1,2,3 … . 𝑀 + 1 (15)
Then, probability (𝑃𝑗) can be:
𝑃𝑗 = 𝐹𝑗 − 𝐹𝑗−1 (16)
The Turnbull model can be estimated by treating either the 𝐹𝑗 or 𝑃𝑗, where j is 1 to M, as
parameters. When the Fj are parameters, the likelihood function can be expressed as:

163
𝐿(𝐹; 𝑁, 𝑌) = ∑ [(𝑁𝑗 𝑙𝑛 𝐹𝑗 + 𝑌𝑗 𝑙𝑛 (1 − 𝐹j)𝑀
𝑛=1] (17)
where,
𝑁𝑗 is the number of No respondents to 𝑡𝑗, and
𝑌𝑗 is the number of Yes respondents to 𝑡𝑗, and
(1- FM) = P M+1 is equal to the probability that WTP is greater than the highest finite
bid. Therefore, equation (17) can also be re-written as
𝐿(𝑃; 𝑁, 𝑌) = ∑[𝑁𝑗 ln (∑ 𝑃𝑖
𝑗
𝑖=1
) + 𝑌𝑗
𝑀
𝑗=1
ln (1- ∑ 𝑃𝑖
𝑗
𝑖=1
)] (18)
To obtain a valid probability density function, the sum of the 𝑃𝑗s must be equal to one
and for a valid density function, they must be positive and fall within the unit interval.
The Turnbull algorithm solves the first-order conditions from the maximisation of
equation (18) taking into consideration the non-negativity constraints. The general first
order unconstrained equation is:
𝜕𝐿
𝜕𝑃𝑖= ∑ (
𝑁𝑗
∑ 𝑃𝑘𝑗𝑘=1
−𝑌𝑗
1 − ∑ 𝑃𝑘𝑗𝑘=1
) ≤ 0 where 𝑃𝑖
𝑀
𝑗=𝑖
≥ 0
𝑃𝑖 𝜕𝐿
𝜕𝑃𝑖 = 0
(19)
The equation ensures that 𝑃1 > 0, so long as 𝑁1 ≠ 0. Hence the first order condition for
𝑃1 always holds the equality when there is at least one No response.
Assuming 𝑃2 ≠ 0, then;
𝜕𝐿
𝜕𝑃1−
𝜕𝐿
𝜕𝑃2=
𝑁1
𝑃1−
𝑌1
1 − 𝑃1 = 0 (20)
Now, 𝑃1 can be solved directly,
𝑃1 =𝑁1
𝑁1 + 𝑌1 (21)

164
Similarly, if 𝑃3 > 0, 𝑡ℎ𝑒𝑛 𝜕𝐿
𝜕𝑃3 is subtracted from
𝜕𝐿
𝜕𝑃2 to derive
𝑃2 =𝑁2
𝑁2 + 𝑌2− 𝑃1 (22)
𝑃2 is positive if:
𝑁2
𝑁2 + 𝑌2>
𝑁1
𝑁1 + 𝑌1 (23)
Where, 𝑁𝑗
𝑁𝑗 +𝑌𝑗 is the proportion of No responses to 𝑡𝑗, and since Turnbull treats each
group of the sample which is offered the same amount as a series of independent
Bernoulli trials, it becomes a natural estimator of 𝐹𝑗. The assumption is that the
proportion of No responses is greater for higher bid amount, 𝑡2, than for the lower bid
amount 𝑡1. However, if the opposite is found, that is:
𝑁2
𝑁2 + 𝑌2<
𝑁1
𝑁1 + 𝑌1 (24)
Then, such proportion of “No” responses are pooled together, to re-estimate the
associated 𝑃𝑗.
Once the monotonic cdf is constructed as per the above, a lower bound expected WTP
value can be obtained. The major steps for this, as outlined by Haab and McConnell
(1997) and adopted by Nepal et al. (2018) are:
1. Sort the unique bid levels in ascending116 order, and index them 𝑡𝑗, j = 1,2, …,
M.
2. For each bid level, calculate 𝐹𝑗 = 𝑁𝑗/(𝑁𝑗 + 𝑌𝑗).
3. Starting with j=1, compare 𝐹𝑗 and 𝐹𝑗+1.
(a) If 𝐹𝑗+1 > 𝐹𝑗 , continue to next step.
(b) If 𝐹𝑗+1 ≤ 𝐹𝑗 , then pool jth and (j+1) bid levels into single bid levels such
that 𝑡𝑝𝑜𝑜𝑙𝑒𝑑 = 𝑡𝑗, 𝑁𝑝𝑜𝑜𝑙𝑒𝑑 = 𝑁𝑗 + 𝑁𝑗+1 , and 𝑌𝑝𝑜𝑜𝑙𝑒𝑑 = 𝑌𝑗 + 𝑌𝑗+1 .
4. Repeat steps 2 and 3, until 𝐹𝑗 < 𝐹𝑗+1for all 𝑗.
116 For WTA, the data are ordered in descending order.

165
As per the above, the lower bound WTP is given by
E(𝐿𝐵𝑊𝑇𝑃) = ∑ 𝑃𝑗𝑡𝑗−1
𝑀+1
𝑗=1
(25)
Or,
E(𝐿𝐵𝑊𝑇𝑃) = ∑ 𝑡𝑗
𝑀+1
𝑗=1
(𝐹𝑗+1 − 𝐹𝑗) (26)
This lower bound estimate is distributed asymptotically normal, it is a linear
combination of 𝑃𝑗𝑠, which are also asymptotically normal. Therefore, the variance of
the mean expected WTP is:
𝑉(E(𝐿𝐵𝑊𝑇𝑃)) = ∑ 𝑡𝑗−12 ⌊𝑉(𝐹𝑗) − V(𝐹𝑗−1)⌋ −
𝑀+1
𝑗=1
2 ∑ 𝑡𝑗−1𝑡𝑗
𝑀
𝑗=1
𝑉(𝐹𝑗) (27)
where, 𝑉(𝐹𝑗) = 𝐹𝑗(1−𝐹𝑗)
𝑁𝑗+𝑌𝑗 is the variance of 𝐹𝑗 .
Further, because the Turnbull method provides point mass estimates of discrete choice
of bids, the median can only be defined within a range. Since, the response proportions
are consistent estimates of the distribution point masses at each bid amount, the bid for
which the distribution function passes 0.5 is the lower bound of the range of median
WTP. While, the next highest price represents the upper bound on the range of the
median WTP.
8.2 Parametric Specification
The parametric models allow for the incorporation of the respondent characteristics in
the functional form. Therefore, the models offer a better understanding of the choice
parameters in relation to the individual’s characteristics. This helps to improve the
reliability and validity of the results, as well as to extrapolate the research findings to a
more general population (Haab & McConnell, 2002). The goal of the parametric
estimation for the discrete choice CV elicitation is not only to calculate the WTP, but
also to understand how the covariates and the characteristics affect the WTP, especially
in relation to the offer of environmental incomes. In this context, there are two
objectives 1) to estimate the WTP value for the biogas plant and 2) to analyse the WTP
the full price for the biogas digester with respect to the influence of the yearly

166
environmental incomes. The discrete CE model objective is to understand the impact of
financial attributes including the yearly environmental income on the decision making
of the respondents, and how the choices interact with individual characteristics, rather
than to estimate the marginal values. However, there is risk of misspecification. If the
estimated model differs radically from the true-but-unobserved model, then the
covariate effects can be wrong in magnitude and size, and the estimations will not be
valid.
8.2.1 Contingent valuation
Hanemann and Cameron introduced modelling of the WTP function for discrete choice
CV (Haab & McConnell, 2002). The basic idea is that the WTP is a well-defined
concept, and can be d by determined by the question of whether the respondent’s WTP
exceeds the price that is offered to the respondent. The WTP is the amount of money
that makes respondents indifferent between the status quo and the proposed CV
scenario of having a biogas digester. Solving the equality, WTP can be defined as a
function of income, covariates and the unobserved random preferences. A respondent
answers yes when WTP exceeds the required payment. Hence, the WTP statement can
be as derived from Equation 4, and adapted from (Haab & McConnell, 2002) as:
𝑊𝑇𝑃(𝑦𝑛, 𝑧𝑛, 𝜀𝑛) > 𝑡𝑗 (28)
However, this will be true if and only if:
𝑢1(𝑦𝑛 − 𝑡𝑗 , 𝑧𝑛, 𝜀1𝑛) > 𝑢0(𝑦𝑛, 𝑧𝑛, 𝜀0𝑛) (29)
where, 𝑢1 is the utility due to the proposed CV scenario, and 𝑢0 is the utility of the
status quo. The determinants of utility for individual 𝑛 are 𝑦𝑛, the discretionary income,
𝑧𝑛, which represents a vector of an individual’s personal and household characteristics,
and 𝜀𝑛 = 𝜀1𝑛 − 𝜀0𝑛, an error component of the respondent’s preferences known only to
the respondent and not to the researcher.
The respondent answers yes to a proposed bid of 𝑡𝑗 if the utility due to the biogas
digester exceeds the utility at the status quo. However, the nature of the random part of
the preferences is unknown, and therefore, only probability statements can be made
considering that, 𝑢1 > 𝑢0. As per random utility theory, indirect utility can be
described as the additive component of deterministic and stochastic components,

167
𝑣1(𝑦𝑛 − 𝑡𝑗 , 𝑧𝑛) + 𝜀1𝑛 > 𝑣0(𝑦𝑛, 𝑧𝑛) + 𝜀0𝑛 (30)
Consequently, the probability statement can be written as:
Pr[𝑊𝑇𝑃(𝑦𝑛, 𝑧𝑛, 𝜀𝑛) > 𝑡𝑗] = 𝑣1(𝑦𝑛 − 𝑡𝑗 , 𝑧𝑛) + 𝜀1𝑛
> 𝑣0(𝑦𝑛, 𝑧𝑛) + 𝜀0𝑛] (31)
This shows that both the direct WTP function and the utility difference function can be
used for the parametric modelling of discrete choice CV data. For certain functions,
such as the linear function, the random utility and random WTP models are the same,
because the underlying assumption is the same, which is related to the utility difference
in relation to compensating variation. Appendix 11 shows the derivation of the discrete
choice CV with a random utility model and its similarity with the random WTP model.
However, the WTP function is more transparent than the utility difference, and can lead
to more plausible distributions (Haab & McConnell, 2002).
Non-Linear Exponential WTP Function
A random WTP exponential functional form is assumed in the case of the first WTP
elicitation related to the WTP for the biogas digester. The exponential functional form is
assumed because of the expectation that the WTP distribution will be positive but
skewed because of the differing WTP based on primarily the differences in income of
the households. The analysis assumes that the WTP is an exponential function of a
linear combination of attribute vectors and an additive stochastic preference term,
𝑊𝑇𝑃𝑛 = 𝑒𝛾𝑧𝑛+ε𝑛 (32)
Where, 𝛾 and 𝑧𝑛represents m-dimensional vectors of the parameters to be estimated and
the individual’s personal and household characteristics, and ε𝑛is a stochastic error with
mean zero and unknown variance, 𝜎2. The probability of respondent 𝑛 replying yes to
an offered bid of 𝑡𝑗 is equivalent to the probability of the random WTP function being
greater than the offered bid:
Pr(𝑦𝑒𝑠𝑗) = Pr(𝑊𝑇𝑃𝑛 > 𝑡𝑗)
= Pr(𝑒𝛾𝑧𝑛+ε𝑛 > 𝑡𝑗)

168
= Pr(ε𝑛 > ln(𝑡𝑗) − 𝛾𝑧𝑛) (33)
Normalising by the unknown standard error, 𝜎, to standardise the stochastic error results
in the probability of a “yes” response:
Pr(𝑊𝑇𝑃𝑛 > 𝑡𝑗) = Pr (ε𝑛
𝜎>
1
𝜎ln(𝑡𝑗) −
𝛾
𝜎𝑧𝑛)
= Pr(𝜃𝑛 > 𝛽ln(𝑡𝑗) − 𝛾∗𝑧𝑛)
= Pr(𝜃𝑛 < −𝛽ln(𝑡𝑗) + 𝛾∗𝑧𝑛) (34)
Since this probability represents a linear combination of functions of covariates
[ln(𝑡𝑗), 𝑧𝑛], assuming ε𝑛 is either normally or logistically distributed, results in a model
that is estimable with a standard probit or a logit model. Estimation leads to the
recovery of −1
𝜎 and
𝛾
𝜎 .
If ε𝑛 is distributed normally with mean zero and constant variance 𝜎2, then 𝑒𝜀𝑛 is
distributed log-normally with mean 𝑒1
2𝜎2
and variance, 𝑒2𝜎2− 𝑒𝜎2
. Substituting into the
expectation of WTP yields expected WTP from the probit model as:
𝐸𝑛(𝑊𝑇𝑃|𝑧𝑛, 𝛾) = 𝑒𝛾𝑧𝑛+12
𝜎2
(35)
Since, ε𝑛is symmetric about zero, median WTP can be calculated by substituting ε𝑛 = 0
such that:
𝑀𝐷𝑛(𝑊𝑇𝑃|𝑧𝑛, 𝛾) = 𝑒𝛾𝑧𝑛 (36)
If ε𝑛 is distributed logistically with mean zero and constant variance 𝜎2𝜋2
3, then 𝑒𝜀𝑛is
distributed log-normally with mean 𝜎𝜋
sin(𝜎𝜋) and variance, 𝑒2𝜎2
− 𝑒𝜎2. Substituting into
the expectation of WTP yields expected WTP from the logit model as:
𝐸𝑛(𝑊𝑇𝑃|𝑧𝑛, 𝛾) =𝜎𝜋
sin(𝜎𝜋)𝑒𝑧𝑛𝛾 (37)
Median WTP can be calculated by substituting ε𝑛 = 0 such as:
𝑀𝐷𝑛(𝑊𝑇𝑃|𝑧𝑛, 𝛾) = 𝑒𝛾𝑧𝑛 (38)

169
8.2.2 Choice experiment
Following Holmes and Adamowicz (2003), the indirect utility under the random utility
framework from equation (9) can be written as
𝑈𝑗 = 𝑉(𝑥𝑗; 𝜷) + 𝜀𝑗 (39)
where 𝑈𝑗 is the indirect utility of the respondent associated with alternative 𝑗, 𝑥𝑗 is a
vector of attributes associated with alternative 𝑗, and 𝛽 is the vector of preference
parameters known as a part-worths, and 𝜀𝑗 is the random error component. Choice of
any alternative is deterministic from the perspective of the respondent, but stochastic
from the perspective of the researcher who does not know everything about the
individual. Since the utility is assumed to be linear in the attributes and its parameters,
we can define the utility as:
𝑈𝑗 = ∑ 𝛽𝑘𝑥𝑗𝑘
𝐾
𝑘=1
+ 𝜀𝑗 (40)
Where βk is the preference weight associated with attribute k, and xjk is the attribute k for
alternative j, and represents the level of the attribute. If interactions are included in the
experimental design, then the utility function is:
𝑈𝑗 = ∑ 𝛽𝑘𝑥𝑗𝑘
𝐾
𝑘=1
+ ∑ ∑ 𝛽𝑘𝑚𝑥𝑗𝑘𝑥𝑗𝑚
𝐾
𝑘=1
𝑀
𝑚=1
+ 𝜀𝑗 (41)
where 𝛽𝑘𝑚 is the vector of preference parameters for the interaction term between
attributes 𝑘 and 𝑚, and 𝑥𝑗𝑘 and 𝑥𝑗𝑚 are the attributes 𝑘 and 𝑚 in alternative 𝑗. The
differentiation of the equation shows that the parameter estimates βk are equal to the
marginal utilities as, 𝜕𝑈/𝜕𝑥𝑘 = 𝛽𝑘. The marginal rates of substitution between any two
attributes can be estimated as the ratio of the parameter values i.e. 𝛽𝑘/𝛽𝑚. Further, in
the case of interaction terms as in equation (44), the marginal utility depends on the
level of xm, such that 𝜕𝑈/𝜕𝑥𝑘 = 𝛽𝑘 + 𝛽𝑘𝑚𝑥𝑚.
The derivation of a specific random utility model depends on the assumed distribution
of the random error term. The conditional logit (CL) model is the basic starting
specification for any discrete CE and assumes the error terms are independently and
identically distributed (iid) and follow an extreme value type 1 Gumbel distribution

170
(Holmes & Adamowicz, 2003; McFadden, 1973). The conditional logit probability of
choosing an alternative i from a set of alternatives 𝐶 is expressed as:
Pr(𝑖|𝐶)=𝑒𝑥𝑝(∑ 𝛽𝑘𝑥𝑖𝑘
𝐾𝑘=1 )
∑ 𝑒𝑥𝑝𝑗∈𝐶 (𝛽𝑘𝑥𝑗𝑘) (42)
The general form of the conditional logit is:
Pr(𝑖)=𝑒𝑉(𝛽,𝑥𝑖)
∑ 𝑒𝑉(𝛽,𝑥𝑗)𝑗
(43)
where, 𝑉(𝛽, 𝑥𝑖) is the observed component of the utility function for alternative 𝑖, and
𝑖 is part of the set of alternatives 𝑗. The choice is because of the trade-off between the
attribute levels across all the alternatives. Conditional logit is like multinomial logit in
that both models rely on the same statistical assumptions about the relationship between
choice and the variables used to explain choice. However, multinomial logit is often
used to describe models that relate choices to the characteristics of the respondents
making the choices only (Hauber et al., 2016).
Further, the use of the CL model depends on an axiom of independence of irrelevant
alternatives (iia) (Luce & Tukey, 1964; McFadden, 1973) which states that the relative
odds of an alternative being chosen over a second should be independent of the presence
or absence of an unchosen third alternative or their attributes. The iia assumption is
related to the ratio of probabilities as,
𝑃𝑟(𝑖)
𝑃𝑟(𝑗)=
𝑒𝑉(𝛽,𝑥𝑖)
𝑒𝑉(𝛽,𝑥𝑗) (44)
where the ratio is unaffected by any third alternative. The imposition of the axiom
results in inflexible elasticities leading to substitution patterns that are simplistic. At the
same time, the cross elasticities are identical117. This results in restrictive assumptions
of consequent consumer preferences (Holmes & Adamowicz, 2003). In practice, iia
violations occur for many reasons, including heterogeneity of preferences.
117 The percent change in probability of choosing i for a percent change in an attribute level in any
alternative j is the same.

171
Further, the CL model has two fundamental restrictive limitations related to
heterogeneity. First, the model assumes a constant scale parameter, with the model
measuring utility on the same scale, equally badly or equally well, across all
respondents and choice tasks. This assumption allows the model to ignore the
systematic variations in the model variance across choice questions or the respondents
which can result in biased estimates (Hauber et al., 2016). Hess and Train (2017) have
defined the variance in scale as the differences in the respondent’s choice due to the
impact of factors that are (not) included in the choice question. Accordingly, the
coefficient magnitude of the attributes is large if the choice is unaffected by the factors
that are not included in the model i.e. the response errors are less. Therefore, scale
heterogeneity is a form of correlation among utility coefficients due to which parameter
estimates of the included attributes become larger in magnitude for some respondents
than others. The second limitation assumes that the preference structure (taste) is
homogenous across the respondents, and therefore the model is not able to account for
unobserved systematic variations in preferences across or within respondents or choice
tasks. This inability to account for the preference heterogeneity can lead to biased
estimates as well. Some authors have gone as far as suggesting that the
preferences/tastes are homogenous, and any systematic variations are due to the scale
heterogeneity only (Hess & Rose, 2012). Various other more sophisticated models have
been developed that relax these restrictive assumptions.
The random parameter logit (RPL) and latent class (LC) models are the most widely
used models to analyse the systematic variations due to heterogeneity in CEs (Keane &
Wasi, 2013; Sagebiel, 2017). Both the models are versions of the mixed logit model
which is a highly flexible model that can approximate any random utility model (Hess
& Train, 2017). Mixed logit models allow for random taste variation, unrestricted
substitution patterns, and correlation in unobserved factors (Bailey & Wilson, 2009).
The RPL is the most straight-forward and most widely used derivation of the mixed
logit probability model, where the heterogeneity is captured by estimating the mean and
variance of the attributes, resulting in systematic variations across respondents. The
RPL model conceptualises a random term that adjusts for individual specific systematic
variations, and unlike the conditional logit model, captures both the mean effect and the
variance across the sample respondents. The choice probability for an RPL model is:

172
Pr(𝑖𝑛|𝐶)=𝑒𝑉(𝛽𝑛,𝑥𝑖𝑛)
∑ 𝑒𝑉(𝛽𝑛,𝑥𝑗𝑛)𝑗
(45)
Where n represents the respondent n in the sample, 𝛽𝑛 = 𝑓(𝛽, 𝜎|𝜗𝑛), where 𝛽 and 𝜎 are
the parameters to be estimated reflecting the systematic variations across the individuals
in the sample, and where the variable 𝜗𝑛 characterises the respondent’s heterogeneity,
and 𝑓(∗) describes the distribution of the random parameter 𝛽𝑛 across the respondent
𝛽𝑛 is typically assumed to be distributed normally with mean 𝛽 and standard
deviation 𝜎 though other distributed choices are possible. For a normal distribution,
𝛽𝑛 = 𝛽 + 𝜎𝜗𝑛 for 𝜗𝑛~N(0,1) (46)
Equation (49) shows that the choice probability with conditional logit is a special case
of RPL where the standard deviation 𝜎 = 0. Therefore, the overall conditional
probability, conditional on 𝛽𝑛, can be derived as an integral function:
Pr(𝑖)= ∫𝑒𝑉(𝛽𝑛,𝑥𝑖𝑛)
∑ 𝑒𝑉(𝛽𝑛,𝑥𝑗𝑛)𝑗
𝑓 (𝛽)𝑑𝛽 (47)
The literature suggests that the researcher is free to specify a distribution for the random
parameter according to the behavioural expectation of the study (Train, 2009).
The latent class (LC) logit model is a semi-parametric specification, which does not
require any assumption of distribution, and is considered a comparatively more
informative model compared to the RPL, with a slightly higher dominance of use in the
literature (Sagebiel, 2017). Under regular LC choice models, it is assumed that the
values of the scale factor are the same for all respondents regardless of the latent class to
which they belong. However, this equality assumption can be violated in LC models
derived based on conditional logit model specifications, where the part-worth
preference parameters are confounded with a scale parameter which reflects the amount
of uncertainty by different respondents (Magidson & Vermunt, 2007). This is because
in such choice models, the preference estimates are perfectly confounded with the
inverse of the error variance. Therefore, it becomes unclear whether the differences
between groups are due to the differences in preferences, differences in error variability,
or due to both (Burke, Aubusson, Schuck, Buchanan, & Prescott, 2015). This leads to
the formation of spurious segments that mainly differ in terms of scale, or the response
error, but don’t differ much in terms of real preference patterns leading to

173
misclassification as well as incorrect parameter estimates (Magidson & Vermunt, 2007).
In this study, we seek to fit a Scale-Adjusted LC (SALC) model which adjusts for
differences in scale, resulting in more meaningful segments that differ only in
preferences (Glenk, Hall, Liebe, & Meyerhoff, 2012). Using the SALC approach,
individuals are described as having some probability of being in a latent preference
class, which distinguishes their preferences for each feature level. In addition,
simultaneously they are described as having some probability of being in a certain latent
scale class, which distinguishes their level of choice consistency from other respondents
(Burke et al., 2015). The probability of choice for a respondent in a SALC model can be
expressed as:
Pr(𝑖𝑛|𝑞, 𝑑)=𝑒𝑉(𝛼𝑑𝛽𝑞,𝑥𝑖𝑛)
∑ 𝑒𝑉(𝛼𝑑𝛽𝑞,𝑥𝑗𝑛)𝑗
(48)
where the probability of choosing alternative 𝑖 for a respondent 𝑛 depends on the latent
preference class or segment 𝑞 = 1,2, … . . , 𝑄 and the unobserved scale parameter class
𝑑 = 1,2, … . , 𝐷, and each individual is expected to belong to a class based on their
preference parameter, 𝛽𝑞, and identified by a scale parameter, 𝛼𝑑. For identification
purposes, a single scale parameter is normalised to one, and the remaining scale
parameters are ratios of the reference scale class.
The class membership can be identified through the set of observed covariates and/or
sociodemographic characteristics, and that process can be specified as a separate
multinomial logit model. The probability of preference class membership can be
expressed as:
Pr(𝑛𝑞|𝑑)=𝑒𝑉(𝜃𝑞,𝑍𝑛)
∑ 𝑒𝑉(𝜃𝑞,𝑍𝑛)𝑞
(49)
Similarly, the probability of belonging to a scale group can be expressed as
Pr(𝑛|𝑑)=𝑒𝑉(𝛾𝑑,𝑍𝑛)
∑ 𝑒𝑉(𝛾𝑑,𝑍𝑛)𝑑
(50)
where the vector 𝑍𝑛 represent a vector of covariates and/or sociodemographic
characteristics for individual 𝑛, and 𝜃 and 𝛾 are the respective vectors of parameter
estimates of the 𝑍𝑛 covariates.

174
The joint probability that an individual belongs to a segment 𝑞 and group 𝑑 and chooses
alternative 𝑖 is the product of the probabilities. As per Holmes and Adamowicz (2003),
the overall probability then can be expressed as
Pr(𝑖)= ∑ ∑ 𝜋𝑛|d
𝑄
𝑞=1
𝐷
𝑑=1
𝜋𝑛𝑞|d𝜋𝑖𝑛|q,d (51)
The number of preference and scale classes can be obtained by comparing the different
information criteria such as the Bayesian Information Criterion (BIC) respective to a
class solution, which would indicate the model fit and identify what number of
preference and scale classes are appropriate.
8.3 Discussion and Conclusion
Non-parametric Turnbull estimation is specified to obtain the lower bound mean WTP,
which gives a starting point for the WTP estimates for the biogas plant. The random
utility model is the basic decision making model used in the parametric estimation of
both the discrete choice CV and CE methods. The model expresses the utility derived
by a consumer as the additive function of fixed deterministic components and the
random stochastic component induced during the decision making process. In the case
of CV, the fixed deterministic components are the observed bid levels, psychographic
and socioeconomic parameters of the respondents, whereas in the case of CE for this
study, they are the observed credit attributes and their levels. The error component in
both the CV and CE estimation is assumed to be independently and identically
distributed. In the case of CV, either a normal or logistic distribution can be assumed
based on the estimation, where as in the case of CE the error terms follow an extreme
value type 1 Gumbel distribution.
In the case of CV, since the WTP is a well-defined concept, it can be specified by using
a direct random WTP model. However, its theoretical premise is the same as the utility
difference specified in relation to the compensating variation, which considers that the
consumers are willing to pay for the biogas digester only when the utility due to the
proposed CV scenario is better than the status quo situation. The non-linear functional
form was used with the expectation that the WTP for the biogas digester will not be
normally distributed, and a median WTP will be a more robust measure of the average
WTP for the biogas plant.

175
For the CE, the random utility model is used as a behavioural model to understand
preferences for credit alternatives. Three types of model were specified to estimate the
CE results. The CL is the basic starting model which assumes the relative odds of
choosing an alternative over a second alternative is independent of the irrelevant third
alternative. Therefore, the model does not allow estimation of any variation in the
respondents’ choice behaviour. This assumption is simplistic and restrictive, and does
not consider the heterogeneity in the taste/preference and scale/magnitude across
respondents and choice tasks. Therefore, RPL and LC logit models are also specified to
analyse the choice heterogeneity. RPL relaxes the simplistic assumptions of the CL
model. The model conceptualises a random term that adjusts for the systematic
variations to estimate both the mean and the variance of the attributes, which provides a
structural advantage to understand the heterogeneity in preferences. While various
distributional forms of the random parameter can be assumed, a normal distribution is
assumed for the study. A SALC logit model is specified, where the heterogeneity can be
identified both in terms of consumers’ probabilistic membership to a scale class due to
variations in response error as well as a preference class due to taste variation. These
class memberships can be effectively specified as unique CL models, and an additional
simultaneously estimated equation is specified to predict joint membership of the
different classes. Therefore, the SALC model is a more informative model, where the
class memberships can also be uniquely defined in relation to the other observed
covariates.

176
Part III Results
The third part examines the application of the econometric model specified in the
methodology section with respect to data from the sample households. This part also
presents the results of the qualitative analysis. The part is divided into four chapters: the
first chapter (Chapter 9) contains the descriptive statistics in relation to the household
characteristics, their energy consumption, and financial access situation. The second
chapter (Chapter 10) describes the CV results and the third chapter (Chapter 11)
describes the CE results, together with the market share estimates. The fourth chapter
(Chapter 12) elaborates the results from the qualitative analysis.

177
Chapter 9 Descriptive Statistics
This chapter describes the respondent and household characteristics. The data obtained
are compared to the regional and/or national data as available. The respondent
characteristics are described based on age and literacy. The household characteristics
are described based on income and wealth as well as their energy consumption and
access to finance status. The energy consumption focuses on the fuel used for cooking,
and the financial access focuses on the type of credit used by the households, and
contains a measure of household commitment to take credit for biogas installation.
9.1 Introduction
The survey was carried out in the villages shown in Error! Reference source not
found. from 1 to 30 November 2017. The surveyors were provided a set number of
questionnaires for each location.
In each village, the enumerators selected the first household randomly, and if there was
nobody in or the household did not want to do the survey, the next household was
selected. The enumerators each completed about 6-8 household surveys per day. The
survey was carried out immediately after the harvest and around the major festivals,
when the households had time to complete the face-to-face survey with the enumerators.
Each enumerator was provided with the required number of questionnaires, answer
sheets, sets of pictures and colour-coded choice cards, according to the research design.
Table 9-1: Names of Sampled Locations
S.N Village names Council Province Development Region
1 Punarbas Punarbas 7 Far-western
2 Hasuliya Kailari 7 Far-western
3 Bansgadhi Bansgadhi 5 Mid-western
4 Bejapur Raptisonari 5 Mid-western
5 Dhanauri Shantinagar 5 Mid-western
6 Gugauli Vijaynagar 5 Western
7 Jahadi Kapilvastu 5 Western
8 Rudrapur, Gajedi Kanchan 5 Western
9 Sarawal Sarawal 5 Western
10 Dawannedevi Bardaghat 5 Western

178
The descriptive statistics contain information on household characteristics, their energy
use and financing status. The observation from the sample survey is compared to the
data from the Census survey which was conducted in Fiscal Year (FY) 2010/11, and
data from the National Living Standard Survey (NLSS), 2010/11. Both the Census
survey and the NLSS survey was carried out by the Central Bureau of Statistics (CBS)
of Nepal. Other appropriate sources are used where data are not available from these
sources. In case of the financing status, data from the recent Finscope Consumer
Survey, 2014 is used. This survey was implemented by the Central Bank of Nepal, as
part of the larger multi-country financial inclusion initiative being supported by the
United Nations Capital Development Fund (UNCDF). Chi squared tests of
independence and t-tests were conducted to determine whether the sample
demographics were significantly different from the regional and/or the national level
values.
9.2 Household Characteristics
The household characteristics are presented in Table 9-2. The percentage of female
respondents is 49.3%, which is statistically equivalent to both the regional and national
average. The age groups were compared with the adjusted age groups from the total
population, where the Chi-square test indicated a significant difference. The sample
population had a higher percentage of younger people. This may be in part due to the
lower overseas migration for work, where the data shows lower sampled households
with members working overseas, at 25.13% compared to the regional and national
average. The comparison of educational qualification shows that the literacy rate118 is
equivalent to the national average. Both the sample and national statistics indicate a low
level of population graduating into college and universities. Further, data showed 60.33
% of the respondents have either never gone to school or have dropped out at primary
level. The national trend of average yearly dropout rate is 5-6% each year. The study
results indicate that regular dropout can lead to a substantial illiterate population
overtime. The average agriculture land owned is 0.63 ha which is lower than the
national and regional values. Further, the household yearly income at US $1,269, is also
less than both the national and rural regional average.
118 This is including the respondents who have attended the adult literacy program who were treated as
equivalent to the respondents who have attended primary level education.

Description
Comparison
Source
Sample Rural Terai 119 National
Respondent
Gender (% Female) 49.38 55.64 51.51 (Central Bureau of Statistics, 2014a)
Age
18 to 24 19.90 16.47 (Central Bureau of Statistics, 2014a)
25 to 50 years 64.33 55.74 (Central Bureau of Statistics, 2014a)
> 50 years 15.77 27.79 (Central Bureau of Statistics, 2014a)
Education
Literacy 68.84 59.6 (Central Bureau of Statistics, 2014b)
119 The Rural Terai average is for the rural Western, and the Far and Mid-Western region.
Table 9-2: Household Characteristics

180
Beyond School - Class 10 (%) 8.39 10.26 (Central Bureau of Statistics, 2014b)
Households (HHs)
HHs with member overseas 25.13 44.47 56 (Central Bureau of Statistics, 2014a)
Average agriculture land (ha) 0.63 0.75 0.68 (Central Bureau of Statistics, 2014c)
Average yearly income (US $) 1,269 1,916 2,024 (Central Bureau of Statistics, 2014c)
Livestock
HHs with cow/s (%) 66.67 58.4 55.7 (Central Bureau of Statistics, 2010b)
HHs with buffalo/s (%) 60.15 38.6 41.85 (Central Bureau of Statistics, 2010b)
Number of cows 1.78 2.2 1.5 (Central Bureau of Statistics, 2010b)
Number of buffalos 1.45 1.2 0.8 (Central Bureau of Statistics, 2010b)

One of the reasons is that the sampling locations are marginal rural locations, where the
households have lower landholding, and which may be correlated with the lower
household income. Further, rural regions tend to have a higher Human Poverty Index
(HPI) than the national average, and the mid-western region, which is part of the study
area, has a higher HPI compared to the other regions, which may be the result of the
lower yearly income range noted by the respondents. The livestock scenario is
comparatively better, and is higher than the regional values. The proportion of
households with livestock is higher than both the national and regional average. The
average number of livestock is suitable to allow the households to install biogas
digesters, and shows that there is good potential for a biogas digester market in the
region. Except for age and literacy rate, the null hypothesis of no independence could
not be rejected.
9.3 Energy Consumption Status
The energy consumption scenario of the sampled population is presented in Table 9-3.
The energy consumption status is statistically different from the both the regional and
national scenario. There is a higher proportion of sampled households using firewood
and sourcing firewood from community forests. The reasons for the higher firewood
consumption may be because the sampled villages are located closer to the community
forest and conservation areas. Further, the firewood collection from community forests
is more prevalent in the rural mid and far western Terai than other locations. The
amount of firewood consumed is lower at 7.84 kg per day per household. This is lower
than the quantity measured by Fox (1984) at 10.675 kg and Kandel, Chapagain, Sharma,
and Vetaas (2016) at 8.4 kg. Further, the firewood quantity is also lower than the
average of the firewood quantity used in the biogas Project Design Documents, for
projects registered with the CDM.
The proportion of households using dried dung is also higher than the regional and
national average. This may be because the sample also consists of households from
three Western region districts of Kapilvastu, Rupandehi and Parasi which have higher
number of villages that use dried dung for cooking as part of their cultural and
traditional practice. The proportion of households using LPG is higher than the regional
average, but is roughly equivalent to the national average. The higher proportion of
households using LPG can be attributed to the rapid penetration of the LPG in the rural
areas. The growth of non-solid fuels, mainly LPG in Nepal, was highest for the SE4All
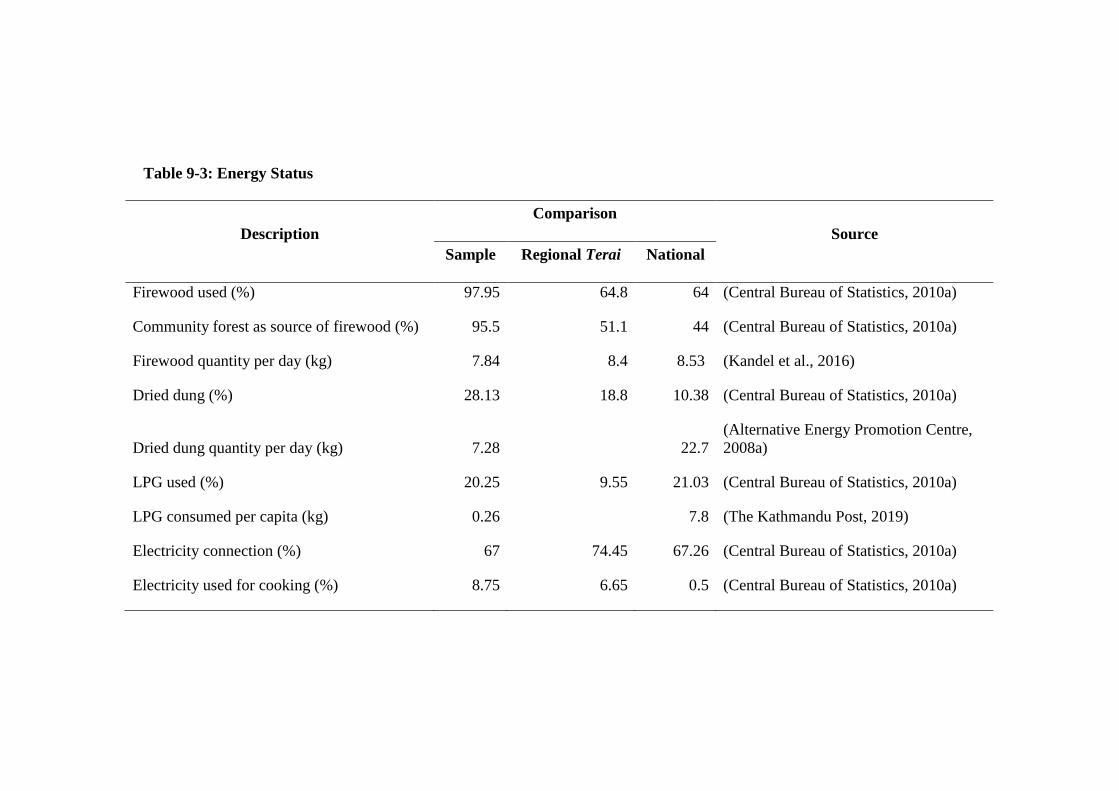
Table 9-3: Energy Status
Description
Comparison
Source
Sample Regional Terai National
Firewood used (%) 97.95 64.8 64 (Central Bureau of Statistics, 2010a)
Community forest as source of firewood (%) 95.5 51.1 44 (Central Bureau of Statistics, 2010a)
Firewood quantity per day (kg) 7.84 8.4 8.53 (Kandel et al., 2016)
Dried dung (%) 28.13 18.8 10.38 (Central Bureau of Statistics, 2010a)
Dried dung quantity per day (kg) 7.28 22.7
(Alternative Energy Promotion Centre,
2008a)
LPG used (%) 20.25 9.55 21.03 (Central Bureau of Statistics, 2010a)
LPG consumed per capita (kg) 0.26 7.8 (The Kathmandu Post, 2019)
Electricity connection (%) 67 74.45 67.26 (Central Bureau of Statistics, 2010a)
Electricity used for cooking (%) 8.75 6.65 0.5 (Central Bureau of Statistics, 2010a)

tracking period of 2010-12 at 2.5%120. However, both the quantity of dung and LPG
consumed is less than the national average, like the firewood quantity consumed.
The proportion of households connected to electricity is equivalent to the national
average, but is lower than the regional average. However, the households using
electricity to cook is equivalent to the regional average but higher than the national
average. The household's median monthly electricity payment is US $2 per month. This
is higher than the monthly base minimum charge of US $0.8 for 20 units, normally used
by lifeline low income households only for lighting. The proportion of households using
electricity for cooking is, however, significantly lower compared to lighting. There is
also high variability in the quantity of electricity consumed, due to its use for other
productive purposes such as poultry by some households. Out of the sampled
households, 54% of the households use only firewood, 1.87% (15 households) use only
dried dung, 0.25% (2 households) use only LPG for cooking, and the rest of the
households use a combination of fuels. Electricity comprises part of the cooking fuel for
70 households for cooking rice in electric rice cookers, while the rest of the meal is
cooked with other fuels.
9.4 Access to Finance
The status of access to finance of the sampled populations in presented in Table 9-4.
Chi-square tests of independence show that except for the households' credit use
experience, the null hypothesis for no independence could not be rejected for the rest of
the parameter values. Some 98.13% of the respondents indicated a good level of access
to finance compared to the rural and national average access situation. This is in terms
of the availability of the commercial banks, microfinance banks, savings and credit
cooperatives and/or groups near the respondent's village. This may be because there are
more banks and financial institutions in the Terai region due to road and electricity
accessibility, and higher population density. Out of the sample population who have
used credit services, 54.34% have used credit from the savings and credit
cooperatives/groups. The rest (45.66%) have used the credit services from microfinance
and commercial banks. This is different to the national data where a higher proportion,
120 The global tracking framework report of the UN SE4All has emphasised the non-solid fuels, which
include primarily the liquid, gaseous fuels, and electricity. In Nepal, liquid kerosene is being replaced by
the more modern gaseous LPG. Electricity is used for rice-cookers.

184
62.5 %, have used credit offered by the banks than the saving and credit
cooperatives/groups.
Further, only 6.35% sample respondents have used the commercial bank credit, even
though nearly 75% of the population in the Terai region have access to commercial
banking facilities (Central Bureau of Statistics, 2014c). This shows that sample
population rely more on credit offered based on the micro finance principles of group
collateral, regular savings and early payments. More than two-thirds of households are
ready to mortgage their land, pay the required service charge, and/or carry-out the
regular savings to acquire loan to install the biogas plants.
9.5 Discussion and Conclusion
The sampled households have comparatively low household income compared to the
regional and national average. This may be attributed to lower land holding and a lower
proportion of households with members working overseas, which are the primary
sources of income for rural households in Nepal. This may also be because the sampled
villages are in marginal areas in terms of their proximity to the forests. The proportion
of households with livestock is higher than the regional and national average, and the
number of livestock is sufficient to allow for the potential of biogas marketing in the
area.
Table 9-4: Financing Status
Description Sample Comparison
Rural National
Access to finance (%) 98.13 82 82
Credit use experience (%) 43.86 49 46
Source of credit
Savings & Credit Cooperatives/Groups (%) 54.34 81.63 78.26
Microfinance bank (%) 39.31 18.36 21.73
Commercial banks (%) 6.35
Ready to mortgage property (%) 71.71 10
Ready to pay the service charge (%) 78.81 47
Ready to contribute to regular savings (%) 92.43 67

185
The households use a combination of fuels for cooking. The proportion of households
using firewood and dried dung is higher than the regional and national average,
however, the quantity consumed by each household is lower than the regional average.
The higher proportion may be due to the proximity to the forests of most of the villages.
In terms of the modern fuels, the use of LPG and grid electricity is increasing compared
to the census data of 2010/11. However, the quantity of LPG consumed is lower than
the national average, which may be due to its occasional use, and not for regular
cooking. Further, the lower firewood and dried dung consumption may be due to
increasing proportion of households also relying on LPG and electricity for cooking.
The access to finance situation is positive for the region. The respondents have access to
credit from several sources such as savings and credit groups/cooperatives, MFIs and
commercial banks. However, less than half of the respondents have experience of using
financial credit, and a very low proportion of respondents have accessed a loan from
commercial banks. Further, in terms of the study objectives, more than two-thirds of
respondents are ready to mortgage their land, pay the required service charge and/or
carry-out the regular savings, to acquire loan to install the biogas plants.

186
Chapter 10 Contingent Valuation Results
This chapter describes the results from the CV section of the household survey. The data
were analysed using both non-parametric and parametric estimation methods. The
Turnbull approach was used to carry out the distribution-free non-parametric
estimation, where it was used to obtain lower bound estimates of WTP value for the
biogas plant. Further, a parametric exponential model was also used to estimate the
WTP for a biogas plant. This was followed by the analysis of a linear model to assess
the influence of the yearly environmental incomes on WTP the full market price for the
biogas plant. The parametric estimation used binary logistic regression models to
estimate the average WTP as well as the WTP the full price given potential yearly
environmental income from biogas operation. Subsequent marginal effects analysis was
conducted to understand the impact of variables on WTP, as well as the potential
market share. The models were estimated using Stata 13.1.
10.1 Non-parametric Estimation
As noted, the Turnbull estimator was used to estimate the lower bound mean WTP
value for the biogas digester. This is related to the first CV question where the
respondents were asked a single bound CV question to understand their WTP values for
the biogas digester. Error! Reference source not found. shows that the proportion of
'Yes' responses for the WTP bid values decreases with higher bid values. This is
consistent with a priori theoretical expectations. Further, as shown in Table 10-1, the
responses do not violate the monotonicity assumption for a standard distribution
function. Therefore, the estimator does not require pooling the ratio of 'No' responses
across any of the bid values to maintain an increasing cumulative distribution of the
WTP probability121.
The mean lower bound estimate of the WTP is US $294.61 with a standard error of US
$7.72. The 95% confidence interval for this mean WTP is US $294.61 ± 1.96*7.72 (US
$279.47, US $309.74). The standard error and the confidence intervals are calculated
using the asymptotic normality as presented in the equation (27) in Chapter 8. The area
121 Nearly 40% of the respondents answered 'Yes' to the highest bid value of US $433.79, and this could
lead to overall higher WTP estimates – this is known as the “fat-tail” problem.

187
above the line in Figure 1 represents the expected lower bound for the 'No' responses.
This is because there are 321 respondents, 67% of the sample, who are not willing to

188
Figure 10-1: WTP and Bid Values
pay the offered bid values. The bid value at which the distribution function passes 0.5
gives the lower bound for the range of the median WTP, and the next highest bid value
gives the higher bound for the range of the median WTP. Therefore, the median WTP
falls between US $329.63 and US $397.22, which is higher than the mean estimated
WTP.
Table 10-1 Turnbull Lower Bound Estimates without Pooling
Bid
Price (tj)
Number
offered (Tj)
Number of Nos
(Nj)
Unrestricted
Fj=Nj/Tj Elb V(Elb)
0 0
185.37 162 30 0.185 0 32.006
236.54 160 38 0.238 9.698 2.964
329.63 159 68 0.428 44.984 13.340
397.22 162 89 0.549 40.119 6.981
450.79 157 96 0.611 24.660 4.343
450.79+ 1 175.148
Mean WTP (US $) 294.61
95% CI 309.74, 279.47
Median WTP range (US $) 329.63 to 397.22

189
10.2 Parametric Estimation
10.2.1 Binary logit models
Binary logit models were used to estimate the parametric values. Definitions of the
variables used in the models are presented in Table 10-3
Table 10-2 Definition of Variables
Variable Definition
Health impact
Dummy variable set to 1 if the respondent was aware
about the health impact of using firewood for
cooking
Climate change impact Dummy variable set to 1 if the respondent was aware
of GHG emissions resulting due to firewood cooking
Subsidy knowledge Dummy variable set to 1 if the respondent was aware
about the government subsidy for biogas installation
Bid value Amount presented to the respondents as the cost to
them of biogas digester installation
Initial WTP
Dummy variable set to 1 if the respondent is willing
to pay the amount presented as the cost of a biogas
plant installation
Yearly environmental
income value
Amount presented to the respondents as income that
households can earn yearly for reducing carbon
dioxide due to the installation of a biogas plant
Female Dummy variable set to 1 if the respondent is female
Education Educational qualification attained by the respondents
in terms of the years of education
Firewood quantity Quantity of firewood used for cooking by the
respondent’s household
Collateral
Dummy variable set to 1 if the respondent is ready to
mortgage her/his house or land to receive a loan for
biogas installation
Regular savings Dummy variable set to 1 if the respondent is ready to
make monthly savings to receive a loan for biogas
Buffaloes The number of buffaloes owned by the household
Household income Respondent's household income

190
Table 10-3 shows the parameter estimates from the model with only the bid value
(Model 1) and the model that includes the socio-demographic and the psychographic
variables, both with and without interactions (Model 2 and 3). The psychographic
variables included are Health Impact, Climate Change Impact, Subsidy Knowledge,
Collateral and Regular Savings. The socio-demographic variables are Female,
Education, Firewood Quantity, Buffaloes and Yearly Environmental Income. The
overall model fit for each of the models is significant at p<0.001. Further, the pseudo R2
increased from 0.09 to 0.17 and 0.19, between the constant/bid value only model
(Model 1) and the extended models with and without the interaction terms (Model 2 and
Model 3). The log likelihoods for the extended models with and without interactions are
8% and 10% larger than for the constant/bid only model, which shows that the extended
models better predict the outcome. The log-likelihood ratio test value of 25.95 between
the models with and without interaction exceeds the critical Chi-square value of χ2 (6)
d.f = 20.52 at α = 0.001, allowing the rejection of the null hypothesis that the extended
model with interaction (model 3) is no better than the model without the interaction
(model 2). While the BIC criterion suggested otherwise, the extended model (model 3)
is used because it also allows for additional analysis, especially the marginal effects
analysis in relation to the significant interaction between variables. There is no
significant collinearity between the bid variable and any other independent variables.
The collinearity diagnostics are presented in Appendix 12.
In Model 3, Bid Level, is significant and negative at p<0.01. This indicates that
respondents’ likelihood of purchasing the biogas digester reduces with the increase in
the cost of the digester. This is as theoretically expected. All the psychographic
variables are significant at p<0.01. Except for Climate Change Impact, the other
psychographic variables have positive effects. As per Table 10-4 the marginal effects
analysis shows that Regular Savings has the largest effect. Respondents who are willing
to make regular savings to access credit for the biogas installation are 29.72% more
likely to purchase the biogas digester compared to respondents who are not.
Respondents who are aware about the harmful health impacts of traditional cooking
practices are 13.76% more likely to purchase the biogas digester compared to the other
group. Similarly, respondents who are aware of the government subsidy are 8.9% more
likely to pay for the biogas.

191
WTP Model 1 Model 2 Model 3
Coef./SE Coef./SE Coef./SE
Bid Value (Multiplied by 1000) -0.076*** -0.088*** -0.091***
(0.008) (0.009) (0.010)
Health Impact 0.943*** 1.842***
(0.256) (0.389)
Climate Change Impact -0.753*** -1.741***
(0.200) (0.501)
Subsidy Knowledge 0.531*** 1.663***
(0.190) (0.487)
Firewood Quantity 0.085*** 0.085*
(0.026) (0.046)
Collateral 0.431* -0.0483
(0.226) (0.277)
Regular Savings 1.263*** 1.620***
(0.384) (0.438)
Household Income (Multiplied by 100000) 0.200 0.200
(0.100) (0.200)
Education 0.177***
(0.057)
Health Impact * Education -0.195***
(0.061)
Subsidy Knowledge * Firewood Quantity -0.152**
(0.060)
Climate Change Impact * Firewood Quantity 0.134**
(0.060)
Table 10-3: Binary Logit Estimations

192
Female -0.344
(0.356)
Female * Collateral 0.804*
(0.412)
Constant 2.891*** 0.288 -0.462
(0.285) (0.504) (0.655)
LR χ2 96.191 170.699 196.367
Simulated LLfit -490.716 -423.338 -410.364
Pseudo R2 0.09 0.17 0.19
BIC 994.802 907.032 920.087
Number of Observations 800 756 755
* p<0.10, ** p<0.05, *** p<0.01
Further results show that respondents who are ready to mortgage their land/house are
6.55% more likely to purchase the biogas digester. Climate Change Impact is however
negative, and interestingly, respondents who are aware about the climate change
impacts of using firewood are 12.84% less likely to pay for the biogas digester. This
may be because the respondents aware about the climate change are also the ones with
better education, and households with better education tend to use less firewood and
more of other cleaner substitutes, viz. LPG, and electricity for cooking. Among the
remaining socio-demographic variables, the Firewood Quantity is significant at p<0.1.
However, the magnitude is small suggesting a minor influence. Household Income is
not significant. Several interactions between household income and other variables were
tried. However, none of the interaction effects was significant. This indicates that the
household income does not affect the respondents' utility in relation to the WTP for the
biogas digester.
Table 10-4 Marginal Effects
Variables Health
Impact
Climate
Change
Impact
Subsidy
Knowhow
Regular
Savings
Marginal Effects 13.76% -12.84% 8.92% 29.72%

193
Table 10-5 presents the marginal effects for variables whose interaction terms are
significant. While the main effect of Health Impact was positive, the interaction effect
with Education122shows that the probability of purchase decreases with an increase in
education for respondents with knowledge about the health impacts. For each annual
increase in Education, the odds ratio estimate shows that respondents with knowledge
about the health impacts of firewood use are 17.73% less likely to purchase the biogas
compared to the other group. This may be because the respondents with better education
are the households using less firewood and more of the other cleaner substitutes, viz.
electricity and LPG for cooking. Further, the interaction effect between Female and
Collateral shows that the female members expressing their willingness to take out a
mortgage are 123.62% more likely to pay for the biogas compared to their male
counterparts.
The variable Firewood Quantity has a significant interaction effects with the variables
Climate Change Impact and Subsidy Knowhow. The analysis shows that while the main
effect of Climate Change Impact is negative, the interaction effect shows that with each
1 kg/month increase in firewood consumed, respondents with knowledge about the
climate change impact are 14.42% more likely to purchase than respondents from the
other group. On the other hand, it is interesting to note that for each 1 kg/month increase
in firewood consumed, respondents with knowledge about the government subsidy
become 14.15% less likely to purchase the biogas compared to the other group.
This unexpected finding may be explained by the scope of change required for
households consuming large amounts of firewood. For these households, the need for a
larger substitution with respect to the biogas required may not have been considered
feasible given the capacity of the biogas plant explained during the survey and currently
subsidised. Figures showing the effect on probability with respect to the interaction
122 Education as a variable is significant only after its interaction with Health Impact.
Table 10-5: Marginal Effects with Interaction
Variables Education/
Health Impact
Collateral
/Female
Firewood/
Climate
Change
Firewood/
Subsidy
Knowhow
Marginal
Effects
-17.73% 123.62% 14.42% -14.15%

194
between the variables are presented in Appendix 13, Appendix 14, Appendix 15, and
Appendix 16.
10.2.2 Willingness to pay using parametric models
In all the models, bid values were transformed to log-normal values to obtain
asymmetric distributional forms required to allow the estimation of mean and median
WTP separately. Table 10-6 shows the WTP estimates of each model and their
confidence intervals. The mean WTP for the parametric estimation ranges between US
$515.66 for the model with constant and bid only (Model 1) and US $452.92 for the
model with interactions (Model 3). Further, the confidence intervals from the parametric
estimation also differs from that of the non-parametric estimation. This shows that these
values are significantly different from the mean non-parametric estimate of US $294.61.
Hence, the mean parametric estimates are 36-42% higher than the non-parametric
means. As stated in the methodology chapter, this is expected because the non-
parametric estimates are lower since the (conservative) assumption in the Turnbull
approach is that the full mass of the distribution falls at the lower bound of the range of
prices for each mass point (Persson & Svensson, 2013). Further, as pointed out earlier,
nearly 40% of respondents are willing to pay the full price, which increases the overall
mean WTP estimate. The mean WTP estimates derived from the parametric estimations
are statistically equivalent to a full price of US $450.79 for the biogas plant. While the
mean WTP between parametric and non-parametric estimates are different, the median
WTP range of US $329.63 to 397.22 derived from the non-parametric estimation
overlaps with the median WTP ranges obtained from the parametric estimations.
Further, since the full model shows that both the Regular savings and Collateral
(through interaction with Female) have significant association with the WTP estimates,
two models (model 4 and 5) were estimated to assess the differences in WTP between
the respondents ready to take out credit through regular savings and by mortgaging
Table 10-6 WTP Estimates
Estimates Model 1 Model 2 Model 3
Mean WTP (US $) 515.66 462.59 452.92
95% CI (444.65, 682.24) (412.04, 561.65) (406.13, 546.83)
Median WTP (US $) 370.79 364.60 362.24
95% CI (346.74,402.25) (342.37, 392.40) (340.27, 390.14)

195
collateral, and the respondents who were not ready to take out credit. The model results
are presented in Appendix 17. Table 10-7 presents the mean and median WTP estimated
from the model results. The result shows that the median WTP between the two models
are significantly in different123, where the respondents willing to take out credit are
willing to pay 46.65% more than the respondents not willing to take out credit.
10.2.3 Willingness to pay and environmental income
Binary logit models were also used to estimate the probability of purchasing the biogas
digester at full market price in the presence of an ongoing environmental subsidy. That
is, this provides understanding of respondents' WTP at full market price for the biogas
digester, in the context that the respondents’ household receives environmental income
each year as part of their contribution to reduce GHG emissions because of the
installation of the biogas digester. Different yearly environmental income values were
offered to the respondents to understand their WTP at full market price, but given
different levels of ongoing subsidy.
The model results are presented in Table 10-8. The model included the initial WTP as a
variable because it is the measure which informs us whether the respondent is in the
market or not, and the interaction provides information on whether and how those who
are in the market react to the environmental income. As per the earlier analysis in
Model 1-3 in Table 3, Initial WTP is the dependent variable which represents
respondents’ WTP for the technology assessed through a single bound dichotomous
question. Initial WTP is treated as a dummy variable (Yes as 1 and No as 0). Table 10-8
shows two models where model 6 is the reduced model with only Yearly
123 The difference between the median values were tested using the ranksum and non-parametric equality
of median tests in Stata.
Table 10-7 WTP Estimates with and without Willingness to Take out Credit
Estimates Model 4 Model 5
Mean WTP (US $) 447.28 488.17
95% CI (399.04, 526.58) (324.23, NA)
Median WTP (US $) 366.65 250.01
95% CI (341.41, 390.89) (179.25, 318.04)

196
Model 6 Model 7
Coef./SE Coef./SE
Yearly Environmental Income
Value (Multiplied by 1000) 0.218*** 0.170***
(0.056) (0.064)
Initial WTP (Yes =1 and No =0) 2.147*** 1.659***
(0.469) (0.507)
Yearly Environmental Income *
Initial WTP (Multiplied by
1000) 0.338** 0.393**
(0.168) (0.172)
Female -0.736*
(0.437)
Collateral --0.088
(0.323)
Female * Collateral 1.194**
(0.520)
Regular Savings 1.885***
(0.479)
Buffaloes 0.623***
(0.203)
Firewood Quantity 0.069*
(0.041)
Buffaloes * Firewood -0.043**
(0.019)
Constant -0.889***
- --
3.008***
(0.301) (0.611)
Table 10-8 Binary Logit Estimations with Yearly Environmental Income

197
LR χ2 206.615 263.771
Simulated LLfit -316.455 -266.981
Pseudo R2 0.2461 0.3307
BIC 659.638 607
Number of Observations 798 765
* p<0.10, ** p<0.05, *** p<0.01
Environmental Income and Initial WTP and the interaction between these variables, and
model 7 is the extended model with the socio-demographic and psychographic
variables. Both models are significant overall, and the inclusion of the socio-
demographic and psychographic variables increases the explanatory power of the
extended model. The pseudo R2 increased from 0.24 to 0.32 between the basic model
and the extended model. The log likelihood for the extended model is 8% higher than
for the base model, which shows that the extended model better predicts the outcome.
Further, the log-likelihood ratio test value of 93.28 between the models exceeds the
critical Chi-square value of χ2 (7) d.f = 24.32 at α = 0.001, allowing rejection of the null
hypothesis that the extended model is no better than the constant only model. Here, the
BIC criterion for fit also provides strong support for the extended model.
Results from both models show that Yearly Environmental Income and Initial WTP (as
dummy Yes = 1 and No =0) are significant and positive at p<0.01. The interaction
between Yearly Environmental Income and Initial WTP is also positive and significant,
at p<0.05. This shows that including the Initial WTP in the model moderates the
influence of the Yearly Environmental Income on the dependent variable. Further, the
positive interaction shows that respondents already in the market for a biogas digester
are far more likely to vote yes when the environmental income is available. Statistically,
this shows that the regressions of model 4 and 5 anchor off the Initial WTP. Figure 10-2
shows the marginal effects on respondents’ probability of purchase with increasing
Yearly Environmental Income and their Initial WTP, based on the extended model. The
result shows the interaction between the two variables, where the probability of
purchase increases with the increase in yearly income, for both the respondents who are
and are not willing to pay the initial bid values. The probability is significantly higher
for respondents who are already in the market compared to respondents who are not,
and the odd ratio estimate shows that respondents in the market are 48.14% more

198
willing to pay the full price compared to the respondents in the other group. However,
the marginal effect is higher for all environmental income values for the respondents
who are not in the market. In contrast, the effect is lower for the respondents already in
the market, with diminishing returns especially after US $40. This shows that for the
initial No voters, WTP the full price is sensitive to the scale of the yearly environmental
income, while for the initial Yes voters, they are willing to pay the full-price just
because they are in the market.
Figure 10-2: Probability with Increase in Yearly Environmental
Income for Respondents with Different Initial WTP
Consistent with the above results, Heckman’s selection models were estimated to
further analyse what factors influenced WTP the market price, and if the decisions to
pay the market price were interrelated with the initial WTP. The model results are
presented in Table 10-9. Here, only the results of the outcome models are presented; the
full model results are presented in Appendix 18. Model 8 presents the results for those
with a positive initial WTP (.i.e. for respondents in the market) and model 9 presents the
results for those with a negative initial WTP (.i.e. respondents considered to be not in
the market). The significant Rho (ρ) parameters show that the consumers’ decision to
pay the full market price is related to their initial WTP decision.
The results show that the decision to pay the market price of the respondents already in
the market is influenced by the Regular Savings and Firewood Quantity. The Regular
Savings is significant and positive at p<0.01 level and the Firewood Quantity is
significant and positive at p<0.05. In the case of the respondents not in the market, the

199
results show that the WTP is influenced by the Yearly Environmental Income together
with the Regular Savings and Buffaloes. The Yearly Environmental Income is
significant and positive at p<0.01, the Regular Savings is significant and positive at
p<0.05, and the Buffaloes is significant and positive at p<0.01. As explained earlier in
Figure 10-2, this shows that the increase in the yearly environmental income influences
WTP the full price of only the consumers who did not have an initial positive WTP.
However, the Regular Savings influences the decision to pay the full market price of
both the type of consumers.
Further, WTP the full price of consumers already in the market is also influenced by the
amount of firewood consumed, where households with more firewood consumption are
more likely to pay the full market price. Similarly, WTP of the consumers not already in
the market is also influenced by the number of buffaloes owned, where households with
more buffaloes are more likely to pay the full market price. In this, the model results
show a significant interaction effect between Buffaloes and Firewood Quantity at
p<0.05, and negative. This interaction effects show that as the number of buffaloes
increase, the effect of increase in firewood quantity on the probability of purchase
reduces. Similarly, as the amount of firewood quantity increases, the effect of increase
Table 10-9: Heckman’s Selection Model Estimations
WTP 2 Model 8 Model 9
Coef./SE Coef./SE
Environmental Income Value (Multiplied by 1000) 0.169***
(0.042)
Regular Savings 1.632*** 0.601**
(0.283) (0.286)
Buffaloes 0.543***
(0.164)
Firewood Quantity 0.059** 0.035
(0.026) (0.032)
Buffaloes * Firewood Quantity -0.050**
(0.019)
Constant -1.136*** -2.060***
(0.363) (0.353)
Rho (ρ) 1.098*** 0.506*
(0.265) (0.295)

200
in buffalo on the probability of purchase reduces. However, the magnitude of this effect
is small, and therefore the effect is minor.
10.3 Market Share
Model 1 and Model 3 results were used to calculate the potential market share124 of
biogas digesters in sales of cooking stoves under different scenarios to inform policy
recommendations. The market share analysis as per Error! Reference source not
found. shows the likely market shares at different initial bid values for different
scenarios. The average market share with constant and bid only model (Model 1) is
close to the market share with the extended model (Model 3), especially at bid values
above US $329.63. The market shares were also analysed with respect to hypothetical
markets with male and female consumers only using the results from the extended
model. In addition, the two psychographic dummy variables awareness and knowledge
were combined with gender to explore how these variables affect market share.
Figure 10-3: Market Share Scenario with Initial Bid Values
Specifically, males with awareness refers to male respondents who are knowledgeable
and aware, similarly, females without awareness refer to female respondents who are
not knowledgeable and aware, where by all the psychographic variables are treated as
“0”. The socio-demographic variables were set at their mean values for this analysis.
124 Market share for the purpose of the CV analysis is the probability of purchase of the biogas plant
based on results from different model specifications.

201
The results show that Females with Awareness would have the highest market share at
each bid level, and Females without Awareness would have the least market share. The
Males with Awareness have market shares like the overall average market share. This
shows that targeted programs to raise the awareness of females (and males) and to
provide access to finance are important in increasing the market share of the biogas
digester.
Figure 10-4: Market Share Scenarios with Yearly Environmental
Income
Error! Reference source not found. shows the likely market shares at different Yearly
Environmental Income Values for different scenarios. The average market share with
Bid and Initial WTP only (Model 6) is marginally lower than the market share with the
extended model (Model 7) with all independent variables set at their average values, and
this discrepancy is seen especially at bid values lower than US $40. However, for both
the models, the market share is substantially lower when Initial WTP is set to "No", and
is higher when Initial WTP is "Yes", at all bid levels of environmental income. Further,
the market share despite the environmental income is on average less for respondents
who are not in the market compared to those who are already in the market. This further
shows that the respondents who are not in the market initially are more responsive to the
environmental income compared to the respondents already in the market.

202
The results indicate that the market share is higher for consumers with higher initial
WTP and lower for consumers with lower initial WTP. However, the difference in the
market share between the respondents who were already in the market and willing to
pay different bid values is marginal, while the difference is significant between the
respondents not initially in the market and those that were in the market. In all the
model scenarios, the trend of market share indicates a converging trend with increase in
the environmental income values. However, for all scenarios, there remain some
consumers who do not want to purchase the biogas digester, especially with respect to
respondents who are initially not able and/or not ready to pay for the biogas digester.
Therefore, despite the increasing impact of the higher yearly environmental income and
the covariates, the poorest consumers would still not be willing to purchase the biogas,
especially at lower yearly income.
10.4 Discussion and Conclusion
The mean estimates of the WTP for the biogas digester from the parametric models are
higher than from the non-parametric model. The higher estimates are because of the fat-
tail problem as a result of the expressed WTP the full market price by a higher number
of respondents. However, the median WTP range from both the models overlap. The
median WTP estimate from the model with the interactions is US $362.24, which is
64.37% of the total cost125, but is higher than the overall average of US $ 212.18126
derived from existing data on household contribution.
The analysis shows that the respondents who are aware about the health impacts of
traditional firewood use as well as those who knows about the government subsidy for
biogas installation have a higher probability of purchasing a biogas digester. Further,
the probability of purchase with respect to these variables interact positively with the
socio-demographic variables of education and firewood consumption, such that with
higher education and higher firewood consumption, respondents are more likely to
purchase the biogas digesters. Interestingly, respondents who are aware about climate
change impacts have a lesser likelihood of purchase, however, this effect is moderated
125 This total cost is the cost of the biogas digester construction material, without the labour contribution
for pit construction. Normally, the pits are constructed by the households during agriculture off-season,
and is estimated to cost approximately US $90. 126 Data as of 2016/17 received from BSP/N.

203
at higher firewood consumption levels. However, WTP was not found to be influenced
by household income.
The analysis also shows that the decision to pay the full market price is related to the
decision to pay an initial arbitrary price for the biogas plant, where in the respondents
who were initially not willing to pay any price for the biogas plants become influenced
by the yearly environmental income incentives to pay the full market price. In contrast,
the respondents already willing to pay a price for the biogas plant are willing to pay the
full market price regardless of the yearly environmental incentives. However, an
important finding is that the decision to pay the full market price for both the type of
respondents is influenced by the provision to take out credit through regular savings.
This reflects the existing practice where the consumers are more used to taking out
credit from the MFIs than the commercial banks, which requires mortgage options.
The market share analysis shows that the potential market share decreases with
increases in the cost of the biogas digester. Nevertheless, respondents are also willing to
pay the full market price if yearly environmental earnings are provided to the
households based on their contribution to the GHG emission reduction. That is, market
share at full market price increases with increase in the potential yearly environmental
income. The results show that, for all values of the environmental income, the market
share is higher for the respondents who are already in the market i.e. for respondents
who were willing to pay a price in the first place. However, the influence of
environmental income is higher for respondents who are not in the market. For these
respondents, market share increases at a higher rate, while the increase is marginal and
diminishing in the case of respondents already in the market. Further analysis shows
that females with awareness about the health and climate change impacts, and who are
ready to mortgage and/or make regular savings to take out credits, also increases the
market share.

204
Chapter 11 Choice Experiment Results
This chapter describes the results of the CE study. Three different models - conditional
logit, random parameter logit, and latent class logit models - were estimated. First, the
non-labelled version of the conditional logit model was used to estimate model
parameters. Thereafter, a random parameter logit model was used to understand
preference heterogeneity with respect to specific attributes. Lastly, the latent class
model was used to understand the segment (or class) and scale structure of the
respondents. The results of the latent class model were analysed with both the Latent
Gold 5.0 and Stata 13.1, while the rest of the models were estimated using the Stata
13.1 program. The purpose of the chapter is to estimate the market share of the biogas
plants based on the analysis of the influence of credit attributes together with yearly
environmental incomes on the willingness to purchase the biogas plant.
11.1 Independent Variables
Definition of the variables used in the different models are presented in Table 11-1127.
Variable Definition
Choice Dependent variable set to 1 if the respondents choose an
alternative
ASC Alternative specific constant
Interest rate Interest rate for the loan/credit
Payback period The number of years by which the loan has to be paid
back
Instalment frequency The payment frequency of the loan
Yearly environmental
income
The income that households can earn yearly for
reducing carbon dioxide with the installation of biogas
digesters
Female Dummy variable set to 1 if respondent's gender is
female
Age Respondent's age
127 The attributes of instalment amount, total yearly payment, and overall total amount were removed,
because it made no sense to include these attributes. This is because these attributes are the functional
variables of the other attributes of interest rate, payback period and instalment frequency.
Table 11-1: Definition of Variable

205
Children number Number of children in respondent's household
Firewood quantity Quantity of firewood used for cooking
Agriculture land Agricultural land owned by the respondent's household
Household income Respondent's household income
11.2 Conditional Logit Model
The CL model was estimated initially to gain an initial indication of the significance,
sign and the magnitude of the design variables. A model with the ASC and attributes is
initially presented in Table 11-2 as Model 1. The McFadden R2 or Pseudo-R2 for model
1 is 0.33, which indicates a good fit of the model128. For this model, the constant term is
assigned to the status quo or no option alternative. It indicates the model intercept for
the status quo or no option alternative, and thereby helps to quantify the preferences for
the choosing neither of the credit alternatives. It is significant and negative at p<0.01,
and the larger magnitude indicates a strong preference for the alternatives presented.
The coefficient for yearly environmental income from the biogas plant installations is
significant and positive at p<0.01. This indicates that respondents prefer higher income
levels from the suggested carbon reduction if the biogas plants are installed with credit
support. The variables, interest rate and payback period are statistically significant and
negative at p<0.01 indicating disutility for increases in these attributes values.
Respondents prefer lower interest rates and paying the credit off over a shorter period of
time. However, the coefficient for instalment frequency is insignificant, suggesting that
respondents' utility is not related to the variable.
A model that includes interaction of the socio-demographic variables with the constant
term (ie the ASC) is presented as Model 2 in Table 11-2. While there are different ways
to include the socio-demographic variables, the most common method of interacting
with ASC is presented. The ASC represents the average role of all the unobserved
sources of utility, and therefore, its interaction helps to capture unexplained values or
reasons held by respondents, which are not captured by the design attributes.
Interactions of the socio-demographic variables with the design variables did not
128 McFadden R2 or Pseudo R2 of 0.3 represents a decent model fit. Pseudo-R2 of 0.3 represents an R2 of
approximately 0.6 of a linear regression model. Pseudo R2 values in the range of 0.3 to 0.4 can be
translated as an R2 of between 0.6 and 0.8 for a linear equivalent model (Hensher & Johnson, 1981).

206
produce significant results. The ASC interaction improves the overall model fit only
slightly with McFadden R2, from 0.33 to 0.34, compared to the ASC and attributes only
Choice
Model 1 Model 2
Coef./SE Coef./SE
ASC -4.429*** -5.455***
(0.16) (0.555)
Interest Rate (at 1*100) -0.079*** -0.076***
(0.007) (0.008)
Payback Period -0.211*** -0.219***
(0.017) (0.019)
Instalment Frequency 0.014 0.014
(0.011) (0.012)
Yearly Environmental Income
(at 1/10,000) 0.210*** 0.211***
(0.02) (0.022)
ASC Interaction
Female * ASC 0.498*
(0.276)
Age * ASC 0.271***
(0.057)
Children number * ASC -0.443***
(0.131)
Land * ASC -0.457**
(0.226)
Household Income * ASC 0.217***
(0.055)
LR χ2 3421.097 3033.105
Table 11-2: CL Model with Attributes only – Model 1 and ASC Interactions – Model 2

207
Simulated LLfit -3548.508 -2925.137
Psuedo R2 0.325 0.341
BIC 7144.878 5944.307
Number 14361 12129
*, ** and *** denote statistical significance at 10, five and one per cent, respectively.
Model 1. However, the log-likelihood ratio test value of 1,246129 exceeds the critical
Chi-square value of χ2 (5)d.f = 20.52 at α = 0.01, allowing the rejection of the null
hypothesis that the extended model is no better than the attribute only model.
The results indicate that female, age, number of children, agriculture land and yearly
income impact respondents’ choices at different levels of significance. The interaction
between female and ASC is significant and positive at p<0.10, which indicates a higher
propensity for females to prefer biogas adoption. This may be because female
respondents are the ones who are involved in cooking and want to change towards
cleaner cooking alternatives. The interaction between age and ASC is significant and
positive, which indicates that the likelihood of biogas purchase increases with age of the
respondent. There is a significant and negative interaction between the number of
children and the ASC at p<0.01, indicating that household with more children have
lower propensity to purchase biogas plants. A possible reason for this could be that the
households with more children are also the ones which have relatively less available
income compared to other households, and therefore such households have a lesser
ability to purchase a biogas plant. A second possible reason could be that households
with higher firewood use are also the ones with higher number of children, and since
children are involved in firewood collection, these respondents may consider that they
have a lesser need for a biogas plant. Further, the impact of land ownership is
significant and negative at p<0.05, which indicates that household with more land
holdings are less interested in installing biogas. However, the interaction between yearly
income and ASC is significant and positive at p<0.01 as expected, which indicates that
the intention to install biogas increases with an increase in income.
129 The likelihood ratio test statistic is computed by taking the difference between the maximum log-
likelihood statistics for the reduced model and the extended models.

208
11.3 Random Parameter Logit Model
The descriptive statistics presented in Chapter 9 show that there is substantial
heterogeneity with respect to the location and socio-demographics of the respondents,
which can lead to heterogeneity in preferences. The basic RPL model with only the
attributes, all modelled as random parameters, is presented in Table 11-3 as Model 3.
The socio-demographic variables are interacted with the ASC and presented in Model 4.
The goodness of fit, using the log-likelihood, indicates that there are major
improvements between the RPL and the CL models. Further, the extended RPL with the
ASC interaction (Model 4) has better goodness of fit than all the other models. The
likelihood ratio value of 1,138 exceeds the critical Chi-square value for χ2(5) d.f = 20.52
at α=0.01, allowing the rejection of the null hypothesis that the specified model is no
better than the base comparison model. The significance and signs of the attributes, as
well as the interaction terms between the socio-demographic variables and ASC, are
consistent with the CL models. However, the mean parameters have increased
compared to the CL. This increase is attributed to the RPL model, breaking down the
unobserved part of the utility and normalising the parameters, and explaining more of
the unobserved portions of utility (Abdullah & Jeanty, 2011; Revelt & Train, 2000).
This consequently leads to an increase in the scale parameter, which is inversely related
to the model variance, which therefore leads to the increase in the mean size of the
parameters. Overall, both RPL models confirm the earlier results. The yearly
environmental income is statistically significant and positive at p<0.01. Similarly, there
is a significant but negative association with the values of the interest rate and payback
period, at p<0.01. However, the RPL models also show that the standard deviation of
the instalment frequency, is significant at p<0.01, though the model co-efficient was not
significant, like the CL models. Therefore, the model results show that while the
instalment frequency does not affect the respondents' utility, its large coefficient of
variation indicates that there are a large proportion of respondents who have both
positive and negative preference for this attribute. This means that some respondents
like to pay the instalments quickly while others like to pay over longer intervals.

209
Choice
Model 3 Model 4
Coeff./SE Coeff./SE
Mean
ASC -6.859*** -7.575***
(0.304) (0.832)
Interest Rate (at 1*100) -0.110*** -0.103***
(0.011) (0.011)
Payback Period -0.253*** -0.259***
(0.024) (0.025)
Instalment Frequency 0.023 0.025
(0.015) (0.017)
Yearly Environmental Income (at 1/10000) 0.281*** 0.275***
(0.028) (0.03)
Standard Deviation
Interest Rate 0.123*** 0.111***
(0.012) (0.013)
Payback Period 0.313*** 0.261***
(0.029) (0.033)
Instalment Frequency 0.223*** 0.225***
(0.023) (0.024)
Yearly Environmental Income (at 1/10000) 0.220*** 0.216***
(0.041) (0.048)
ASC Interaction
Female ASC 0.498*
(0.425)
Age ASC 0.352***
Table 11-3: RPL Model with Attributes only – Model 3 and ASC Interactions – Model 4

210
(0.088)
Children number ASC -0.575***
(0.206)
Land ASC -0.785**
(0.373)
Household Income ASC 0.274***
(0.081)
LR χ2 296.181 187.977
Simulated LLfit -3400.418 -2831.148
BIC 6886.986 5793.944
Number 14361 12129
*, ** and *** denote statistical significance at 10, five and one per cent, respectively.
11.4 Latent Class Model
Three information signals, AIC, BIC, and the log-likelihood, were used as a guide to
understand the optimal number of classes, assuming a constant scale across classes in
Stata. As can be seen in Table 11-4, the optimal number of classes based on the log-
likelihood and CAIC is two classes. In the case of BIC, the minimum is reached at 3
classes. However, it is unlikely to significantly improve the model fit as the difference
in BIC between two and three classes is negligible and therefore the minimum is
effectively reached at two classes. Further, models with two classes, but with one and
then two scale parameters were estimated in Latent Gold 5.0. However, the model with
2 classes, and a single scale remained the preferred model. Given that there is only a
single scale parameter, scale adjustment with respect to response error is not required
since the two subgroups do not differ in the scale parameter130, and the observed latent
classification is due to the preferences without the influence of the confounding effect
of the response errors.
130 The analysis was carried out in STATA and did not require the use of Latent Gold since there was a
single scale class parameter.

211
Classes 2 3 4 5 6 7
BIC 6295.05 6293.536 6309.818 6317.031 6352.363 6373.173
CAIC 6306.138 6310.003 6332.804 6358.834 6409.444 6421.117
LLF -3110.815 -3090.034 -3078.152 -3061.734 -3059.38 -3049.76
The LC model results are presented in Table 11-5 as Model 5. The results show that
there exists no scale heterogeneity as the model with different scale estimations was not
preferred. There exists preference heterogeneity across the two classes, as indicated by
the differences in the sign, magnitude and significance of the parameter estimates. The
model results give further insight compared to the earlier models about the preferences
among the respondents, and what attribute variables are important to the respondents in
each class. The class probabilities indicate that the first class has 35.3% of respondents,
and nearly two-thirds, 64.7%, are in class 2. Both the classes have a similar and a
negative large sized ASC for the status quo option, indicating only a small portion of
the respondents choose this option. It is interesting to note that all the attributes,
including instalment frequency, are statistically significant at p<0.01 in class 1, and the
signs are consistent with the earlier models. For this class, instalment frequency has a
positive sign. This is different to the earlier models where the instalment frequency was
not significant. In the case of class 2, the payback period and the yearly environmental
income are significant at p<0.01. However, the interest rate and instalment frequency
are not significant for class 2. The payback period is negative indicating that
respondents in this class do not prefer a longer payback period. Further, the yearly
environmental income is positive, indicating respondents' preference for higher income
levels. These results are like the respondents' preferences for class 1 for the same
variables. Further, the magnitude of the coefficients in class 1, are also considerably
large compared to these in class 2. Across both classes, respondents have negative
preferences for larger payback period, and a positive preference for higher yearly
environmental income.
Further, the results were also modelled with socio-demographic variables predicting
class membership. A manual backward selection method was used to investigate the
relevant socio-demographic variables to be included in the model as covariates
Table 11-4: Minimum Class Speciation

212
Table 11-5 Latent Class Model with Two Classes – Model 5
Choice Coeff./S.E Coeff./S.E
Class 1 Class 2
ASC -8.867*** -7.497***
(0.778) (1.116)
Interest Rate (at 1*100) -0.236*** -0.014
(0.040) (0.017)
Payback Period -0.431*** -0.101***
(0.068) (0.031)
Instalment Frequency 0.126*** -0.009
(0.044) (0.020)
Yearly Environmental Income (at 1/10000) 0.374*** 0.122***
(0.072) (0.043)
Share of Class 1
Age 0.146**
(0.062)
Firewood quantity -0.281***
(0.093)
Household Income 0.107*
(0.064)
Constant 0.147
(0.671)
Simulated LLfit -2990.62
BIC 6115
Number 13632
*, ** and *** denote statistical significance at 10, five and one per cent, respectively.

213
predicting class membership. Three socio-demographic variables of age, firewood
quantity and household yearly income were found to influence class membership. The
results show that the effect of firewood quantity is significant at p<0.01, age of the
respondents is significant at p<0.05, and yearly environmental income is significant at
p<0.1. This indicates that, compared to class 2, older respondents, and households
which consume less firewood, and households with higher income are more likely to be
in class 1.
Compared to the continuous mixing distribution approach and its assumption in the case
of RPL, these results show that the LC model offers a unique approach to understanding
the latent heterogeneity that is not readily identifiable with the RPL model. The LC
model allows for heterogeneity to be manifest through different potential market
segments and their respective preferences, which is useful to design targeted strategies
and product features, which can result in better interventions. For example, based on the
LC model result, the respondents in Class 2 are indifferent to the interest rate which is
unique to micro-credit consumers, who are ready to pay high interest rates for small
credits but to be paid back in short payback periods. However, the coefficient
magnitude for the respondents in Class 2 shows higher variance, which indicates the
need for a better information and awareness strategy for the respondents in this group.
Further, while the LC model shows an increased model fit compared to the restricted
CL models, comparison with the RPL model shows that the model fit is better for the
RPL model with the socio-demographic characteristics (Model 4). This is contrary to
the findings of most other studies, in which researchers have found a better fit with LC
models (Hynes, 2005; Zhenning Li et al., 2019; Sagebiel, 2017; Savolainen, 2016;
Shen, 2009). Given the superior model fit for the RPL model, the RPL model
parameters are used to carry out the subsequent market share analysis, as per the
objective of the study.
11.5 Comparison with Dummy Variable Models
Dummy variable modelling is a way of understanding the non-linearity in the utility for
the attributes. The dummy variable CL model (model 6) and RPL model (model 7) are
presented in Appendix 19. Non-linearity is often tested with new or niche products, and
the attribute of yearly environmental income is a new offering to the rural consumers
not currently available with respect to energy products. Non-linearities across the
different levels can arise because of diminishing marginal utility or thresholds.

214
Modelling non-linearity can help in assessing preferences at different attribute levels
which can help in products design. In this, possible non-linearities with the variables of
environmental income and instalment frequency are of particular interest. The attribute
levels are effects-coded because that avoids the disadvantage of perfectly confounding
the base attribute level with the grand mean of the utility function, which is considered
an issue with dummy coding (Bech & Gyrd‐Hansen, 2005; Hensher et al., 2005). The
modelling results presented in Error! Reference source not found. and Figure 11-2
show non-linearity in the case of instalment frequency and yearly environmental
income.
Figure 11-1: Relationship between Instalment Frequency and Effects
Codes
The coefficient values for instalment frequency presented in Table 11-2 and 11-3 were
close to zero and statistically insignificant. However, the utility trend presented in
Figure 11-1 indicates a non-linear association. The preference is positive for the
quarterly and biannual frequency level, however, quarterly level is the most preferred
option, with negative preference for the monthly level.
-0.060
-0.040
-0.020
0.000
0.020
0.040
0.060
M o n t h l y Q u a r t e r l y B i a n n u a l
Effe
cts
Co
de
Co
effi
cice
nt
Cal
ues
Installment Frequency
CL RPL

215
Figure 11-2: Relationship between Yearly Environmental Income and
Effects Codes
Regarding the yearly environmental income, the coefficient is negative for the levels of
"No Environmental Income" and US $12. The mean coefficient nearly equals zero for
US $20, and is statistically insignificant. However, the utility is positive for the higher
income levels of US $40, 60, and 72. It is interesting to note that for both non-linear
attributes, the utility declines initially, and then increases sharply for higher levels of
attribute values. The RPL model results confirm the CL model results.
11.6 Market Share Analysis
A market share analysis was carried out based on both the continuous model (Model 5)
and non-linear model (Model 7) results. The market share was analysed based on
different levels of yearly environmental incomes and interest rates. An example of the
product design, attributes, values and the utility coefficients are shown in Error!
Reference source not found.. Four products with payback periods of 3 and 7 years and
instalment frequencies of 1 and 6 months were chosen. The impact of payback period
and instalment frequency were constant for the product design. The table presented
shows the values for the yearly environmental income of US $20 at 16% interest rate
from the non-linear model estimation. The Not in the Market (NIM) scenario presents
the market share at the status quo option.
The market shares for the different products at the different levels of yearly income and
interest rate is shown in the graphs presented in Figure 11-3 and Figure 11-4. For the

216
model with continuous variables, the market share increases sharply at the yearly
environmental income of US $12 for all levels of interest rates. This income provision
of US $12 can more than double the market share for all the different levels of interest
rates. The next level of yearly environmental income of US $20 increases the market
share further, but only marginally. Further increases in the yearly environmental income
to US $40 and above do not produce any significant increase in the market share. In the
case of the market share analysis with the dummy variables, the market share decreases
with the increase in the yearly environmental income to US $12. The results from the
model with the continuous variables was not able to capture this phenomenon. This can
be attributed to the fact that the payment is not large enough to be worth the transaction
costs of being part of such a program. However, the market share increases substantially
at the next level of US $20 for all levels of interest rate. The analysis shows that the
market share increases significantly with the increase in the yearly income. This
increase is more for higher levels of interest rate of 12% and 16%. The results also
indicate that the returns from market share diminish at higher levels of yearly
environmental income
Table 11-6: Utility and Market Share
Product
Yearly
Environmental
Income (US $)
Utility
Coefficient
Interest
Rate
(%)
Utility
Coefficient
Payback
Period
(Yrs.)
Utility
Coefficient
Instalment
Frequency
(Month)
Utility
Coefficient
Total
Utility
Market
Share
NIM 0 0.00 0.00 0.00 0.00 -2.45 30.95
1 20 -0.07 16 -0.85 3 0.57 1 -0.02 -2.82 21.37
2 20 -0.07 16 -0.85 3 0.57 6 0.05 -2.76 22.81
3 20 -0.07 16 -0.85 7 0.00 1 -0.02 -3.40 12.03
4 20 -0.07 16 -0.85 7 0.00 6 0.05 -3.33 12.84

217
Figure 11-3: Market share with different levels of environmental
income and interest rates (Continuous variable model)
Table 11-7 Market share values as % (Continuous variable model)
Interest
Rate
Environmental Income (US $)
0 12 20 40 60 72
5% 44.97% 94.93% 99.34% 100.00% 100.00% 100.00%
8% 37.18% 93.13% 99.09% 99.97% 100.00% 100.00%
12% 27.78% 89.82% 98.61% 99.99% 100.00% 100.00%
16% 20.01% 85.15% 97.88% 99.99% 100.00% 100.00%

218
Figure 11-4: Market share with different levels of environmental
income and interest rates (Dummy variable model)
11.7 Discussion and Conclusion
An important finding extending and confirming the previous CV results was that credit
availability increases the likelihood of purchase. The results show that none of the
respondents opted out completely from the choice tasks and always chose the status quo
option. This means that the alternatives presented were preferred by respondents who
were not ready to pay the full price previously with a given environmental income. This
shows that the respondents are willing to take on suitable credit to purchase the biogas
plants, especially when a yearly environmental income is considered. An important
finding with the CE is that the respondents’ choice of the credit parameters is influenced
0%
10%
20%
30%
40%
50%
60%
70%
80%
90%
100%
$0 $10 $20 $30 $40 $50 $60 $70 $80
%ta
ge o
f R
esp
on
den
ts In
th
e M
arke
t
Environmental Income5% 8% 12% 16%
Table 11-8 Market share values as % (Dummy variable model)
Interest
Rate
Environmental Income (US $)
0 12 20 40 60 72
5% 72.90% 56.51% 92.58% 97.37% 98.01% 98.65%
8% 60.47% 42.49% 87.65% 95.46% 96.56% 97.64%
12% 45.12% 28.42% 79.23% 91.88% 93.78% 95.71%
16% 32.47% 18.84% 69.05% 86.87% 89.81% 92.87%
219
by household income. This result is different from the earlier CV results in which the
WTP was not influenced by the household income, but by the potential credit provisions
through regular savings and/or through collateral to purchase the biogas plants. This
shows that while credit provisions affect the WTP for the biogas positively, the
willingness to take credit and the type of credit is further dependent on household
income. Therefore, the results indicate that affordable and properly designed credit can
motivate consumers to take-up clean energy technologies, and it may not be necessary
to provide direct subsidies to buy down the cost of the RETs.
The results further indicate that the female respondents are more likely to take-on credit
for biogas installation, which could be because of gendered labour division where
females conduct the household cooking activities. However, this could also reflect the
status where higher number of females are using credit, especially from the MFIs.
Further, the results show that the older respondents are more willing to use credit. This
could be because the older respondents have more experience of taking-on credit as well
as the household financial authority. The results further show that the households with
more children have lower propensity to take credit for biogas purchase. This could be
because these households have relatively less income to pay for the credit taken to
purchase biogas plants, and the yearly income proposed is not high enough to motivate
these respondents. However, the higher number of children could also mean that there is
more labour available to collect firewood thus limiting the propensity of biogas
purchase. Further, the households with more land holdings are less inclined to take-on
credit for biogas installation.
The results further show that respondents can be viewed as belonging to one of two
groups based on their preferences. The respondents in the first group are affected by all
the credit attributes. These respondents prefer lower interest rates, shorter payback
period and less frequent instalments, and higher yearly environmental income. This
group makes up nearly one-third of the respondents, and the magnitude of the model
parameter shows that these respondents are more sensitive to changes in the credit
features. The respondents in the second group also prefer a shorter payback period and
higher yearly environmental income, but are indifferent to the interest rate and
instalment frequency. The second group makes up nearly two-third of the respondents.
The results indicate that the first group contains households whose respondents are
older, with higher firewood consumption, and have higher income. Therefore, it can be
interpreted that the respondents in general are willing to use credit with a lower payback

220
period and higher yearly environmental income. The lower payback period may be
because the households do not want to hold on to credit for a longer period of time
because of the cultural context in rural Nepal, and also because the majority of the
households are used to taking-on the credit from the MFIs, which provide credit with
shorter payback periods but higher interest rates. The other explanation is because the
households are aware about the fact that the payback period has the highest impact on
the total payment, so the respondent could have anchored their choices based only on
the payback period and the yearly environmental income.
The market share analysis shows that the market share is low and decreasing for a
yearly environmental income up to US $12, based on non-linear model results.
However, the market share increases sharply beyond US $12, reaching threshold values
at US $20, and then levelling-off for higher values of environmental income. Further,
the results show that the increase in the market share along with the increase in the
yearly environmental income is more at higher interest rates. The lower interest rates
only add marginally to the market share, especially at higher yearly environmental
income values. Therefore, this shows that subsidising interest rates does not add
significantly to the potential market share, especially when environmental rebates are
provided. Therefore, it may be better to keep the interest rates on a par with market rates
and, if the market price for carbon credits is too low, subsidise the yearly environmental
income, for better results.

Chapter 12 Qualitative Analysis
This chapter describes the results from the qualitative survey. Investment data obtained
from various banks and financial institutions, were analysed to give a picture of the
investment status of energy access technologies in Nepal. Further, results are based on
analyses of the information obtained during the interviews with the various financing
entities, including focus group discussion carried out with the rural communities. In
this, the results present the demand and supply conditions of energy access finance,
issues with existing subsidy and credit provisions, and governance issues around access
to finance.
12.1 Introduction
The qualitative analysis is based on interviews and data gathered on credit and subsidy
investment during the field visit. Some 18 representatives of different banks and
financing entities were interviewed as part of the qualitative analysis. Table 12-1 shows
the list of entities interviewed. The interviews were carried out with five commercial
Type of Institution/Entity Name of Institution/ Entity Number
Commercial Banks, Class “A”
Nepal Merchant Bank, Siddhartha Bank, Civil
Bank, Himalayan Bank, Nepal Investment Bank
Limited
5
Development Bank, Class “B” Tourism Development Bank 1
Wholesale Lending MFI, Class “D” Sana Kisan Micro Finance Institution 1
Retail Lending MFIs, Class “D” Nirdhan Utthan Bank (Central and Regional)
Grameen Bikas Bank (Central and Regional) 4
Retail Lending MFIs, Financial
intermediary NGO Sahara Nepal, Jivan Bikas Samaj 2
Government Projects/Programs
Central Renewable Energy Fund, Multiple Donors 1
CleanStart Project, UNCDF 1
Gold Standard Biogas Project, WWF 1
Energy Financing Experts Nara Hari Dhakal 1
Surya Hada 1
Table 12-1: List of Banks and Financing Entities

222
banks, one development bank, five micro-finance institutions (MFIs), and two energy
financing experts. The MFIs included one wholesale and four retail institutions. The
retail institutions included two financial intermediary NGOs. Interviews were also
conducted with the representatives of the three donor funded government
programs/projects involved in energy access financing. The interviews were conducted
face-to-face, while the investment data were accessed through e-mail communication.
The participants represent the major entities involved in energy access financing in
Nepal, and their views and data represent the energy access investment situation in
Nepal.
12.2 Findings
12.2.1 Biogas plant installation
The number of biogas plants installed has varied over the years, but has generally been
more than 10,000 per year (see Figure 12-1). The year 2015/16 saw a substantial decline
because of several adverse influences such as earthquakes and the blockade with India.
The trend of biogas installation cost and subsidy shows that the real cost of plant
installation has decreased overtime along with the share of the subsidy. The cost of the
subsidy is in real values after deflating by the consumer price index. The cost and
Figure 12-1: Trend of Biogas Plant Installation, Cost and Share of
Subsidy Per Plant
Source: Data provided by Biogas Sector Partnership-Nepal

223
subsidy were high during the initial phase of biogas promotion because of the
installation of large size plants of up to 20 m3. The cost and subsidy decreased over time
along with the reduction in the size of the plant, which stands at a maximum of 6 m3 at
present.
12.2.2 Loan investment conditions and business models
The interviews demonstrated that there are two main types of business models for credit
investment to enhance rural renewable energy access in Nepal. In the first, the
individual level household technologies are financed by the MFIs, and, in the second,
the larger mini-grid and/or micro-hydro projects are financed by the banks. A flow chart
of credit investment for energy access is presented in Figure 12-2.
Figure 12-2: Credit Supply for Clean Energy Access
Source: Based on Interviews
Within this flow of credit investment, the interviews demonstrated that the MFIs’
savings and equity sources are not sufficient, and the MFIs have sourced part of their
funds from the commercial banks, the Biogas Credit Fund (BCF), and from the
Community Forestry Coordination Committees (CFCC), the last of these as part of the
Gold Standard Biogas Project financed by the World Wild Fund for Nature (WWF).
The credit provisions under BCF and WWF support are particularly for biogas
installations. The banks on their part have received funds from the dedicated financing
facilities of the MHDF and CREF. However, they have also utilised their regular fund
for financing RETs. MFIs operate using the group-based lending model, pioneered by
the Grameen Bank in Bangladesh. The model emphasises providing micro-credit for

224
income generating activities, primarily to poor women members in the community. It
was found that depending upon the geographical and socio-economic conditions, the
MFIs operate with groups of 5 to 50 members, and emphasise financial literacy of the
members.
There is considerable supply of funds from the banks to the MFIs. All the interviewed
MFIs, except for the one operating with the WWF program, have borrowed from the
commercial banks to meet their energy access credit demand, in addition to the other
loan investments. The interviews revealed that the MFIs have borrowed up to 50% of
their yearly loan investment target from the commercial markets. The interviews
demonstrated that the commercial banks are also establishing their own MFIs, and are
involved in energy access financing. Following central bank directives, the MFIs can
loan up to NPR 500,000 (US $4818) per project without collateral and up to NPR 1
million with collateral. The interest rate cap is set at 18% with a spread of 7% on the
cost of funds. The interviews revealed that the MFIs’ energy access interest rates are
normally reduced by up to 2% compared to other loans, and they are categorised as
other types of loans, as they do not normally generate income, as per the standard
expectations of micro-credit investments. However, there is clear evidence that micro-
financing, energy access is a viable business in Nepal. Further, participants were of the
view that reducing consumer interest rates by such margins does not make much
difference to the consumers’ decisions to take credit for energy access systems.
Loans for micro-hydro and mini-grid projects are made by the banks directly. There is
an incentive for banks to make such loans due to their higher returns compared to loan
investments to the MFIs. However, due to banks’ low rural presence, and the lack of
innovative business models, banks also seem somewhat reluctant to make such loans.
Traditionally, mini-grid and micro-hydro projects have also suffered from low load
factors, due to lack of day-time use of electricity produced.
“Investment in micro-hydro is suffering due to low level of energy use – load factor,
and also there is virtually no grid connection, therefore micro-hydro investment could
not expand as expected. Further, productive end use is just a myth, entrepreneurs are
entrepreneurs in spite of electricity, and people do not suddenly become entrepreneurial
once they get electricity.”
-Energy financing expert

225
While many interviewed banks have not loaned money for such projects, banks exposed
to such loans reported up to 20% loan loss provisioning. Such loan loss provisions are
substantially higher than the standard provisions of 1.57%. However, the Anchor
Business and Community model for mini-grids proposed by the World Bank
(Ramchandran, Pai, & Parihar, 2016) is considered to have better investment prospects
by the interviewed participants. This is because such projects have a secure anchor and
business consumption loads to allow for a sustained income generation for the projects,
contrary to the low load factors of the traditional micro-hydro projects designed to
provide only lighting services. Besides the rural loan investment in micro-hydro and to
the MFIs, the banks have also provided retail loans to urban solar PV technologies for
household and commercial use. The loans to urban solar is incentivised with an interest
rate subsidy, while the rural energy access loans are incentivised primarily with a capital
subsidy. The total amount of loans by the interviewed banks, and program facilities are
presented in Table 12-2. So far, around NPR 1.5 billion (~US $14.5 million) has been
provided for in clean energy and energy access loans. This is, however, miniscule
compared to the total loan portfolio of the banks and FIs under the deprived sector
portfolio, which is a total of NPR 129.62 billion (~US $1.2 billion). The loan
investment to the MFIs is 81.04% of all loan investments, indicating higher investment
in the household technologies.
By technology, solar PV has the highest of the clean energy loans, followed by biogas
and micro-hydro. Nepal Merchant Bank (NMB) has the largest exposure at 58.47% of
the total loans. The NMB representative indicated that the bank has continued the
energy access credit portfolio that was acquired through a merger with the Clean Energy
Development Bank, and further NMB is a member of the network “Global Alliance for
Banking on Values”. Besides, a vendor-financing, rent-to-own model is also being
experimented with solar PV irrigation by Sunfarmer Nepal131 where the farmers have to
pay a monthly instalment for three years through the local farmers’ cooperative. The
cooperatives retain a fee from the monthly payments by the farmers for their
administrative support.
131 Sunfarmer Nepal is a vendor involved in solar PV promotion in Nepal.

S.N Bank and Funding Facility Total Amount Tenure Interest Rate Investment Type Account Performance Technology
1 Biogas Credit Fund 356,835,557 3 years 6% - 14% Wholesale-MFIs Very Good Biogas
2 CFCC (WWF Support) 79,568,000 3 years 4% - 8% Wholesale-MFIs Not satisfactory Biogas
3 Micro-hydro Debt Fund
3.1 Himalayan Bank Limited 17,150,000 5 years 10% Retail Bad to Satisfactory Micro-hydro
3.2 Nepal Merchant Bank Limited 36,682,000 7 years 12% Retail Bad to Sub-standard Micro-hydro
4 Central Renewable Energy Fund
4.1 Civil Bank Limited 4,000,000 3 years 7% - 18% Wholesale-MFIs Very Good Solar
12,500,000 7 years 9% Retail Mini Grid & Micro-hydro
107,051,475 2 to 5 years 9% Retail Urban Solar
4.2 Nepal Merchant Bank Limited 785,651,106 1 to 6 years 11% - 18% Wholesale-MFIs Satisfactory Biogas, Solar and ICS
62,219,893 3-5 years 9% Retail Satisfactory Urban Solar
4.3 Tourism Development Bank132 19,300,000 5 years 9% Retail Bad to Satisfactory Micro-hydro
4.4 Nepal Investment Bank Limited 31,842,998 3-5 years 9% Retail Satisfactory Urban Solar
Total (NPR) 1,512,801,029
Source: Credit investment data provided by the participants based on the interview questionnaire.
132 Tourism Development Bank Limited merged with Mega Bank, a Class A commercial bank on May 13, 2018.
Table 12-2: Loan Investment Status

“But, ………….., and further, my commitment in the sector has been for some time. I
started my involvement in RE sector financing since 2008. At that time, BoK was strong
with Mr. XY taking the lead, but he got transferred and later on his replacement Mr. AB
carried this on for some time, then BoK stopped doing this. After that Himalayan
Bank’s Mr. JK continued this purpose for some time, and now he has been transferred
and has a different role. Therefore, it’s been only me who has been in this for nearly
nine years now. At that time, it was easy for me because the bank that started it was
itself the Clean Energy Development Bank, there was no option to not do clean energy.
CEDB was a small institution (Class B) and I was able to carry that, but now here in
NMB if I’m given a new responsibility, or if the off-gird clean energy is merged with
large hydro, it may not get the proper support or even may not be continued.”
-NMB representative
The interviews demonstrated that the banks make loans for in clean energy and energy
access primarily to meet their deprived sector lending portfolio requirements. As per
central bank directives, the commercial banks, development banks, and finance
companies have to loan 5%, 4.5%, and 4%, respectively, of their portfolios to the
deprived sector. With regards to energy access, the banks and FIs can meet their
deprived sector portfolio by retail lending in the loan products itemised as133:
1. Loans of up to NPR 150,000 (US $1,445) for household energy access
technologies, and
2. Loans of 50% of the total cost or up to NPR 300 million (US $2,890,730) for
mini-grid or micro-hydro projects.
Further, the deprived sector portfolio can also be met through wholesale lending to:
1. Licensed class D financing institutions which are solely operating as wholesale
financing institutions, and/or
2. Licensed class D financing institutions and/or financial intermediary
organisations which are providing retail micro-credits, and/or
3. Cooperatives which are established in the rural areas as per the Cooperative Act,
1997, and/or
4. Equity investments in the licensed Class D financing institutions.
Since, MFIs cannot make a loan above NPR 1 million (~US $9635) to any project, as
per the central bank’s directives, the loans for mini-grid and micro-hydro projects are
carried out directly by the banks and financial institutions. However, since MFIs’ loan
133 As per the Central Bank Directives numbered 17/074.

228
conditions are conducive to providing micro-credit to the household technologies, as
described by the deprived sector directives, MFIs and banks partner to invest in the
household energy technologies. Banks and FIs are reluctant to loan directly for
household technologies primarily because of their traditional commercial focus, and
secondly due to their limited rural sector presence.
12.2.3 Supply and demand conditions for finance
Credit for the installation of energy access technologies was started by the Agriculture
Development Bank under the government subsidy and credit scheme for biogas and
micro-hydro projects. Under that, the support for larger biogas plants started from
1974/75 (Alternative Energy Promotion Centre, 2015; Karki, 1978). Larger plants were
the norm due to the nature of farming practices, under which a higher number of cattle
and other livestock were reared per farm compared to current rural farming practices.
The shift in investment towards smaller-sized biogas plants gained momentum with the
establishment of the Biogas Credit Fund (BCF) in 2001/02. The operation of BCF was
incentivised by the capacity building support of Winrock under its Credit for Energy
Program, which trained nearly 400 MFIs in biogas credit investment. This training,
together with a financing facility from the BCF, supported an increased number of
households to install biogas plants. Similarly, the financing facility of MHDF provided
added momentum to credit investment of micro-hydro projects from 2008 onwards. The
UNCDF’s CleanStart program expanded its credit financing modality after 2013/14,
under a performance-based scheme where the partner banks and MFIs were provided
financial incentives based on an installation target. While the earlier Winrock’s Credit
for Energy Program for biogas promotion focused on introducing the credit-investment
concept through an increased number of MFIs, the focus of CleanStart has been towards
scaling the earlier experience through a concerted effort focused on those MFIs with a
larger member base. CleanStart partners Nirdhan Utthan Bank (NUB) and Jiwan Bikas
Samaj (JBS) have 300,000 and 220,000 members, respectively. Figure 12-3 presents the
trend of biogas plants installation with credit support from the banks, and under
different financing facilities134.
134 Some of the private banks, such as Bank of Kathmandu, also provided wholesale lending for
household biogas installation to the MFIs during the period of BCF operation. This is not included.

229
Figure 12-3: Biogas Installation Using Credit
Source: Biogas installation data provided by BSPN and credit investment data
provided by AEPC.
Figure 12-3 shows a higher contribution of the government owned banks, viz. ADBN,
Nepal Bank Limited (NBL) and Rastriya Banijya Bank (RBB), during the initial period
of the biogas promotion program. The number of plants installed with credit from these
banks reduced overtime, especially after 1998/99. This can be attributed to the Maoist
insurgency which increasingly attacked the rural financing operations of the government
owned banks since its start in 1996 (N. Dhakal & Kanel, 2004; Hofmann & Grossmann,
2005). The installation of plants with credit funding support from the BCF gained
momentum after its establishment in 2001/02. As mentioned above, the BCF largely
operated by providing wholesale loans to the MFIs. As shown in Figure 12-3, this
support from the BCF substantially increased the rate of biogas installation, and was at
its highest in 2009/10 when credit support from the other banks was at its minimum.
However, credit support from the BCF reduced after 2009/10. One of the major reasons
for this was the suspension of the BCF credit support due to its increasing arrears,
which had to be settled. Also, the impending take-over of the BCF by the CREF
reduced the credit support.

230
Biogas installation further spiked, albeit briefly, starting in 2013/14 with the operation
of the CleanStart program. Figure 12-4 shows the progress of different technologies
under this program to 2016/17. The interview participants believed that the increased
installation of biogas along with ICS during the CleanStart program period was also due
to the blockade of
Figure 12-4: Technology Installation Achieved by the CleanStart
Program
Source: Data supplied by CleanStart Program, UNCDF office, Kathmandu.
a major Southern border after the promulgation of the Constitution of Federal Nepal,
starting towards the end of September 2015. This lasted for five months, and resulted in
a crippling supply of petroleum products, especially LPG used in urban and peri-urban
areas for cooking (British Broadcasting Corporation (BBC), 2018). Many urban and
peri-urban households which were using LPG, resorted to using firewood with ICS, and
other alternative technologies, such as induction cooking plates and biogas plants.
Besides the aforementioned force majeure reasons affecting demand, the interview
participants considered that in general willingness and financial ability of the consumers
have increased, which has assisted the installation of household energy technologies.
Many participants also considered a growing remittance economy as a major reason for

231
the increased WTP of the rural households. The remittance flow into a household is
both due to migration within and outside the country. The proportion of households
receiving remittance income has increased from 23% in 1995/96 to 56% in 2010/11,
and the average income transfer in the form of remittances is NPR 80,436 (US $775) (in
nominal terms) per recipient household (Central Bureau of Statistics, 2014c). About
79% of the total remittances received by households is used for daily consumption,
while 7% is used for loans repayment (Central Bureau of Statistics, 2014c).
Further, the increasing number of MFIs, especially in the Terai region has also
increased the accessibility to credit and ability to pay of the rural households. This is
also because of the emphasis of micro-credit on income generation as a core objective.
The MFI participants emphasised that micro-credits were used for integrated income
generation and energy activities, where the energy technologies would enhance the
productivity of income generation activities, such as for the buffalo and biogas
technology as a bundled loan product.
“We can also support energy access by proving credits to consumers to buy energy
meters, to run the livelihood income generating enterprises to pay the energy charge
and cost of technologies, etc. The idea is to provide credit+ so that the consumers will
be able to do income generating activities and also pay back for the energy
technologies.”
-MFI representative.
Some participants also considered that the flow of remittances reduced the use of
biogas, as households opted for better substitutes such as LPG as their incomes
increased. Further, since labour migration tends to involve youth, this has left the
elderly who are not as capable and interested in rearing the livestock essential for biogas
operation. However, the participants were also of the opinion that the LPG would
probably be used only occasionally, especially due to the ease of its operation in times
of urgency such as preparing tea for guests or when biogas is not available due to cold
weather conditions. Several participants also stated that the households will continue to
use firewood if they have easy access both in terms of regulation and distance to the
forest resources, given the cost of LPG and electricity, and due to the uncertainty of
accessibility to LPG and electricity, especially in the rural areas. In this context,
participants suggested that households would not continue installing biogas plants if the
cost of plants increased to reach price parity with that of LPG and electricity use.

232
Lastly, many participants expressed strong concern about issues related to vendors’
services, affecting the demand for the energy access technologies. There is a widespread
resentment regarding the vendors’ lack of proper services, especially after sales
services, which also affects the operation of the financing institutions. This is because
the consumers often default on the loans when the products do not perform as expected.
Many plants and systems remain idle and are inoperable due to the lack of timely repair
and maintenance services. Although the vendors are pre-qualified or licensed by the
government, the participants suggested that the vendors were charging higher prices for
substandard products and services. They raised concern that the products supplied by
the vendors could be bought more cheaply outside of the contractual agreements, and
even from overseas. Therefore, they suggested standardising the products and services,
rather than consumers having to buy products from the licensed vendors.
Some participants also suggested that there is rampant exploitation of consumers, and
some MFIs have even introduced threshold prices for energy access investments as
conditions for receiving credit investment, especially in the case of solar home systems.
In the case of biogas, the MFIs mentioned that vendors demotivate consumers from
approaching the MFIs for credit access. This has happened primarily after the increase
in the subsidy. The respondents believed that the vendors do not consider the MFIs’
credit support as complementary to enhancing the market. Rather, they want to avoid
the MFIs’ credit, because of the control and monitoring that are introduced, and which
are different from and additional to the monitoring in relation to the subsidy
disbursement. Vendors do not seem to realise the market potential of the MFIs, which
have a total of 2.2 million consumers, and fail to partner with the MFIs towards
marketing their products. Rather, the vendors’ focus largely has been on lobbying the
government to increase the subsidy and on other issues related to subsidy policy and
subsidy disbursement.
“The solar association was good in lobbying and shouting at the central level with the
AEPC, and at the ground level they were not really interested and prioritising
marketing as a tool for business expansion. The other thing is that energy demand is
suppressed at the moment, the households who had installed 20 Wp are good marketing
targets, but the companies are not trying to promote second tier solutions to these
customers. Therefore, the vendors need to be reoriented, because they do not have the
capacity for markets beyond the subsidy.”
-Program representative

233
In the context of these concerns related to the vendors, some MFIs, viz. JBS have
established their own company to supply the products. However, some participants
believed that such arrangements could lead to a push sale of products, thus essentially
creating disincentives for the market to function properly. However, the experience so
far has been satisfactory, in that the consumers are getting customised services and
products at reasonable prices. Participants suggested developing the capacities of the
MFIs to orient their consumers to select the right vendors.
The trend of biogas installation shows that the demand is affected by the availability
and type of credit available as well as the external support such as CleanStart. Further,
in the case of biogas, the demand is influenced by the changing demographics in terms
of youth migration and remittance received by rural households. This has a dual effect
in terms of 1) enhancing the purchasing power of the households to afford biogas but 2)
also impact its use because of the lack of younger people to look after the livestock.
However, most importantly, the demand for biogas has been impacted by the poor
vendor services.
12.2.4 Subsidy and credit issues
When considering subsidies and credit it is important to be aware of the relationships
between households, their system suppliers, the suppliers of credit, and the government
supplying the subsidy. For example, subsidies are provided as a package discount on the
purchase of a biogas plant or a SHS. Often households do not have information about
the amount of the subsidy. Credit can sometimes be organised within this package, or
alternatively households can in a separate transaction apply for credit.
The trend in Figure 12-1 shows an increasing share of plants constructed with credit
support until 2009/10. This was because of the credit support by the government banks
and the MFIs through the BCF facility. The support by the banks was during the initial
period when the plant installed sizes were large, and then by the MFIs through the BCF
facility starting in 2001/02. The plant installation with credit support then decreases
continuously until 2011/12. This decrease was due to the stoppage of wholesale credit
investment by the BCF, as mentioned in the earlier section. The plant construction then
increased from 2012/13, even with minimal contribution with credit support. However,
the plant installation decreased beyond 2014/15, because of the stoppage in subsidy
disbursement as a result of the delay in the revision of the subsidy policy. The
installation of the plants then caught up once the subsidy policy was approved in May

234
2016135. An important consideration is the relationship between the subsidy on biogas
system installation and the demand for credit. The MFI participants believed that the
out-of-pocket expenses with the increase in subsidy in 2012/13 reduced to around NPR
7,000, thus making it unnecessary for many households to approach MFIs for credit for
biogas plant installations. However, on the credit supply side, this was also during the
time when the BCF had stopped its wholesale funding facility due to the management of
the arrears as mentioned above. Furthermore, the MFI representative in the WWF
program stated that its farmers are also eligible to get top-up subsidies from the local
conservation area office and the community forest groups besides the government
subsidy136, which further reduces the need for farmers’ equity and credit investment.
Despite the trend of reduced cost and subsidy, the upfront cost of the biogas plants
relative to the plant capacity seems to have remained high for individual farmers, even
with the average subsidy contribution of 39.55% of the total cost. A principal reason for
this is attributed to the inefficiency resulting from the uncertainty surrounding the
subsidy policy in general, and in particular to the process of subsidy disbursement.
Under normal circumstances, the subsidy policy is revised every two years. When the
government decides to revise the subsidy policy, it is always delayed, which creates
uncertainty, as well as substantial lobbying and advocacy by the vendors’ associations.
Once the subsidy policy is approved, the regular process of subsidy disbursement also
takes considerable time, which is understood to be a cause for increase in the price of
the products. The interviews demonstrated that the vendors quote higher prices for the
systems that are installed with subsidy support. Moreover, the MFIs partnering with the
CleanStart program confirmed that vendors reduced the price by about 25% for the
SHSs when they were assured about credit disbursement within one week of the system
installation. These were mostly smaller systems of 20 Wp installed both in the grid-
connected peri-urban areas and remote locations without access to the grid. The
interviews indicated that even consumers from remote locations were ready to purchase
the systems without subsidy support once the price was reduced. The price for the
systems would, however, be higher for remote locations due to additional transportation
135 Further, 2015/16 is also the year when the earthquakes and the blockade happened, as mentioned in the
earlier section. 136 In many remote areas and/or for targeted communities, there are enclaves of special programs run by
NGOs which provide top-up subsidies. Many micro-hydro plants are constructed with support from
government subsidy, and top-up from local government, mostly in cases when they cannot get a loan
from the bank.

235
cost. Some participants therefore supported the continuation of subsidy support for
installations in the rural and/or remote locations, but recommended innovative ways to
design and deliver subsidies directly to households in such rural and remote locations.
“In the new perspectives, it may be good to think about distributing subsidy directly like
it is being done with the social welfare distribution, and not through suppliers of biogas
systems.”
-Energy Financing Expert
Participants expressed that upfront payments have remained high also due to lack of
innovation in biogas technology. The only innovation has been the redesign of the
technology to 2m3 capacity to cater for the low income and poorer farmers. Inflation, at
an average of 8.8% over three decades has continued to limit the relative purchasing
power of the average farmers, and the increase in income together with the subsidy has
not been able to counter the inflation effects for many households to be able to afford
the upfront payments. Transportation is another major factor that increases the system
cost, especially in rural and remote locations. The issue of higher upfront costs is like
the other technologies, except for the solar PV systems, in which case the capital cost
has reduced significantly overtime.
While the above analysis of the trend of subsidy and credit investment shows that there
is a demand for biogas plants and a demand for finance for energy access investment,
the participants from the banking sector referred to inherent issues with energy access
financing that limited their ability to make loans available to the energy sector.
Furthermore, all the participants pointed out that the lack of financial support for credit
investment has affected the expected financial innovation in the sector. CREF has an
accumulated fund of nearly NPR 4.3 billion earmarked for subsidy, while the fund
earmarked for credit disbursement is only 237.5 million. The partner banks were
promised a credit investment fund of around US $100 million at the start of the CREF
establishment. But, it took nearly 2.5 years to establish CREF when the contractual
agreements were carried out with the banks on February 2015. During this period, the
fund earmarked for credit was cannibalised and used for subsidies, and during this time
CREF activities were focused on subsidy management, such as the online integration of
subsidy disbursement procedures, to reduce the time required for manual processing of
subsidy documents. This resulted in insufficient focus towards credit-related activities,
contrary to the program objectives. The partner banks therefore received a substantially

236
lesser amount of funds for credit purposes compared to their proposed business plans.
Some of the participants believed that the integration of the MHDF and BCF, along
with the funds received as carbon revenues would have addressed the issue of CREF’s
lack of credit finance. The CREF investment committee has decided to request the
government to use 50% of the subsidy fund, NPR 2 billion (US $19 million), for credit
operation. Table 12-3 shows the status of CREF funds used by banks towards energy
access investment.
S.N Partner bank
CREF
deposit
(NPR)
Fund used
(NPR)
Balance
(NPR)
1 Bank of Kathmandu
11,000,000
-
11,000,000
2 Siddhartha Bank Limited
27,000,000
-
27,000,000
3 Nepal Investment Bank Limited
2,000,000
-
2,000,000
4 Himalayan Bank Limited
9,000,000
-
9,000,000
5 Civil Bank Limited
64,000,000
16,500,000
47,500,000
6
Tourism Development Bank
Limited
20,000,000
19,300,000
700,000
7 Nepal Merchant Bank Limited
97,000,000
785,651,106
(688,651,106)
Total
230,000,000
821,451,106
(591,451,106)
Source: Data provided by CREF
Out of 7 partner banks, only 3 banks have utilised the fund while the rest have not
provided credit for any energy access technologies. Out of the seven banks, only NMB
and Civil banks has provided wholesale loans to the MFIs to invest in biogas and other
household RETs137. The interviews revealed that the handling bank, and the partner
137 Civil Bank has a separate unit for micro banking under which whole loan to MFIs, and loans to micro-
hydro projects are handled. The NMB acquired its energy access portfolio from the merger with the Clean
Energy Development Bank and has a dedicated Renewable Energy Unit. The banks without such specific
focus has tried to initiate loan investment to micro-hydro projects with CREF support, but the bank
participants were of the opinion that many micro-hydro projects were financially unfeasible, even if
considered feasible by the AEPC technical team. Banks considered micro-hydro project investment as
risky, even with subsidised interest rates and a capital subsidy.
Table 12-3: Status of CREF Funds Used by Banks

237
banks are investing the unused fund received from CREF in activities other than for
energy access promotion, despite funding deficit expressed by the MFIs. It is
paradoxical to see that the funds are being (mis)used when the MFIs lack funds to invest
in household technologies such as biogas. In this context, energy access financing
through MFIs has suffered relatively compared to other sectors such as agriculture and
livestock, which receive higher investment priority. This has played out like this
because the finance sector is going through a liquidity crunch presently because of a
regulatory increase on the paid-up capital of the banks and a lack of government
expenditure due to the events like earthquake and election. As per the Central Bank
record, the average interest rate on deposits since January 2016 is 5.58%, and the
average lending rate is 10.5%. Therefore, considering these rates, the funds received
from CREF at 2 to 2.5% are relatively cheap138, and bears a higher profit compared to
regular investments.
“We (MFI) could have utilised all the fund that is available in CREF given the network
that we have. We have to borrow from the commercial banks at higher interest rates for
energy access financing, now the rate is fluctuating between 10-13%.”
-MFI representative
Some non-banking participants maintained that the current mechanism of CREF
providing fund investment as deposits to the commercial banks is a disincentive for the
sector, especially during such liquidity crunch. They suggested that any future funding
should be provided on a performance-based refinancing modality, together with
capacity building support towards project and partner identification. Bank participants
stated that they were still interested and motivated to invest in energy access, but
emphasised the need of subsidised funding support and capacity building activities
around energy financing. However, non-banking MFI participants believed that the
energy access financing does not suit the commercial approach of the banking sector,
and contrarily complained about their own lack of direct access to the CREF fund,
which increased their cost of funds.
“The non-investment charge is only 3%, while the market rate is 8%, therefore, there is
5% profit, due to liquidity crunch at the moment. Therefore, along with the fund, CREF
will also need to identify the best projects, say 10 best micro-hydro projects – a bit of
handholding is required in the beginning.”
138 Data based on the interviews with the banks and CREF.

238
-Project representative
The analysis shows that the subsidy and credit availability has been necessary to
maintain the installation of the biogas plants. This is because the upfront cost of biogas
plants has remained high because of the lack of technology innovation in addition to
sustained cost inflation. Moreover, the inefficiencies due to subsidy delivery have also
resulted in increased plant cost. Further, the fund available for credit investment to
biogas plants has suffered due to indirect access of the MFIs to CREF, where the banks’
investment interests have been motivated by the liquidity crunch in the market and lack
of rural outreach.
12.2.5 Governance and access to finance
The promulgation of the constitution in September 2015 and the legislative election as
per the new constitution in the last quarter of 2017, has restructured the country into a
Federal Republic with seven provinces and 744 local village and municipal councils. In
Section 51 (g) regarding the policies on the protection, promotion and use of natural
resources, the Constitution has emphasised (1) the adoption of national interest and the
intergenerational equity in the use of natural resources while at the same time according
preferential rights to the local communities in terms of the distribution of dividends, and
(2) comprehensive development and production of renewable energy to fulfil the basic
needs of the citizens keeping in mind the affordability, accessibility and reliability of
the energy provisions. Further, the constitution has accorded respective fiscal authority
to local level governments to legislate policies, implement budget and generate revenue
with regards to “alternative energy”- the distributed energy access technologies. The
fiscal budget for FY 2018/19 indicates that Federal government has started providing a
fiscal budget for energy access to the local councils. The FY budget shows a total of
NPR 180 million (~US $1.7 million) support for the provincial government, and NPR
997.50 million (~ US $10 million) for the local governments. But, AEPC still has the
bulk, around NPR 3,510 million (~ US $34 million) as an annual energy access budget.
However, given the constitutional authority, the participants believed that the bulk of
the spending for energy access will be subsequently carried out by the local councils.
The participants raised the concern that it will take substantial time for the federal
devolution to happen completely, partly because of the process and partly because of the
inertia with the current system.

239
The previous governments prior to the Federal constitution had never been able to spend
more than 50% of the development budget, but it is expected that the new localised
administration will be able to spend a comparatively higher proportion of the earmarked
government budget. With the increased fiscal authority, the participants also raised the
concern that the local province and councils may lack accountability and transparency
in their operation. They believed that there is a risk that the local councils will be more
enthusiastic about providing grants and subsidies, rather than trying to improve access
to finance through banks and FIs, unless the councils think differently and try to be
innovative. This is more so in the case of energy technologies because household
technologies like SHSs and biogas digesters can be installed quickly compared to larger
projects. Given the funds earmarked for the local councils, it is likely that they will be
spent on a small number of such household systems. It is also because the politicians
and the bureaucrats are wary about working with credit structure, since it is easier to
operate by providing subsidies. The participants believed that the local councils need a
broad range of capacity building support in energy planning and monitoring. Above all,
the provinces and the local councils need to be informed about the potential of
mobilising credit with or without subsidy support to scale-up the deployment of
technologies and services.
“…………, if the local councils are not aware about the issues with the subsidy, and
therefore the potential of credit in terms of reaching the target efficiently, the same
problem could be continued with the 744 councils.”
“As the morning shows the day, you can have a look at the schemes that the new
councils have so far introduced – their first announcements were increasing the welfare
amount for the old, making the bus-ride free for the old. All of our mind set for planning
is always distributional – handing out goods and services.”
-Program representative
The participants also informed us that with the new governance structure, the
government is actively regulating banks and FIs to enhance access to finance.
Subsequent monetary policies introduced after the Constitution have introduced several
directives to incentivise rural operation of the commercial banks and other FIs. Prior to
this, most bank’s rural presence was in the district headquarters and in the main town
centres within the district. Similarly, even MFIs with expanded branch networks could
also only service consumers at a maximum of 2-3 hours walking distance from the
district headquarter and town centres. The government introduced the plan to establish a
commercial bank in each council village in 2015/16. As of July 2018, commercial banks

240
have established branches in 556 councils out of (Nepal Rastra Bank, 2018b) 753 local
councils as per the federal structure. Further, commercial banks can establish branches
without having to obtain any approval from the central bank. The central bank has also
relaxed the regulation to maintain the cash reserve ratio (CRR) and statutory liquidity
ratio (SLR) of the branches established in the local councils, for the next three years.
Donor supported programs such as Unnati139 and Sachyam140 are also providing
technical support and incentives for the banks and FIs to establish their branches in
remote local councils.
Provision has been made in the monetary policy to invest 25% of the total portfolio in
the priority sector, with 10% in the agriculture sector and 15% in the energy and
hydropower sector. This is an improvement both with respect to volume and
contribution to the expansion of the energy sector, as earlier only hydropower was
categorised under the priority sector as against the “energy” sector. Such provision for
development banks and finance companies is at 15% and 10%, respectively. Further, the
deprived sector lending portfolio is increased to 5% for all categories of FIs, which is an
increase of 0.5% and 1% for the development banks and finance companies (Nepal
Rastra Bank, 2018b). The central bank has complemented this emphasis towards rural
financial access with limits on unproductive sectors in urban areas such as in housing
and auto loans. At present, the banks cannot lend more than 65% for housing and auto
loans, while earlier banks could lend up to 90% for such products. However, while the
banks’ presence in rural council/areas may increase the physical proximity, there still
remains the psychological barrier for small farmers to approach the banks. The
interviewed participants believe that the commercial banking approach is not always
suitable for the small farmers, and that the MFIs present a much more enabling
approach to credit access for the poorer farmers.
“Only very few members have taken loans from the banks, because of the cumbersome
process of the banks, to get letters from different places, besides having to put up with
the collateral. The banks need all sorts of recommendations from the district offices,
village development committees.”
-A female member of a credit group during focus group
139 Unnati emphasises the expansion and consolidation of MFIs operation and their linkage with the banks
and FIs of other categories. 140 Sakchyam focuses on providing improved finance to small and medium enterprises as banks and FIs
provide more and better products and services to these enterprises.

241
MFI participants pointed out the need for proper prudential regulation of the MFIs, such
as through the registration at the Credit Information Bureau (CIB), similar to the
requirement for the banks and other FIs. The monetary policy 2018/19 has outlined
regulated compulsorily registration of the MFIs in the network of CIB. In this context,
the participants maintained that the expanding network of mobile and internet
applications would be crucial in enhancing the access to finance, especially given the
remote geographical conditions leading to thin and scattered markets for finance and
other commodities in such areas. The use of mobile and internet application is
promoting mobile banking services which is expected to support the government goals
of setting up a bank account for every adult Nepalese. Both the physical extension of
bank’s branches and the use of mobile and internet applications for financial inclusion is
expected to also enhance the potential of energy access investment, especially through
IT-enabled micro-credit for household energy technologies and the expansion of vendor
financed projects such as the PAYG schemes, where IT applications can be used both to
monitor energy use by consumers as well as carry out the financial transactions. All the
MFIs interviewed were piloting online mobile and tablet applications for financial
transactions with their clients and members. UNCDF is supporting the mobile payment
pilot program for the vendor financed solar PV irrigation scheme. Such innovations of
financial inclusion reduce the fixed costs and initial outlay of connecting markets with
the rural economy, thus enhancing the feasibility of energy and financial services.
All the participants emphasised the need for capacity development activities, especially
to enhance the local-level provincial and council’s capacity to plan, monitor and
coordinate activities. In this, since alternative energy and small electricity projects fall
within the jurisdiction of the local councils, concerned organisations, particularly
AEPC, will have to play a crucial role in designing and partaking capacity building of
the local councils. Similarly, many participants strongly believed that CREF, will have
to be strengthened institutionally and technically, to be able to create a conducive
energy access market for the banks and FIs. They believed that this has to start with
hiring an adequate number of personnel with the right capacity and experience in
financial activities relevant to CREF. The MFI participants flagged the need for not
only capital funding, but also of MFI’s need for capacity building in areas of energy
access financing and product design.
All the participants also stated that awareness campaigns are crucial to motivate
consumers and increase the demand for energy access. Since the rural consumers are not

242
educated and informed like in the developed countries, the market for energy access will
not develop organically without appropriate marketing nudges. This will be important in
the case of technologies like biogas plants where the early adopters and innovators have
taken up the technologies, and therefore the early/late majority and laggards remain in
the market for adoption of these technologies. The participants also pointed out the need
for an information campaign about the second tier use of energy access technologies,
beyond regular lighting and cooking, and particularly in agriculture applications for
irrigation, produce drying and processing. An important change would be to orient and
develop the capacity of the vendors to carry out their own marketing and awareness
campaign.
Most participants were unaware about carbon revenue, and the possibility of earning
revenues with the installation of clean energy technologies. However, the participants
suggested various ways of properly utilising the carbon revenues. Banks considered the
possibility of using carbon revenues as secondary assets, especially in the case of micro-
hydro. However, they suggested that such could only be possible with the guarantee of
actual revenues such as through contractual agreement with the buyers, or through
central bank regulatory directives. However, the participants were sceptical of regular
mainstreaming of the revenues, due to the uncertain nature of the technologies, and their
sustainable operation. Participants believed that it would be possible to distribute the
carbon revenues to the consumers, and most cited the example of the social welfare
system, which is being trialled to be distributed electronically at present as part of
mobile banking services. Participants also pointed out the possibility of designing
micro-credits based on the duration and volume of such revenues. The participants
believed that such distribution of revenues could scale-up the use of biogas plants but
felt that the consumers could spend the revenues unnecessarily, since the amount for
individual households would not be substantial. Participants also suggested the
possibility of utilising the carbon revenues as a wholesale fund for credit at subsidised
rates. They believed it could also be used as incentives for motivating MFIs and FIs to
report their credit investment in energy access technologies similar to the case of
CleanStart programs where MFIs receive NPR 100 (96 US cents) and NPR 50 (48 US
cents), respectively for reporting every biogas plant and solar home system installed
with credit support.
The trend shows that the devolution of authority resulting from the changed
constitutional context is positive, especially for household technologies such as biogas.

243
However, care must be taken that this does not lead to dependence on subsidies.
Moreover, adequate capacity building and awareness activities need to be conducted
with regards to credit mobilisation and other relevant activities. This is important in the
context of increased government emphasis on rural access to finance and expansion in
priority and deprived sector lending, together with existing carbon revenues being
generated by the biogas projects.
12.3 Discussion and Conclusion
The historical trend of biogas promotion shows that the rate of installation of biogas has
varied over the years. The installation has increased especially with project and
programmatic support and shows that both the subsidy and credit support has been
crucial in maintaining and increasing the installation of biogas plants. The trend shows a
growth in the number of installations during the period when the subsidy has increased.
However, the trend also shows that credit support has been crucial in maintaining plant
installation. The data show that the installation has suffered with the phase-out of
programs such as wholesale credit support from BCF, and the impact on credit access
due to the conflict situation. Further, plant installation is also affected by incidents
leading to scarcity of substitute fuels such as LPG and electricity otherwise used for
cooking. Besides, there are a few drivers that are affecting the promotion of biogas in
relation in general. The lack of innovation in the current technology, poor vendor
services in terms of product quality and after sales services, as well as migration in
relation to a remittance economy is affecting the adoption of the biogas plants, both due
to lack of personnel to look after these technologies as well as the increased income of
households to afford other substitutes such as LPG.
Access to finance is important in two ways, first, in terms of the availability of adequate
funds for the banks and financial institutions to offer loans for energy access
technologies, especially in times of liquidity and volatility, and, second, in terms of the
presence of the banks and FIs in the rural areas. However, the investment status shows
that not all the commercial banks are committed and interested to make energy access
investments due to issues of administrative costs, and investment risks posed by many
rural projects. Therefore, while the rural expansion of the banks could enhance credit
access, it will not eliminate such issues related to project cash flow and investment
uncertainty. Further, small investments required for household-level technologies may
not be catered for by banks, unless they are coupled with other investments. Therefore,

244
micro-credit will continue to be the main source of credit for household-level
technologies, and this would call for improved mechanisms for partnership between
commercial banks and MFIs in the context in which banks’ rural presence is expected to
increase.
Capacity building is crucial, especially in the context of the new Federal structure. A
broad range of capacity building activities is required for all the stakeholders involved.
Government and non-government capacity are critical in continuing the innovation
cycle of the technologies and/or financial products such as the use of mobile and
internet applications and vendor financing. Governments at various levels need to be
made aware about the increased ability and WTP of the rural consumers for energy
access, especially in relation to the availability of credit access as well as the increase in
per capita income. This is highly relevant in the context where governments have
limited funds to manage their various development objectives. Banks and FIs need to
be trained about product design and delivery to develop energy access into a viable
portfolio, and vendors’ need to be trained about marketing which so far has been the
realm of the government and NGOs. In the context of the study, all the stakeholders
must be made aware about the potential of distributing carbon revenues from an equity
perspective, especially with regards to its complementary use with access to credit. An
important objective to keep in mind is that it may be possible to incentivise households
to take up biogas and other technologies even without the subsidy support.

Chapter 13 Conclusion
This chapter synthesises the discussions and results from the previous chapters. The
first section provides a summary to the literature review, methodology, and the results.
The second section provides the key findings, their implications to policy and
managerial practices. The third section highlights the limitations and caveats of the
study, and future research needs and potential.
13.1 Summary
The first task of the thesis was to introduce the thesis in Chapter 1, along with the
research questions. The two main research questions were: 1) What is the influence of
credit on the uptake of biogas plants? 2) What is the influence of distributing carbon
revenues on the uptake of biogas plants? This was followed by an introduction to the
status of energy access finance in Nepal, in Chapter 2. Chapter 2 provided a backdrop
for the implementation of the research questions. In this, the current energy access
situation, GHG emissions, and the status of energy access financing facilities, subsidy
and credit were explained. It was noted in this chapter that despite higher benefits to
households and the environment, the clean cooking technologies such as biogas plants
received less subsidy support in Nepal, in absolute terms, compared to lighting and
electricity-based technologies.
The rest of the thesis was organised into three parts. In Part I, literature pertaining to the
carbon emissions trading (Chapter 3), financing renewable energy (Chapter 4), in
particular the energy access, and the application of SP methods (Chapter 5) was
reviewed. The review started with the emergence and development of emissions trading
regimes. It noted the historical development of emissions trading schemes, and their
application in early pollution abatement initiatives, to their current use in the context of
the global carbon markets. It was noted in this context that the linkages of carbon
markets are inevitable and that such linkages will benefit electricity and energy
consumers both in the developed and developing economies. While the implementation
of the emissions trading was hailed because of its balanced impact on efficiency and
equity, the review found that the current linkages between the global and the local do
not produce the necessary market conditions to take full benefits of trading schemes.
The continuation of the linkages between the carbon credit buyers and sellers with a
PES-like domain reduces market efficiency and impacts on producers’ equity. This
situation could be improved in the case of energy access projects because of the clear

246
property rights and established transaction costs, unlike for forestry projects which are
beset with common property problems.
The review further analysed the complementary needs of the climate change policies
along with the RE policies. It was noted here that the RE subsidy policies in developing
countries were initiated to address energy security and energy poverty concerns, and
were later integrated in the larger global carbon context due to the potential to provide
carbon offsets to meet the carbon abatement objectives of developed countries. The
findings indicated that RE policies on their own cannot lead to additional emissions
reductions, but can result in welfare losses, especially when such policies cannot be
phased out overtime. Such welfare losses are higher in the developing countries where
direct subsidies are used to meet the energy access targets, resulting in inefficiencies
that impact on the mobilisation of adequate commercial financing. This reduces the
adoption of the RETs. However, the adaptive models of micro-credit (group model) and
PAYG (Fintech) systems have seen some success in energy access financing, and some
such applications have also been commercially viable without government subsidies.
The potential of such commercial viability could free up financial resources.
The continuous provision of subsidies, and the resulting lack of full and flexible
markets for the energy access technologies, makes for an ideal situation for the use of
SP techniques to understand consumers’ preferences for improving energy access in
Nepal, and in other similar contexts. Moreover, values derived from observed prices in
such markets may not reveal true underlying values. Further, the low cost of
implementing SP studies, and the theoretical and methodological validity and reliability
of these methods suggested that they were the most appropriate research technique for
this study.
The review further revealed that there has been a marked increase in the literature that
studied specific local preferences for RETs in developed countries. This literature
indicated that local people are ready to trade-off increased economic benefits such as
direct income compensation with environmental outcomes. In the case of the
developing countries, the literature on WTP for the ICS showed that the households
prefer different sales offers, in which payments over time in instalments have significant
impacts on purchase, even at full retail prices. These findings were useful for this study
since the current study also proposed the use of economic incentives and access to
credits to test the potential adoption of biogas plants. The review further found an
247
increasing number of SP studies conducted in the energy access space in the developing
countries. However, the use of CV was found to be more common for electricity
connection and increasing RE in the integrated energy mix, with multiple CE studies in
the clean cooking space. Overall, the review found a lack of literature with specific
focus on understanding the role of finance and/or carbon revenue for renewable energy
and energy access promotion.
The themes that emerged from the literature review were that: 1) the distribution of
lump sum carbon revenues can be progressive and 2) continued subsidies can create
market inefficiencies resulting in inadequate commercial financing, and 3) the literature
focused on understanding and analysing clean lighting and electricity avenues, primarily
in relation to SHS promotion.
In Part II of the thesis, the methodology and research design were elaborated. In this, the
theoretical framework and issues of CV and CE (Chapter 6), the survey design (Chapter
7), and the model specifications (Chapter 8) were explained. It was noted that the
theoretical framework for CV is the basic consumer theory, in which the consumer’s
WTP for a biogas plant, represented the utility gained in relation to their current
cooking practice, and their personal and household characteristics. Similarly, the
theoretical framework for CE is based on adaptation of Lancaster’s characteristics
demand within the McFadden’s random utility model. An important consideration to
make was that the hypothetical nature of SP methods can produce biases. Careful design
considerations were necessary to enhance the incentive compatibility and
consequentiality of the study. In this, it was found that research validity can be
improved with the use of ancillary tools such as cheap talk and calibration, as well as
pre-tests, and strongly depended on the choice of the elicitation formats, in relation to
the study contexts, and design of the CE, in relation to its attributes and their levels
The survey design was based in the Western Terai region of Nepal, with suitable
conditions in relation to the access to finance, as well as climate and existing energy
access status. Given the hypothetical nature of the study, the survey questionnaire was
designed to properly communicate the risks of traditional cooking practice and potential
benefits of biogas plants in the context of climate change and carbon benefits, right at
the beginning as part of the introductory section. The sequence of the CV questions
was arranged to also understand the potential protest responses. An important design
feature was the inclusion of the credit-related questions as part of the auxiliary

248
questions, which provided an instrument to test the impact of credit access on the WTP
values.
As part of the estimation approach, the Turnbull estimator was specified as the non-
parametric approach, to get an initial understanding of the WTP value. A non-linear
functional form was specified for the WTP estimation through the binary logit models,
with the expectation of higher values from some of the respondents. For CE, the CL
model specification is the basic model proposed, and further RPL and LC logit models
were also specified to analyse the heterogeneity. The overall design of the survey, and
the methodology used sought to understand, the consumers’ WTP in relation to the
availability of credit and the environmental income through the carbon revenues.
In Part III of the thesis, the results from the study were presented. The descriptive
statistics (chapter 9), CV results (chapter 10), CE results (chapter 11), and results from
the qualitative study (chapter 12) were elaborated. The descriptive statistics showed that
the respondent’s average annual household income was lower than both the national and
regional average. Further, the result showed that more than half the households used
only firewood for cooking, and the rest used firewood as the basic fuel together with
other fuel sources. This dependence on firewood indicated a latent demand for cleaner
technologies like biogas plants, and biogas plants were already being used by some
households in the region. Further, the results showed that almost all the households had
access to finance, and nearly half had experience of using credit from either banks
and/or MFIs.
The CV results found that the average WTP for the biogas plant is higher than the
current market revealed value, with the subsidy support. The findings indicated that
households who are willing to take out credit have a significantly higher WTP. Further,
the results showed that the provision of yearly environmental income significantly
increased WTP of the retail price, especially for households who were not willing to pay
a price initially. More importantly, the results showed that credit availability impacted
the WTP of the retail price across the board. Subsequently, the CE results showed that
variables related to financing increased the adoption rate at retail price further, where all
of the respondents chose a credit option compared to the status quo option. In this, the
results indicated that households preferred low interest rates and low payback period
with higher yearly environmental income. This shows that respondents prefer to pay
back the loan earlier, which is similar to the existing micro-credit schemes familiar to

249
many of the respondents, and which is being used by many rural consumers. The
CVresults showed that, while access to credit influenced the WTP, the CE results
showed that, household income influenced the willingness to take out credit. Overall,
the results showed that female respondents were more willing to pay and willing to take
out credit for purchasing biogas plants. In the CV and CE results there was little
evidence of strategic bias, and consequently the results from this study can be
considered valid.
In line with the CV and CE results, the findings from the qualitative analysis also
indicated a higher credit investment in the RE sector through the MFIs, even only with
targeted lending for household technologies. However, the sectoral investment status
indicated that while the MFIs lacked adequate funding resources to invest in the sector,
the commercial banks were not able to mobilise the available resources to do so either.
Further, contrary to the study results which indicated a WTP the full market price with
appropriate credit products and ex-post environmental incentives, the historical trend of
investment indicated major use of upfront subsidies to increase and/or maintain the
construction of biogas plants, with declining credit support, for various reasons.
13.2 Key Findings
Several key findings were observed during the research. These findings are linked to the
observations made during the literature review, the research design, and analysis, and
ultimately present a composite picture to address the research questions. The key
findings and their implications to the literature, managerial practice and public policy
are explained. The findings are presented below.
1. First, the results from the research indicated that access to credit strongly
influences the decision to pay a price for the biogas digester thus resulting in an
initial market. In this, the results indicated that the awareness of female
household representatives is crucial to enhance the market share of the biogas
technology.
2. Second, the results indicated that distributing carbon revenues can motivate the
consumers to pay the full market price for the biogas digester. This direct
distribution of carbon revenues to households increases the market share further.
In this, the distribution of carbon revenues has higher impact on the consumers
who are not willing to pay for the technology without the carbon revenues than
the consumers who are willing to pay some price for the biogas digester.

250
3. Third, the results indicated that appropriately integrating credit products with
carbon revenues can strongly enhance the market share of biogas plants further
at full market price. In this, the rate of increase in the market share is larger at
higher interest rates. However, the threshold is reached at carbon revenues
which are commensurate with the current market prices for carbon credits, after
which the change in market share is diminishing at higher carbon prices.
Therefore, it is optimal to provide adequate carbon revenues compared to
subsidising interest rates to realise the full market potential. This means that the
optimal uptake can be reached at current market rates of financial credits as well
as likely carbon prices.
4. Lastly, the literature review identified that the carbon revenues generated by the
energy access technologies, such as through household technologies like biogas
plants can be distributed progressively because of clear property rights and
decreasing transaction costs. Further, the literature review also pointed out that
the practice of direct subsidy provision for energy access can lead to significant
welfare losses, if the subsidy is locked-in, and the losses can continue when
there is insufficient access to appropriate credit facilities. However, some
schemes PAYG and micro-credit schemes in Africa and Asia have been able to
finance energy access without direct subsidies. These findings from the literature
review are also supported by the qualitative research results. The findings from
the qualitative analysis related to issues with inadequate flow of finance,
inadequate bank loans, the potential of carbon revenue use and need for capacity
building are all issues identified in the literature.
13.3 Managerial and Policy Implications
The findings have important managerial implications. According to the first finding, as
above, there is a strong need for information dissemination targeting females in the
community because of their involvement in household cooking and their increased
participation in micro-credit activities where micro-credit services are available. Such
information dissemination activities can be included as part of any current information
dissemination programs. This finding is consistent with the findings from the literature
that shows the cross-over potential between access to micro-credit and cooking in
relation to the objectives of improving women’s livelihoods in rural areas of developing
countries (Bazilian et al., 2011; Glemarec, 2012; Groh & Taylor, 2015; P. S. C. Rao et
al., 2009).

251
The second and third findings have important policy implications for increasing access
to micro-credit. The findings recommend the need to enhance access to credit, and
especially micro-credit for household biogas technologies. The current emphasis of the
government of Nepal is to enhance access to finance through the extension of
commercial bank facilities. The findings from this study suggest that the emphasis
should be not only to promote access to banking facilities, but also to promote the
micro-credit facilities. Specifically, the findings from the qualitative results show that
commercial banking facilities can forge partnership with MFIs to promote biogas plants
in rural and remote areas. This finding is also emphasised in the literature wherein
energy access financing could mainstream linkages between micro-credit facilities and
commercial banks, and thereby enhance their energy financing portfolios (Lemaire,
2011). This partnership however needs to be facilitated by external technical and
financial assistance (Morris et al., 2007), such as through the application of Fintech
innovations.
The findings recommend that the consumers will benefit most if carbon revenues are
distributed together with the development of appropriate credit facilities. This could be
important in the present political scenario where the local councils have the right to
execute energy access programs, but do not have sufficient funds and the right tools in
terms of plans and programs to meet energy access targets. Instead of trying to provide
larger upfront subsidies to smaller groups, the councils could use the linkages with
carbon markets, and provide such revenues over time as carbon revenues become
available each year from their available budget, to reach a larger set of potential
beneficiaries. Some of the councils could initiate such pilot programs, together with
additional support for the promotion of credit in their jurisdiction.
In the global climate finance context, these are recommendations to increase global
programmatic efforts towards enhancing access to credit with a specific focus on energy
access and renewable energy promotion. Further, in the context of the ongoing review
and the expected changes in the global carbon trading regime post 2020, especially with
the intended sustainable development mechanism, it may be worthwhile to put a greater
emphasis on carbon market linkages to benefit the rural poor through providing a share
of carbon revenues. This could lead to an increase in the uptake of energy access and
renewable energy technologies at lower costs, especially when access to credit is
integrated with such efforts to provide beneficial market linkages. The aforementioned
policy recommendations could lead to enhancing efficiency and equity at multiple

252
levels of the climate finance framework, with impacts on climate change mitigation,
adaptation, and sustainable development.
13.4 Research Caveats
While the study sought to explore whether alleviating budget constraints or altering
payment terms influences adoption of biogas plants, some households may have a
preference for the traditional way of cooking, and consequently their reason for not
adopting a biogas plant may not be budget related, or influenced by altering credit
terms. For those households, alternative approaches may be needed to address adoption,
such as a social marketing campaign, or assistance through opinion leaders. The
literature review did point out the propensity of households to revert back to using
traditional stoves for various reasons, and the results also indicated that education and
health impact awareness, especially for female household members are important.
Further, the literature review also pointed out that ICS adoption is influenced by varied
payment terms and sales offers. However, addressing the constraints specific to
adoption of ICS or other clean cooking options was not the primary objective, and is
beyond the scope of the thesis.
The results of validity tests show that CV and CE can provide valid estimates. The
median value estimate from both the parametric and non-parametric CV models
overlap, and indicate robust measures of the consumers’ demand. Similarly, the CE
results also indicate the probability of preference heterogeneity among the respondents
as expected. In this, one-third of respondents with higher income, age and firewood
consumption were more sensitive about their choices compared to the rest of the
respondents. The rest of the respondents indicated relatively lesser sensitivities, which
may have been due to respondent uncertainty and cognitive burden with the choice
trade-off to be made. However, this is considered a valid result for rural consumers
because of their lower education levels and the fact that only half of the respondents had
prior credit experience.
The survey was carried out face-to-face with the households and the researcher was
involved in the case of interviews with the financing entities. The non-response rate was
negligible without any protest responses. However, extrapolation of the results in the
hills and mountain region besides the Terai region may be incorrect due to the
difference in the cost of the technology and the different circumstances with respect to
infrastructure. The costs of biogas are higher by 22% to 90% in the hills and mountains,

253
and therefore the scale of the bid values and attribute parameters may need to be
different than the ones presented in this study. Further, benefit-cost analysis was not
carried out to provide a scale of the potential benefits, which could influence decision
makers.
13.5 Future Research
The results indicated positive impacts of information dissemination towards enhancing
the probability of purchase of the biogas plants. However, the awareness about climate
change impacts indicated a negative impact on the probability of purchase, which was
moderated with the increase in the firewood consumed by the households. It was
expected that the main effects of the awareness about the climate change knowledge
should have been positive. Further, while the literature review revealed that the energy
security concerns results in positive WTP, the study did not include it explicitly for the
survey. Therefore, it can be that the positive WTP for biogas plants in this study could
have been motivated by implicit energy security concerns, especially due to the scarcity
of LPG during the closures of the southern borders in Nepal as explained in the
qualitative analysis. In this context, it is expected that inclusion of information on such
issues would result in additive psychological influences on the consumers in addition to
the other benefits and costs that the consumers are aware of. However, awareness about
climate change impacts, about RETs in relation to potential carbon revenues, and the
energy security concerns are subjects which are not part of the regular academic as well
as programmatic discussion in Nepal. Therefore, future research in understanding these
aspects exclusively or as part of a wider research could be useful in assessing
consumers’ climate change information needs in the energy access space as well as
other relevant sectors such as agriculture, built environment, and forestry.
The expectation is that the demand for biogas plants will increase with the distribution
of carbon revenues in parallel with credit mainstreaming. However, the actual
implications can only be confirmed through impact analysis based on actual
experiments or quasi-experiments. Therefore, such experiments and subsequent impact
evaluation would be important to validate the results of the research. The data from such
experiments will be more suitable for benefit-cost analysis and extrapolations which
could be used for longer-term policy and planning of biogas promotion in Nepal.

254
13.6 Conclusion
The thesis has involved an investigation of the potential of distributing carbon revenues
as results-based payments to reduce and/or replace the current direct subsidy based
biogas promotion in Nepal. This approach has tested the potential along with the
influence of implied and explicit access to credit situations. The thesis results indicated
that mainstreaming credit together with the carbon revenues could positively impact the
take up of renewable energy technologies, without the need for upfront subsidies.

255
References
Abdullah, S., & Jeanty, P. W. (2011). Willingness to pay for renewable energy:
Evidence from a contingent valuation survey in Kenya. Renewable and
Sustainable Energy Reviews, 15(6), 2974-2983. doi:10.1016/j.rser.2011.03.016
Abdullah, S., & Mariel, P. (2010). Choice experiment study on the willingness to pay to
improve electricity services. Energy Policy, 38(8), 4570-4581.
Abeler, J., Falk, A., Goette, L., & Huffman, D. (2011). Reference points and effort
provision. American Economic Review, 101(2), 470-492.
Abiiro, G. A., Leppert, G., Mbera, G. B., Robyn, P. J., & De Allegri, M. (2014).
Developing attributes and attribute-levels for a discrete choice experiment on
micro health insurance in rural Malawi. BMC Health Serv Res, 14(1), 235.
Abou-Ali, H., & Carlsson, F. (2004). Evaluating the welfare effects of improved water
quality using the choice experiment method. Retrieved from
https://ideas.repec.org/p/hhs/gunwpe/0131.html
Acemoglu, D., Aghion, P., Bursztyn, L., & Hemous, D. (2012). The environment and
directed technical change. The American Economic Review, 102(1), 131-166.
Acemoglu, D., & Robinson, J. A. (2012). Why nations fail: The origins of power,
prosperity, and poverty: Crown Books.
Acharya, K., & Bajracharya, T. (2013). Current status of micro hydro technology in
Nepal. Retrieved from
https://www.researchgate.net/publication/296348325_Current_Status_of_Micro
_Hydro_Technology_in_Nepal
Adamowicz, W. L. (2004). What's it worth? An examination of historical trends and
future directions in environmental valuation*. Australian Journal of Agricultural
and Resource Economics.
Adams, R., Chou, Y. J., & Pu, C. (2015). Willingness to participate and Pay for a
proposed national health insurance in St. Vincent and the grenadines: a cross-
sectional contingent valuation approach. BMC Health Serv Res, 15, 148.
doi:10.1186/s12913-015-0806-3
Adkins, E., Tyler, E., Wang, J., Siriri, D., & Modi, V. (2010). Field testing and survey
evaluation of household biomass cookstoves in rural sub-Saharan Africa. Energy
for Sustainable Development, 14(3), 172-185.
Ahmad, B., & Rahman, A. U. (2017). Role of micro credit in fuel wood conservation
and living standard. Retrieved from https://ssrn.com/abstract=3049320
Akhtar, S., Saleem, W., Nadeem, V., Shahid, I., & Ikram, A. (2017). Assessment of
willingness to pay for improved air quality using contingent valuation method.
Global Journal of Environmental Science and Management, 3(3), 279-286.
Alberini, A. (1995). Optimal designs for discrete choice contingent valuation surveys:
Single-bound, double-bound, and bivariate models. Journal of Environmental
Economics and Management, 28(3), 287-306.
Alberini, A., Bigano, A., Ščasný, M., & Zvěřinová, I. (2016). Preferences for Energy
Efficiency vs. Renewables: How Much Does a Ton of CO2 Emissions Cost?
Alberini, A., & Cooper, J. (2000). Applications of the contingent valuation method in
developing countries: A survey (Vol. 146): Food & Agriculture Org.
Albert, J., Luoto, J., & Levine, D. (2010). End-user preferences for and performance of
competing POU water treatment technologies among the rural poor of Kenya.
Environmental science & technology, 44(12), 4426-4432.
Alexander, A. J., Shi, L., & Solomon, B. (2017). How fintech is reaching the poor in
Africa and Asia: A start-up perspective. Retrieved from
https://openknowledge.worldbank.org/handle/10986/30360
https://www.researchgate.net/publication/296348325_Current_Status_of_Micro_Hydro_Technology_in_Nepal

256
Alhassan, H., Donkoh, S., & Boateng, V. (2017). Households' willingness to pay for
improved solid waste management in Tamale Metropolitan area, Northern
Ghana UDS International Journal of Development, 3(2), 70-84.
Alstone, P., Gershenson, D., & Kammen, D. M. (2015). Decentralized energy systems
for clean electricity access. Nature Climate Change, 5, 305.
doi:10.1038/nclimate2512
Alternative Energy Promotion Centre. (2008a). Biogas Users Survey 2007/08. In.
Kathmandu, Nepal: Alternative Energy Promotion Centre, Ministry of Energy,
Water Resources and Irrigation.
Alternative Energy Promotion Centre. (2008b). Solar and wind energy resource
assessment: Final report (GIS Part). Retrieved from
https://policy.asiapacificenergy.org/sites/default/files/Assessment___Solar%20a
nd%20Wind%20Energy%20Resource-
%20in%20Nepal%20%282008%29_reduced.pdf
Alternative Energy Promotion Centre. (2014). Study on socio-economic impact of
biogas support program. In. Kathmandu, Nepal: Alternative Energy Promotion
Centre, Ministry of Energy, Water Resources and Irrigation.
Alternative Energy Promotion Centre. (2015). Biogas as renewable source of energy in
Nepal: Theory and development. In. Kathmandu, Nepal: Alternative Energy
Promotion Centre, Ministry of Energy, Water Resources and Irrigation.
Alternative Energy Promotion Centre. (2016). Renewable Energy Subsidy Policy,
2016/17. Retrieved from https://www.aepc.gov.np/uploads/docs/2018-06-
19_RE%20Subsidy%20Policy,%202073%20(English).pdf.
Alternative Energy Promotion Centre. (2018). Progress at a glance: A year in review
2074/75 (2017/18). Retrieved from https://www.aepc.gov.np/documents/annual-
progress-report-aepc
Álvarez-Farizo, B., & Hanley, N. (2002). Using conjoint analysis to quantify public
preferences over the environmental impacts of wind farms. An example from
Spain. Energy Policy, 30(2), 107-116.
Amegnaglo, C. J., Anaman, K. A., Mensah-Bonsu, A., Onumah, E. E., & Gero, F. A.
(2017). Contingent valuation study of the benefits of seasonal climate forecasts
for maize farmers in the Republic of Benin, West Africa. Climate Services, 6, 1-
11.
Amiri, N., Emadian, S. F., Fallah, A., Adeli, K., & Amirnejad, H. (2015). Estimation of
conservation value of myrtle (Myrtus communis) using a contingent valuation
method: a case study in a Dooreh forest area, Lorestan Province, Iran. Forest
Ecosystems, 2(1), 30.
Amirnejad, H., Jahanifar, K., Shahpori, A., & Eshghi, F. (2018). Establishment of a
New Urban Solid Waste Management Programs in Mazandaran Province, North
of Iran. Journal of Applied Sciences and Environmental Management, 22(7),
1037-1041.
An, L., Lupi, F., Liu, J., Linderman, M. A., & Huang, J. (2002). Modeling the choice to
switch from fuelwood to electricity. Ecological Economics, 42(3), 445-457.
doi:10.1016/s0921-8009(02)00126-x
Anastassiadis, F., Liebe, U., & Musshoff, O. (2015). Financial flexibility in agricultural
investment decisions: a discrete choice experiment. Agricultural Economics
Review, 16(1), 47-58.
Andrews, R. N. (2006). Managing the environment, managing ourselves: A history of
American environmental policy: Yale University Press.
Ang, B., & Su, B. (2016). Carbon emission intensity in electricity production: A global
analysis. Energy Policy, 94, 56-63.

257
Angelsen, A., Brockhaus, M., Duchelle, A. E., Larson, A., Martius, C., Sunderlin, W.
D., . . . Wunder, S. (2017). Learning from REDD+: a response to Fletcher et al.
Conservation Biology, 31(3), 718-720.
Aravena, C., Martinsson, P., & Scarpa, R. (2014). Does money talk? — The effect of a
monetary attribute on the marginal values in a choice experiment. Energy
Economics, 44, 483-491. doi:10.1016/j.eneco.2014.02.017
Ariffin, M., Fazamimah, N., Ahmad, Y., & Alias, A. (2015). Importance of preserving
the non-use value of the cultural heritage: Case study of George Town, Penang
World Heritage Site. Applied Mechanics & Materials, 747.
Arinloye, D.-D. A., Linnemann, A. R., Hagelaar, G., Coulibaly, O., & Omta, O. S.
(2015). Taking profit from the growing use of mobile phone in Benin: a
contingent valuation approach for market and quality information access.
Information Technology for Development, 21(1), 44-66.
Arrow, K., Solow, R., Portney, P. R., Leamer, E. E., Radner, R., & Schuman, H. (1993).
Report of the NOAA panel on contingent valuation. Retrieved from
https://www.researchgate.net/profile/Edward_Leamer/publication/277297107_K
enneth_Arrow/links/572a241108ae2efbfdbc1959/Kenneth-Arrow.pdf
Arshad, M., Amjath-Babu, T., Kächele, H., & Müller, K. (2016). What drives the
willingness to pay for crop insurance against extreme weather events (flood and
drought) in Pakistan? A hypothetical market approach. Climate and
Development, 8(3), 234-244.
Asenso-Okyere, W. K., Osei-Akoto, I., Anum, A., & Appiah, E. N. (1997). Willingness
to pay for health insurance in a developing economy. A pilot study of the
informal sector of Ghana using contingent valuation. Health policy, 42(3), 223-
237.
Asian Development Bank. (2017). Nepal energy sector assessment, strategy, and road
map Retrieved from
https://www.adb.org/sites/default/files/publication/356466/nepal-energy-
assessment-road-map.pdf
Ayenew, B., & Meride, Y. (2015). Labor as a payment vehicle for valuing soil and
water conservation practice: An application of contingent valuation method in
Abaro-Toga Watershed, Southern Ethiopia. Journal of Economics and
Sustainable Development, 6(15), 17-26.
Azhar, A., Rahman, M. M., & Arif, M. T. (2018). Willingness to Pay For Health
Insurance in Sarawak, Malaysia: A Contingent Valuation Method. Bangladesh
Journal of Medical Science, 17(2), 230-237.
Báez-Montenegro, A., Centeno, A. B., Lara, J. Á. S., & Prieto, L. C. H. (2015).
Contingent valuation and motivation analysis of tourist routes: Application to
the cultural heritage of Valdivia (Chile). Tourism Economics, 22(3), 558-571.
doi:10.5367/te.2015.0459
Bailey, I., & Wilson, G. A. (2009). Theorising transitional pathways in response to
climate change: Technocentrism, ecocentrism, and the carbon economy.
Environment and Planning A, 41(10), 2324-2341. doi:10.1068/a40342
Bailis, R., Drigo, R., Ghilardi, A., & Masera, O. (2015). The carbon footprint of
traditional woodfuels. Nature Climate Change, 5(3), 266.
Bakar, N. A. A., Radam, A., Samdin, Z., & Yacob, M. R. (2016). Willingness to pay in
Kubah National Park and Matang Wildlife Centre: A contingent valuation
method International Journal of Business & Society, 17(1).
Baltussen, R., Ten Asbroek, A., Koolman, X., Shrestha, N., Bhattarai, P., & Niessen, L.
W. (2007). Priority setting using multiple criteria: should a lung health
programme be implemented in Nepal? Health Policy and Planning, 22(3), 178-
185.

258
Banna, H., Afroz, R., Masud, M. M., Rana, M. S., Koh, E. H., & Ahmad, R. (2016).
Financing an efficient adaptation programme to climate change: a contingent
valuation method tested in Malaysia. Cahiers Agricultures, 25(2), 25003.
Banzhaf, H. S. (2019). The environmental turn in natural resource economics: John
Krutilla and "Conservation Reconsidered" Journal of the History of Economic
Thought, 41(1), 27-46. doi:10.1017/S1053837218000305
Baral, N., Stern, M. J., & Bhattarai, R. (2008). Contingent valuation of ecotourism in
Annapurna conservation area, Nepal: Implications for sustainable park finance
and local development. Ecological Economics, 66(2-3), 218-227.
doi:10.1016/j.ecolecon.2008.02.004
Baranzini, A., Borzykowski, N., & Carattini, S. (2018). Carbon offsets out of the
woods? Acceptability of domestic vs. international reforestation programmes in
the lab. Journal of Forest Economics, 32, 1-12.
doi:https://doi.org/10.1016/j.jfe.2018.02.004
Barragán-Beaud, C., Pizarro-Alonso, A., Xylia, M., Syri, S., & Silveira, S. (2018).
Carbon tax or emissions trading? An analysis of economic and political
feasibility of policy mechanisms for greenhouse gas emissions reduction in the
Mexican power sector. Energy Policy, 122, 287-299.
Barrie, J., & Cruickshank, H. J. (2017). Shedding light on the last mile: A study on the
diffusion of Pay As You Go Solar Home Systems in Central East Africa. Energy
Policy, 107, 425-436.
Barton, D. N. (2002). The transferability of benefit transfer: contingent valuation of
water quality improvements in Costa Rica. Ecological Economics, 42(1), 147-
164.
Bateman, I. J., Carson, R. T., Day, B., Hanemann, M., Hanley, N., Hett, T., . . .
Özdemiroglu, E. (2002). Economic valuation with stated preference techniques:
a manual. Economic valuation with stated preference techniques: a manual.
Bates, M. N., Pokhrel, A. K., Chandyo, R. K., Valentiner-Branth, P., Mathisen, M.,
Basnet, S., . . . Smith, K. R. (2018). Kitchen PM 2.5 concentrations and child
acute lower respiratory infection in Bhaktapur, Nepal: The importance of fuel
type. Environmental research, 161, 546-553.
Baumol, W. J. (1978). Equity vs. allocative efficiency: Toward a theory of distributive
justice. Atlantic Economic Journal, 6(1), 8-16.
Baumol, W. J., & Oates, W. E. (1971). The use of standards and prices for protection of
the environment. In The economics of environment (pp. 53-65): Springer.
Baumol, W. J., & Wolff, E. N. (1981). Subsidies to new energy sources: do they add to
energy stocks? The journal of political economy, 891-913.
Bazilian, M., Nussbaumer, P., Gualberti, G., Haites, E., Levi, M., Siegel, J., . . .
Fenhann, J. (2011). Informing the financing of universal energy access: an
assessment of current financial flows. The Electricity Journal, 24(7), 57-82.
Bech, M., & Gyrd‐Hansen, D. (2005). Effects coding in discrete choice experiments.
Health Economics, 14(10), 1079-1083.
Beltramo, T., Blalock, G., Levine, D. I., & Simons, A. M. (2015). The effect of
marketing messages and payment over time on willingness to pay for fuel-
efficient cookstoves. Journal of Economic Behavior & Organization, 118, 333-
345. doi:https://doi.org/10.1016/j.jebo.2015.04.025
Bennett, J., & Blamey, R. (Eds.). (2001). The choice modelling approach to
environmental valuation: Edward Elgar Publishing.
Bergmann, A., Colombo, S., & Hanley, N. (2008). Rural versus urban preferences for
renewable energy developments. Ecological Economics, 65(3), 616-625.
doi:10.1016/j.ecolecon.2007.08.011

259
Bergmann, A., Hanley, N., & Wright, R. (2006). Valuing the attributes of renewable
energy investments. Energy Policy, 34(9), 1004-1014.
doi:10.1016/j.enpol.2004.08.035
Berhane, A., & Enquselassie, F. (2015). Patients’ preferences for attributes related to
health care services at hospitals in Amhara region, northern ethiopia: a discrete
choice experiment. Patient preference and adherence, 9, 1293.
Bhatia, M., & Angelou, N. (2015). Beyond connections: Energy access redefined.
Retrieved from https://elibrary.worldbank.org/doi/abs/10.1596/24368
Bhattacharyya, S. C. (2013). Financing energy access and off-grid electrification: A
review of status, options and challenges. Renewable and Sustainable Energy
Reviews, 20, 462-472.
Biggeri, M., Nannini, M., & Putoto, G. (2018). Assessing the feasibility of community
health insurance in Uganda: A mixed-methods exploratory analysis. Social
science & medicine, 200, 145-155.
Bijaya, G. D., Cheng, S., Xu, Z., Bhandari, J., Wang, L., & Liu, X. (2016). Community
forestry and livelihood in Nepal: A review. The Journal of Animal & Plant
Sciences, 26(1), 1-12.
Biller, D., Rogge, K., & Ruta, G. (2006). The use of contingent valuation in developing
countries: a quantitative analysis. In A. Alberini & J. Kahn (Eds.), Handbook on
Contingent Valuation Edward Elgar
Binam, J., Nkama, A., & Nkenda, R. (2004). Estimating the willingness to pay for
community health prepayment schemes in rural area: A case study of the use of
contingent valuation surveys in central Cameroon Institute of Agricultural
Research for Development. In: Institute of Agricultural Research for
Development, University of YaoundÈ II.
Birol, E., Meenakshi, J., Oparinde, A., Perez, S., & Tomlins, K. (2015). Developing
country consumers’ acceptance of biofortified foods: a synthesis. Food Security,
7(3), 555-568.
Birol, E., Roy, D., Deffner, K., & Karandikar, B. (2009). Developing country
consumers’ demand for food safety and quality: Is Mumbai ready for certified
and organic fruits? Paper presented at the 2009 Conference, August 16-22,
2009, Beijing, China.
Bishop, R. C., & Heberlein, T. A. (1979). Measuring values of extramarket goods: Are
indirect measures biased? American journal of agricultural economics, 61(5),
926-930.
Blaauw, D., Erasmus, E., Pagaiya, N., Tangcharoensathein, V., Mullei, K., Mudhune,
S., . . . Lagarde, M. (2010). Policy interventions that attract nurses to rural areas:
a multicountry discrete choice experiment. Bulletin of the World Health
Organization, 88(5), 350-356.
Blamey, R., Gordon, J., & Chapman, R. (1999). Choice modelling: assessing the
environmental values of water supply options. Australian Journal of
Agricultural and Resource Economics, 43(3), 337-357.
Blazy, J.-M., Carpentier, A., & Thomas, A. (2011). The willingness to adopt agro-
ecological innovations: Application of choice modelling to Caribbean banana
planters. Ecological Economics, 72, 140-150.
Blomley, T., Maharjan, R., & Meshack, C. (2009). Exploring the rationale for benefit
sharing in community forestry: Experiences from Tanzania and Nepal. In
Towards a conceptual framework for equitable benefit-sharing in community
forestry.
Blonz, J., Burtraw, D., & Walls, M. A. (2010). Climate policy's uncertain outcomes for
households: The role of complex allocation schemes in cap-and-trade. The BE
Journal of Economic Analysis & Policy, 10(2).

260
Bodansky, D. (1999). The legitimacy of international governance: a coming challenge
for international environmental law? American Journal of International Law,
596-624.
Bolaji, B. O. (2012). Effects of unsustainable use of biomass energy for cooking and
strategies for their reduction in developing countries. Developing Country
Studies, 2(3), 19-25.
Börner, J., Wunder, S., Wertz-Kanounnikoff, S., Tito, M. R., Pereira, L., & Nascimento,
N. (2010). Direct conservation payments in the Brazilian Amazon: Scope and
equity implications. Ecological Economics, 69(6), 1272-1282.
Botelho, A., Pinto, L. M. C., Lourenço-Gomes, L., Valente, M., & Sousa, S. (2016).
Social sustainability of renewable energy sources in electricity production: An
application of the contingent valuation method. Sustainable Cities and Society,
26, 429-437. doi:https://doi.org/10.1016/j.scs.2016.05.011
Bowen, H. R. (1943). The interpretation of voting in the allocation of economic
resources. The Quarterly Journal of Economics, 27-48.
Boxall, P., Adamowicz, W., Swait, J., Williams, M., & Louviere, J. J. (1996). A
comparison of stated preference methods for environmental valuation.
Ecological Economics, 18(3), 243-253.
Boyd, E., Hultman, N., Timmons Roberts, J., Corbera, E., Cole, J., Bozmoski, A., . . .
Liverman, D. M. (2009). Reforming the CDM for sustainable development:
lessons learned and policy futures. Environmental Science & Policy, 12(7), 820-
831. doi:10.1016/j.envsci.2009.06.007
Boyle, K. J. (2003). Contingent valuation in practice. In A primer on nonmarket
valuation (pp. 111-169): Springer.
Boyle, K. J., MacDonald, H. F., Cheng, H.-t., & McCollum, D. W. (1998). Bid design
and yea saying in single-bounded, dichotomous-choice questions. Land
economics, 49-64.
Branger, F., Lecuyer, O., & Quirion, P. (2015). The European Union Emissions Trading
Scheme: Should we throw the flagship out with the bathwater? Wiley
Interdisciplinary Reviews: Climate Change, 6(1), 9-16.
Brennan, N., & Van Rensburg, T. M. (2016). Wind farm externalities and public
preferences for community consultation in Ireland: A discrete choice
experiments approach. Energy Policy, 94, 355-365.
doi:https://doi.org/10.1016/j.enpol.2016.04.031
Brenner, M., Riddle, M., & Boyce, J. K. (2007). A Chinese sky trust?: Distributional
impacts of carbon charges and revenue recycling in China. Energy Policy, 35(3),
1771-1784.
Bridge, G., Bouzarovski, S., Bradshaw, M., & Eyre, N. (2013). Geographies of energy
transition: Space, place and the low-carbon economy. Energy Policy, 53, 331-
340.
British Broadcasting Corporation (BBC). (2018). Nepal blockade: Six ways it affects
the country. Retrieved from https://www.bbc.com/news/world-asia-35041366
Brouwer, R. (2000). Environmental value transfer: state of the art and future prospects.
Ecological Economics, 32(1), 137-152.
Brouwer, R., & Akter, S. (2010). Informing micro insurance contract design to mitigate
climate change catastrophe risks using choice experiments. Environmental
Hazards, 9(1), 74-88.
Brouwer, R., Job, F. C., van der Kroon, B., & Johnston, R. (2015). Comparing
willingness to pay for improved drinking-water quality using stated preference
methods in rural and urban Kenya. Applied health economics and health policy,
13(1), 81-94.

261
Brown, K., & Corbera, E. (2003). Exploring equity and sustainable development in the
new carbon economy. Climate Policy, 3, S41-S56.
doi:10.1016/j.clipol.2003.10.004
Brunie, A., Chen, M., & Akol, A. (2016). Qualitative assessment of the application of a
discrete choice experiment with community health workers in Uganda: Aligning
incentives with preferences. Global Health: Science and Practice, 4(4), 684-
693.
Büchs, M., Bardsley, N., & Duwe, S. (2011). Who bears the brunt? Distributional
effects of climate change mitigation policies. Critical Social Policy,
0261018310396036.
Buen, J. (2018). The danger of subsidised solar: How government and donors
unwittingly hobbled our business Retrieved from https://nextbillion.net/danger-
subsidized-solar-government-donors-unwittingly-hobbled-business/
Bumpus, A. G., & Liverman, D. M. (2008). Accumulation by decarbonization and the
governance of carbon offsets. Economic Geography, 127-155.
Bumpus, A. G., Liverman, D. M., & Lovell, H. (2010). The rise of voluntary carbon
offset standards: self-regulation, legitimacy and multi-scalar governance.
Legitimacy and Multi-Scalar Governance (September 20, 2010).
Burke, P. F., Aubusson, P. J., Schuck, S. R., Buchanan, J. D., & Prescott, A. E. (2015).
How do early career teachers value different types of support? A scale-adjusted
latent class choice model. Teaching and Teacher Education, 47, 241-253.
Burt, Z., Njee, R. M., Mbatia, Y., Msimbe, V., Brown, J., Clasen, T. F., . . . Ray, I.
(2017). User preferences and willingness to pay for safe drinking water:
Experimental evidence from rural Tanzania. Social science & medicine, 173, 63-
71.
Burtraw, D., Palmer, K., Bharvirkar, R., & Paul, A. (2001). The effect of allowance
allocation on the cost of carbon emission trading. Resources for the Future
Discussion Paper, 1(03).
Burtraw, D., Sweeney, R., & Walls, M. (2009). The incidence of US climate policy:
alternative uses of revenues from a cap-and-trade auction.
Byrnes, L., Brown, C., Foster, J., & Wagner, L. D. (2013). Australian renewable energy
policy: Barriers and challenges. Renewable Energy, 60, 711-721.
doi:https://doi.org/10.1016/j.renene.2013.06.024
Campese, J. (2012). Equitable benefit sharing: exploring experiences and lessons for
REDD+ in Tanzania. Paper presented at the Tanzania Natural Resource Forum,
Arusha, Tanzania.
Caney, S., & Hepburn, C. (2011). Carbon trading: unethical, unjust and ineffective?
Royal Institute of Philosophy Supplements, 69, 201-234.
Carattini, S., Baranzini, A., Thalmann, P., Varone, F., & Vöhringer, F. (2017). Green
taxes in a post-Paris world: Are millions of nays inevitable? Environmental and
Resource Economics, 68(1), 97-128. doi:10.1007/s10640-017-0133-8
Carl, J., & Fedor, D. (2016). Tracking global carbon revenues: A survey of carbon taxes
versus cap-and-trade in the real world. Energy Policy, 96, 50-77.
doi:https://doi.org/10.1016/j.enpol.2016.05.023
Carson, R. T. (2000). Contingent valuation: a user's guide. Environmental science &
technology, 34(8), 1413-1418.
Carson, R. T. (2012). Contingent valuation: a comprehensive bibliography and history:
Edward Elgar Publishing.
Carson, R. T., & Czajkowski, M. (2014). The discrete choice experiment approach to
environmental contingent valuation. In S. Hess & A. Daly (Eds.), The handbook
of choice modelling: Edward Elgar Publishing.

262
Carson, R. T., Flores, N. E., & Meade, N. F. (2001). Contingent valuation: controversies
and evidence. Environmental and Resource Economics, 19(2), 173-210.
Carson, R. T., Flores, N. E., & Mitchell, R. C. (1999). The theory and measurement of
passive-use value: Oxford University Press.
Carson, R. T., & Groves, T. (2007). Incentive and informational properties of
preference questions. Environmental and Resource Economics, 37(1), 181-210.
Carson, R. T., & Mitchell, R. C. (1995). Sequencing and nesting in contingent valuation
surveys. Journal of Environmental Economics and Management, 28(2), 155-
173.
Carson, R. T., Mitchell, R. C., Hanemann, M., Kopp, R. J., Presser, S., & Ruud, P. A.
(2003). Contingent valuation and lost passive use: damages from the Exxon
Valdez oil spill. Environmental and Resource Economics, 25(3), 257-286.
Carson, R. T., Wilks, L., & Imber, D. (1994). Valuing the preservation of Australia's
Kakadu conservation zone. Oxford Economic Papers, 727-749.
Central Bureau of Statistics. (2010a). Nepal living standard survey, Statistical report
volume I. Kathmandu, Nepal: National Planning Commission Secretariat.
Central Bureau of Statistics. (2010b). Nepal living standard survey, Statistical report
volume II. Kathmandu, Nepal: National Planning Commission Secretariat.
Central Bureau of Statistics. (2014a). Population monograph of Nepal, Volume I
Population dynamics. Kathmandu, Nepal: National Planning Commission
Secretariat.
Central Bureau of Statistics. (2014b). Population monograph of Nepal, Volume II Social
demography. Kathmandu, Nepal: National Planning Commission Secretariat.
Central Bureau of Statistics. (2014c). Population monograph of Nepal, Volume III
Economic demography. Kathmandu, Nepal: National Planning Commission
Secretariat.
Central Renewable Energy Fund. (2013). CREF financial intermediation mechanism
(Final Draft). Retrieved from https://www.aepc.gov.np/uploads/docs/2018-07-
10_CREF%20Financial%20Intermediation%20Mechanism.pdf
Central Renewable Energy Fund Investment Committee. (2015). Central renewable
energy fund: Operational guideline.
Centre for Energy Studies. (2013). Study on role of renewable energy technologies in
climate change mitigation and adaptation options in Nepal. In. Kathmandu,
Nepal: Alternative Energy Promotion Centre, Ministry of Energy, Water
Resources and Irrigation.
Centre for Microfinance. (2013). Study on impact of credit on the installation of biogas
plants. Retrieved from https://aepc.gov.np/uploads/docs/2018-07-
09_Study%20on%20Impact%20of%20Credit%20on%20Installation%20of%20
Biogas%20Plants.pdf
Cerutti, P. O., Lescuyer, G., Assembe-Mvondo, S., & Tacconi, L. (2010). The
challenges of redistributing forest-related monetary benefits to local
governments: a decade of logging area fees in Cameroon. International Forestry
Review, 12(2), 130-138.
Chaikumbung, M., Doucouliagos, H., & Scarborough, H. (2016). The economic value
of wetlands in developing countries: A meta-regression analysis. Ecological
Economics, 124, 164-174. doi:https://doi.org/10.1016/j.ecolecon.2016.01.022
Challcharoenwattana, A., & Pharino, C. (2016). Wishing to finance a recycling
program? Willingness-to-pay study for enhancing municipal solid waste
recycling in urban settlements in Thailand. Habitat International, 51, 23-30.
Chan, K.-Y., Oerlemans, L. A. G., & Volschenk, J. (2015). On the construct validity of
measures of willingness to pay for green electricity: Evidence from a South

263
African case. Applied Energy, 160, 321-328.
doi:10.1016/j.apenergy.2015.09.068
Chanel, O., Makhloufi, K., & Abu-Zaineh, M. (2017). Can a circular payment card
format effectively elicit preferences? Evidence from a survey on a mandatory
health insurance scheme in Tunisia. Applied health economics and health policy,
15(3), 385-398.
Chatterjee, N. (2015). Willingness to pay for drinking water in some selected dryland
areas of West Bengal: A contingent valuation approach. In. West Bengal, India:
Vidyasagar University.
Chaurey, A., Krithika, P., Palit, D., Rakesh, S., & Sovacool, B. K. (2012). New
partnerships and business models for facilitating energy access. Energy Policy,
47, 48-55.
Chen, B., & Qi, X. (2018). Protest response and contingent valuation of an urban forest
park in Fuzhou City, China. Urban Forestry & Urban Greening, 29, 68-76.
Chen, Q., Yang, H., Liu, T., & Zhang, L. (2016). Household biomass energy choice and
its policy implications on improving rural livelihoods in Sichuan, China. Energy
Policy, 93, 291-302. doi:https://doi.org/10.1016/j.enpol.2016.03.016
Chen, W. Y., & Hua, J. (2015). Citizens' distrust of government and their protest
responses in a contingent valuation study of urban heritage trees in Guangzhou,
China. J Environ Manage, 155, 40-48. doi:10.1016/j.jenvman.2015.03.002
Chen, W. Y., Hua, J., Liekens, I., & Broekx, S. (2018). Preference heterogeneity and
scale heterogeneity in urban river restoration: A comparative study between
Brussels and Guangzhou using discrete choice experiments. Landscape and
Urban Planning, 173, 9-22.
Chen, X., Lupi, F., & Liu, J. (2017). Accounting for ecosystem services in
compensating for the costs of effective conservation in protected areas.
Biological Conservation, 215, 233-240.
doi:https://doi.org/10.1016/j.biocon.2017.09.013
Chen, X., Shao, S., Tian, Z., Xie, Z., & Yin, P. (2017). Impacts of air pollution and its
spatial spillover effect on public health based on China's big data sample.
Journal of Cleaner Production, 142, 915-925.
Chien, Y.-L., Huang, C. J., & Shaw, D. (2005). A general model of starting point bias in
double-bounded dichotomous contingent valuation surveys. Journal of
Environmental Economics and Management, 50(2), 362-377.
Chiwaula, L. S., Chirwa, G. C., Caltado, F., Kapito-Tembo, A., Hosseinipour, M. C.,
van Lettow, M., . . . Kasende, F. (2016). The value of informal care in the
context of option B+ in Malawi: a contingent valuation approach. BMC Health
Serv Res, 16(1), 136.
Choe, K., Whittington, D., & Lauria, D. T. (1996). The economic benefits of surface
water quality improvements in developing countries: a case study of Davao,
Philippines. Land economics, 519-537.
Chowdhury, S., Meenakshi, J., Tomlins, K. I., & Owori, C. (2011). Are consumers in
developing countries willing to pay more for micronutrient-dense biofortified
foods? Evidence from a field experiment in Uganda. American journal of
agricultural economics, 93(1), 83-97.
Ciriacy-Wantrup, S. V. (1947). Capital returns from soil-conservation practices. Journal
of farm economics, 29(4 Part II), 1181-1196.
Coase, R. H. (1960). The problem of social cost: Springer.
Collings, S., & Munyehirwe, A. (2016). Pay-as-you-go solar PV in Rwanda: evidence
of benefits to users and issues of affordability. Field Actions Science Reports.
The journal of field actions(Special Issue 15), 94-103.

264
Colombo, S., Calatrava-Requena, J., & Hanley, N. (2007). Testing choice experiment
for benefit transfer with preference heterogeneity. American journal of
agricultural economics, 89(1), 135-151.
Convery, F., Ellerman, A. D., & De Perthuis, C. (2008). The European carbon market in
action: Lessons from the first trading period. Journal for European
Environmental & Planning Law, 5(2), 215-233.
Cook, J., Jeuland, M., Maskery, B., & Whittington, D. (2012). Giving stated preference
respondents “time to think”: results from four countries. Environmental and
Resource Economics, 51(4), 473-496.
Cook, J., Whittington, D., Canh, D. G., Johnson, F. R., & Nyamete, A. (2007).
Reliability of stated preferences for cholera and typhoid vaccines with time to
think in Hue, Vietnam. Economic Inquiry, 45(1), 100-114.
Corbera, E., Brown, K., & Adger, W. N. (2007). The equity and legitimacy of markets
for ecosystem services. Development and Change, 38(4), 587-613. doi:DOI
10.1111/j.1467-7660.2007.00425.x
Cramton, P., & Kerr, S. (2002). Tradeable carbon permit auctions: How and why to
auction not grandfather. Energy Policy, 30(4), 333-345.
Cranford, M. (2014). Positive incentives for ecosystem services. (PhD), University of
London,
Cranford, M., & Mourato, S. (2014). Credit-based payments for ecosystem services:
Evidence from a choice experiment in Ecuador. World Development, 64, 503-
520.
Cromwell, G. (1992). What makes technology transfer? Small-scale hydropower in
Nepal's public and private sectors. World Development, 20(7), 979-989.
doi:https://doi.org/10.1016/0305-750X(92)90125-F
Cundale, K., Thomas, R., Malava, J. K., Havens, D., Mortimer, K., & Conteh, L.
(2017). A health intervention or a kitchen appliance? Household costs and
benefits of a cleaner burning biomass-fuelled cookstove in Malawi. Social
science & medicine, 183, 1-10.
Dales, J. H. (1968). Pollution, property, and prices: An essay in policy-making and
economics Edward Elgar Publishing
Danso, G. K., Otoo, M., Ekere, W., Ddungu, S., & Madurangi, G. (2017). Market
Feasibility of Faecal Sludge and Municipal Solid Waste-Based Compost as
Measured by Farmers’ Willingness-to-Pay for Product Attributes: Evidence
from Kampala, Uganda. Resources, 6(3), 31.
Das, S., Birol, E., & Bhattacharya, R. N. (2010). Informing efficient solid waste
management to improve local environmental quality and public health in West
Bengal, India. In J. Bennett & E. Birol (Eds.), Choice Experiments in
Developing Countries: Implementation, Challenges and Policy Implications
(Vol. 171): Edward Elgar.
Daskalakis, G. (2018). Temporal restrictions on emissions trading and the implications
for the carbon futures market: Lessons from the EU emissions trading scheme.
Energy Policy, 115, 88-91. doi:https://doi.org/10.1016/j.enpol.2018.01.008
Datta, R. (2003). From development to empowerment: the self-employed women's
association in India. International Journal of Politics, Culture, and Society,
16(3), 351-368.
Dauda, S. A., Yacob, M. R., & Radam, A. (2015). Household’s willingness to pay for
heterogeneous attributes of drinking water quality and services improvement: an
application of choice experiment. Applied Water Science, 5(3), 253-259.
Davis, R. K. (1963). The value of outdoor recreation: an economic study of the Maine
woods. (PhD), Harvard University,

265
Deichmann, U., Meisner, C., Murray, S., & Wheeler, D. (2011). The economics of
renewable energy expansion in rural Sub-Saharan Africa. Energy Policy, 39(1),
215-227. doi:10.1016/j.enpol.2010.09.034
Desvousges, W. H., Johnson, F. R., Dunford, R. W., Boyle, K. J., Hudson, S. P., &
Wilson, K. N. (1993). Measuring natural resource damages with contingent
valuation: tests of validity and reliability. Contingent valuation: A critical
assessment, 91, 91-93.
Desvousges, W. H., Mathews, K., & Train, K. (2016). From curious to pragmatically
curious: Comment on “From Hopeless to Curious? Thoughts on Hausman's
‘Dubious to Hopeless’ Critique of Contingent Valuation”. Applied Economic
Perspectives and Policy, 38(1), 174-182.
Dhakal, N. (2008). Financing domestic biogas plants in Nepal Retrieved from
http://www.bibalex.org/search4dev/files/338821/172303.pdf
Dhakal, N., & Kanel, J. P. (2004). Microfinance services in insurgency and conflict
situation: case study of Nepal. In. Kathmandu, Nepal: International Network of
Alternative Financial Institutions and South Asia Partnership.
Dhakal, S., & Raut, A. (2010). Potential and bottlenecks of the carbon market: The case
of a developing country, Nepal. Energy Policy, 38(7), 3781-3789.
Dhital, R. P., Ito, Y., Kaneko, S., Komatsu, S., Mihara, R., & Yoshida, Y. (2016). Does
institutional failure undermine the physical design performance of solar water
pumping systems in rural Nepal? Sustainability, 8(8), 770.
Diamond, P. A., & Hausman, J. A. (1994). Contingent valuation: Is some number better
than no number? The Journal of economic perspectives, 8(4), 45-64.
Dillman, D. A. (2011). Mail and Internet surveys: The tailored design method--2007
Update with new Internet, visual, and mixed-mode guide: John Wiley & Sons.
Dimal, M. O. R., & Jetten, V. (2018). Analyzing preference heterogeneity for soil
amenity improvements using discrete choice experiment. Environment,
Development and Sustainability, 1-29.
Dimitropoulos, A., & Kontoleon, A. (2009). Assessing the determinants of local
acceptability of wind-farm investment: A choice experiment in the Greek
Aegean Islands. Energy Policy, 37(5), 1842-1854.
doi:10.1016/j.enpol.2009.01.002
Dinan, T. M., & Rogers, D. L. (2002). Distributional effects of carbon allowance
trading: how government decisions determine winners and losers. National Tax
Journal, 199-221.
Donfouet, H. P. P., Cook, J., & Jeanty, P. W. (2015). The economic value of improved
air quality in urban Africa: a contingent valuation survey in Douala, Cameroon.
Environment and Development Economics, 20(5), 630-649.
Dong, X., Zhang, J., Zhi, R., Zhong, S. e., & Li, M. (2011). Measuring recreational
value of world heritage sites based on contingent valuation method: A case
study of Jiuzhaigou. Chinese Geographical Science, 21(1), 119-128.
Dransfeld, B., Hoch, S., Honegger, M., & Michaelowa, A. (2015). Analysis of possible
new market mechanisms Pilot activities beyond the PMR. Retrieved from
http://www.thegreenwerk.net/publications/Analysis_of_Possible_New_Market_
Mechanisms_Pilot_Activities_beyond_the_PMR.html
Duncan, R. (2007). Can subsidising alternative energy technology development lead to
faster global warming? Paper presented at the Australian Agricultural and
Resource Economics Society (AARES) 2007 Conference (51st), Queenstown,
New Zealand. https://ageconsearch.umn.edu/record/10383/
Durand-Morat, A., Wailes, E. J., & Nayga, R. M. (2016). Challenges of conducting
contingent valuation studies in developing countries. American journal of
agricultural economics, 98(2), 597-609.

266
Eberhard, A. A., Imran, M., Meier, P., Siyambalapitiya, T., & Vagliasindi, M. (2014).
The design and sustainability of renewable energy incentives: an economic
analysis. In: The World Bank.
Echessah, P. N., Swallow, B. M., Kamara, D. W., & Curry, J. J. (1997). Willingness to
contribute labor and money to tsetse control: Application of contingent valuation
in Busia District, Kenya. World Development, 25(2), 239-253.
Edenhofer, O., Hirth, L., Knopf, B., Pahle, M., Schlömer, S., Schmid, E., & Ueckerdt,
F. (2013). On the economics of renewable energy sources. Energy Economics,
40, S12-S23.
Ek, K., & Matti, S. (2015). Valuing the local impacts of a large scale wind power
establishment in northern Sweden: public and private preferences toward
economic, environmental and sociocultural values. Journal of environmental
planning and management, 58(8), 1327-1345.
doi:10.1080/09640568.2014.922936
Ellegård, A., Arvidson, A., Nordström, M., Kalumiana, O. S., & Mwanza, C. (2004).
Rural people pay for solar: experiences from the Zambia PV-ESCO project.
Renewable Energy, 29(8), 1251-1263.
Ellerman, A. D., & Harrison Jr, D. (2003). Emissions trading in the US: Experience,
lessons, and considerations for greenhouse gases. In: Pew Center on Global
Climate Change.
Ellerman, A. D., Marcantonini, C., & Zaklan, A. (2016). The European Union
Emissions Trading System: Ten years and counting. Review of Environmental
Economics and Policy, 10(1), 89-107. doi:10.1093/reep/rev014
Engel, S., Pagiola, S., & Wunder, S. (2008). Designing payments for environmental
services in theory and practice: An overview of the issues. Ecological
Economics, 65(4), 663-674.
European Union Emissions Trading Scheme. (2018). Use of international credits.
Retrieved from https://ec.europa.eu/clima/policies/ets/credits_en
Ezzati, M., & Baumgartner, J. C. (2017). Household energy and health: where next for
research and practice? The Lancet, 389(10065), 130-132.
Fahad, S., & Jing, W. (2018). Evaluation of Pakistani farmers’ willingness to pay for
crop insurance using contingent valuation method: The case of Khyber
Pakhtunkhwa province. Land Use Policy, 72, 570-577.
Farber, D. A. (2012). Pollution markets and social equity: Analyzing the fairness of cap
and trade. Ecology LQ, 39, 1.
Farrell, A. (2001). Multi-lateral emission trading: lessons from inter-state NOx control
in the United States. Energy Policy, 29(13), 1061-1072.
Farrell, A., Carter, R., & Raufer, R. (1999). The NOx Budget: market-based control of
tropospheric ozone in the northeastern United States. Resource and Energy
Economics, 21(2), 103-124.
Farrell, N., & Lyons, S. (2016). Equity impacts of energy and climate policy: who is
shouldering the burden? Wiley Interdisciplinary Reviews: Energy and
Environment, 5(5), 492-509.
Fenton, A., Paavola, J., & Tallontire, A. (2017). The role of microfinance in household
livelihood adaptation in satkhira district, southwest Bangladesh. World
Development, 92, 192-202.
Filippini, M., & Martínez-Cruz, A. L. (2016). Impact of environmental and social
attitudes, and family concerns on willingness to pay for improved air quality: a
contingent valuation application in Mexico City. Latin American Economic
Review, 25(1), 7.
Finmark Trust. (2014). Finscope Consumer Survey Nepal. Retrieved from
http://finmark.org.za/finscope-nepal-2014-consumer-survey/

267
Fletcher, R., & Breitling, J. (2012). Market mechanism or subsidy in disguise?
Governing payment for environmental services in Costa Rica. Geoforum, 43(3),
402-411.
Forest Action Nepal. (2014). Understanding drivers and causes of deforestation and
forest degradation in Nepal: Potential policies and measures for REDD+.
Retrieved from www.tinyurl.com/nepal-drivers-redd
Forest Trends. (2016). Raising ambition: State of the voluntary carbon markets 2016.
Retrieved from https://www.forest-trends.org/publications/raising-ambition/
Forest Trends. (2018). Voluntary carbon market insights: 2018 Outlook and first-
quarter trends. Retrieved from https://www.forest-
trends.org/publications/voluntary-carbon-markets/
Fox, J. (1984). Firewood consumption in a Nepali village. Environmental management,
8(3), 243-249.
Frondel, M., Ritter, N., Schmidt, C. M., & Vance, C. (2010). Economic impacts from
the promotion of renewable energy technologies: The German experience.
Energy Policy, 38(8), 4048-4056.
Fujimori, S., Kubota, I., Dai, H., Takahashi, K., Hasegawa, T., Liu, J.-Y., . . . Takimi,
M. (2017). The effectiveness of the international emissions trading under the
Paris Agreement. In Post-2020 Climate Action (pp. 65-75): Springer.
García-Amado, L. R., Pérez, M. R., Escutia, F. R., García, S. B., & Mejía, E. C. (2011).
Efficiency of payments for environmental services: equity and additionality in a
case study from a biosphere reserve in Chiapas, Mexico. Ecological Economics,
70(12), 2361-2368.
García, J. H., Cherry, T. L., Kallbekken, S., & Torvanger, A. (2016). Willingness to
accept local wind energy development: Does the compensation mechanism
matter? Energy Policy, 99, 165-173.
doi:https://doi.org/10.1016/j.enpol.2016.09.046
Gavard, C., & Kirat, D. (2018). Flexibility in the market for international carbon credits
and price dynamics Difference with European allowances. Energy Economics.
doi:https://doi.org/10.1016/j.eneco.2018.10.018
Gelo, D., & Koch, S. F. (2015). Contingent valuation of community forestry programs
in Ethiopia: Controlling for preference anomalies in double-bounded CVM.
Ecological Economics, 114, 79-89.
Gham Power. (2017). Khotang microgrid extension to power telecom and additional
community. Retrieved from
https://www.gsma.com/mobilefordevelopment/mgrantee/gham-power-nepal-
private-limited/
Ghanbarpour, M. R., Saravi, M. M., & Salimi, S. (2014). Floodplain inundation analysis
combined with contingent valuation: implications for sustainable flood risk
management. Water Resources Management, 28(9), 2491-2505.
Ghosh, R., Goyal, Y., Rommel, J., & Sagebiel, J. (2017). Are small firms willing to pay
for improved power supply? Evidence from a contingent valuation study in
India. Energy Policy, 109, 659-665.
Gibson, J., Rigby, D., Polya, D., & Russell, N. (2015). Discrete choice experiments in
developing countries: Willingness to pay versus willingness to work.
Environmental and Resource Economics, 1-25.
Glemarec, Y. (2012). Financing off-grid sustainable energy access for the poor. Energy
Policy, 47, 87-93. doi:10.1016/j.enpol.2012.03.032
Glenk, K., Hall, C., Liebe, U., & Meyerhoff, J. (2012). Preferences of scotch malt
whisky consumers for changes in pesticide use and origin of barley. Food
policy, 37(6), 719-731. doi:https://doi.org/10.1016/j.foodpol.2012.08.003

268
Goeree, J. K., Palmer, K., Holt, C. A., Shobe, W., & Burtraw, D. (2010). An
experimental study of auctions versus grandfathering to assign pollution permits.
Journal of the European Economic Association, 8(2‐3), 514-525.
Gold Standard. (2018). Project Registry. Retrieved from https://mer.markit.com/br-
reg/public/index.jsp?entity=project&sort=project_name&dir=ASC&start=0&ent
ity_domain=Markit,GoldStandar
Goldemberg, J., Johansson, T. B., Reddy, A. K. N., & Williams, R. H. (1987). Energy
for a sustainable world. Washington, D.C.: World Resources Institute.
Gollwitzer, L., Becker, S., Ely, A., Kirumba, E., Ozor, N., Urama, K., . . . Ockwell, D.
(2017). Debunking free market myths: transforming pro-poor, sustainable
energy access for climate compatible development. In Making Climate
Compatible Development Happen (pp. 130-150): Routledge.
Gomez, W., Salgado, H., Vasquez, F., & Chavez, C. (2014). Using stated preference
methods to design cost-effective subsidy programs to induce technology
adoption: an application to a stove program in southern Chile. J Environ
Manage, 132, 346-357. doi:10.1016/j.jenvman.2013.11.020
Goulder, L. H., & Schein, A. R. (2013). Carbon taxes versus cap and trade: a critical
review. Climate Change Economics, 4(03), 1350010.
Government of Nepal. (2017). Biomass Energy Strategy 2017. Retrieved from
https://www.aepc.gov.np/uploads/docs/2018-07-
29_Biomass%20Energy%20Strategy%202073%20BS%20(2017)%20English.pd
f.
Grameen Bank. (2018). Founder Retrieved from http://www.grameen.com/founder-2/
Grazhdani, D. (2015). Contingent valuation of residents’ attitudes and willingness-to-
pay for non-point source pollution control: A case study in AL-Prespa,
Southeastern Albania. Environmental management, 56(1), 81-93.
Groh, S., & Taylor, H. (2015). The role of microfinance in energy access: changing
roles, changing paradigms, and future potential. Enterprise Development and
Microfinance, 26(4), 307-324.
Groom, B., Dehlavi, A., Khan, B., & Shahab, A. (2010). Non-use values of wetland
ecosystems on the Indus River, Pakistan: A spatially explicit, multi-ecosystem
choice experiment. In J. Bennett & E. Birol (Eds.), Choice Experiments in
Developing Countries: Implementation, Challenges and Policy Implications:
Edward Elgar.
Groothuis, P. A., Groothuis, J. D., & Whitehead, J. C. (2008). Green vs. green:
Measuring the compensation required to site electrical generation windmills in a
viewshed. Energy Policy, 36(4), 1545-1550. doi:10.1016/j.enpol.2008.01.018
Grosjean, P., & Kontoleon, A. (2009). How sustainable are sustainable development
programs? The case of the Sloping Land Conversion Program in China. World
Development, 37(1), 268-285.
Gujba, H., Thorne, S., Mulugetta, Y., Rai, K., & Sokona, Y. (2012). Financing low
carbon energy access in Africa. Energy Policy, 47, 71-78.
Guo, X., Liu, H., Mao, X., Jin, J., Chen, D., & Cheng, S. (2014). Willingness to pay for
renewable electricity: A contingent valuation study in Beijing, China. Energy
Policy, 68, 340-347. doi:10.1016/j.enpol.2013.11.032
Haab, T. C., Interis, M. G., Petrolia, D. R., & Whitehead, J. C. (2013). From hopeless to
curious? Thoughts on Hausman's "Dubious to Hopeless" critique of contingent
valuation. Applied Economic Perspectives and Policy, 35(4), 593-612.
doi:10.1093/aepp/ppt029
Haab, T. C., & McConnell, K. E. (1997). Referendum models and negative willingness
to pay: alternative solutions. Journal of Environmental Economics and
Management, 32(2), 251-270.

269
Haab, T. C., & McConnell, K. E. (2002). Valuing environmental and natural resource:
The econometrics of non-market valuation: Edward Elgar Publishing.
Hadker, N., Sharma, S., David, A., & Muraleedharan, T. (1997). Willingness-to-pay for
Borivli National Park: evidence from a contingent valuation. Ecological
Economics, 21(2), 105-122.
Haghparast-Bidgoli, H., Shaha, S. K., Kuddus, A., Chowdhury, M. A. R., Jennings, H.,
Ahmed, N., . . . Nahar, T. (2018). Protocol of economic evaluation and equity
impact analysis of mHealth and community groups for prevention and control of
diabetes in rural Bangladesh in a three-arm cluster randomised controlled trial.
BMJ open, 8(8), e022035.
Hahn, R. W., & Hester, G. L. (1989). Where did all the markets go-An analysis of
EPA's Emissions Trading Program. Yale J. on Reg., 6, 109.
Hall, S., Foxon, T. J., & Bolton, R. (2017). Investing in low-carbon transitions: energy
finance as an adaptive market. Climate Policy, 17(3), 280-298.
Hall, S., Roelich, K. E., Davis, M. E., & Holstenkamp, L. (2018). Finance and justice in
low-carbon energy transitions. Applied Energy, 222, 772-780.
doi:https://doi.org/10.1016/j.apenergy.2018.04.007
Hammitt, J. K., & Zhou, Y. (2006). The economic value of air-pollution-related health
risks in China: a contingent valuation study. Environmental and Resource
Economics, 33(3), 399-423.
Hanemann, W. M. (1991). Willingness to pay and willingness to accept: how much can
they differ? The American Economic Review, 81(3), 635-647.
Hanemann, W. M. (1994). Valuing the environment through contingent valuation. The
Journal of economic perspectives, 8(4), 19-43.
Hanley, N., Mourato, S., & Wright, R. E. (2001). Choice modelling approaches: A
superior alternative for environmental valuatioin? Journal of Economic Surveys,
15(3), 435-462.
Hanley, N., & Nevin, C. (1999). Appraising renewable energy developments in remote
communities: the case of the North Assynt Estate, Scotland. Energy Policy,
27(9), 527-547.
Hanley, N., Ryan, M., & Wright, R. (2003). Estimating the monetary value of health
care: lessons from environmental economics. Health Economics, 12(1), 3-16.
Hanna, R., Duflo, E., & Greenstone, M. (2016). Up in smoke: the influence of
household behavior on the long-run impact of improved cooking stoves.
American Economic Journal: Economic Policy, 8(1), 80-114.
Hanson, K., McPake, B., Nakamba, P., & Archard, L. (2005). Preferences for hospital
quality in Zambia: results from a discrete choice experiment. Health Economics,
14(7), 687-701.
Hauber, A. B., González, J. M., Groothuis-Oudshoorn, C. G., Prior, T., Marshall, D. A.,
Cunningham, C., . . . Bridges, J. F. (2016). Statistical methods for the analysis of
discrete choice experiments: a report of the ISPOR Conjoint Analysis Good
Research Practices Task Force. Value in health, 19(4), 300-315.
Haug, C., Eden, A., & de Oca, M. M. (2018). Addressing the distributional impacts of
carbon pricing policies. Retrieved from
https://www.adelphi.de/en/publication/addressing-distributional-impacts-carbon-
pricing-policies-0
Hausman, J. (2012). Contingent valuation: From dubious to hopeless. Journal of
Economic Perspectives, 26(4), 43-56. doi:10.1257/jep.26.4.43
Hazra, T., Goel, S., & Maitra, B. (2015). Willingness-to-pay and preference
heterogeneity for service attributes of solid waste management: an experience in
Kolkata, India. Global Nest Journal, 17(1), 82-92.

270
Hearne, R. R., & Salinas, Z. M. (2002). The use of choice experiments in the analysis of
tourist preferences for ecotourism development in Costa Rica. J Environ
Manage, 65(2), 153-163.
Heinzen, R. R., & Bridges, J. F. (2008). Comparison of four contingent valuation
methods to estimate the economic value of a pneumococcal vaccine in
Bangladesh. International journal of technology assessment in health care,
24(04), 481-487.
Heltberg, R. (2004). Fuel switching: evidence from eight developing countries. Energy
Economics, 26(5), 869-887. doi:10.1016/j.eneco.2004.04.018
Hensher, D. A., & Johnson, L. W. (1981). Behavioural response and form of the
representative component of the indirect utility function in travel choice models.
Regional Science and Urban Economics, 11(4), 559-572.
Hensher, D. A., Rose, J. M., & Greene, W. H. (2005). Applied choice analysis: a
primer: Cambridge University Press.
Herbes, C., Friege, C., Baldo, D., & Mueller, K.-M. (2015). Willingness to pay lip
service? Applying a neuroscience-based method to WTP for green electricity.
Energy Policy, 87, 562-572. doi:https://doi.org/10.1016/j.enpol.2015.10.001
Hess, S., & Rose, J. M. (2012). Can scale and coefficient heterogeneity be separated in
random coefficients models? Transportation, 39(6), 1225-1239.
Hess, S., & Train, K. (2017). Correlation and scale in mixed logit models. Journal of
Choice Modelling, 23, 1-8.
Hill, R. V., Hoddinott, J., & Kumar, N. (2013). Adoption of weather‐index insurance:
learning from willingness to pay among a panel of households in rural Ethiopia.
Agricultural Economics, 44(4-5), 385-398.
Hilman, H., Gidwani, J., Morris, E., Subedi, P. S., & Chowdhary, S. (2007). Using
microfinance to expand access to energy services: The emerging experiences in
Asia of Self-employed Women’s Association Bank (SEWA), Sarvodaya Economic
Enterprise Development Services (SEEDS), Nirdhan Utthan Bank Limited
(NUBL), and AMRET. Retrieved from
http://www.arcfinance.org/pdfs/pubs/Energy_Asia_FINAL.pdf
Hofmann, A., & Grossmann, H. (2005). Rural finance in conflict environments –
Experiences from Nepal’s Small-Farmer Cooperatives Limited (SFCL).
Retrieved from http://www.findevgateway.org/sites/default/files/mfg-en-case-
study-rural-finance-in-conflict-environments-experiences-from-nepals-small-
farmer-cooperatives-limited-sfcl-2005_0.pdf
Holmes, T. P., & Adamowicz, W. L. (2003). Attribute-based methods. In P. A. Champ,
K. J. Boyle, & T. C. Brown (Eds.), A primer on nonmarket valuation (pp. 171-
219): Springer.
Hope, R. (2006). Evaluating water policy scenarios against the priorities of the rural
poor. World Development, 34(1), 167-179.
Huh, S.-Y., Lee, J., & Shin, J. (2015). The economic value of South Korea׳s renewable
energy policies (RPS, RFS, and RHO): A contingent valuation study. Renewable
and Sustainable Energy Reviews, 50, 64-72.
doi:https://doi.org/10.1016/j.rser.2015.04.107
Hussain, M. Z., & Etienne, C. (2012). Lessons from Output-Based Aid for leveraging
finance for clean energy. Retrieved from
https://openknowledge.worldbank.org/handle/10986/26785
Hynes, S. (2005). Analysing Preference Heterogeneith using Random Parameter Logit
and Latent Class Modelling Techniques. In: Department of Economics, National
University of Ireland, Galway.
Infrastructure Development Company Limited. (2018). Projects and Programs
Retrieved from http://idcol.org/home/solar

271
Intergovernmental Panel on Climate Change. (2018). Global Warming of 1.5 °C.
Retrieved from https://www.ipcc.ch/sr15/
International Carbon Action Partnership. (2018). Emissions trading worldwide status
report 2018. Retrieved from https://icapcarbonaction.com/en/icap-status-report-
2018
Iqbal, M. H., & Milon, S. R. H. (2017). Economic benefits of an eco-town for slums in
Dhaka city of Bangladesh: An application of discrete choice model. Australian
Academy of Business and Economics Review, 3(2), 61-75.
Isem, J., & Porteous, D. (2005). Commercial banks and microfinance: Evolving models
of success. In.
Jacobson, M., Shr, Y.-H., Dalemans, F., Magaju, C., & Ciannella, R. (2018). Using a
choice experiment approach to assess production tradeoffs for developing the
croton value chain in Kenya. Forest Policy and Economics, 86, 76-85.
Jacobsson, S., Bergek, A., Finon, D., Lauber, V., Mitchell, C., Toke, D., & Verbruggen,
A. (2009). EU renewable energy support policy: Faith or facts? Energy Policy,
37(6), 2143-2146.
Ji, S., Choi, Y., Lee, C.-K., & Mjelde, J. W. (2018). Comparing willingness-to-pay
between residents and non-residents using a contingent valuation method: case
of the Grand Canal in China. Asia Pacific Journal of Tourism Research, 23(1),
79-91. doi:10.1080/10941665.2017.1399919
Jiang, L., O'Neill, & C., B. (2004). The energy transition in rural China. International
Journal of Global Energy Issues, 21(1/2), 2. doi:10.1504/ijgei.2004.004691
Jiang, Y., Swallow, S. K., & Mcgonagle, M. P. (2005). Context-sensitive benefit
transfer using stated choice models: specification and convergent validity for
policy analysis. Environmental and Resource Economics, 31(4), 477-499.
Jin, J., Wang, Z., & Ran, S. (2006). Comparison of contingent valuation and choice
experiment in solid waste management programs in Macao. Ecological
Economics, 57(3), 430-441.
Jofre-Bonet, M., & Kamara, J. (2018). Willingness to pay for health insurance in the
informal sector of Sierra Leone. PloS one, 13(5), e0189915.
Johansson, T. B., Patwardhan, A., Nakicenovic, N., & Gomez-Echeverri, L. (Eds.).
(2012). Global energy assessment. Cambridge, UK: Cambridge University
Press.
Johnson, F. R., & Desvousges, W. H. (1997). Estimating stated preferences with rated-
pair data: environmental, health, and employment effects of energy programs.
Journal of Environmental Economics and Management, 34(1), 79-99.
Johnston, R. J., & Rosenberger, R. S. (2010). Methods, trends and controversies in
contemporary benefit transfer. Journal of Economic Surveys, 24(3), 479-510.
Jones, M. S., Alexander, C. E., & Smith, B. (2018). Economic consequences of post-
harvest insect damage in Rwandan common bean markets. Crop protection, 104,
92-100.
Kaffashi, S., Shamsudin, M. N., Radam, A., Yacob, M. R., Rahim, K. A., & Yazid, M.
(2012). Economic valuation and conservation: Do people vote for better
preservation of Shadegan International Wetland? Biological Conservation,
150(1), 150-158.
Kahn, J. R., Vásquez, W. F., & de Rezende, C. E. (2017). Choice modeling of system-
wide or large scale environmental change in a developing country context:
Lessons from the Paraíba do Sul River. Science of the Total Environment, 598,
488-496.
Kahneman, D., & Knetsch, J. L. (1992). Valuing public goods: the purchase of moral
satisfaction. Journal of Environmental Economics and Management, 22(1), 57-
70.

272
Kalkuhl, M., Edenhofer, O., & Lessmann, K. (2012). Learning or lock-in: Optimal
technology policies to support mitigation. Resource and Energy Economics,
34(1), 1-23.
Kalkuhl, M., Edenhofer, O., & Lessmann, K. (2013). Renewable energy subsidies:
Second-best policy or fatal aberration for mitigation? Resource and Energy
Economics, 35(3), 217-234.
Kandel, P., Chapagain, P. S., Sharma, L. N., & Vetaas, O. R. (2016). Consumption
patterns of fuelwood in rural households of Dolakha district, Nepal: reflections
from community forest user groups. Small-scale Forestry, 15(4), 481-495.
Kanyoka, P., Farolfi, S., & Morardet, S. (2008). Households' preferences and
willingness to pay for multiple use water services in rural areas of South Africa:
an analysis based on choice modelling. Water Sa, 34(6), 715-723.
Karekezi, S. (2002). Renewables in Africa—meeting the energy needs of the poor.
Energy Policy, 30(11), 1059-1069.
Karki, A. B. (1978). Gobargas Samay ko Mang ra Hank: Sajha Prakashan.
Kaswan, A. (2013). Climate change and environmental justice: lessons from the
California lawsuits. San Diego J. Climate & Energy L., 5, 1.
Keane, M., & Wasi, N. (2013). Comparing alternative models of heterogeneity in
consumer choice behavior. Journal of Applied Econometrics, 28(6), 1018-1045.
Khan, I., & Zhao, M. (2019). Water resource management and public preferences for
water ecosystem services: a choice experiment approach for inland river basin
management. Science of the Total Environment, 646, 821-831.
Khanal, U., Wilson, C., Managi, S., Lee, B., Hoang, V.-N., & Gifford, R. (2018).
Psychological influence on survey incentives: valuing climate change adaptation
benefits in agriculture. Environmental economics and policy studies, 20(2), 305-
324.
Kikulwe, E., Birol, E., Falck-Zepeda, J., & Wesseler, J. (2010). Rural consumers’
preferences for banana attributes in Uganda: Is there a market for GM staples.
Choice experiments in developing countries: Implementation, challenges and
implications. Cheltenham, UK: Edward-Elgar Publishing.
Kim, H.-Y., Park, S.-Y., & Yoo, S.-H. (2016). Public acceptability of introducing a
biogas mandate in Korea: A contingent valuation study. Sustainability, 8(11),
1087.
Kling, C. L., Phaneuf, D. J., & Zhao, J. (2012). From Exxon to BP: Has some number
become better than no number? Journal of Economic Perspectives, 26(4), 3-26.
doi:10.1257/jep.26.4.3
Klinglmair, A., & Gilbert Bliem, M. (2012). Evaluation of households’ preferences for
the planned hydropower station in Graz-Puntigam using a choice experiment.
Paper presented at the Symposium Energieinnovation, Graz, Austria
Knetsch, J. L. (1990). Environmental policy implications of disparities between
willingness to pay and compensation demanded measures of values. Journal of
Environmental Economics and Management, 18(3), 227-237.
doi:https://doi.org/10.1016/0095-0696(90)90003-H
Knetsch, J. L., & Sinden, J. A. (1984). Willingness to pay and compensation demanded:
Experimental evidence of an unexpected disparity in measures of value. The
Quarterly Journal of Economics, 99(3), 507-521.
Kojima, M. (2011). The role of liquefied petroleum gas in reducing energy poverty
Retrieved from https://openknowledge.worldbank.org/handle/10986/18293
Kolstad, J. R. (2011). How to make rural jobs more attractive to health workers.
Findings from a discrete choice experiment in Tanzania. Health Economics,
20(2), 196-211.

273
Komendantova, N., Patt, A., Barras, L., & Battaglini, A. (2012). Perception of risks in
renewable energy projects: The case of concentrated solar power in North
Africa. Energy Policy, 40, 103-109.
Koseoglu, N. M., van den Bergh, J. C., & Lacerda, J. S. (2013). Allocating subsidies to
R&D or to market applications of renewable energy? Balance and geographical
relevance. Energy for Sustainable Development, 17(5), 536-545.
Kosoy, N., & Corbera, E. (2010). Payments for ecosystem services as commodity
fetishism. Ecological Economics, 69(6), 1228-1236.
doi:10.1016/j.ecolecon.2009.11.002
Kossoy, A., Peszko, G., Oppermann, K., Prytz, N., Klein, N., Blok, K., . . . Borkent, B.
(2015). State and trends of carbon pricing 2015. Retrieved from
http://documents.worldbank.org/curated/en/636161467995665933/State-and-
trends-of-carbon-pricing-2015
Kowsari, R., & Zerriffi, H. (2011). Three dimensional energy profile. Energy Policy,
39(12), 7505-7517. doi:10.1016/j.enpol.2011.06.030
Krishna, V. V., Drucker, A. G., Pascual, U., Raghu, P. T., & King, E. D. I. O. (2013).
Estimating compensation payments for on-farm conservation of agricultural
biodiversity in developing countries. Ecological Economics, 87, 110-123.
doi:10.1016/j.ecolecon.2012.12.013
Kruk, M. E., Johnson, J. C., Gyakobo, M., Agyei-Baffour, P., Asabir, K., Kotha, S. R., .
. . Dzodzomenyo, M. (2010). Rural practice preferences among medical students
in Ghana: a discrete choice experiment. Bulletin of the World Health
Organization, 88(5), 333-341.
Kruk, M. E., Paczkowski, M., Mbaruku, G., de Pinho, H., & Galea, S. (2009). Women's
preferences for place of delivery in rural Tanzania: a population-based discrete
choice experiment. American journal of public health, 99(9), 1666-1672.
Kruk, M. E., Paczkowski, M. M., Tegegn, A., Tessema, F., Hadley, C., Asefa, M., &
Galea, S. (2010). Women's preferences for obstetric care in rural Ethiopia: a
population-based discrete choice experiment in a region with low rates of
facility delivery. Journal of Epidemiology & Community Health, 64(11), 984-
988.
Kruk, M. E., Riley, P. L., Palma, A. M., Adhikari, S., Ahoua, L., Arnaldo, C., . . .
Dziuban, E. J. (2016). How can the health system retain women in HIV
treatment for a lifetime? A discrete choice experiment in Ethiopia and
Mozambique. PloS one, 11(8), e0160764.
Krutilla, J. (1967). Conservation reconsidered. The American Economic Review, 57(4),
777-786.
Kumar, A. (2018). Justice and politics in energy access for education, livelihoods and
health: How socio-cultural processes mediate the winners and losers. Energy
Research & Social Science, 40, 3-13.
Kumari, A., Kaushal, P., Sharma, S., & Guleria, A. (2016). Micro financing through
Forest Protection Committees for the empowerment of women Self Help Groups
in Punjab. Indian Forester, 142(3), 289-293.
Lagarde, M., & Blaauw, D. (2009). A review of the application and contribution of
discrete choice experiments to inform human resources policy interventions.
Human resources for health, 7(1), 1-10.
Lahimer, A. A., Alghoul, M. A., Yousif, F., Razykov, T. M., Amin, N., & Sopian, K.
(2013). Research and development aspects on decentralized electrification
options for rural household. Renewable and Sustainable Energy Reviews, 24,
314-324. doi:https://doi.org/10.1016/j.rser.2013.03.057
Lam, N. L., Chen, Y., Weyant, C., Venkataraman, C., Sadavarte, P., Johnson, M. A., . . .
Bond, T. C. (2012). Household Light Makes Global Heat: High Black Carbon
http://documents.worldbank.org/curated/en/636161467995665933/State-and-trends-of-carbon-pricing-2015

274
Emissions From Kerosene Wick Lamps. Environmental science & technology,
46(24), 13531-13538. doi:10.1021/es302697h
Lambe, F., & Senyagwa, J. (2015). Identifying behavioural drivers of cookstove use: a
household study in Kibera, Nairobi. Stockholm Environment Institute, 6.
Lancaster, K. J. (1966). A new approach to consumer theory. The journal of political
economy, 132-157.
Landell-Mills, N. (2002). Developing markets for forest environmental services: an
opportunity for promoting equity while securing efficiency? Philosophical
Transactions of the Royal Society of London A: Mathematical, Physical and
Engineering Sciences, 360(1797), 1817-1825.
Larson, E., Vail, D., Mbaruku, G. M., Kimweri, A., Freedman, L. P., & Kruk, M. E.
(2015). Moving toward patient-centered care in africa: a discrete choice
experiment of preferences for delivery care among 3,003 Tanzanian women.
PloS one, 10(8), e0135621.
Le, T. H. T., Lee, D. K., Kim, Y. S., & Lee, Y. (2016). Public preferences for
biodiversity conservation in Vietnam's Tam Dao National Park. Forest Science
and Technology, 12(3), 144-152.
Lee, C.-Y., & Heo, H. (2016). Estimating willingness to pay for renewable energy in
South Korea using the contingent valuation method. Energy Policy, 94, 150-156.
doi:https://doi.org/10.1016/j.enpol.2016.03.051
Lee, J., Ingalls, M., Erickson, J. D., & Wollenberg, E. (2016). Bridging organizations in
agricultural carbon markets and poverty alleviation: An analysis of pro-Poor
carbon market projects in East Africa. Global Environmental Change, 39, 98-
107. doi:https://doi.org/10.1016/j.gloenvcha.2016.04.015
Lemaire, X. (2009). Fee-for-service companies for rural electrification with
photovoltaic systems: the case of Zambia. Energy for Sustainable Development,
13(1), 18-23.
Lemaire, X. (2011). Off-grid electrification with solar home systems: the experience of
a fee-for-service concession in South Africa. Energy for Sustainable
Development, 15(3), 277-283.
Levine, D. I., Beltramo, T., Blalock, G., Cotterman, C., & Simons, A. M. (2018). What
impedes efficient adoption of products? Evidence from randomized sales offers
for fuel-efficient cookstoves in Uganda. Journal of the European Economic
Association, 16(6), 1850-1880.
Levine, D. I., & Cotterman, C. (2012). What impedes efficient adoption of products?
Evidence from randomized variation in sales offers for improved cookstoves in
Uganda.
Lewis, J. J., & Pattanayak, S. K. (2012). Who adopts improved fuels and cookstoves? A
systematic review. Environ Health Perspect, 120(5), 637-645.
doi:10.1289/ehp.1104194
Li, H., Bennett, M. T., Jiang, X., Zhang, K., & Yang, X. (2017). Rural household
preferences for active participation in “payment for ecosystem service”
programs: A case in the miyun reservoir catchment, China. PloS one, 12(1),
e0169483.
Li, Z., Ci, Y., Chen, C., Zhang, G., Wu, Q., Qian, Z. S., . . . Ma, D. T. (2019).
Investigation of driver injury severities in rural single-vehicle crashes under rain
conditions using mixed logit and latent class models. Accident Analysis &
Prevention, 124, 219-229.
Li, Z., & Hu, B. (2018). Perceived health risk, environmental knowledge, and
contingent valuation for improving air quality: New evidence from the Jinchuan
mining area in China. Economics & Human Biology, 31, 54-68.

275
Lim, S.-Y., Lim, K.-M., & Yoo, S.-H. (2014). External benefits of waste-to-energy in
Korea: A choice experiment study. Renewable and Sustainable Energy Reviews,
34, 588-595. doi:10.1016/j.rser.2014.03.045
Liu, W., Wang, C., & Mol, A. P. J. (2013). Rural public acceptance of renewable
energy deployment: The case of Shandong in China. Applied Energy, 102, 1187-
1196. doi:10.1016/j.apenergy.2012.06.057
Loomis, J., & Santiago, L. (2013). Economic valuation of beach quality improvements:
comparing incremental attribute values estimated from two stated preference
valuation methods. Coastal Management, 41(1), 75-86.
Louviere, J. J., Flynn, T., & Carson, R. T. (2010). Discrete Choice Experiments Are Not
Conjoint Analysis. Journal of Choice Modelling, 3(3), 57-72.
doi:10.1016/s1755-5345(13)70014-9
Louviere, J. J., & Hensher, D. A. (1982). Design and analysis of simulated choice or
allocation experiments in travel choice modeling.
Louviere, J. J., & Hensher, D. A. (1983). Using discrete choice models with
experimental design data to forecast consumer demand for a unique cultural
event. Journal of consumer research, 10(3), 348-361.
Louviere, J. J., & Lancsar, E. (2009). Choice experiments in health: the good, the bad,
the ugly and toward a brighter future. Health Economics, Policy and Law, 4(04),
527-546.
Luce, R. D., & Tukey, J. W. (1964). Simultaneous conjoint measurement: A new type
of fundamental measurement. Journal of mathematical psychology, 1(1), 1-27.
Luintel, H., Bluffstone, R. A., Scheller, R. M., & Adhikari, B. (2017). The Effect of the
Nepal Community Forestry Program on Equity in Benefit Sharing. The Journal
of Environment & Development, 26(3), 297-321.
doi:10.1177/1070496517707305
Lurmann, F., Avol, E., & Gilliland, F. (2015). Emissions reduction policies and recent
trends in Southern California’s ambient air quality. Journal of the Air & Waste
Management Association, 65(3), 324-335.
Macea, L. F., Amaya, J., Cantillo, V., & Holguín-Veras, J. (2018). Evaluating economic
impacts of water deprivation in humanitarian relief distribution using stated
choice experiments. International Journal of Disaster Risk Reduction, 28, 427-
438.
Magidson, J., & Vermunt, J. K. (2007). Removing the scale factor confound in
multinomial logit choice models to obtain better estimates of preference. Paper
presented at the Sawtooth software conference.
Mahieu, P., Andersson, H., Beaumais, O., Crastes, R., & Wolff, F. C. (2014). Is choice
experiment becoming more popular than contingent valuation. FAERE Working
Papers, 12.
Mainali, B., & Silveira, S. (2011). Financing off-grid rural electrification: country case
Nepal. Energy, 36(4), 2194-2201.
Mainali, B., & Silveira, S. (2013). Alternative pathways for providing access to
electricity in developing countries. Renewable Energy, 57, 299-310.
Malla, M. B., Bruce, N., Bates, E., & Rehfuess, E. (2011). Applying global cost-benefit
analysis methods to indoor air pollution mitigation interventions in Nepal,
Kenya and Sudan: Insights and challenges. Energy Policy, 39(12), 7518-7529.
doi:10.1016/j.enpol.2011.06.031
Mangham, L. J., & Hanson, K. (2008). Employment preferences of public sector nurses
in Malawi: results from a discrete choice experiment. Tropical Medicine &
International Health, 13(12), 1433-1441.

276
Manning, D., & Loomis, J. (2016). Consumer preferences for fixed versus variable
quantities of electricity: joint estimation of contingent quantity and valuation
methods. Environment and Development Economics, 21(6), 789-811.
Manning, D., Means, P., Zimmerle, D., Galvin, K., Loomis, J., & Paustian, K. (2015).
Using contingent behavior analysis to measure benefits from rural electrification
in developing countries: an example from Rwanda. Energy Policy, 86, 393-401.
doi:https://doi.org/10.1016/j.enpol.2015.06.032
Mannucci, P. M., & Franchini, M. (2017). Health effects of ambient air pollution in
developing countries. International journal of environmental research and
public health, 14(9), 1048.
Marschak, J. (1974). Binary-choice constraints and random utility indicators (1960). In
Economic Information, Decision, and Prediction (pp. 218-239): Springer.
Masera, O. R., Saatkamp, B. D., & Kammen, D. M. (2000). From linear fuel switching
to multiple cooking strategies: a critique and alternative to the energy ladder
model. World Development, 28(12), 2083-2103.
Masini, A., & Menichetti, E. (2012). The impact of behavioural factors in the renewable
energy investment decision making process: Conceptual framework and
empirical findings. Energy Policy, 40, 28-38.
Mauzerall, D. L., Sultan, B., Kim, N., & Bradford, D. F. (2005). NOx emissions from
large point sources: variability in ozone production, resulting health damages
and economic costs. Atmospheric Environment, 39(16), 2851-2866.
Mayer, B. (2018). The International Law on Climate Change: Cambridge University
Press.
Mbachu, C., Okoli, C., Onwujekwe, O., & Enabulele, F. (2018). Willingness to pay for
antiretroviral drugs among HIV and AIDS clients in south‐east Nigeria. Health
Expectations, 21(1), 270-278.
McDermott, M. H., & Schreckenberg, K. (2009). Equity in community forestry: insights
from North and South. International Forestry Review, 11(2), 157-170.
doi:10.1505/ifor.11.2.157
McFadden, D. (1973). Conditional logit analysis of qualitative choice behavior.
Frontiers in Econometrics, 105-142.
McFadden, D. (1986). The choice theory approach to market research. Marketing
science, 5(4), 275-297.
McFadden, D. (1994). Contingent valuation and social choice. American journal of
agricultural economics, 76(4), 689-708.
McFadden, D. (2001). Economic choices. The American Economic Review, 91(3), 351-
378.
McFadden, D. (2014). The new science of pleasure: consumer choice behavior and the
measurement of well-being. In S. Hess & A. Daly (Eds.), Handbook of Choice
Modeling (pp. 7-48).
McFadden, D., & Train, K. (2017). Contingent Valuation of Environmental Goods: A
Comprehensive Critique: Edward Elgar Publishing.
McIntosh, C., Sarris, A., & Papadopoulos, F. (2013). Productivity, credit, risk, and the
demand for weather index insurance in smallholder agriculture in Ethiopia.
Agricultural Economics, 44(4-5), 399-417.
Memon, M. A., & Matsuoka, S. (2002). Validity of contingent valuation estimates from
developing countries: scope sensitivity analysis. Environmental economics and
policy studies, 5(1), 39-61.
Menanteau, P., Finon, D., & Lamy, M.-L. (2003). Prices versus quantities: choosing
policies for promoting the development of renewable energy. Energy Policy,
31(8), 799-812.

277
Ministry of Finance. (2018). Economic Survey of Nepal 2017/18. Retrieved from
https://mof.gov.np/uploads/document/file/for%20web_Economic%20Survey%2
02075%20Full%20Final%20for%20WEB%20_20180914091500.pdf
Ministry of Health, New Era, & United States Agency for International Development.
(2016). Nepal Demographic and Health Survey Retrieved from
https://www.dhsprogram.com/pubs/pdf/fr336/fr336.pdf
Mirelman, A., Mentzakis, E., Kinter, E., Paolucci, F., Fordham, R., Ozawa, S., . . .
Niessen, L. W. (2012). Decision-making criteria among national policymakers
in five countries: a discrete choice experiment eliciting relative preferences for
equity and efficiency. Value Health, 15(3), 534-539.
doi:10.1016/j.jval.2012.04.001
Mitchell, R. C., & Carson, R. T. (1989). Using surveys to value public goods: The
contingent valuation method: Resources for the Future.
Mittal, S., Ahlgren, E. O., & Shukla, P. R. (2018). Barriers to biogas dissemination in
India: A review. Energy Policy, 112, 361-370.
doi:https://doi.org/10.1016/j.enpol.2017.10.027
Mobarak, A. M., Dwivedi, P., Bailis, R., Hildemann, L., & Miller, G. (2012). Low
demand for nontraditional cookstove technologies. Proceedings of the National
Academy of Sciences, 109(27), 10815-10820.
Mohideen, R. (2018). Energy technology innovation in South Asia: Implications for
gender equality and social inclusion (2071-7202). Retrieved from
http://dx.doi.org/10.22617/WPS179175-2
Moren, H. (2009). The difficulty of fencing in interstate emissions: EPA's clean air
interstate rule fails to make good neighbors. Ecology LQ, 36, 525.
Moreno, A., & Bareisaite, A. (2015). Scaling up access to electricity: pay-as-you-go
plans in off-grid energy services.
Morris, E., Winiecki, J., Chowdhary, S., & Cortiglia, K. (2007). Using microfinance to
expand access to energy services: Summary of findings. SEEP Network.
Morrison, M. (1998). Choice modelling, non-use values and benefit transfer. (PhD ),
University of New South Wales
Morrison, M. (2009). A guide for estimating the nonmarket values associated with
improved fire management. Retrieved from Melbourne:
http://www.bushfirecrc.com/sites/default/files/managed/resource/a_guide_for_es
timating_the_non-
market_values_associated_with_improved_fire_management.pdf
Morrison, M., & Bennett, J. (2000). Choice modelling, Non-use values and benefit
transfer. Economic Analysis and Policy, 30(1), 13-32. doi:10.1016/s0313-
5926(00)50002-2
Morrison, M., & Bennett, J. (2004). Valuing New South Wales rivers for use in benefit
transfer. Australian Journal of Agricultural and Resource Economics, 48(4),
591-611. doi:DOI 10.1111/j.1467-8489.2004.00263.x
Morrison, M., Bennett, J., Blamey, R., & Louviere, J. J. (2002). Choice modeling and
tests of benefit transfer. American journal of agricultural economics, 84(1), 161-
170.
Morrison, M., & Bergland, O. (2006). Prospects for the use of choice modelling for
benefit transfer. Ecological Economics, 60(2), 420-428.
Morrison, M., & Brown, T. C. (2009). Testing the effectiveness of certainty scales,
cheap talk, and dissonance-minimization in reducing hypothetical bias in
contingent valuation studies. Environmental and Resource Economics, 44(3),
307-326.
Morwitz, V. G., Steckel, J. H., & Gupta, A. (2007). When do purchase intentions
predict sales? International Journal of Forecasting, 23(3), 347-364.

278
Motsinger, J., Moss, S., & Fine, J. (2010). A Gold Standard for equity in climate cap-
and-trade programs. Environment, 52(4), 34-43.
Mu, X., Whittington, D., & Briscoe, J. (1990). Modeling village water demand
behavior: a discrete choice approach. Water Resources Research, 26(4), 521-
529.
Muradian, R., Arsel, M., Pellegrini, L., Adaman, F., Aguilar, B., Agarwal, B., . . .
Norgaard, R. (2013). Payments for ecosystem services and the fatal attraction of
win-win solutions. Conservation Letters, 6(4), 274-279. doi:10.1111/j.1755-
263X.2012.00309.x
Murakami, K., Ida, T., Tanaka, M., & Friedman, L. (2015). Consumers' willingness to
pay for renewable and nuclear energy: A comparative analysis between the US
and Japan. Energy Economics, 50, 178-189.
doi:https://doi.org/10.1016/j.eneco.2015.05.002
Nam, P., & Son, T. (2005). Households demand for improved water services in Ho Chi
Minh City: A comparison of contingent valuation and choice modelling
estimates. Retrieved from https://ideas.repec.org/p/eep/report/rr2005063.html
Nandagiri, L. (2015). Evaluation of economic value of pilikula lake using travel cost
and contingent valuation methods. Aquatic Procedia, 4, 1315-1321.
Napolitano, S., Stevens, G., Schreifels, J., & Culligan, K. (2007). The NOx budget
trading program: a collaborative, innovative approach to solving a regional air
pollution problem. The Electricity Journal, 20(9), 65-76.
National Planning Commission. (2014). Nepal human development report 2014:
Beyond geography, unlocking human potential. Retrieved from
http://www.hdr.undp.org/sites/default/files/nepal_nhdr_2014-final.pdf
National Rural and Renewable Energy Program. (2017). National rural and renewable
energy program - Program completion report (Draft). In. Kathmandu, Nepal:
Alternative Energy Promotion Centre, Ministry of Energy, Water Resources and
Irrigation.
Navrud, S., & Mungatana, E. (1994). Environmental valuation in developing countries:
the recreational value of wildlife viewing. Ecological Economics, 11(2), 135-
151.
Ndambiri, H., Mungatana, E., & Brouwer, R. (2017). Scope effects of respondent
uncertainty in contingent valuation: evidence from motorized emission
reductions in the city of Nairobi, Kenya. Journal of environmental planning and
management, 60(1), 22-46.
Negassa, A., Shapiro, B., Kidane, T., Abdena, A., & Hanson, J. (2015). Ex-ante
assessment of demand for improved forage seed and planting materials among
Ethiopian smallholder farmers: A contingent valuation analysis: ILRI (aka
ILCA and ILRAD).
Nepal, N., Steltzer, E., Bohara, A. K., & Cullen, K. (2018). Public values on offshore
wind farm. Environmental economics and policy studies, 20(1), 225-240.
doi:10.1007/s10018-017-0191-8
Nepal Rastra Bank. (2018a). List of Banks and Financial Institutions. Retrieved
25/12/2018
https://www.nrb.org.np/bfr/pdffiles/List_of_BFIs_Jan_2017_English.pdf
Nepal Rastra Bank. (2018b). Monetary Policy for 2018/19, Unofficial Translation
Retrieved from
https://www.nrb.org.np/ofg/monetary_policy/Monetary_Policy_(in_English)--
2018-19_(Full_Text).pdf
Nesta, L., Vona, F., & Nicolli, F. (2014). Environmental policies, competition and
innovation in renewable energy. Journal of Environmental Economics and
Management, 67(3), 396-411.

279
Newcombe, A., & Ackom, E. K. (2017). Sustainable solar home systems model:
Applying lessons from Bangladesh to Myanmar's rural poor. Energy for
Sustainable Development, 38, 21-33.
Newell, R. G., Pizer, W. A., & Raimi, D. (2013). Carbon markets 15 years after Kyoto:
Lessons learned, new challenges. The Journal of economic perspectives, 27(1),
123-146.
Nguyen, Q. L. T., Nguyen, L. H., Tran, B. X., Phan, H. T. T., Le, H. T., Nguyen, H. D.,
. . . Thuc, V. T. M. (2017). Co-financing for viral load monitoring during the
course of antiretroviral therapy among patients with HIV/AIDS in Vietnam: A
contingent valuation survey. PloS one, 12(2), e0172050.
Nyamuryekung'e, K. K., Lahti, S. M., & Tuominen, R. J. (2018). Patients' willingness to
pay for dental services in a population with limited restorative services.
Community dental health, 35(3), 167-172.
Oleson, K. L., Barnes, M., Brander, L. M., Oliver, T. A., van Beek, I.,
Zafindrasilivonona, B., & van Beukering, P. (2015). Cultural bequest values for
ecosystem service flows among indigenous fishers: A discrete choice
experiment validated with mixed methods. Ecological Economics, 114, 104-116.
Orgill-Meyer, J., Jeuland, M., Albert, J., & Cutler, N. (2018). Comparing Contingent
Valuation and Averting Expenditure Estimates of the Costs of Irregular Water
Supply. Ecological Economics, 146, 250-264.
Orme, B. K. (2010). Getting started with conjoint analysis: strategies for product
design and pricing research: Research Publishers.
Ortega, D. L., Wang, H. H., Wu, L., & Hong, S. J. (2015). Retail channel and consumer
demand for food quality in China. China Economic Review, 36, 359-366.
Osiolo, H. H. (2017). Willingness to pay for improved energy: Evidence from Kenya.
Renewable Energy, 112, 104-112.
Ouma, E. A., Obare, G. A., & Staal, S. J. (2003). Cattle as assets: assessment of non-
market benefits from cattle in smallholder Kenyan crop-livestock systems. Paper
presented at the proceedings of the 25th International Conference of Agricultural
Economists (IAAE).
Owens, K. (2018). Global climate finance and the Green Climate Fund: Can innovation
and democracy coexist? . In C. J. N. Craik, S. Seck and T. Stephens (Ed.),
Global Environmental Change and Innovation in International Law, (pp. 59-
77): Cambridge: Cambridge University Press.
Ozawa, S., Grewal, S., & Bridges, J. F. (2016). Household size and the decision to
purchase health insurance in cambodia: results of a discrete-choice experiment
with scale adjustment. Applied health economics and health policy, 14(2), 195-
204.
Palinkas, L. A., Horwitz, S. M., Green, C. A., Wisdom, J. P., Duan, N., & Hoagwood,
K. (2015). Purposeful sampling for qualitative data collection and analysis in
mixed method implementation research. Administration and Policy in Mental
Health and Mental Health Services Research, 42(5), 533-544.
Palit, D. (2013). Solar energy programs for rural electrification: Experiences and lessons
from South Asia. Energy for Sustainable Development, 17(3), 270-279.
Palit, D., & Chaurey, A. (2011). Off-grid rural electrification experiences from South
Asia: Status and best practices. Energy for Sustainable Development, 15(3), 266-
276.
Pant, B. (2016). Financial inclusion in Nepal: Policy review and prescriptions.
Retrieved from https://www.nrb.org.np/ecorev/articles/2.pdf
Pant, H. D. (2009). Micro finance business in Nepal In T. Pangeni, R. Pant, S. D. Kafle,
R. K. Pokharel, & N. M. Maskay (Eds.), Nepalese Financial System: Growth
and Challenges Nepal.

280
Park, S.-H., Jung, W.-J., Kim, T.-H., & Lee, S.-Y. T. (2016). Can Renewable Energy
Replace Nuclear Power in Korea? An Economic Valuation Analysis. Nuclear
Engineering and Technology, 48(2), 559-571.
doi:https://doi.org/10.1016/j.net.2015.12.012
Parry, I. W. (2004). Are emissions permits regressive? Journal of Environmental
Economics and Management, 47(2), 364-387.
Parshuram and Associates. (2016). Commercial financing instruments for scaling up
energy services through micro/mini hydro and large scale solar applications. In.
Kathmandu, Nepal: Alternative Energy Promotion Centre, Ministry of Energy,
Water Resources and Irrigation.
Pascual, U., Muradian, R., Rodríguez, L. C., & Duraiappah, A. (2010). Exploring the
links between equity and efficiency in payments for environmental services: A
conceptual approach. Ecological Economics, 69(6), 1237-1244.
doi:10.1016/j.ecolecon.2009.11.004
Pattanayak, S. K., Jeuland, M., Lewis, J., Usmani, F., Brooks, N., Bhojvaid, V., . . .
Patange, O. (2019). Experimental evidence on promotion of electric and
improved biomass cookstoves. Proceedings of the National Academy of
Sciences, 201808827.
Pattanayak, S. K., Wunder, S., & Ferraro, P. J. (2010). Show me the money: Do
payments supply environmental services in developing countries? Review of
Environmental Economics and Policy, 4(2), 254-274. doi:10.1093/reep/req006
Paudel, B., Zhang, Y.-l., Li, S.-c., Liu, L.-s., Wu, X., & Khanal, N. R. (2016). Review
of studies on land use and land cover change in Nepal. Journal of Mountain
Science, 13(4), 643-660.
Permadi, D. B., Burton, M., Pandit, R., Race, D., & Walker, I. (2018). Local
community's preferences for accepting a forestry partnership contract to grow
pulpwood in Indonesia: A choice experiment study. Forest Policy and
Economics, 91, 73-83.
Persson, M., & Svensson, M. (2013). The willingness to pay to reduce school bullying.
Economics of Education Review, 35, 1-11.
Peter, R., Ramaseshan, B., & Nayar, C. V. (2002). Conceptual model for marketing
solar based technology to developing countries. Renewable Energy, 511-524.
Phadke, A. A., Jacobson, A., Park, W. Y., Lee, G. R., Alstone, P., & Khare, A. (2017).
Powering a home with just 25 Watts of solar PV: Super-efficient appliances can
enable expanded off-grid energy service using small solar power systems.
Pigou, A. C. (1932). The economics of welfare (4th ed.). London: McMillan & Co.
Pirard, R. (2012). Market-based instruments for biodiversity and ecosystem services: A
lexicon. Environmental Science & Policy, 19, 59-68.
Pode, R. (2013). Financing LED solar home systems in developing countries.
Renewable and Sustainable Energy Reviews, 25, 596-629.
Pohekara, S. D., Kumar, D., & Ramachandrana, M. (2004). Dissemniation of cooking
energy alternatives in India- A review. Renewable and Sustainable Energy
Reviews. doi:10.1016/j.rser.2004.05.001
Point Carbon. (2008). EU ETS Phase II–The potential and scale of windfall profits in
the power sector. A report for WWF By Point Carbon Advisory Services.
Pokharel, S. (2007). Kyoto protocol and Nepal's energy sector. Energy Policy, 35(4),
2514-2525.
Portney, P. R. (1994). The contingent valuation debate: why economists should care.
The Journal of economic perspectives, 8(4), 3-17.
Poudel, D., & Johnsen, F. H. (2016). Analysis of farmers’ willingness to pay for
agrobiodiversity conservation in Nepal. In J. Gibson (Ed.), Patenting Lives: Life
Patents, Culture and Development (pp. 161-178): Routledge.

281
Pun, B. (2018). Energy sector - White paper Retrieved from
http://www.moewri.gov.np/images/category/White-Paper-2075-with-
Annex02.pdf.
Radmehr, M., Willis, K., & Kenechi, U. E. (2014). A framework for evaluating WTP
for BIPV in residential housing design in developing countries: A case study of
North Cyprus. Energy Policy, 70, 207-216.
doi:https://doi.org/10.1016/j.enpol.2014.03.041
Raes, L., Speelman, S., & Aguirre, N. (2017). Farmers’ preferences for PES contracts to
adopt silvopastoral systems in Southern Ecuador, Revealed through a choice
experiment. Environmental management, 60(2), 200-215.
Rai, N., Best, S., & Soanes, M. (2016). Unlocking climate finance for decentralised
energy access. IIED, London, 10.
Rai, R. K., & Scarborough, H. (2015). Nonmarket valuation in developing countries:
incorporating labour contributions in environmental benefits estimates.
Australian Journal of Agricultural and Resource Economics, 59(4), 479-498.
doi:10.1111/1467-8489.12071
Ramchandran, N., Pai, R., & Parihar, A. K. S. (2016). Feasibility assessment of Anchor-
Business-Community model for off-grid rural electrification in India. Renewable
Energy, 97, 197-209. doi:https://doi.org/10.1016/j.renene.2016.05.036
Ramli, F., Samdin, Z., & Ghani, A. (2017). Willingness to pay for conservation fee
using contingent valuation method: The case of Matang Mangrove Forest
Reserve, Perak, Malaysia. Malaysian Forester, 80(1), 99-110.
Randall, A., Ives, B., & Eastman, C. (1974). Bidding games for valuation of aesthetic
environmental improvements. Journal of Environmental Economics and
Management, 1(2), 132-149.
Ranson, M., & Stavins, R. N. (2016). Linkage of greenhouse gas emissions trading
systems: Learning from experience. Climate Policy, 16(3), 284-300.
Rao, E. J., Mtimet, N., Twine, E., Baltenweck, I., & Omore, A. (2016). Farmers’
preference for bundled input–output markets and implications for adapted dairy
hubs in Tanzania—A choice experiment. Agribusiness.
Rao, P. S. C., Miller, J. B., Wang, Y. D., & Byrne, J. B. (2009). Energy-microfinance
intervention for below poverty line households in India. Energy Policy, 37(5),
1694-1712.
Ratanak, O., & Yabe, M. (2010). Valuing preferences for ecotourism in the Phnom
Prich Wildlife Sanctuary, Cambodia. In J. Bennett & E. Birol (Eds.), Choice
Experiments in Developing Countries: Implementation, Challenges and Policy
Implications: Edward Elgar Publishing
Rehman, I., Kar, A., Banerjee, M., Kumar, P., Shardul, M., Mohanty, J., & Hossain, I.
(2012). Understanding the political economy and key drivers of energy access in
addressing national energy access priorities and policies. Energy Policy, 47, 27-
37.
REN21 Renewable Energy Policy Network. (2010). Renewables 2010: Global status
report. Retrieved from
http://www.ren21.net/Portals/0/documents/activities/gsr/REN21_GSR_2010_ful
l_revised%20Sept2010.pdf
Ren, X., Che, Y., Yang, K., & Tao, Y. (2016). Risk perception and public acceptance
toward a highly protested Waste-to-Energy facility. Waste Management, 48,
528-539. doi:https://doi.org/10.1016/j.wasman.2015.10.036
Revelt, D., & Train, K. (2000). Customer-specific taste parameters and mixed logit:
Households' choice of electricity supplier. In: Department of Economics,
Univeristy of California, Berkley.

282
Riva, F., Ahlborg, H., Hartvigsson, E., Pachauri, S., & Colombo, E. (2018). Electricity
access and rural development: Review of complex socio-economic dynamics
and causal diagrams for more appropriate energy modelling. Energy for
Sustainable Development, 43, 203-223.
doi:https://doi.org/10.1016/j.esd.2018.02.003
Roberts, T. M. (2010). Mitigating the distributional impacts of climate chance policy.
Wash. & Lee L. Rev., 67, 209.
Robinson, B. E., & Baumgartner, J. (2011). Cultivating a demand for clean cookstoves.
science, 334(6063), 1636-1637.
Rockers, P. C., Jaskiewicz, W., Wurts, L., Kruk, M. E., Mgomella, G. S., Ntalazi, F., &
Tulenko, K. (2012). Preferences for working in rural clinics among trainee
health professionals in Uganda: a discrete choice experiment. BMC Health Serv
Res, 12(1), 1.
Rogelj, J., McCollum, D. L., & Riahi, K. (2013). The UN's 'Sustainable Energy for All'
initiative is compatible with a warming limit of 2 °C. Nature Climate Change.
doi:10.1038/nclimate1806
Rolffs, P., Byrne, R., & Ockwell, D. (2014). Financing Sustainable Energy for All:
Pay-as-you-go vs. traditional solar finance approaches in Kenya. Retrieved
from http://sro.sussex.ac.uk/id/eprint/52474
Rolffs, P., Ockwell, D., & Byrne, R. (2015). Beyond technology and finance: pay-as-
you-go sustainable energy access and theories of social change. Environment
and Planning A, 47(12), 2609-2627.
Rose, A., Wei, D., Miller, N., Vandyck, T., & Flachsland, C. (2018). Policy brief—
Achieving Paris climate agreement pledges: Alternative designs for linking
emissions trading systems. Review of Environmental Economics and Policy,
12(1), 170-182. doi:10.1093/reep/rex029
Rosenbaum, J., Derby, E., & Dutta, K. (2015). Understanding consumer preference and
willingness to pay for improved cookstoves in Bangladesh. Journal of Health
Communication, 20, 20-27.
Roy, M., & Chakraborty, S. (2014). Developing a sustainable water resource
management strategy for a fluoride-affected area: a contingent valuation
approach. Clean Technologies and Environmental Policy, 16(2), 341-349.
Ruokamo, E. (2016). Household preferences of hybrid home heating systems – A
choice experiment application. Energy Policy, 95, 224-237.
doi:https://doi.org/10.1016/j.enpol.2016.04.017
Saengow, U., Birch, S., Geater, A., & Chongsuwiwatvong, V. (2018). Willingness to
pay for colorectal cancer screening and effect of copayment in Southern
Thailand. Asian Pacific journal of cancer prevention, 19(6), 1727.
Sagebiel, J. (2017). Preference heterogeneity in energy discrete choice experiments: A
review on methods for model selection. Renewable and Sustainable Energy
Reviews, 69, 804-811.
Salihu, H. M., Ghaji, N., Mbah, A. K., Alio, A. P., August, E. M., & Boubakari, I.
(2012). Particulate pollutants and racial/ethnic disparity in feto-infant morbidity
outcomes. Maternal and child health journal, 16(8), 1679-1687.
Salm, S., Hille, S. L., & Wüstenhagen, R. (2016). What are retail investors' risk-return
preferences towards renewable energy projects? A choice experiment in
Germany. Energy Policy, 97, 310-320.
doi:https://doi.org/10.1016/j.enpol.2016.07.042
Samdeliri, A., & Shahbaz, H. (2017). Valuing recreational benefits in an aquatic
ecosystem area with contingent valuation method: Case of ShirinSou Wetland,
Iran. International Journal of Agricultural Management and Development
(IJAMAD), 7(1047-2017-1723), 133-140.

283
Sangkapitux, C., Suebpongsang, P., Punyawadee, V., Pimpaoud, N., Konsurin, J., &
Neef, A. (2017). Eliciting citizen preferences for multifunctional agriculture in
the watershed areas of northern Thailand through choice experiment and latent
class models. Land Use Policy, 67, 38-47.
Sarkar, A., & Singh, J. (2010). Financing energy efficiency in developing countries—
lessons learned and remaining challenges. Energy Policy, 38(10), 5560-5571.
Savolainen, P. T. (2016). Examining driver behavior at the onset of yellow in a traffic
simulator environment: comparisons between random parameters and latent
class logit models. Accident Analysis & Prevention, 96, 300-307.
Sawin, J., & Flavin, C. (2006). National policy instruments: Policy lessons for the
advancement & diffusion of renewable energy technologies around the world.
Renewable Energy. A Global Review of Technologies, Policies and Markets.
Scarpa, R., Ruto, E. S., Kristjanson, P., Radeny, M., Drucker, A. G., & Rege, J. E.
(2003). Valuing indigenous cattle breeds in Kenya: an empirical comparison of
stated and revealed preference value estimates. Ecological Economics, 45(3),
409-426.
Scherr, S. J., Bennett, M. T., Loughney, M., & Canby, K. (2006, p.5). Developing future
ecosystem service payments in China: Lessons learned from international
experience. Retrieved from
http://citeseerx.ist.psu.edu/viewdoc/download?doi=10.1.1.463.9413&rep=rep1&
type=pdf
Scheufele, G., Bennett, J., & Kyophilavong, P. (2018). Pricing biodiversity protection:
Payments for environmental services schemes in Lao PDR. Land Use Policy, 75,
284-291.
Schmalensee, R., & Stavins, R. (2013). The SO2 allowance trading system: The ironic
history of a grand policy experiment. The Journal of economic perspectives,
27(1), 103-121.
Schmalensee, R., & Stavins, R. (2015). Lessons learned from three decades of
experience with cap-and-trade. Retrieved from
https://www.nber.org/papers/w21742.pdf
Schmalensee, R., & Stavins, R. N. (2017). The design of environmental markets: What
have we learned from experience with cap and trade? Oxford Review of
Economic Policy, 33(4), 572-588. doi:10.1093/oxrep/grx040
Schomers, S., & Matzdorf, B. (2013). Payments for ecosystem services: A review and
comparison of developing and industrialized countries. Ecosystem Services, 6,
16-30.
Seenprachawong, U. (2016). An economic analysis of coral reefs in the Andaman Sea
of Thailand. In Marine and Coastal Ecosystem Valuation, Institutions, and
Policy in Southeast Asia (pp. 31-45): Springer.
Selassie, G. G., & Kountouris, Y. (2010). Fishing permit price and wetland
conservation: A choice experiment on the value of improved environmental
quality of lake Awassa, Ethiopia. In J. Bennett & E. Birol (Eds.), Choice
Experiments in Developing Countries: Implementation, Challenges and Policy
Implications: Edward Elgar Publishing
Shakya, S., Bhaju, S., Shrestha, S., Tuladhar, R., & Tuladhar, S. (2014). Financial
inclusion country report Retrieved from https://uncdf-
cdn.azureedge.net/mediamanager/82456?sv=2016-
0531&sr=b&sig=rB9HhUzf0f%2BTlyb6s5%2F4XLizsnQAVMKIgLMsbLvK%
2 Fv4%3D&se=2019-02-26T07%3A34%3A04Z&sp=r
Sharma, P. (no date). Financing electrification projects- an experience of MHDF. from
Energising Development

284
http://winrock.org.np/ckfinder/userfiles/files/4_%20presentation%20outline_M
HDF%20-%20email.pdf
Shen, J. (2009). Latent class model or mixed logit model? A comparison by transport
mode choice data. Applied Economics, 41(22), 2915-2924.
Shittu, A., & Kehinde, M. (2018, July 28-August 2, 2018). Willingness to accept
incentives for a shift to climate–smart agriculture among smallholder farmers in
southwest and Northcentral Nigeria. Paper presented at the International
Association of Agricultural Economists 2018 Conference, Vancouver, British
Columbia.
Shono, A., Kondo, M., Ohmae, H., & Okubo, I. (2014). Willingness to pay for public
health services in rural Central Java, Indonesia: Methodological considerations
when using the contingent valuation method. Social science & medicine, 110,
31-40.
Shrestha, R. K., & Loomis, J. B. (2001). Testing a meta-analysis model for benefit
transfer in international outdoor recreation. Ecological Economics, 39(1), 67-83.
Simiyu, S., Swilling, M., Rheingans, R., & Cairncross, S. (2017). Estimating the cost
and payment for sanitation in the informal settlements of Kisumu, Kenya: a
cross sectional study. International journal of environmental research and
public health, 14(1), 49.
Singh, P., & Shakya, S. (2016). Policy intervention to reduce energy consumption and
mitigate environmental emission in cement industries of Nepal. International
Journal of Environmental Protection and Policy, 4, 34-43.
doi:10.11648/j.ijepp.20160402.12
Snowball, J., Willis, K., & Jeurissen, C. (2008). Willingness to pay for water service
improvements in middle-income urban households in Africa: A state choice
analysis South African Journal of Economics, 76(4), 705-720.
Song, Z., Zhang, C., Yang, G., Feng, Y., Ren, G., & Han, X. (2014). Comparison of
biogas development from households and medium and large-scale biogas plants
in rural China. Renewable and Sustainable Energy Reviews, 33, 204-213.
doi:https://doi.org/10.1016/j.rser.2014.01.084
Soon, J.-J., & Ahmad, S.-A. (2015). Willingly or grudgingly? A meta-analysis on the
willingness-to-pay for renewable energy use. Renewable and Sustainable
Energy Reviews, 44, 877-887. doi:https://doi.org/10.1016/j.rser.2015.01.041
South Coast Air Quality Management District. (2018). Annual RECLAIM audit report
for 2016 compliance year. Retrieved from http://www.aqmd.gov/docs/default-
source/reclaim/reclaim-annual-report/2016-reclaim-report.pdf?sfvrsn=8
Sovacool, B. K. (2013a). Expanding renewable energy access with pro-poor public
private partnerships in the developing world. Energy Strategy Reviews, 1(3),
181-192.
Sovacool, B. K. (2013b). A qualitative factor analysis of renewable energy and
Sustainable Energy for All (SE4ALL) in the Asia-Pacific. Energy Policy, 59,
393-403.
Sovacool, B. K. (2017). Reviewing, reforming, and rethinking global energy subsidies:
towards a political economy research agenda. Ecological Economics, 135, 150-
163.
Sovacool, B. K., & Dworkin, M. H. (2015). Energy justice: Conceptual insights and
practical applications. Applied Energy, 142, 435-444.
Stavins, R. (2007). Market-based environmental policies: what can we learn from US
experience (and related research)? In J. Freeman & C. D. Kolstad (Eds.), In
Moving to Markets in Environmental Regulation: Lessons from Twenty Years of
Experience: Oxford University Press.

285
Subramanian, S., Kaganova, Y., Zhang, Y., Hoover, S., Nyambe, N., Pinder, L., . . .
Parham, G. (2018). Patient preferences and willingness to pay for cervical
cancer prevention in Zambia: Protocol for a multi-cohort discrete choice
experiment. JMIR research protocols, 7(7).
Survey Department. (2018). Maps of Nepal. Retrieved from
http://dos.gov.np/?albums=maps-of-nepal
Sustainable Energy for All. (2017a). Going Further, Faster -Together Annual Report
2017. Retrieved from
https://www.seforall.org/sites/default/files/2016_EUSEW.pdf
Sustainable Energy for All. (2017b). Scaling and Refining Finance in Countries with
Large Energy Access Gaps Retrieved from
https://www.seforall.org/sites/default/files/gather-
content/2017_SEforALL_FR4P.pdf
Taale, F., & Kyeremeh, C. (2016). Households׳ willingness to pay for reliable electricity
services in Ghana. Renewable and Sustainable Energy Reviews, 62, 280-288.
doi:https://doi.org/10.1016/j.rser.2016.04.046
Tabi, A., & Wüstenhagen, R. (2017). Keep it local and fish-friendly: Social acceptance
of hydropower projects in Switzerland. Renewable and Sustainable Energy
Reviews, 68, 763-773. doi:https://doi.org/10.1016/j.rser.2016.10.006
Tacconi, L., Mahanty, S., & Suich, H. (2013). The livelihood impacts of payments for
environmental services and implications for REDD+. Society & Natural
Resources, 26(6), 733-744. doi:10.1080/08941920.2012.724151
Takama, T., Tsephel, S., & Johnson, F. X. (2012). Evaluating the relative strength of
product-specific factors in fuel switching and stove choice decisions in Ethiopia.
A discrete choice model of household preferences for clean cooking alternatives.
Energy Economics, 34(6), 1763-1773.
doi:https://doi.org/10.1016/j.eneco.2012.07.001
Tarfasa, S., & Brouwer, R. (2013). Estimation of the public benefits of urban water
supply improvements in Ethiopia: a choice experiment. Applied Economics,
45(9), 1099-1108.
Tarfasa, S., & Brouwer, R. (2018). Public preferences for improved urban waste
management: a choice experiment. Environment and Development Economics,
23(2), 184-197.
Thanh, N. H., Van Minh, H., Huyen, D. T. T., Chung, L. H., & Hung, N. V. (2014). Use
of contingent valuation methods for eliciting the willingness to pay for sanitation
in developing countries. Vietnam Journal of Public Health, 2(2).
Thapa, S. (2003). Sustainable promotion of enterprises based on micro hydro energy in
Nepal. (Masters), University of Flensburg, Flensburg, Germany.
Tharkar, S., Devarajan, A., Kumpatla, S., & Viswanathan, V. (2010). The
socioeconomics of diabetes from a developing country: a population based cost
of illness study. Diabetes Res Clin Pract, 89(3), 334-340.
doi:10.1016/j.diabres.2010.05.009
The Kathmandu Post. (2018, http://kathmandupost.ekantipur.com/news/2018-01-
06/nepals-first-biogas-plant-starts-producing-cng.html). Nepal’s first biogas
plant starts producing CNG. The Kathmandu Post.
The Kathmandu Post. (2019). Govt mulls direct subsidy on LPG. The Kathmandu Post.
Retrieved from https://kathmandupost.com/money/2015/02/17/govt-mulls-
direct-subsidy-on-lpg
Thi Thuy Nga, N., FitzGerald, G., & Dunne, M. P. (2018). Family-based social health
insurance for informal workers in Vietnam: Willingness to pay and Its
determinants. Asia Pacific Journal of Public Health, 1010539518799785.

286
Thompson, D. Y., Swallow, B. M., & Luckert, M. K. (2017). Costs of lost
opportunities: Applying non-market valuation techniques to potential REDD+
participants in Cameroon. Forests, 8(3), 69.
Thomson Reuters. (2018). Carbon Market Survey 2018. Retrieved from http://financial-
risk-solutions.thomsonreuters.info/CarbonMarketSurveyReport
Thomy, B., Morrison, M., Duncan, R., Bark, R. H., Boyle, K. J., & Birtles, P. J. (2017).
Thresholds and interactions: Evidence from valuing urban riparian corridors. In:
Charles Sturt University.
Thorbecke, E. (2016). Inequality and the trade-off between efficiency and equity.
Journal of Human Development and Capabilities, 17(3), 460-464.
doi:10.1080/19452829.2016.1203033
Thurstone, L. L. (1927). A law of comparative judgment. Psychological review, 34(4),
273.
Tietenberg, T. H. (2006). Emissions trading: principles and practice (Second ed.):
Resources for the future, Washington DC, USA.
Tilahun, M., Birner, R., & Ilukor, J. (2017). Household-level preferences for mitigation
of Prosopis juliflora invasion in the Afar region of Ethiopia: a contingent
valuation. Journal of environmental planning and management, 60(2), 282-308.
Tilahun, M., Vranken, L., Muys, B., Deckers, J., Gebregziabher, K., Gebrehiwot, K., . .
. Mathijs, E. (2015). Rural households' demand for frankincense forest
conservation in Tigray, Ethiopia: a contingent valuation analysis. Land
Degradation & Development, 26(7), 642-653.
Timilsina, G., Sapkota, P., & Steinbuks, J. (2018). How much has Nepal lost in the last
decade due to load shedding? an economic assessment using a CGE model
Retrieved from
http://documents.worldbank.org/curated/en/934061528378849106/How-much-
has-Nepal-lost-in-the-last-decade-due-to-load-shedding-an-economic-
assessment-using-a-CGE-model
Train, K. E. (2009). Discrete choice methods with simulation: Cambridge university
press.
Tran, B. X., Le Nguyen, Q., Nguyen, L. H., Phan, H. T. T., Le, H. T., Tran, T. D., . . .
Latkin, C. A. (2017). Expanding co-payment for methadone maintenance
services in Vietnam: the importance of addressing health and socioeconomic
inequalities. BMC Health Serv Res, 17(1), 480.
Trang, T. T. T., Rañola, R. F., & Van Song, N. (2018). Households’ willingness-to-pay
for wastewater treatment in traditional agro-food processing villages, Nhue-Day
River Basin, Vietnam: Case study in Hanoi City. Journal of Environmental
Protection, 9(10), 1021.
Trujillo, J. C., Carrillo, B., Charris, C. A., & Velilla, R. A. (2016). Coral reefs under
threat in a Caribbean marine protected area: assessing divers' willingness to pay
toward conservation. Marine Policy, 68, 146-154.
Tuan, T. H., & Navrud, S. (2007). Valuing cultural heritage in developing countries:
comparing and pooling contingent valuation and choice modelling estimates.
Environmental and Resource Economics, 38(1), 51-69.
Tuan, T. H., & Navrud, S. (2008). Capturing the benefits of preserving cultural heritage.
Journal of cultural heritage, 9(3), 326-337.
Tuan, T. H., Seenprachawong, U., & Navrud, S. (2009). Comparing cultural heritage
values in South East Asia–Possibilities and difficulties in cross-country transfers
of economic values. Journal of cultural heritage, 10(1), 9-21.
Turnbull, B. W. (1976). The empirical distribution function with arbitrarily grouped,
censored and truncated data. Journal of the Royal Statistical Society. Series B
(Methodological), 290-295.

287
Kyoto Protocol, (1998).
Paris Agreement (2015).
United Nations Development Program. (2014). Human development report 2014
Sustaining human progress: Reducing vulnerabilities and bulding resilience
Retrieved from http://hdr.undp.org/sites/default/files/hdr14-report-en-1.pdf
United Nations Environment Program. (2015). The financial system we need: Aligning
the financial system with sustainable development. Retrieved from
http://unepinquiry.org/wp-
content/uploads/2015/11/The_Financial_System_We_Need_EN.pdf
United Nations Environment Program. (2016). Green Finance for Developing
Countries: Need, Concerns and Innovations Retrieved from
https://unepinquiry.org/publication/green-finance-for-developing-countries/
United Nations Framework Convention on Climate Change. (2018). CDM Registry.
Retrieved 01/12/2018 https://cdm.unfccc.int/Registry/index.html
United States Environment Protection Agency. (2018). Clean air markets: Acid Rain
Program. Retrieved from https://www.epa.gov/airmarkets/acid-rain-program
Upadhyay, M. P., Ghimire, S., & Sharma, Y. P. (2018). Women’s participation in the
formal financial market in Nepal: Evidence from NLSS III Data. International
Journal of Advances in Management and Economics.
Urmee, T., & Harries, D. (2009). A survey of solar PV program implementers in Asia
and the Pacific regions. Energy for Sustainable Development, 13(1), 24-32.
Van Bueren, M., & Bennett, J. (2004). Towards the development of a transferable set of
value estimates for environmental attributes. Australian Journal of Agricultural
and Resource Economics, 48(1), 1-32.
van der Kroon, B., Brouwer, R., & van Beukering, P. J. H. (2014). The impact of the
household decision environment on fuel choice behavior. Energy Economics,
44, 236-247. doi:10.1016/j.eneco.2014.04.008
Van Hecken, G., & Bastiaensen, J. (2010). Payments for ecosystem services: justified or
not? A political view. Environmental Science & Policy, 13(8), 785-792.
doi:10.1016/j.envsci.2010.09.006
van Kooten, G. C. (2017). Forest carbon offsets and carbon emissions trading: Problems
of contracting. Forest Policy and Economics, 75, 83-88.
doi:https://doi.org/10.1016/j.forpol.2016.12.006
Vásquez, Ó. C., Álvarez, A., Silva, J., & Muga, A. P. (2014). Towards the estimation of
demand for recycling in Chile: The case of Santiago. Resources, Conservation
and Recycling, 82, 94-102. doi:10.1016/j.resconrec.2013.11.006
Vásquez, W. F., & Alicea-Planas, J. (2018). Unbundling household preferences for
improved sanitation: A choice experiment from an urban settlement in
Nicaragua. J Environ Manage, 218, 477-485.
Vatn, A. (2010). An institutional analysis of payments for environmental services.
Ecological Economics, 69(6), 1245-1252.
Vazquez, A., & Iglesias, G. (2015). Public perceptions and externalities in tidal stream
energy: A valuation for policy making. Ocean & Coastal Management, 105, 15-
24.
Veisten, K. (2007). Contingent valuation controversies: Philosophic debates about
economic theory. The Journal of Socio-Economics, 36(2), 204-232.
Villalobos, P., & Huenchuleo, C. (2010). Ecosystem service valuation of Ruil
(Nothofagus alessandrii) forests in central Chile: an application of the choice
experiment method. In J. Bennett & E. Birol (Eds.), Choice Experiments in
Developing Countries–Implementation, Challenges and Policy Implications.
(pp. 151-167): Edward Elgar.

288
Vivid Economics. (2016). State and trends of carbon pricing 2016 (146481001X).
Retrieved from https://openknowledge.worldbank.org/handle/10986/25160
Vivid Economics. (2017). State and trends of carbon pricing 2017 (1464812187).
Retrieved from https://openknowledge.worldbank.org/handle/10986/28510
Vollmer, D., Prescott, M. F., Padawangi, R., Girot, C., & Grêt-Regamey, A. (2015).
Understanding the value of urban riparian corridors: considerations in planning
for cultural services along an Indonesian river. Landscape and Urban Planning,
138, 144-154.
Waldman, K. B., Ortega, D. L., Richardson, R. B., & Snapp, S. S. (2017). Estimating
demand for perennial pigeon pea in Malawi using choice experiments.
Ecological Economics, 131, 222-230.
Waldman, K. B., & Richardson, R. B. (2018). Confronting tradeoffs between
agricultural ecosystem services and adaptation to climate change in Mali.
Ecological Economics, 150, 184-193.
Wang, E., Wei, J., & Zhu, J. (2017). The effects of improving coastal park attributes on
the recreation demand—A case study in Dalian China. Tourism Economics,
23(1), 133-149.
Wang, H., He, J., Kim, Y., & Kamata, T. (2014). Municipal solid waste management in
rural areas and small counties: An economic analysis using contingent valuation
to estimate willingness to pay for Yunnan, China. Waste Management &
Research, 32(8), 695-706. doi:10.1177/0734242X14539720
Wang, N.-n., Luo, L.-g., Pan, Y.-r., & Ni, X.-m. (2018). Use of discrete choice
experiments to facilitate design of effective environmentally friendly agricultural
policies. Environment, Development and Sustainability, 1-17.
Wang, W., Jin, J., He, R., Gong, H., & Tian, Y. (2018). Farmers’ willingness to pay for
health risk reductions of pesticide use in China: A contingent valuation study.
International journal of environmental research and public health, 15(4), 625.
Wang, X., Zhang, Y., Huang, Z., Hong, M., Chen, X., Wang, S., . . . Meng, X. (2016).
Assessing willingness to accept compensation for polluted farmlands: a
contingent valuation method case study in northwest China. Environmental
Earth Sciences, 75(3), 179.
Wang, Y., & Corson, C. (2015). The making of a charismatic carbon credit: clean
cookstoves and women in western Kenya. Environment and Planning A, 0(0), 0-
0. doi:10.1068/a130233p
Water and Energy Commission Secretariat. (2017). Electricity demand forecast report
(2015-2040). Retrieved from https://wecs.gov.np/uploaded/Electricity-Demand-
Forecast-Report-2014-2040.pdf
Weaver, M., Ndamobissi, R., Kornfield, R., Blewane, C., Sathe, A., Chapko, M., . . .
Senwara-Defiobonna, J. (1996). Willingness to pay for child survival: results of
a national survey in Central African Republic. Social science & medicine, 43(6),
985-998.
Weisbrod, B. A. (1964). Collective-consumption services of individual-consumption
goods. The Quarterly Journal of Economics, 78(3), 471-477.
Whittington, D. (2002). Improving the performance of contingent valuation studies in
developing countries. Environmental and Resource Economics, 22(1-2), 323-
367.
Whittington, D. (2010). What Have We Learned from 20 Years of Stated Preference
Research in Less-Developed Countries? Annual Review of Resource Economics,
2(1), 209-236. doi:10.1146/annurev.resource.012809.103908
Whittington, D., Briscoe, J., Mu, X., & Barron, W. (1990). Estimating the willingness to
pay for water services in developing countries: a case study of the use of

289
contingent valuation surveys in Southern Haiti. Economic development and
cultural change, 38(2), 293-311.
Whittington, D., Choe, K., & Lauria, D. (1997). The effect of giving respondents “Time
to Think” on tests of scope: An experiment in Calamba, Philippines. In
Determining the Value of Non-Marketed Goods (pp. 219-234): Springer.
Whittington, D., Lauria, D. T., Choe, K., Hughes, J. A., Swarna, V., & Wright, A. M.
(1993). Household sanitation in Kumasi, Ghana: a description of current
practices, attitudes, and perceptions. World Development, 21(5), 733-748.
Whittington, D., Lauria, D. T., & Mu, X. (1991). A study of water vending and
willingness to pay for water in Onitsha, Nigeria. World Development, 19(2),
179-198.
Whittington, D., Smith, V. K., Okorafor, A., Okore, A., Liu, J. L., & McPhail, A.
(1992). Giving respondents time to think in contingent valuation studies: a
developing country application. Journal of Environmental Economics and
Management, 22(3), 205-225.
Whittington, D., & Swarna, V. (1994). The economic benefits of potable water supply
projects to households in developing countries (0116-273X). Retrieved from
https://www.adb.org/publications/economic-benefits-potable-water-supply-
projects-households-developing-countries
Winther, T. (2008). The impact of electricity: Development, desires and dilemmas:
Berghahn Books.
Wolde-Rufael, Y. (2006). Electricity consumption and economic growth: a time series
experience for 17 African countries. Energy Policy, 34(10), 1106-1114.
doi:10.1016/j.enpol.2004.10.008
World Bank. (2014). CO2 emissions (metric tons per capita). Retrieved from
https://data.worldbank.org/indicator/en.atm.co2e.pc?view=map
World Bank. (2015). Sustainable Energy for All 2015—Progress toward sustainable
energy. Retrieved from
http://trackingenergy4all.worldbank.org/~/media/GIAWB/GTF/Documents/GTF
-2105-Full-Report.pdf
World Bank. (2017). Investment Prospectus for Clean Cooking Solutions in Nepal
Retrieved from
http://documents.worldbank.org/curated/en/916571494854063344/pdf/Investme
nt-prospectus-for-clean-cooking-solutions-in-Nepal-a-roadmap-to-national-goal-
of-providing-clean-cooking-solutions-for-all.pdf
World Bank. (2018a). State and Trends of Carbon Pricing 2018 (1464812187).
Retrieved from https://openknowledge.worldbank.org/handle/10986/31755
World Bank. (2018b). Tracking SDG7 : The Energy Progress Report 2018. Retrieved
from
http://documents.worldbank.org/curated/en/495461525783464109/Tracking-
SDG7-the-energy-progress-report-2018
World Bank. (2019). State and trends of carbon pricing 2019. Retrieved from
http://documents.worldbank.org/curated/en/191801559846379845/State-and-
Trends-of-Carbon-Pricing-2019
World Health Organisation. (2012). Health indicators of sustainable energy. Retrieved
from https://www.who.int/hia/green_economy/indicators_energy1.pdf
Wunder, S. (2005). Payments for environmental services: some nuts and bolts.
Retrieved from https://www.cifor.org/publications/pdf_files/OccPapers/OP-
42.pdf
Wüstenhagen, R., & Menichetti, E. (2012). Strategic choices for renewable energy
investment: Conceptual framework and opportunities for further research.
Energy Policy, 40, 1-10.
http://documents.worldbank.org/curated/en/191801559846379845/State-and-Trends-of-Carbon-Pricing-2019

290
Xu, L., Yu, B., & Li, Y. (2015). Ecological compensation based on willingness to
accept for conservation of drinking water sources. Frontiers of Environmental
Science & Engineering, 9(1), 58-65.
Yamegueu, D., Azoumah, Y., Py, X., & Zongo, N. (2011). Experimental study of
electricity generation by Solar PV/diesel hybrid systems without battery storage
for off-grid areas. Renewable Energy, 36(6), 1780-1787.
Yang, Y., Solgaard, H. S., & Haider, W. (2015). Value seeking, price sensitive, or
green? Analyzing preference heterogeneity among residential energy consumers
in Denmark. Energy Research & Social Science, 6, 15-28.
doi:https://doi.org/10.1016/j.erss.2014.11.001
Yesuf, M., Mekonnen, A., Köhlin, G., & Carlsson, F. (2005). Are agricultural extension
packages what Ethiopian farmers want? A stated preference analysis (1403-
2465). Retrieved from http://hdl.handle.net/2077/2747
Yin, H., Pizzol, M., Jacobsen, J. B., & Xu, L. (2018). Contingent valuation of health
and mood impacts of PM 2. 5 in Beijing, China. Science of the Total
Environment, 630, 1269-1282.
Yoo, S. H. (2006). The causal relationship between electricity consumption and
economic growth in the ASEAN countries. Energy Policy, 34(18), 3573-3582.
doi:10.1016/j.enpol.2005.07.011
Yu, X., Gao, Z., & Zeng, Y. (2014). Willingness to pay for the “Green Food” in China.
Food policy, 45, 80-87.
Zerriffi, H. (2011). Innovative business models for the scale-up of energy access efforts
for the poorest. Current Opinion in Environmental Sustainability, 3(4), 272-278.
Zhang, L., & Wu, Y. (2012). Market segmentation and willingness to pay for green
electricity among urban residents in China: The case of Jiangsu Province.
Energy Policy, 51, 514-523. doi:10.1016/j.enpol.2012.08.053
Zhang, X., Qi, T.-y., Ou, X.-m., & Zhang, X.-l. (2017). The role of multi-region
integrated emissions trading scheme: A computable general equilibrium
analysis. Applied Energy, 185, 1860-1868.
doi:https://doi.org/10.1016/j.apenergy.2015.11.092
Zhao, X., Cai, Q., Li, S., & Ma, C. (2018). Public preferences for biomass electricity in
China. Renewable and Sustainable Energy Reviews, 95, 242-253.
doi:https://doi.org/10.1016/j.rser.2018.07.017

291
Appendices
Appendix 1: Direct Black Carbon radiative forcing from residential
kerosene lighting (W/m2)

141 (Bhatia & Angelou, 2015)
Appendix 2: Multi–tier matrix for measuring access to electricity141

142 (Bhatia & Angelou, 2015)
Appendix 3: Multi-tier matrix for measuring access to cooking
solutions142

143 The budget stated is as planned and the actual expenses may have been different.
Appendix 4: AEPC implemented Projects and Programs143

The literature describes the need for validity measures to test the accuracy of the SP
results, where three basic validity measures are expressly tested. The first, criterion
validity relates to the comparison of the results against a criterion such as “the actual
market price”. For example, the WTP for a new product not yet introduced in the
market can be related to the market price paid by the consumers once the product is
introduced in the market. The criterion validity is difficult to achieve in developing
country context like Nepal because markets can be far from competitive so that true
consumer values are not reflected in market prices. The second, construct validity is
based on an understanding that the results from a SP study will relate to other
measures as predicted by basic principles. It can be carried out in two ways. In the
first, results are compared with the results from other measures that follow the same
theoretical construct to understand the convergence of results. A WTP estimate can
be compared with the results from another method, which follows the same
underlying theoretical construct such as the travel cost method. In the second, validity
can be tested against changes in other related variables to understand the vector of
such changes, and check whether the changes occur as suggested by theoretical
constructs. The third, content validity relates to the ability and robustness of the tools
and instruments used to measure accurately. Validity is related to objectivity that
seeks to minimise the different biases expected in SP studies from the lack of a real
market situations. The literature suggests that the most important test of validity is the
convergence related to the construct validity, because all measure of comparison to
some other type of measurement is basically a test of the convergence of theoretical
constructs.
Appendix 5: Validity Measures

Rural Households’ Willingness to Pay and Credit Preferences for Biogas Plants
in Nepal
CHARLES STURT UNIVERSITY
SCHOOL OF MANAGEMENT AND MARKETING
Appendix 6: Household Survey Questionnaire

297
PURPOSE OF THE STUDY
The purpose of the study is to assess whether rural consumers are willing to pay and
use credit to install a household biogas plant.
A biogas plant is a clean energy technology which can be used to replace firewood
for cooking.
This study is a university research project. Your name is not recorded with your
answers. All your answers will be kept strictly confidential.
Your participation is voluntary and can take up to one hour to complete.
During the study I will ask you some questions to find out if you are interested to
purchase a biogas plant by paying cash or by taking credit from a financial institution.
I will also ask you some questions to understand your general household information
such as your age and income. This information is to make sure that we get
information from a wide range of households.
I hope you will enjoy this in-person face to face interview and thank you for taking
your time to answer my questions.
CURRENT ENERGY USE AND HEALTH EFFECTS
Many rural Nepalese households rely on firewood for cooking. As shown in the
pictures [show picture set I], most households collect firewood themselves and cook
food using traditional stoves. .
The smoke from traditional stoves goes deep into people’s lungs, which can cause
sicknesses such as pneumonia and tuberculosis. Women are more prone to these
sicknesses because they do most of the cooking, as well as children because they
spend a lot of time indoors.
In Nepal, nearly 8,000 people, particularly women and children, die each year
because of diseases such as pneumonia due to indoor air pollution.
Question 1. Prior to this survey, did you know about the health effects of firewood
use for cooking?
Yes No

298
CLIMATE CHANGE AND BIOGAS
Now I will tell you about another disadvantage of using firewood. Use of firewood
also produces gases which are harmful to the environment as they help to increase the
world’s temperature. Increases in these gases across the world are causing changes in
weather patterns.
The changing weather pattern has increased storms in some areas causing floods that
damage human lives, properties and agriculture, as shown in the picture [show picture
II]. Over 50 people were killed by landslides and flash floods in Nepal in the last
week of July alone last year. Use of clean energy technologies such as biogas can
reduce the emission of such harmful gases in the environment, which will help to
reduce these changes in weather patterns.
Question 2. Prior to this survey, did you know that cooking on firewood also emits
harmful gases that cause changes in weather patterns?
Yes No
CLEAN ENERGY AND BIOGAS
A biogas plant can be installed at your house to reduce use of firewood for cooking.
As shown in the pictures [show picture set III], a biogas plant is a simple technology
that produces gas for cooking. In a biogas plant, water and dung are mixed in equal
quantities and fermented for two months, after which cooking gas is produced.
A household requires two cattle head (buffalo and/or cow) to feed dung daily to
generate an adequate amount of gas. The biogas plant can produce gas for 3 hours
each day which can be used for cooking.
The digestion of cow manure also produces high quality fertiliser, normally known as
bio-slurry. The use of bio-slurry can help to reduce the use of chemical fertiliser.
Once installed, a biogas plant can operate for 15 years. A biogas plant makes your
household self-sufficient for cooking energy, and you don’t have to rely on imported
fuels such as kerosene and LPG.
Question 3. Prior to this survey, did you know about household biogas plants?
Yes No

299
REVENUE FROM THE BIOGAS USE
The reduction in emission of harmful gases due to biogas use can be measured. This
can be done by measuring the firewood consumption before and after the biogas is
installed.
There are companies and organisations in the developed countries which will pay for
reductions in harmful gases. These companies want to buy reductions in gases
because their government has asked them to either reduce their own emissions or buy
such reductions from others. This will help those companies meet their quota of
emitting harmful gases.
Some environmental organisations also want to buy such measured reductions to
preserve and protect the environment from climate change impacts.
It is estimated that in Nepal nearly 1 million households can install biogas plants. In
the future, these households may be able to earn the revenue from such buyers of
emission when these households install the biogas plants.
Question 4. Do you believe that if you install a biogas plant you will be able to earn
income due to reductions in emissions of harmful gases?
Yes No Don’t Know
UNDERSTANDING THE INFORMATION PROVIDED
We would now like to ask you a few questions to help you think about the
information we have presented to you.
Question 5. Please indicate whether the following statements are True or False. Pick
either True or False.
Firewood used in traditional stoves can cause serious health effects for women and
children
True False
Biogas reduces gases which can cause changes in weather patterns
True False
An equal quantity of dung and water is required every day to run a biogas plant
True False

300
Biogas digester also produces bio-fertiliser which has high nutrients
True False
Biogas plants are cheap and can be installed within a few days
True False
GOVERNMENT SUBSIDIES FOR BIOGAS PLANTS
The government provides subsidies to help people buy and install biogas in their
homes. This subsidy is about one-third of the total cost of the technology. However,
access to these government subsidies is limited. Only about 20,000 biogas plants are
subsidised each year. Therefore, many households like yours may have to wait a long
period to receive a government subsidy.
Question 6. Prior to this survey, did you know about government subsidies?
Yes No
WILLINGNESS TO PAY
I will now ask you your willingness to pay for a biogas plant considering you will
install the plant in the next six months.
Please note here that there are no right and wrong answers to these questions; we just
want to know your preferences.
However, many studies like this one which have asked different groups of people to
state their willingness to pay for amenities such as drinking water, have found that on
average, people UNDERSTATED their actual willingness to pay compared to their
actual payment later. In the following question, please decide truthfully on how much
you would exactly pay, considering the benefits and your current income.
Question 7: ASK: Would you be willing to pay a one-time payment of Rs or $ X to
install the Biogas in your household?
IF the answer is NO to Question 7, ASK Question 8: How much would you pay?
NRs…….
Question 9. If you received an income of NPR Y each year for installing and using
the biogas plant, would you be willing to pay the full price of NPR 45,000 (US

301
$433.79) to install the biogas in your household?” [Each respondent would be offered
a value out of five levels of rebate]
If the answer to Question 7, 8 and 9 is NO then GO TO Question 10, else GO TO
Next Section.
Question 10: Which of the following statements most closely describes your reason
for not wanting to pay for the biogas plant? Tick one box only
I prefer to use firewood for cooking
Biogas is too costly
I have heard bad reviews about the technology
I would rather switch over to LPG for cooking
I need more information to make a choice
Some other reason, please specify:
___________________________________________________
PREFERENCES FOR CREDIT
Some banks and micro-finance institutions provide credit to install biogas plants and
households have used such credit to install biogas plants. However, many households
do not have easy access to banks and other finance institutions, especially in rural
locations. Also, even if there is access, many households do not have enough assets or
income to qualify for credit.
Therefore, in the next few questions, I will ask you to make choices to help us
understand what type of credit you would choose, if any, if you were offered credit to
install a biogas plant.
Each option has an interest rate for the credit.
Each option has the number of years over which you have to pay back the
loan.
Each option has the instalment amount that you have to pay for the period of
the loan.
Each instalment has to be paid on time, otherwise you will incur additional
costs.
Each option has a yearly rebate that you receiving for keeping the biogas in
operation. You will get your yearly rebates after your biogas plant has been
checked that it is operating properly. You will get this rebate every year for a
minimum of 10 years.

302
Choosing between these options will give us an understanding of what aspects are
important to you and how much you are prepared to pay for them.
EXAMPLE
In the table that I will show you, which is an example, each question has two options
- Options A and B.
[Show Choice Card Example]
These options describe different alternatives for the credit services. You would
consider the features and cost to your household for each of the options.
Option A would cost you $14 monthly, to be paid for 5 years, at a 16% interest rate.
This is $164 per year and $821 in total. You would earn $38 as a rebate each year and
$380 in 10 years.
Option B would cost you $ 13 per month, to be paid for 5 years, at 12% interest rate.
This is $150 per year and $751 in total. You would earn $50 as rebate each year and
$500 in 10 years in total.
For Option A, you would pick the box as shown below. If you preferred a different
option, you pick the box for Option B. You can choose to pick None of the Options
if you did not want to choose either of the other options to use credit.
Now I will ask you the real questions.
Question 11. Suppose options A and B were the ONLY credit options available.
Which one would you realistically choose? Pick one box only.
[Show Choice Set I, II, III & IV]
Question 12. Did you always choose None of the Options when answering the
questions in Question 11?
Yes – please GO TO question 13
No - please GO TO Question 14
Question 13. Which of the following statements most closely describes your reason
for choosing None of the Options? Tick one box only.
I don’t like to take credit

303
The instalment is too costly
I have heard bad reviews about the technology
There are no banks or financial institutions who will provide such credit for
biogas
I would rather switch over to LPG for cooking
I need more information to make a choice
Some other reason, please specify:
_____________________________________
Question 14. Please indicate the extent to which you agree with each of the following
statements. Please tick one box in each row
Yes No Not Sure
I understood the information provided
during the survey
I found answering the questionnaire
confusing
I found answering the questionnaire
difficult
My responses will influence government
policy
NOW ASK A FEW QUESTIONS TO MAKE SURE THAT WE ARE
SURVEYING A WIDE RANGE OF PEOPLE
Please note that your responses to these questions will be treated completely
confidentially and the results will only be reported in aggregate form.
Question 15: What is your gender?
Male Female
Question 16: What is your age? Please tick one box only
18-24 years 46-50 years
25-29 years 51-55 years
30-35 years 56-60 years
36-39 years 61-65 years

304
40-45 years 66 years or older
Question 17: Are there any children under 18 years in your household?
Yes No
Question 18: If Yes, how many? Please Specify _________
Question 19: Currently is anybody in your household working in a foreign
country?
Yes No
Question 20: What is the highest level of education you have obtained or are
obtaining? Please tick one box only
Never went to school Certificate/Year 12
Primary only Graduate
Secondary/Year 10 Post Graduate
Other Please Specify___________________________
Now I will ask you some questions about your energy consumption, firewood and
other fuels if any used for cooking.
Question 21. Which fuels do you use for cooking in your home?
Firewood LPG Grid Electricity
Other Please Specify ______________________
Question 22. If you use firewood, where do you get your firewood from?
Community Forest Private Forest
Other Please Specify ____________________________
Question 23. If you use firewood, how much firewood do you consume in a month for
household cooking?
Please Specify in Bharis144_________________________
Question 24. If you use dried dung, how much dried dung do you consume in a day for
household cooking?
Please Specify in local units_________________________
Question 25. If you use LPG, please tell us how long a cylinder lasts for cooking?
Please specify in months _________________________
Question 26 If you use grid electricity for cooking, which device do you use?
144 One Bhari of firewood is equal to 30 Kg of firewood approximately.

305
Rice Cooker Induction Plate
Other Please Specify ____________________________
Question 27 Please tell use your monthly electricity bill?________
Now I will ask you some questions about your credit history.
Question 28. Is there a bank or other financial institution near your household?
Yes No
Question 29. Have you previously used credit from a bank or other financial
institution?
Yes No
Question 30. If Yes, please give us the name of the bank or the financing institution
from which you received your last credit?
Question 31. Have you ever been denied credit before by a bank or other financial
institution?
Yes No
Question 32. If Yes, what were the reasons to deny you credit?
Please Specify____________________________________
Question 33. Assuming you were wanting to obtain credit to install a biogas plant in
the next six months, which of the following would you do to obtain the credit? Please
tick one box in each row
Question 34. How much livestock do you own? Please specify the numbers.
Yes No Don’t Know
Use your house and land for
collateral
Pay a one-time fee of 2% for
loan processing
Start a savings account and
make regular savings of Rs
100 per month

306
Cows Buffalos Goats Pigs
Other Please Specify______________________________
Question 35. How much agricultural land do you own? Please tick one box
Less than 1 Bigha145
1.1 Bigha to 2 Bigha
2.1 Bigha to 3 Bigha
3.1 Bigha to 4 Bigha
4.1 Bigha to 5 Bigha
More than
More than 5 Bigha
I do not own any land
Question 36: To the best of your knowledge, what is the annual total income from your
household (before tax). Please tick one box
Less than Rs 15,000
Rs 15,000 to Rs 30,000
Rs 30,000 to Rs 60,000
Rs 60,000 to Rs 90,000
Rs 90,000 to Rs 120,000
Rs 120000 to Rs 150000
Rs 150000 to Rs 180000
Rs 180000 to Rs 200000
Rs 200,000 or more
Not sure/ I don’t know
I would prefer not to answer this question
This last question is very important because studies suggest that income influences
people's choices.
Question 37. If you would like to make any other comments about the
willingness to pay or the credit preferences, or about this survey, please
tell me now and I will note it down.
145 One Bigha = 6,773 meter square = 0.677263 hectare

307
Appendix 7: Picture Set I – Traditional Cooking

Appendix 8: Picture Set II -Climate Change Impact

Appendix 9: Picture Set III – Biogas Plant

Assessment of Financing for Off Grid Renewable Energy Technologies in Nepal
- Interview-
CHARLES STURT UNIVERSITY
SCHOOL OF MANAGEMENT AND MARKETING
Appendix 10: Interview Questionnaire for Financing Entities

311
PURPOSE OF THE STUDY
The purpose of this interview is to understand the Renewable Energy (RE) financing
portfolio of banks, financial institutions and cooperatives. The questionnaire is also
used to obtain information on the RE financing scenario from projects and experts
involved in RE financing.
This study is a university research project. Your name is not recorded with your
answers. All your answers will be kept strictly confidential.
Your participation is voluntary and can take up to one hour to complete.
During the interview, I will ask questions to understand your institution’s investment
in RE technologies, and your understanding of the current government policy on RE
financing, and what possible improvements could be made in financing policy to
accelerate RE deployment.
I hope you will enjoy this in-person face to face interview and thank you for taking
your time to answer my questions.

312
A. COMMERCIAL AND DEVELOPMENT BANKS
1. What is the name of your Bank?
_______________________________________________
2. When was it established? ______________________________________
3. Under which Class is your Bank established?
Class A Class B Class C Class D
Others, please specify__________________
4. What is the reason for your Bank offering Renewable Energy (RE) financing to
your customers?
_________________________________________________________________
_________________________________________________________________
_________________________________________________________________
_________________________________________________________________
_________________________________________________________________
__
5. What are the type of loans provided under RE financing? Please tick the respective
box.
Wholesale RE Loans Direct RE Project Loans
Household RE Technologies Others, please specify
________________________
6. Can you please provide the Wholesale loan information as per Question 5?
Please fill the table below.
Client Financial Institution
Loan provided for
$ Amount issued in the last 12 months
Interest Rate
Tenure
Note: Add extra paper for additional loans.
7. What are the protocols considered or required for providing wholesale loans?
_________________________________________________________________
_________________________________________________________________
_________________________________________________________________
_________________________________________________________________
_________________________________________________________________
_______________
8. Can you please provide the Direct Project loan information as per Question 5?
Please fill the table below.
Client Project
Loan provided for
$ Amount issued in the last 12 months
Interest Rate
Tenure

313
Note: Add extra paper for additional loans.
9. What are the protocols considered or required for providing Direct Project loans?
_________________________________________________________________
_________________________________________________________________
_________________________________________________________________
_________________________________________________________________
_________________________________________________________________
_____________
10. Can you please provide the Household loan information as per Question 5? Please
fill the table below.
Household Technologies
Loan provided for
$ Amount issued in the last 12 months
Interest Rate
Tenure
Note: Add extra paper for additional loans.
11. What are the protocols considered or required for providing Household
Technology loans?
_________________________________________________________________
_________________________________________________________________
_________________________________________________________________
_________________________________________________________________
_________________________________________________________________
_____________
12. Can you please provide the information on Other loan category as per Question
5? Please fill the table below.
Other loan types
Loan provided for
$ Amount issued in the last 12 months
Interest Rate
Tenure
Note: Add extra paper for additional loans.
13. What are the protocols considered or required for providing Other category of
loans?
_________________________________________________________________
_________________________________________________________________
_________________________________________________________________
_________________________________________________________________
_________________________________________________________________
________
14. What is the overall amount invested so far in RE financing? Please fill the table
below.
Type Total Amount Average Interest
Rate
Average Tenure
Wholesale Loans

314
Project Loans
Household loans
Others,
_____________
15. If the Bank is providing only wholesale or direct lending and not both, what are
the reasons for doing so?
_________________________________________________________________
_________________________________________________________________
_________________________________________________________________
_______________________________________________________
16. What percentage of your total portfolio was covered by RE financing in the last
year?
________________________
17. Is this total RE investment used to reflect the Central Bank’s directives of priority
sector lending?
Yes No
18. If No, please can you tell us why the total RE investment is not used to meet the
Central Bank’s directives?
_________________________________________________________________
_________________________________________________________________
_________________________________________________________________
_____________________________________________
19. Have you taken loans from any other Banks and/or Financial Institutions (e.g.
Central Bank, International Multilateral Banks) to meet your RE financing
portfolio?
Yes No
20. If Yes, please fill the table below.
From Amount Interest Rate Tenure
Bank 1
Bank 2
Bank 3
21. If No, What conditions would lead you to take such loans?
_________________________________________________________________
_________________________________________________________________
_________________________________________________________________
___________________________________________________
22. Have your Bank invested the bank’s shareholders’ funds to meet the RE
portfolio?
Yes No
23. If Yes, what were the conditions that led to the decision?
_________________________________________________________________
_________________________________________________________________
_________________________________________________________________
__________________________________________________

315
24. If No, Why have you not considered this?
_________________________________________________________________
_________________________________________________________________
_________________________________________________________________
________________________________________________________
25. Do you think that the subsidy being provided by the government for off grid RE
technologies should continue? If Yes or No, please ask Why.
_________________________________________________________________
_________________________________________________________________
_________________________________________________________________
________________________________________________________
26. Do you think carbon revenues could play a potential role in the deployment of off
grid renewable energy technologies? If yes, How and If No, Why not?
_________________________________________________________________
_________________________________________________________________
_________________________________________________________________
_____________________________________
27. What favourable conditions do you think are required for banks and financial
institutions to enhance access to finance for off grid household RE technologies?
_________________________________________________________________
_________________________________________________________________
_________________________________________________________________
_____________________________
28. What favourable conditions do you think are required for banks and financial
institutions to enhance access to finance for off grid community/mini grid
technologies?
_________________________________________________________________
_________________________________________________________________
_________________________________________________________________
_____________________________________
29. Are you familiar with the Central Renewable Energy Fund (CREF)?
Yes No
30. If Yes, What do you know about it?
_________________________________________________________________
_________________________________________________________________
_________________________________________________________________
_________________________________________________
31. Can you please tell us about your opinion and assessment about the structure and
operation of the CREF?
_________________________________________________________________
_________________________________________________________________
_________________________________________________________________
_________________________________________________
32. What improvements do you consider are necessary to improve the performance
of CREF?
________________________________________________________________

316
B. MICRO FINANCE AND COOPERATIVES
1. What is the name of your Institution?
_______________________________________
2. When was it established? ______________________________________
3. Are you registered with any formal body to carry out Renewable Energy (RE)
financing?
Please specify, _________________________
4. What is the reason for your institution offering RE financing to your customers?
_________________________________________________________________
_________________________________________________________________
_________________________________________________________________
____________________________________________________________
5. What are the services provided by your institution?
6. Savings Insurance Transfer
Others, please specify _________________
6. For the following retail loans, could you provide the details requested? Please fill
the table below
Client Technology Average
Loan
Amount
Interest Rate Tenure Repayment
Rate
Solar Home Systems
Biogas
Improved Cook Stoves
Others: ……………….
Note: Add extra paper if required.
7. What are the protocols considered or required for retail loans to your customers?
_________________________________________________________________
_________________________________________________________________
_________________________________________________________________
_________________________________________________________________
_____________________________________________________________
8. What is the overall amount invested so far in RE financing? Please fill for each FY
for the last 10 years.
Type Yr1 Yr2 Yr2 Yr3 Yr4 Yr5 Yr6 Yr7 Yr8 Yr9 Yr10
Biogas
Solar Home Systems
Improved Cook Stoves
Others,
_____________

317
9. What percentage of your total portfolio was covered by RE financing in the last
year?
________________________
10. Have you taken loans from any other Banks and/or Financial Institutions (e.g.
Central Bank, Commercial Banks) to meet the RE financing portfolio?
Yes No
11. If Yes, please fill the loan information below.
Note: Add extra paper if required.
12. If No, What conditions would lead you to take such loans?
_________________________________________________________________
_________________________________________________________________
_________________________________________________________________
________________________________________________________
13. Have your Institution invested the shareholders’ funds to meet the RE portfolio?
Yes No
14. If Yes, what were the conditions that led to the decision?
_________________________________________________________________
_________________________________________________________________
_________________________________________________________________
___________________________________________________
15. If No, Why have you not considered this?
_________________________________________________________________
_________________________________________________________________
_________________________________________________________________
________________________________________________________
16. Do you think that the subsidy being provided by the government for off grid RE
technologies should continue? If Yes or No, please ask Why.
_________________________________________________________________
_________________________________________________________________
_________________________________________________________________
_____________________________________________________
17. Do you think carbon revenues could play a potential role in the deployment of off
grid renewable energy systems? If yes, How and If No, Why not?
_________________________________________________________________
_________________________________________________________________
_________________________________________________________________
_______________________________________
18. What favourable conditions do you think are required for banks and financial
institutions to enhance access to finance for off grid household RE technologies?
_________________________________________________________________
_________________________________________________________________
_________________________________________________________________
_________________________________
19. What favourable conditions do you think are required for banks and financial
institutions to enhance access to finance for off grid community/mini grid
From Amount Interest Rate Tenure
Bank 1
Bank 2
Bank 3

318
technologies?
_________________________________________________________________
_________________________________________________________________
_________________________________________________________________
_____________________________________________
20. Are you familiar with the Central Renewable Energy Fund (CREF)?
Yes No
21. If Yes, What do you know about it?
_________________________________________________________________
_________________________________________________________________
_________________________________________________________________
____________________________________________________
22. Can you please tell us about your opinion and assessment about the structure and
operation of the CREF?
_________________________________________________________________
_________________________________________________________________
_________________________________________________________________
______________________________________________
23. What improvements do you consider are necessary to improve the performance
of CREF?
_________________________________________________________________
_________________________________________________________________
_________________________________________________________________
__________________________________________________

319
RE FINANCING PROGRAM:
1. What is the name of your Institution/Program?
_____________________________________
2. What is the duration of your program?
______________________________________
3. What are the activities being carried out by your program on RE financing?
_________________________________________________________________
_________________________________________________________________
_________________________________________________________________
___________________________________________________
4. Which are your working areas geographically?
_________________________________________________________________
_________________________________________________________________
_________________________________________________________________
___________________________________________________
5. What are the potential impacts of your program/project?
_________________________________________________________________
_________________________________________________________________
_________________________________________________________________
_________________________________________________
6. Do you think that the subsidy being provided by the government for off grid RE
technologies should continue? If Yes or No, please ask Why.
_________________________________________________________________
_________________________________________________________________
_________________________________________________________________
_____________________________________________
7. Do you think that the carbon revenues could play a potential role in fulfilling the
gap if the government reduces or removes the subsidy? If yes, How and If No,
Why not?
_________________________________________________________________
_________________________________________________________________
_________________________________________________________________
______________________________________________
8. What favourable conditions do you think are required for banks and financial
institutions to enhance access to finance for off grid household RE technologies?
_________________________________________________________________
_________________________________________________________________
_________________________________________________________________
___________________________________________
9. What favourable conditions do you think are required for banks and financial
institutions to enhance access to finance for off grid community/mini grid
technologies?
_________________________________________________________________
_________________________________________________________________
_________________________________________________________________
_____________________________________________
10. Are you familiar with the Central Renewable Energy Fund (CREF)?
Yes No
11. If Yes, What do you know about it?
_________________________________________________________________

320
_________________________________________________________________
_________________________________________________________________
___________________________________________________
12. Can you please tell us about your opinion and assessment about the structure and
operation of the CREF?
_________________________________________________________________
_________________________________________________________________
_________________________________________________________________
________________________________________________
13. What improvements do you consider are necessary to improve the performance
of CREF?
_________________________________________________________________
_________________________________________________________________
_________________________________________________________________
____________________________________________________________

321
RE FINANCE EXPERTS:
1. What is the duration of your involvement in RE financing?
_____________________________
2. Which areas have you been involved within RE financing?
_________________________________________________________________
_________________________________________________________________
_________________________________________________________________
___________________________________________________
3. Do you think that the subsidy being provided by the government for off grid RE
technologies should continue? If Yes or No, please ask why.
_________________________________________________________________
_________________________________________________________________
__________________________________
4. Do you think that the carbon revenues could play a potential role in fulfilling the
gap if the government reduces or removes the subsidy? If yes, how and If No,
Why not.
_________________________________________________________________
_________________________________________________________________
_________________________________________________________________
__________________________________________________
5. What favourable conditions do you think are required for banks and financial
institutions to enhance access to finance for off grid household RE technologies?
_________________________________________________________________
_________________________________________________________________
__________________________________
6. What favourable conditions do you think are required for banks and financial
institutions to enhance access to finance for off grid community/mini grid
technologies?
_________________________________________________________________
_________________________________________________________________
_________________________________________________________________
_____________________________________________
7. Are you familiar with the Central Renewable Energy Fund (CREF)?
Yes No
8. If Yes, What do you know about it?
_________________________________________________________________
_________________________________________________________________
_________________________________________________________________
________________________________________________
9. Can you please tell us about your opinion and assessment about the structure and
operation of the CREF?
_________________________________________________________________
_________________________________________________________________
_________________________________________________________________
___________________________________________________
10. What improvements do you consider are necessary to improve the performance
of CREF?
_________________________________________________________________
_________________________________________________________________
___

The basic model for analysing discrete choice CV responses is the random utility
model, similar to the discrete CE introduced by McFadden (1973). Under a random
utility framework, the indirect utility as per the utility difference can be expressed as
(Haab & McConnell, 2002):
𝑢1(𝑦𝑗 − 𝑡𝑗,𝑧𝑗 , 𝜀1𝑗) > 𝑢0(𝑦𝑗 , 𝑧𝑗 , 𝜀0𝑗)
where 𝑖 = 1 is the improved condition due to the proposed CV scenario, and 𝑖 = 0 is
the status quo. The individual j’s determinants of utility are 𝑦𝑗, the discretionary
income, 𝑧𝑗, which represents a vector of individual’s personal and household
characteristics, including the questionnaire variations, and 𝜀𝑖𝑗, a component of
preferences known only to the respondent and not to the researcher. The respondent j
answers yes to a maximum payment of 𝑡𝑗 if the utility due to goods and/or services
exceeds utility of the status quo. However, researchers do not know the nature of the
random part of the preferences, and therefore, can only make probability statements
that may be 𝑈1 > 𝑈0. For a respondent j, this probability is:
Pr(𝑌𝑒𝑠𝑗) = Pr [𝑢1(𝑦𝑗 − 𝑡𝑗 , 𝑧𝑗 , 𝜀1𝑗) > 𝑢0(𝑦𝑗 , 𝑧𝑗 , 𝜀0𝑗)]
As per the random utility model, the utility function can be written as additively
separate deterministic and stochastic components:
𝑢𝑖(𝑦𝑗 , 𝑧𝑗, 𝜀1𝑗) = 𝑣𝑗(𝑦𝑗 , 𝑧𝑗) + 𝜀𝑖𝑗
Further, with the additive specification, the probability statement for respondent j is:
Pr(𝑌𝑒𝑠𝑗) = Pr [𝑣1(𝑦𝑗 − 𝑡𝑗 , 𝑧𝑗) + 𝜀1𝑗 > 𝑣0(𝑦𝑗 , 𝑧𝑗) + 𝜀0𝑗]
Now, since the utility is specified as the sum of the random and deterministic
components, the differences in the random components between the status quo and
the expected scenario can be identified, and therefore, the random component can be
defined as 𝜀𝑗 = 𝜀1𝑗 − 𝜀0𝑗.
Let 𝐹𝜀( ) be the probability that the random variable 𝜀 is less than 𝛼. Then, the
probability for a yes will be:
Appendix 11: Utility difference Random Utility Model Specification for CV

323
Pr(𝑌𝑒𝑠𝑗) = 1 − 𝐹𝜀 [−𝑣1(𝑦𝑗 − 𝑡𝑗,𝑧𝑗) − 𝑣0(𝑦𝑗, 𝑧𝑗)]
The above equation represents the point of departure for the random utility model.
The simplest and most commonly estimated function is the linear utility function. The
linear utility function results when the deterministic part of the function is linear in
income and covariates:
𝑣𝑖𝑗(𝑦𝑗) = 𝛼𝑖𝑧𝑗 + 𝛽𝑖(𝑦𝑗)
Where 𝑧𝑗is an m-dimensional vector of variables that is related to individual j and 𝛼𝑖
is an m-dimensional vector of parameters, so that:
𝛼𝑖𝑧𝑗 = ∑ 𝛼𝑖𝑘𝑧𝑗𝑘
𝑚
𝑘=1
The deterministic utility for the proposed CV scenario is:
𝑣1𝑗(𝑦𝑗 − 𝑡𝑗) = 𝛼1𝑧𝑗 + 𝛽1(𝑦𝑗 − 𝑡𝑗)
Similarly, the status quo scenario is:
𝑣0𝑗(𝑦𝑗) = 𝛼0𝑧𝑗 + 𝛽0𝑦𝑗
The change in the deterministic utility is:
𝑣1𝑗 − 𝑣0𝑗 = ( 𝛼1−𝛼0)𝑧𝑗 + 𝛽1(𝑦𝑗 − 𝑡𝑗) − 𝛽0𝑦𝑗
Further, we can assume a marginal utility of income between the two states in our
study. This may not be true in actual estimation scenarios. Hence, 𝛽1 = 𝛽0, when the
utility difference becomes:
𝑣1𝑗 − 𝑣0𝑗 = 𝛼𝑧𝑗 − 𝛽𝑡𝑗
Where, 𝛼 = 𝛼1 − 𝛼0 and𝛼𝑧𝑗 = ∑ 𝛼𝑘𝑧𝑗𝑘𝑚𝑘=1 . After this specification of the
deterministic component, the probability of responding yes will be
Pr(𝑦𝑒𝑠𝑗) = Pr(𝛼𝑧𝑗 − 𝛽𝑡𝑗 + 𝜀𝑗 > 0)

324
To process the estimation of the parameters of the utility difference, it will be
necessary to specify the nature of the random terms. The assumption that the 𝜀𝑗 is IID
with mean zero permits normal and logistic distributions to be the most widely used
symmetric distributions.

Parameters VIF
VIF
SQRT Tolerance
R-
squared
WTP 1.3 1.14 0.7703 0.2297
Bid Value 1.17 1.08 0.8523 0.1477
Health Impact 2.52 1.59 0.3971 0.6029
Education 8.39 2.9 0.1192 0.8808
Health Impact *Education 10.34 3.22 0.0967 0.9033
Climate Change Impact 7.94 2.82 0.126 0.874
Subsidy Knowhow 7.32 2.7 0.1367 0.8633
Firewood Quantity 2.77 1.67 0.3605 0.6395
Subsidy Knowhow * Firewood Quantity 9.21 3.03 0.1086 0.8914
Climate Change Impact * Firewood Quantity 9.89 3.14 0.1012 0.8988
Collateral 2.27 1.51 0.4401 0.5599
Female 4.29 2.07 0.2333 0.7677
Female * Collateral 5.43 2.33 0.1842 0.8158
Ready Save 1.75 1.32 0.5717 0.4283
Household Income 1.2 1.1 0.832 0.168
Mean VIF 5.05
Appendix 12: Collinearity Diagnostics

Appendix 13 Probability with Increase in Educational Qualification
for Respondents with and without Knowledge about Health
Impacts

Appendix 14 Probability for Male and Female Respondents with
Different Attitude towards Mortgaging Property

Appendix 15 Probability with Increase in Firewood Consumption for
Respondents with and without knowledge about the Climate
Change Impact

Appendix 16 Probability with the Increase in Firewood for
Respondents with and without the Knowledge about the
Government Subsidy

WTP Model 4 Model 5
Coef./SE Coef./SE
Bid Value (Ln) -2.935*** -1.682***
(0.308) (0.474)
Health Impact 1.630*** 4.133***
(0.408) (1.221)
Climate Change Impact 0.110*
(0.062)
Subsidy Knowhow -0.125* 1.286***
(0.065) (0.356)
Firewood Quantity -1.906***
(0.515)
Education 1.722*** 0.503***
(0.502) (0.175)
Health Impact * Education 0.079* -0.554***
(0.048) (0.180)
Subsidy Knowhow * Firewood Quantity -0.172***
(0.062)
Climate Change Impact * Firewood
Quantity 0.146**
(0.062)
Household Income (Divided by 100000) 0.061 0.148*
(0.039) (0.081)
Constant 28.807*** 12.102**
(3.196) (4.977)
LR χ2 154.362 54.229
Simulated LLfit -385.793 -128.663
BIC 842.342 295.24
Number of Observations 700 225
Appendix 17 Model with and without Willingness to Take out Credit

WTP 2 Model 8 Model 9
Coef./SE Coef./SE
Environmental Income Value (Multiplied by 1000) 0.169***
(0.042)
Regular Savings 1.632*** 0.601**
(0.283) (0.286)
Buffaloes 0.543***
(0.164)
Firewood Quantity 0.059** 0.035
(0.026) (0.032)
Buffaloes * Firewood Quantity -0.050**
(0.019)
Constant -1.136*** -2.060***
(0.363) (0.353)
WTP 1
Bid Value (Multiplied by 1000) -0.056*** 0.054***
(0.005) (0.005)
Health Impact 0.882*** -1.097***
(0.224) (0.227)
Climate Change Impact -0.966*** 0.927***
(0.293) (0.299)
Subsidy Knowhow 1.115*** -0.869***
(0.280) (0.296)
Firewood Quantity 0.065** -0.049*
(0.027) (0.027)
Collateral -0.095 0.003
(0.203) (0.209)
Regular Savings 1.078*** -0.897***
(0.252) (0.255)
Education 0.091*** -0.108***
(0.033) (0.033)
Health Impact * Education -0.101*** 0.118***
(0.035) (0.035)
Female -0.203 0.24
(0.199) (0.204)
Female * Collateral -0.408* -0.528**
(0.231) (0.238)
Climate Change Impact * Firewood Quantity 0.076** -0.070**
(0.036) (0.036)
Subsidy Knowhow * Firewood Quantity -0.110*** 0.076**
(0.035) (0.037)
Household Income (Divided by 100000) 0.036 -0.03
(0.023) (0.023)
Constant -0.023 0.313
(0.386) (0.392)
Appendix 18 Heckman’s Selection Model Parameter Estimates

332
Rho (ρ) 1.098*** 0.506*
(0.265) (0.295)
LR χ2 37.235 49.039
Simulated LLfit -505.4861 -586.0438
BIC 1136.88 1317.86
Number of Observations 755 755
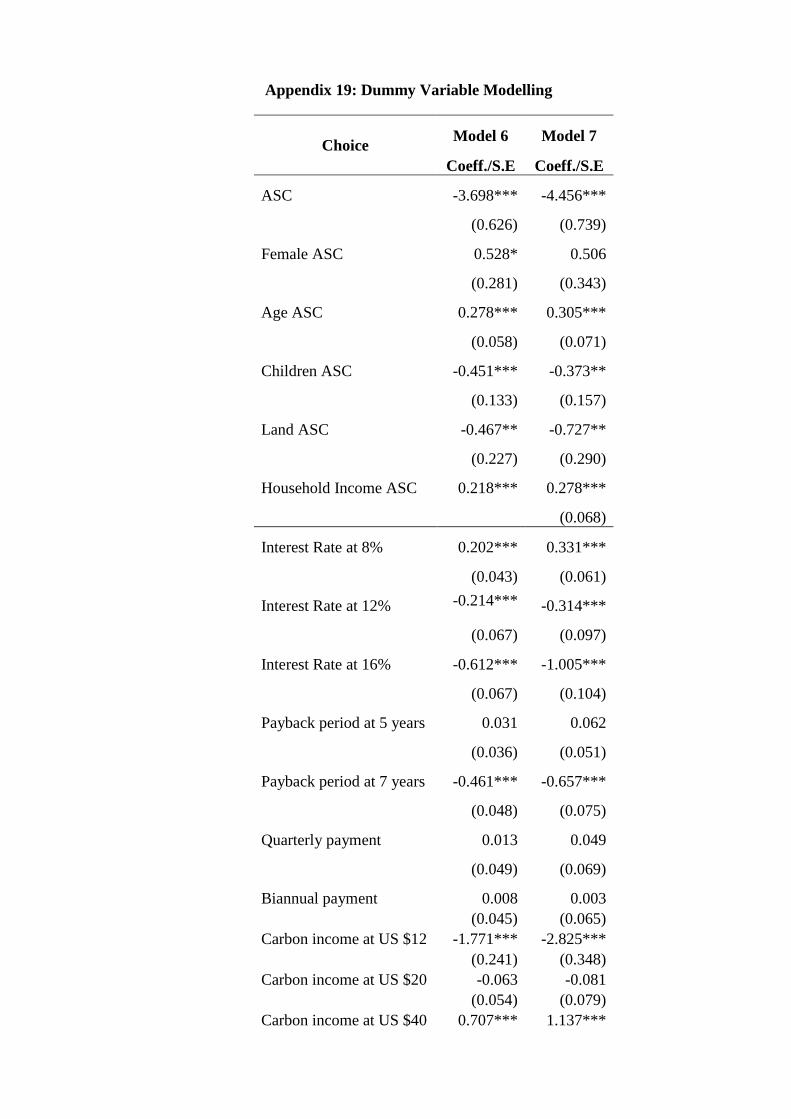
Choice Model 6 Model 7
Coeff./S.E Coeff./S.E
ASC -3.698*** -4.456***
(0.626) (0.739)
Female ASC 0.528* 0.506
(0.281) (0.343)
Age ASC 0.278*** 0.305***
(0.058) (0.071)
Children ASC -0.451*** -0.373**
(0.133) (0.157)
Land ASC -0.467** -0.727**
(0.227) (0.290)
Household Income ASC 0.218*** 0.278***
(0.068)
Interest Rate at 8% 0.202*** 0.331***
(0.043) (0.061)
Interest Rate at 12% -0.214*** -0.314***
(0.067) (0.097)
Interest Rate at 16% -0.612*** -1.005***
(0.067) (0.104)
Payback period at 5 years 0.031 0.062
(0.036) (0.051)
Payback period at 7 years -0.461*** -0.657***
(0.048) (0.075)
Quarterly payment 0.013 0.049
(0.049) (0.069)
Biannual payment 0.008 0.003
(0.045) (0.065)
Carbon income at US $12 -1.771*** -2.825***
(0.241) (0.348)
Carbon income at US $20 -0.063 -0.081
(0.054) (0.079)
Carbon income at US $40 0.707*** 1.137***
Appendix 19: Dummy Variable Modelling

334
(0.095) (0.143)
Carbon income at US $60 0.966*** 1.568***
(0.107) (0.171)
Carbon income at US $72 1.338*** 2.113***
(0.193) (0.276)
SD
Interest Rate at 8% -0.332***
(0.126)
Interest Rate at 12% -0.385**
(0.166)
Interest Rate at 16% 0.711***
(0.104)
Payback period at 5 years -0.015
(0.095)
Payback period at 7 years -0.579***
(0.114)
Quarterly payment 0.398***
(0.108)
Biannual payment 0.513***
(0.080)
Carbon income at US $12 -0.335*
(0.192)
Carbon income at US $20 -0.205
(0.192)
Carbon income at US $40 0.766***
(0.118)
Carbon income at US $60 1.172***
(0.121)
Carbon income at US $72 0.410***
(0.152)
LRχ2 3107.023 187.799
Simulated LLfit -2888.1781 -2794.2786
BIC 5946 5871
Number of Observations 12129 12129