Share, Celebrate, Grow
40
Share, Celebrate, Grow VCSE STATE OF THE SECTOR REPORT 2016
Transcript of Share, Celebrate, Grow

Share, Celebrate, Grow VCSE STATE OF THE SECTOR REPORT 2016
1
Contents
Executive Summary ........................................................................................................................................................... 3
Why a Somerset State of the Sector Survey? ................................................................................................................... 4
Summary of other relevant research ................................................................................................................................ 5
The NCVO Almanac 2016 .......................................................................................................................................... 5
Somerset Community Foundation ‘Vital Signs Survey’ 2016 .................................................................................... 5
State of the Sector Survey 2016: Summary of key findings .............................................................................................. 6
A diverse sector – with gaps ..................................................................................................................................... 6
Rich in optimism and in commitment to meeting needs… ....................................................................................... 6
…but many on a ‘sustainability knife-edge’ .............................................................................................................. 6
Funders’ priorities are proving counter-productive ................................................................................................. 6
Organisation structures and reach ................................................................................................................................... 8
Size of organisation ................................................................................................................................................... 8
Geographical coverage.............................................................................................................................................. 9
Local reach ................................................................................................................................................................ 9
Distribution of responding organisations by district .............................................................................................. 10
Workforce: 2014-15 and 2015-16 .................................................................................................................................. 11
Estimated hours worked by volunteers in an average week .................................................................................. 12
Partnership working ........................................................................................................................................................ 12
The nature of partnerships ..................................................................................................................................... 12
Reasons for working with partners ......................................................................................................................... 13
Potential for future partnerships ............................................................................................................................ 14
Reasons for considering partnership working in future ......................................................................................... 14
Services provided ............................................................................................................................................................ 15
Who uses the services? ................................................................................................................................................... 17
Who is missing out? ........................................................................................................................................................ 19
Has the volume of demand for services changed? ......................................................................................................... 20
Has the complexity of issues changed? .......................................................................................................................... 21
Resources and Sustainability .......................................................................................................................................... 23
Expected income for 2016-17 as compared to the previous year .......................................................................... 23
In the current financial year is expenditure likely to exceed income? ................................................................... 24

2
Has availability of funding for organisations changed in the past three years? ..................................................... 25
Are there are plans to increase or reduce the number / level of services provided in the coming year? ............. 26
What are the three areas that organisations find it hardest to raise funds for?.................................................... 28
What 4 main challenges are respondents likely to face in the next 2 years? ......................................................... 29
For which 4 areas are respondents most likely to want training or support? ........................................................ 31
What areas of support do respondents need in order to develop work with volunteers? .................................... 32
Conclusions ..................................................................................................................................................................... 33
Considerations for Local Strategic decision makers and funders ........................................................................... 33
Considerations for the VCSE sector ........................................................................................................................ 33
Appendix A: Gaps in services. Summary of comments ................................................................................................... 34
Appendix B: Has the volume of demand changed? Summary of comments ................................................................ 36
Appendix C: Has the complexity of issues changed? Summary of comments............................................................... 38

3
Executive Summary
This report is the first in-depth review of the state of the VCSE sector. It is an opportunity to celebrate the great
work being undertaken by so many organisations from large to ‘micro’ across the County but also to explore the
key issues facing these organisations. What we have found is a sector under pressure caught between reducing
resources and growing needs for their services. Two thirds of the respondents were ‘micro’ or small organisations but
pressures were described by organisations of every size and capacity.
Key findings include the fact that many organisations have no full-time staff, often with only part-time staff and many
others relying entirely on volunteers. Many organisations described a picture of reduced funding over a number of
years and a situation of chronic financial insecurity caused by a combination of ‘contract culture’, the difficulty of
obtaining funding for core costs and the interminable quest for project funding and grants. The constant necessity to
raise pockets of project funding reduces the time spent on the core aims of many organisations. The time and
resources needed to write funding bids and report to funders is often disproportionate and detrimental to the overall
service and makes real strategic planning for many organisations impossible. Several organisations mentioned having
to use reserves to plug gaps in funding.
Key areas for which organisations are finding it difficult to raise funds are: staff salaries, core costs and replacing IT
and essential equipment. Organisations highlighted a number of challenges they were likely to face in the next four
years, the top ones being: organisational development/managing their organisation, demonstrating impact, recruiting
volunteers and influencing public policy. A majority of organisations are reporting increased demand for their services
year on year at the same time as a significant increase in the complexity of issues faced by clients. Organisations
mentioned a need for more support for young people, people experiencing mental health issues and autism, people
who are economically disadvantaged and people experiencing social isolation and loneliness.
There is, however, also what might be described as ‘optimistic determination’ with many organisations planning to
deliver more services next year, many already working in partnerships and more planning to explore this option. A few
organisations have reviewed and changed their organisational form and are exploring social enterprise models of
delivery and new forms of fundraising.
In the conclusion we list a number of issues for all sectors to consider. For the VCSE sector there is an opportunity to
build on the partnerships and collaboration already taking place and to learn from those organisations leading the
way. There is also a sector-wide need for support with fundraising capacity and skills, volunteer recruitment and
workforce development, marketing and communication. New collaborations with business and the developing social
enterprise market offer opportunities to access skills, support and potentially new sources of unrestricted funds. For
funders there is a need to look critically at the issues of core funding and the continual pressure for small groups to
continually innovate at the expense of building on existing solid work already recognised as making a difference. For
local commissioners and funders there is a need to review the role of grant-making alongside commissioned work and
to consider the proportionate monitoring and evaluation requirements. There is also the need to evaluate the impact
on the public sector locally if the VCSE is unable to provide complementary services as they have done in the past.
Researcher and Author: Brenda Weston
Acknowledgements: Liz Simmons (VCSE Strategic Advisor), Community Council for Somerset, Engage, Spark, Somerset
Community Foundation and Somerset County Council

4
Why a Somerset State of the Sector Survey?
In 2016 there were 2803 charities registered with the Charity Commission as active in Somerset. Whilst a majority are
Somerset-based and focused there are others that have a much broader sphere of activity spreading beyond the
county boundary. Many charities have more than one legal status (such as Registered Charity as well as Company
Limited by Guarantee). There is also an unknown – possibly unknowable - number of informal, unregistered, active
voluntary groups across the county that perform an essential role in strengthening their communities and enriching
individual lives.
This survey is a response to cross-sector interest in having this kind of work undertaken on a county-wide scale. It is
intended to:
Develop a better understanding of the VCSE sector which can be refreshed over time
Provide accurate intelligence to partner organisations and commissioners
Gain a better understanding of how best to support existing organisations and new groups
Inform the development of targeted services, for example assisting small community groups with funding
applications, and larger groups requiring help with commissioning and procurement
Support the “Tackling Loneliness in Somerset” and “Stronger Communities” initiatives
Early desk research showed that similar work is undertaken in a number of other parts of the country on a more or
less regular basis, with a great deal of consistency in the data collected. The Somerset survey benefited from a review
of some of this work, incorporating questions that were considered relevant to Somerset. Amendments were made
as a result of consultations and a limited piloting exercise.
Other, relevant research carried out during 2016 includes that undertaken by the NCVO for its 2016 Almanac, and in
Somerset the ‘Vital Signs’ research and subsequent report by the Somerset Community Foundation. These are briefly
summarised below. A report of an England-wide survey published in late 2016 by the organisation ‘Localgiving’
summarised results from a survey to which 598 VCSE groups and organisations had contributed. There was a
remarkable consistency between the Somerset survey and results and this national survey.1
This report is the outcome of 130 survey responses. In the main, the survey used multiple- choice questions, inviting
respondents to add comments if they wished to expand on their answers, or describe alternatives that did not fit the
options provided. A number of questions asked respondents to ‘tick all that apply’ where multiple answers were
anticipated. The diverse nature of participating organisations resulted in variations in the numbers of organisations
responding to each questions. In some cases the information was not available to them and in others it was not
relevant.
1 Local Charity and Community Group Sustainability Report, 2016, Localgiving.
https://localgiving.org/reports/Local_Charity_Community_Group_Sustainability_Report_2016.pdf
5
Summary of other relevant research
The NCVO Almanac 2016
NCVO Almanac 2016 Executive Summary concluded that during 2015-16:
“Smaller charities did not fare as well as large. The three smaller income bands experienced decreases
in overall income and were less financially secure… This year’s data shows that around one-third of
charities with an annual income of less than £1m report having no reserves at all, making them
especially vulnerable to external shocks.”
The summary also highlights that charities are spending more money on generating funds.
They found that in 2013/14 “85% of the voluntary sector’s total spending went towards achieving its
charitable aims… In order to maximise the amount of money available for their charitable activities,
charities need to spend money in order to generate further funds. Voluntary organisations spent £5.4bn
on generating funds in 2013/14 and for every £1 spent, £4.20 was generated in return.”
Our survey found that all but one of the participating organisations came within the three smaller income bands.
Somerset Community Foundation ‘Vital Signs Survey’ 2016
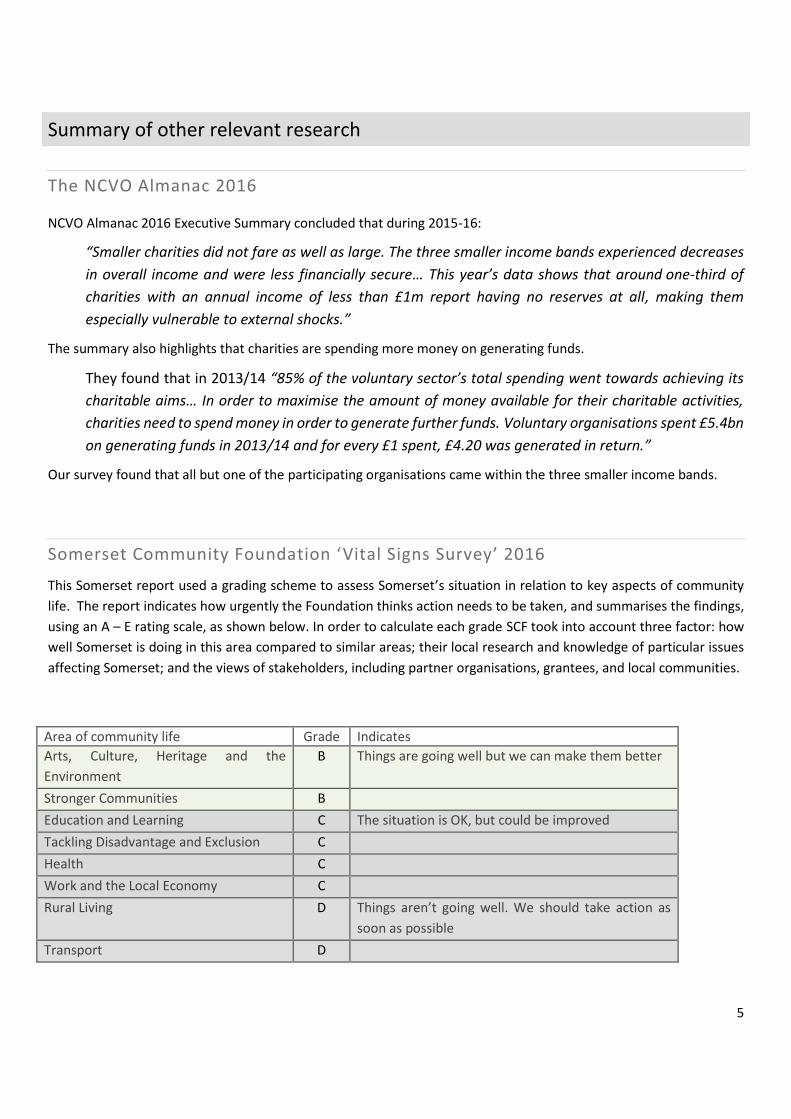
This Somerset report used a grading scheme to assess Somerset’s situation in relation to key aspects of community
life. The report indicates how urgently the Foundation thinks action needs to be taken, and summarises the findings,
using an A – E rating scale, as shown below. In order to calculate each grade SCF took into account three factor: how
well Somerset is doing in this area compared to similar areas; their local research and knowledge of particular issues
affecting Somerset; and the views of stakeholders, including partner organisations, grantees, and local communities.
Area of community life Grade Indicates
Arts, Culture, Heritage and the
Environment
B Things are going well but we can make them better
Stronger Communities B
Education and Learning C The situation is OK, but could be improved
Tackling Disadvantage and Exclusion C
Health C
Work and the Local Economy C
Rural Living D Things aren’t going well. We should take action as
soon as possible
Transport D

6
State of the Sector Survey 2016: Summary of key findings
A diverse sector – with gaps
Districts were fairly evenly represented in the survey, but with 6.5% of Somerset’s population, West Somerset showed
the highest ‘per head’ level of voluntary activity and Sedgemoor had the lowest
130 organisations, with a diverse range of charitable purposes, contributed to the survey
68% of these are ‘micro’ and ‘small’ organisations
47% of respondents (the largest category) provide social, recreation and leisure services; by contrast 0.9% and 1.8%
respectively provide immigration and child care services
75% are wholly Somerset focused; 25% have a wider geographical reach
Gaps: Young people, people with mental health problems, and those on low incomes were identified as groups for
whom services are currently inadequate
Rich in optimism and in commitment to meeting needs…
19% expected the current year’s income to exceed that of the previous year, 46% expected it to be about the same
48% plan to maintain their level of services in the coming year while 35% plan to increase their level of services
61% are currently working in partnership with other organisations, and more plan to do so. Key reasons - alongside
improving services - include cost savings, efficiencies and increasing funding opportunities
…but many on a ‘sustainability knife-edge’
59% said the volume of demand for their services has increased,
42% said the complexity of issues faced by clients has increased and 39% said it had stayed the same
76% expect their income to remain ‘about the same’ or to decrease during 2016-17
43% expect to break even financially during the current year, 25% expect their outgoings to exceed their income
52% said the availability of funding has decreased over the past three years,
65% said that ‘funding and sustainability’ are priority areas for training and support
Parish and town councils are key to the sustainability of many local community groups and charities
Funders’ priorities are proving counter-productive
Core running costs are the most difficult to raise - severely limiting fund-raising capacity. 61% put salaries at the top
of the list of funding-raising challenges
78% put funding and sustainability at the top of 4 main challenges facing them in the next 2 years;
65% (84) of organisations have no paid full-time workers, 24 of these have 1 or 2 part-time workers
32% of all respondents are operating with no paid staff at all

7

8
Somerset State of the Sector 2016 Survey Results
Organisation structures and reach
All participating organisations responded to this question and all but 4 were able to supply details of the legal status
of their organisation. They were asked to tick as many options as applied, and to describe their status if none of the
options were appropriate.
Seventeen organisations provided ‘other’ information. Some were uncertain how to describe their status and one was
Parish Council. With the exception of three that were in the process of registering their organisations, two as
Community Interest Organisations and one not yet determined, most comments expanded on the answers already
given.
Size of organisation
VCSE organisations are categorised according to their annual income, which is perhaps a reasonable indicator of
financial resilience. The five categories are: micro; small; medium; large; and major. The survey asked “What was your
organisation's total income / category for the financial year 2015-16?” Responses showed that over two thirds of
respondents were ‘small’ or ‘micro’ organisations.
Small (£10 - £100k) 41 (37.3%)
Medium (£100k -£1m) 35 (31.8%)
Micro (less than £10 k) 33 (30%)
Large (£1-10mm plus) 1 (0.9%)
Registered charity 62
Co. Ltd by guarantee 26
Other 17
Unincor'ptd ass'n 15
CIC 10
Informal group 9
Community Interest Co 7
Charitable trust 6
N/K 4Community
benefit soc. 6 Cooperative 2

9
Geographical coverage
Charities listed by the Charity Commission as operating in Somerset vary widely in terms of their scale and reach,
ranging from national and regional to neighbourhood and sub-district geographical areas. The survey aimed to profile
respondents’ geographical reach, and findings showed that 96 (75%) of those that responded to this question were
wholly Somerset-focused while 32 (25%) were part of a regionally- or nationally-based organisation.
Local reach
The survey asked in which district council area/s responding organisations were operating as an indicator of any
significant disparities in terms of VCSE activity. For reference the table beneath shows Somerset’s population
distribution by District Council area and by age groups. (Source Somerset Intelligence Website: 2011 Census).
District 0-15 yrs 16-64 yrs 65+ yrs Pop. Total % of pop total
S Somerset 28618 99834 34825 163277 30.4%
Sedgemoor 20666 71973 23465 116104 21.6%
Taunton Deane 20078 69677 22012 111767 20.8%
Mendip 20397 69185 21278 110860 20.6%
West Somerset 4831 20130 10080 35041 6.5%
Age group totals 94590 330799 111660 537049 99.9%

10
Distribution of responding organisations by district
Respondents were also asked whether their organisation’s activities were focused on geographical communities
within specific sub-district areas or neighbourhoods in their District Council area. The figures indicate the number of
organisation covering the sub-area named. A number of these ‘sub-areas’ (mostly small towns) have multiple
organisations operating within them.
West Somerset
13
Taunton Deane 10
Mendip 7
South Somerset 7
Sedgemoor 3

11
Workforce: 2014-15 and 2015-16
The survey sought to compare the size and make-up of the respondents’ Somerset-based workforce over a 2-year
period. The figures for 2014-15 represent 4 fewer responses (125) than for 2015/16 (129), which makes direct
comparison difficult. Significant numbers of responding organisations had part-time but no full-time staff, and others
were operating with volunteers and no paid staff at all. A small number did not have volunteers, and some had neither
paid staff nor any form of management body.
Workforce totals 2014/15 2015/16
Number of responses 125 129
Total full time 273 346
Total part time 583 619
Total Trustees/Management Committee 698 737
Volunteers 5,578 5701
Full time workers:
In 2015/16 84 (65%) of organisations have no full time workers. The remaining 45 have at least one. 31 (24%) have
5 or fewer full-time workers.
In 2014/15 81 (65%) had no full time workers. 33 (26%) had 5 or fewer.
Part-time workers:
In 2015/16 43 (33%) organisations had no part-time workers and 18 (14%) had just 1. 38 (29%) organisations had
5 or fewer.
In 2014/15 45 (36%) organisations had no part-time workers and 22 (18%) organisations had 1. 38 (30%)
organisations have 5 or fewer.
Volunteers:
In 2015/16 19 (15%) organisations had no volunteers. 38 (29%) had 10 or fewer; 40 (31%) had between 11 and 30.
At the high end 7 (5%) had more than 100 volunteers.
In 2014/15 21 (17%) organisations had no volunteers and 31 (25%) had 10 or fewer. 42 (34%) had between 11 and
30. 7 (6%) had more than 100.
Trustees/Management Committee members:
In 2015/16 25 (19%) organisations had no Trustees or management committee members. 35 (27%) had 5 or fewer;
57 (44%) had between 6 and 10; 12 (9%) had between 11 and 21.
In 2014/15 28 (22%) organisations had no Trustees or management committees. 29 (23%) had 5 or fewer; 55 (44%)
had between 6 and 10; 13 (10%) had between 11 and 21

12
Estimated hours worked by volunteers in an average week
Of the 99 responses to this question 81 provided the calculated weekly number of volunteer hours, which totalled
5739 hours per week. This averages out at 58 hours per week per organisation. Clearly this average spans wide
variations in the numbers of voluntary hours worked within each organisation. One example estimated voluntary
input in term of its financial value: “We currently capture around 50-60% of volunteer hours. Each month the 50-60%
equates to approximately £28,000 at minimum wage.”
Partnership working
Respondents were asked “Do you currently deliver services in partnership with other organisations?” The 127
responses showed that 78 organisations (61%) are currently working in partnership while 50 (39%) are not.
Supplementary questions explored the nature of and reasons for partnership working, as well as future plans in this
regard.
The nature of partnerships
Multiple options allowed. The 78 who said they are working with partner organisations were asked to describe the
nature of their partnerships. They were able to tick as many options as applied.
Summary of comments
The additional comments indicated that some organisations with similar or complementary aims and purposes work
together informally as well as formally, sharing resources. Examples include organisations cooperating to promote and
support community and environmental enhancements.
“AONB, Transition groups, Alcombe Food Cupboard, Somerset Beekeepers, Friends of the Quantocks,
Forum 21”
Serving the same client group(s) 50
(64%)
Working in the same localities 47
(60%)Providing similar services 32 (41%)
Providing complementary
services 47 (60%)
Other 10 (13%)
13
“We offer our venue to local charities and educational organisations to present their own events, eg.
school plays, speech days.”
One organisation has a transnational partnership with an organisation that provides education to 360,000 child
beneficiaries. Another works on a sub-contracted basis supplying expertise that the partner needs in order to deliver
specific elements of a contract. Others work with statutory bodies and businesses.
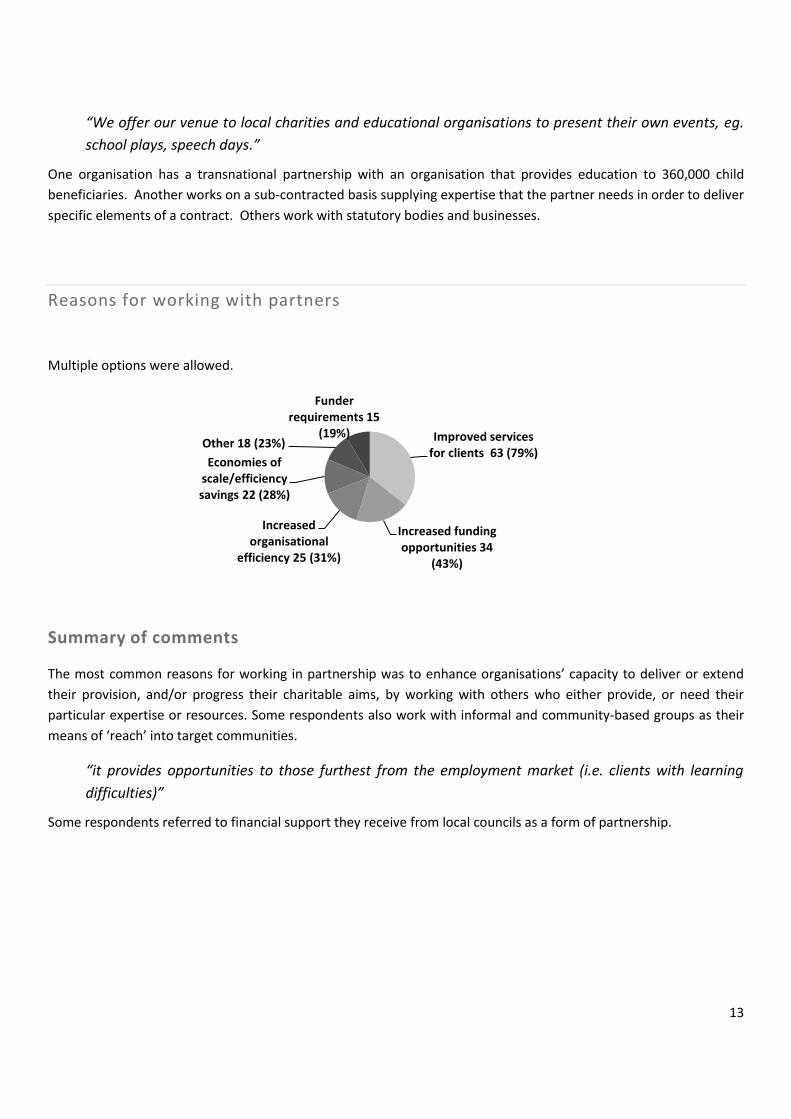
Reasons for working with partners
Multiple options were allowed.
Summary of comments
The most common reasons for working in partnership was to enhance organisations’ capacity to deliver or extend
their provision, and/or progress their charitable aims, by working with others who either provide, or need their
particular expertise or resources. Some respondents also work with informal and community-based groups as their
means of ‘reach’ into target communities.
“it provides opportunities to those furthest from the employment market (i.e. clients with learning
difficulties)”
Some respondents referred to financial support they receive from local councils as a form of partnership.
Improved services for clients 63 (79%)
Increased funding opportunities 34
(43%)
Increased organisational
efficiency 25 (31%)
Economies of scale/efficiency savings 22 (28%)
Other 18 (23%)
Funder requirements 15
(19%)

14
Potential for future partnerships
Those who do not currently work with partners were asked about any future plans to do so. Of 58 responses, 17 (29%)
said they do have plans, 15 (26%) do not, and the 26 (45%) were unsure.
Most who expanded on their answers were open to the possibility of partnership working in the future if the
opportunity should arise, and they were compatible, for example, in terms of ethos. Some said that the nature of their
organisation did not lend itself to formal partnerships, although informal collaboration was already happening in some
cases.
Reasons for considering partnership working in future
Multiple responses were allowed for this question. The reasons given in 57 responses broadly echoed those
highlighted by organisations already working with others, for example, access to a wider pool of human resources,
skills, and premises which would help towards achieving shared objectives.
Improved services for
clients 41 (72%)
Increased funding 34
(60%)
Efficiency savings to offset
decreasing funding 19
(33%)
Increased efficiency 17
(30%)
Funder requirements 10
(14%)
Other 9 (%)
15
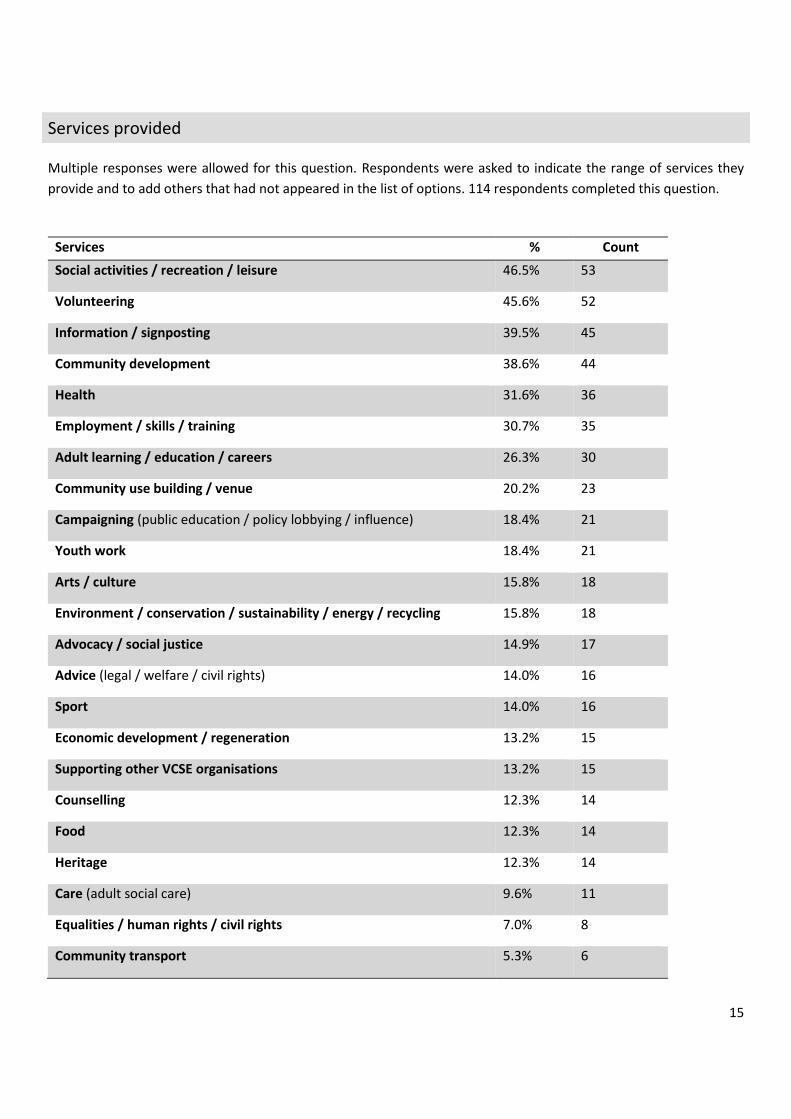
Services provided
Multiple responses were allowed for this question. Respondents were asked to indicate the range of services they
provide and to add others that had not appeared in the list of options. 114 respondents completed this question.
Services % Count
Social activities / recreation / leisure 46.5% 53
Volunteering 45.6% 52
Information / signposting 39.5% 45
Community development 38.6% 44
Health 31.6% 36
Employment / skills / training 30.7% 35
Adult learning / education / careers 26.3% 30
Community use building / venue 20.2% 23
Campaigning (public education / policy lobbying / influence) 18.4% 21
Youth work 18.4% 21
Arts / culture 15.8% 18
Environment / conservation / sustainability / energy / recycling 15.8% 18
Advocacy / social justice 14.9% 17
Advice (legal / welfare / civil rights) 14.0% 16
Sport 14.0% 16
Economic development / regeneration 13.2% 15
Supporting other VCSE organisations 13.2% 15
Counselling 12.3% 14
Food 12.3% 14
Heritage 12.3% 14
Care (adult social care) 9.6% 11
Equalities / human rights / civil rights 7.0% 8
Community transport 5.3% 6

16
Accommodation / housing / homelessness 4.4% 5
Addiction / substance use / recovery 4.4% 5
Animal welfare / wildlife 4.4% 5
Community safety / criminal justice 4.4% 5
Child care 1.8% 2
Immigration 0.9% 1
Summary of comments
Financial advice and services were mentioned by three respondents. Also among the additional services were forms
of ‘wellbeing’ support, including that provided to people experiencing loneliness and isolation, as well as “acute
distress”.
Organisations that are responsible for community use buildings are providing invaluable ‘hubs’, with facilities that play
an important part in enhancing health and wellbeing, and tackling social isolation, particularly in rural communities.
Similarly, those providing transport are performing a crucial service to those able to use it.
“the amelioration of loneliness and isolation; welfare and wellbeing of isolated rural senior villagers”
A community theatre provides opportunities for young people to enhance their career prospects, and older people to
volunteer and socialise:
“Many young people come into the theatre to perform, but others also come to learn about the
technical side. Many of these have used this experience when seeking a career. Our theatre also offers
valuable networks for retired people to meet and work together as well as enjoying themselves.”

17
Who uses the services?
Multiple options were allowed. Respondents were asked to identify their client groups from a list of possible
beneficiaries, and to add any others not included. Based on the 105 responses a large proportion of organisations
provide services to a varied cross-section of their local communities.
Options Response
People with mental health conditions 72
Young people 69
Physically disabled people 67
People with learning disabilities/difficulties 66
Families / parents 65
Socially excluded / vulnerable people 63
Carers 59
Unemployed people 52
Deaf and hearing impaired people 49
People with Autism 49
Black, Asian & Minority Ethnic groups, including gypsy, traveller, Roma/Irish 43
Visually impaired people 39
LGBT people 36
Prisoners / ex-offenders / people at risk of offending / criminal justice issues 31
Substance users 29
Victims of crime / anti-social behaviour 29
Faith or belief communities 28
Homeless people 27
Refugees /asylum seekers 17
Older people 17
Animals/wildlife 9

18
Summary of comments
A number of respondents commented to the effect that they are “inclusive” or “do not discriminate” against anyone.
Whilst this is an important commitment, it cannot be taken as an indication that all such organisations are able to
meet all specific needs.
Other user groups for whom respondents provide services are:
People with acquired brain injury
Adults who are lonely and/or isolated
People who are housebound or their carers
Bereaved parents
Children under 5 and their families
People with Motor Neurone Disease
People needing transport for medical, social, education, family, shopping etc reasons
Children with Special Educational Needs
Among the responding organisations were voluntary sector infrastructure organisations, parish councils, and
organisations that do not provide directly.

19
Who is missing out?
Multiple options were allowed. Contributors were asked “which, if any, groups of people you believe to be
inadequately supported in Somerset”. There were 66 responses, some naming more than one group or area of need.
These were categorised for presentation in table form.
Group/issue identified Frequency
Young people 17
People with mental health issues and autism 16
Economically disadvantaged people 9
People suffering social isolation and loneliness 7
LGBT people 4
Carers/young carers 3
People with learning disabilities/difficulties 3
Elderly and vulnerable/infirm 3
BME people 2
People without their own transport 2
Specialist support for families of children under 5 1
Bereaved parents 1
People with complex multiple needs 1
Private tenants 1
Those living in a rural environment 1
20
Summary of comments
A number of respondents identified specific needs associated with the groups represented. Some are quoted below
and Appendix A provides an expanded record of these responses.
The comments here and in the Appendix support the view that in spite of the range of VCSE services that exist across
Somerset as a whole that are operating on an inclusive basis, there exist gaps in services for some vulnerable groups
with particular needs.
“Cuts in public spending have impacted on the
community support for people living with mental health
issues.”
“Rural low income under-employed”
“Socially isolated men, especially older generation”
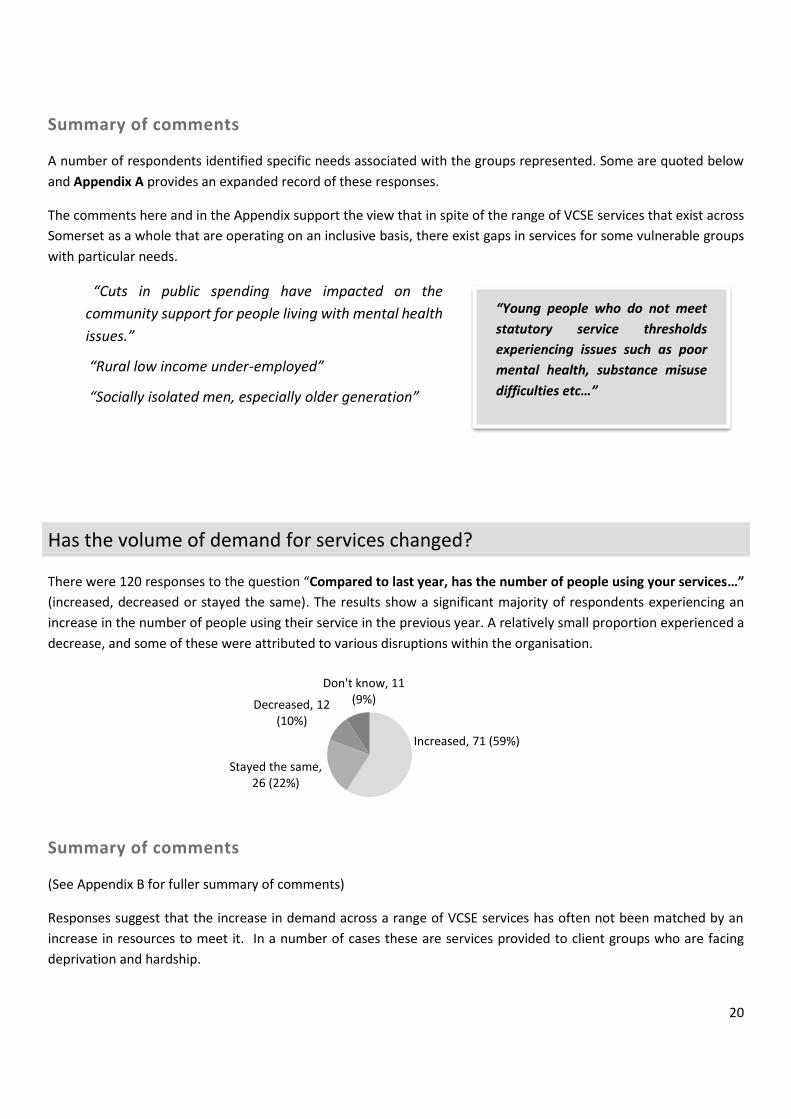
Has the volume of demand for services changed?
There were 120 responses to the question “Compared to last year, has the number of people using your services…”
(increased, decreased or stayed the same). The results show a significant majority of respondents experiencing an
increase in the number of people using their service in the previous year. A relatively small proportion experienced a
decrease, and some of these were attributed to various disruptions within the organisation.
Summary of comments
(See Appendix B for fuller summary of comments)
Responses suggest that the increase in demand across a range of VCSE services has often not been matched by an
increase in resources to meet it. In a number of cases these are services provided to client groups who are facing
deprivation and hardship.
Increased, 71 (59%)
Stayed the same, 26 (22%)
Decreased, 12 (10%)
Don't know, 11 (9%)
“Young people who do not meet
statutory service thresholds
experiencing issues such as poor
mental health, substance misuse
difficulties etc…”

21
For example, demand for Somerset’s independent, free-access advice has risen:
“Social welfare reform has had a great impact on disabled and long term sick - move from DLA to PIP,
pace of change in society is too much for many of our residents”
An organisation that contacts lonely and isolated people to help them reconnect with their community is experiencing:
“a fairly constant steady increase, requiring more paid coordinator resources, more activities, and
therefore more funding”.
Has the complexity of issues changed?
There were 119 responses to the question “Compared with last year, has the complexity of issues faced by your
clients changed?” Again, the most frequent response was “Increased”.
Summary of comments
The additional comments paint a compelling picture of organisations and groups under pressure, sandwiched between
reducing resources and growing needs. (See Appendix C for fuller summary of comments). This pressure cascades
downwards from statutory agencies through established charities to local groups seeking to alleviate a range of needs
in their communities.
“Groups are facing more challenges in terms of funding, demand on their services with limited
resources, legislative challenges, lack of volunteers and trustees.”
“Social welfare reform has had a great impact on disabled and long term sick - move from DLA to PIP,
pace of change in society is too much for many of our residents”
Increased 50 (42%)
Stayed the same 46 (39%)
Don't know 22 (18%)
Decreased 1 (0.8%)

22
“Drug and alcohol issues have increased, plus debt worries”
Some point out that this has been a progressive process over a number of years:
“Actually complexity of clients has been increasing year
on year for a while now”
Volunteers working to support older, isolated people in their
communities are faced with increasing number of mentally
frail individuals and the complexities that this entails.
Also identified were knock-on effects within the sector from VCSE organisations struggling to maintain their level of
service or closing down entirely:
“Fewer community support organisations (which have closed or reduced their contact time) means
more pressure on remaining organisations. Frequent requests for help from outside our client group.”
“With increasing thresholds and
waiting list for e.g. CAHMS and
Talking Therapies, we are now
working with people with far more
complex, sometimes severe and
enduring support needs.”

23
Resources and Sustainability
The final group of questions looked at Somerset VCSE sector’s income and sustainability as reflected in this sample of
organisations. As we saw earlier, based on income, over two thirds of the respondents were categorised as ‘small’ or
‘micro’ organisations, 31% were medium-sized and one was large.
Expected income for 2016-17 as compared to the previous year
Respondents were asked about their expectations regarding income up to the 2017 financial year as compared with
2015-16. There were 112 responses.
Summary of comments
For many who are familiar with the voluntary and community sector, the picture painted through the comments that
followed this question - of a range of organisations on knife-edge - will come as no great surprise. It is painted against
a background in which local government, and other statutory bodies concerned with social welfare, have endured an
unprecedented financial squeeze for a prolonged period. There is some evidence that Town and Parish councils are
stepping up to support local groups in these difficult times, and perhaps for some of the rural charities there will be
cause for optimism if this should become a trend.
“Youth Group is entirely grant funded, including generous grants from the two Parish Councils”
It can be argued, however, that many of the pressures which undermine VCSE organisations’ capacity to respond to
increasingly complex needs, and deliver more and better services, arise for the chronic financial insecurity imposed by
the ‘contract culture’, the withdrawal of core funding and the interminable quest for project funding and grants.
The constant necessity to raise pockets of project funding and eke out enough to cover core functions often results in
a patchwork of activity related to, but not always directly delivering on the central aims of the organisation. In addition
the time and resources needed to provide reports to funders is often hugely disproportionate, detrimental to the
overall service by making strategic planning near to impossible.
“Using all our reserves to continue this year as we have lost our major funder.”
About the same52 (46%)
Less31 (28%)
More21 (19%)
Don't know8 (7%)

24
The last of these quotes comes from an organisation
operating in Somerset’s most remote rural areas where
children and families can often experience acute problems
in accessing services.
In the current financial year is expenditure likely to exceed income?
There were 112 responses to this question.
Summary of comments
The comments indicate fairly high levels of uncertainty regarding future cost increases – against a background of
reduced income - and in respect of organisations’ ability to meet these whilst maintaining current levels of service.
Some are clearly in difficulties with reserves diminishing or used up.
“We have used our reserves to develop new services in order to meet demand and to promote relationships with the
Health service and CCG”
A number of organisations were clear that they would not allow their expenditure to exceed their income and are
budgeting accordingly. However this does have a limiting impact on the ability to forward plan for the less affluent.
“Only exceed by a very small margin!!”
“We try to raise enough money to cover expenditure - not guaranteed”
No, our income is likely to match
our expenditure48 (43%)
Yes, our expenditure is
likely to exceed our income
28 (25%)
No, our income is likely to exceed our expenditure
22 (20%)
Not known14 (12%)
“It is harder to secure small grants as there are
so many applicants, funders’ demands for
reporting on outcomes and impact is not
proportionate to grant…”

25
Some organisations are working to secure specific capital projects for the public benefit. Others expect spending to
exceed income for various reasons, and with a range of potential consequences.
“Currently we have an overspend and will be considering
redundancies to balance the books by March if we cannot
secure an additional £9K before December.”
“the provision will not be funded due to council cuts”
“Cost of transport will increase”
“We are all volunteers. Our expenses are kept to the minimum,
but it is the utilities that put us under pressure with high prices
in comparison to other countries.”
Has availability of funding for organisations changed in the past three years?
There were 111 responses to this question, with over half identifying a decrease.
Summary of comments
The comments describe a situation in which the amounts and sources of funding for a wide and important range of
voluntary services are diminishing as government spending cuts cascade down to the agencies that have
supplemented and supported the work of statutory services. At a time of increasing levels of social and financial
deprivation this is clearly not a happy picture.
Decisions made by and structural changes to local statutory authorities are also having an impact, in some cases
hindering progress towards social, health and well-being goals.
“Cuts to Service Level Agreements have affected our income, plus less donations, perhaps due to
continuing recessionary times.”
“Local Sustainable Transport Fund cuts by the Govt has reduced our chances of central funding …”
Increased11 (10%)
Decreased58 (52%)
Stayed the same
26 (23%)
Don't know16 (15%)
“No free reserves left so we
have to stick totally to
agreed budget.”

26
“Tendering of advocacy services has squeezed out local and specialist advocacy providers”
“Our major grant which covered staffing from the NHS has been withdrawn and also additional funding
from County”
Long- established independent advice agencies are experiencing increasing year-on-year uncertainty, with some major
funders indicating that they do not see advice services as a priority.
“Next year we are facing a crisis in funding and Trustees fear that the service may not survive without
drastic action.”
A number of comments point to an acute capacity issue
arising from a widespread, chronic state of financial
insecurity, necessitating time- and labour-intensive project
funding bids.
“It is our capacity to fundraise that fluctuates”
Others referred to a diminishing funding ‘pot’ for which there
is increasing competition
“Everyone is after the same money and funders seem to be cutting down”
Some had more positive experiences, and their income had increased for reasons that included fund-raising initiatives
for specific goals, and increased use of amenities. One had benefited from changing its status from a charity to a CIC
which “opened more avenues.”
Are there are plans to increase or reduce the number / level of services provided
in the coming year?
There were 113 responses to this question.
Maintain a similar
level54 (48%)
Increase40 (35%)
Don't know
13 (12%)
Decrease6 (5%)
“(Funding) has fluctuated hugely from
year to year depending on projects. Core
funding has decreased steadily.”

27
Summary of comments
In spite of widespread uncertainties around future funding and capacity, these comments convey an overall impression
of optimistic determination to maintain, and in many cases a desire to increase services in order to meet needs.
“To cover more areas with drop-in centres”
“To increase reach to those parents and families who need our support”
“Possibly increase to increase our income; but we are just about working at capacity”
“We have identified a need for better support to people at the start of their recovery”
Some qualify their responses in view of the uncertainties regarding future funding. A number of the most established
organisations are struggling to meet growing demands with year-on-year reductions in funding.
“This will depend on funding streams”
“If more people need our help, and we have the
resources, funds and volunteers to do so then
we will...”
“We are in the extraordinary position of being
able to bid for growth services without the
reassurance that the core services will continue
to be funded...”
“(Decrease) Unless funding can be found”
Sadly, a number of respondents are facing closure as a result of financial pressures.
“Charity likely to close”
“We will be discussing whether to close in January.”
“Requests for our support have quadrupled … although funding ends in March...”
“Withdrawal of funding will lead to closure in a few months.
Some organisations are self-financing, either because their services generate sufficient income to meet costs or they
are able to draw on legacy funds. Some that have been able to attract sufficient individual donations, and others have
all outgoings met by their volunteers.
“We want to reach more young
people facing difficulties that prevent
them from accessing education and
employment.”

28
What are the three areas that organisations find it hardest to raise funds for?
There were 94 responses to the question “Considering all areas of your organisation's work, what three areas do you
find it hardest to raise funds for?” Some organisations apply small charges to those who use them and have no
overheads that are not covered by these.
Summary of comments
By far the outstanding issue for the many who
commented on this question highlighted the
problems they face as a result of a project- and
innovation-focused culture among the most
important and affluent funding bodies.
“Continuation of services - each funder
seems to want a new and unique
programme whereas we have a set of services which work and are still needed.”
“Core costs … as well as funding of successful on-going projects”.
“Funders like Projects not everyday expenditure.”
The widespread resistance on the part of funders to support essential but hidden overheads - such as insurance and
the costs of running a crisis phone line - in favour of often short-term ‘innovative’ project funding is progressively
undermining the sustainability of key voluntary sector activity. Many comments make the point both poignantly and
eloquently.
Salaries 57 (61%)
Other overheads 49 (52%)
Office costs 41 (44%)
IT and capital equipment 23
(25%)
Service development 20
(21%)
Professional development 18
(19%)
Volunteer costs 16 (17%)
Skills training 13 (14%)
“No one wants to fund rent, heat and light,
supervision and management - but everyone
wants project workers to achieve amazing things
- from the middle of a field maybe?”

29
Some of the charities that have been successful in attracting sufficient individual donations are also concerned about
the potential impact of stagnant pay levels on many donors’ incomes. Others, such as local community groups, have
not engaged, or do not need to engage in fund-raising at the present time.
In a predominantly rural county, with an ageing population and dwindling bus services, mobile services and voluntary
transport are increasingly important. An organisation that provides tutors for housebound people to learn how to use
communications technology, and others that provide mobile services to support isolated families or transport to
hospital and other essential services, will all be affected by any increases in invisible costs such as insurance and fuel.
“We have struggled to raise funds for a new vehicle which is required by the charity”
Capital costs are also a problem, particularly for organisations that have responsibility for maintaining buildings. These
range from local heritage organisations and purpose-built youth facilities to village halls and other multi-purpose
community facilities.
“Maintenance in perpetuity of a 1990s hall of no architectural merit is not sexy but it is an enabler of
other organisations provisions”
What 4 main challenges are respondents likely to face in the next 2 years?
There were 110 responses, shown the in order of frequency.
Funding and sustainability 87 80% Recruiting board/management committee with necessary skills 45 41%
Recruiting volunteers to provide frontline services 40 36%
Time constraints 38 35%
Organisational development / managing your organisation 33 30%
Demonstrating your impact 30 27%
Recruiting volunteers to provide back office support 22 20%
Influencing public policy 19 17%
Leadership 15 14%
Financial management 14 13%
Managing people / HR (including skills / professional development 11 10%
Business planning 9 8%
Social enterprise / trading 8 7%

30
Partnership working 8 7%
Environment impact/footprint 4 4%
Equality and diversity within your organisation 2 2%
Summary of comments
The comments can be summarised under three headings: people; skills and knowledge; and meeting specific needs.
Attracting enough people to sustain the viability of voluntary and community activities and organisations is a
widespread concern.
“Our Committee, in common with other organisations, are all retired so aging and grandparent duties
will have a major impact on the Branch”
Among the skills gaps are technical, marketing and business skills and know-how, including that necessary to provide
good governance.
“Considerable technical ability plus resilience needed”
“Marketing and Promotion in order to reach out to our families and their children in
‘Specific needs’ include funding for counselling young people and for assisting people with serious mental health
problems
“… we have the necessary expertise but these are groups who can't pay for the service.”
31
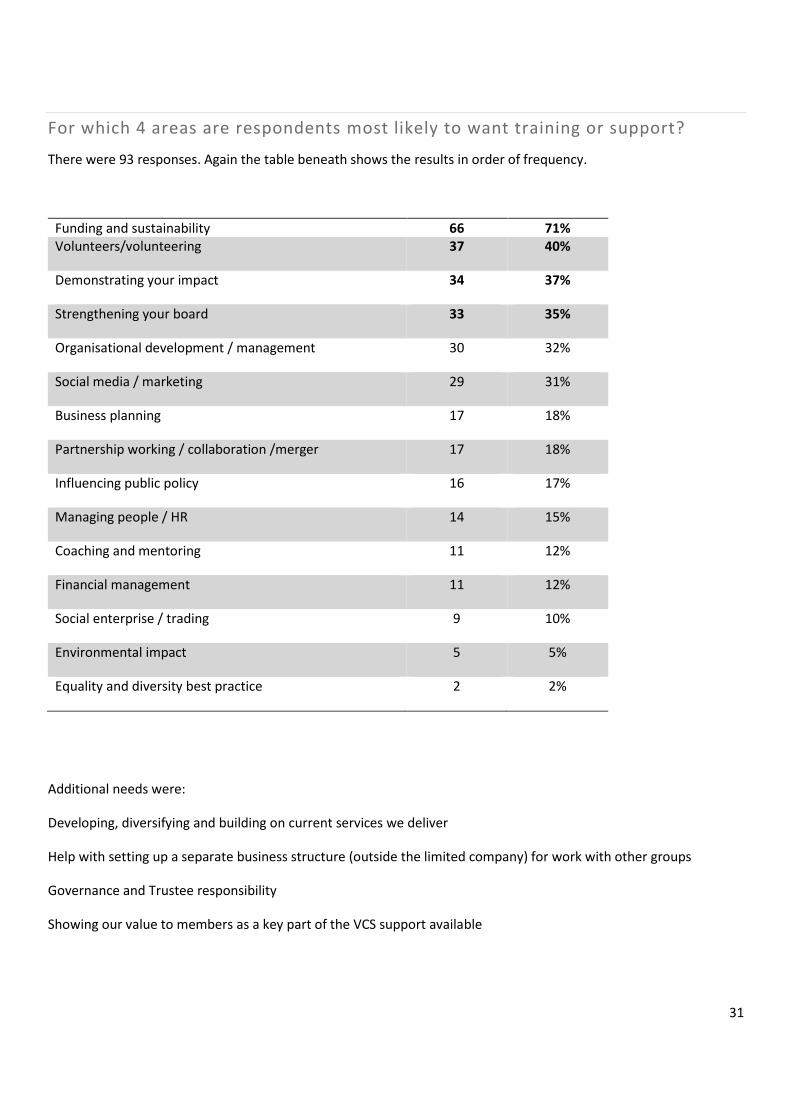
For which 4 areas are respondents most likely to want training or support?
There were 93 responses. Again the table beneath shows the results in order of frequency.
Funding and sustainability 66 71% Volunteers/volunteering 37 40%
Demonstrating your impact 34 37%
Strengthening your board 33 35%
Organisational development / management 30 32%
Social media / marketing 29 31%
Business planning 17 18%
Partnership working / collaboration /merger 17 18%
Influencing public policy 16 17%
Managing people / HR 14 15%
Coaching and mentoring 11 12%
Financial management 11 12%
Social enterprise / trading 9 10%
Environmental impact 5 5%
Equality and diversity best practice 2 2%
Additional needs were:
Developing, diversifying and building on current services we deliver
Help with setting up a separate business structure (outside the limited company) for work with other groups
Governance and Trustee responsibility
Showing our value to members as a key part of the VCS support available
32
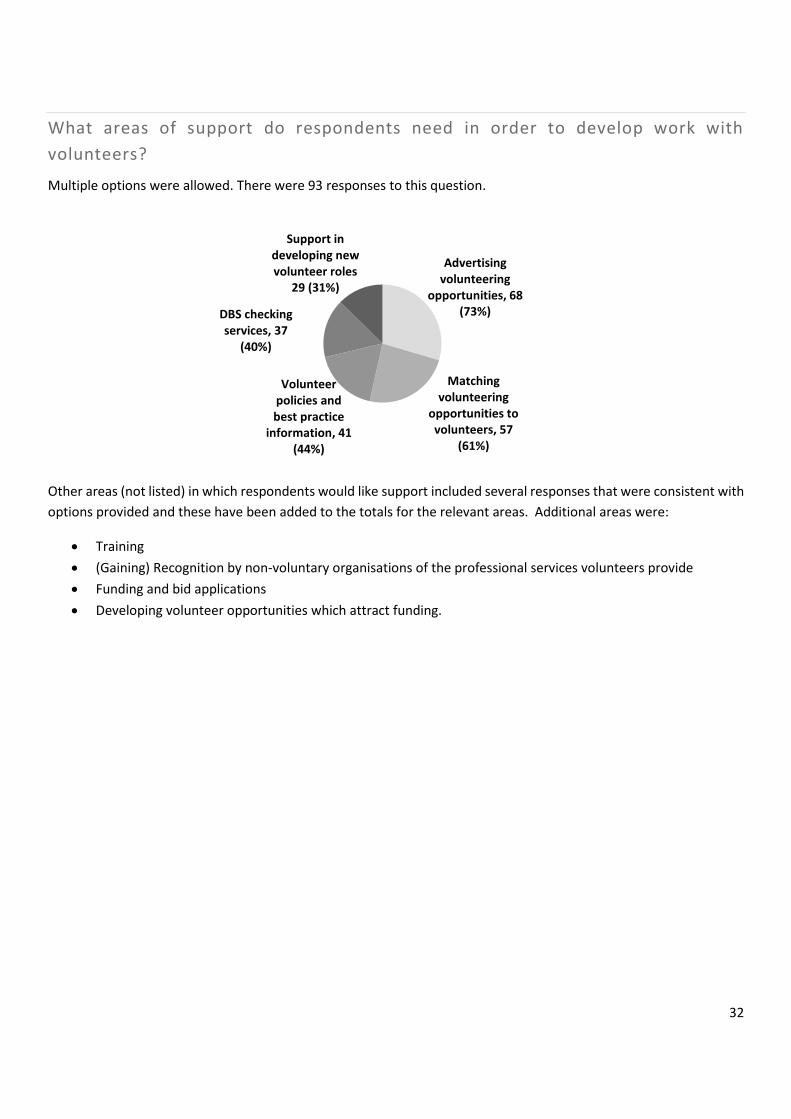
What areas of support do respondents need in order to develop work with
volunteers?
Multiple options were allowed. There were 93 responses to this question.
Other areas (not listed) in which respondents would like support included several responses that were consistent with
options provided and these have been added to the totals for the relevant areas. Additional areas were:
Training
(Gaining) Recognition by non-voluntary organisations of the professional services volunteers provide
Funding and bid applications
Developing volunteer opportunities which attract funding.
Advertising volunteering
opportunities, 68 (73%)
Matching volunteering
opportunities to volunteers, 57
(61%)
Volunteer policies and best practice
information, 41 (44%)
DBS checking services, 37
(40%)
Support in developing new volunteer roles
29 (31%)

33
Conclusions
There are a number of important messages in this report – none, however, that will be any surprise.
First it is important to recognise that although the voluntary, community and social enterprise sector has long been
an important component of public life in Somerset the sector is increasingly central to communities and individuals
including the delivery of core services
A significant conclusion of the report is the impact on the VCSE of the gradually diminishing grants from the public
sector, the increased competition for external grant funding and the time and specialist knowledge required to embark
on either bidding for locally commissioned work or large scale funding applications. Micro organisations with no paid
staff may find this environment easier to survive in as they may be able to exist on small amounts of local fundraising
and volunteer goodwill. Large organisations can afford to employ specialist teams of bid writers and fundraisers.
Some analysis of the responses to the report suggests that it is the middle layer of organisations with the £50,000+
annual turnover where the most pain is currently being felt.
Considerations for Local Strategic decision makers and funders
To be clear about what they want from commissioned work, allowing enough time for organisations to work
together and collaborate
Use grants to support good learning organisations as well as commissioning work
Re-consider the apparent emphasis on innovation rather than funding solid proven work in areas of need
All but the smallest organisations require some core costs to fund e.g. insurance, safeguarding training,
volunteer expenses, office space, etc
Monitoring and evaluation requirements are important but need to be proportionate
Some investment required to support the wider sector to address development needs crucial to support
thriving organisations e.g. communication, marketing , volunteer recruitment, fundraising, bid writing.
Continue to engage with the sector at an early stage to help shape services and proposals – opportunities
within the new STP, etc
Invest for the wider sector to address the increasing demand for volunteers, to attract, recruit and retain a
larger pool of volunteers.
Allow sector to play to its strengths
Celebrate what is already happening
Considerations for the VCSE sector
Should celebrate the work it is already doing both long-standing and new
As traditional types of funding continue to diminish organisations need to explore the options of different
organisational forms and new ways of raising funds including social capital trading, crowdfunding, etc
Many organisations are already collaborating but there may be more opportunities to work in partnership,
share resources and skills and explore new ways of working for the benefit of the people of Somerset.
Further develop skills in monitoring delivery and evaluating outcomes

34
Appendix A: Gaps in services. Summary of comments
Young people
“Young people who do not meet statutory service thresholds experiencing issues such as poor mental
health, substance misuse difficulties etc”
“Young people with ADHD”
“Young people with social, emotional and behavioural difficulties
“Young people: Mental health for young people”
“Young people who are LGBT+”
“Children and young people requiring specialist support”
“Unemployed youth training and development”
People with mental health problems
“People with mental health vulnerabilities”
”People with varying degrees of mental health support needs”
“Cuts in public spending have impacted on the community support for people living with mental health
issues.”
“All those affected by autism whether or not they have a diagnosis”
Economically disadvantaged people
“Disadvantaged families (housing/benefits/employment/ Low income/border of poverty)”
“Quite a lot of underprivileged and marginal groups of people are not well supported, especially as
funding has diminished in recent years”
“Rural low income under employed”
“Unemployed”
“Homeless”
People suffering social isolation and loneliness
“Socially isolated men, especially older generation”
“Isolated vulnerable people particularly mental health”
“People suffering social isolation and loneliness”

35
Other groups
“People who want the health benefits and to help the environment by travelling by active and
sustainable means , i.e. walking and cycling
“Town & Parish Councillors - they receive legal & process training but not much on the new powers of
Localism Act or their expanded role given cuts to services.”
36
Appendix B: Has the volume of demand changed? Summary of comments
Responses suggest that the increase in demand across a range of VCSE services has often not been matched by an
increase in resources to meet it. In a number of cases these are services provided to client groups who are facing
deprivation and hardship.
For example, demand for Somerset’s independent, free-access advice has risen:
“There has been a 5% increase in (advice service) enquiries, up to 6,070 this year”
“Social welfare reform has had a great impact on disabled and long term sick - move from DLA to PIP,
pace of change in society is too much for many of our residents”
Another organisation providing counselling for people with life-threatening conditions has increased by over 50% and
young people seeking help from a counselling and psychotherapy organisation are on a waiting list.
A community interest company that organises free or very low cost activities for children, young people and families
which focuses on social inclusion and integration, is unable to meet the increased demand because of funding.
Similarly, reduced funding has caused an organisation providing family support and early years' education
opportunities to cut its sessions.
An organisation that contacts lonely and isolated people to help them reconnect with their community is experiencing
“a fairly constant steady increase, requiring more paid coordinator resources, more activities, and
therefore more funding”.
By contrast, demand fluctuates unpredictably for specialist organisations such as one working with people with a
Motor Neurone Disease diagnosis.
A village-base ‘Friendship Club’ set up to combat loneliness and isolation that started in 2012 has seen an almost 9-
fold increase in the number of members.
There have been increases in the use of rural arts, leisure and heritage facilities. These include rural community halls
and leisure centres providing youth services, local museums and a community theatre providing film and performing
arts
“We are proactively promoting the use of our hall. The youth club has expanded.”
“Last year approximately 17,000 people came to the theatre, all serviced by our 200 volunteers”
“We are seeing a decline in older groups such as Ladies circle, line dancers, bowlers but more physical
fitness and entertainment users”

37
An organisation that co-ordinates farmers markets reported that
“Fewer people starting up food businesses and fewer people able to afford prices of food at Farmers'
Markets.”
Apart from those who indicated that funding issues had had an effect, several respondents provided information about
other significant changes to their organisations which had resulted in reduced user numbers. Three of these were
newly-formed, one was closing down and two others were moving premises and undergoing building work that had
disrupted normal service.

38
Appendix C: Has the complexity of issues changed? Summary of comments
The additional comments paint a compelling picture of organisations and groups under pressure, sandwiched between
reducing resources and growing needs. This pressure cascades downwards from statutory agencies through
established charities to local groups seeking, through voluntary effort, to alleviate a range of needs in their
communities.
“Groups are facing more challenges in terms of funding, demand on their services with limited resources,
legislative challenges, lack of volunteers and trustees.” (A Somerset infrastructure organisation)
“With Parish Council financial precepts dwindling by the day, it remains to be seen how long our
organisation can financially/physically support the services we offer. Currently our Parish Council are very
supportive of our efforts, but this is obviously tempered by their available financial support as to how far
we can go, our whole existence is the process of raising funds for the upkeep of our facility and all provided
by volunteer force - somewhere the final straw has to break.” (A village hall committee)
“The landscape of regeneration is constantly changing; but complexity for town & parish councillors is
increasing year on year. Also funding streams seem to be getting more complicated, with more loans and
support on offer than grants.” (A Somerset infrastructure organisation)
A variety of organisations identified a range of similar, and related explanations for the growing complexity of clients’
problems.
“Ever-increasing DWP pressures on (and lack of support for) long-term unemployable” (Community and
economic development group)
“Changes to the benefits system” (A Credit Union)
“Social welfare reform has had a great impact on disabled and long term sick - move from DLA to PIP,
pace of change in society is too much for many of our residents” (Advice Agency)
“Additional pressures brought on by benefits cuts, increased cost of living” (Domestic Violence charity)
“Changes in allowances and services” (Carers organisation)
“Drug and alcohol issues have increased, plus debt worries” (A family support charity)
“More debt, more isolation, more anxieties of joining projects for fear of change” (A community group
combating isolation)

39
Some point out that this has been a progressive process over a number of years:
“Actually complexity of clients has been increasing year on year for a while now” (Psychological therapy
and counselling)
“The complexity of referrals we receive have been growing steadily for many years” (Children’s charity)
“With increasing thresholds and waiting list for e.g. CAHMS and Talking Therapies, we are now working
with people with far more complex, sometimes severe and enduring support needs.” (Local charity to
reduce health and social inequalities)
Volunteers working to support older, isolated people in their communities are faced with increasing number of
mentally frail individuals and the complexities that this entails
Also identified was the knock-on effects within the sector from VCSE organisations struggling to maintain their level
of service or closing down entirely:
“Fewer community support organisations (which have closed or reduced their contact time) means
more pressure on remaining organisations. Frequent requests for help from outside our client group.”
(Learning Disabilities Advocacy)