Shapiro Vellucci.the Cost of Charging It
24
The Costs of “Charging It” in America: Assessing the Economic Impact of Interchange Fees for Credit Card and Debit Card Transactions Robert J. Shapiro and Jiwon V ellucci February 2010
-
Upload
alvaro-gallegos-alfonso -
Category
Documents
-
view
216 -
download
0
Transcript of Shapiro Vellucci.the Cost of Charging It
8/8/2019 Shapiro Vellucci.the Cost of Charging It
http://slidepdf.com/reader/full/shapiro-velluccithe-cost-of-charging-it 1/24
The Costs of “Charging It” in America:
Assessing the Economic Impact of Interchange
Fees for Credit Card and Debit Card Transactions
Robert J. Shapiro and Jiwon VellucciFebruary 2010

8/8/2019 Shapiro Vellucci.the Cost of Charging It
http://slidepdf.com/reader/full/shapiro-velluccithe-cost-of-charging-it 2/24

8/8/2019 Shapiro Vellucci.the Cost of Charging It
http://slidepdf.com/reader/full/shapiro-velluccithe-cost-of-charging-it 3/24
1
The Costs of “Charging It” in America:
Assessing the Economic Impact of Interchange Fees for Credit Card and Debit Card Transactions1
Robert J. Shapiro and Jiwon Vellucci
I. Introduction
The use of credit cards and debit cards has made what once was a simple, direct exchangeof product for cash between a merchant and a customer into a complicated financial transaction.With credit cards, customers can charge their purchases through a merchant. The merchant’s bank (the “acquiring bank”) then uses a network such as Visa or MasterCard to transmit thecharge to the bank that issued the card to the customer (the “issuing bank”). Here is where thefees start piling up. For this transaction, the merchant’s bank charges the merchant a “merchantdiscount fee” that covers various costs and profits for itself, the credit card network, and thecard-issuing bank. The portion of this “merchant discount fee” that the merchant’s bank pays tothe card-issuing bank is called the “interchange fee,” while the portion that goes to the creditcard network is called the “association fee.”2 The same basic arrangements are used for debitcards, which directly connect the network to the customer’s checking account.
Fees to cover the costs of processing credit and debit card transactions have a soundeconomic basis. The merchants who pay them receive services: Customers purchase more whenthey can use credit cards to delay their payments, merchants receive their payments before their customers pay their bills, and the banks issuing the cards are frequently responsible whencustomers default on their charges or charges prove to be fraudulent. The banks also receiveservices from the credit card network, most importantly when they act as the processor of payments between consumers, merchants and their respective banks.
While the economic basis for interchange fees used in current credit card and debit cardsystems are clear, there are serious issues about the economic basis for the levels of those fees,which in 2008 totaled some $48 billion. This study analyzes these issues. We find, first, that thecurrent arrangements effectively prevent normal market factors from determining the level of these fees. In fact, these arrangements appear to have many of the price-setting features anddistortions of a cartel. As we will see, two firms, Visa and MasterCard, together account for more than 86 percent of all U.S. consumer card transactions and nearly two-thirds of all U.S.commercial card transactions. Further, merchants would incur prohibitive costs if they tried toapply market pressure by withdrawing or exiting from these systems, since credit and debit cardtransactions are so ubiquitous.
1 Research for this analysis was supported by Consumers for Competitive Choice. The views and analysis are solely
those of the authors. The authors also want to acknowledge the valued assistance of Krista Ellis.2 The cash flow runs in the opposite direction, from the cardholder to the card-issuing bank, to the card network, to
the merchant’s bank, and finally to the merchant. See figure 1 for an illustrative example. After the transaction is
authorized, the issuing bank posts the original charge on the cardholder’s account and sends the original charge less
the interchange fee to the merchant’s bank through the network. Both the network and the merchant’s bank deduct
their own fees, and then send what remains--the original charge less the fees--to the merchant.
8/8/2019 Shapiro Vellucci.the Cost of Charging It
http://slidepdf.com/reader/full/shapiro-velluccithe-cost-of-charging-it 4/24
2
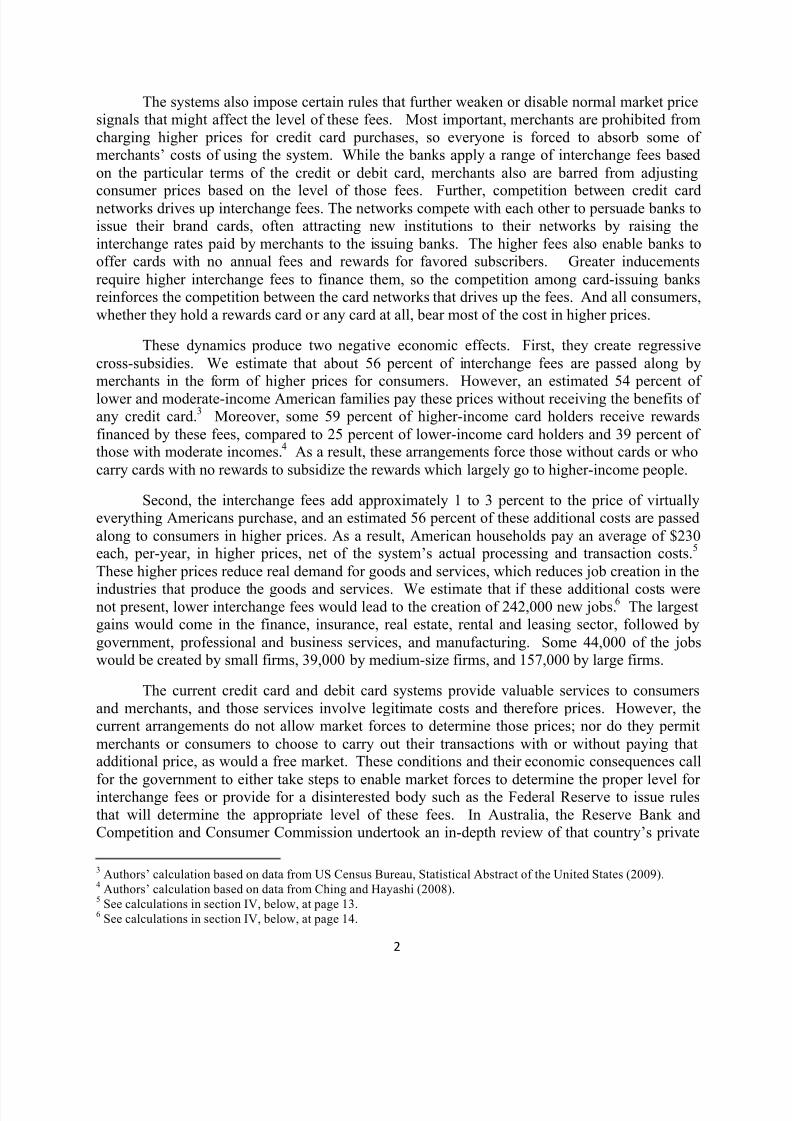
The systems also impose certain rules that further weaken or disable normal market pricesignals that might affect the level of these fees. Most important, merchants are prohibited fromcharging higher prices for credit card purchases, so everyone is forced to absorb some of merchants’ costs of using the system. While the banks apply a range of interchange fees basedon the particular terms of the credit or debit card, merchants also are barred from adjusting
consumer prices based on the level of those fees. Further, competition between credit cardnetworks drives up interchange fees. The networks compete with each other to persuade banks toissue their brand cards, often attracting new institutions to their networks by raising theinterchange rates paid by merchants to the issuing banks. The higher fees also enable banks tooffer cards with no annual fees and rewards for favored subscribers. Greater inducementsrequire higher interchange fees to finance them, so the competition among card-issuing banksreinforces the competition between the card networks that drives up the fees. And all consumers,whether they hold a rewards card or any card at all, bear most of the cost in higher prices.
These dynamics produce two negative economic effects. First, they create regressivecross-subsidies. We estimate that about 56 percent of interchange fees are passed along bymerchants in the form of higher prices for consumers. However, an estimated 54 percent of
lower and moderate-income American families pay these prices without receiving the benefits of any credit card.3 Moreover, some 59 percent of higher-income card holders receive rewardsfinanced by these fees, compared to 25 percent of lower-income card holders and 39 percent of those with moderate incomes.4 As a result, these arrangements force those without cards or whocarry cards with no rewards to subsidize the rewards which largely go to higher-income people.
Second, the interchange fees add approximately 1 to 3 percent to the price of virtuallyeverything Americans purchase, and an estimated 56 percent of these additional costs are passedalong to consumers in higher prices. As a result, American households pay an average of $230each, per-year, in higher prices, net of the system’s actual processing and transaction costs. 5 These higher prices reduce real demand for goods and services, which reduces job creation in the
industries that produce the goods and services. We estimate that if these additional costs werenot present, lower interchange fees would lead to the creation of 242,000 new jobs.6 The largestgains would come in the finance, insurance, real estate, rental and leasing sector, followed bygovernment, professional and business services, and manufacturing. Some 44,000 of the jobswould be created by small firms, 39,000 by medium-size firms, and 157,000 by large firms.
The current credit card and debit card systems provide valuable services to consumersand merchants, and those services involve legitimate costs and therefore prices. However, thecurrent arrangements do not allow market forces to determine those prices; nor do they permitmerchants or consumers to choose to carry out their transactions with or without paying thatadditional price, as would a free market. These conditions and their economic consequences call
for the government to either take steps to enable market forces to determine the proper level for interchange fees or provide for a disinterested body such as the Federal Reserve to issue rulesthat will determine the appropriate level of these fees. In Australia, the Reserve Bank andCompetition and Consumer Commission undertook an in-depth review of that country’s private
3 Authors’ calculation based on data from US Census Bureau, Statistical Abstract of the United States (2009).4 Authors’ calculation based on data from Ching and Hayashi (2008).5 See calculations in section IV, below, at page 13.6 See calculations in section IV, below, at page 14.

8/8/2019 Shapiro Vellucci.the Cost of Charging It
http://slidepdf.com/reader/full/shapiro-velluccithe-cost-of-charging-it 5/24
3
interchange fees and rules, and recommended changes which ultimately reduced those fees to anaverage of 0.50 percent per-transaction and allowed merchants to apply transparent surcharges based on the particular fees for each transaction. At a minimum, the Federal Reserve Board or the Federal Trade Commission should examine our credit-card system’s fees and practices andrecommend reforms to reduce the impact on consumers and jobs.
II. Credit Cards Payment System and Interchange Fees
As noted above, the widespread use of credit cards and debit cards has turned a simple,direct exchange into a complicated transaction involving the merchant, the consumer, themerchant’s bank, the consumer’s bank, and the credit card network. Figure 1, below, illustrates atypical credit card transaction with a $100 charge and a 3 percent merchant discount fee. Thisfigure describes the Visa and MasterCard systems; in the American Express and Discover systems, those firms act as both the card-issuing institution and acquiring bank.
Figure 1. Credit Card Payment Transaction7
Depending on the type of card, the interchange fee may be a flat charge per-transaction, a percentage of the value of the transaction, or a combination of both. Credit card transactionsusually entail a flat fee plus a percentage-fee for each transaction, while most PIN debit cardtransactions usually involve only flat fees.8 The size of the interchange fee also can depend onthe type of card, the merchant’s category, the volume of merchant’s sales, and how thetransaction is processed.9 Table 1, below, illustrates average interchange fees for four classes of cards, although once again, the merchant’s fee includes a fee paid to the merchant’s bank on topof the interchange fee paid to the bank issuing the card and the credit card network. In 2009, the
7 This is only an illustrative example. The specific dollar amounts in this example are from Levitin (2007). Theissuing bank as well as the merchant pays association fees. $0.1 in this example only captures the portion that the
merchant pays. July 2009, MasterCard earned $0.0185 per-transaction and Visa earned $0.0195. See
www.ok.gov/treasurer/documents/OK%20Summary%202009_1.doc 8 Levitin (2007).9 GAO (2008).
Credit Card Network ($0.10)
Acquiring Bank ($0.50) Issuing Bank ($2.40)
Merchant ($97.00) Card Holder (-$100.00)
Goods or services
Credit card
information
$97.00 Submit
transaction data
$97.50Submit
transaction data
$100
Bills card
holder $100
$97.60
Credit
inquiry

8/8/2019 Shapiro Vellucci.the Cost of Charging It
http://slidepdf.com/reader/full/shapiro-velluccithe-cost-of-charging-it 6/24
4
average fee for credit cards transactions was 1.5 percent to 2.0 percent, although they range ashigh as 2.95 percent for Visa card and 3.25 percent for MasterCard transactions.10
Table 1. Average Interchange Fees, By Type of Card Transaction, in the United States11
Type Interchange Fees
PIN Debit 0.30 to 0.75 percent of the transaction value
Signature Debit 1.2 percent of the transaction value
Visa Credit Card 1.5 to 2.0 percent of the transaction value
MasterCard Credit Card 1.5 to 2.0 percent of the transaction value
Since American Express and Discover act as both the card-issuing banks and theacquiring banks, their merchant fees and interchange fees are the same. American Express andDiscover also negotiate with individual merchants over the level of their fees, but do not issueany summary of the results. It is believed that the average merchant pays higher fees for American Express than Visa and MasterCard, although American Express is also reported to
have reduced its average fees from roughly 3.26 percent in 1990 to 2.56 percent in 2009.However, a survey of 750 small business owners found that merchants with fewer than 250employees paid fees averaging 3.2 percent for American Express transactions and 2.5 percent for transactions using Discover cards, compared to 2.3 percent for MasterCard and Visa.12
The volume of interchange fees has risen sharply in recent years, increasing their impacton merchants and consumers, and their importance to the banks which issue the cards and retainthe fees. According to the National Retail Federation, the total fees paid by merchants acceptingVisa and MasterCard nearly doubled in recent years, from about $26 billion in 2004 to $48 billion in 2008. These data track information from the Nilson Report, which estimates thatinterchange fees increased from about $18 billion in 2000 to $47 billion in 2008.
Figure 2. Interchange Fees Paid by Merchants13
10 GAO (2009).11 Prager, Manuszak, Kiser and Borzekowski (2009); Ching and Hayashi (2008).12 GAO (2009).13 GAO (2009)
0
10
20
30
40
50
60
2000 2001 2002 2003 2004 2005 2006 2007 2008
Billion $
National Retail Federation Nilson Report

8/8/2019 Shapiro Vellucci.the Cost of Charging It
http://slidepdf.com/reader/full/shapiro-velluccithe-cost-of-charging-it 7/24
5
These increases in the total volume of interchange fees reflect Americans’ increasing useof these cards as well as growth in the number of credit cards and debit cards issued. Thenumber of credit and debit cards in circulation has increased steadily for many years. From 2000to 2006, the number of credit cards increased from 1,425 million to 1,488 million or 4.4 percent.(See Table 2, below) Over the same years, the total volume of transactions using those cards
grew from $1,242 billion to $1,950 billion, or 57.0 percent; and industry analysts predict thatcredit card volume will grow another 40.9 percent from 2006 to 2010.
Table 2. Debit Cards and Credit Cards - Number of Cards and Purchase Volume14
Debit Cards Credit CardsYear
Number of Cards Purchase Volume Number of Cards Purchase Volume
1990 164 million $12 billion 1,012 million $466 billion
2000 235 million $311 billion 1,425 million $1,242 billion
2006 354 million $1,025 billion 1,488 million $1,950 billion
2010 (est) 484 million $1,643 billion 1,618 million $2,747 billion
Furthermore, the share of the value of all in-store transactions across the country thatwere covered by credit and debit cards grew from 43 percent in 1999 to 59 percent in 2008.
Figure 3. In-Store Transaction by Payment Type15
On top of these increases in the use and numbers of credit and debit cards, banks haveraised interchange fee rates. While Visa and MasterCard both claim that the average interchangerate applied to their transactions has remained stable, the GAO found that interchange rates haveincreased for 43 percent of Visa cards and 45 percent of MasterCard credit cards. In addition,
14 U.S. Census Bureau (2000; 2009)15 Brandt (2008)

8/8/2019 Shapiro Vellucci.the Cost of Charging It
http://slidepdf.com/reader/full/shapiro-velluccithe-cost-of-charging-it 8/24
6
the structure of those fees has become more complex, with the number of fee levels andcategories reaching 60 under Visa and 243 under MasterCard.16 The GAO analysis alsoestablished that from 1991 to 2009, the maximum interchange rates charged by Visa andMasterCard rose by more than 50 percent, from about less than 2.0 percent to about 3.25 percent(Table 3 below). Other researchers also have found that from 1995 to 2005, interchange fees
rose by more than 25 percent.
17
Throughout this period, one might have expected that these rateswould have actually declined, given the higher use of credit cards and technologicalimprovements across much of the transaction system.
Table 3. Interchange Fee Charges for Visa and MasterCard Domestic Credit Cards18
Changes in rates from 1991 and 2009 Visa MasterCard
Number of interchange rate categories in 1991 4 4
Number of interchange rate categories in 2009 60 243
Range of interchange rates in 1991 1.25% to 1.91% 1.30% to 2.08%
Range of interchange rates in 2009 0.95% to 2.95% 0.90% to 3.25%
Percentage of rates that increased 43% 45%
Percentage of rates that stayed the same 45% 45%
Percentage of rates that decreased 12% 10%
III. The Economics and Anti-Competitiveness of Interchange Fees
The Economics of Interchange Fees
The market for credit and debit card payments has several features which prevent normalsupply and demand from determining the levels of interchange fees. First, these fees are set inwhat economists call a “two-sided market,” in which the issuing banks and credit card networks provide services to two different groups (merchants and credit card holders) with differentsensitivity to changes in the prices of those services. In principle, the interchange fee could beset at the level that would reflect most closely the actual benefits for each group and the actualcosts borne by the issuing bank and the network. In practice, the merchants bear the direct costsof interchange fees, while credit card users directly pay other fees, including annual membershipfees, interest charges, and late payment penalties. This is also a market with network effects, inwhich the benefits to an individual credit card holder increase with the number of merchants inthe network, and the benefits to the individual merchant increase with the number of credit cardholders. Markets with these kinds of network effects have two features which can weaken or disable normal market price signals. First, they tend to develop one or two dominant players, afeature evident in this case. Most merchants have only four choices of credit card networks – Visa, MasterCard, American Express, and Discover – and since all four are fairly ubiquitous,most merchants are constrained to accept most or all of them. In fact, Visa and MasterCardtogether account for 86 percent of all consumer card transactions and 62.3 percent of all
16 GAO (2009).17 Semeraro (2008).18 GAO (2009).

8/8/2019 Shapiro Vellucci.the Cost of Charging It
http://slidepdf.com/reader/full/shapiro-velluccithe-cost-of-charging-it 9/24
7
commercial cards transactions (Figure 4, below). If consumers want to hold a useful credit card,they also have only four choices. These dynamics, in turn, give the four networks a measure of pricing power.
Figure 4. Market Share of Credit Cards Networks19
Second, a market with network effects often imposes high costs on anyone withdrawingfrom that market, further weakening normal market forces. The market in computer operatingsystems, long dominated by Microsoft Windows, is often cited as a classic example: Windows’usefulness to each PC user increases with the number of users and, consequently, the number of new applications written for it, creating network effects. The sacrifice of that enhancedusefulness can involve high costs for anyone, for example, considering switching to Linux. Withcredit cards, the costs of withdrawing from the four dominant card networks are also high,especially for merchant, since 78 percent of American consumers hold credit cards,20 and almost40 percent of all in-store transactions are paid for with credit cards and signature debit cards. 21
Given these dimensions, most merchants are effectively unable to leave all or most of thesenetworks in a market response to high interchange fees.
The current arrangements, in which the credit card networks set these fees while most of the funds collected by them go to the banks that issue the cards, comes from their history. In thelate 1950s, Bank of America began offering one of the first general purpose credit cards, theBankAmericard. To increase its use, Bank of America licensed it to other banks and thenconverted the system into a membership-owned corporation, which it called the Visa network.22 Similarly, MasterCard began in 1966 as a bank-owned card association.23 In both cases, a fewlarge banks controlled the networks, which allocated their ownership and effective control basedon the credit-card sales volume of its member banks.24 In 2006, both MasterCard and Visa
became public corporations, combining ownership by banks, investors and charitable
19 The Nilson Report, September 2009, Issue 933. The numbers are based on $3.069 trillion in purchases of goods
and services generated from commercial and consumer general purpose credit and debit cards in 2008. 20 Foster, Meijer, Schuh and Zabek (2009).21 Signature debit cards transactions are carried mostly by MasterCard and Visa.22 GAO (2009).23 Chakravorti (2003).24 Levitin (2007).

8/8/2019 Shapiro Vellucci.the Cost of Charging It
http://slidepdf.com/reader/full/shapiro-velluccithe-cost-of-charging-it 10/24
8
foundations. While the major banks no longer wholly control these networks, the card networkscontinue to operate to serve the interests of their dominant member banks, with the sameincentives governing interchange fees.25
The dominance of this market by a handful of card-issuing financial institutions has
increased in recent years. In 1992, the top ten credit card issuers accounted for just over one-half of the market.26 By 2002, the top ten controlled 75 percent of the market; and by 2007, the topten accounted for almost 90 percent of all credit card volume. Moreover, in 2007, just four financial institutions – American Express, J.P. Morgan Chase, Bank of America, and Citigroup – controlled nearly 70 percent of the market; and setting aside American Express and Discover, theother three institutions held more than 63 percent of the remaining market (Table 4, below).
Table 4. Ten Largest Credit Card Issuers by Dollar Value, 200727
Issuer Market ShareMarket Share Excluding
AMEX & Discover
American Express 24.7% -
JP Morgan Chase 17.6% 24.9%
Bank of America 14.6% 20.8%
Citigroup 12.3% 17.6%
Capital One 5.9% 8.4%
Discover 5.0% -
U.S. Bank 3.6% 5.2%
HSBC 2.3% 3.3%
Wells Fargo 2.1% 2.9%
GE Money 1.5% 2.1%
Total 89.6% 85.2%
While these institutions compete fiercely for new credit card subscribers, they do so not by reducing interchange fees but by offering inducements such as rewards programs and initiallylow interest charges. This competition, therefore, tends to increase costs, which in turn are passed along to merchants in higher interchange fees. Moreover, economic researchers havefound that in two-sided markets, a producer may be able to increase profits by charging onegroup a price close to or even below the producer’s actual marginal cost and then earn all or mostof its profits by charging other groups much higher prices.28 As noted above in Table 3,MasterCard alone has 243 separate interchange rate levels, with the highest rates applied to the
purchases using high rewards cards. This strategy is especially effective since those who pay the
25 Semeraro (2008).26 Evans and Schmalensee (2005b).27 Prager et al (2009).28 Evans and Schmalensee (2005a) Magazines are another example of a two-sided market. There, many magazines
provide deep discounts for subscriptions, which they use to set higher advertising rates. They also charge much
higher prices to those purchasing individual issues at newsstands, which accounts for the frequent use of disasters,
celebrities and fads featured on their covers.

8/8/2019 Shapiro Vellucci.the Cost of Charging It
http://slidepdf.com/reader/full/shapiro-velluccithe-cost-of-charging-it 11/24

8/8/2019 Shapiro Vellucci.the Cost of Charging It
http://slidepdf.com/reader/full/shapiro-velluccithe-cost-of-charging-it 12/24
10
fees than on its employees’ health care.33 Similarly, 7-11 has said that interchange fees representits third-largest business expense, after payroll and electricity;34 and the National Association of Convenience Stores reports that in 2006, interchange fees totaling $6.6 billion exceeded the $4.8 billion profits of all U.S. convenience stores. Moreover, the total fees paid by conveniencestores have continued to rise since 2006, reaching $7.6 billion in 2007 and $8.4 billion in 2008.35
These large fees do not appear to be necessary to maintain the current credit card system,since they account for a small share of the system’s revenues. One study found that theinterchange fees collected by an average bank issuing Visa or MasterCard in 2001 accounted for just 15 percent of its credit card-related revenues, compared to 70 percent from finance charges,12 percent from penalties and cash-advance fees, and a 3 percent from annual membership andother fees.36 Another study found similar results, with 13 percent of revenues coming frominterchange fees, more than 70 percent from interest and penalty charges, and 2 percent fromannual membership fees.37 The GAO estimates are slightly higher, with about 20 percent of Visaand MasterCard issuers’ card-related revenues coming from interchange fees.38
High interchange rates, however, are an effective way for credit card networks and
payment systems to attract new banks to issue their cards. Analysts note, for example, that Visaand MasterCard raised their average interchange fee from 1.3 percent in 1995 to 1.7 percent in2002 in order to entice banks to choose their systems.39 Following a 2003 court ruling allowing banks that are members of Visa or MasterCard to also issue other credit cards, Visa andMasterCard both moved to retain banks by introducing new cards with higher interchange fees.Both networks also offered higher interchange fees to encourage card-issuing banks to favor their signature debit cards over PIN debit cards.40 And the GAO reports that the averageinterchange rates introduced since the 2003 judicial ruling have been 18 percent higher for Visaand 11 percent higher for MasterCard than their average rates prior to 2003.
41
As interchange fees increase in the absence of market discipline, they entail higher
economic costs. As we will see, merchants pass along much of these fees in higher prices, whichall consumers bear regardless of how they pay for their purchases. The result is a series of cross-subsidies, in which consumers who do not use credit cards or cannot qualify for high-rewardcards pay higher prices to support the use of cards and high-reward cards by others. Thesesubsidies are often regressive, since lower-income consumers are more likely to pay cash whilehigh-income consumers are more likely to use high-reward-based credit cards. They also reducereal consumer demand, with adverse effects for job creation. The rest of the fees are absorbed bymerchants through lower profits, which also may hamper job creation.
33 Martin (2009).34
Sidel (2009).35 NACS Online (2009).36 Evans and Schmalensee (2005b).37 Chakravorti (2003).38 GAO (2009).39 Evans and Schmalensee( 2005b).40 In the early-1990s, when Visa undertook a campaign to convince banks to issue its signature debit card, Visa’s
interchange fee was about 37 cents, versus 8 cents for a bank PIN debit card on a typical $30 transaction (Evans and
Schmalensee(2005b)).41 GAO (2009).

8/8/2019 Shapiro Vellucci.the Cost of Charging It
http://slidepdf.com/reader/full/shapiro-velluccithe-cost-of-charging-it 13/24

8/8/2019 Shapiro Vellucci.the Cost of Charging It
http://slidepdf.com/reader/full/shapiro-velluccithe-cost-of-charging-it 14/24
12
Table 5. Income Characteristics of Card Users47
Income All Americans Credit Card Users Reward Card Users
$0-$40,000 46.3% 35.2% 24.4%
$40,000-$59,999 17.8% 24.0% 21.9%
$60,000 and over 36.0% 40.8% 53.7%
These data show straight-forward transfers from lower-income people to higher-income people with rewards cards. Nor can the banks that issue the rewards-linked credit cards chargemerchants high interchange rates when their customers use those cards claim credibly that therewards are a necessary part of the overall efficiencies associated with credit cards: Studies havefound that nearly all (higher-income) consumers who receive rewards from using their cardswould continue to use them if the rewards ended, rather than switch to cash or checks.48
The Impact of Interchange Fees on Jobs
When merchants pass along their interchange fees to consumers, the higher prices reducereal demand for goods and services, which in turn affects the jobs of those who produce thosegoods and services. The use of credit cards enhances efficiency, and part of the interchange feerepresents the cost to process the transaction. One study estimates that 13 percent of interchangefees represent the actual cost of transaction processing.49 The remainder of these fees goes tocover the rewards, which account for an estimated 44 percent of the total fees, as well as creditcard network branding and servicing, and other transaction costs and profit margins for the card-issuing banks.50 The authors caution, however, that their findings represent only roughestimates, since banks do not issue the data required to refine such an analysis. For this analysis,therefore, we take a conservative approach and increase the estimated share of the interchange
fee that represents the cost of transaction processing, by 50 percent to 19.5 percent. Thatadjustment leaves 80.5 percent of the fee to be passed on to consumers through higher prices or absorbed by merchants.
In order to determine what share of that 80.5 percent of the fee is actually passed along inhigher prices for consumers, we have to estimate a “cost pass-through rate” for interchange fees.In other contexts, such cost pass-through rates vary significantly depending on the type of costand the industry. Since interchange rates affect a wide range of businesses, we reviewed studiesof the cost pass-through rates for exchange rates and value added taxes, which also affect a widerange of businesses. Our literature review found that 60 percent to 70 percent of the costsassociated with changes in exchange rates are passed through in higher prices.51 Furthermore,studies by the Congressional Research Service and others found that that a 4 percent value-added
47 Ching and Hayashi (2008).48 Ibid. They did find that ending rewards might induce some consumer to prefer debit cards over credit cards, but
that also would not reduce the benefits or efficiencies of credit and debit card use.49 Dawson and Hugener (2006).50 Ibid. 51 Ashenfelter, Ashmore, Banker, and McKernan (1998). The pass-through rates for exchange rate changes refer to
changes in local currency import prices in response to variations in the exchange rate between exporting and
importing countries.

8/8/2019 Shapiro Vellucci.the Cost of Charging It
http://slidepdf.com/reader/full/shapiro-velluccithe-cost-of-charging-it 15/24
13
tax, covering 75 percent of consumer outlays, would likely lead to a 3 percent increase inconsumer prices, for a 75 percent cost pass-through rate.52 Based on these findings, we estimatethat the cost pass-through rate for interchange fees, apart from transaction costs, is about 70 percent. Therefore, we can estimate that 56 percent of the $48 billion in interchange feescharged and collected in 2008 were passed on to consumers as higher prices (0.805 x 0.70 =
0.56), or about $26.9 billion. This suggests that the average American household spent morethan $230 in 2008 on interchange fees that did not represent the transaction and processing costsfor credit cards, even if they never used a credit card.53 As noted earlier, much of these costs goto support rewards programs that disproportionately benefit higher-income households.
These calculations frame the analysis of the impact of these interchange fees on jobs: If American consumers and businesses had an additional $26.9 billion to spend or save, how manynew jobs would it likely create? To answer this question in the current economic environment,we adopt the analysis used by the President’s Council of Economic Advisers (CEA) to estimate job creation associated with the 2009 stimulus package.54 The CEA study averaged a range of public and private models to estimate the effects of the projected increases in governmentspending and tax reductions. The CEA concluded that after two years, a stimulus equal to 1.0
percent of GDP would generate output increases of 1.57 percent from higher spending and 0.99 percent from tax cuts. The lower prices linked to lower interchange fees are similar to tax cuts,while the direct increase in purchasing power at the point of spending is similar to spending.Therefore, we use the average of the two multipliers, 1.28 percent. The study also found that a1.0 percent increase in GDP is accompanied by an employment increase of 0.75 percent.
These findings enable us to estimate the impact on jobs if consumers did not bear theshare of interchange fees now passed along in higher prices, after setting aside the actualtransaction and processing costs of credit cards. GDP in 2008 was $14,441 billion, and $26.9 billion represents 0.186 percent of GDP. If consumers had an additional $26.9 billion to spend,it would generate an increase in output of 0.238 percent (0.186 x 1.28 multiplier); and that
increase in output implies an increase in employment of 0.179 percent (0.238 x 0.75). Non-farm payroll employment at the end of 2008 was 135,074,000. Therefore, if the share of current highinterchange fees now passed along to consumers in higher prices, net of the system’s actualtransaction and processing costs, were eliminated, we estimate that the resulting increase ineconomic activity would generate almost 242,000 new jobs. We note that this estimate does nottake account of jobs created by the rewards provided by some cards. However, this factor should be offset entire or in substantial part by our assumption that the transaction and processing costswhich are not passed along in higher prices account for 19.5 percent of interchange fees, a 50 percent increase of the rough estimate of 13 percent by previous researchers.
These potential jobs gains would be distributed across many industries. Table 6, below,
distributes those gains based on each industry’s share of GDP. We estimate that employment infinance, insurance, real estate, rental and leasing would expand by 48,300 jobs, followed bynearly 31,200 government jobs, and 30,600 jobs in professional and business services, and nearly27,800 in manufacturing.
52 Bickley (2003).53 This estimate is based on 116,783,000 U.S. households in 2008, the number estimated in the 2010 Statistical
Abstract.54 President’s Council of Economic Advisers (2009).

8/8/2019 Shapiro Vellucci.the Cost of Charging It
http://slidepdf.com/reader/full/shapiro-velluccithe-cost-of-charging-it 16/24
14
Table 6. Job Gains by Industry If the Share of Credit Card Interchange Fees Passed On
in Higher Prices, Net of Actual Processing and Transaction Costs, Were Eliminated55
IndustryIndustry Output
(billion)
Share of
GDP
Job
Gains
Gross domestic product $14,264.6 100.0% 241,783
Private industries $12,424.6 87.1% 210,595
Agriculture, forestry, fishing, and hunting $157.7 1.1% 2,673
Mining $325.3 2.3% 5,514
Utilities $306.0 2.1% 5,187
Construction $581.5 4.1% 9,856
Manufacturing $1,637.7 11.5% 27,759
Wholesale trade $818.8 5.7% 13,879
Retail trade $885.5 6.2% 15,009
Transportation and warehousing $414.9 2.9% 7,032Information $622.0 4.4% 10,543
Finance, insurance, real estate, rental and leasing $2,848.4 20.0% 48,280
Finance and insurance $1,064.9 7.5% 18,050
Real estate and rental and leasing $1,783.5 12.5% 30,230
Professional and business services $1,805.8 12.7% 30,608
Educational services, health care, social assistance $1,157.9 8.1% 19,626
Arts, entertainment, recreation, accommodation, food services $536.3 3.8% 9,090
Other services, except government $326.8 2.3% 5,539
Government $1,840.0 12.9% 31,188
These jobs gains would be distributed across small, medium-size and large companies.Table 7, below, shows this distribution based on Census Bureau data on receipts by firm size.
Table 7. Estimated Job Gains by Firm Size56
55 Total GDP in table 7 on which each industry share is based is smaller than GDP 14,441 billion used in the above
analysis. This is because GDP by industry data have not been adjusted to reflect the revised GDP 14,441 billion at
the time of this writing.56 U.S. Census Bureau (2002).
8/8/2019 Shapiro Vellucci.the Cost of Charging It
http://slidepdf.com/reader/full/shapiro-velluccithe-cost-of-charging-it 17/24
15
This analysis shows that small businesses would create some 44,000 new jobs, nearly 20 percent of the total employment gains; medium-size firms would add more than 39,000 new jobsor 16.3 percent of the total, and large firms would create more than 157,000 new jobs or nearlytwo-thirds of the total.
V. Judicial and Legislative Actions Affecting Interchange Rules and Fees
While interchange fee levels are not regulated directly in the United States, Congress andthe courts have taken steps periodically regarding some of the system’s anti-competitive features.For example, in 1971 the courts held that a Visa rule prohibiting banks from affiliating withmore than one credit card network was a per se prohibition of antitrust laws.
57In 1991, a federal
appeals court allowed Visa to bar Sears, which had founded Discover Card in 1985, from issuingVisa cards;58 but in 1998, the courts overturned Visa and MasterCard rules prohibiting banks intheir networks from also issuing Discover or American Express cards.59 In 1996, a group of major retailers led by Wal-Mart and Sears sued Visa and MasterCard over their rule requiringmerchants that accepted their credit cards to also accept their signature debit cards; on the eve of the trial in late 2003, the credit card networks agreed to apply their honor-all-cards rule
separately to credit and debit cards and paid the retailers some $3 billion in damages.60 And in2008, a group of businesses sued Visa, MasterCard, Bank of America and others alleging thecredit card networks and certain large banks conspired to set interchange fees in violation of theSherman and Clayton Antitrust Acts, but the Ninth Circuit Court of Appeals found that the plaintiffs had not presented sufficient evidence of a conspiracy.61
Congress is also considering reforming these arrangements. In 2009, legislation wasintroduced by Representative Peter Welch (D-VT), “The Credit Card Interchange Fee Act of 2009,” to bar credit card networks from imposing additional charges on merchants for certain premium payment cards, as well as certain features of honor-all-card rules and no minimum payment rules. The bill would also direct credit card companies to provide consumers with
transparent disclosure of the terms of their contracts and rules, and authorize the Federal TradeCommission to review their rules, terms and agreements.
Other countries have taken stronger steps to regulate these fees and practices. The GAOreports that more than 30 countries have taken actions or are considering doing so to reduceinterchange fees and the antitrust practices of their credit card payment systems. One notablecase is Australia. In 2000, the Reserve Bank of Australia and the Competition and Consumer Commission issued a study on that nation’s credit card payment system, concluding thatinterchange fee rates of 0.95 percent per-transaction were too high and that network rules prohibiting merchants from applying surcharges to reflect interchange fees unnecessarilysuppressed price signals to consumers about the costs of their credit card use.62 Following the
report, the Bank of Australia introduced a series of reforms reducing the weighted averageinterchange fees on Visa and MasterCard from 0.95 percent to 0.50 percent and eliminating the
57 Worthen Bank and Trust v. National Bank Americard , discussed in Evans and Schmalensee (2005b).58 Sears v. Visa, discussed in Evans and Schmalensee (2005b).59 US v. Visa and MasterCard , Department of Justice (2007).60 In re: Visa Check/MasterMoney Antitrust Litigation, discussed in Evans and Schmalensee (2005b).61 Kendall v. Visa, United States Court of Appeals for the Ninth Circuit (2008).62 Bank of Australia and Australian Competition and Consumer Commission (2000).

8/8/2019 Shapiro Vellucci.the Cost of Charging It
http://slidepdf.com/reader/full/shapiro-velluccithe-cost-of-charging-it 18/24
16
no-surcharge rules.63 A 2008 review of these reforms found that they had improved price signalsin the Australian payments system and increased transparency and access.64 The review alsoestimated that consumers had saved $1.1 billion through lower prices in the preceding year,although opponents claimed that annual fees had risen 22 percent and the value of card rewardsas a portion of spending had decreased 23 percent.65
The Australian experience, including the reduction of average interchange fee rates to afraction of their U.S. average levels without apparently reducing the breadth or efficiency of thatnation’s credit card system, argues for a serious review of the American credit card system.Given the substantial costs to consumers and employment of our current arrangements, at aminimum the Federal Reserve and Federal Trade Commission should undertake such a reviewand recommend appropriate changes and reforms.
VI. Conclusion
The use of credit and debit cards by individuals and businesses is ubiquitous, and the benefits for consumers, business customers and merchants are obvious. Yet, the costs of the
credit card system – how much it increases the prices everyone pays and the job effects of those price increases – have not been either recognized widely nor analyzed closely. This study hasexamined the interchange fees which merchants pay on all credit card transactions to the handfulof large banks that issue most credit cards. We find that these fees are substantial: Visa andMasterCard, which account for more than 85 percent of all consumer credit cards and more than62 percent of all commercial cards, impose interchange fees to every credit card purchase thatrange from about 1.0 percent to 3.5 percent of the sale and average 1.5 to 2.0 percent of the sale price.
We further find that these levels of interchange fees are not justified economically. Lessthan 20 percent of interchange fees go to cover the actual transaction and processing costs of thecredit and debit card networks. A substantial share of the remainder of these fees goes to pay for the “rewards” that the banks issuing the credit cards offer higher-income people to adopt their cards, and possibly run up interest and penalty charges. Yet, most of these fees are passed alongin higher prices for everything people buy, whether or not they use a reward-linked credit card or any credit card at all. The result is a system of regressive cross-subsidies in which lower andmoderate-income people, who do not use credit cards or use cards with no rewards, pay higher prices to finance rewards for higher-income credit card users. We estimate that these fees costan average American household some $230 per year in higher prices.
Moreover, the structure of the credit card market and the rules imposed by the dominantnetworks (including American Express and Discover, along with Visa and MasterCard) preventnormal market forces from determining the level of these fees. In particular, credit cards are so
ubiquitous that merchants cannot apply market pressures to bring down their fees bywithdrawing from the major networks, at least not without jeopardizing their sales. Moreover,the rules of these networks prevent merchants from charging customers based on the interchange
63 Bank of Australia (2008b).64 Bank of Australia (2008a).65 Stillman, Bishop, Malcolm and Hildebrandt (2008).

8/8/2019 Shapiro Vellucci.the Cost of Charging It
http://slidepdf.com/reader/full/shapiro-velluccithe-cost-of-charging-it 19/24
17
fee for the card that a customer uses, and preclude consumers from exerting market pressureagainst high interchange fees by paying with cash, by check, or using cards with lower fees.
We further find that by raising prices, these fees also reduce real demand for goods andservices, which in turn harms U.S. employment. We estimate that if interchange fees werelimited to the transaction and processing costs of credit card purchases, the additional resourcesfor consumers would support the creation of more than 240,000 new jobs.
The economic and social concerns over high interchange fees described here are notlimited to the United States. In Australia, concerns in 2000 about high interchange fee rates thatwere still only a fraction of current U.S. levels – fees of 0.95 percent per transaction at the time – led to a high-level inquiry by the Bank of Australia and the Australian Commerce andCompetition Commission. They found that the fees were both too high and insulated fromnormal market signals, and so they introduced reforms that brought down those fees to anaverage of 0.50 percent. A review of the results several years later found that the reformsimproved the transparency, access, and efficiency of the country’s payment system.
Given the large economic costs of our current credit and debit card payment system, theFederal Reserve and the Federal Trade Commission should undertake a comparable inquiry and propose new rules and reforms for the American credit card system and the interchange feescharged through it.

8/8/2019 Shapiro Vellucci.the Cost of Charging It
http://slidepdf.com/reader/full/shapiro-velluccithe-cost-of-charging-it 20/24
18
References
Ashenfelter, Orley, David Ashmore, Jonathan B. Baker, and Signe-Mary McKernan. 1998.“Identifying the Firm-Specific Cost Pass-Through Rate.” Bureau of Economics, Federal Trade
Commission, working paper 217.
Bank of Australia and Australian Competition and Consumer Commission. 2000. “Debit andCredit Card Schemes in Australia: A Study of Interchange Fees and Access.” Reserve Bank of Australia, Australian Competition and Consumer Commission.http://www.accc.gov.au/content/index.phtml/itemId/306324.
Bank of Australia. 2008a. “Reform of Australia’s Payment System: Preliminary Conclusions of the 2007/2008 Review.” http://www.rba.gov.au/payments-system/reforms/review-card-reforms/review-0708-pre-conclusions/index.html.
Bank of Australia. 2008b. “Reform of Australia’s Payment System: Conclusions of the2007/2008 Review.” http://www.rba.gov.au/payments-system/reforms/review-card-reforms/review-0708-conclusions/index.html.
Bickley, M. James. 2003. “Value Added Tax as a New Revenue Source.” CongressionalResearch Service, Issue Brief for Congress.
Brandt, Sharon. 2008. “Consumer Payment Preferences for In-Store Purchases.” First Date,Market Brief.
Bureau of Economic Analysis. 2009. “Industry Economic Accounts: Gross Domestic Product by
Industry Accounts.” US Department of Commerce.www.bea.gov/industry/gpotables/gpo_action.cfm?anon=411346&table_id=24752&format_type=0
Chakravorti, Sujit. 2003. “Theory of Credit Card Networks: A Survey of the Literature.” Review
of Network Economics Vol.2, Issue 2.
Ching, Andrew, and Fumiko Hayashi. 2008. “Payment Card Rewards Programs and Consumer Payment Choice.” Payments System Research, Federal Reserve Bank of Kansas City, working paper 06-02.
Council of Economic Advisers. 2009. “Estimates of Job Creation from the American Recoveryand Reinvestment Act of 2009.” Executive Office of the President, the White House.
http://www.whitehouse.gov/administration/eop/cea/Estimate-of-Job-Creation/
Dawson, Amy and Carl Hugener. 2006. “A New Business Model for Card Payments.” DiamondManagement and Technology Consultants, Inc.
Department of Justice. 2007. “United States v. Visa U.S.A. Inc., Visa International Corporation,MasterCard International Inc.” Antitrust Filings, Antitrust Division, Brief for the United States.http://www.justice.gov/atr/cases/indx57.htm

8/8/2019 Shapiro Vellucci.the Cost of Charging It
http://slidepdf.com/reader/full/shapiro-velluccithe-cost-of-charging-it 21/24
19
Evans, S. David, and Richard Schmalensee. 2005a. “The Economics of Interchange Fees andTheir Regulation: An Overview.” MIT Sloan School of Management, working paper 4548-05.
Evans, S. David, and Richard Schmalensee. 2005b. Paying with Plastic: The Digital Revolution
in Buying and Borrowing. Massachusetts: The MIT Press.
Foster, Kevin, Erik Meijer, Scott Schuh, and Michael A. Zabek. 2009. “The 2008 Survey of Consumer Payment Choice.” Public Policy Discussion Papers, Federal Reserve Bank of Boston.
Government Accountability Office. 2008. “Credit and Debit Cards: Federal Entities Are TakingActions to Limit Their Interchange Fees, but Additional Revenue Collection Cost Savings MayExist.” GAO 08-558, Report to Congressional Requesters.
Government Accountability Office. 2009. “Credit Cards: Rising Interchange Fees HaveIncreased Costs for Merchants, but Options for Reducing Fees Pose Challenges.” GAO 10-45Report to Congressional Addressees.
House Committee on Financial Services. 2009. Full Committee Hearing: H.R. 2382 the CreditCard Interchange Fees Act of 2009 and H.R. 3639, the Expedited CARD Reform for ConsumersAct of 2009. House Financial Service Committee Democratic Staff.http://www.house.gov/apps/list/hearing/financialsvcs_dem/fchrCC_100809.shtml
Levitin, Adam. 2007. “Priceless? The Competitive Costs of Credit Card Merchant Restrains.”Georgetown University Law Center, faculty working papers.
Martin, Andrew. 2009. “Card Fees Pit Retailers Against Banks.” The New York Times, B1.
NACS Online. 2009. “Issue Update: Credit Card Interchange Fees (“Swipe Fees”).” The
Association of Convenience and Petroleum Retailing.
Prager, A. Robin, Mark D. Manuszak, Elizabeth K. Kiser, and Ron Borzekowski. 2009.“Interchange Fees and Payment Card Networks: Economics, Industry Developments, and PolicyIssues.” Federal Reserve Board.
Sidel, Robin. 2009. “Interchange Fees Step into the Spotlight.” The Wall Street Journal ,Business section.
Semeraro, Steven. 2008. “Credit Card Interchange Fees: Debunking Six Myths.” ThomasJefferson School of Law, Legal Studies Research Paper.
Stillman Robert, William Bishop, Kyla Malcolm, and Nicole Hildebrandt. 2008. “RegulatoryIntervention in the Payment Card Industry by the Reserve Bank of Australia.” CRAInternational.
United States Court of Appeals for the Ninth Circuit. 2008. Kendall v. via USA Inc., 518 F. 3d1042. http://www.ca9.uscourts.gov/datastore/opinions/2008/03/06/0516549.pdf
U.S. Census Bureau. 2000. “Statistical Abstract of the United States: 2001.” The National Data Book , 120 Edition.

8/8/2019 Shapiro Vellucci.the Cost of Charging It
http://slidepdf.com/reader/full/shapiro-velluccithe-cost-of-charging-it 22/24
20
U.S. Census Bureau. 2008. “Statistical Abstract of the United States: 2009.” The National Data Book , 128 Edition.
U.S. Census Bureau. 2009. “Statistical Abstract of the United States: 2010.” The National Data Book , 129 Edition.
U.S. Census Bureau. 2002. “Statistics of U.S. Business Data. 2002 Annual Tabulations.”Statistics of US Businesses. www.census.gov/econ/susb/data/susb2002.html.
8/8/2019 Shapiro Vellucci.the Cost of Charging It
http://slidepdf.com/reader/full/shapiro-velluccithe-cost-of-charging-it 23/24
About the Authors
Robert J. Shapiro is the chairman of Sonecon, LLC, a private firm that advises U.S. and foreign businesses, governments and non-profit organizations. Dr. Shapiro has advised, among others,
U.S. President Bill Clinton and British Prime Ministers Tony Blair and Gordon Brown; privatefirms including Amgen, AT&T, Cisco, Gilead Sciences, Google, MCI, Inc., SLM Corporation, Nordstjernan of Sweden, and Fujitsu of Japan; and non-profit organizations including theAmerican Public Transportation Association, the Education Finance Council, BIO, and the U.S.Chamber of Commerce. He is also a senior fellow of the Georgetown University BusinessSchool, chairman of the Globalization Initiative of NDN, chair of the U.S. Climate Task Force,co-chairman of American Task Force Argentina, and a director of the Ax:son-JohnsonFoundation in Sweden. From 1997 to 2001, he was U.S. Under Secretary of Commerce for Economic Affairs, where he directed economic policy for the U.S. Commerce Department andoversaw the nation’s major statistical agencies. Prior to that, he was co-founder and VicePresident of the Progressive Policy Institute. Dr. Shapiro also served as principal economic
advisor in William Clinton’s 1991-1992 presidential campaign, senior economic advisor to the presidential campaigns of Albert Gore, Jr. in 2000 and John Kerry in 2004, Legislative Director for Senator Daniel P. Moynihan, and Associate Editor of U.S. News & World Report. In 2008, headvised the campaign and presidential transition of Barack Obama. He has been a Fellow of Harvard University, the Brookings Institution, and the National Bureau of Economic Research.He holds a Ph.D. and M.A. from Harvard, as well as an A.B. from the University of Chicago anda M.Sc. from the London School of Economics and Political Science.
Jiwon Vellucci is a senior policy analyst at Sonecon, LLC. Prior to joining Sonecon, Ms.Vellucci, who is fluent in Mandarin and Korean, served as research analyst at the PetersonInstitute for International Economics, where her work focused on the Chinese economy and
U.S.-China economic relations. She received an M.A. in Asian Studies from the Elliott Schoolof International Affairs at George Washington University and her B.A. with Magna Cum Laudehonors from Ewha Woman’s University in South Korea. Ms. Vellucci is currently working onher M.S. in finance at the Johns Hopkins University Carey School of Business.

8/8/2019 Shapiro Vellucci.the Cost of Charging It
http://slidepdf.com/reader/full/shapiro-velluccithe-cost-of-charging-it 24/24