
Shaping our slice of heaven Regions of opportunity · 2020-05-09 · manufacturing, food processing...
59
Shaping our slice of heaven Regions of opportunity May 2019
Transcript of Shaping our slice of heaven Regions of opportunity · 2020-05-09 · manufacturing, food processing...

Shaping our slice of heavenRegions of opportunityMay 2019
Regions of opportunity
2
Executive summary 3
Context to our ‘within New Zealand’ story 7
Place: Purpose and how it is defined in this report 10
National and regional economic impact 12
Auckland 17
Waikato 23
Hawke’s Bay/Gisborne 29
Wellington 35
Canterbury 41
Building a platform for economic success across our regions 46
Appendix 48
Endnotes 55
Contacts 58
Contents

Regions of opportunity | Executive summary
3
Executive summary
The regions of opportunity narrativeWelcome to the second edition of the Shaping our slice of heaven series, entitled ‘Regions of opportunity’.
In the first edition of the series, we focused on the economic opportunities presented by export industries that are predicted to experience above average global economic growth and are industries in which New Zealand has comparative advantages. We developed a national prosperity map identifying five industries of opportunity for New Zealand: tourism, agribusiness, advanced manufacturing, food processing and international education.
In this second report, we move away from the national view and take a deep dive into our regions. We examine how increasing exports in four of these industries of opportunity (we’ve left out international education as the data is either too complex or missing) can contribute to the economic growth of some of our country’s diverse regions, both individually and together, for a more prosperous outlook overall.
New Zealand has plenty of goods and services exports to offer world markets but the country’s full export potential hasn’t yet been realised. The diverse nature of its landscapes, towns and cities means New Zealand shouldn’t be treated as a monolith – to overlook our regional variety and the particular opportunities that come with each is to miss a crucial chance to substantially change economic development for the better.
New Zealand already has a well-developed narrative projecting to the world why it should not be overlooked both as a destination for inward investment and a place to source goods and services. But while this outwardly focused narrative is vitally important on the world stage, we believe there is further value to be unlocked by telling the ‘within New Zealand story’ that lies beneath. In this report, we examine our four industries of opportunity across five regions – Auckland, Waikato, Hawke’s Bay/Gisborne, Wellington and Canterbury – to develop our ‘regions of opportunity’ narrative. We deliberately chose a mix of five urban, provincial and mixed urban/
provincial regions to demonstrate the differences. These five regions are home to over two-thirds of the total population and account for three-quarters of the nation’s gross domestic product (GDP).
Economic impact of increased exportsUsing our Deloitte Access Economics in-house computable general equilibrium (CGE) model, we assessed the potential economic impact of increasing exports across these four industries in the five regions chosen. Our analysis aims to understand how growth in key industries can result in quite different outcomes for the different regions, depending on their unique characteristics.
The key question we are asking is what role can different regions play in supporting our overall economic success, driven by export growth? Or to put it another way, how can our regions build a pathway to prosperity, and what role do exports play in this picture?
To answer this question, we have measured the economic impact of scenarios under which each of the
The Shaping our slice of heaven series is designed to promote debate across business, industry associations, government and the media on issues facing the New Zealand economy. Our aim is to shine a spotlight on the challenges we face as a country to improve our overall prosperity and wellbeing, and in doing so ask some hard questions about what we are doing to rise to these challenges.

Regions of opportunity | Executive summary
4
Auckland
Tourism $3.9bn
Agribusiness $2.5bn
Food processing $6.1bn
Advanced manufacturing $2.9bn
National
Tourism $11.5bn
Agribusiness $4bn
Food processing $10.6bn
Advanced manufacturing $6.1bn
Waikato
Tourism $1.4bn
Agribusiness $500m
Food processing $800m
Advanced manufacturing $100m
Hawke’s Bay/Gisborne
Tourism $900m
Agribusiness $600m
Food processing $500m
Advanced manufacturing $200m
Canterbury
Tourism $600m
Agribusiness $500m
Food processing $1.5bn
Advanced manufacturing $900m
Wellington
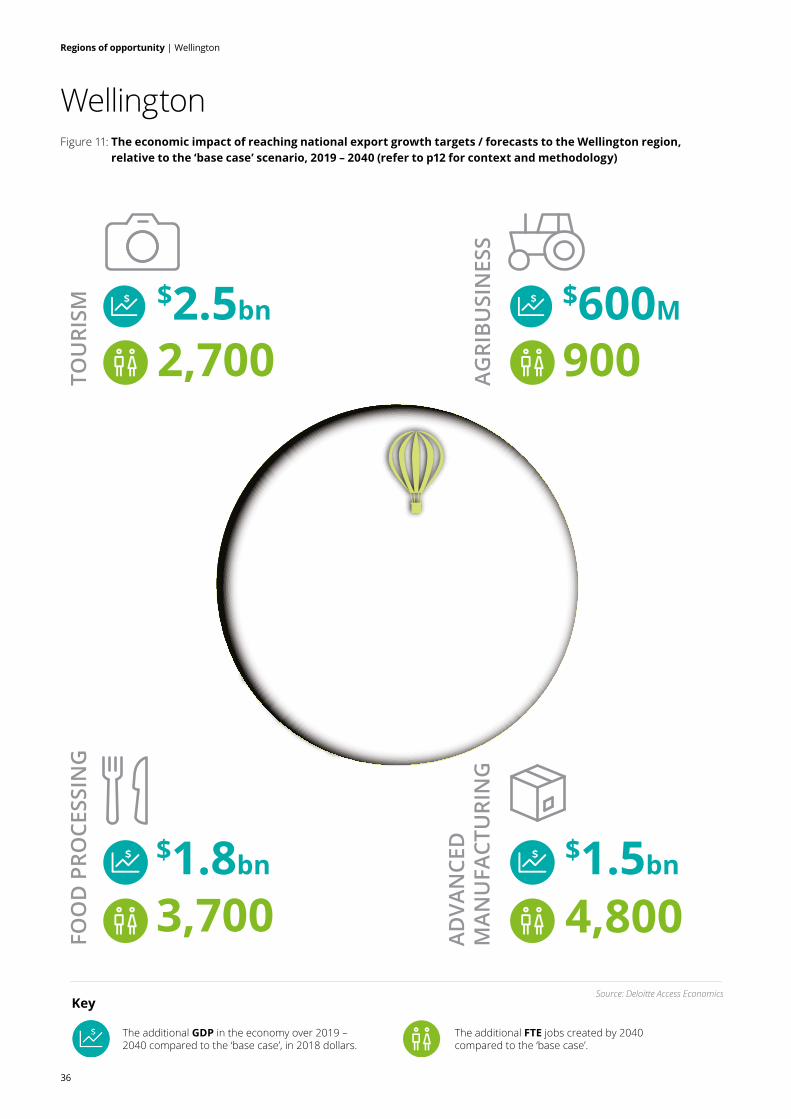
Tourism $2.5bn
Agribusiness $600m
Food processing $1.8bn
Advanced manufacturing $1.5bn
Results for the rest of New Zealand are not presented in this infographic.
Figure 1
Economic impact in GDP terms 2019-2040
Regions of opportunity | Executive summary
5
four industries exports grow at a rate necessary to reach industry or government targets. Our economic model simulates how the economy will respond and re-adjust to increased export growth, over the period from 2019 to 2040. The model is sufficiently dynamic to estimate the impact across all regions in New Zealand, including any inter-regional trade.
National economic impactOur modelling reveals our hypothesis to be sound – namely that export growth in these industries can result in significant benefits for each of our regions of opportunity, and in turn for the country. Across all five regions analysed, in aggregate, our modelling shows that:
• Over the period 2019 to 2040, the economy would be $11.5 billion (4.3 percent) larger in real terms if our five regions of focus grow at the national export growth target set for tourism. In addition, there is a boost in employment of an additional 23,100 full-time equivalent (FTE) jobs.
• The additional national GDP, as a result of the five regions growing at the national export growth target for agribusiness, equals approximately $4 billion over the period and there would be 6,500 FTE additional jobs created.
• If the regions we modelled grew to meet national export growth targets for food processing, national GDP would increase $10.6 billion and employment would grow by around 23,200 FTE jobs.
• Achieving the national research and development (R&D) target by growing advanced manufacturing exports would add an additional 39,500 FTE jobs and increase GDP by $6.1 billion.
Some more of the insights gained from the economic modelling of our scenarios unearth a range of interesting insights at the regional level. Moving geographically from north to south, they are as follows.
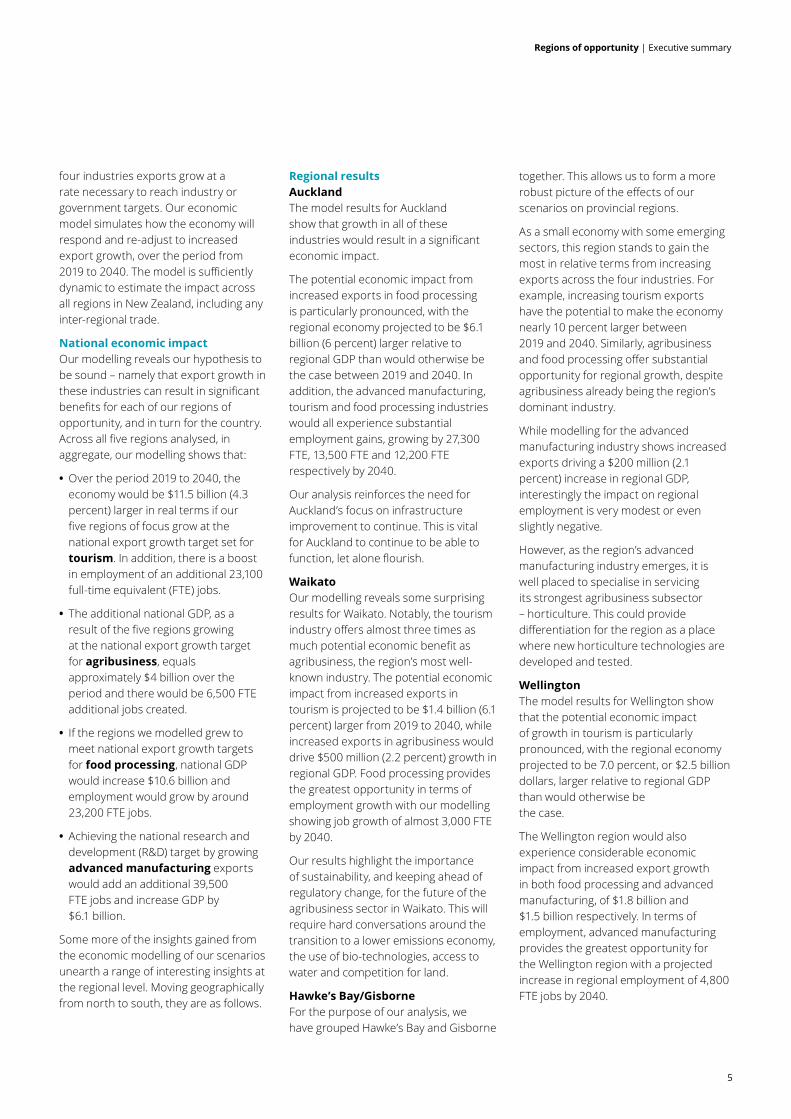
Regional resultsAucklandThe model results for Auckland show that growth in all of these industries would result in a significant economic impact.
The potential economic impact from increased exports in food processing is particularly pronounced, with the regional economy projected to be $6.1 billion (6 percent) larger relative to regional GDP than would otherwise be the case between 2019 and 2040. In addition, the advanced manufacturing, tourism and food processing industries would all experience substantial employment gains, growing by 27,300 FTE, 13,500 FTE and 12,200 FTE respectively by 2040.
Our analysis reinforces the need for Auckland’s focus on infrastructure improvement to continue. This is vital for Auckland to continue to be able to function, let alone flourish.
WaikatoOur modelling reveals some surprising results for Waikato. Notably, the tourism industry offers almost three times as much potential economic benefit as agribusiness, the region’s most well-known industry. The potential economic impact from increased exports in tourism is projected to be $1.4 billion (6.1 percent) larger from 2019 to 2040, while increased exports in agribusiness would drive $500 million (2.2 percent) growth in regional GDP. Food processing provides the greatest opportunity in terms of employment growth with our modelling showing job growth of almost 3,000 FTE by 2040.
Our results highlight the importance of sustainability, and keeping ahead of regulatory change, for the future of the agribusiness sector in Waikato. This will require hard conversations around the transition to a lower emissions economy, the use of bio-technologies, access to water and competition for land.
Hawke’s Bay/GisborneFor the purpose of our analysis, we have grouped Hawke’s Bay and Gisborne
together. This allows us to form a more robust picture of the effects of our scenarios on provincial regions.
As a small economy with some emerging sectors, this region stands to gain the most in relative terms from increasing exports across the four industries. For example, increasing tourism exports have the potential to make the economy nearly 10 percent larger between 2019 and 2040. Similarly, agribusiness and food processing offer substantial opportunity for regional growth, despite agribusiness already being the region’s dominant industry.
While modelling for the advanced manufacturing industry shows increased exports driving a $200 million (2.1 percent) increase in regional GDP, interestingly the impact on regional employment is very modest or even slightly negative.
However, as the region’s advanced manufacturing industry emerges, it is well placed to specialise in servicing its strongest agribusiness subsector – horticulture. This could provide differentiation for the region as a place where new horticulture technologies are developed and tested.
WellingtonThe model results for Wellington show that the potential economic impact of growth in tourism is particularly pronounced, with the regional economy projected to be 7.0 percent, or $2.5 billion dollars, larger relative to regional GDP than would otherwise be the case.
The Wellington region would also experience considerable economic impact from increased export growth in both food processing and advanced manufacturing, of $1.8 billion and $1.5 billion respectively. In terms of employment, advanced manufacturing provides the greatest opportunity for the Wellington region with a projected increase in regional employment of 4,800 FTE jobs by 2040.
Auckland
Tourism $3.9bn
Agribusiness $2.5bn
Food processing $6.1bn
Advanced manufacturing $2.9bn
National
Tourism $11.5bn
Agribusiness $4bn
Food processing $10.6bn
Advanced manufacturing $6.1bn
Waikato
Tourism $1.4bn
Agribusiness $500m
Food processing $800m
Advanced manufacturing $100m
Hawke’s Bay/Gisborne
Tourism $900m
Agribusiness $600m
Food processing $500m
Advanced manufacturing $200m
Canterbury
Tourism $600m
Agribusiness $500m
Food processing $1.5bn
Advanced manufacturing $900m
Wellington
Tourism $2.5bn
Agribusiness $600m
Food processing $1.8bn
Advanced manufacturing $1.5bn
Results for the rest of New Zealand are not presented in this infographic.

Regions of opportunity | Executive summary
6
“It’s not enough to develop regional economic development plans region by region, without considering how the regions link together, and where each region’s competitive advantage lies”
These results may seem counter-intuitive at first, but the signs have been apparent for some time that the region has opportunities to increase economic growth and add jobs outside of the public sector. In our view Wellington must look to its other competitive advantages, which may be found in the synergies between the film and creative, food and beverage, and tourism sectors.
CanterburyThe Canterbury region is well-known for its agriculture and food processing industries. Therefore it’s not surprising that our modelling shows food processing provides the greatest opportunity in terms of GDP, growing by $1.5 billion (4.3 percent) over the period from 2019 to 2040.
Untapped potential in value-add food processing should be seen as a significant opportunity for the region, leveraging its agribusiness sector. And further consideration of how best to grow Canterbury’s advanced manufacturing sector should take into account the region’s natural resources and wealth of business services.
A key question is how Canterbury can diversify these sectors to increase its national and global share. Examples include moving towards precision agriculture, diversifying food processing and expanding the electronic manufacturing hub in Canterbury.
Next stepsWhile all of New Zealand’s regions stand to benefit from key export industries, such as tourism, both the opportunities and the benefits will not be evenly distributed. Some regions may be better placed investing in other industries that draw on their strengths, including existing business clusters, natural advantages or logistics connectivity.
In our view it is not enough to develop regional economic development plans region by region, without considering how the regions link together, and where each region’s competitive advantage lies. So how do we build a strong platform for economic success across all our regions? For our regions to thrive and take advantage of the opportunities presented to them, some important questions need be addressed. They include:
• How do we get regions working together to support a more coordinated ‘within New Zealand ’ regional economic development strategy
• How can we ensure that local government and economic development agencies are appropriately equipped to support strategies for growth that embrace regional differences?
• How do we ensure that growth in Auckland – New Zealand’s economic
powerhouse – does not shrink or have negative effects on the regions?
• How can we build on our regional differences to increase our overall economic resilience to respond to external shocks?
• And as New Zealand transitions to a lower carbon economy, how can we ensure that the learnings from Taranaki’s Just Transition programme are shared and applied across other regions?
By starting conversations to address these questions now, we can preserve and enhance the future prosperity of our regions of opportunity, and by extension, New Zealand as a whole.

7
Regions of opportunity | Context
Context to our ‘within New Zealand’ storyThe importance of regional economic growth in driving overall national growth cannot be over-emphasised. It is essential that all regional economies within New Zealand continue to thrive.
Context to our ‘within New Zealand’ storyOver-reliance on a handful of urban economies, such as Auckland, Wellington and Canterbury, to provide growth for the entire nation leaves New Zealand vulnerable to economic shocks. For instance, an asymmetric shock to urban centers in the form of a downward property price adjustment would likely soften consumer demand due to declining wealth and reduced consumer confidence. Supporting growth more broadly within regional economies would spread economic risk over a greater number of geographical markets and improve overall economic resilience.
This begs the question of what role regions across New Zealand should play in supporting overall economic success and to what degree there should be centralised coordination of these efforts. Deloitte refers to this as the ‘within New Zealand’ story.
A refreshed focus on regional economic developmentThere have been efforts to develop the ‘within New Zealand’ story, including a refreshed government focus on regional economic development, which includes:
The Provincial Growth Fund aims to close the gap between growing and struggling regions, which has come about due to long-term underinvestment and intergenerational poverty.
The Ministry of Business, Innovation and Employment (MBIE)’s Just Transition Unit manages the impact and maximises opportunities associated with the changes brought about by New Zealand’s transition to a low emissions economy. The initiative’s current focus considers what a Just Transition would look like in Taranaki.
The Living Standards Framework informs how the Government prioritises investment, and how to measure economic success. The focus is currently at a national level, but the regional implications of this framework are just as important.
A research and development tax credit (R&D tax credit) was recently introduced, which is critical for lifting investment in R&D and innovation in New Zealand, and will contribute to shaping our regions.
The New Zealand Infrastructure Commission is being established to ensure the country gets the quality infrastructure investment required for long-term economic prosperity. It will provide support strategy, planning, procurement and delivery across New Zealand, and therefore unlock growth opportunities at a regional and national level.
A future of work study is underway to consider the effects of technological disruption on work. Digital disruption is both a risk, as it threatens to replace or transform traditional jobs, but also an opportunity to create jobs demanding new skills. The future of work, and the outcome of this study, will certainly have an impact on all regions over the long-term.

8
Regions of opportunity | Context
Exports shaping our regional futures There is, however, a lack of consideration of how regional exports could benefit regional economic development. There is a focus on exports nationally, through targets set by industry and strategies for how exports could be diversified. In 2014 the Productivity Commission conducted a study to understand inter-regional trade and the extent to which goods and services are traded across distances within New Zealand.1 But there is as yet little evidence on the link between exports and regional economic development.
Export-driven growth is highly important for New Zealand. We are trade-dependent, with exports directly accounting for a third of the country’s economic output. In addition, exports such as tourism, agribusiness, food processing and advanced manufacturing provide strong anchors for New Zealand’s economy. New Zealand is exposed to risks associated with being trade-dependent, such as exchange rate fluctuations and being a price-taker in
the world economy, but can also reap significant benefits from trade, such as enhanced efficiency and increased innovation. Through this, if risks are managed, trade can lead to increased economic growth, higher employment and improvements in living standards.
In this second edition of our Shaping our slice of heaven series, Deloitte further develops the ‘within New Zealand’ story by determining the economic impact of increasing exports – both international and inter-regional – and how our regions can prosper from this.
Deloitte recognises prosperity is more than just economic growth and increased employment. Regions are more than that – their people, social cohesion, institutions, environment, history, culture, infrastructure, and proximity to other regions (to name a few) all have a bearing on the future prosperity of our cities and regions. However, this report is predominately focused on the economic and employment outcomes
of our regions, rather than the broader wellbeing outcomes.
Relationship between exports and economic growth As a small, open economy, New Zealand is highly exposed to global trends and events, which can have significant influence on our macroeconomic and social environment. New Zealand borrows money from overseas, so international monetary policy changes can flow through to our interest rates. This has economic impacts on things like mortgage repayment amounts and savings rates. Changes in the exchange rate, for instance, makes our products more or less desirable in relation to products from another country, directly affecting the profits of New Zealand exporters.
From a ‘within New Zealand’ perspective, exports facilitate economic growth at a regional level in terms of increasing output, employment and overall living standards for those based within the region.
A primary way businesses interact with the world is through trade inflows and outflows. For instance, New Zealand businesses sell milk and meat products to overseas consumers, we provide technical expertise to international businesses and welcome tourists into our country. It is not just cities that benefit – strong export demand is a central contributing factor to buoyant growth seen throughout the provinces.
One mechanism underpinning economic growth is based on extracting more out of the same inputs (improved productivity). Improving the productive capacity of resources involves identifying and understanding our industries of opportunity and building upon regional competitive advantages through investment and innovation. Productivitiy
improvementsImproving the productivitycapacity of resources lies atthe heart of sustainable andlong-term economic growth
Local strengths and opportunities
Regions need to undestand where their strengths lie, relative to other regions in
New Zealand, and also the world
Global industries ofopportunities
Understand what the globalopportunities are based on
global economic growth andNew Zealand’s comparative
advantages
Regional economic growth drives overall
economic growth
Source: Deloitte Access Economics
Figure 2: The relationship between exports and regional economic growth
Export growthThrough strategic growth in sectors with potential
global opportunities, regions can achieve
national export targets
9
Regions of opportunity | Context
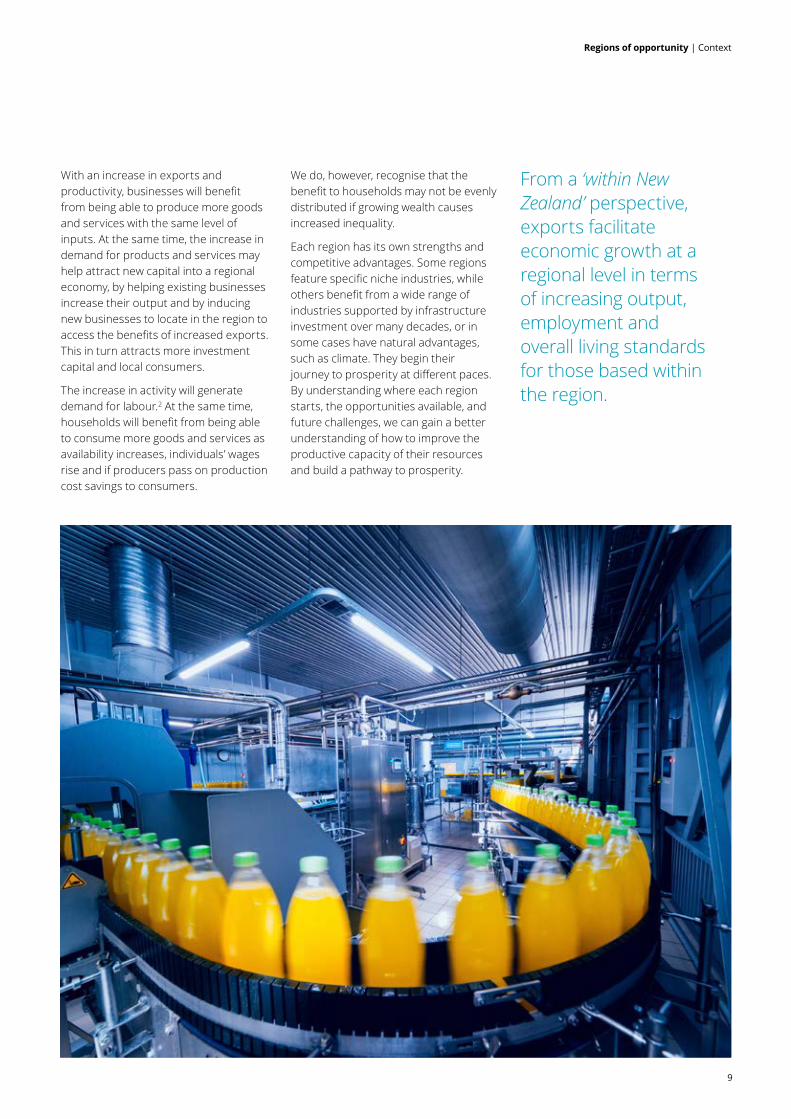
With an increase in exports and productivity, businesses will benefit from being able to produce more goods and services with the same level of inputs. At the same time, the increase in demand for products and services may help attract new capital into a regional economy, by helping existing businesses increase their output and by inducing new businesses to locate in the region to access the benefits of increased exports. This in turn attracts more investment capital and local consumers.
The increase in activity will generate demand for labour.2 At the same time, households will benefit from being able to consume more goods and services as availability increases, individuals’ wages rise and if producers pass on production cost savings to consumers.
We do, however, recognise that the benefit to households may not be evenly distributed if growing wealth causes increased inequality.
Each region has its own strengths and competitive advantages. Some regions feature specific niche industries, while others benefit from a wide range of industries supported by infrastructure investment over many decades, or in some cases have natural advantages, such as climate. They begin their journey to prosperity at different paces. By understanding where each region starts, the opportunities available, and future challenges, we can gain a better understanding of how to improve the productive capacity of their resources and build a pathway to prosperity.
From a ‘within New Zealand’ perspective, exports facilitate economic growth at a regional level in terms of increasing output, employment and overall living standards for those based within the region.
10
Regions of opportunity | Place
Place: Purpose and how it is defined in this report
Purpose of place and how it is definedThe physical attributes of a location, such as climate, geography, and proximity to other areas, influence where individuals and businesses locate. It is true that technology has eroded the traditional relevance of place for businesses and individuals. Yet a growing body of international and local research shows that geographic clusters of companies in related industries continue to feature in virtually every geographic area – nationally, regionally, and even in towns and cities. The existence of these subnational clusters reveal that location still has a role to play in harnessing future prosperity.
Place can be defined in a number of different ways. Often the main urban areas define New Zealand both geographically and economically. Everywhere else is identified as ‘the regions’. Technology, globalisation and urbanisation further this gap between urban and provincial. Deloitte has also observed that while young people are flocking to the cities for education and work opportunities, populations outside the cities are growing old.3 At the same time, the decline in New Zealand-based manufacturing and lower export prices seriously affects some provinces or ‘regions’.
How place is defined in reportFor the purpose of this report, we consider ‘place’ to be a region based on Statistics New Zealand’s defined boundaries. New Zealand has 16 regions, and our regions of focus in this report are:
• Auckland
• Waikato
• Hawke’s Bay/Gisborne
• Wellington
• Canterbury
We chose regions hosting the four most populated urban centres – Auckland, Wellington, Canterbury and Waikato – as they represent over two-thirds of the New Zealand population.4 They are also diverse in terms of their main industries. While most of these focus on knowledge-based industries, Waikato and Canterbury also have significant manufacturing sectors and contribute almost 30 percent of the country’s agricultural Gross Domestic Product (GDP). We selected Hawke’s Bay/Gisborne as comparator regions as their economy is mainly based on primary industry and are relatively sparsely populated. In addition, these two smaller regions have yet to be studied elsewhere in detail – unlike Taranaki, which is the current pilot study in MBIE’s Just Transition initiative.
The regional split of exports within our focus regionsSome of our regions of focus are more export-driven than are others. For example, if we only consider both goods and services exported from New Zealand in 2018, Auckland has the highest share of exports of our focus regions (25 percent), followed by Canterbury (15 percent). In total, our focus regions account for approximately 60 percent of total exports from New Zealand.5
The physical attributes of a location, such as climate, geography, and proximity to other areas, influence where individuals and businesses locate.

11
Regions of opportunity | Place
Figure 3
Regional GDP growth and split of exports from New Zealand
8.3%
4.7%
4.5%
6.9%
25%
5.3%
9.1%
7.5%
Canterbury
14.6%
4.6%
Waikato
Auckland
Hawke’s Bay/Gisborne
Wellington
Split of Exports
GDP Growth (2017-2018)
Key
Source: Deloitte Access Economics based on regional export data obtained from Infometrics, and analysis of Statistics New Zealand data where gaps were present in the Infometrics regional export data. Including both products and services (percentage share of total exports from New Zealand, 2018)
Source: Statistics New Zealand, year end March
12
Regions of opportunity | Economic impact
National and regional economic impact
What role should regions play in supporting overall economic success? How can our regions build a pathway to prosperity, and what role do exports play in this picture?
To address these questions, our analysis focuses on:
• The industries that would provide New Zealand with the best chance to successfully turn local advantage into global competitiveness (industries of opportunity).
• The economic impact of increasing exports, within each industry of opportunity, on our regions and the New Zealand economy as a whole (economic impact).
Industries of opportunityThis report focuses on four of New Zealand’s five industries of opportunity:6
Tourism
Agribusiness
Food processing
Advanced manufacturing
These are the industries identified in Shaping our slice of heaven: Industries of opportunity, as having both above average global economic growth over the next 20 years, as well as industries in which New Zealand has a strong comparative advantage on the global stage. Our prosperity map outlines where these sit relative to other industries, as seen in Figure 3.
We are not attempting to “pick winners”. We recognise that there are other industries contributing to New Zealand’s prosperity, and these industries – or ones that haven’t been identified yet – may end up also being key to future economic prosperity. We also recognise that there are other types of prosperity, such as social prosperity, that this report doesn’t cover.
However, based on these selected industries, we wanted to know how our regions of focus could benefit from increased export growth. To do so, we measured the economic impact of scenarios in which each industry of opportunity’s exports grow at the high-growth profile necessary to reach certain industry or government targets.
Assessment of the economic impact of increasing exports on our focus regionsWe used our in-house regional general equilibrium model (DAE-RGEM) to estimate the economic impact of growing exports in our industries of opportunity. The model simulates how the economy will respond and adjust to increased export growth over the period of 2019 to 2040. We assume that this growth stems from change within New Zealand, in particular from an increase in productivity in each relevant industry, rather than from an increase in demand from international markets. Since productivity improvements do not differentiate between production for domestic consumption and export, these improvements benefit the entire industry’s production regardless of the final consumer.
Based on the assumed increase in exports, DAE-RGEM models the behavioural response of consumers, firms, governments and overseas markets. At the same time, it observes resource constraints and takes into account the optimal distribution of resources. The model has the ability to incorporate the flow-on impacts to any region of New Zealand and the rest of the world.
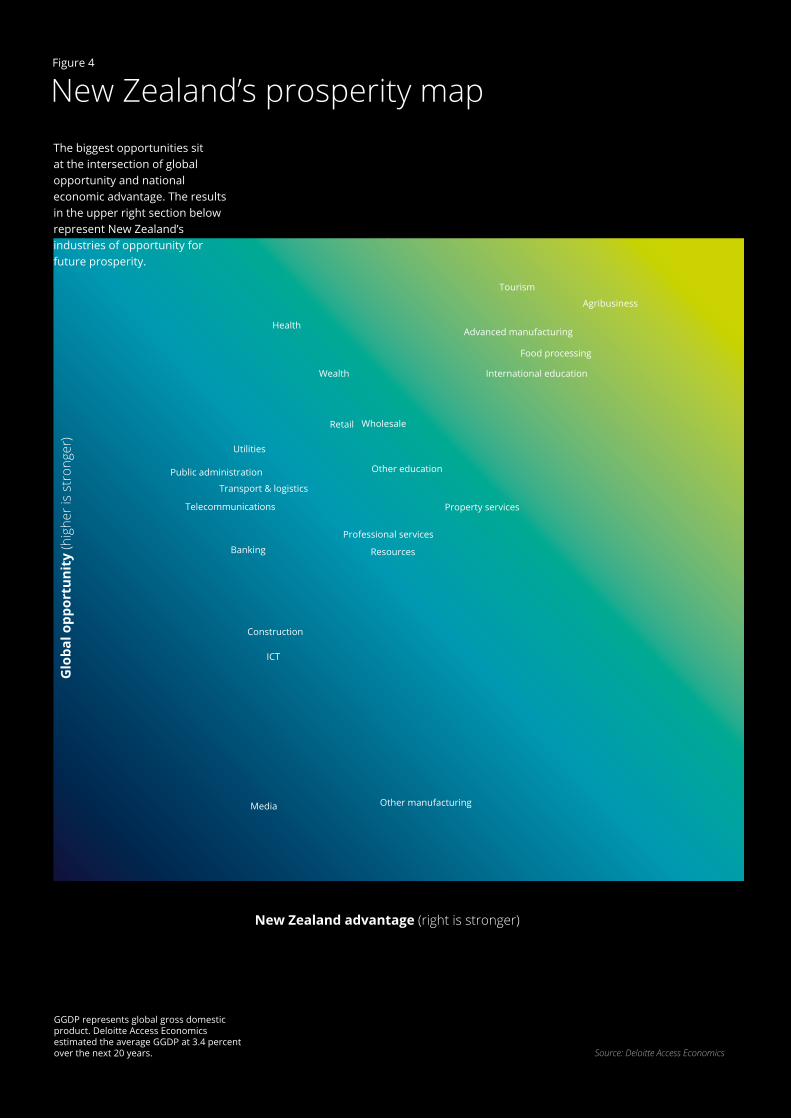
New Zealand’s prosperity map
+10% of GGDP
-10% of GGDP
Agribusiness
Resources
Food processing
Advanced manufacturing
Other manufacturing
New Zealand advantage (right is stronger)
Glo
bal o
ppor
tuni
ty (h
ighe
r is
stro
nger
)
Utilities
Construction
Transport & logistics
ICT
Media
Telecommunications
Banking
Wealth
Public administration
International education
Other education
Health
Tourism
WholesaleRetail
Professional services
Property services
The biggest opportunities sit at the intersection of global opportunity and national economic advantage. The results in the upper right section below represent New Zealand’s industries of opportunity for future prosperity.
Figure 4
Source: Deloitte Access Economics
GGDP represents global gross domestic product. Deloitte Access Economics estimated the average GGDP at 3.4 percent over the next 20 years.
13
Regions of opportunity | Economic impact

14
Regions of opportunity | Economic impact
This provides a ‘what if’ style analysis, based on a hypothetical scenario where the five focus regions achieve the export growth necessary to reach national targets.
Appendix B details our approach, our in-house DAE-RGEM tool, and the inputs used in the model.
Scenarios and key inputs To determine the economic impact of the increased export growth, we compare the national and regional economies under two distinct scenarios:
• The ‘base case’ scenario grows exports at the same rate as the average annual growth rate over the past ten years for each industry.
• The ‘counterfactual’ scenario grows exports at a higher rate than the base-case scenario. We have used the growth rate required to achieve national export targets set for each industry of opportunity.7 This creates a ‘high-growth profile’.
We modelled four independent ‘counterfactual’ scenarios – one for each industry of opportunity. In each ‘counterfactual’ scenario, high-growth profiles are applied to our focus regions.8 We recognise that how each region responds to export growth will differ due to differences in, for example, access to capital and resources, available products and services, level of competition, and employment opportunities.
However, our focus regions follow a higher-growth path, while all other regions grow at their ‘base case’ growth rates.
Appendix A outlines our methodology to create export growth profiles for both scenarios.
Export targets are what our country aspires to in order to maximise prosperity. They are set to help government achieve their priorities and hold industry leaders accountable. We used the following export targets to inform our ‘counterfactual’ scenario for each industry of opportunity:
• Tourism: MBIE forecasts international tourist spending in New Zealand to reach $14.8 billion in 2024, up 40 percent from 2017.9 To meet this forecast, international tourist spending would have to grow on average by 5.4 percent annually up to 2024. We think, given increasing tourist spend and the current economic conditions, achieving this target is feasible.
• Agribusiness: In 2014, the Primary Industries Minister announced an ambitious goal to double the value of primary sector exports from its 2012 level to $64 billion by 2025.10 This would require an annual growth rate of 6.2 percent from now until 2025 for agribusiness. With current exports in agribusiness not keeping up with the growth required, we think this target is a stretch. However, the agribusinesses industry is looking positive over the long-term, and we expect the industry to respond to the key challenges it faces to continue to be prosperous.
• Food processing: The export target for food processing is included in the primary sector target just mentioned. Further to that, Fonterra – New Zealand’s largest dairy exporter – has an aggressive growth target to reach $35 billion in total revenue by 2025.11 These targets in aggregate suggest that an annual growth rate of 7.5 percent is required to achieve the export targets set for food processing exports. We feel this target is optimistic, despite the historic average annual growth rate of 5.1 percent. However, the food processing sector in New Zealand has experienced a boom over the past few years, and the constant growth rate needed to achieve the export target is still possible.
• Advanced manufacturing: The Government is determined to increase research and development (R&D) and productivity, announcing in the 2018 Budget their commitment to increase national investment in R&D to 2.0 percent of GDP.12 R&D expenditure has a significant impact on advanced manufacturing exports.13 Using the findings from a 2014 study,14 we estimated what the growth in advanced manufacturing exports would be if R&D expenditure reached the desired 2.0 percent of GDP by 2040.15 This shows that exports would grow at 6.0 percent per annum to 2040. Assuming the relationship between R&D expenditure and growth in advanced manufacturing exports is similar in New Zealand, we think this growth rate is achievable, given the right incentives are created by the implementation of R&D tax credits and the growing demand for advanced manufacturing exports.
We modelled four independent ‘counterfactual’ scenarios – one for each industry of opportunity. In each ‘counterfactual’ scenario, high-growth profiles are applied to our focus regions.

15
Regions of opportunity | Economic impact
As sectors are interrelated and affected by changes in other industries, related industries also benefit from an increase in exports (and therefore increased production) by our industries of opportunity. For example, the economic impact of the agribusiness ‘counterfactual’ scenario is $4.0 billion to New Zealand over the period 2019 to 2040. This does not mean that the GDP growth is limited to the agribusiness industry, but rather the economic benefit is spread across a number of industries.
$1.9 billion in GDP growth out of the total $4.0 billion economic benefit comes through GDP growth within agribusiness, $1.3 billion comes through growth in ‘other business services’ and a further $500 million from both ‘trade’ and ‘other government services’.18 This explains why we will observe in the following sections of the report that regions that are not relatively strong in an industry of opportunity
may still see considerable GDP growth occurring from exports in that particular industry.
Economic shocks rarely occur in isolation, therefore the modelling should be interpreted as an indication of the potential magnitude of the impact of increasing exports in each industry and each region, but not as a prediction of the future.
Regional economic impact on our focus regions Which of the industries are likely to provide the largest benefit to each region from strong export growth?
The estimated economic impact varies significantly across our focus regions. This variability is driven by differences in the relative size of the industry, the economic composition within the region and the extent to which each region is export-driven.
The next five chapters provide a detailed narrative on each region, discussing:
• An overview of the current economic conditions. The economic impact results, in terms of regional GDP and employment for each industry of opportunity.
• A consideration of how the region could amplify the economic opportunity identified in our economic impact results.
Economic impact on New Zealand Our analysis reveals that the economy would enjoy considerable benefits as a direct result of increasing exports in our industries of opportunity from our regions of focus. Specifically, we estimate that:16
Over the period 2019 to 2040, the economy would be 4.3 percent larger in real terms if our regions of focus grow at the national export growth target set for tourism. This is a gain of approximately $11.5 billion in 2018 dollars. Similarly, when compared to the ‘base case’ scenario, there is a boost in employment of an additional 23,100 full-time equivalent (FTE) jobs by 2040.
The additional national GDP, as a result of our regions of focus growing at the national export growth target for agribusiness, equals approximately $4 billion over 2019 to 2040, relative to the ‘base case’ scenario.17 There would also be 6,500 FTE additional jobs created by 2040.
If our regions of focus grew at national export growth targets for food processing between 2019 and 2040, there would be an increase of approximately $10.6 billion in national GDP. This also has the potential to increase employment by around 23,200 FTE jobs by 2040.
Achieving the national R&D target, and as a result our regions of focus growing advanced manufacturing exports, would add an additional 39,500 FTE jobs by 2040. This also has the potential to increase the size the economy by $6.1 billion over the period 2019 to 2040, when compared to the ‘base case’ scenario.


Regions of opportunity | Auckland
17
Auckland Tāmaki-makau-rau
Auckland is growing rapidly thanks in part to record levels of overseas immigration.19 While barely taking up 2 percent of New Zealand’s land area, it is home to over one third of the population and recently reached 1.6 million people. Population growth is forecast to remain strong with the region predicted to reach 2 million people by 2028. It is responsible for almost 40 percent of New Zealand’s GDP and a quarter of our exports.20
With a growing population, and limited land for urban sprawl, dense urban areas will need to manage the upward pressure on living costs. These areas have a house price to income ratio of 8.8, and Auckland City is now the 9th least affordable in a survey of over 90 cities across the world.21 Future economic growth and prosperity will need to overcome the challenges an ever-increasing population brings. This is a significant challenge with no easy solution.
Industries of opportunityAuckland is the gateway to New Zealand, with 75 percent of all international visitors entering the country through Auckland International Airport.22 The city is a hub for large events like the America’s Cup, which is scheduled to be hosted there in 2021. Growth in tourism is supported by additional investment in the hotel sector, with 41 projects expected to deliver an additional 6,500 rooms over the next five years, an increase of approximately 90 percent.23
Auckland is also a key location for New Zealand’s food and beverage and advanced manufacturing sectors.24 Its proximity to the Waikato agricultural hub supports a thriving food processing sector. In addition, increasing international recognition for Auckland’s high-tech manufacturing industry has made it the country’s most acclaimed innovation hub.
Two thirds of New Zealand’s top 50 food and beverage companies are headquartered in Auckland. The industry in Auckland comes with a material R&D component, housing facilities such as the FoodBowl, a state of the art facility for R&D trials, as well as the Liggins Institute, which leads research into the development of food products with specific health benefits.25
Advanced manufacturing in Auckland is supported by GridAKL, the region’s innovation precinct and home to more than 100 businesses, from start-ups to multinationals. The region also contains a strong health technology subsector, as well as cutting edge engineering, 3D printing, robotics and space technology firms.26
34.7% of New Zealand’s population
37.9% of New Zealand’s GDP
1.9% of New Zealand’s land area

$3.9bn
13,500$2.5bn
3,700
$6.1bn
12,200$2.9bn
27,300
TOU
RISM
FOO
D P
ROCE
SSIN
G
AGRI
BUSI
NES
SAD
VAN
CED
M
ANU
FACT
URI
NG
Key
The additional GDP in the economy over 2019 – 2040 compared to the ‘base case’, in 2018 dollars.
The additional FTE jobs created by 2040 compared to the ‘base case’.
Source: Deloitte Access Economics
AucklandFigure 5: The economic impact of reaching national export growth targets / forecasts to the Auckland region,
relative to the ‘base case’ scenario, 2019 – 2040 (refer to p12 for context and methodology)
Regions of opportunity |Auckland
18

Economic impact of reaching industry export growth targetsEach of our industries of opportunity provide ample opportunity to contribute to future prosperity for Auckland.
Impact on regional GDP and employmentWe estimate that from 2019 to 2040 the potential economic impact from food processing is particularly pronounced, with the regional economy expected to be 6.0 percent larger ($6.1 billion) relative to what would otherwise be the case. In particular, the economic impact of increasing exports in food processing is projected to increase substantially after 2024. Three quarters of this benefit comes directly from growth in food processing GDP.
There is also a considerable potential economic impact from increased tourism growth, increasing Auckland’s regional GDP by 3.8 percent ($3.9 billion). The economic impact of increasing tourism is predominantly driven by growth in ‘trade’ GDP, which includes accommodation and food and beverage services. Tourism and food processing also offer substantial employment opportunities, with current employment numbers increasing by 1.5 percent and 1.3 percent respectively by 2040.
In terms of employment, advanced manufacturing provides the greatest opportunity for Auckland. Our ‘counterfactual’ modelling for this industry of opportunity shows an increase of 27,300 FTEs, or 3.0 percent of the region’s current employment levels, by 2040.
Capitalising on this economic opportunityThe modelling undertaken for Auckland shows that growth in all of these industries would result in a significant economic impact. As Auckland is a key powerhouse of economic activity for the country this comes as no surprise, but the devil is in the detail and the results reveal some actionable insights.
First, the relative importance of exports to the Auckland region is less than in other regions. Exports of goods and services account for approximately 15 percent of Auckland’s regional GDP.27 This is despite Auckland being the entry point for most visitors, as well the exit point for many of our exports. This is not to say that export industries are not important for Auckland. Rather their importance is masked by the size of the domestic economy – driven off a large population base.
Auckland provides a great number of services that it can export to other
$0
$200
$400
$600
$800
$1,000
$1,200
$1,400
2019 2024 2029 2034
$mill
ions
Tourism Agribusiness Food processing Advanced manufacturing
Figure 6: Annual change in regional GDP by industry, 2019 – 2040 (2018 dollars)
2039
Source: Deloitte Access Economics
Regions of opportunity | Auckland
19

regions, and supports a wide range of businesses. This diversity and scale means some of the industries of opportunity are less prominent in Auckland than they are in other regions.
Focus on infrastructure must continue. This report is not intended to focus on how to support Auckland to function more effectively as New Zealand’s largest urban centre. However, it is worth re-emphasising that Auckland must follow through on infrastructure investment to ensure the region is not constrained by the quality of investment and lack of capacity for residents and businesses. This means freeing up land in the right places for the right things at the right time, providing bulk infrastructure to service this land, and fast-tracking a transport system that can effectively move people and goods between city and region, nationally and internationally. All are vital components to allow Auckland to function, let alone flourish.
Consider road pricing as an opportunity. Small changes can make a big impact: adding more park and rides, supporting active modes, streamlining intersections, prioritising safety
and supporting urban regeneration through a community-first designed transport system are all things that will incrementally make a difference. But there is also room to take bold steps such as implementing a road pricing scheme and considering options to remove port-related traffic from the network.
Extending the apex of the “golden triangle” north. This report has not modelled Northland. However, we do believe that by conceptually moving Auckland to the middle of the “golden triangle”, the potential for Auckland’s “halo effect” to extend north would allow Northland to provide support and capacity so that potential growth is not artificially constrained. While Northland is somewhat geographically challenged in a way that the Waikato is not, being narrow with an irregular landscape created by volcanic activity over a long period, that same activity provides soils that are already supporting a shift from dairy to horticultural products such as avocados, kiwifruit, blueberries and citrus – all of which are important to Auckland.
Spatial planning. It has often been said that Auckland should grow up rather than
out. While this is conceptually appealing, it needs to be tempered by recognition that a highly constrained approach to Auckland’s spatial planning may lead to some unintended consequences e.g. increased house prices. For example, a recent study in the United States found that high house prices in highly productive cities, such as San Francisco and New York, limit the number of workers who can afford to move or stay in them, which has a negative effect on economic growth and productivity.28
Cluster benefits, and the use of technology. Auckland is the largest region for advanced manufacturing, with a wide range of technology companies as well as having the largest concentration of processed foods and non-alcoholic beverage manufacturers.29
The Auckland manufacturing sector could benefit from further automation. For example, the Netherlands exports high-tech machinery such as robotic soft fruit pickers and automated meat separators and undertakes significant R&D in agribusiness, resulting in it’s badge as the food bowl of northern Europe.
Regions of opportunity |Auckland
20
Population
1,570,100 largest urban area
It is important that Auckland does not lose its distinctive flavour of Aotearoa New Zealand – situated firmly in the Pacific with strong ties to Asia.
CoromandelWaiheke Island
Pokeno
Pukekohe
Wellsford
Auckland

Clusters have a positive impact on regional and industry performance although there are few economically significant manufacturing clusters in New Zealand.30
“Individual companies cannot establish them on their own, while historically governments across the world have tried and failed to conjure effective clusters from nothing. Therefore, where they exist, clusters are valuable because they represent defensible advantage in a competitive, globalising world.”
Given the benefit of clusters, and the fact that clusters are difficult to replicate, there is a significant opportunity for Auckland to respond to commercial opportunities for global demand in advanced manufacturing with a more formalised approach to clusters.31
Maintain its distinctive New Zealand brand. It is important that Auckland does not lose its distinctive flavour of Aotearoa New Zealand – situated firmly in the Pacific with strong ties to Asia. Diversity of thinking, experiences and culture should be celebrated, and are beneficial for Auckland’s tourism story, providing a differentiator from other global cities. Auckland will not win international convention business with a bland offering; cultural differences can be used as a draw-card to help attract international business visitors.
Regions of opportunity | Auckland
21


Regions of opportunity | Waikato
23
Waikato
Waikato is New Zealand’s fourth-largest regional economy, driven by the agriculture industry, and dairy in particular. This comes with challenges due to concerns about biological effluent and increased regulation of the sector, which the region will have to navigate to continue its economic growth.
Also of economic significance to Waikato are the business services, construction, and health and community services sectors. In addition, Hamilton is emerging as a major freight and logistics centre and a pivotal corner of the country’s “golden triangle” along with Auckland and Tauranga.
A major player in the region is Tainui Group Holdings (TGH). As the investment arm of Waikato-Tainui it has the role of creating and growing tribal wealth, and represents over 76,000 members from 68 marae across the wider Waikato region. TGH has a long-term, balanced approach to its investments, with a strong focus on the primary sector – it now owns over 4000 hectares of Waikato land that supports dairy, sheep, beef and forestry operations, in addition to having a fishing quota. TGH is also a part owner of Waikato Milking Systems, a Hamilton-based company that designs and manufactures world-class dairy technology, particularly innovative rotary platforms. They provide dairy farm solutions in over 30 countries, including USA, Russia and China.
TGHs inland port development at Ruakura is set to be a game-changer for the Waikato. It is officially recognised as a project of national significance, bringing a wide range of benefits to Waikato-Tainui, the Waikato region and to the entire country.
Industries of opportunity
Waikato is an agricultural powerhouse contributing to New Zealand’s economy through its domestic dairy supply and exports. The downside to this is that agribusiness is a key contributor to pollution, with the sector producing three-quarters of Waikato’s emissions. However, change is underway, with emissions per kilo of milk and meat falling each year as farmers adopt innovative ways to manage and mitigate biological emissions.
Tied to the agriculture sector, the Waikato region is also a major source of food processing and has eight global food processing plants.32,33 Waikato is home to the most significant cluster of agri-tech companies in New Zealand and also has strong aviation sector capability.34,35
International tourism has grown strongly in Waikato in recent years, with international visitor expenditure and guest nights outperforming the national average, growing 8.4 percent in the past year.36 Additionally, the region is well positioned to host first-rate sports and business events, which attract many domestic and international visitors to the region.37
9.6% of New Zealand’s population
8.4% of New Zealand’s GDP
9.0% of New Zealand’s land area
$1.4bn
1,800$500M
1,400
$800M
2,900$100M
1,300
TOU
RISM
FOO
D P
ROCE
SSIN
G
AGRI
BUSI
NES
SAD
VAN
CED
M
ANU
FACT
URI
NG
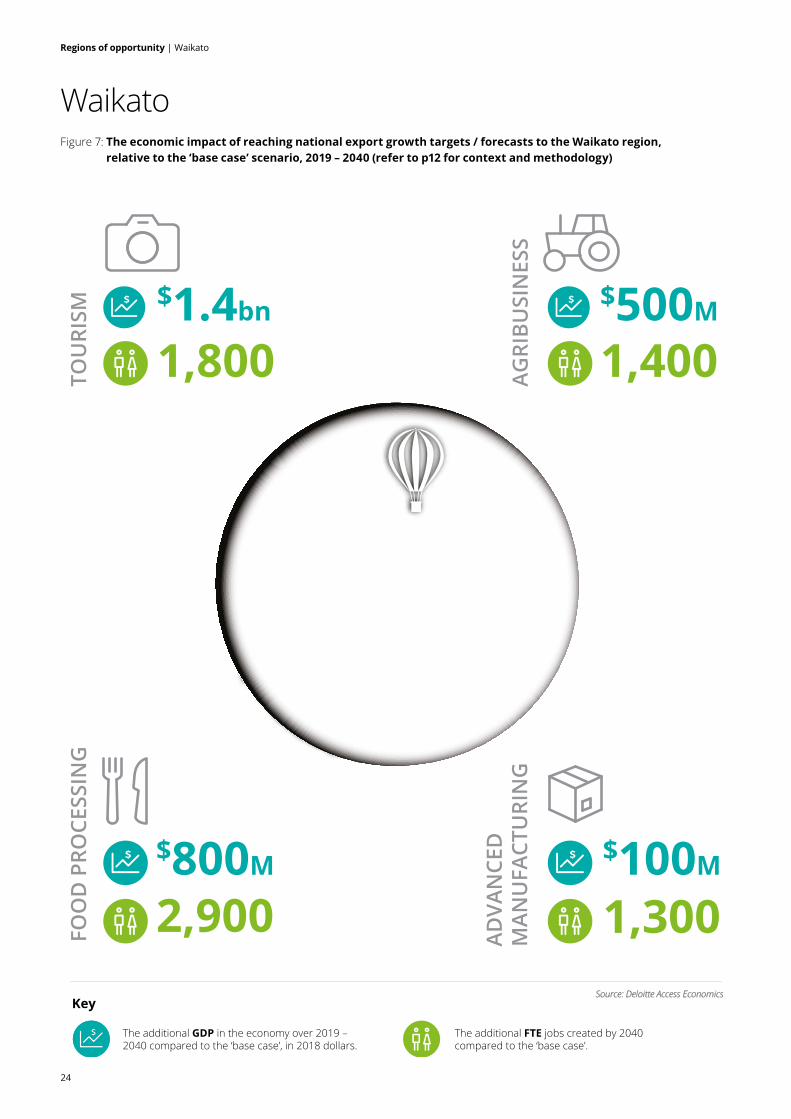
Key
The additional GDP in the economy over 2019 – 2040 compared to the ‘base case’, in 2018 dollars.
The additional FTE jobs created by 2040 compared to the ‘base case’.
Source: Deloitte Access EconomicsSource: Deloitte Access Economics
WaikatoFigure 7: The economic impact of reaching national export growth targets / forecasts to the Waikato region,
relative to the ‘base case’ scenario, 2019 – 2040 (refer to p12 for context and methodology)
Regions of opportunity | Waikato
24

Economic impact of reaching industry export growth targetsEach of our industries of opportunity provide significant scope to contribute to Waikato’s future prosperity.
Impact on regional GDPUnder our ‘counterfactual’ scenarios, tourism provides the greatest opportunity for Waikato in terms of growing GDP. When compared to the ‘base case’, if tourism were to grow at a rate necessary to meet national targets, it would result in an economic benefit of $1.4 billion to the region, equivalent to 6.1 percent of the region’s GDP.
On the other hand, if agribusiness growth targets were met, this would increase Waikato’s regional GDP by an additional 2.2 percent ($500 million) over the period from 2019 to 2040. This represents only the impact on the Waikato economy, with an expected knock on effect
much wider than the local area, thanks to the dynamic interconnectivity between regions.
This interconnectivity also means that an increase in productivity on-farm will have flow-on effects for other regions, as dairy, produce and meat become cheaper to supply.
Food processing provides a significant opportunity for Waikato, with regional GDP increasing by $800 million (3.5 percent of regional GDP) in today’s dollar terms if targets are met. Despite hosting the largest cluster of agri-tech companies in New Zealand, the estimated economic benefit as a result of increasing exports in advanced manufacturing has the smallest impact on Waikato’s economy ($100 million from 2019 to 2040 relative to the ‘base case’).
Impact on employmentFood processing provides the greatest opportunity for the Waikato in terms of regional employment. Our modelling shows an increase to regional employment of 2,900 FTE by 2040, or 1.1 percent of the region’s current employment levels, driven by increases in both food processing and agribusiness.
Capitalising on this economic opportunityThese results may be surprising, with tourism offering almost three times as much potential economic benefit as agribusiness – Waikato’s most renowned industry – over the period modelled. This illustrates the untapped potential of tourism for Waikato.
$mill
ions
Tourism Agribusiness Food processing Advanced manufacturing
Figure 8: Annual change in regional GDP by industry, 2019 – 2040 (2018 dollars)
$0
$50
$100
$150
$200
$250
2019 2024 2029 2034 2039
Source: Deloitte Access Economics
Regions of opportunity | Waikato
25
Creating a sustainable sector prepared for future regulation. Agriculture has historically been a significant source of prosperity for the region and this is unlikely to change in the future. Our modelling clearly demonstrates the benefit to Waikato of increasing exports in agribusiness. The key challenge to capitalising on this opportunity is the ever-increasing need for farmers to respond to regulatory and market needs, including changing consumer preferences for reduced biological emissions. This will necessitate hard conversations around the use of bio-technologies, access to water, competition for land, soil management, and planting of carbon-sequestering vegetation. This topic is further complicated by the current land moratorium affecting how land can be used in Waikato.
Farmers are already responding to these requirements, and biological emissions have been decreasing since 2005. It is questionable, however, whether Waikato farmers are able to continue doing so on an economically sustainable basis over the long-term, particularly if they
are competing internationally against farmers who are not regulated in the same way.
The Government has commissioned the Interim Climate Change Committee to assess how agri-sector obligations could best be arranged if agricultural methane and nitrous oxide emissions were to enter into the New Zealand Emissions Trading Scheme. A well-managed scheme that operates globally could be beneficial in the long-run due to the transparency it would place on the value of carbon, but we need to ensure that these conversations happen today to ensure its viability. In this way, the Waikato region would still be able to reap the potential benefits from its strongest industry into the future.
A leader in agri-tech. One way the industry is trying to increase output, while reducing emissions, is through the advancement of agri-tech, with Waikato home to the largest cluster of agri-tech companies in New Zealand. This cluster would support the Waikato region to stay ahead of the innovation curve, and subsequently grow the region’s exports.Agri-tech would do this specifically by improving primary sector efficiency,
yield, sustainability and profitability through the development of high-tech, energy-efficient, products and solutions. With local farms likely to be used as a testing ground in the first instance, the Waikato stands to be at the global forefront of primary sector innovation and best practice.
Waikato’s tourism potential is untapped. Tourism has been identified as the industry of opportunity with the largest potential economic impact for the Waikato – with export growth potentially increasing regional GDP by $1.4 billion from 2019 to 2040. Apart from the Coromandel – which is largely a domestic tourism destination – the region has not traditionally been known for its tourism sector. Yet Waikato’s strong agricultural sector, natural assets (such as the Waitomo caves), and rich Māori culture and heritage should enable the region to build a distinctly Waikato tourism offering. Planning is also underway by Te Waka - the recently formed Waikato Economic Development Agency to develop a cultural tourism package with input from local iwi. Currently under development is an agri-tourism hub located on the Waikato River near Pokeno.
Regions of opportunity | Waikato
26
Rotorua
Hamilton
Taupo
Matamata
Tokoroa
Pukekohe
Turangi
Mokau
Tauranga
Te Awamutu
Cambridge
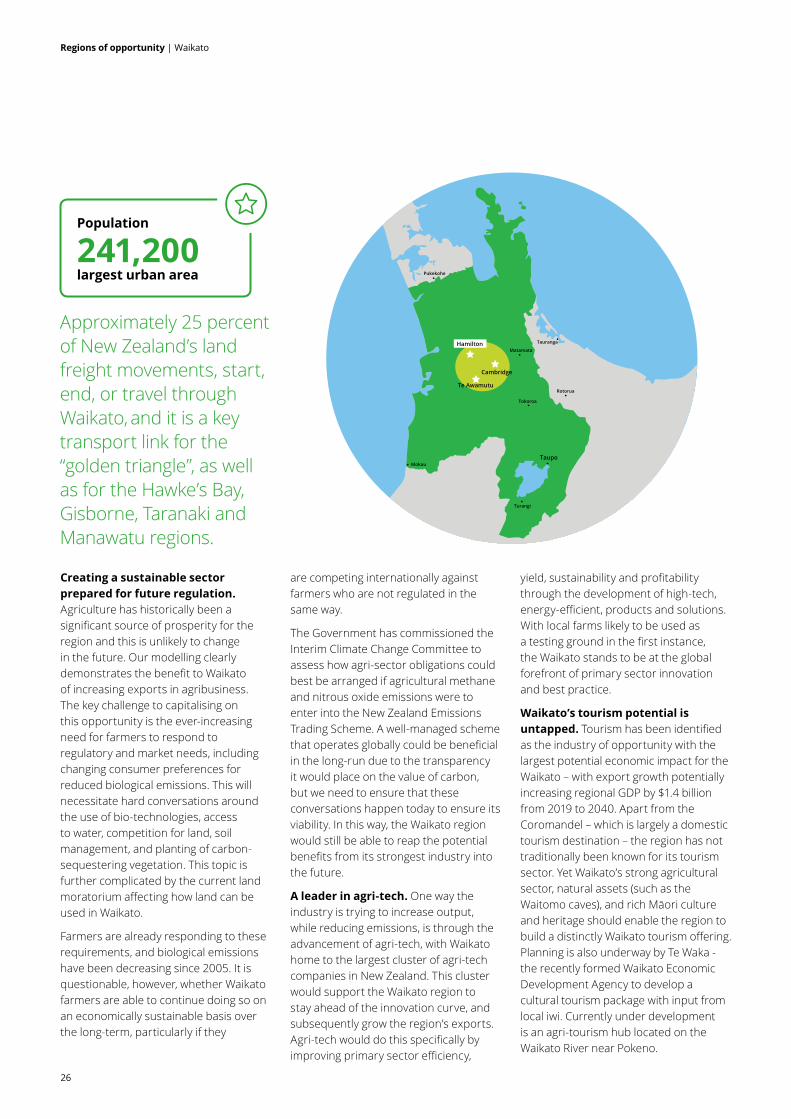
Approximately 25 percent of New Zealand’s land freight movements, start, end, or travel through Waikato, and it is a key transport link for the “golden triangle”, as well as for the Hawke’s Bay, Gisborne, Taranaki and Manawatu regions.
Population
241,200 largest urban area
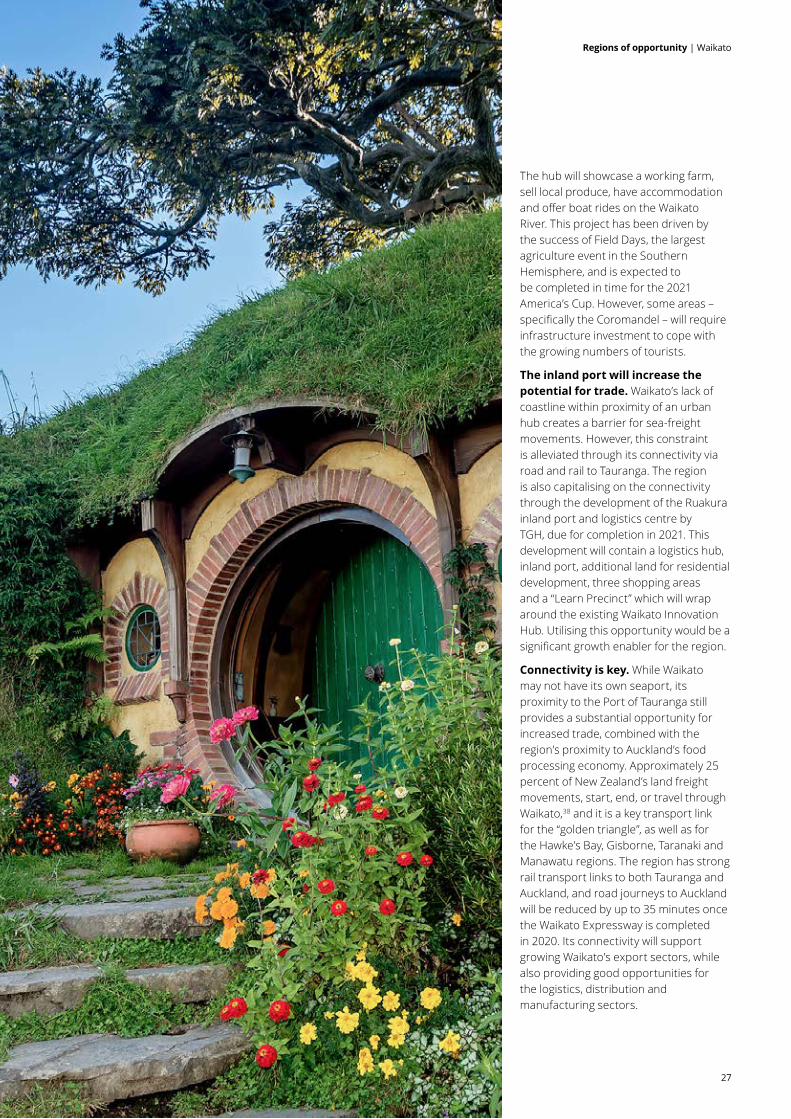
The hub will showcase a working farm, sell local produce, have accommodation and offer boat rides on the Waikato River. This project has been driven by the success of Field Days, the largest agriculture event in the Southern Hemisphere, and is expected to be completed in time for the 2021 America’s Cup. However, some areas – specifically the Coromandel – will require infrastructure investment to cope with the growing numbers of tourists.
The inland port will increase the potential for trade. Waikato’s lack of coastline within proximity of an urban hub creates a barrier for sea-freight movements. However, this constraint is alleviated through its connectivity via road and rail to Tauranga. The region is also capitalising on the connectivity through the development of the Ruakura inland port and logistics centre by TGH, due for completion in 2021. This development will contain a logistics hub, inland port, additional land for residential development, three shopping areas and a “Learn Precinct” which will wrap around the existing Waikato Innovation Hub. Utilising this opportunity would be a significant growth enabler for the region.
Connectivity is key. While Waikato may not have its own seaport, its proximity to the Port of Tauranga still provides a substantial opportunity for increased trade, combined with the region’s proximity to Auckland’s food processing economy. Approximately 25 percent of New Zealand’s land freight movements, start, end, or travel through Waikato,38 and it is a key transport link for the “golden triangle”, as well as for the Hawke’s Bay, Gisborne, Taranaki and Manawatu regions. The region has strong rail transport links to both Tauranga and Auckland, and road journeys to Auckland will be reduced by up to 35 minutes once the Waikato Expressway is completed in 2020. Its connectivity will support growing Waikato’s export sectors, while also providing good opportunities for the logistics, distribution and manufacturing sectors.
Regions of opportunity | Waikato
27


Regions of opportunity | Hawke’s Bay/Gisborne
29
Hawke’s Bay/Gisborne Te Matau-a-Māui/Te Tai Rāwhiti
Known for its productive plains and hill country, the Hawke’s Bay/Gisborne regions thrives on its primary industries and tourism offerings. The Hawke’s Bay region is currently one of New Zealand’s largest wine producers, attributable to its mild Mediterranean climate and variety of fertile soils.39 Supporting the export efforts of the region’s industries is the Port of Napier, which is a major export and transport hub for the east coast, and Eastland Port in Gisborne, which is the country’s second largest log exporter.
The Hawke’s Bay/Gisborne regions currently account for 3.5 percent of national GDP and are poised to continue taking advantage of their unique climate to grow into the country’s leading exporter of premium primary produce.40,41 The vision for Hawke’s Bay is to be New Zealand’s most innovative region, and a hub for business growth.42 Tairawhiti’s Economic Action Plan similarly has a primary industries focus, outlining wood processing, aquifer recharge and apiculture as sectors of potential.43
Industries of opportunityHawke’s Bay’s greatest commercial opportunities lie within its horticulture and viticulture industries. Currently, the region has the largest share of the country’s horticultural land. The region’s climate and land allows for a diversified range of produce with permanent crops, wineries, sheep, beef and dairy farming in the area.
Similarly, Gisborne’s highly fertile alluvial soil enables the region’s strong agricultural economy, with a specialisation in forestry, sheep, beef and grain farming. Planting of high-value produce is increasing in the region, which includes citrus, grapes, pip fruit, persimmon and macadamia nuts.
Food and beverage manufacturing is well supported by the regions’ primary production advantages. With low infrastructure costs, available resources, and export links to support a diverse range of food businesses, Hawke’s Bay has attracted leading international food and beverage processing firms and is home to one of Australasia’s largest maize milling companies.
Both regions’ visitor economies are growing, albeit slowly. Tourism, both domestic and international, is strong across the regions, bringing in many from around the country over the summer months to enjoy the warm climate. However, visitors are highly seasonal and total annual spend is proportionally low. Combined, the regions currently account for only 1.6 percent of international tourist spend.
4.4% of New Zealand’s population
3.5% of New Zealand’s GDP
8.4% of New Zealand’s land area

$900M
700$600M
800
$500M
800$200M
(100)
TOU
RISM
FOO
D P
ROCE
SSIN
G
AGRI
BUSI
NES
SAD
VAN
CED
M
ANU
FACT
ORI
NG
Key
The additional GDP in the economy over 2019 – 2040 compared to the ‘base case’, in 2018 dollars.
The additional FTE jobs created by 2040 compared to the ‘base case’.
Source: Deloitte Access Economics
Hawke’s Bay/GisborneFigure 9 The economic impact of reaching national export growth targets / forecasts to the Hawke’s Bay/Gisborne
region, relative to the ‘base case’ scenario, 2019 – 2040 (refer to p12 for context and methodology)
Regions of opportunity | Hawke’s Bay/Gisborne
30

Economic impact of reaching industry export growth targetsHawke’s Bay/Gisborne is well placed to benefit from all of our industries of opportunity.
Impact on regional GDPHawke’s Bay/Gisborne sees the largest potential economic impact in tourism export growth, with our modelling showing the regional economy expected to be almost 10 percent larger ($900 million), than would otherwise be the case, from 2019 to 2040.
Hawke’s Bay/Gisborne also has a considerable potential economic impact from increasing agribusiness and food processing export growth, increasing by $600 million (6.4 percent of combined regional GDP), and $500 million (5.3 percent of combined regional GDP), respectively.
Advanced manufacturing is estimated to increase the Hawke’s Bay/Gisborne regions’ economies with combined regional GDP increasing by $200 million (2.1 percent of combined regional GDP) in today’s dollar terms.
Impact on employmentTourism, agribusiness and food processing all provide opportunity for the regions in terms of growing employment, with our modeling indicating an increase of 700-800 FTE by 2040, or 0.7 percent – 0.8 percent of the regions’ current employment levels.
Interestingly, the increase in combined regional GDP as a result of increasing advanced manufacturing exports results in a decrease in employment opportunities in these regions, when compared to the ‘base case’ scenario. This could be explained by inter-regional movement of employment opportunities.
Capitalising on this economic opportunityAs a small economy with some still emerging sectors, the Hawke’s Bay/ Gisborne regions stands to gain the most – in relative terms – from increasing its exports across our industries of opportunity. For example, increasing tourism exports has the potential to make the economy nearly a tenth larger between 2019 and 2040. Similarly, agribusiness and food processing offer substantial opportunity for regional growth, despite agribusiness already being the region’s dominant industry. How can these sectors grow in unison to capitalise on these opportunities, without crowding each other out?
Tourism Agribusiness Food processing Advanced manufacturing
$mill
ions
Figure 10: Annual change in regional GDP by industry, 2019 – 2040 (2018 dollars)
$0
$20
$40
$60
$80
$100
$120
$140
2019 2024 2029 2034 2039
Source: Deloitte Access Economics
Regions of opportunity | Hawke’s Bay/Gisborne
31

There is untapped potential of unique tourism offerings. As Napier’s port is being expanded to accommodate cruise ships, visitor numbers to Hawke’s Bay will grow. The region should capitalise on the opportunity that more cruise ship visitors will present. Improvements to the transport network will also be important in growing tourism in this region. Currently tourism revolves around Hawke’s Bay wineries, and remains relatively undeveloped in Gisborne. The region’s rich Māori culture and historic importance provide untapped potential to grow the tourism sector in these areas. There is also potential for ‘space launch’ tourism, as a unique opportunity with the Rocket Lab launch facility at Mahia Peninsula. Lacking the infrastructure for significant growth in numbers, the region should focus its efforts on attracting high-value tourists, while putting the infrastructure plans in place to support a larger volume in the long-term.
Water use planning is needed. Climate change is an important issue for Hawke’s Bay/Gisborne. While they currently have an ideal climate
for a range of produce, they are getting drier. Parts of the regions are exposed to drought in summer months, putting pressure on irrigation systems. Currently, there are concerns around the sustainability of irrigation in multiple locations across the regions, as aquifers are declining, creating flow on effects to rivers such as the Tukituki and Waipawa. With sufficient rainfall in the winter months, the regions needs to explore increased water storage infrastructure as a viable option that minimises the effect on the environment, or look to diversify towards less water-intensive horticultural methods. Increased water storage would also allow for the ability to “flush the rivers” at low peak flows in the summer. If the status quo remains, access to water is likely to remain one of the largest challenges faced by the region.
Grow and attract a future agribusiness workforce. A lackluster workforce threatens the industry. Harvesting of the region’s fruit and vegetables requires a highly seasonal workforce susceptible to shortage. Certain horticulture jobs are listed as “skill shortages” by Immigration New
Zealand, allowing the region to bring in international workers for shortage periods. However, this solution will not be able to withstand significant growth. In February 2019, there was a seasonal labour shortage declared in the Hawke’s Bay by the Ministry of Social Development, for a six week period from February to April.
But it is not just a shortage of workers that the region is facing – it is a shortage of the right skills. This begs the question – are the education systems aligned to produce the capability in the areas of demand? Increased communication between industry and education providers, as well as investment in the local polytechnics, would help better prepare the region for its future workforce requirements.
As the industry grows, worker shortages will become more prevalent unless the seasonal workforce issues and lack of skill requirements can be solved. Consistently lower than average population growth is impacting not just the region’s ability to grow, but also replace those exiting the workforce. Reducing youth migration out of the regions and equipping them
Regions of opportunity | Hawke’s Bay/Gisborne
32
Gisborne
Porangahau
Dannevirke
Hicks Bay
Murupara
Taupo
Napier
Hastings
While the Wairoa-Napier rail line has been reopened, extending the operating rail line up to Gisborne would increase trade efficiency going south from Gisborne.
Population
134,500 largest urban area

with the right skills, as well as attracting workers to the regions will be necessary to sustain the current workforce, as well as grow it for future prosperity.
Gisborne needs increased connectivity to flourish. While the Wairoa-Napier rail line has been reopened, and road upgrades between Wairoa and Gisborne have been promised, extending the operating rail line up to Gisborne would increase trade efficiency going south from Gisborne. Minister Shane Jones has indicated that funding may also be provided to re-open the Wairoa – Gisborne portion of the rail line, subject to support from KiwiRail. Investing in rail may be made more commercially viable if Eastland Port, which currently cannot accept containers, receives resource consent for expansion. A lack of container port facilities in Gisborne is estimated to cost the region $36 million per annum in additional transport costs.44
Added capacity for processing food and other commodities within the region. Currently, the region is not equipped to process the large volume of commodities that it produces, and most produce leaves the region for processing. Growing the processing capabilities locally will allow for expansion into more value-add agribusiness exports. Downstream, niche processing of some of the region’s strongest commodity products, such as meat, wool and timber, would redistribute much of the value back into the local economy. Higher-value exports would also grow its export economy without a significant increase in agribusiness capacity, which alleviates some of the mentioned restricting factors facing the region’s sector.
A horticulture tech hub. As the region’s advanced manufacturing industry emerges, it is well placed to specialise in its strongest agribusiness subsector – horticulture. Without the scale to do everything, the Hawke’s Bay/Gisborne region should differentiate itself from other agri-tech hubs around the country, for example in Waikato, which focuses on dairy and meat, by positioning it as a place where new horticulture technologies are developed and tested. This will not only benefit the region by being the go-to for these new technologies, but also the local
producers, who will be well positioned as early adopters of any new efficiency-improving technology that could significantly decrease its workforce requirements.
Bringing together advanced manufacturing and food processors, and unifying the geographical “Bay” brand for exports that already exists for its wine, have the potential to substantially lift economic growth and prosperity for the region. The region has already made progress with registration as a Geographical Indication with IPONZ.
Regions of opportunity | Hawke’s Bay/Gisborne
33

Regions of opportunity | Wellington
34

Regions of opportunity | Wellington
35
Wellington Te Whanga-nui-a-Tara
The Wellington region is home to New Zealand’s capital, contributing approximately 13 percent of national GDP and having the second highest GDP per capita.45,46 Wellington lends itself to knowledge-intensive production with the most degree-qualified employees in the country,47 and over half of the workforce employed in knowledge-intensive sectors.48 As might be expected, its largest sector is public administration and safety. However, professional, scientific and support services are not far behind, contributing the most to the region’s growth in the past ten years, and currently making up 25 percent of all businesses in the region.49
What is less well understood is that while public service occupations are undoubtedly important, Wellington only has three quarters of the number of government employees as Auckland,50 which homes the largest number in the country. Wellington is not a staid city of public servants, and like all of our regions, stands to benefit substantially from export growth across our industries of opportunity.
The Wellington region is unusual, comprising four cities – Wellington, Porirua, Lower Hutt and Upper Hutt – within its boundaries. Together, these four cities have a population of over 400,000 accounting for over 80 percent of the total regional population. Approximately 62,000 people work in the CBD of Wellington city, only 4,000 fewer than in Auckland’s CBD, despite that city having a much larger population.
Industries of opportunitiesThe Wellington region’s demographic make-up of highly skilled people, paired with its proximity to a myriad of resources for business and innovation presented by the government, research, and education sectors, bodes well for a thriving economy.
Wellington shows strengths in the advanced manufacturing sector as one of the main technology hubs for New Zealand, and a large proportion of the country’s creative sector are based here. The region excels at creative screen-related technologies, supporting growth in tech startups serving the creative sector. The region also features social enterprises that are strongly tech-based.51
With 9 percent of the country’s total tourism spend,52 the Wellington region attracts tourists for its arts, sports, theatre and culinary experiences. The public sector attracts many business visitors, hosting a range of conferences and meetings. Tourism spend for the year ending October 2018 reached $2.6 billion, with over two thirds of this coming from domestic visitors.53
Wellington also hosts a number of food processing businesses. Historically these have focused on meat and dairy, like many other regions, but winemaking and brewing have rapidly increased in importance over the past few decades. There is a strong relationship between food and tourism, and the large number of smaller food and beverage processors in the region support a thriving visitor economy focused around their products.
On the other hand, the region’s agribusiness activity is small and declining. Despite Wellington having
10.7% of New Zealand’s population
13.0% of New Zealand’s GDP
3.0% of New Zealand’s land area
$2.5bn
2,700$600M
900
$1.8bn
3,700$1.5bn
4,800
TOU
RISM
FOO
D P
ROCE
SSIN
G
AGRI
BUSI
NES
SAD
VAN
CED
M
ANU
FACT
URI
NG
Key
The additional GDP in the economy over 2019 – 2040 compared to the ‘base case’, in 2018 dollars.
The additional FTE jobs created by 2040 compared to the ‘base case’.
Source: Deloitte Access Economics
WellingtonFigure 11: The economic impact of reaching national export growth targets / forecasts to the Wellington region,
relative to the ‘base case’ scenario, 2019 – 2040 (refer to p12 for context and methodology)
Regions of opportunity | Wellington
36

Tourism Agribusiness Food processing Advanced manufacturing
$mill
ions
Figure 12: Annual change in regional GDP by industry, 2019 – 2040 (2018 dollars)
$0
$100
$200
$300
$400
$500
2019 2024 2029 2034 2039
Source: Deloitte Access Economics
Regions of opportunity | Wellington
37
a large rural area, from mountains to river plains, only 5.5 percent of the total land-mass is used for agribusiness purposes.54 It provides about 0.9 percent of Wellington’s GDP (direct activity only), with its activity decreasing by a fifth between 2014 and 2017.55
Economic impact of reaching industry export growth targetsEach of our industries of opportunity provides ample potential to contribute to future prosperity for the Wellington region.
Impact on regional GDPThe potential economic impact of growth in tourism is particularly pronounced. The regional economy is expected to be 7.0 percent larger (or $2.5 billion) relative to regional GDP, than would otherwise be the case, from 2019 to 2040.
Wellington also has considerable potential economic impact from increasing export growth in food processing and advanced manufacturing,
at $1.8 billion (5.1 percent of regional GDP), and $1.5 billion (4.2 percent of regional GDP), between 2019 and 2040, respectively.
Agribusiness is a small proportion of the region’s output, and consequently offers the lowest economic benefit potential for Wellington from our industries of opportunity. Less than 10 percent of the $600 million potential economic benefit comes about through growth in agribusiness directly, suggesting any growth in agribusiness exports across our focus regions is unlikely to come from the Wellington region. Instead, the modelled regional GDP growth from agribusiness in Wellington is through supporting industries, such as business and government services.56
Impact on employmentIn terms of employment, advanced manufacturing provides the greatest opportunity for the region, with the advanced manufacturing ‘counterfactual’
scenario leading to an increase in regional employment of 4,800 FTE by 2040, or 1.6 percent of the region’s current employment levels.
Capitalising on this economic opportunityThese results may at first seem counter-intuitive, but in fact the signs have been apparent for some time that Wellington has opportunities to leverage economic growth and add jobs in industries other than the public sector. Our modeling suggests the region should look to its other competitive advantages, which leverage off the synergies between the film and creative, food and beverage, and tourism sectors.

Regions of opportunity | Wellington
38
Wellington
Lower Hutt
Upper Hutt
Otaki
Masterton
Martinborough
Paraparaumu
Eketahuna
Porirua
Wellington already has the most degree-qualified employees in the country, retaining and attracting more skilled and talented people is essential to enable this growth to continue.
Population
418,500 largest urban area
Distinctly Wellington. Wellington has always attracted a large number of domestic visitors, not just for business, but also for weekend leisure travel, sports events, theatre and music. In recent years, it has started to take on a more distinctive tourism brand as a destination in its own right. Sitting at the centre of New Zealand, the airport is a major domestic travel hub. The growth of the film sector paired with a growing reputation for food and beverages has provided Wellington with a more visible and attractive brand for international tourists. But there is still room for substantial growth, particularly if some larger proposed investments are progressed – most notably adding capacity for larger conferences, medium-sized arts performance and long haul flights.
Leveraging the city’s creativity and skilled work force. The creative technology industry, aligned with the film industry, form part of a wider advanced manufacturing industry. Wellington is globally recognised for its post-production and visual effects capability.57 With the country’s highest concentration of web-based and digital companies
per capita, Wellington is poised to continue growing its creative digi-tech industry. The region offers robust telecommunications connections, making it an ideal place for web and mobile software developers to set up shop. In a 2015 report by Technology Investment Network, Wellington’s revenue growth in the high-technology sector surpassed that of all other regions in New Zealand.58
The region offers investment opportunities in the film sector and encourages international producers to make use of our diverse and accessible film locations. However, film is an expensive way to attract tourists, with NZIER modelling showing that the film industry brings in only $1.1 for every $1 spent. A focus on building the wider sector, in conjunction with the film industry, should be the focus of the region, as it continues to make its name as a tech hub of the country.
Attracting and retaining talent. Wellington’s recent growth has been driven by knowledge-intensive production, with 53 percent of those employed working in these sectors.
Although Wellington already has the most degree-qualified employees in the country, retaining and attracting more skilled and talented people is essential to enable this growth to continue. To sustain the current rate of growth, Wellington requires a continuous stream of skilled people to start new, and refresh existing businesses. WellingtonNZ (previously Wellington Regional Economic Development Agency) was established for this task, with a mandate to create conditions for business growth and to promote Wellington as a great place to live and work.59
In recent years, Wellington has seen a boom in student population numbers, moving here from across New Zealand and internationally. Wellington is viewed as an attractive and safe place to study. But finding a solution to the steep house prices caused by the housing shortage in the capital will be imperative to keep growing the number of students choosing Wellington for tertiary education. Additionally, most students do not stay on to take jobs in Wellington upon graduation, so there is more to be done to enable graduates to transition into local jobs.

Regions of opportunity | Wellington
39
Building resilience. But it is not all positive for Wellington – the city is still working through the consequences of the 2016 Kaikoura earthquake, which impacted the availability of commercial properties across the CBD. Residential housing, particularly apartments, have also been affected, displacing the workforce to a degree.
The problem of limited space to work and live is two-fold. Not only is it a barrier to attracting and retaining talent, but it also hinders one of Wellington’s other industries of opportunity. Wellington is home to the headquarters of a number of financial firms and government agencies, but is increasingly becoming the place for call centre operations. Replacing and repairing infrastructure, especially commercial buildings, is therefore vital to enabling growth in this and other sectors.


Regions of opportunity | Canterbury
41
Canterbury Waitaha
Canterbury is a diverse region characterised by rolling plains, abundant farmland and mountainous borders. New Zealand’s third largest urban area, Christchurch, is well placed to expand, as one of the country’s only major urban areas that isn’t geographically constrained.
Currently, Canterbury contributes just over 12 percent of New Zealand’s GDP, fueled by strong primary industries, manufacturing and construction sectors,60 and continues to grow. Despite the residential construction sector slowing, the commercial sector continues strongly with the build of a new convention centre “Te Pae”, a metro sports facility, and stadium.61
Industries of opportunityCanterbury is well-known for its agriculture industry, contributing nearly one fifth of national agriculture GDP. The region produces meat and dairy products, seafood and wine for both domestic and international consumers. Historically, sheep, beef and grain farming dominated the region, but recently many farmers have converted to high-value dairy farming, with a 9 percent increase since 2012. These industries make the most of Canterbury’s natural advantages – river-fed irrigation and abundant arable land – and a number of rural servicing and merchandising companies that have their headquarters in Christchurch.
Consequently, the region contributes significantly to the nation’s processed food production, forming Canterbury’s largest manufacturing sub-sector by employee count.62
Although Canterbury has a smaller concentration of food and beverage manufacturing relative to other regions, the region plays a key role in adding value to primary produce.63
Its strong manufacturing sector shows signs that it is transitioning to higher-value manufacturing. Canterbury is an electronic manufacturing hub, and the national hub for agri-tech innovations, supported by research institutes such as Lincoln University, Landcare Research, Plant and Food Research and AgResearch.
While Canterbury tourism has struggled, growth is back on track. Canterbury was the second fastest growing region for international tourism spending in the country last year, growing 17 percent. Christchurch hosts the South Island’s largest international airport, and is the point of entry for many into the country. The city is known as the gateway to Antarctica, and for its parks and walks. The wider region attracts visitors seeking adventure and outdoor activities.
12.8% of New Zealand’s population
12.4% of New Zealand’s GDP
16.7% of New Zealand’s land area
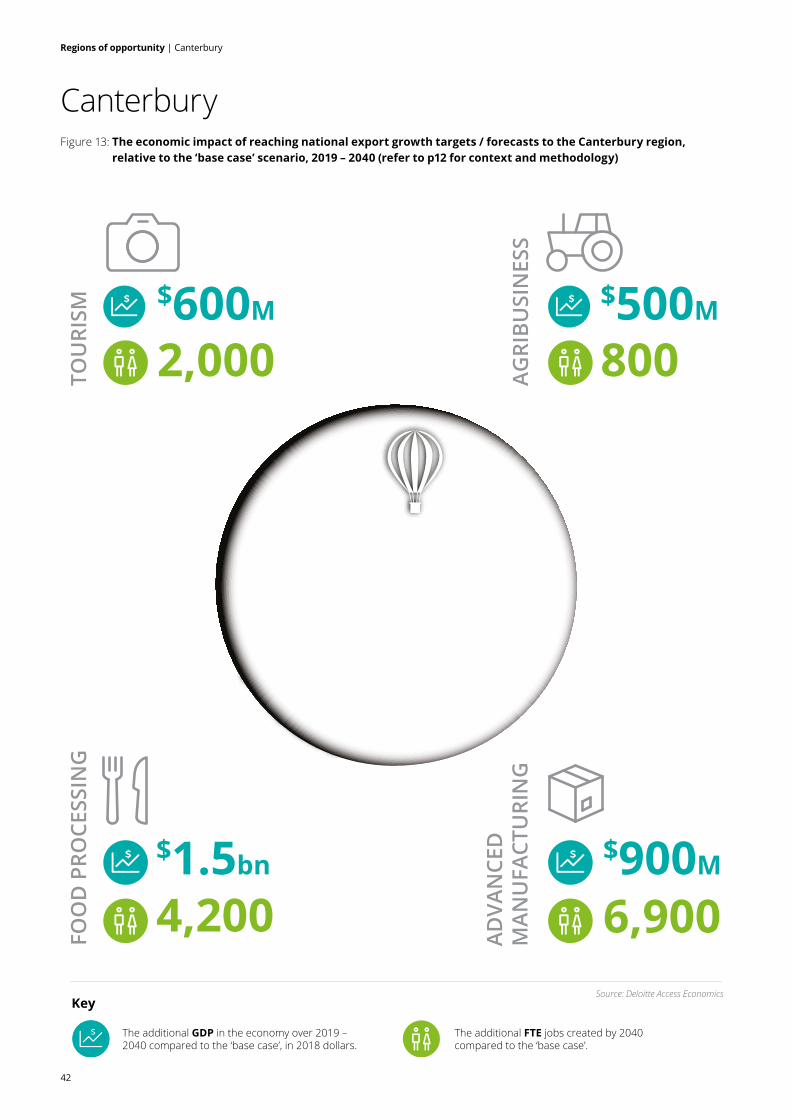
$600M
2,000$500M
800
$1.5bn
4,200$900M
6,900
TOU
RISM
FOO
D P
ROCE
SSIN
G
AGRI
BUSI
NES
SAD
VAN
CED
M
ANU
FACT
URI
NG
Key
The additional GDP in the economy over 2019 – 2040 compared to the ‘base case’, in 2018 dollars.
The additional FTE jobs created by 2040 compared to the ‘base case’.
Source: Deloitte Access Economics
CanterburyFigure 13: The economic impact of reaching national export growth targets / forecasts to the Canterbury region,
relative to the ‘base case’ scenario, 2019 – 2040 (refer to p12 for context and methodology)
Regions of opportunity | Canterbury
42

Economic impact of reaching industry export growth targetsFigure 13 lays out the potential economic impact for Canterbury of reaching selected industry specific targets.
Impact on regional GDP and employmentFood processing provides the greatest opportunity in terms of GDP growth for Canterbury, with increased exports offering an additional $1.5 billion in regional GDP (4.3 percent of the region’s GDP), in today’s dollar terms over the period 2019 to 2040.
Advanced manufacturing also provides significant opportunity for the Canterbury region, with regional GDP potentially increasing by $900 million (2.6 percent of regional GDP). It also provides the greatest opportunity for Canterbury in terms of regional employment, with the ‘counterfactual’ scenario leading to an increase in regional employment of 6,900 FTE jobs by 2040, or 2.0 percent of the
region’s current employment levels. Food processing also offers substantial opportunity, with employment numbers increasing 4,200 FTE, or 1.2 percent of the region’s current employment level.
It is worth noting that as a diverse region, not all growth is created equal, and growth in some sectors comes at the expense of other sectors. For example, our modelling shows that the projected increases in employment from growth in food processing and agribusiness comes at the expense of employment in ‘other manufacturing’ and advanced manufacturing, and vice versa.
Canterbury would also experience a considerable potential economic impact from increasing both tourism and agribusiness export growth, increasing by $600 million and $500 million, or 1.7 percent and 1.4 percent of Canterbury’s regional GDP. The economic impact as a result of increasing tourism growth is projected to be slow at the start of the period, and then take off around 2026;
while the projected economic impact for agribusiness is relatively constant from 2026 to 2040.
Capitalising on this economic opportunityThe results outline the further opportunities that a growing high-value manufacturing sector presents to Canterbury. Untapped potential in value-add food processing should be seen as a significant opportunity by leveraging the legacy agribusiness sector. Further consideration of how best to grow Canterbury’s high-value manufacturing sector should leverage its natural resources and wealth of business services. That said, the opportunities in tourism and agribusiness should not be ignored. How can Canterbury diversify these sectors to increase its national share?
Utilise Canterbury’s traceable supply chain. Today’s consumers are increasingly pushing for product traceability. Canterbury is unique as
$0
$50
$100
$150
$200
$250
$300
2019 2024 2029 2034 2039
Tourism Agribusiness Food processing Advanced manufacturing
$mill
ions
Figure 14: Annual change in regional GDP by industry, 2019 – 2040 (2018 dollars)
Source: Deloitte Access Economics
Regions of opportunity | Canterbury
43

it hosts the whole value chain; food is grown, processed and exported from the region, allowing for the high degree of traceability increasingly sought by consumers. Because of this, Canterbury is well placed to become more globally competitive. The region could be the country’s leader in transparent supply chains. Additionally, the data collected from tracing the supply chain allows for a much broader knowledge base to make future planning decisions. For example, the data would give farmers, processors and exporters the ability to make sure the right products are grown, processed and shipped at the right times.
Incorporating agri-tech. Another opportunity for Canterbury is ‘precision agribusiness’. This is a farm management concept that involves the study and management of in-field variations within farms that can affect crop yield. The concept relies on the use of new technologies such as internet of things, satellite imagery, information technology and geospatial tools. One application of the technology, for example, is that farmers could reduce inputs using a targeted application of
the software. Christchurch NZ is one of the partners in a new industry group, Precision Agribusiness Association of NZ.64 This technology platform provides an opportunity for Canterbury’s agribusiness sector to be more productive, efficient and sustainable, giving Canterbury a competitive advantage.
Diversification of food processing. Historically, Canterbury has been heavily reliant on dairy exports. However, as environmental concerns grow, and managing intensification becomes increasingly important, the region has the opportunity to get ahead of the curve and diversify into more sustainable agribusiness production. With an abundance of other farmland – most of which is flat – and the infrastructure in place to support growth, there is ample opportunity to expand production. As international food production requirements are estimated to increase almost 50 percent by 2050,7 and with an urban middle class predicted to reach 4.9 billion by 2030,65 the demand for high quality food products is likely to skyrocket. Planning how the region’s
processed food export value can be maintained with a potential move away from high-value milk powder exports should be done now. Diversification into finished goods with a long shelf life should be the first consideration to reduce the risks associated with volatile world prices.
New Zealand’s electronic manufacturer. Canterbury is the country’s electronic manufacturing hub, with almost a fifth of New Zealand’s electronics and electrical manufacturing firms based there. Tait Communications, which exports 95 percent of its products from Christchurch, alongside others, act as anchor firms for the industry, and draw similar businesses to the region.66 Canterbury’s education institutions – the University of Canterbury, NZi3 (National ICT Innovation Institute), and HITLab – should position themselves as the go-to education providers for tech students, leveraging the electronic cluster nearby. Canterbury is well-placed to reap the benefits of agglomeration, with organisations such as Canterbury Tech connecting tech businesses across the region. As a country-leader
Regions of opportunity | Canterbury
44
Arthur’s Pass
Timaru
Whataroa
Maruia
Mount Cook
Glenavy
Clarence
Oamaru
Ward
Christchurch
To achieve the growth outcome outlined in this report, Canterbury must make the most of the silver lining the earthquake has presented it with: the chance to build a better and more resilient city.
Population
404,600 largest urban area

in electronic manufacturing, the region should use growth in the sub-sector to gain a place on the electronics manufacturing world-stage, alongside Wellington’s film tech sector and Auckland’s multitude of advanced manufacturing specialties.
Recent investment after the earthquakes. Eight years after the earthquakes, the city is experiencing a renaissance with new buildings, restaurants, bars and shopping options bringing people, vitality and positivity back into the CBD. While many empty areas remain, these represent further opportunities for growth. To achieve the growth outcome outlined in this report, Canterbury must make the most of the silver lining the earthquake has presented it with: the chance to build a better and more resilient city.
Destination Canterbury. As it stands, many visitors see Canterbury as the entry point for exploring other parts of the South Island rather than a destination in its own right. To meet our modelled future growth, this view must be changed. To achieve this, Canterbury must become innovative in the way it sells its attractions and successfully executes the 2016 Canterbury Visitor Strategy. The completion of the new Christchurch Convention Centre, Te Pae in 2020 will be a significant attractor and should also support further investment in the hotel sector. Agri-tourism, which includes any agribusiness-based operation or activity bringing visitors to a farm, often having them stay with local people in rural areas, could be another innovative way to grow tourism in the region.
Regions of opportunity | Canterbury
45
Building a platform for economic success across our regions
This second edition of the Shaping our slice of heaven series develops our ‘industries of opportunity’ narrative from the first edition by considering what role our regions should play in supporting overall economic success, with a focus on exports.
Throughout the report, we present recommendations on ways in which each of our focus regions could take action to support economic growth driven out of these industries of opportunity. It is not enough to consider opportunities at a national level – the attributes and competitive advantages that are only noticeable when examined at a local level are critical for fostering innovation and reaping the benefits of agglomeration. In turn, these help improve the economic performance and prosperity of New Zealand as a whole.
Put another way, New Zealand cannot achieve the economic benefit that would result from achieving national export targets without building on our regional differences in a coordinated manner. In our view, it is timely to shift and broaden the conversation to a ‘within New Zealand’ narrative, to generate continuous growth, prosperity and inclusion for all New Zealand’s regions. But where do we start?
Some positive recent announcements include the establishment of the Climate Change Commission and the Infrastructure Commission, as well as progress towards an integrated wellbeing framework. These initiatives all drive a more coordinated approach across regions, encouraging more effective collaboration and accountability.
Yet these are not enough. For our regions to thrive and take advantage of the opportunities presented to them, some important questions need be addressed. These include:
How can we ensure that local government and economic development agencies are appropriately equipped to support strategies for growth that embrace regional differences? How do we give regions more control over their own revenues, and keep regional organisations and activities decentralised? How can we evaluate the success of regional economic development strategies?
At the same time, how do we get regions working together to support a more coordinated ‘within new Zealand’ regional economic development strategy? Efforts in recent years to develop economic development strategies region by region have not proved as successful as hoped. Is there another way forward by examining competitive advantages more deeply?
What are the most appropriate and sustainable governance structures that will provide the right level of guidance and incentives for regions to respond in ways that support future prosperity? How do we encourage these organisations to see growth as a positive rather than seeing growth as a cost imposed on – in some cases already strained – infrastructure?
What is required to encourage diverse stakeholders to take responsibility and be accountable for achieving better outcomes on a regional basis? For example, in many regions the port is a key enabler of economic growth and yet the ports as companies are profit maximising rather than economic value maximising.
How can we create a positive business environment within and across regions? A good business environment reflects a region’s economic soft power (the power to attract and co-opt), which is a vital part of comprehensive competitiveness.
How do we ensure that growth in Auckland – one of New Zealand’s economic powerhouses – does not shrink or have negative effects on the regions? As Auckland continues to grow, this can be at the expense of areas outside of Auckland, and the reverse can also be true (for example, rising house prices in Auckland have made other locations relatively more attractive).
Regions of opportunity | Building a platform
46
How can each region achieve a balance between having an ‘anchor’ industry, which creates risk when that industry is in a trough, but without going down a route that results in excessive diversification? Building scale within a small economy may help support infrastructure development, technology and innovation which will encourage greater diversity and investment.
How can we build on our regional differences to have the ability to respond to external shocks? With global growth expectations looking softer over the coming years, there’s a risk that lower global demand hits our exports. For example, China has played a large role in boosting New Zealand exports – currently taking almost a quarter of our exports, compared to 6 percent a decade ago. However, the recent trade friction between the US and China represents a threat to this opportunity. We need to be ready to respond.
What is the mechanism that seeks to allocate the Provincial Growth Fund in a way that maximises future economic prosperity region by region? Is it possible to take an industry-based lens to this analysis? And how do we evaluate the success of allocated funds?
As New Zealand transitions to a lower carbon economy, how can we ensure that the learnings from Taranaki are shared and applied across other regions in New Zealand? What support should or could be considered for industries that are currently both high carbon emitters and large contributors to our economy? And is there a difference between biological and non-biological emitters?
What digital advances will present both unique challenges and benefits for our regions of opportunity? How can each region take advantage of these disruptive opportunities? How can these opportunities be used to not just enhance economic prosperity, but also to promote greater social inclusion and mitigate against a growing number of pockets of deprivation – often due to poor connectivity to larger urban centres?
Starting these conversations today would preserve and enhance the future prosperity of our regions of opportunity.
It is our intention for this second edition of the Shaping our slice of heaven series to stimulate debate aimed at improving regional economic development, enhancing regional coordination, and building on our regional differences for the best outcomes over the long-term – not only from an economic growth perspective, but also on a holistic basis encompassing inclusiveness, social, natural and human capital.
Regions of opportunity | Building a platform
47
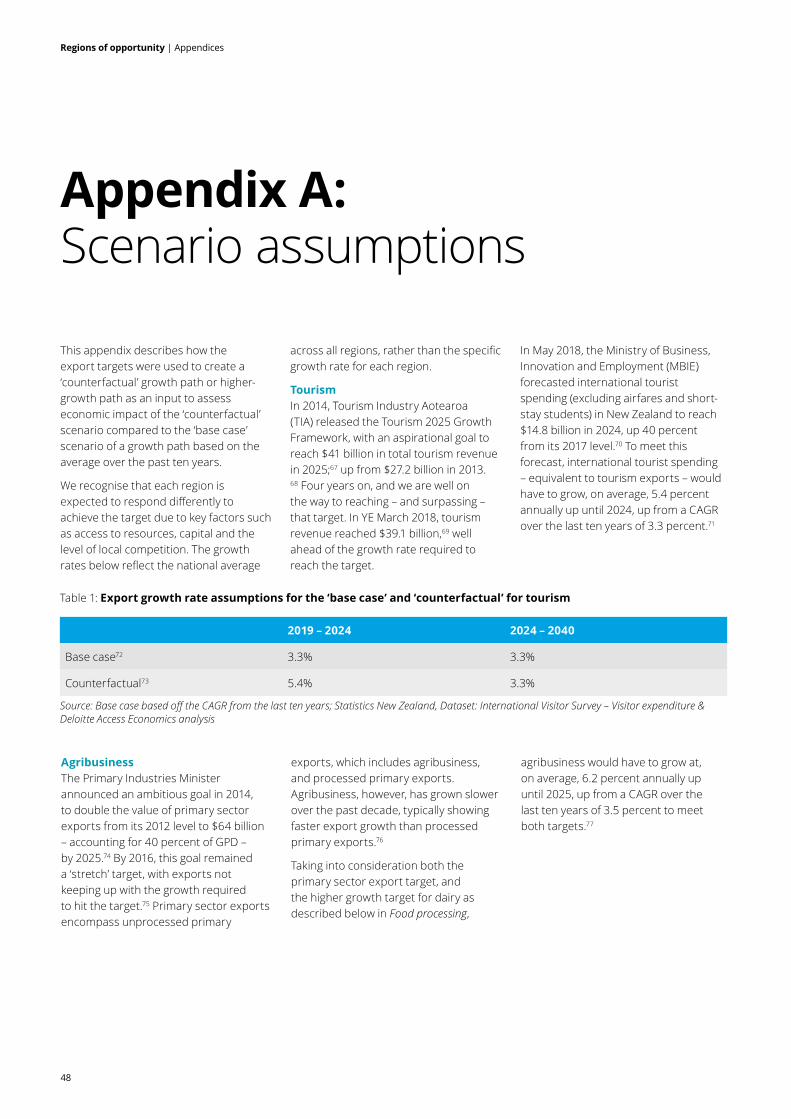
Appendix A: Scenario assumptions
This appendix describes how the export targets were used to create a ‘counterfactual’ growth path or higher-growth path as an input to assess economic impact of the ‘counterfactual’ scenario compared to the ‘base case’ scenario of a growth path based on the average over the past ten years.
We recognise that each region is expected to respond differently to achieve the target due to key factors such as access to resources, capital and the level of local competition. The growth rates below reflect the national average
across all regions, rather than the specific growth rate for each region.
TourismIn 2014, Tourism Industry Aotearoa (TIA) released the Tourism 2025 Growth Framework, with an aspirational goal to reach $41 billion in total tourism revenue in 2025;67 up from $27.2 billion in 2013. 68 Four years on, and we are well on the way to reaching – and surpassing – that target. In YE March 2018, tourism revenue reached $39.1 billion,69 well ahead of the growth rate required to reach the target.
In May 2018, the Ministry of Business, Innovation and Employment (MBIE) forecasted international tourist spending (excluding airfares and short-stay students) in New Zealand to reach $14.8 billion in 2024, up 40 percent from its 2017 level.70 To meet this forecast, international tourist spending – equivalent to tourism exports – would have to grow, on average, 5.4 percent annually up until 2024, up from a CAGR over the last ten years of 3.3 percent.71
Table 1: Export growth rate assumptions for the ‘base case’ and ‘counterfactual’ for tourism
2019 – 2024 2024 – 2040
Base case72 3.3% 3.3%
Counterfactual73 5.4% 3.3%
Source: Base case based off the CAGR from the last ten years; Statistics New Zealand, Dataset: International Visitor Survey – Visitor expenditure & Deloitte Access Economics analysis
Regions of opportunity | Appendices
48
AgribusinessThe Primary Industries Minister announced an ambitious goal in 2014, to double the value of primary sector exports from its 2012 level to $64 billion – accounting for 40 percent of GPD – by 2025.74 By 2016, this goal remained a ‘stretch’ target, with exports not keeping up with the growth required to hit the target.75 Primary sector exports encompass unprocessed primary
exports, which includes agribusiness, and processed primary exports. Agribusiness, however, has grown slower over the past decade, typically showing faster export growth than processed primary exports.76
Taking into consideration both the primary sector export target, and the higher growth target for dairy as described below in Food processing,
agribusiness would have to grow at, on average, 6.2 percent annually up until 2025, up from a CAGR over the last ten years of 3.5 percent to meet both targets.77

Table 2: Export growth rate assumptions for the ‘base case’ and ‘counterfactual’ for agribusiness
2019 – 2025 2025 – 2040
Base case78 3.5% 3.5%
Counterfactual79 6.2% 3.5%
Source: Base case based off the CAGR from the last ten years; Statistics New Zealand, Primary industry export revenue, 2004-2022; Statistics New Zealand, Level of Processing (4 digit) – Exports (Annual-Jun); & Deloitte Access Economics analysis
Table 3: Export growth rate assumptions for the ‘base case’ and ‘counterfactual’ for food processing
2019 – 2025 2025 – 2040
2019 – 2025 2025 – 2040
Base case86 5.1% 5.1%
Counterfactual87 7.5% 5.1%
Source: Base case based off the CAGR from the last ten years; Statistics New Zealand, Primary industry export revenue, 2004-2022; Statistics New Zealand, Level of Processing (4 digit) – Exports (Annual-Jun); & Deloitte Access Economics analysis
Food processingProcessed foods, included processed primary products, make up over a third of New Zealand’s goods exports.80 All processed foods are all included in the primary sector export target, outlined under Agribusiness. Of these processed food exports, two thirds are made up of a thriving dairy export sector.81 Fonterra
– New Zealand’s largest dairy producer – makes up a quarter of New Zealand’s total goods export value,82 and holds 84 per cent of the milk processing market share in New Zealand.83 In 2014, Fonterra released an aggressive growth target to reach $35 billion in total revenue by 2025; up from $22 billion in 2013.84
Taking into consideration both the higher growth target for dairy, and the primary sector export target described above in Agribusiness, food processing would have to grow at, on average, 7.5 percent annually up until 2025, up from a CAGR over the last decade of 5.1 percent to meet both targets.85
Regions of opportunity | Appendices
49
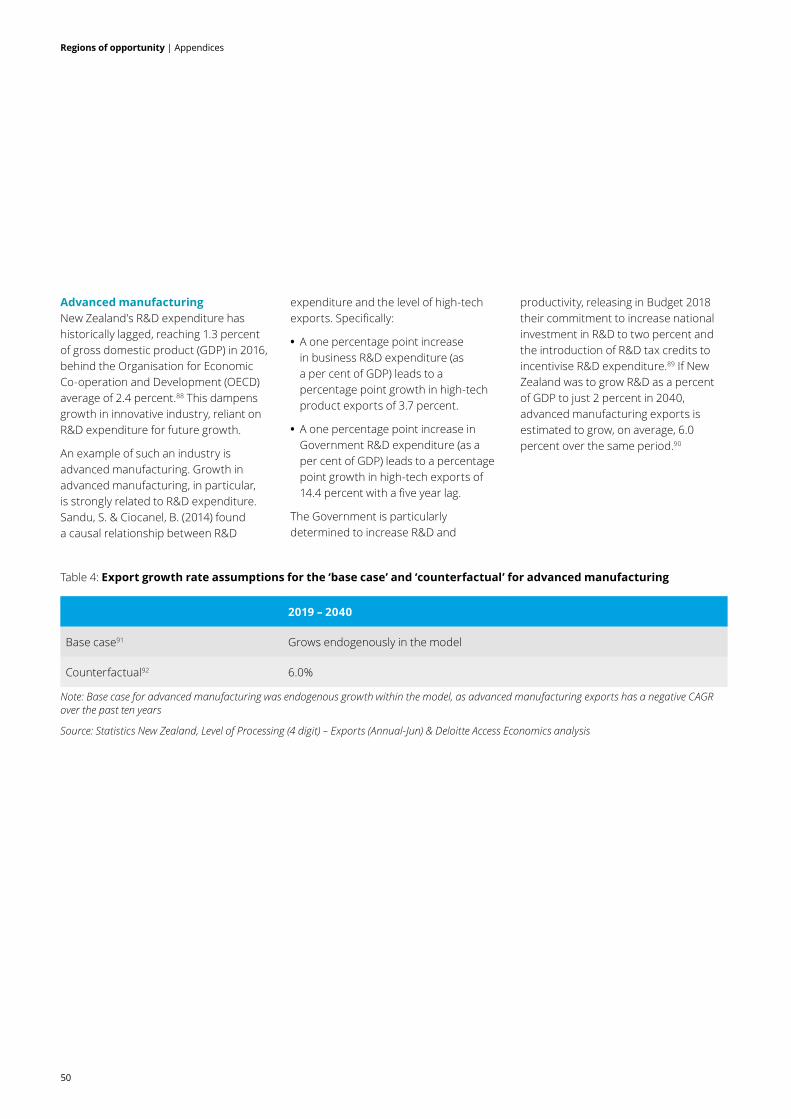
Table 4: Export growth rate assumptions for the ‘base case’ and ‘counterfactual’ for advanced manufacturing
2019 – 2040
Base case91 Grows endogenously in the model
Counterfactual92 6.0%
Note: Base case for advanced manufacturing was endogenous growth within the model, as advanced manufacturing exports has a negative CAGR over the past ten years
Source: Statistics New Zealand, Level of Processing (4 digit) – Exports (Annual-Jun) & Deloitte Access Economics analysis
Advanced manufacturingNew Zealand’s R&D expenditure has historically lagged, reaching 1.3 percent of gross domestic product (GDP) in 2016, behind the Organisation for Economic Co-operation and Development (OECD) average of 2.4 percent.88 This dampens growth in innovative industry, reliant on R&D expenditure for future growth.
An example of such an industry is advanced manufacturing. Growth in advanced manufacturing, in particular, is strongly related to R&D expenditure. Sandu, S. & Ciocanel, B. (2014) found a causal relationship between R&D
expenditure and the level of high-tech exports. Specifically:
• A one percentage point increase in business R&D expenditure (as a per cent of GDP) leads to a percentage point growth in high-tech product exports of 3.7 percent.
• A one percentage point increase in Government R&D expenditure (as a per cent of GDP) leads to a percentage point growth in high-tech exports of 14.4 percent with a five year lag.
The Government is particularly determined to increase R&D and
productivity, releasing in Budget 2018 their commitment to increase national investment in R&D to two percent and the introduction of R&D tax credits to incentivise R&D expenditure.89 If New Zealand was to grow R&D as a percent of GDP to just 2 percent in 2040, advanced manufacturing exports is estimated to grow, on average, 6.0 percent over the same period.90
Regions of opportunity | Appendices
50

Appendix B: Measuring the economic impact
We used our in-house model to estimate this economic impact. The Deloitte Access Economics – Regional General Equilibrium Model (DAE-RGEM) is a large scale, dynamic, multi-region, multi-commodity computable general equilibrium model of the world economy with bottom up modelling of New Zealand regions. The model allows policy analysis in a single, robust, integrated economic framework. This model projects changes in macroeconomic
aggregates such as GDP, employment, export volumes, investment and private consumption. At the sectoral level, detailed results such as output, exports, imports and employment are also produced.
The model is based upon a set of key underlying relationships between the various components of the model, each which represent a different group of agents in the economy.
These relationships are solved simultaneously, and so there is no logical start or end point for describing how the model actually works. However, they can be viewed as a system of interconnected markets with appropriate specifications of demand, supply and the market clearing conditions that determine the equilibrium prices and quantity produced, consumed and traded.
This appendix describes how we measured the economic impact based on our in-house model.
The economic impact was measured in terms of GDP and employment. The GDP output of the scenarios are illustrated in the figure below. Scenario 1 is labelled the ‘base case’ scenario where the GDP growth curve for the current export
growth path is illustrated. Scenario 2 is labelled ‘counterfactual’ scenario where the GDP growth curve for when exports meet the national targets set is illustrated. The economic impact is the differential between the GDP growth in ‘base case’ scenario relative to ‘counterfactual’ scenario.
Figure 15: Illustration of the economic impact in terms of GDP growth for the two scenarios
2018 2040
GD
P gr
owth
/ Re
gion
al G
DP
grow
th
CounterfactualForecast base case
Regions of opportunity | Appendices
51
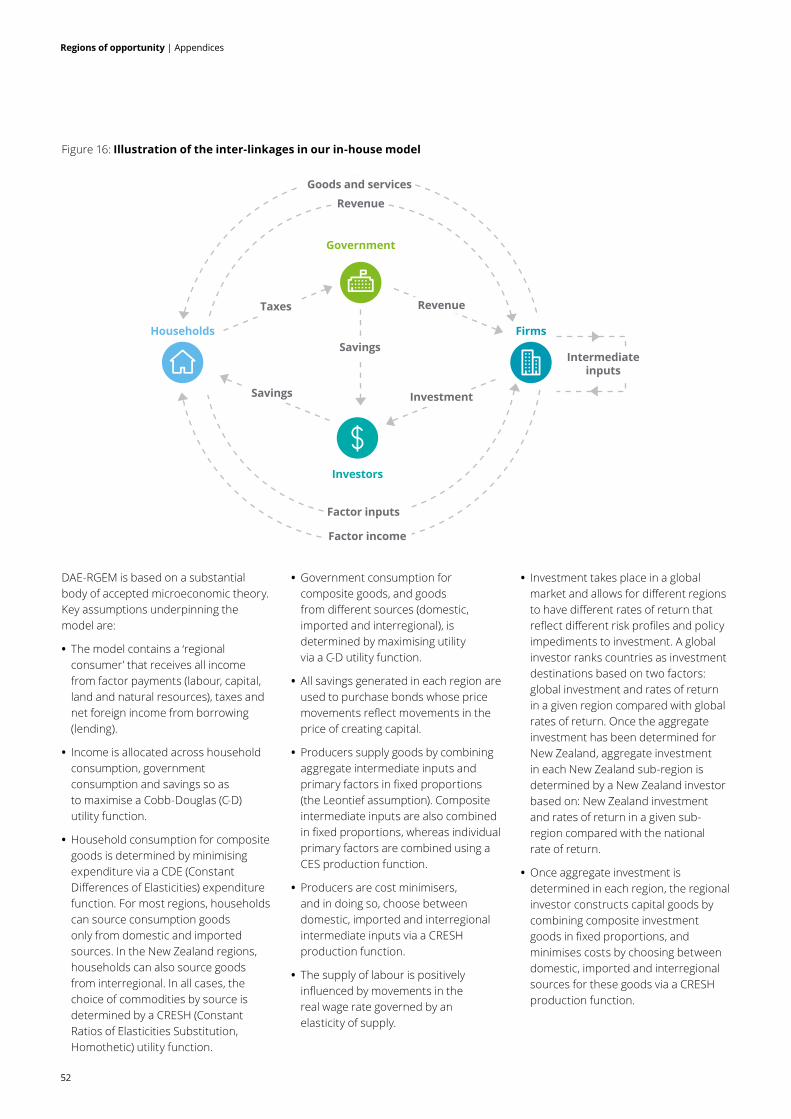
Figure 16: Illustration of the inter-linkages in our in-house model
DAE-RGEM is based on a substantial body of accepted microeconomic theory. Key assumptions underpinning the model are:
• The model contains a ‘regional consumer’ that receives all income from factor payments (labour, capital, land and natural resources), taxes and net foreign income from borrowing (lending).
• Income is allocated across household consumption, government consumption and savings so as to maximise a Cobb-Douglas (C-D) utility function.
• Household consumption for composite goods is determined by minimising expenditure via a CDE (Constant Differences of Elasticities) expenditure function. For most regions, households can source consumption goods only from domestic and imported sources. In the New Zealand regions, households can also source goods from interregional. In all cases, the choice of commodities by source is determined by a CRESH (Constant Ratios of Elasticities Substitution, Homothetic) utility function.
• Government consumption for composite goods, and goods from different sources (domestic, imported and interregional), is determined by maximising utility via a C-D utility function.
• All savings generated in each region are used to purchase bonds whose price movements reflect movements in the price of creating capital.
• Producers supply goods by combining aggregate intermediate inputs and primary factors in fixed proportions (the Leontief assumption). Composite intermediate inputs are also combined in fixed proportions, whereas individual primary factors are combined using a CES production function.
• Producers are cost minimisers, and in doing so, choose between domestic, imported and interregional intermediate inputs via a CRESH production function.
• The supply of labour is positively influenced by movements in the real wage rate governed by an elasticity of supply.
• Investment takes place in a global market and allows for different regions to have different rates of return that reflect different risk profiles and policy impediments to investment. A global investor ranks countries as investment destinations based on two factors: global investment and rates of return in a given region compared with global rates of return. Once the aggregate investment has been determined for New Zealand, aggregate investment in each New Zealand sub-region is determined by a New Zealand investor based on: New Zealand investment and rates of return in a given sub-region compared with the national rate of return.
• Once aggregate investment is determined in each region, the regional investor constructs capital goods by combining composite investment goods in fixed proportions, and minimises costs by choosing between domestic, imported and interregional sources for these goods via a CRESH production function.
Government
Investors
Goods and services
Revenue
SavingsFirmsHouseholds
Taxes Revenue
InvestmentSavings
Factor inputs
Factor income
Intermediateinputs
Regions of opportunity | Appendices
52

• Prices are determined via market-clearing conditions that require sectoral output (supply) to equal the amount sold (demand) to final users (households and government), intermediate users (firms and investors), foreigners (international exports), and other New Zealand regions (interregional exports).
• For internationally-traded goods (imports and exports), the Armington assumption is applied whereby the same goods produced in different countries are treated as imperfect substitutes. But, in relative terms, imported goods from different regions are treated as closer substitutes than domestically-produced goods and imported composites. Goods traded interregional within the New Zealand regions are assumed to be closer substitutes again.
• The model accounts for greenhouse gas emissions from fossil fuel combustion. Taxes can be applied to emissions, which are converted to good-specific sales taxes that impact on demand. Emission quotas can be set by region and these can be traded, at a value equal to the carbon tax avoided, where a region’s emissions fall below or exceed their quota.
Below is a description of each component of the model and key linkages between components.
Households Each region in the model has a so-called representative household that receives and spends all income. The representative household allocates income across three different expenditure areas: private household consumption; government consumption; and savings.
The representative household interacts with producers in two ways. First, in allocating expenditure across household and government consumption, this
sustains demand for production. Second, the representative household owns and receives all income from factor payments (labour, capital, land and natural resources) as well as net taxes. Factors of production are used by producers as inputs into production along with intermediate inputs. The level of production, as well as supply of factors, determines the amount of income generated in each region.
The representative household’s relationship with investors is through the supply of investable funds – savings. The relationship between the representative household and the international sector is twofold. First, importers compete with domestic producers in consumption markets. Second, other regions in the model can lend (borrow) money from each other.
• The representative household allocates income across three different expenditure areas – private household consumption; government consumption; and savings – to maximise a Cobb- Douglas utility function.
• Private household consumption on composite goods is determined by minimising a CDE (Constant Differences of Elasticities) expenditure function. Private household consumption on composite goods from different sources is determined is determined by a CRESH (Constant Ratios of Elasticities Substitution, Homothetic) utility function.
• Government consumption on composite goods, and composite goods from different sources, is determined by maximising a Cobb-Douglas utility function.
• All savings generated in each region is used to purchase bonds whose price movements reflect movements in the price of generating capital.
ProducersApart from selling goods and services to households and government, producers sell products to each other (intermediate usage) and to investors. Intermediate usage is where one producer supplies inputs to another’s production. For example, coal producers supply inputs to the electricity sector.
Capital is an input into production. Investors react to the conditions facing producers in a region to determine the amount of investment. Generally, increases in production are accompanied by increased investment. In addition, the production of machinery, construction of buildings and the like that forms the basis of a region’s capital stock, is undertaken by producers. In other words, investment demand adds to household and government expenditure from the representative household, to determine the demand for goods and services in a region.
Producers interact with international markets in two main ways. First, they compete with producers in overseas regions for export markets, as well as in their own region. Second, they use inputs from overseas in their production.
• Sectoral output equals the amount demanded by consumers (households and govern ment) and intermediate users (firms and investors) as well as exports.
• Intermediate inputs are assumed to be combined in fixed proportions at the composite level. As mentioned above, the exception to this is the electricity sector that is able to substitute different technologies (brown coal, black coal, oil, gas, hydropower and other renewables) using the ‘technology bundle’ approach developed by ABARE (1996).
Regions of opportunity | Appendices
53
• To minimise costs, producers substitute between domestic and imported intermediate inputs is governed by the Armington assumption as well as between primary factors of production (through a CES aggregator). Substitution between skilled and unskilled labour is also allowed (again via a CES function).
• The supply of labour is positively influenced by movements in the wage rate governed by an elasticity of supply is (assumed to be 0.2). This implies that changes influencing the demand for labour, positively or negatively, will impact both the level of employment and the wage rate. This is a typical labour market specification for a dynamic model such as DAE-RGEM. There are other labour market ‘settings’ that can be used. First, the labour market could take on long-run characteristics with aggregate employment being fixed and any changes to labour demand changes being absorbed through movements in the wage rate. Second, the labour market could take on short-run characteristics with fixed wages and flexible employment levels.
InvestorsInvestment takes place in a global market and allows for different regions to have different rates of return that reflect different risk profiles and policy impediments to investment. The global investor ranks countries as investment destination based on two factors: current economic growth and rates of return in a given region compared with global rates of return.
Once aggregate investment is determined in each region, the regional investor constructs capital goods by combining composite investment goods in fixed proportions, and minimises costs by choosing between domestic, imported and interregional sources for these goods via a CRESH production function.
International Each of the components outlined above operate, simultaneously, in each region of the model. That is, for any simulation the model forecasts changes to trade and investment flows within, and between, regions subject to optimising behaviour by producers, consumers and investors. Of course, this implies some global conditions that must be met, such as global exports and global imports, are the same and that global debt repayment equals global debt receipts each year.
Regions of opportunity | Appendices
54

Endnotes
1. New Zealand Productivity Commission (2014). Trade over distance for New Zealand firms: measurement and implications, retrieved from https://www.productivity.govt.nz/sites/default/files/nzpc-working-paper-2014-05-trade-over-distance-rev2.pdf
2. It should be noted that not all of this additional demand for workers will be in the form of paid labour, it may be in the form of robotic or cognitive workers
3. Deloitte Access Economics, The importance of place: a cities and regions view of wellbeing, 2018 retrieved from https://www2.deloitte.com/nz/en/pages/public-sector/articles/cities-and-regions-wellbeing.html
4. Statistics New Zealand, Estimated Resident Population for Regional Council Areas, at 30 June (1996+) (Annual-Jun), 2017
5. It should be noted that the exports data captures exports from airports and seaports within the region. So, inter-regional exports from a region cannot be captured separately, and some exports could be transported from another region to that port of export. Although there are some limitations of this data, it does provide an indicative regional split of cargo exports across our regions of focus.
6. While international education was identified as an ‘industry of opportunity’ in Shaping our Slice of Heaven: Industries of opportunity, it was not included in this analysis due to limitations in the data
7. The higher-growth rate is only applied over the target period – when the target year is reached, growth in exports returns to the ‘base case’ level.
8. We note that as the high-growth scenario is only applied to our regions of focus, the ‘counterfactual’ scenario does not illustrate an economy where the export target is met. Rather, the regions of focus grow at the rate that the entire country’s exports would need to grow at to meet the target. The high-growth rates were only applied to our regions of focus to reduce noise in the model.
9. Ministry of Business, Innovation and Employment, New Zealand Tourism Forecasts 2018 – 2024, May 2018
10. Beehive (2014). Minister outlines ‘export double’ vision for primary sector, November 2014, retrieved from https://www.beehive.govt.nz/release/minister-outlines-’export-double’-vision-primary-sector. There is no information to show that this target has
been updated or amended under the new Government.
11. Fonterra, Investors day presentation, December 2017
12. New Zealand Government, Research and development key to building a stronger and more productive economy, May 2018, retrieved from https://www.budget.govt.nz/budget/2018/releases/r28-la-woods-research-and-development-key-to-build.htm
13. Sandu, S. & Ciocanel, B. (2014). Impact of R&D and Innovation on high-tech export. Procedia Economics and Finance. Volume 15, 2014, Pages 80-90. Found that for a 1.0% increase in business R&D expenditure, growth in advanced manufacturing is expected to be 3.7%, and a 1.0% increase in Government R&D expenditure is expected to lead to an increase in advanced manufacturing exports by 14.4% with a five year lag.
14. Ibid.
15. We assume that R&D as a proportion of GDP grows at a constant rate to reach 2.0% in 2040 – the last year of analysis in the model.
16. It is important to note that as these shocks were run independently, the results are not additive across industries.
17. We note that the five focus regions cover most of the country’s advanced manufacturing (79%), food processing (70%) and tourism (64%) production, but only cover 44% of the country’s agriculture production. It can therefore be expected that by limiting the high-growth export profiles to only our focus regions would have less of an economic impact in agribusiness relative to other industries.
18. See Appendix B for how industries are defined within the model.
19. Statistics New Zealand; Permanent & long-term migration by country of residence, citizenship and NZ area (Annual-Mar)
20. Statistics New Zealand, Projected population of regional council areas (2013(base)- 2043 update)
21. Demographia (2018) 14th Annual Demographia International Housing Affordability Survey: 2018
22. Auckland Airport, Fast Facts, retrieved from https://corporate.aucklandairport.co.nz/news/publications/fast-facts
23. Horwath HTL (2018). Market report Auckland hotel market outlook, September 2018, retrieved from https://horwathhtl.com/publication/market-report-auckland-hotel-market-outlook/
24. New Zealand Trade and Enterprise, Auckland Investment Profile, December 2016
25. New Zealand Trade and Enterprise, Auckland Investment Profile, December 2016
26. New Zealand Trade and Enterprise, Auckland Investment Profile, December 2016
27. Exports of Merchandise Trade and Services (2010). Understanding Auckland’s Role in New Zealand’s Global Engagement. Retrieved from http://knowledgeauckland.org.nz/assets/publications/Understanding_Auckland__s_Role_in_New_Zealand__s_Global_Engagement_Exports_of_Merchandise_Trade_and_Services.pdf
28. Hsieh, C-T., & Moretti, E. (2018). Housing constraints and spatial misallocation. American Economic Journal: Macroeconomics (Forthcoming)
29. Ministry of Business, Innovation and Employment (2018). Beyond commodities: Manufacturing into the future, retrieved from https://www.mbie.govt.nz/assets/f0f81b6194/new-zealand-manufacturing-sector-report-2018.pdf
30. Clusters are “geographic concentrations of industries related by knowledge, skills, inputs, demand, and/or other linkages.”
31. Delgado, M, Porter M, Stern, S. (2014). Defining Clusters of Related Industries. Working paper 20375. National Bureau of Economic Research, Cambridge.
32. New Zealand Trade and Enterprise (2016), Waikato Investment Profile, December 2016
33. Open Waikato, Farming, retrieved from http://openwaikato.co.nz/Invest/Detail/11/farming>
34. Ibid.
35. Ibid.
36. Year ended August 2018; Ministry of Business, Innovation and Employment, MRTE Insights Viewer; and Hamilton & Waikato Tourism, Tourism Opportunities Plan 2016, June 2016
37. Ibid.
38. New Zealand Trade and Enterprise (2016). Waikato Investment Profile, December 2016
Regions of opportunity | Endnotes
55

39. Hawke’s Bay Wines, Hawke’s Bay, retrieved from http://hawkesbaywine.co.nz/hawkes-bay
40. Matariki: Hawke’s Bay Regional Economic Development Strategy and Action Plan 2016, (2016). Retrieved from https://www.sporty.co.nz/asset/downloadasset?id=627903f5-568e-4c32-b12d-b3fe994752f8
41. Year ended March 2017; Statistics New Zealand, Gross domestic product, by region (Annual-Mar)
42. Matariki: Hawke’s Bay Regional Economic Development Strategy and Action Plan 2016, (2016). Retrieved from https://www.sporty.co.nz/asset/downloadasset?id=627903f5-568e-4c32-b12d-b3fe994752f8
43. Tairawhiti’s Economic Action Plan Governance Group (2017). Tairawhiti’s Economic Action Plan, February 2017
44. Ministry of Business, Innovation and Employment and Ministry of Transport (2014). East Coast Regional Economic Potential Study
45. Year ended March 2017; Statistics New Zealand, Gross domestic product, by region (Annual-Mar)
46. Year ended March 2018; Statistics New Zealand, Regional Gross Domestic Product – RNA (Annual-Mar)
47. Business Environment, Wellington City Council. Retrieved from https://www.wellingtonnz.com/business/business-environment
48. New Zealand Trade and Enterprise (2016). Wellington Investment Profile, December 2016
49. Wellington City Economic Profile, Infometrics. Retrieved from https://ecoprofile.infometrics.co.nz/Wellington%2bCity/Businesses
50. State Services Commission (2018). Retrieved from http://www.ssc.govt.nz/public-service-workforce-data/hrc-workforce
51. Technology Investment Network & Ministry of Business, Innovation and Employment (2017). The investor’s guide to the New Zealand Technology Sector.
52. Ministry of Business, Innovation and Employment (2019). Key Tourism Statistics, January 13, 2019
53. Ibid.
54. Statistics New Zealand (2016). Agricultural and horticultural land use, 2016
55. Wellington City Council, Business Environment. Retrieved from https://www.wellingtonnz.com/business/business-environment
56. See Appendix B for how industries are defined within the model.
57. New Zealand Trade and Enterprise (2019). Wellington Investment Profile. Retrieved from https://www.nzte.govt.nz/-/media/NZTE/Downloads/Investment-and-funding/Regional-investment-profiles/Wellington-investment-profile.pdf
58. Technology Investment Network & Ministry of Business, Innovation and Employment (2017). The investor’s guide to the New Zealand Technology Sector.
59. Wellington City Council, Business Environment. Retrieved from https://www.wellingtonnz.com/business/business-environment
60. Year ended March 2017; Statistics New Zealand, Gross domestic product, by region (Annual-Mar)
61. ChristchurchNZ (2018). Christchurch and Canterbury Quarterly Economic Report August 2018. Retrieved from https://www.christchurchnz.org.nz/media/8483/2018-q2-economic-update.pdf
62. ChristchurchNZ (2018). Manufacturing. Retrieved from https://www.cdc.org.nz/economy/sector-profiles/manufacturing
63. Ministry of Business, Innovation and Employment (2018). Beyond commodities: Manufacturing into the future, retrieved from https://www.mbie.govt.nz/assets/f0f81b6194/new-zealand-manufacturing-sector-report-2018.pdf
64. Christchurch NZ (2014). Agriculture, Forestry and Fishing. Retrieved from https://www.cdc.org.nz/economy/sector-profiles/agriculture-forestry-fishing/
65. M. Pezzini (2012). An emerging middle class. OECD Observer. Retrieved from http://oecdobserver.org/news/fullstory.php/aid/3681/An_emerging_middle_class.html
66. Ministry of Business, Innovation and Employment (2018). New Zealand Manufacturing Sector Report 2018
67. Tourism Industry Aotearoa (2014). Tourism 2025 Growing Value Together
68. Statistics New Zealand (2018). Tourism Satellite Account
69. Statistics New Zealand (2018). Tourism Satellite Account
70. Ministry of Business, Innovation and Employment (2018). New Zealand Tourism Forecasts 2018 – 2024
71. Statistics New Zealand (2018). Dataset: International Visitor Survey – Visitor expenditure & Deloitte Access Economics analysis
72. Based off the CAGR from the last ten years; Statistics New Zealand (2018). Dataset: International Visitor Survey – Visitor expenditure & Deloitte Access Economics analysis
73. Statistics New Zealand (2018). Dataset: International Visitor Survey – Visitor expenditure & Deloitte Access Economics analysis
74. Beehive (2014). Minister outlines ‘export double’ vision for primary sector. Retrieved from https://www.beehive.govt.nz/release/minister-outlines-%E2%80%98export-double%E2%80%99-vision-primary-sector
75. The National Business Review (2016). NZ goal of doubling primary sector exports to $64b by 2025 remains a stretch target, MPI says. Retrieved from https://www.nbr.co.nz/article/nz-goal-doubling-primary-sector-exports-64b-2025-remains-stretch-target-mpi-says-b-190432
76. Statistics New Zealand, Primary industry export revenue, 2004-2022; Statistics New Zealand, Level of Processing (4 digit) – Exports (Annual-Jun); & Deloitte Access Economics analysis
77. Statistics New Zealand, Primary industry export revenue, 2004-2022; Statistics New Zealand, Level of Processing (4 digit) – Exports (Annual-Jun); & Deloitte Access Economics analysis
78. Based off the CAGR from the last ten years; Statistics New Zealand, Primary industry export revenue, 2004-2022; Statistics New Zealand, Level of Processing (4 digit) – Exports (Annual-Jun); & Deloitte Access Economics analysis
79. Statistics New Zealand, Primary industry export revenue, 2004-2022; Statistics New Zealand, Level of Processing (4 digit) – Exports (Annual-Jun); & Deloitte Access Economics analysis
Regions of opportunity | Endnotes
56
80. Statistics New Zealand, Level of Processing (4 digit) – Exports (Annual-Jun) & Deloitte Access Economics analysis
81. Statistics New Zealand, Level of Processing (4 digit) – Exports (Annual-Jun) & Deloitte Access Economics analysis
82. Fonterra (2019). Export Markets. Retrieved from https://www.fonterra.com/nz/en/what-we-stand-for/global-reach/export-markets.html
83. New Zealand Herald (2018). New report lines up Fonterra beside local competitors. Retrieved from https://www.nzherald.co.nz/business/news/article.cfm?c_id=3&objectid=12042971
84. New Zealand Herald (2014). Brian Gaynor: Fonterra must boost consumer products. Retrieved from https://www.nzherald.co.nz/brian-gaynor-on-business/news/article.cfm?c_id=1503237&objectid=11332266
85. Statistics New Zealand, Primary industry export revenue, 2004-2022; Statistics New Zealand, Level of Processing (4 digit) – Exports (Annual-Jun); & Deloitte Access Economics analysis
86. Based off the CAGR from the last ten years; Statistics New Zealand, Primary industry export revenue, 2004-2022; Statistics New Zealand, Level of Processing (4 digit) – Exports (Annual-Jun); & Deloitte Access Economics analysis
87. Statistics New Zealand, Primary industry export revenue, 2004-2022; Statistics New Zealand, Level of Processing (4 digit) – Exports (Annual-Jun); & Deloitte Access Economics analysis
88. The National Business Review (2017). NZ companies lift spending on R&D but still lag behind OECD average. Retrieved from https://www.nbr.co.nz/article/nz-companies-lift-spending-rd-still-lag-behind-oecd-average-b-201286
89. New Zealand Government (2018). Research and development key to building a stronger and more productive economy. Retrieved from https://www.budget.govt.nz/budget/2018/releases/r28-la-woods-research-and-development-key-to-build.htm
90. Sandu, S. & Ciocanel, B. (2014). Impact of R&D and Innovation on high-tech export. Procedia Economics and Finance. Volume 15, 2014, Pages 80-90.; & Statistics New Zealand, Level of Processing (4 digit) – Exports (Annual-Jun); & Deloitte Access Economics analysis
91. The ‘base case’ for advanced manufacturing was endogenous growth within the model, as advanced manufacturing exports has a negative CAGR over the past ten years
92. Sandu, S. & Ciocanel, B. (2014). Impact of R&D and Innovation on high-tech export. Procedia Economics and Finance. Volume 15, 2014, Pages 80-90.; & Statistics New Zealand, Level of Processing (4 digit) – Exports (Annual-Jun); & Deloitte Access Economics analysis
Regions of opportunity | Endnotes
57

Contact
Key contributors
Linda Meade Partner Deloitte Access Economics New Zealand
Tel: +64 (4) 470 3788 Email: [email protected]
Shaping our slice of heaven: Regions of opportunity
Liza Van der Merwe Associate Director Deloitte Access Economics
Becky Burgess Analyst Deloitte Access Economics

Deloitte refers to one or more of Deloitte Touche Tohmatsu Limited (“DTTL”), its global network of member firms, and their related entities. DTTL (also referred to as “Deloitte Global”) and each of its member firms are legally separate and independent entities. DTTL does not provide services to clients. Please see www.deloitte.com/about to learn more.
Deloitte Asia Pacific Limited is a company limited by guarantee and a member firm of DTTL. Members of Deloitte Asia Pacific Limited and their related entities provide services in Australia, Brunei Darussalam, Cambodia, East Timor, Federated States of Micronesia, Guam, Indonesia, Japan, Laos, Malaysia, Mongolia, Myanmar, New Zealand, Palau, Papua New Guinea, Singapore, Thailand, The Marshall Islands, The Northern Mariana Islands, The People’s Republic of China (incl. Hong Kong SAR and Macau SAR), The Philippines and Vietnam, in each of which operations are conducted by separate and independent legal entities.
Deloitte is a leading global provider of audit and assurance, consulting, financial advisory, risk advisory, tax and related services. Our network of member firms in more than 150 countries and territories serves four out of five Fortune Global 500® companies. Learn how Deloitte’s approximately 286,000 people make an impact that matters at www.deloitte.com.
Deloitte New Zealand brings together more than 1300 specialist professionals providing audit, tax, technology and systems, strategy and performance improvement, risk management, corporate finance, business recovery, forensic and accounting services. Our people are based in Auckland, Hamilton, Rotorua, Wellington, Christchurch, Queenstown and Dunedin, serving clients that range from New Zealand’s largest companies and public sector organisations to smaller businesses with ambition to grow. For more information about Deloitte in New Zealand, look to our website www.deloitte.co.nz.
This communication contains general information only, and none of Deloitte Touche Tohmatsu Limited, its member firms, or their related entities (collectively, the “Deloitte Network”) is, by means of this communication, rendering professional advice or services. Before making any decision or taking any action that may affect your finances or your business, you should consult a qualified professional adviser. No entity in the Deloitte Network shall be responsible for any loss whatsoever sustained by any person who relies on this communication.
© 2019. For information, contact Deloitte Touche Tohmatsu Limited.