Shape. - Uniqa Insurance Group 2004, the UNIQA Group has pledged to comply with the Austrian Code of...
174
Shape. ANNUAL FINANCIAL REPORT 2014 ACCORDING TO SECTION 82 PARAGRAPH 4 OF THE AUSTRIAN STOCK EXCHANGE ACT UNIQA INSURANCE GROUP AG
Transcript of Shape. - Uniqa Insurance Group 2004, the UNIQA Group has pledged to comply with the Austrian Code of...

Shape.
ANNUAL FINANCIAL REPORT 2014ACCORDING TO SECTION 82 PARAGRAPH 4 OF
THE AUSTRIAN STOCK EXCHANGE ACTUNIQA INSURANCE GROUP AG

Contents
Corporate Governance Report . . . . . . . . . . . . . . . . . . . . . . . . . . . . . . . . . . . . . . . . . . . . . . . . . . . . . . . . . . . . . . . . . 3Report of the Supervisory Board . . . . . . . . . . . . . . . . . . . . . . . . . . . . . . . . . . . . . . . . . . . . . . . . . . . . . . . . . . . . . . 17Group Management Report . . . . . . . . . . . . . . . . . . . . . . . . . . . . . . . . . . . . . . . . . . . . . . . . . . . . . . . . . . . . . . . . . . 20Consolidated Financial Statements . . . . . . . . . . . . . . . . . . . . . . . . . . . . . . . . . . . . . . . . . . . . . . . . . . . . . . . . . . . 38Notes to the Consolidated Financial Statements . . . . . . . . . . . . . . . . . . . . . . . . . . . . . . . . . . . . . . . . . . . . . . 48Auditor‘s Opinion . . . . . . . . . . . . . . . . . . . . . . . . . . . . . . . . . . . . . . . . . . . . . . . . . . . . . . . . . . . . . . . . . . . . . . . . . . . 170Statement by Legal Representatives . . . . . . . . . . . . . . . . . . . . . . . . . . . . . . . . . . . . . . . . . . . . . . . . . . . . . . . . . 172
GROUP REPORT 2014 2

Since 2004, the UNIQA Group has pledged to comply with the Austrian Code of Corporate Gov-ernance and publishes the declaration of conformity both in the Group annual report and on the Group website at www.uniqagroup.com in the Investor Relations section. The Austrian Code of Corporate Governance is also publically available at www.corporate-governance.at.
Implementation and compliance with the individual rules in the Code are evaluated by PwC Wirtschaftsprüfung GmbH – with the exception of Rules 77 to 83. Compliance with Rules 77 to 83 of the Code of Corporate Governance is evaluated by Schönherr Rechtsanwälte GmbH. The evaluation is carried out largely using the questionnaire for the evaluation of compliance with the Code published by the Austrian Working Group for Corporate Governance (as amended July 2012). The reports on the external evaluation in accordance with Rule 62 of the Austrian Code of Corporate Governance can also be found at www.uniqagroup.com.
UNIQA also declares its continued willingness to comply with the Austrian Code of Corporate Governance as currently amended. In accordance with statutory requirements, UNIQA complies with the “L rules” (legal requirements) in the Code in full. However, UNIQA deviates from the provisions of the Code as amended with regard to the following C rules (comply or explain rules) and the explanations are set out below.
Rule 49 of the Austrian Code of Corporate Governance
Due to the growth of UNIQA‘s shareholder structure and the special nature of the insurance busi-ness with regard to the investment of insurance assets, there are a number of contracts with com-panies related to the individual members of the Supervisory Board in which they discharge duties as members of governing bodies. If such contracts require approval by the Supervisory Board in accordance with Section 95 paragraph 5 no. 12 of the Austrian Stock Corporation Act (Rule 48), the details of these contracts cannot be made public for reasons of company policy and competition law. All transactions are in any case entered into and processed on an arm’s length basis.
Corporate Governance Report
3 CORPORATE GOVERNANCE REPORT

CORPORATE GOVERNANCE REPORT 4
COMPOSITION OF THE MANAGEMENT BOARDChairmanAndreas Brandstetter, Chief Executive Officer (CEO)
* 1969, appointed 1 January 2002 until 31 December 2016
Responsible for: • Investor Relations • Group Communications • Group Marketing• Group Human Resources• Group Internal Audit• Group General Secretary
Supervisory Board appointments or comparable functions in other domestic and foreign compa-nies not included in the consolidated financial statements:• Member of the Supervisory Board of Raiffeisen Zentralbank Österreich Aktiengesellschaft,
Vienna • Member of the Board of Directors of SCOR SE, Paris
Number of UNIQA shares held as at 31 December 2014: 21,819
MembersHannes Bogner, Chief Investment Officer (CIO)
* 1959, appointed 1 January 1998 until 31 December 2016
Responsible for:• Group Asset Management (Front Office)• Real Estate• Investments/Equity Affairs• Legal & Compliance • Group Internal Audit
Supervisory Board appointments or comparable functions in other domestic and foreign compa-nies not included in the consolidated financial statements:• Member of the Supervisory Board of Casinos Austria Aktiengesellschaft, Vienna • Member of the Supervisory Board of CEESEG Aktiengesellschaft, Vienna • Member of the Supervisory Board of Niederösterreichische Versicherung AG, St. Pölten • Member of the Supervisory Board of Wiener Börse AG, Vienna
Number of UNIQA shares held as at 31 December 2014: 4,812

5 CORPORATE GOVERNANCE REPORT
Wolfgang Kindl
* 1966, appointed 1 July 2011 until 31 December 2016
Responsible for:• UNIQA International
Number of UNIQA shares held as at 31 December 2014: 4,812
Thomas Münkel, Chief Operating Officer (COO)
* 1959, appointed 1 January 2013 until 31 December 2016
Responsible for:• Group Processes• Group IT• Strategic Project Office
Supervisory Board appointments or comparable functions in other domestic and foreign compa-nies not included in the consolidated financial statements:Member of the Supervisory Board of Raiffeisen Informatik GmbH, Vienna
Number of UNIQA shares held as at 31 December 2014: 4,812
Kurt Svoboda, Chief Financial and Risk Officer (CFRO)
* 1967, appointed 1 July 2011 until 31 December 2016
Responsible for:• Group Finance – Accounting• Group Finance – Controlling• Group Risk Management• Group Asset Management (Back Office)• Group Actuary• Group Reinsurance• Regulatory Management Solvency II
Number of UNIQA shares held as at 31 December 2014: 5,461
On 1 January 2015, Kurt Svoboda also took over the role of Chief Financial Officer (CFO) of UNIQA Insurance Group AG in addition to his responsibilities as Chief Risk Officer (CRO). Until 31 December 2014, Hannes Bogner held the role of CFO. Since 1 January 2015, responsibility for compliance has been held by Hannes Bogner (previously Kurt Svoboda).
THE WORK OF THE MANAGEMENT BOARD
The work of the members of the Management Board is regulated by the rules of procedure. The division of business responsibilities as decided by the full Management Board is approved by the Supervisory Board. The rules of procedure govern the obligations of the members of the Man-agement Board to provide each other with information and approve each other’s activities and the obligations of the Management Board to provide information to, and seek consent from, the

CORPORATE GOVERNANCE REPORT 6
Supervisory Board. The rules of procedure specify a list of activities that require consent from the Supervisory Board. The Management Board generally holds weekly meetings in which the members of the Management Board report on the current course of business, determine what steps should be taken and make strategic corporate decisions. In addition, there is a continuous exchange of information between the members of the Management Board regarding relevant activities and events.
The meetings of the Management Board of UNIQA Insurance Group AG are attended by the CEOs of UNIQA Österreich Versicherungen AG and Raiffeisen Versicherung AG – Hartwig Löger and Klaus Pekarek respectively – normally with an advisory vote. The resulting body is known as the Group Executive Board.
The Management Board informs the Supervisory Board at regular intervals, in a timely and comprehensive manner, about all relevant questions of business performance, including the risk situation and the risk management of the Group. In addition, the Chairman of the Supervisory Board is in regular contact with the CEO to discuss the Company’s strategy, business performance and risk management.
MEMBERS OF THE SUPERVISORY BOARD ChairmanWalter Rothensteiner
* 1953, appointed 3 July 1995 until the 16th AGM (2015)
Supervisory Board appointments in domestic and foreign listed companies• Chairman of the Supervisory Board of Raiffeisen Bank International AG, Vienna
First Vice ChairmanChristian Kuhn (since 26 May 2014)
* 1954, appointed 15 May 2006 until the 16th AGM (2015)
Georg Winckler (until 26 May 2014)
* 1943, appointed 17 September 1999 until the 15th AGM (2014)
Supervisory Board appointments in domestic and foreign listed companies• First Vice Chairman of the Supervisory Board of Erste Group Bank AG, Vienna
Second Vice ChairmanErwin Hameseder
* 1956, appointed 21 May 2007 until the 16th AGM (2015)
Supervisory Board appointments in domestic and foreign listed companies• Chairman of the Supervisory Board of AGRANA Beteiligungs-Aktiengesellschaft, Vienna• Vice Chairman of the Supervisory Board of STRABAG SE, Villach• First Vice Chairman of the Supervisory Board of Flughafen Wien Aktiengesellschaft, Vienna
Airport • First Vice Chairman of the Supervisory Board of Raiffeisen Bank International AG, Vienna• Second Vice Chairman of the Supervisory Board of Südzucker AG Mannheim/Ochsenfurt,
Mannheim

7 CORPORATE GOVERNANCE REPORT
Third Vice ChairmanEduard Lechner (since 26 May 2014)
* 1956, appointed 25 May 2009 until the 16th AGM (2015)
Christian Kuhn (until 26 May 2014)
* 1954, appointed 15 May 2006 until the 16th AGM (2015)
Fourth Vice ChairmanGünther Reibersdorfer (until 26 May 2014)
* 1954, appointed 23 May 2005 until 25 May 2009 and 31 May 2010 until the 16th AGM (2015)
Supervisory Board appointments in domestic and foreign listed companies• Member of the Supervisory Board of Raiffeisen International AG, Vienna
Fifth Vice ChairmanEwald Wetscherek (until 26 May 2014)
* 1944, appointed 17 September 1999 until the 15th AGM (2014)
MembersMarkus Andréewitch
* 1955, appointed 26 May 2014 until the 16th AGM (2015)
Ernst Burger
* 1948, appointed 25 May 2009 until the 16th AGM (2015)
Supervisory Board appointments in domestic and foreign listed companies• Vice Chairman of the Supervisory Board of Josef Manner & Comp. Aktiengesellschaft, Vienna
Peter Gauper
* 1962, appointed 29 May 2012 until the 16th AGM (2015)
Eduard Lechner (until 26 May 2014)
* 1956, appointed 25 May 2009 until the 16th AGM (2015)
Johannes Schuster
* 1970, appointed 29 May 2012 until the 16th AGM (2015)
Supervisory Board appointments in domestic and foreign listed companies• Member of the Supervisory Board of Raiffeisen International AG, Vienna
Kory Sorenson
* 1968, appointed 26 May 2014 until the 16th AGM (2015)
Supervisory Board appointments in domestic and foreign listed companies• Member of the Board of Directors of SCOR SE, Paris• Member of the Board of Directors of Phoenix Group Holdings, Cayman Islands

CORPORATE GOVERNANCE REPORT 8
Delegated by the Central Works CouncilJohann-Anton Auer
* 1954, since 18 February 2008
Number of UNIQA shares held as at 31 December 2014: 106
Peter Gattinger
* 1976, since 10 April 2013
Heinrich Kames
* 1962, since 10 April 2013
Number of UNIQA shares held as at 31 December 2014: 56
Franz-Michael Koller
*1956, since 17 September 1999
Number of UNIQA shares held as at 31 December 2014: 912
Friedrich Lehner
* 1952, from 31 May 2000 to 1 September 2008 and since 15 April 2009
Number of UNIQA shares held as at 31 December 2014: 912
The Supervisory Board of UNIQA Insurance Group AG held six meetings in 2014.
COMMITTEES OF THE SUPERVISORY BOARDCommittee for Board AffairsChairman
• Walter Rothensteiner
Vice Chairman
• Christian Kuhn (since 26 May 2014)• Georg Winckler (until 26 May 2014)
Members
• Erwin Hameseder• Eduard Lechner (since 26 May 2014) • Christian Kuhn (until 26 May 2014)
Working CommitteeChairman
• Walter Rothensteiner
Vice Chairman
• Christian Kuhn (since 26 May 2014)• Georg Winckler (until 26 May 2014)

9 CORPORATE GOVERNANCE REPORT
Members
• Erwin Hameseder • Ernst Burger (since 26 May 2014)• Eduard Lechner (since 26 May 2014) • Johannes Schuster (since 26 May 2014)• Christian Kuhn (until 26 May 2014)• Günther Reibersdorfer (until 26 May 2014)• Ewald Wetscherek (until 26 May 2014)
Delegated by the Central Works Council
• Johann-Anton Auer • Heinrich Kames • Franz-Michael Koller
Audit CommitteeChairman
• Walter Rothensteiner
Vice Chairman
• Christian Kuhn (since 26 May 2014)• Georg Winckler (until 26 May 2014)
Members
• Erwin Hameseder• Eduard Lechner (since 26 May 2014) • Kory Sorenson (since 26 May 2014)• Christian Kuhn (until 26 May 2014)• Günther Reibersdorfer (until 26 May 2014)• Ewald Wetscherek (until 26 May 2014)
Delegated by the Central Works Council
• Johann-Anton Auer • Heinrich Kames • Franz-Michael Koller
Investment CommitteeChairman• Erwin Hameseder
Vice Chairman
• Christian Kuhn (since 18 September 2014)• Georg Winckler (until 26 May 2014)

CORPORATE GOVERNANCE REPORT 10
Members
• Eduard Lechner • Peter Gauper (since 26 May 2014)• Kory Sorenson (since 26 May 2014)• Christian Kuhn (from 26 May 2014 to 18 September 2014)• Günther Reibersdorfer (until 26 May 2014)
Delegated by the Central Works Council
• Johann-Anton Auer • Heinrich Kames • Franz-Michael Koller (since 26 May 2014)
THE WORK OF THE SUPERVISORY BOARD AND ITS COMMITTEES
The Supervisory Board advises the Management Board in its strategic planning and projects. It participates in the decisions assigned to it by law, the Articles of Association and its rules of pro-cedure. The Supervisory Board is responsible for supervising the management of the Company by the Management Board.
The Supervisory Board has comprised nine shareholder representatives since the Annual General Meeting held on 26 May 2014 (previously ten shareholder representatives). Georg Winck-ler, Ewald Wetscherek and Günther Reibersdorfer stepped down from the Board. Kory Sorenson, satisfying the criteria of Rule 54 of the Austrian Corporate Governance Code for companies with a free float of more than 20 per cent, and Markus Andréewitch were elected to the Supervisory Board during the Annual General Meeting. Nadine Gatzert withdrew her candidacy. The Chair-man’s Committee of the Supervisory Board was reduced in size from six to four shareholder rep-resentatives. The functions of the fourth and fifth Vice Chairmen were discontinued.
A Committee for Board Affairs was formed to handle the relationship between the Company and the members of its Management Board relating to employment and salary; this committee also acts as the Nominating and Remuneration Committee. In its three meetings, the Committee for Board Affairs dealt with personnel matters relating to Management Board members as well as with questions of remuneration policy and succession planning.
The appointed Working Committee is called upon to make decisions only if the urgency of the matter means that the decision cannot wait until the next meeting of the Supervisory Board. It is the Chairman’s responsibility to assess the urgency of the matter. The decisions passed must be reported in the next meeting of the Supervisory Board. Generally, the Working Committee can make decisions on any issue that is the responsibility of the Supervisory Board but this does not include issues of particular importance or matters that must be decided upon by the full Supervi-sory Board by law. The Working Committee did not convene for any meetings in 2014.
The Audit Committee of the Supervisory Board performs the duties assigned to it by law. The Audit Committee convened for three meetings in which the auditor of the consolidated financial statements also participated, dealt with all financial statement documents, the Corporate Govern-ance Report and the Management Board’s proposal on the appropriation of profit. Furthermore, the planning of the audit of the 2014 financial statements of the companies of the consolidated group was carried out and the Audit Committee was informed of the results of the preliminary audits. In particular, the Audit Committee was provided on a quarterly basis with the reports of the Internal Auditing department concerning audit areas and material findings based on the audits conducted.

11 CORPORATE GOVERNANCE REPORT
Finally, the Investment Committee advises the Management Board with regard to its invest-ment policy; it has no decision-making authority. The Investment Committee held four meetings at which the members discussed the capital investment strategy, questions concerning capital structure and the focus of risk and asset liability management.
The various chairmen of the committees informed the members of the Supervisory Board about the meetings and the work of the respective committees.
For information concerning the activities of the Supervisory Board and its committees, please also refer to the details in the Report of the Supervisory Board.
INDEPENDENCE OF THE SUPERVISORY BOARD
All elected members of the Supervisory Board have declared their independence under Rule 53 of the Austrian Code of Corporate Governance. Kory Sorenson satisfies the criteria in Rule 54 for companies with a free float of more than 20 per cent.
A Supervisory Board member is considered independent if he or she is not in any business or personal relationship with the Company or its Management Board that represents a material con-flict of interests and is therefore capable of influencing the behaviour of the member concerned.
UNIQA has established the following points as additional criteria for determining the inde-pendence of a Supervisory Board member:• The Supervisory Board member should not have been a member of the Management Board or a
managing employee of the Company or a subsidiary of the Company in the past five years.• The Supervisory Board member should not maintain or have maintained within the last year
any business relationship with the Company or a subsidiary of the Company that is material for the Supervisory Board member concerned. This also applies to business relationships with companies in which the Supervisory Board member has a significant economic interest but does not apply to functions performed on decision-making bodies in the Group.
• The Supervisory Board member should not have been an auditor of the Company or a sharehold-er or salaried employee of the auditing company within the last three years.
• The Supervisory Board member should not be a member of the Management Board of anoth-er company in which a Management Board member of our Company is a member of the other company‘s Supervisory Board unless one of the companies is a member of the other company’s group or holds an investment in the other company.
• The Supervisory Board member should not be a member of the Supervisory Board for longer than 15 years. This does not apply to Supervisory Board members who are shareholders with a business investment or who are representing the interests of such a shareholder.
• The Supervisory Board member should not be a close family relative (direct descendent, spouse, life partner, parent, uncle, aunt, sibling, niece, nephew) of a Management Board member or of persons who are in one of the positions described in the above points.
MEASURES TO PROMOTE WOMEN ON THE MANAGEMENT BOARD, SUPERVISORY BOARD AND IN SENIOR EXECUTIVE POSITIONS
UNIQA is convinced that the Group can enhance the level of success on a sustainable basis by encouraging a high degree of diversity. Diversity at management levels has a positive impact on the corporate culture. UNIQA defines diversity in this context as different nationalities, cultures and a mix of women and men.
This diversity also reflects the make-up of our customer base in Austria and 18 European countries and helps us to understand them better so we can offer suitable products and services. People from more than 30 different countries are employed by UNIQA at the Vienna corporate head office alone.

CORPORATE GOVERNANCE REPORT 12
Over the course of 2014, the proportion of women on Management Boards and in senior ex-ecutive positions throughout the Group improved by one percentage point to 19 per cent. The equivalent figure at an international level remained at 25 per cent.
We are particularly pleased to welcome Kory Sorenson, the first woman to be appointed as a shareholder representative on the Supervisory Board of UNIQA Insurance Group AG. Her pres-ence makes the Supervisory Board more diverse. Kory Sorenson combines professional expertise with many years of experience and an international dimension. UNIQA has therefore taken a further step in the right direction but still needs to keep improving in this regard, and certainly intends to do so.
Enabling employees to achieve a work-life balance and providing them with straightforward access to services that make everyday life easier – especially for mothers – are key factors. In Aus-tria, UNIQA has created a comprehensive range of services known as “Freiraum” (Latitude) that addresses these needs. In conjunction with an external partner (KibisCare), this range of services includes a comprehensive childcare service on “bridging days” (between a public holiday and the weekend), an advisory and agency service for childcare, private tuition and for the support and care of family members, together with a broad range of health and sports activities.
UNIQA also supports flexible working hours and offers the option of teleworking. In 2014, 21 per cent of the administrative employees in Austria made use of part-time working while 8 per cent opted for teleworking.
In terms of professional development for managers, UNIQA believes that the most promising approach is to undertake joint development activities for both women and men. Cooperation be-tween men and women then becomes a matter of course and also works much better on a day-to-day basis. The “INSPIRE“ management development programme, which has been running since 2013, aims to put this joint development approach into practice: it brings together managers from all the markets in the UNIQA Group and a quarter of the participants are women. From a recruit-ment perspective however, UNIQA exercises positive discrimination, giving preference to female applicants where they have the same skills and qualifications.
REMUNERATION REPORTRemuneration of the Management Board and Supervisory Board
The members of the Management Board receive their remuneration exclusively from UNIQA In-surance Group AG, the Group holding company.
in € thousand 2014 2013The expenses attributable to the financial year in question for theremuneration of the members of the Management Board amounted to:
Fixed remuneration1) 2,468 2,458
Variable remuneration 876 2,465
Current remuneration 3,344 4,923
Termination benefit entitlements 0 0
Total 3,344 4,923
of which proportionately recharged to the operating subsidiaries: 2,173 4,176
Former members of the Management Board and their surviving dependants received: 2,706 2,699
1) The fixed salary components included remuneration in kind equivalent to €85,463 (2013: €73,088).

13 CORPORATE GOVERNANCE REPORT
The breakdown of the total Management Board remuneration among the individual members of the Management Board was as follows:
Name of Mgt. Board member Fixed Variable Total Termination benefit Total Totalin € thousand remuneration remuneration1) current remun. entitlements 2014 2013Andreas Brandstetter 608 218 826 0 826 1,164
Hannes Bogner 459 164 623 0 623 938
Wolfgang Kindl 459 166 624 0 624 900
Thomas Münkel 485 164 649 0 649 972
Kurt Svoboda 457 164 622 0 622 949
Total 2014 2,468 876 3,344 0 3,344 0Total 2013 2,458 2,465 4,923 0 0 4,9231) Including long-term incentive provision in the amount of €89,380.
In addition to the remuneration listed above, the following pension fund contributions were paid in the financial year for the existing pension commitments to the members of the Management Board. The compensation payments arise if a member of the Management Board steps down be-fore the age of 65 because pension entitlements are generally funded in full until the age of 65.
Pension fund contributions Regular Compensation Total forin € thousand contributions payments the yearAndreas Brandstetter 84 0 84
Hannes Bogner 128 0 128
Wolfgang Kindl 119 0 119
Thomas Münkel 245 0 245
Kurt Svoboda 105 0 105
Total 2014 681 0 681Total 2013 681 0 681
The remuneration paid to the members of the Supervisory Board for their work in the 2013 finan-cial year was €380,000. Provisions amounting to €443,750 were set aside for the remuneration to be paid for this work in 2014. A total of €32,700 was paid out in 2014 to cover attendance fees and out-of-pocket expenses (2013: €31,320).
in € thousand 2014 2013Current financial year (provision) 444 380
Attendance fees 33 31
Total 476 411

CORPORATE GOVERNANCE REPORT 14
The breakdown of the total remuneration (including attendance fees) paid to the individual share-holder representatives on the Supervisory Board was as follows:
Name of Supervisory Board member Remuneration Remunerationin € thousand 2014 2013Walter Rothensteiner 72 71
Christian Kuhn 61 51
Georg Winckler 24 58
Erwin Hameseder 62 57
Eduard Lechner 53 23
Günther Reibersdorfer 22 50
Ewald Wetscherek 20 44
Markus Andréewitch 20 0
Ernst Burger 35 16
Peter Gauper 35 16
Johannes Schuster 35 16
Kory Sorenson 27 0
Remuneration paid to employee representatives 12 9
Total 476 411
Former members of the Supervisory Board did not receive any remuneration.
The disclosures in accordance with Section 239 paragraph 1 of the Austrian Commercial Code in conjunction with Section 80b of the Austrian Insurance Supervisory Act, which must be included as mandatory disclosures in the notes to the financial statements for IFRS financial statements to release the Company from the requirement to prepare financial statements in accordance with the Austrian Commercial Code, are defined more broadly for the separate financial statements in accordance with the provisions of the Austrian Commercial Code. The separate financial state-ments include not only the remuneration for the decision-making functions (Management Board) of UNIQA Insurance Group AG, but also the remuneration paid to the Management Boards of the subsidiaries if such remuneration is based on a contract with UNIQA Insurance Group AG.
Principles of profit-sharing for the Management Board
A variable remuneration component is made available to the members of the Management Board in the form of bonus agreements and granted in the form of a one-off payment if the specified criteria for the entitlement to the bonus have been satisfied.
The system used to calculate the variable component of the remuneration for the Manage-ment Board was modified when the appointments to the Management Board were extended from the 2013 financial year. A short-term incentive (STI) is offered in which a one-off payment is made if the defined criteria for the payment of the incentive have been met, based on the Company’s earnings situation and agreed individual objectives for each financial year. A long-term incentive (LTI) is also made available in parallel with the STI. The LTI is a share-based payment arrange-ment with cash settlement and provides for one-off payments after a period of four years based on a virtual investment in UNIQA shares each year and the performance of UNIQA shares, ROE and total shareholder return over the period. This incentive is subject to agreed upper limits and an obligation on the members of the Management Board to make an annual investment in UNIQA shares with a holding period of four years in each case. The system complies with Rule 27 of the Austrian Code of Corporate Governance.

Principles and requirements for the Company pension scheme provided for the Management Board
UNIQA has agreed retirement pensions, invalidity pension benefits and surviving dependants‘ pensions for the members of the Management Board. The beneficiaries‘ actual pension entitle-ments are a contractual arrangement with Valida Pension AG, which is responsible for managing the pensions. The retirement pension generally becomes due for payment when the beneficiary meets the requirements for receiving a retirement pension as specified in the Austrian General So-cial Security Act. In event of an earlier retirement, the pension entitlement is reduced. In the case of the occupational invalidity pension and the pension for surviving dependants, basic amounts are provided as a minimum pension.
The pension plan at Valida Pension AG is funded by UNIQA through ongoing contributions for the individual members of the Management Board. Compensation payments must be made to Valida Pension AG if members of the Management Board step down before the age of 65 (imputed contribution payment duration to prevent overfunding).
Principles for vested rights and entitlements of the Management Board of the Company in the event of termination of their position
Severance payments have been agreed based on the provisions of the Austrian Salaried Employee Act. These severance payments, which are made if the employment contract of a member of the Management Board is terminated prematurely, comply with the criteria set out in Rule 27a of the Austrian Code of Corporate Governance The member of the Management Board generally retains his or her pension entitlements if his or her function is terminated, but the entitlements are subject to curtailment rules.
Supervisory Board remuneration
The remuneration paid to the Supervisory Board is approved at the Annual General Meeting as a total amount for the work in the previous financial year. The remuneration applicable to the individual Supervisory Board members is based on their position within the Supervisory Board and the number of committee positions held.
D&O insurance, POSI insurance
UNIQA has taken out directors’ & officers’ (D&O) insurance and, in connection with the imple-mentation of the re-IPO in 2013, public offering of securities insurance (POSI) for the members of the Management Board, Supervisory Board and senior executives. The costs are borne by UNIQA.
RISK REPORT, DIRECTORS’ DEALINGS
A comprehensive risk report (Rule 67 of the Austrian Code of Corporate Governance) is includ-ed in the notes to the consolidated financial statements. The notifications concerning directors‘ dealings in the year under review (Rule 73 of the Austrian Code of Corporate Governance) can be found in the Investor Relations section of the Group website at www.uniqagroup.com.
15 CORPORATE GOVERNANCE REPORT

CORPORATE GOVERNANCE REPORT 16
EXTERNAL EVALUATION
Implementation of, and compliance with, the individual rules in the Austrian Code of Corporate Governance for the 2014 financial year has been evaluated by PwC Wirtschaftsprüfung GmbH – with the exception of Rules 77 to 83. Compliance with Rules 77 to 83 was evaluated by Schön-herr Rechtsanwälte GmbH. The evaluation is carried out largely using the questionnaire for the evaluation of compliance with the Code published by the Austrian Working Group for Corporate Governance (as amended July 2012).
On completion of the evaluation, PwC Wirtschaftsprüfung GmbH and Schönherr Rechtsan-wälte GmbH were able to confirm that UNIQA – to the extent that these rules were covered by UNIQA’s declaration of conformity – had complied with the rules of the Austrian Code of Corpo-rate Governance in 2014. Some of the rules were not applicable to UNIQA in the evaluation period.
Vienna, 25 March 2015
Andreas BrandstetterChairman of the Management Board
Hannes BognerMember of the Management Board
Thomas MünkelMember of the Management Board
Kurt SvobodaMember of the Management Board
Wolfgang KindlMember of the Management Board

17 REPORT OF THE SUPERVISORY BOARD
Dear Shareholders,
For UNIQA, the year 2014 continued to be dominated by the UNIQA 2.0 long-term strategic pro-gramme planned to run until 2020. This annual report gives an account of the programme’s third full year. Despite tough capital market conditions, the Group was once again able to increase profit from ordinary activities.
As a consequence of the substantial uncertainty surrounding the medium-term economic trend in Europe, the political crisis in parts of Eastern Europe and the persistent low level of interest rates, UNIQA decided in the late autumn of 2014 to revise its planning for the 2015 financial year. Howev-er, the revised budgets are still based on a significant year-on-year increase in net profit.
UNIQA continues to adhere to the cornerstones of the UNIQA 2.0 strategic programme. It plans to increase the number of customers in the existing markets to 15 million by 2020 by focusing on its core expertise as a direct insurance company. The Company is aiming for further gradual improvement in its underwriting business in Austria and careful profitable growth in Central and Eastern Europe.
Activities of the Supervisory Board
During 2014, the Supervisory Board was regularly informed by the Management Board about the business performance and position of UNIQA Insurance Group AG and the Group as a whole. It also supervised the Management Board’s management of the business and fulfilled all the tasks assigned to the Supervisory Board by law and the Articles of Association. At the Supervisory Board meetings, the Management Board presented detailed quarterly reports and provided additional verbal and written reports. The Supervisory Board was given timely and comprehensive informa-tion about those measures requiring its approval.
The members of the Supervisory Board are regularly invited to participate in informative events on relevant topics. In 2014, there were two special seminars covering Solvency II and the new life insurance strategy.
Focus of the deliberations
The Supervisory Board met on six occasions in 2014. Discussions focused on the Group’s earnings situation and its further strategic development.
At the meeting held on 27 February, the Supervisory Board mainly discussed the Group’s pre-liminary results for 2013, the initial trends in 2014 and the future real estate strategy in the Group.
The Supervisory Board meeting on 9 April focused on the audit of the annual financial state-ments and consolidated financial statements for the year ended 31 December 2013 and on the re-ports from the Management Board with up-to-date information on the performance of the Group in the first quarter of 2014. The Supervisory Board also discussed the agenda for the 15th Annual General Meeting to be held on 26 May 2014.
The meeting of the Supervisory Board held on 22 May was dedicated to a discussion of the
Report of the Supervisory Board

REPORT OF THE SUPERVISORY BOARD 18
Group’s earnings situation in the first quarter of 2014.Following the retirement of members of the Supervisory Board and the election of new mem-
bers, a constituent meeting of the Supervisory Board was held on 26 May. Given the membership changes and some changes in functions, new elections were held at this meeting for the positions of Vice Chairmen and for the members of the other committees appointed by the Supervisory Board. No successor appointments were made for the functions of the fourth and fifth Vice Chair-men in the Chairman‘s Committee of the Supervisory Board.
At its meeting on 4 September, the Supervisory Board discussed the Group’s earnings situa-tion in the first half of the year, the latest developments in the third quarter and the forecast for the whole of 2014. It also addressed the modification of the rules of procedure for the Supervisory Board and the Management Board.
The meeting of the Supervisory Board on 26 November held detailed discussions on the fore-cast for 2014 and on the planning for the 2015 financial year as well as receiving reports on the results of the Group in the first three quarters of 2014 and the latest performance information for the fourth quarter of 2014. The Supervisory Board also evaluated is activities in accordance with the Austrian Code of Corporate Governance.
In December 2014, the Supervisory Board consented to the sale of a property (Haas-Haus in Vienna) by adopting a written resolution circulated among the members.
Committees of the Supervisory Board
To facilitate the work of the Supervisory Board and to improve its efficiency, committees have been set up in addition to the statutory Audit Committee.
The Working Committee did not hold any meetings in 2014, nor did it take any decisions by circulating a written resolution.
At its three meetings, the Committee for Board Affairs dealt with employment legalities con-cerning the members of the Management Board and with questions relating to remuneration policy and succession planning.
The Investment Committee held four meetings at which the members discussed the capital investment strategy, questions concerning capital structure and the focus of risk and asset liability management.
The Audit Committee held three meetings in 2014 and these meetings were also attended by the auditors of the (consolidated) financial statements. The meeting held on 9 April discussed all the documents relating to the financial statements and the appropriation of profit proposed by the Management Board. The annual activity report for 2013 in accordance with Section 13 paragraph 6 of the Austrian Regulation on Compliance for Issuers was also submitted to the meeting. At the meeting held on 22 May, the auditor presented the planning and strategy for the audits of the 2014 financial statements prepared by the companies in UNIQA Insurance Group AG’s corporate group and coordinated this planning and strategy with the committee. At the meeting held on 26 November, the auditor informed the committee about the findings from its preliminary audits to date. The meeting acknowledged a report by the auditor on its assessment of the extent to which the risk management system was fully functioning. In addition, the Audit Committee received quarterly reports from Internal Audit on the areas audited by this department and any material findings that arose from these audits.
Each committee chairman informed the members of the Supervisory Board about the meet-ings and the work of the respective committees.

19 REPORT OF THE SUPERVISORY BOARD
Separate and consolidated financial statements
The separate financial statements prepared by the Management Board, the management report for UNIQA Insurance Group AG, the consolidated financial statements prepared in accordance with International Financial Reporting Standards (IFRSs) – as adopted by the EU – and the Group management report for the year ended 31 December 2014 were audited by PwC Wirtschaftsprü-fung GmbH, which issued an unqualified audit opinion.
The Supervisory Board noted the findings of the audit with approval.The audit of the compliance of the Corporate Governance Report with Section 243b of the
Austrian Commercial Code and the evaluation of UNIQA’s compliance with the rules of the Aus-trian Code of Corporate Governance (with the exception of Rules 77 to 83) in the 2014 financial year was carried out by PwC Wirtschaftsprüfung GmbH. Schönherr Rechtsanwälte GmbH audited UNIQA’s compliance with Rules 77 to 83 of the Austrian Code of Corporate Governance. The audits found that UNIQA had complied with the rules of the Austrian Code of Corporate Govern-ance in the 2014 financial year to the extent that the rules were included in UNIQA’s declaration of conformity.
The Supervisory Board acknowledged the consolidated financial statements for 2014, ap-proved the 2014 annual financial statements of UNIQA Insurance Group AG and endorsed both the management report and the Group management report. The 2014 annual financial statements were thereby adopted in accordance with Section 96 paragraph 4 of the Austrian Stock Corpora-tion Act.
The Supervisory Board reviewed and approved the proposal for the appropriation of profit submitted by the Management Board. Accordingly, a dividend distribution of €0.42 per share will be proposed to the Annual General Meeting on 26 May 2015.
The Supervisory Board would like to take this opportunity to thank all employees of the UNIQA Group for the immense personal commitment and dedication they have shown over the past year.
Vienna, April 2015On behalf of the Supervisory Board
Walter RothensteinerChairman of the Supervisory Board

20 GROUP MANAGEMENT REPORT
Group management report
ECONOMIC ENVIRONMENT
Overall economic momentum in the insurance industry remained restrained in 2014. Although there was no new recession, the economic recovery in the euro zone remained hesitant and the change in gross domestic product (GDP) at 0.9 per cent in real terms was below the expectations of economic researchers. Private consumption is only recovering slowly and corporate invest-ments were too low in many euro zone countries to provide significant momentum for growth and employment. Monetary easing and historically low real interest rates have not yet resulted in the boost in demand which had been hoped for. The development of disposable income in many European countries also remains somewhat stagnant. These factors also contributed to the fact that economic growth of 0.3 per cent in Austria in 2014 fell somewhat below the average in the euro zone. Austrian households responded with a lower tendency towards saving, and at 7.4 per cent the savings rate fell in the 1st half of the year below the average over many years. Italy’s economy also remained below expectations in 2014 with a slight recession.
The high unemployment rates continue to point to low utilisation of available economic capacity. However, there has been some relief for the labour markets recently with unemploy-ment rates falling to 11.5 per cent at year-end in the euro zone. The unemployment rate in Aus-tria in 2014 was 5 per cent and 12.9 per cent in Italy according to calculations by Eurostat.
The yields on fixed interest securities from euro zone issuers again reached new lows in the past year. The effective interest return of German government bonds with a 10-year maturity fell to less than 0.4 per cent at the start of 2015. The compression of interest rates and risk premiums ran through virtually the entire range of investments. European corporate bonds and mortgage bonds were also affected by this. Deflationary price developments reached the euro zone towards the end of the year and the rate of inflation was minus 0.3 per cent in February 2015. The Europe-an Central Bank continued its process of monetary easing. The key interest rate is virtually zero and the ECB’s deposit rate is minus 0.2 per cent. The ECB also started its process of high-volume, unlimited bond purchases (“quantitative easing”). It can be expected that interest rates will generally remain very low for a longer period of time as a result of the slow recovery in the euro zone, low levels of inflation and this major monetary policy stimulus.
The general economic settings in Central and Eastern Europe are becoming increasingly heterogeneous. Central Europe (Poland, Slovakia, Czech Republic and Hungary) is one of the more stable regions. The upturn in domestic demand is providing real momentum, the labour markets are improving and low inflation and interest rates are bolstering the economy. Eco-nomic growth was around 3 per cent on average in real terms in Poland, Slovakia, the Czech Republic and Hungary.

21GROUP MANAGEMENT REPORT
The slowdown in the Russian economy intensified in 2014, with GDP only rising by 0.6 per cent in real terms. A rapid fall in the price of oil, the international economic sanctions and a more restrictive monetary policy by the Russian Central Bank compounded the downturn and could lead to a recession in Russia. The slump in the Ukrainian economy was largely caused by the unresolved conflict that is being carried out increasingly by military means in eastern Ukraine. The country remains dependent on international financial aid despite a standby ar-rangement agreed with the International Monetary Fund (IMF) and financial aid received from the European Union in the last year. The tense economic situation triggered a dramatic correc-tion in the currency markets. Both the Russian rouble and the Ukrainian hryvnia lost more than 50 per cent of their values against the euro over the course of 2014.
The process of economic transformation is unfolding at differing speeds in the countries of Southeastern Europe. Romania recovered economically with growth in GDP of 3 per cent in real terms. Bulgaria’s economy is slowly overcoming the stagnation of recent years. Croatia has so far been unable to make the most of its membership in the European Union. The country has to bear the consequences of several years of recession and will also barely emerge from stagnation in 2015. Events in 2014 in Serbia as well as Bosnia and Herzegovina were overshadowed by the flood disasters in May. The consequences of the bad weather are expected to be overcome grad-ually and investments in reconstruction could provide some economic stimulus. The south-western Balkan countries (Albania, Kosovo, Macedonia and Montenegro) recently recorded economic growth which was slightly above the average for the region.
Overall, the process of convergence in the countries in Central and Eastern Europe is pro-ceeding at a slower pace than that forecasted by the economic researchers, both after the 2008/09 financial crisis as well as after the 2011/12 euro crisis. The centre of conflict in eastern Ukraine and the tense geopolitical and economic situation in Ukraine and Russia are factors which are also expected to cast their shadow over the European economy in 2015. Positive ef-fects are expected in the euro zone economy as a result of lower oil prices on the global market, the devaluation of the euro in relation to the currencies of important trading partners and in part through the quantitative easing by the ECB.
Single premiums drive premium revenue in Austria The growth in premiums in the Austrian insurance market continued in 2014 following the positive turnaround in 2013. The insurance industry recorded an overall increase of 3.3 per cent in 2014, particularly as a result of strong growth in the area of single premiums. However, a decline in single premiums is expected for 2015, with associated lower levels of overall growth.
Ongoing premium revenue in life insurance is falling further (2014: minus 3.9 per cent). UNIQA therefore issued a new life insurance product in 2014 with benefits for customers and insurers that it expects to provide new stimulus for the insurance market.
The property and casualty sector showed positive premium growth of 2.8 per cent in 2014. The vehicle liability insurance line of business remained flat as a result of the decrease in ve-hicle registrations, while the comprehensive insurance business continued to experience strong growth. A sideways movement is expected in property and casualty insurance for 2015, although casualty insurance is expected to exceed the EUR 1 billion limit.

22 GROUP MANAGEMENT REPORT
In health insurance, the 2014 gains of 3.3 per cent were slightly weaker than those in the previous years, a trend which is expected to continue in 2015. Health insurance is experiencing stronger permanent growth than the property and casualty sector with steady growth rates of around three per cent.
Insurance penetration – i.e. the proportion of premium revenue in gross domestic product – will see moderate growth once again following the declines in 2015, although this will still re-main below the European average.
CEE remains the growth region with potential The markets in the CEE region generally also experienced growth in 2014 which was mostly above the levels in Western Europe. The countries of Central Europe in particular – Poland, Slovakia, the Czech Republic and Hungary – recorded good GDP growth rates, which were also driven by strong domestic demand. UNIQA expects the convergence progress for the countries in Central and Eastern Europe to continue, albeit at a slower pace than previously predicted. A comparable trend is also expected for the insurance market in CEE.
Development in the insurance market for the region was only positive to a limited extent in 2014. The life insurance sector in particular recorded an overall decline in premium volumes, driven once again by heavy declines in business with short-term single premium products in Poland. However, the intense price competition, particularly in the vehicle and property insur-ance business in a series of markets in Central and Eastern Europe, also resulted in lower pre-mium revenues in the non-life sector. In Ukraine, the political and economic events had a nega-tive impact on the insurance market. In contrast, the Russian market remained virtually un-affected with growth in premium volumes both in the life as well as in the non-life sector.
The aggregate figures on market development were also impacted in 2014 by negative ex-change rate trends in some of the major markets in Eastern Europe, such as in Russia, the Czech Republic, Ukraine and in Hungary.
The improvements in the economic situation should have a greater impact on consumer spending and investment activity by companies in 2015. The insurance markets in Central and Eastern Europe should therefore benefit from good growth figures and improved export oppor-tunities. However, the additional effects of the current political crisis between Ukraine and Russia on the insurance industries of both these countries are extremely difficult to assess at the present time.
Despite the patchy development, the CEE region remains a growth region with high poten-tial. The need to catch up for insurance products can also be seen, among other things, from the indicators which are still seriously lagging behind, such as those for insurance density and in-surance penetration in the region: while the annual insurance premium in Southeastern Europe is only around €100 per capita for instance, it is more than €2,000 per person in Western Europe. Many people in CEE remain underinsured or have no insurance at all. Yet the higher economic growth in CEE as compared with Western Europe with the resulting increased pros-perity in the population offers very good growth opportunities for the insurance industry that significantly surpass those in the already saturated insurance markets of Western Europe.

23GROUP MANAGEMENT REPORT
UNIQA GROUP
With a premium volume written (including the savings portion from the unit-linked and index-linked life insurance) of €6,064.4 million, the UNIQA Group is among the leading insurance groups in Central and Eastern Europe. The savings portion from the unit-linked and index-linked life insurance in the amount of €544.7 million was set off against the change in actuarial reserves, pursuant to FAS 97 (US-GAAP). Without taking the savings portion from the unit-linked and index-linked life insurance into consideration, the premium volume written amounted to €5,519.7 million.
UNIQA in Europe UNIQA offers its products and services via all distribution channels (hired sales force, general agencies, brokers, banks and direct sales) and covers the entire range of insurance lines.
The listed holding company, UNIQA Insurance Group AG, manages the Group and also op-erates the indirect insurance business. In addition, it carries out numerous service functions for the Austrian and international insurance companies, in order to take best advantage of synergy effects and to consistently implement the Group’s long-term corporate strategy.
UNIQA International AG manages the international activities of the Group. This entity is also responsible for the ongoing monitoring and analysis of the international target markets and for acquisitions and post-merger integration.
New responsibilities on the Management Board of UNIQA Insurance Group AG On 1 January 2015, Kurt Svoboda took over the role of Chief Financial Officer (CFO) in addition to his responsibilities as Chief Risk Officer (CRO). Hannes Bogner, who was the CFO up until that point, became the Chief Investment Officer (CIO) and his main responsibility is to focus on the area of Investments as well as Legal & Compliance.
Rating In October 2014, the rating agency Standard & Poor’s confirmed the rating of UNIQA Insurance Group AG as “A-”. The ratings of UNIQA Österreich Versicherungen AG and the Group’s rein-surer, UNIQA Re AG in Switzerland, also remained “A”. UNIQA Versicherung AG in Liechten-stein was rated for the first time and received an “A-”. The rating of the UNIQA supplementary capital bond continues to be “BBB”. The outlook for all the companies is considered by Standard & Poor’s to be “stable”.
Standard & Poor’s substantiates this confirmation of their ratings with the continued strong competitive position and the very strong capital base. The rating agency recognises an im-provement in liquid funds: in this area the rating was raised from “strong” to “exceptional”.

24 GROUP MANAGEMENT REPORT
Companies included in the IFRS consolidated financial statements In addition to UNIQA Insurance Group AG, UNIQA’s 2014 consolidated financial statements include 53 Austrian and 70 international companies. A total of 27 affiliated companies whose influence on a true and fair presentation of the financial position, financial performance and cash flows was immaterial were not included in the consolidated financial statements. In add-ition, nine Austrian companies were recognised as associates using equity method accounting. Seven associates were of minor importance, and shares held in these companies are recognised at fair value.
Details on the consolidated companies and associates are contained in the corresponding overview in the notes to the consolidated financial statements. The accounting policies are also described in the notes to the consolidated financial statements.
Risk report UNIQA’s comprehensive risk report is included in the notes to the consolidated financial state-ments 2014.
Corporate Governance Report Since 2004, UNIQA has pledged to comply with the Austrian Code of Corporate Governance and publishes the Corporate Governance Report at www.uniqagroup.com in the Investor Rela-tions section.
BUSINESS PERFORMANCE IN THE GROUP
UNIQA provides life and health insurance, and is active in almost all lines of property and cas-ualty insurance. It serves about 10.0 million customers, over 19.2 million insurance contracts with a premium volume written (including the savings portion from the unit-linked and index-linked life insurance) of about €6.1 billion (2013: €5.9 billion) and investments of €29.2 billion (2013: €27.4 billion). UNIQA is the second-largest insurer in Austria, has a strong network in Central and Eastern Europe with a presence in 15 countries and is additionally active in Italy, Liechtenstein and Switzerland.
Premium development UNIQA’s total premium volume increased in 2014, taking into account the savings portions of the unit-linked and index-linked life insurance in the amount of €544.7 million (2013: €727.9 million), by 3.0 per cent to €6,064.4 million (2013: €5,885.5 million). The total consoli-dated premium volume written rose by 7.0 per cent to €5,519.7 million (2013: €5,157.6 million). The continuing noticeable decline in premiums in the unit-linked life insurance was a dampen-ing factor. The main causes of this are subsequent effects of maturing life insurance policies in conjunction with the decision that was already made back in 2011 to withdraw completely from the German market and not to underwrite any more new business.
In the area of insurance policies with recurring premium payments, there was a deterior-ation of 1.9 per cent to €5,102.7 million (2013: 5,202.8 million). In the single premium business, on the other hand, the premium volume increased by 40.8 per cent to €961.6 million (2013: €682.8 million) due to very strong growth in Austria and Italy.

25GROUP MANAGEMENT REPORT
The Group premiums earned, including the savings portion from the unit-linked and index-linked life insurance (after reinsurance) in the amount of €526.1 million (2013: €702.3 million), rose by 3.6 per cent to €5,839.0 million (2013: €5,640.9 million). The retained premiums earned (according to IFRSs) rose by 7.6 per cent to €5,312.9 million (2013: €4,938.6 million).
In the 2014 financial year, 43.2 per cent (2013: 44.0 per cent) of the premium volume written (including the savings portion from the unit-linked and index-linked life insurance) can be attributed to property and casualty insurance, 15.8 per cent (2013: 15.9 per cent) to health insur-ance and 40.9 per cent (2013: 40.1 per cent) to life insurance.
Development of insurance benefits The insurance benefits before reinsurance (see Note 36 in the consolidated financial statements) rose in the 2014 financial year by 10.8 per cent to €4,517.7 million (2013: 4,078.1 million). Con-solidated insurance benefits retained also rose in the past year by 10.7 per cent to €4,383.7 million (2013: €3,959.4 million), above all due to the sharp rise in the single premium business.
Operating expenses Total consolidated operating expenses (see Note 37 in the consolidated financial statements) less reinsurance commissions received and the share of profit from reinsurance ceded (see Note 33 in the consolidated financial statements) decreased clearly in the 2014 financial year by 5.8 per cent to €1,275.3 million (2013: €1,354.2 million). Expenses for the acquisition of insurance less reinsurance commissions received and the share of profit from reinsurance ced-ed in the amount of €26.0 million (2013: €28.3) fell by 0.2 per cent to €912.5 million (2013: €914.2 million). Other operating expenses decreased due to the systematic implementation of cost savings measures as part of the UNIQA 2.0 strategy programme by 17.5 per cent to €362.8 million (2013: €439.9 million). The figures from the past year include extraordinary expenses related to strategic projects in the amount of €25 million.
UNIQA’s cost ratio after reinsurance, i.e. the relation of total operating expenses less re-insurance commissions received and the share of profit from reinsurance ceded to the Group premiums earned, including the savings portion from the unit-linked and index-linked life insurance, dropped to 21.8 per cent during the past year (2013: 24.0 per cent) as a result of the developments mentioned above. The cost ratio before reinsurance was 21.4 per cent (2013: 23.5 per cent).
Investment results Total investments including land and buildings used by the Group, investment property, shares in associates and investments of the unit-linked and index-linked life insurance and current cash held at banks and cash-in-hand rose in the 2014 financial year by €1,829.0 million to €29,212.7 million (31 December 2013: €27,383.6 million).
Net investment income rose despite the burden of the impairment of bonds of Hypo Alpe-Adria-Bank International AG in an amount of €35.4 million by 10.8 per cent to €864.4 million (2013: 780.0 million). Other drivers of this development were gains on the sale of property and fixed interest securities due to modifications of the strategic asset allocation for the economic optimisation of capital. A detailed description of the investment income can be found in the consolidated financial statements (Note 34).

26 GROUP MANAGEMENT REPORT
Other income and Other expenses Other income rose in 2014 mainly due to differences in the exchange rate of the US dollar by 53.8 per cent to €62.4 million (2013: €40.6 million). However, other expenses also rose in the reporting period due to exchange rate differences of the Russian rouble and Ukrainian hryvnia and amounted to €70.3 million (2013: €32.4 million).
Profit/(loss) from ordinary activities The technical result of the UNIQA Group rose in 2014 clearly to €151.5 million (2013: €48.8 million). Operating profit increased to €447.6 million (2013: €347.2 million). Profit/(loss) from ordinary activities of UNIQA was very satisfactory, above all due to the welcome trend in the operative segments UNIQA Austria and Raiffeisen Versicherung AG, and rose by 22.9 per cent to €377.9 million (2013: €307.6 million). Net profit for the reporting period only rose by 1.7 per cent to €292.9 million (2013: €287.9 million), because the net profit for the previous year included a result from discontinued operations in the amount of €50.0 million that arose as a result of the reversal of an other provision related to the sale of the Mannheimer Group. The consolidated profit/(loss) amounted to €289.9 million (2013: €284.7 million). Earnings per share fell, however, due to the rise in the average number of shares in circulation to €0.94 (2013: €1.21). The return on equity after tax and non-controlling interests in the reporting period was 9.9 per cent (2013: 11.9 per cent).
The Management Board will therefore propose a dividend of €0.42 per share to the Supervi-sory Board and the Annual General Meeting.
Own funds and total assets The Group’s total equity increased in the past financial year due to the rise in the revaluation reserve – driven by higher fair values in particular of fixed interest securities – by 11.4 per cent or €317.3 million to €3,102.4 million (31 December 2013: €2,785.1 million). This included non-controlling interests in the amount of €20.2 million (31 December 2013: €22.0 million). The solvency ratio (Solvency I) increased accordingly to 295.4 per cent (31 December 2013: 286.7 per cent). The total assets of the Group rose in the reporting period by 6.6 per cent and amounted to €33,038.2 million on 31 December 2014 (31 December 2013: €31,001.7 million).

27GROUP MANAGEMENT REPORT
Cash flow UNIQA’s cash flows from operating activities amounted to €182.4 million in 2014 (2013: €628.0 million). The cash flow from investing activities amounted to €283.4 million (2013: minus €1,781.3 million). The financing cash flow dropped to minus €109.7 million (2013: €813.0 million).
In total, liquid funds changed by €356.0 million (2013: minus €340.3 million). Financial re-sources available at the end of 2014 amounted to €975.8 million (2013: €617.0 million).
Employees In 2014, the average number of employees at UNIQA rose slightly as a result of the acquisition of the insurance companies in the Baloise Group in Croatia and Serbia to 14,336 (2013: 14,277). Of these, 5,821 (2013: 5,893) were employed in sales positions. The number of employees in admin-istration amounted to 8,515 (2013: 8,384).
In the Central European region (CE) – Poland, Slovakia, Czech Republic and Hungary – the Group had 2,806 employees in the 2014 financial year (2013: 2,899), 2,412 people (2013: 2,028) were employed in the Southeastern Europe region (SEE) – Albania, Bosnia and Herzegovina, Bulgaria, Kosovo, Croatia, Macedonia, Montenegro and Serbia – and 2,328 people (2013: 2,489) in the Eastern European region (EE) – Romania and Ukraine. There were 103 employees (2013: 94) in Russia. The average number of employees in the Western European markets rose slightly to 360 (2013: 348). A total of 6,327 people were employed in Austria (2013: 6,419). Including the employees of the general agencies working exclusively for UNIQA, the total number of people working for the Group amounts to about 22,000.
In 2014, 51 per cent of the staff working in administrative positions at UNIQA Insurance Group AG in Austria were women. In sales, the ratio was 80 per cent men to 20 per cent women. Twenty-one per cent (2013: 19 per cent) of the employees in administration were working part time. The average age in the past year was 43 years (2013: 42 years). In 2014, a total of 15.3 per cent (2013: 14.4 per cent) of the employees participated in UNIQA's bonus system – a variable remuneration system that is tied both to the success of the Company and to personal perfor-mance. In addition, UNIQA offers young people in training the opportunity to get to know for-eign cultures and make international contacts. Currently, 28 apprentices are being trained. Ten new apprentices were accepted in 2014.

28 GROUP MANAGEMENT REPORT
OPERATIONAL SEGMENTS
UNIQA Austria
Premiums At UNIQA Austria, the premiums written, including the savings portion from the unit-linked and index-linked life insurance, decreased slightly in 2014 by 1.2 per cent to €2,773.5 million (2013: €2,806.7 million). This was due to the continued clear decrease in premiums in unit-linked life insurance. The main causes of this development are subsequent effects of maturing life insurance policies in conjunction with the decision that was already made back in 2011 to withdraw completely from the German market and not to underwrite any more new business. Recurring premiums decreased by 1.2 per cent to €2,741.7 million (2013: €2,774.6 million). Single premiums remained more or less at the level of the previous year of €31.9 million (2013: €32.1 million).
Including the savings portion from the unit-linked and index-linked life insurance, the vol-ume of premiums earned at UNIQA Austria amounted to €2,137.0 million (2013: €2,196.2 million). Retained premiums earned (according to IFRS) declined slightly in 2014 by 0.3 per cent to €1,993.9 million (2013: €1,999.2 million).
Whereas premiums written in property and casualty insurance rose by 2.7 per cent to €1,362.6 million (2013: €1,326.2 million), they increased in health insurance by 2.4 per cent to €887.3 million (2013: €866.2 million). In contrast, in life insurance (including the savings por-tion from the unit-linked and index-linked life insurance), they decreased by 14.7 per cent to €523.7 million (2013: €614.2 million).
Retained premiums earned (according to IFRS) rose in property and casualty insurance by 0.7 per cent to €753.0 million (2013: €747.6 million); in health insurance, they increased by 2.5 per cent to €886.9 million (2013: €865.2 million). They fell 8.4 per cent in life insurance to €353.9 million (2013: €386.4 million). Including the savings portion from the unit-linked and index-linked life insurance, the volume of premiums earned in life insurance amounted to €497.0 million (2013: €583.5 million).
Benefits Retained insurance benefits at UNIQA Austria fell by 2.6 per cent in 2014 to €1,637.2 million (2013: €1,680.5 million). However, driven by settlement losses in marine hull insurance, they rose in property and casualty insurance by 4.7 per cent to €516.5 million (2013: €493.5 million) and in health insurance they increased by 1.1 per cent to €744.3 million (2013: €736.2 million). In contrast, they fell 16.5 per cent in life insurance, in line with the premiums earned, to €376.4 million (2013: €450.7 million). Consequently, in 2014 the loss ratio in property and casu-alty insurance amounted to 68.6 per cent (2013: 66.0 per cent).

29GROUP MANAGEMENT REPORT
Operating expenses Operating expenses, less reinsurance commissions received and the share of profit from re-insurance ceded, amounting to €175.8 million (2013: €179.4 million) decreased in the 2014 financial year by 5.8 per cent to €394.0 million (2013: €418.1 million). In the previous year, this figure contained extraordinary expenses related to strategic projects. They fell 9.3 per cent in property and casualty insurance to €173.1 million (2013: €190.9 million). In health insurance, they increased by 6.0 per cent to €130.0 million (2013: €122.6 million). The main driver of this development is the change in the cost allocation due to the new business model in Austria. On the other hand, in life insurance they fell 13.1 per cent to €90.9 million (2013: €104.6 million).
The cost ratio of UNIQA Austria after reinsurance, i.e. the relation of total operating ex-penses, less reinsurance commissions received and the share of profit from reinsurance ceded, to the premiums earned, including the savings portion from the unit-linked and index-linked life insurance, amounted to 18.4 per cent during the past year (2013: 19.0 per cent).
Investment results Net investment income in the UNIQA Austria segment dropped by 4.2 per cent to €363.0 mil-lion (2013: 379.1 million).
Profit/( loss) from ordinary activities Profit/(loss) from ordinary activities of UNIQA Austria rose in the reporting period, driven by the solid profit development in property and casualty insurance as well as health insurance, by 18.6 per cent to €273.9 million (2013: €231.0 million). It rose in property and casualty insurance by 21.8 per cent to €100.7 million (2013: €82.7 million); in health insurance, profit increased by 37.6 per cent to €130.2 million (2013: €94.6 million). In contrast, profit/(loss) from ordinary activities fell by 19.9 per cent in life insurance to €43.0 million (2013: €53.7 million). The main reason for this development was net investment income, which was 25.1 per cent lower at €180.8 million (2013: €241.5 million).

30 GROUP MANAGEMENT REPORT
Raiffeisen Versicherung AG
Premiums The Raiffeisen Insurance segment increased the premiums written, including the savings por-tion from the unit-linked and index-linked life insurance in 2014, by 3.1 per cent to €905.3 million (2013: €878.5 million), despite the noticeable decline recorded in premiums in unit-linked life insurance. The main causes of this development are subsequent effects of ma-turing life insurance policies in conjunction with the decision that was already made back in 2011 to withdraw completely from the German market and not to underwrite any more new business. The strong trend in the Austrian core business with Raiffeisen as a partner bank was able to overcompensate for that deterioration. Although recurring premiums dropped by 8.6 per cent to €754.0 million (2013: €825.3 million), single premiums rose 184.7 per cent to €151.3 million (2013: €53.1 million).
Including the savings portion from the unit-linked and index-linked life insurance, the vol-ume of premiums earned at Raiffeisen Versicherung AG amounted to €794.0 million (2013: €767.7 million). The volume of premiums earned (net, according to IFRS) rose in 2014 by 14.1 per cent to €650.8 million (2013: €570.6 million).
While premiums written rose in property and casualty insurance by 5.1 per cent to €153.2 million (2013: €145.7 million); in life insurance they increased by 2.6 per cent to €752.1 million (2013: €732.8 million). Health insurance is not offered in the Raiffeisen Insur-ance segment.
Retained premiums earned (according to IFRS) rose in property and casualty insurance by 3.9 per cent to €79.8 million (2013: €76.8 million); in life insurance, they increased by 15.6 per cent to €571.1 million (2013: €493.9 million). Including the savings portion from the unit-linked and index-linked life insurance, the volume of premiums earned in life insurance amounted to €714.2 million (2013: €690.9 million).
Benefits Retained insurance benefits in the Raiffeisen Insurance segment increased in 2014 by 8.8 per cent to €685.2 million (2013: €630.0 million). They rose 8.1 per cent in property and casualty insurance to €57.1 million (2013: €52.9 million). In life insurance, this increase was noticeably less than the premiums earned: they rose 8.8 per cent to €628.1 million (2013: €577.1 million). The previous year’s figure was impacted as a result, among other things, of an increase in the free provision for premium refunds. This expense did not repeat itself to the same extent in the 2014 financial year. Overall, in 2014 the loss ratio in property and casualty insurance amounted to 71.6 per cent (2013: 68.8 per cent).
Operating expenses Operating expenses, not including reinsurance commissions received and the share of profit from reinsurance ceded, which amounted to €30.5 million (2013: €26.2 million), decreased in 2014 by 9.2 per cent to €101.5 million (2013: €111.7 million). They fell in property and casualty insurance by 27.9 per cent to €12.0 million (2013: €16.6 million); in life insurance, they in-creased by 6.0 per cent to €89.5 million (2013: €95.2 million).
The cost ratio in the Raiffeisen Insurance segment after reinsurance, i.e. the relation of total operating expenses, less reinsurance commissions received and the share of profit from re-

31GROUP MANAGEMENT REPORT
insurance ceded, to the premiums earned, including the savings portion from the unit-linked and index-linked life insurance, fell to 12.8 per cent in 2014 (2013: 14.6 per cent).
Net investment income Net investment income in the Raiffeisen Insurance segment rose in 2014 by 6.1 per cent to €267.0 million (2013: 251.6 million). Among other things, the gains from the disposal of prop-erty had a positive effect on net investment income in the 2014 financial year.
Profit/( loss) from ordinary activities Profit/(loss) from ordinary activities in the Raiffeisen Insurance segment climbed by 68.2 per cent to €108.6 million (2013: €64.6 million). It rose in property and casualty insurance by 55.4 per cent to €14.1 million (2013: €9.1 million); in life insurance, profit increased by 70.3 per cent over the previous year’s level to €94.6 million (2013: €55.5 million). The main drivers of this positive trend in profit or loss were the drop in expenses connected with the policyholders’ dividend reserve, the reduced costs and the increase in net investment income.
UNIQA International
Premiums UNIQA International increased the premiums written, including the savings portion from the unit-linked and index-linked life insurance, in 2014 by 8.8 per cent to €2,353.1 million (2013: €2,162.4 million). Recurring premiums fell here by 0.6 per cent to €1,574.6 million (2013: €1,564.9 million). Single premiums rose despite the decline in Poland and Hungary due to the very strong business in Italy, where they grew 30.3 per cent to reach €778.5 million (2013: €597.5 million). That means that in 2014 the international companies contributed a total of 38.8 per cent (2013: 36.7 per cent) to total Group premiums.
Including the savings portion from the unit-linked and index-linked life insurance, UNIQA International’s volume of premiums earned amounted to €1,822.2 million (2013: 1,634.1 million). The volume of retained premiums earned (according to IFRS) rose in 2014 by 19.3 per cent to €1,582.3 million (2013: 1,325.9 million).
While premiums written in property and casualty insurance decreased slightly due to nega-tive currency effects and the restraint in the highly competitive motor vehicle segment in CEE by 0.8 per cent to €1,084.9 million (2013: €1,093.7 million), they rose in health insurance by 3.0 per cent to €73.5 million (2013: 71.4 million). In life insurance (including the savings portion from the unit-linked and index-linked life insurance) they rose, driven by the positive course of business in Italy, by 19.8 per cent to €1,194.6 million (2013: €997.3 million).
Retained premiums earned (according to IFRS) fell in property and casualty insurance by 1.8 per cent to €588.2 million (2013: €599.2 million), in health insurance they rose by 2.7 per cent to €71.7 million (2013: €69.8 million) and in life insurance by 40.4 per cent to €922.5 million (2013: €656.8 million). Including the savings portion from the unit-linked and index-linked life insurance, the volume of premiums earned in life insurance amounted to €1,162.4 million (2013: €965.1 million).

32 GROUP MANAGEMENT REPORT
In the Central Europe region (CE) – Poland, Slovakia, the Czech Republic and Hungary – premiums earned, including the savings portion from the unit-linked and index-linked life insurance, decreased in the 2014 financial year by 13.5 per cent to €524.7 million (2013: €606.8 million). The reduction of the very short-term-oriented single premium business in Poland, the marked withdrawal from single premium business in Hungary and the weaker ex-change rate of the Czech koruna were the main factors responsible for this decrease. In Eastern Europe (EE) – comprising Romania and Ukraine – premiums earned, including the savings portion from the unit-linked and index-linked life insurance, fell above all due to the significant loss in value of the Ukrainian hryvnia and the restraint in the highly competitive Romanian motor vehicles business by 23.0 per cent to €117.4 million (2013: €152.5 million). In the South-eastern Europe region (SEE) – Albania, Bosnia and Herzegovina, Bulgaria, Kosovo, Croatia, Macedonia, Montenegro and Serbia – in 2014 premium growth was generated in the amount of 29.6 per cent, to €205.7 million (2013: €158.7 million). One driver of this was the acquisition of the insurance companies in the Baloise Group in Croatia and Serbia. In Russia (RU), the pre-miums earned, including the savings portion from the unit-linked and index-linked life insur-ance, rose despite the decrease in value of the Russian rouble by 1.9 per cent to €65.6 million (2013: €64.3 million). In Western Europe (WE) – Italy, Liechtenstein and Switzerland – the premiums earned, including the savings portion from the unit-linked and index-linked life insurance, rose in particular due to the increase in single premiums in Italy by 39.2 per cent to €908.9 million (2013: €652.9 million).
Benefits Retained insurance benefits of UNIQA International increased in 2014 by 30.6 per cent to €1,253.6 million (2013: €960.1 million). In property and casualty insurance they rose by 1.8 per cent to €372.7 million (2013: €366.1 million); in health insurance, profit increased by 7.5 per cent to €45.7 million (2013: €42.5 million). They increased 51.4 per cent in life insurance to €835.2 million (2013: €551.5 million) due to the strong rise in premium revenue. In 2014 the loss ratio in property and casualty insurance rose 63.4 per cent (2013: 61.1 per cent).
In the CE region, benefits rose by 3.1 per cent in 2014 to €245.8 million (2013: €238.5 million); however, in the EE region they fell by 25.1 per cent to €69.6 million (2013: €92.9 million). In SEE, due to the acquisition of the insurance companies in the Baloise Group in Croatia and Serbia, they rose 33.8 per cent to €128.9 million (2013: €96.3 million). In Russia, benefits amounted to €44.2 million (2013: €40.4 million); and in Western Europe, the volume of benefits rose due to the strong growth in premiums in life insurance by 55.5 per cent to €765.2 million (2013: €492.0 million).

33GROUP MANAGEMENT REPORT
Operating expenses Operating expenses, not including reinsurance commissions received and the share of profit from reinsurance ceded, which amounted to €147.9 million (2013: €147.3 million), decreased in the 2014 financial year by 4.4 per cent to €434.8 million (2013: €454.7 million). They fell by 8.5 per cent in property and casualty insurance to €228.9 million (2013: €250.2 million). In health insurance, benefits rose on the other hand by 7.0 per cent to €30.7 million (2013: €28.7 million). They decreased by 0.3 per cent in life insurance to €175.3 million (2013: €175.8 million).
The cost ratio of UNIQA International after reinsurance, i.e. the relation of total operating expenses, less reinsurance commissions received and the share of profit from reinsurance ceded, to premiums earned, including the savings portion from the unit-linked and index-linked life insurance, decreased during the past year for the reasons mentioned above to 23.9 per cent (2013: 27.8 per cent).
In CE, operating expenses, not including reinsurance commissions received and the share of profit from reinsurance ceded, decreased in the reporting year by 10.9 per cent to €159.7 million (2013: €179.1 million) and in EE by 16.7 per cent to €64.9 million (2013: €77.9 million). In SEE, due to the acquisition of the insurance companies in the Baloise Group in Croatia and Serbia, they increased by 18.2 per cent to €89.7 million (2013: €75.9 million). In Russia, costs amounted to €16.8 million (2013: €24.4 million), while expenses increased in Western Europe by 11.0 per cent to €78.3 million (2013: €70.5 million). In administration (UNIQA International AG), costs decreased by 5.1 per cent to €25.4 million (2013: €26.8 million).
Net investment income Net investment income rose during 2014 by 21.8 per cent to €174.3 million (2013: 143.1 million).
Profit/( loss) from ordinary activities In the reporting period, profit/(loss) from ordinary activities in the UNIQA International seg-ment amounted to minus €1.2 million (2013: €21.5 million). The main reason for this was the impairment of goodwill in Romania in the amount of €25 million. Profit (net of tax) in property and casualty insurance declined due to the impairment of goodwill mentioned above to minus €21.4 million (2013: €1.0 million). In health insurance, it came to minus €1.3 million (2013: €1.6 million). On the other hand, in life insurance the profit/(loss) from ordinary activities improved by 13.7 per cent to €21.5 million (2013: €18.9 million).

34 GROUP MANAGEMENT REPORT
Reinsurance In the reinsurance segment, the premium volume written fell in 2014 by 27.2 per cent to €1,189.3 million (2013: €1,633.1 million). On the other hand, the volume of retained premiums earned (according to IFRS) rose slightly by 0.7 per cent to €1,080.9 million (2013: €1,073.6 million).
Retained insurance benefits increased in 2014 by 2.3 per cent to €800.8 million (2013: €782.5 million). This includes the burden of losses (retained) due to flood damage in Austria, Bosnia and Herzegovina and Serbia as well as an increased burden due to major claims amount-ing to about €96 million.
Operating expenses, not including reinsurance commissions received and the share of profit from reinsurance ceded, which amounted to €8.2 million (2013: €3.9 million), increased mar-ginally by 0.5 per cent to €335.1 million (2013: €333.6 million).
Net investment income rose in 2014 to €31.3 million (2013: €21.8 million). Due to the rise in the volume of benefits, profit/(loss) from ordinary activities in the re-
insurance segment decreased to minus €30.5 million (2013: minus €18.0 million).
Group Functions and Consolidation In the Group Functions and Consolidation segment, profit/(loss) from ordinary activities in-creased due to the rise in investment income to €27.0 million (2013: €8.4 million).
Net investment income rose in 2014 among other things due to gains from the sale of prop-erty to €28.7 million (2013: minus €15.6 million).
EVENTS AFTER THE BALANCE SHEET DATE (SUPPLEMENTARY REPORT)
As a consequence of the decision made on 1 March 2015 by the Austrian Financial Market Authority (FMA) to impose a moratorium on debt and interest payments by Heta Asset Resolution AG, UNIQA anticipates that it will need to recognise an impairment loss in the first quarter of 2015 for senior bonds issued by former Hypo Alpe-Adria-Bank Internatinal AG. The amount of the impairment loss will be determined on the basis of the edict from the FMA and the change in the legal situation. However, the amounts will not be material.

35GROUP MANAGEMENT REPORT
OUTLOOK
Economic outlook UNIQA expects a moderate upturn in the euro zone in 2015, with positive momentum in terms of general demand as a result of the lower price of oil, a lower euro exchange rate and the quanti-tative easing by the ECB. The expectations for growth in CEE are now more heterogeneous. In Central Europe (CE), the economic structural conditions remain positive overall, with expect-ations in terms of economic growth above average when compared with the whole of Europe. The outlook for Russia has changed significantly: Russia’s economy is expected to fall into a deep recession as a result of the fall in the price of oil, the western sanctions and a more restric-tive monetary policy. Ukraine remains in recession and requires stabilising political measures and international financial aid. Structural problems prevent some countries in Southeastern Europe (SEE) from fully exploiting their growth potential. Romania is continuing its recovery as is Bulgaria, although at a more moderate pace. Politicians in Croatia and Serbia are faced with structural reforms and budget consolidation, which are expected to keep GDP growth at virtual-ly zero.
The ECB announced an expanded bond acquisition programme in January 2015 (quantita-tive easing). As part of the expanded programme, the ECB will make monthly purchases of securities beginning in March from public and private issuers amounting to €60 billion. The programme is to run at least until September 2016 or even longer if the ECB sees no sustainable development in inflation, which is consistent with its mandate of achieving price stability.
The capital market has already to some extent anticipated the ECB programme: benchmark interest rates have reached new historic lows in the euro zone over the past year. Yields on German government bonds with 10 year maturities fell below 0.4 per cent in December 2014. UNIQA expects a long period of low interest rates as a result of the slow economic recovery, low inflation and major stimulus through monetary policy.
Consolidated profit or loss UNIQA expects moderate economic growth for 2015. The very low level of interest rates is also placing a strain on the insurance industry as a whole, with no reversal in this trend expected in the near future. UNIQA believes that there are exceptionally high levels of uncertainty in rela-tion to medium-term economic developments in Europe in combination with the geopolitical tensions.
Nevertheless, UNIQA still expects growth in profit from ordinary activities in the double-digit percentage range of 425 to 450 million euros for 2015 as compared with 2014, steady pre-mium performance and further improvement in the combined ratio. UNIQA is continuing to focus its attention on increasing profitability in its core insurance market and to concentrate more heavily on cost and capital management.

36 GROUP MANAGEMENT REPORT
DISCLOSURES REQUIRED UNDER SECTION 243A PARAGRAPH 1 OF THE AUSTRIAN COMMERCIAL CODE
1. The share capital of UNIQA Insurance Group AG amounts to €309,000,000 and is com-prised of 309,000,000 individual no-par value bearer shares. €285,356,365 of the share capital was fully paid in cash and €23,643,635 was paid in non-cash contributions. All shares confer the same rights and obligations.
2. Due to their voting commitments, the shares of UNIQA Versicherungsverein Privatstiftung, Austria Versicherungsverein Beteiligungs-Verwaltungs GmbH, BL Syndikat Beteiligungs Gesellschaft m.b.H., Collegialität Versicherungsverein Privatstiftung and RZB Versiche-rungsbeteiligung GmbH are counted together. Reciprocal preemptive rights have been agreed upon between the first four shareholders listed.
3. Raiffeisen Zentralbank Österreich Aktiengesellschaft holds indirectly, via BL Syndikat Be-teiligungs Gesellschaft m.b.H. and RZB Versicherungsbeteiligung GmbH, a total of 31.40 per cent (allocated in accordance with the Austrian Stock Exchange Act) of the Com-pany’s share capital; UNIQA Versicherungsverein Privatstiftung holds directly and indirectly through Austria Versicherungsverein Beteiligungs-Verwaltungs GmbH a total of 30.58 per cent (allocated in accordance with the Austrian Stock Exchange Act) of the Company’s share capital.
4. No shares with special control rights have been issued. 5. The employees that have share capital exercise their voting rights directly. 6. No provisions of the Articles of Association or other provisions exist that go beyond the stat-
utory provisions for appointing Management Board and Supervisory Board members or for modifying the Articles of Association with the exception of the rule that when a Supervisory Board member turns 70 years of age, they retire from the Supervisory Board at the end of the next Annual General Meeting.
7. The Management Board is authorised to increase the Company’s share capital once or mul-tiple times up to and including 30 June 2019 with the approval of the Supervisory Board by a total of no more than €81,000,000 by issuing up to 81,000,000 no-par value bearer or regis-tered shares in exchange for payment in cash or in kind. The Management Board is further authorised until 27 November 2015 to buy back up to 21,424,790 treasury shares through the Company and/or through subsidiaries of the Company (Section 66 of the Stock Corporation Act). As at 31 December 2014, the Company held 819,650 treasury shares.
8. With regard to the holding company STRABAG SE, corresponding agreements with other shareholders of this holding company exist.
9. No compensation agreements exist for the event of a public takeover offer.
DISCLOSURES REQUIRED UNDER SECTION 243A PARAGRAPH 2 OF THE AUSTRIAN COMMERCIAL CODE
The most important features of the internal control and risk management system with regard to the financial reporting process are described in the notes to the consolidated financial state-ments (Risk Report).

37GROUP MANAGEMENT REPORT
PROPOSED APPROPRIATION OF PROFIT
The individual accounts of UNIQA Insurance Group AG, prepared in accordance with the Austrian Commercial Code, report an annual net profit for the 2014 financial year in the amount of €130,571,950.61 (2013: €108,208,827.81). The Management Board will propose to the Annual General Meeting on 26 May 2015 that this net profit be used for a dividend of €0.42 for each of the 309,000,000 dividend-entitled no-par value shares issued as at the reporting date and the remaining amount carried forward to a new account. Vienna, 25 March 2015
Andreas Brandstetter Chairman of the Management Board
Hannes Bogner Member of the Management Board
Kurt Svoboda Member of the Management Board
Wolfgang Kindl Member of the Management Board
Thomas Münkel Member of the Management Board

38 CONSOLIDATED FINANCIAL STATEMENTS
Consolidated Statement of Financial Position as at 31 December 2014
Assets in € thousand
Notes 31/12/2014 31/12/20131) 01/01/20131)
A. Property, plant and equipment I. Land and buildings for own use 1 187,746 198,433 194,151II. Other property, plant and equipment 2 95,760 88,156 112,604
283,506 286,589 306,755B. Investment property 3 1,504,483 1,652,485 1,690,763C. Intangible assets
I. Deferred acquisition costs 4 998,952 994,501 931,981II. Goodwill 5 490,059 510,174 523,753III. Other intangible assets 6 28,046 24,455 25,170
1,517,058 1,529,131 1,480,903D. Investments in associates 7 528,681 545,053 544,522E. Investments
I. Variable-income securities 1. Available-for-sale 9 625,189 863,810 1,399,3522. At fair value through profit or loss 98,005 131,264 371,262
723,194 995,074 1,770,614II. Fixed-income securities
1. Available-for-sale 9 18,016,323 15,136,246 13,186,6222. Assessed at fair value through profit or loss 364,630 439,374 441,623 18,380,953 15,575,620 13,628,244
III. Loans and other investments 1. Loans 11 835,603 944,813 1,089,6492. Bank balances 12 390,046 1,273,852 1,189,2173. Deposits retained on assumed reinsurance 12 123,554 126,761 129,755 1,349,202 2,345,426 2,408,621
IV. Derivative financial instruments (trading portfolio) 1. Variable-rate 10 0 98 6,3632. Fixed-rate 10 122,340 73,283 55,844 122,340 73,381 62,206
V. Investments under investment contracts 53,664 48,590 43,064 20,629,354 19,038,091 17,912,749F. Unit-linked and index-linked life insurance investments 24 5,386,650 5,332,611 5,023,764
G. Reinsurers' share of technical provisions I. Unearned premiums 19 16,030 14,643 9,869II. Insurance provision 20 394,307 413,385 434,379III. Provision for unsettled claims 21 151,240 123,620 159,763IV. Other technical provisions 1,964 1,604 1,836 23 563,540 553,252 605,847
H. Reinsurers' share of technical provisions for unit-linked and index-linked life insurance 24 332,974 389,206 408,818
I. Receivables including insurance receivables 13 I. Reinsurance receivables 45,883 84,821 42,623II. Other receivables 1,014,694 856,146 845,186III. Other assets 33,967 38,778 48,369 1,094,544 979,746 936,179
J. Income tax receivables 14 53,917 69,881 55,098K. Deferred tax assets 15 6,630 8,695 6,673L. Current bank balances and cash-in-hand 975,764 616,976 960,065M. Assets in disposal groups held for sale 8 161,053 0 63,661Total assets 33,038,153 31,001,715 29,995,797 1) Prior-year amounts have been adjusted in accordance with IAS 8.42.

39CONSOLIDATED FINANCIAL STATEMENTS
Equity and liabilities in € thousand
Notes 31/12/2014 31/12/20131) 01/01/20131)
A. Total equity I. Shareholders’ equity 16
1. Subscribed capital and capital reserves 1,789,920 1,789,920 1,064,5942. Retained earnings 894,474 792,204 656,7083. Revaluation reserve 410,778 177,133 309,2324. Actuarial gains and losses on defined benefit obligations – 143,503 – 116,081 – 95,2605. Consolidated profit 130,572 119,951 78,258
3,082,242 2,763,127 2,013,533II. Non-controlling interests 17 20,193 22,012 20,675
3,102,434 2,785,139 2,034,208B. Subordinated liabilities 18 600,000 600,000 450,000C. Technical provisions
I. Unearned premiums 19 626,641 631,588 629,480II. Insurance provision 20 16,773,299 16,447,408 16,191,990III. Provision for unsettled claims 21 2,584,844 2,367,882 2,365,841IV. Provision for non-profit related premium refunds 22 49,743 46,479 44,578V. Provision for profit-related premium refunds and/or policyholder profit participation 22 1,141,282 360,676 566,721VI. Other technical provisions 44,260 46,182 48,929
23 21,220,068 19,900,215 19,847,540D. Technical provisions for unit-linked and
index-linked life insurance 24 5,306,000 5,251,035 4,939,966E. Financial liabilities
I. Liabilities from loans 25 16,692 18,535 27,494II. Derivative financial instruments 10 32,489 8,301 7,471
49,181 26,836 34,965F. Other provisions
I. Provisions for pensions and similar obligations 26 611,670 586,757 566,620II. Other provisions 27 222,245 249,924 304,389
833,914 836,681 871,009G. Liabilities and other items classified as equity and liabilities 28
I. Reinsurance liabilities 758,583 834,056 887,405II. Other liabilities 583,539 505,022 613,707III. Other items classified as equity and liabilities 26,628 23,040 31,226
1,368,751 1,362,117 1,532,338H. Income tax liabilities 29 43,272 40,712 28,623I. Deferred tax liabilities 30 355,424 198,980 245,956J. Liabilities in disposal groups held for sale 8 159,107 0 11,191Total equity and liabilities 33,038,153 31,001,715 29,995,797 1) Prior-year amounts have been adjusted in accordance with IAS 8.42.

40 CONSOLIDATED FINANCIAL STATEMENTS
Consolidated Income Statement from 1 January until 31 December 2014
in € thousand Notes 2014 20131)
Premiums written (gross) 31 5,519,700 5,157,5761. Premiums earned (net) 32
a) Gross 5,523,218 5,149,467b) Reinsurers’ share – 210,322 – 210,867
5,312,896 4,938,6002. Technical interest income 560,384 489,7993. Other insurance income
a) Gross 32,595 22,305b) Reinsurers’ share 1,897 1,203
34,492 23,5084. Insurance benefits 33
a) Gross – 4,517,700 – 4,078,083b) Reinsurers’ share 134,038 118,635 – 4,383,662 – 3,959,448
5. Operating expenses 34 a) Expenses for the acquisition of insurance – 938,593 – 942,528b) Other operating expenses – 362,782 – 439,941c) Reinsurance commission and share of profit from reinsurance ceded 26,044 28,302
– 1,275,330 – 1,354,1676. Other technical expenses
a) Gross – 71,304 – 56,921b) Reinsurers’ share – 25,994 – 32,600
– 97,298 – 89,5217. Technical result 151,482 48,772
8. Net investment income 35 864,375 780,002
of which profit from associates 23,583 22,2299. Other income 36 62,428 40,58910. Reclassification of technical interest income – 560,384 – 489,79911. Other operating expenses 37 – 70,334 – 32,41312. Non-technical result 296,084 298,379 13. Operating profit/(loss) 447,566 347,15114. Amortisation of goodwill and impairment losses – 32,292 – 7,30115. Finance costs – 37,343 – 32,28116. Profit/(loss) from ordinary activities 377,932 307,56917. Income taxes 38 – 85,055 – 69,71118. Profit/(loss) from discontinued operations (after tax) 0 50,00019. Profit for the year 292,877 287,858
of which attributable to shareholders of UNIQA Insurance Group AG 289,863 284,660of which attributable to non-controlling interests 3,014 3,198
Earnings per share (in €)2) 16 0.94 1.21Average number of shares in circulation 308,180,350 235,294,119 1) Prior-year amounts have been adjusted in accordance with IAS 8.42. 2) Diluted earnings per share equates to basic earnings per share. Calculated based on consolidated profit.
Profit/loss from discontinued operations in the previous year originates from the reversal of a provision for liability in connection with the sale of Mannheimer AG Holding and has been allocated entirely to the shareholders of the parent company.

41CONSOLIDATED FINANCIAL STATEMENTS
Consolidated Statement of Comprehensive Income from 1 January until 31 December 2014
in € thousand 2014 20131)
Profit for the year 292,877 287,858Items not to be reclassified to profit or loss in subsequent periods
Actuarial gains and losses on defined benefit obligations Gains (losses) recognised in equity – 46,042 – 32,157Gains (losses) recognised in equity - deferred taxes 8,841 6,757Gains (losses) recognised in equity - deferred profit participation 9,779 4,579 – 27,422 – 20,821
Items to be reclassified to profit or loss in subsequent periods Currency translation
Gains (losses) recognised in equity – 64,364 – 24,897Recognised in the consolidated income statement 0 – 6,332
Unrealised gains and losses on investments Gains (losses) recognised in equity 1,318,234 – 170,192Gains (losses) recognised in equity - deferred taxes – 127,346 21,194Gains (losses) recognised in equity - deferred profit participation – 893,479 76,778Recognised in the consolidated income statement – 174,736 – 239,082Recognised in the consolidated income statement - deferred tax 11,112 28,104Recognised in the consolidated income statement - deferred profit participation 98,135 150,511
Change from measurement under the equity method Gains (losses) recognised in equity – 7,445 – 10,979Recognised in the consolidated income statement 0 – 1,710
Other changes 2) 2,238 – 1,540 162,350 – 178,143
Other comprehensive income 134,928 – 198,964Total comprehensive income 427,805 88,894
of which attributable to shareholders of UNIQA Insurance Group AG 426,516 86,282of which attributable to non-controlling interests 1,289 2,612
1) Prior-year amounts have been adjusted in accordance with IAS 8.42.
2) Diluted earnings per share equates to basic earnings per share. Calculated based on consolidated profit.
In the 2014 financial year the presentation of the income statement was expanded to include the key management indicator “technical result” as a subtotal. The items other income and other expenses were split and recorded as other technical and other non-technical income and/or expenses.
The portion of the technical interest income that is financed from capital gains was also re-classified as technical income, since the corresponding expense is also included in the insurance benefits. The technical interest is the amount that we earned in insurance business from invest-ing the assets that cover technical provisions.
The item Amortisation of goodwill and impairment losses has also been reclassified under operating profit/(loss).

42 CONSOLIDATED FINANCIAL STATEMENTS
The values as at 31 December 2013 and 2012 have been adjusted in accordance with IAS 8.42. Equity as at 31 December 2013 decreased by EUR 4,788 thousand, whereas equity as at 31December 2012 increased by EUR 4,258 thousand. The adjusted profit/(loss) for 2013 in-creased by EUR 1,081 thousand. The adjustments related to: • Reclassification of deferred acquisition costs previously calculated in the insurance provision,
the provision for pending losses and in the premiums brought forward to the asset side of the statement of financial position, and presentation as deferred acquisition costs,
• Change in the determination and amortisation of deferred acquisition costs, • Taking into account deferred profit sharing in the Italian classic life insurance business for
cumulative value increases of investments shown in the revaluation reserve. • Netting of deferred tax assets and liabilities on account of duration matching and identical
financial management. • Separate presentation of investments under investment contracts, which had previously been
reported under investments held for unit-linked and index-linked life insurance investments. The liabilities resulting from this have been reclassified from technical provisions for unit-linked and index-linked life insurance to other liabilities.

43CONSOLIDATED FINANCIAL STATEMENTS
Consolidated statement of financial position In € thousand
31/12/2013After adjustment
31/12/2013Before adjustment
31/12/2013Adjustment
Assets C. Intangible assets 1,529,131 1,462,530 66,601
I. Deferred acquisition costs 994,501 927,900 66,601E. Investments 19,038,091 18,989,501 48,590
V. Investments under investment contracts 48,590 0 48,590F. Unit-linked and index-linked life insurance investments 5,332,611 5,381,201 – 48,590K. Deferred tax assets 8,695 142,215 – 133,520Total assets 31,001,715 31,068,634 – 66,919Equity and liabilities A. Total equity 2,785,139 2,789,927 – 4,788
I. Shareholders’ equity 2,763,127 2,767,717 – 4,5903. Revaluation reserve 177,133 193,465 – 16,3315. Consolidated profit 119,951 108,209 11,742
II. Non-controlling interests 22,012 22,210 – 199C. Technical provisions 19,900,215 19,826,710 73,505
I. Unearned premiums 631,588 621,986 9,602II. Insurance provision 16,447,408 16,409,428 37,980V. Provision for profit-related premium refunds and/or policyholder
profit participation 360,676 334,753 25,922D. Technical provisions for unit-linked and
index-linked life insurance 5,251,035 5,299,625 – 48,590G. Liabilities and other items classified as equity and liabilities 1,362,117 1,313,527 48,590
II. Other liabilities 505,022 456,432 48,590I. Deferred tax liabilities 198,980 334,616 – 135,636Total equity and liabilities 31,001,715 31,068,634 – 66,919
Consolidated income statement in € thousand
2013After adjustment
2013Before adjustment
2013Adjustment
1. Premiums earned (net) 4,938,600 4,935,888 2,712a) Gross 5,149,467 5,146,755 2,712
4. Insurance benefits – 3,959,448 – 3,955,268 – 4,180a) Gross – 4,078,083 – 4,073,903 – 4,180
5. Operating expenses – 1,354,167 – 1,357,589 3,422a) Expenses for the acquisition of insurance – 942,528 – 945,950 3,422
7. Technical result 48,772 46,817 1,95513. Operating profit/(loss) 347,151 345,195 1,95516. Profit/(loss) from ordinary activities 307,569 305,614 1,95517. Income taxes – 69,711 – 68,837 – 87419. Profit for the year 287,858 286,777 1,081
of which attributable to shareholders of UNIQA Insurance Group AG 284,660 283,447 1,213of which attributable to non-controlling interests 3,198 3,330 – 132
Earnings per share (in €)2) 1.21 1.20 0.01

44 CONSOLIDATED FINANCIAL STATEMENTS
Consolidated statement of financial position In € thousand
31/12/2012 After adjustment
31/12/2012Before adjustment
31/12/2012Adjustment
Assets C. Intangible assets 1,480,903 1,417,725 63,179
I. Deferred acquisition costs 931,981 868,802 63,179E. Investments 17,912,749 17,869,686 43,064
V. Investments under investment contracts 43,064 0 43,064F. Unit-linked and index-linked life insurance investments 5,023,764 5,066,828 – 43,064K. Deferred tax assets 6,673 128,608 – 121,936Total assets 29,995,797 30,054,554 – 58,757Equity and liabilities A. Total equity 2,034,208 2,029,950 4,258
I. Shareholders’ equity 2,013,533 2,009,299 4,2333. Revaluation reserve 309,232 315,528 – 6,2955. Consolidated profit 78,258 67,729 10,529
II. Non-controlling interests 20,675 20,651 25C. Technical provisions 19,847,540 19,790,921 56,618
I. Unearned premiums 629,480 617,165 12,315II. Insurance provision 16,191,990 16,158,189 33,801V. Provision for profit-related premium refunds and/or policyholder
profit participation 566,721 556,218 10,503D. Technical provisions for unit-linked and
index-linked life insurance 4,939,966 4,983,029 – 43,064G. Liabilities and other items classified as equity and liabilities 1,532,338 1,479,065 53,273
II. Other liabilities 613,707 560,434 53,273I. Deferred tax liabilities 245,956 365,590 – 119,633Total equity and liabilities 29,995,797 30,054,554 – 58,757

45CONSOLIDATED FINANCIAL STATEMENTS
Consolidated Statement of Cash Flows from 1 January until 31 December 2014
in € thousand 2014 2013Profit/(loss) for the year including share attributable to non-controlling interests
Profit for the year 292,877 287,858of which interest and dividend payments – 25,372 – 12,261
Non-controlling interests – 3,014 – 3,198Change in technical provisions (net) 1,140,249 435,952Change in deferred acquisition costs – 4,451 – 62,520Change in direct insurance receivables and liabilities 19,526 – 105,070Change in other receivables and liabilities – 110,874 – 116,718Change in securities at fair value through profit or loss 59,044 231,072Gain/(loss) on the disposal of investments – 1,347,215 – 181,034Impairment losses/reversal of impairment losses on other investments – 13,490 195,233Change in pension and termination benefit provision 24,913 20,137Change in deferred tax assets and liabilities 156,461 – 42,104Change in other statement of financial position items 12,615 20,406Change in goodwill and intangible assets 52,260 14,293Other non-cash income and expenses as well as adjustments to profit for the year – 95,051 – 66,279Net cash flows from operating activities 183,849 628,027
of which cash flows from income taxes – 35,141 – 72,844 Proceeds from disposal of consolidated companies 34,303 17,659Payments for acquisition of consolidated companies – 72,247 – 7,988Proceeds from disposal and maturity of other investments 9,614,624 5,393,791Payments for acquisition of other investments – 9,236,185 – 6,875,941Change in unit-linked and index-linked life insurance investments – 54,039 – 308,847Net cash flows used in investing activities 286,457 – 1,781,325 Increase in share capital 0 725,326Change in treasury shares held 0 0Dividend payments – 109,342 – 53,357Proceeds and payments from other financing activities – 1,843 141,041Net cash flows used in financing activities – 111,185 813,009 Change in cash and cash equivalents 359,121 – 340,289Change in cash and cash equivalents due to movements in exchange rates – 334 – 2,800Cash and cash equivalents at beginning of the year 616,976 960,065Cash and cash equivalents at end of period 975,764 616,976
of which cash flow from income taxes – 35,141 – 72,844
Cash and cash equivalents correspond to item L. of the assets: Current bank balances and cash-in-hand

46 CONSOLIDATED FINANCIAL STATEMENTS
Consolidated Statement of Changes in Equity
in € thousand
Subscribed capital and capital reserves
Revaluation reserve Actuarial gains and losses on
defined benefit obligations
At 31/12/2012 1,064,594 315,528 – 95,260IAS 8 restatement 0 – 6,295 0 At 1/1/2013 1,064,594 309,232 – 95,260 Changes due to: Increase in capital 725,326 Change in basis of consolidation Dividends to shareholders Total comprehensive income – 132,099 – 20,821
Currency translation Unrealised gains and losses from measurement under the equity method Unrealised gains and losses on investments – 132,099 Actuarial gains and losses on defined benefit obligations – 20,821Profit for the year Other
Change in retained earnings At 31/12/2013 1,789,920 177,133 – 116,081 Changes due to: Change in basis of consolidation Dividends to shareholders Total comprehensive income 233,645 – 27,422
Currency translation Unrealised gains and losses from measurement under the equity method Unrealised gains and losses on investments 233,645 Actuarial gains and losses on defined benefit obligations – 27,422Profit for the year Other
Change in retained earnings At 31/12/2014 1,789,920 410,778 – 143,503
Consolidated profit at 31 December 2014 corresponds with the separate financial statements of UNIQA Insurance Group AG and reflects the distribution potential of the listed Company. The change in retained earnings is the adjusting item in order to achieve this presentation.

47CONSOLIDATED FINANCIAL STATEMENTS
Retained earnings including treasury
share provision
Treasury shares
Consolidated profit Shareholders’ equity Non-controlling interests
Totalequity
667,565 – 10,857 67,729 2,009,299 20,651 2,029,950 0 0 10,529 4,233 25 4,258 667,565 – 10,857 78,258 2,013,533 20,675 2,034,208 725,326 725,326 – 8,656 – 8,656 – 168 – 8,824 – 53,357 – 53,357 – 1,108 – 54,465 – 45,458 284,660 86,282 2,612 88,894 – 31,229 – 31,229 – 31,229 – 12,689 – 12,689 0 – 12,689 0 – 132,099 – 586 – 132,685 0 – 20,821 0 – 20,821 0 284,660 284,660 3,198 287,858 – 1,540 0 – 1,540 – 1,540 189,610 – 189,610 0 0 803,061 – 10,857 119,951 2,763,127 22,012 2,785,139 462 462 – 1,629 – 1,167 – 107,863 – 107,863 – 1,479 – 109,342 – 69,570 289,863 426,516 1,289 427,805 – 64,364 – 64,364 – 64,364 – 7,445 – 7,445 – 7,445 233,645 – 1,725 231,920 0 – 27,422 0 – 27,422 289,863 289,863 3,014 292,877 2,238 2,238 2,238 171,379 – 171,379 0 0 905,332 – 10,857 130,572 3,082,242 20,193 3,102,434

48 NOTES TO THE CONSOLIDATED FINANCIAL STATEMENTS
Notes to the Consolidated Financial Statements
GENERAL DISCLOSURES
UNIQA Insurance Group AG is a company domiciled in Austria. The address of the Company’s registered office is Untere Donaustraße 21, 1029 Vienna. The Company’s consolidated financial statements for the year ending 31 December 2014 cover UNIQA Insurance Group AG and its subsidiaries (together: the UNIQA Group). The Group primarily conducts business with proper-ty, casualty, health and life insurance.
UNIQA Insurance Group AG, as the parent company of the UNIQA Group, is domiciled in Vienna and is registered in the company registry of the Commercial Court of Vienna under FN 92933t. The shares of UNIQA Insurance Group AG are listed on the Vienna Stock Exchange.
The consolidated financial statements were prepared in line with the International Finan-cial Reporting Standards (IFRSs) as adopted by the European Union (EU). The additional re-quirements of Section 245a paragraph 1 of the Austrian Commercial Code (UGB) were also met. The consolidated financial statements were approved for publication by the Management Board on 25 March 2015.
They are presented in euros, the Company’s functional currency. All financial information shown in euros has been rounded to the nearest thousand unless otherwise indicated.
ACCOUNTING REGULATIONS
1. Accounting principles With the exception of the changes described in the section titled “Changes in major accounting policies” (page 103), the Group applied the following accounting policies consistently to all periods presented in these consolidated financial statements.
2. Consolidation principles Business combinations If the Group has obtained control, it accounts for business combinations in line with the acqui-sition method. The consideration transferred for the acquisition and the identifiable net assets acquired are measured at fair value. All goodwill arising is tested for impairment annually. Any profit from an acquisition at a price below market value is recognised directly in profit or loss. Transaction costs are recognised as expenses immediately.
The consideration transferred includes no amounts associated with the fulfilment of pre-existing relationships. Such amounts are generally recognised in profit or loss.

49NOTES TO THE CONSOLIDATED FINANCIAL STATEMENTS
Any contingent obligation to pay consideration is measured at fair value as of the acquisition date. If the contingent consideration is classified as equity, it is not remeasured, and a settle-ment is accounted for within equity. Otherwise, later changes in the fair value of the contingent consideration are recognised in profit or loss.
Non-controlling interests Non-controlling interests are measured as at the acquisition date with their proportionate share in the identifiable net assets of the acquired entity.
Changes in the Group’s share in a subsidiary that do not result in a loss of control are recog-nised directly in equity as equity transactions with non-controlling interests.
Subsidiaries Subsidiaries are entities controlled by the Group. The Group controls a company if • the Group is able to exercise power over the company in which investments are held • it is exposed to fluctuating returns from its participation and • it is able to influence the amount of the returns as a result of its power.
The financial statements of subsidiaries are included in the consolidated financial state-ments from the date control begins until the date control ends.
Loss of control If the Group loses control of a subsidiary, it derecognises the subsidiary’s assets and liabilities and all associated non-controlling interests and other equity components. Any resulting profit or loss is recognised in the profit for the year. Any retained interest in the former subsidiary is measured at fair value as of the date of the loss of control.
Investment in associates that are equity-accounted Associates are entities over which the Group has significant influence, but not control or joint control, as regards financial and operating policies. This is generally provided once there is a voting share of between 20 and 50 per cent or a comparable crucial influence is guaranteed via other contractual regulations.
Investments in associates are equity-accounted. They are initially recognised at cost, which also includes transaction costs. After the first-time recognition, the consolidated financial statements include the Group’s share in the comprehensive income of the financial investments recognised using the equity method until the date the significant influence or joint control ends.
Transactions eliminated on consolidation Intragroup balances and transactions and all unrealised income and expenses from intragroup transactions are eliminated in the preparation of the consolidated financial statements.

50 NOTES TO THE CONSOLIDATED FINANCIAL STATEMENTS
Discontinued operations A discontinued operation is a part of the Group whose operations and cash flows can be clearly distinguished from the rest of the Group and which • represents a separate, major line of business or geographical area of operations, • is part of a single coordinated plan to dispose of a separate, major line of business or geograph-
ical area of operations, or • is a subsidiary acquired exclusively with a view to resale.
An operation is classified as discontinued when it is disposed of or as soon as the criteria for classification as “held for sale” are met, whichever is earlier.
If an operation is classified as a discontinued operation, the consolidated statement of com-prehensive income for the comparative year is adjusted so that it were as if the operation had been discontinued from the start of the comparative year.
Assets held for sale Non-current assets or disposal groups that include assets and liabilities are classified as held for sale if it is highly probably that they will be realised through sale rather than continued use.
In general, these assets or disposal groups are recognised at the lower of their carrying amounts or fair values less costs to sell. Any impairment loss of a disposal group is firstly at-tributed to goodwill and then to the remaining assets and liabilities on a proportional basis – with the exception that no loss is attributed to financial assets, deferred tax assets, assets in connection with employee benefits or investment property that continues to be measured based on the Group’s other accounting policies. Impairment losses on the first-time classification as held for sale and future profit or loss on remeasurement are recognised in the profit for the year.
As soon as they are classified as held for sale, intangible assets and property, plant and equipment are no longer amortised or depreciated and any investees recognised using the equity method are no longer equity-accounted.
3. Currency translation Transactions in foreign currencies Transactions in foreign currencies are translated into the functional currency of the Group entity at the spot exchange rate on the date of the transaction.
Monetary assets and liabilities denominated in a foreign currency on the reporting date are translated into the functional currency at the closing rate. Non-monetary assets and liabilities measured at fair value in a foreign currency are translated at the rate valid on the date the fair value is calculated. Currency translation differences are recognised in profit or loss for the period. Non-monetary items measured at historical cost in a foreign currency are not trans-lated.
51NOTES TO THE CONSOLIDATED FINANCIAL STATEMENTS
For the following items, currency translation differences are recognised in other compre-hensive income in deviation from the policy: • Available-for-sale equity instruments (except in the case of impairment, for which currency
translation differences are reclassified from other comprehensive income into profit or loss), • Financial liabilities designated as a hedge of a net investment in a foreign operation, provided
the hedge is effective, • Qualified cash flow hedges, provided they are effective.
Foreign operations Assets and liabilities from foreign operations, including the goodwill and fair value adjustments that result from the acquisition, are translated into euros at the closing rate on the reporting date. Income and expenses from foreign operations are translated at the average rate for the year.
Currency translation differences are reported in other comprehensive income and recog-nised in the foreign currency translation as a part of the retained earnings in equity if the for-eign exchange difference is not attributable to non-controlling interests.
On the disposal of a foreign operation that results in loss of control, joint control or signifi-cant influence, the corresponding cumulative amount recognised in the currency translation reserve up to this date is reclassified to profit or loss as part of the result on disposal. In the case of only partial disposal without loss of control over a subsidiary that includes a foreign opera-tion, the corresponding portion of the cumulative exchange difference is attributed to the non-controlling interests. If the Group partially disposes of an associated or jointly controlled company that includes a foreign operation, but retains significant influence or joint control respectively, the corresponding portion of the cumulative currency translation difference is reclassified to profit or loss.
If the settlement of monetary items in the form of receivables or liabilities from or to a for-eign operation is neither planned nor probable in the foreseeable future, the resulting foreign currency gains and losses are considered part of the net investment in the foreign operation. The foreign currency gains and losses are then reported in other comprehensive income and recognised in the currency translation reserve in equity.

52 NOTES TO THE CONSOLIDATED FINANCIAL STATEMENTS
Major exchange rates
EUR closing rates 31/12/2014 31/12/2013Swiss franc CHF 1.2024 1.2276Czech koruna CZK 27.7350 27.4270Hungarian forint HUF 315.5400 297.0400Croatian kuna HRK 7.6580 7.6265Polish zloty PLN 4.2732 4.1543Bosnia and Herzegovina convertible mark BAM 1.9558 1.9558Romanian leu RON 4.4828 4.4710Bulgarian lev BGN 1.9558 1.9558Ukranian hryvnia UAH 19.1492 11.3252Serbian dinar RSD 121.3495 114.5734Russian rouble RUB 72.3370 45.3246Albanian lek ALL 139.8700 140.4900Macedonian denar MKD 61.4218 61.3938
4. Insurance items UNIQA Insurance Group AG has applied IFRS 4 published in 2004 for insurance contracts since 1 January 2005. This standard demands that the accounting policies be largely unaltered with regard to the actuarial items.
The IFRSs contain no specific regulations that comprehensively govern the recognition and measurement of insurance and reinsurance policies and investment contracts with a discre-tionary participation feature. Therefore, in accordance with IAS 8, the provisions of US Gener-ally Accepted Accounting Principles (US GAAP) in the version applicable on 1 January 2005 were applied to all cases for which IFRS 4 contains no specific regulations. For balancing the accounts and evaluation of the insurance-specific entries of life insurance with profit sharing, FAS 120 was observed; FAS 60 was applied for specific items in health, property and casualty insurance and FAS 113 for reinsurance. Unit-linked life insurance, where the policyholder bears the entire investment risk, was accounted for in accordance with FAS 97.
Based on the regulations, technical items must be covered using suitable assets (cover funds). As is standard in the insurance industry, values dedicated to the cover funds are subject to a limitation as regards availability in the group.
Insurance and investment contracts Insurance contracts, i.e. contracts through which significant insurance risk is assumed, and investment contracts with a discretionary participation feature are treated in accordance with IFRS 4, i.e. under application of US GAAP. Investment contracts, i.e. contracts that do not trans-fer a significant insurance risk and that do not include a discretionary participation feature, fall under the scope of IAS 39 (Financial Instruments).

53NOTES TO THE CONSOLIDATED FINANCIAL STATEMENTS
Reinsurance contracts Assumed reinsurance (indirect business) is recognised as an insurance contract in accordance with IFRS 4. Ceded reinsurance is also subject to the application of IFRS 4 and is presented in a separate item under assets in accordance with IFRS 4. The profit and loss items (premiums and pay-ments) are deducted openly from the corresponding items in the gross account, while commis-sion income is reported separately as its own item.
Deferred acquisition costs Deferred acquisition costs are accounted for in accordance with IFRS 4 in conjunction with US GAAP. In the case of property and casualty insurance contracts, costs directly attributable to the acquisition are deferred and distributed over the expected contract term or according to the unearned premiums. In life insurance, the deferred acquisition costs are amortised in line with the pattern of expected gross profits or margins.
Unearned premiums For short-term insurance contracts, such as most property and casualty insurance policies, the premiums relating to future years are reported as unearned premiums in line with the applica-ble regulations of US GAAP. The amount of these unearned premiums corresponds to the insur-ance cover granted proportionally in future periods.
Premiums levied upon entering into certain long-term contracts (e.g. upfront fees) are rec-ognised as unearned premiums. In line with the applicable regulations of US GAAP, these fees are recorded in the same manner as the amortisation of deferred acquisition costs.
Unearned premiums are in principle calculated for each individual policy and exactly to the day. If they are attributable to life insurance, they are included in the insurance provision.
Insurance provision Insurance provisions are established in the casualty, life and health insurance lines. Their carry-ing amount is determined based on actuarial principles on the basis of the present value of fu-ture benefits to be paid by the insurer less the present value of future net premiums the insurer expects to receive. The insurance provision of the life insurer is calculated by taking into ac-count prudent and contractually agreed calculation principles.
For policies of a mainly investment character (e.g. unit-linked life insurance), the provisions of FAS 97 are used to measure the insurance provision. The insurance provision is arrived at by combining the invested amounts, the change in value of the underlying investments and the withdrawals under the policy. For unit-linked insurance policies in which the policyholder carries the sole risk of the value of the investment rising or falling, the insurance provision is listed as a separate liability entry under “Technical provisions for unit-linked and index-linked life insurance”.

54 NOTES TO THE CONSOLIDATED FINANCIAL STATEMENTS
The insurance provisions for health insurance are determined based on calculation prin-ciples that correspond to the “best estimate”, taking into account safety margins. Once calcula-tion principles have been determined, they have to be applied to the corresponding partial port-folio for the whole duration (locked-in principle).
Provisions for losses and unsettled claims The provision for outstanding claims in the property and casualty insurance lines contains the actual and the expected amounts of future financial obligations, including the direct claims settlement expenses appertaining thereto, based on accepted statistical methods. This applies to claims already reported as well as for claims incurred but not yet reported (IBNR). In insur-ance lines in which past experience does not allow the application of statistical methods, indi-vidual loss provisions are set aside.
Life insurance is calculated on an individual loss basis with the exception of the provision for unreported claims.
As for health insurance, the provisions for outstanding claims are estimated on the basis of past experience, taking into consideration the known arrears in claim payments.
The provision for the assumed reinsurance business generally complies with the figures of the cedents.
Provision for premium refunds and profit sharing The provision for premium refunds includes the amounts for profit-related and non-profit related profit sharing to which the policyholders are entitled on the basis of statutory or con-tractual provisions.
In life insurance policies with a discretionary participation feature, differences between local measurement and measurement in accordance with IFRSs are presented with deferred profit participation taken into account, whereby this is also reported in profit or loss or in the statement of comprehensive income depending on the recognition of the change in the under-lying measurement differences. The amount of the provision for deferred profit participation generally comes to 85 per cent of the measurement differentials before tax.
Other technical provisions This item basically contains the provision for contingent losses for acquired reinsurance portfo-lios as well as a provision for expected cancellations and premium defaults.
Technical provisions for unit- and index-linked life insurance This item relates to the insurance provisions and the remaining technical provisions for obliga-tions from life insurance policies where the value or income is determined by investments for which the policyholder bears the risk or for which the benefit is index-linked. As a general rule, the valuation corresponds with the unit-linked and index-linked life insurance investments written at current market values.

55NOTES TO THE CONSOLIDATED FINANCIAL STATEMENTS
5. Employee benefits Short-term employee benefits Obligations from short-term employee benefits are recognised as expenses as soon as the asso-ciated work is performed. A liability must be recognised for the expected amount to be paid if the Group currently has a legal or de facto obligation to pay this amount on the basis of work performed by the employee and the obligation can be reliably estimated.
Defined contribution plans Obligations for contributions to defined contribution plans are recognised as expenses as soon as the associated work is performed. Prepaid contributions are recognised as assets if an en-titlement to refund or reduction of future payments arises.
Defined benefit plans The Group’s net obligation with regard to defined benefit plans is calculated separately for each plan by estimating the future benefits that the employees have earned in the current and in earlier periods. This amount is discounted and the fair value of any plan assets is deducted.
The calculation of defined benefit obligations is carried out annually by a qualified actuary using the projected unit credit method. If the calculation results in a potential asset for the Group, the asset recognised is limited to the present value of any economic benefit available in the form of future refunds from the plan or reductions in future contributions to the plan. Any valid minimum funding requirements are included in the calculation of the present value of the economic benefit.
Remeasurements of the net liability from defined benefit plans are recognised directly in other comprehensive income. The remeasurement includes the actuarial gains and losses, the income from plan assets (not including interest) and the effect of any asset ceiling (not includ-ing interest). The Group calculates net interest expenses (income) on the net liability (asset) from defined benefit plans for the reporting period by applying the discount rate used to meas-ure the defined benefit obligation at the start of the annual reporting period. This discount rate is applied to net liabilities (assets) from defined benefit plans on this date. Any changes in the net liabilities (assets) from defined benefit plans resulting from contribution and benefit pay-ments over the course of the reporting period are taken into account. Net interest expenses and other expenses for defined benefit plans are recognised in profit or loss.
If a plan’s benefits are changed or a plan is curtailed, the resulting change in the benefit re-lating to past service or the gain or loss on the curtailment is recognised directly in net profit for the year. The Group recognises gains and losses from the settlement of a defined benefit plan at the date of the settlement.

56 NOTES TO THE CONSOLIDATED FINANCIAL STATEMENTS
Other long-term employee benefits The Group’s net obligation with regard to long-term employee benefits comprises the future benefits that the employees have earned in return for work performed in the current and in earlier periods. These benefits are discounted to determine their present value. Remeasure-ments are recognised in profit or loss in the period in which they arise.
Post-employment benefits Post-employment benefits are recognised as expenses on the earlier of the following dates: when the Group can no longer withdraw the offer of such benefits or when the Group recognises costs for restructuring. If benefits are not expected to be settled within twelve months of the end of the reporting period, they are discounted.
Share-based payments with cash settlement (share appreciation rights) The fair value on the date share-based payment awards are granted to employees is recognised as expense over the period in which the employees become unconditionally entitled to the awards. The amount recognised as expense is adjusted in order to reflect the number of awards expected to fulfil the corresponding service conditions and non-market performance condi-tions, so that the expense recognised is ultimately based on the number of awards that fulfil the corresponding service conditions and non-market performance conditions at the end of the vesting period. Changes in measurement assumptions likewise result in an adjustment of the recognised provision amounts through profit or loss.
6. Income taxes Tax expense includes actual and deferred tax. Actual tax and deferred tax is recognised in profit or loss, with the exception of any amount associated with a business combination or with an item recognised directly in equity or other comprehensive income.
Actual tax Actual tax is the expected tax liability or tax receivable on taxable income for the financial year or the tax loss on the basis of interest rates that apply on the reporting date or will soon apply, plus all adjustments of the tax liability relating to previous years. Actual tax liabilities include all tax liabilities resulting from the determination of dividends.
Deferred taxes Deferred taxes are recognised with regard to temporary differences between the carrying amounts of assets and liabilities for Group financial accounting purposes and the amounts used for tax purposes. Deferred taxes are not recognised for: • Temporary differences on the first-time recognition of assets or liabilities in the event of a
transaction that is not a business combination and that affects neither net profit before taxes nor taxable income,

57NOTES TO THE CONSOLIDATED FINANCIAL STATEMENTS
• Temporary differences in connection with shares in subsidiaries, associates and jointly con-trolled entities, provided the Group is able to control the timing of the reversal of the tempo-rary differences and it is probable that they will not reverse in the foreseeable future,
• Taxable temporary differences on the first-time recognition of goodwill.
A deferred tax asset is recognised for unused tax losses, unused tax credits and deductible tem-porary differences to the extent that it is probable that future taxable profit will be available for which they can be used. Deferred tax assets are reviewed on every reporting date and reduced to the extent that it is no longer probable that the associated tax advantage will be realised.
Deferred taxes are measured on the basis of the tax rates expected to be applied to tempo-rary differences as soon as they reverse, and using tax rates that have been enacted or substan-tively enacted by the end of the reporting period.
The measurement of deferred taxes reflects the tax consequences arising from the Group’s expectation of the manner in which it will recover the carrying amounts of its assets or settle its liabilities on the reporting date. For investment property measured at fair value, the presump-tion that the carrying amount will be recovered through sale was not rebutted.
Deferred tax assets and debts are netted out if the conditions for a legal claim to offsetting are met and the deferred tax claims and liabilities relate to income tax that is levied by the same tax authority, either for the same taxable item or different taxable items, aimed at achieving a settlement on a net basis.
7. Property, plant and equipment Recognition and measurement Property, plant and equipment are measured at cost less accumulated depreciation and accu-mulated impairment losses.
If parts of an item of property, plant and equipment have different useful lives, they are rec-ognised as separate items (main components) of property, plant and equipment.
Any gain or loss from the disposal of an item of property, plant and equipment is recognised in the net profit for the year.
Reclassification as investment property If the use of a property changes and an owner-occupied property becomes an investment prop-erty, the property is reclassified as investment property with the carrying amount as at the date of the change.
58 NOTES TO THE CONSOLIDATED FINANCIAL STATEMENTS
Subsequent costs Subsequent costs are only capitalised when it is probable that the future economic benefit asso-ciated with the expense will flow to the Group. Ongoing repairs and maintenance are recognised as expenses immediately.
Depreciation The depreciation is calculated in order to write down the costs of property, plant and equipment less their estimated residual values on a straight-line basis over the period of their estimated useful lives. The depreciation is recognised in profit or loss. Land is not depreciated.
The estimated useful lives of significant property, plant and equipment for the current year and comparative years are as follows: • Buildings: 10–80 years • Plant and equipment: 4–10 years • Fixtures and fittings: 4–10 years
Depreciation methods, useful lives and residual values are reviewed on every reporting date and adjusted if necessary.
8. Intangible assets Deferred acquisition costs Deferred acquisition costs for insurance activities that are directly related to new business and/or to extensions of existing policies and that vary in line with that business are capitalised and amortised over the term of the insurance contracts they relate to. If they are attributable to property and casualty insurance, they are amortised over the probable contractual term, with a maximum of five years. In life insurance, the acquisition costs are amortised over the duration of the contract at the same proportion as the actuarial profit margin of each individual year is realised in comparison to the total margin to be expected from the contracts. For long-term health insurance contracts, the amortisation of acquisition costs is measured in line with the proportionate share of earned premiums in the present value of expected future premium in-come. The changes in deferred acquisition costs are shown as operating expenses.
Goodwill The goodwill arising in the context of business combinations is measured at cost less accumu-lated impairment losses. Goodwill arises upon acquisition of subsidiaries and represents the surplus of the consideration transferred for acquisition of the company above the fair value of the Group’s share in the identifiable assets acquired, the liabilities assumed, contingent liabil-ities and all non-controlling shares in the acquired company at the time of the acquisition.

59NOTES TO THE CONSOLIDATED FINANCIAL STATEMENTS
Value of insurance contracts Values of life, property and casualty insurance policies relate to expected future margins from purchased operations and are recognised at the fair value at the acquisition date.
With regard to life insurance business acquired, the amortisation of the current value fol-lows the progression of the estimated gross margins.
Other intangible assets Other intangible assets include both purchased and internally-developed software, which is depreciated on a straight-line basis over its useful economic life of 2 to 5 years.
9. Investment property Land and buildings, including buildings on third-party land, held as long-term investments to generate rental income and/or for the purpose of capital appreciation are measured at cost when they are acquired. Subsequent measurement follows the cost model in accordance with IAS 40.56.
10. Financial instruments Classification The Group classifies non-derivative financial assets to the following categories: Financial assets measured at fair value through profit or loss, loans and receivables, and financial assets available for sale.
The Group categorises non-derivative financial liabilities as other financial liabilities.
Investments With the exception of the mortgages and other loans, investments are listed at the current fair value, which is established by determining a market value or stock market price. In the case of investments for which no market value can be determined, the fair value is determined through internal valuation models or on the basis of estimates of what amounts could be achieved under current market conditions in event of proper liquidation.
Investments held for trade (trading portfolio) Derivatives are used within the limits permitted under the Austrian Insurance Supervisory Act for hedging investments and for increasing earnings. All fluctuations in value are recognised in the income statement.
Investments at fair value through profit or loss ( fair value option) Structured products are not split between the underlying transaction and derivative, but are accounted for as a unit. All the structured products can therefore be found in the “Financial instruments at fair value through profit or loss” item of the statement of financial position. Unrealised profits and losses are recognised in the income statement. In accordance with IAS 39 (11A), ABS bonds, structured bonds, hedge funds and a special annuity fund with a high share of derivatives are also recognised under the items for securities at fair value through profit or loss.

60 NOTES TO THE CONSOLIDATED FINANCIAL STATEMENTS
Unit-linked and index-linked life insurance investments These investments concern life insurance contracts whose value or profit is determined by investments for which the policyholder carries the risk, i.e. the unit-linked or index-linked life insurance contracts. The investments in question are collected in asset pools, recognised at their current market value and kept separately from the remaining investments of the Com-pany. The policyholders are entitled to all income from these investments. The amount of the recognised investments strictly corresponds to the insurance provisions (before reinsurance business ceded) for life insurance, to the extent that the investment risk is borne by the policy-holders. The unrealised profits and losses from fluctuations in the current values of the invest-ment pools are thus offset by the appropriate changes in these provisions.
Non-derivative financial assets and liabilities – recognition and derecognition The Group recognises loans, receivables and issued debt securities from the date on which they arise. All other financial assets and liabilities are recognised for the first time on the trade date. The Group derecognises a financial asset when the contractual rights to cash flows from an asset expire or it transfers the rights to receive the cash flows in a transaction in which all major risks and opportunities connected with the ownership of the financial asset are transferred. Derec-ognition also occurs when the Group neither transfers nor retains all major risks and oppor-tunities connected with ownership and does not retain control over the transferred asset. Every share in such transferred financial assets that arise or remain in the Group is recognised as a separate asset or separate liability.
Financial liabilities are derecognised when the contractual obligation is fulfilled, extin-guished or expired.
Financial assets and liabilities are set off and recognised in net amounts in the statement of financial position if the Group has a legal right to set off the reported amounts against each other and intends either to settle on a net basis, or to realise the asset and settle the liability simultaneously.
Loans and receivables When first recognised, such assets are measured at their fair value plus directly attributable transaction costs. Subsequently, they are measured at amortised cost using the effective interest method.

61NOTES TO THE CONSOLIDATED FINANCIAL STATEMENTS
Cash and cash equivalents In the consolidated cash flow statement, cash and cash equivalents includes bank balances available upon demand, which are a central component of the management of the Group’s pay-ment transactions.
Available-for-sale financial assets Available-for-sale financial assets are initially measured at fair value plus directly attributable transaction costs. Subsequently, available-for-sale financial assets are measured at fair value and corresponding value changes are, with the exception of impairment and foreign exchange differences in the case of available-for-sale debt securities, recognised in other comprehensive income and in the revaluation reserve in equity. When an asset is derecognised, the accumulat-ed other comprehensive income is reclassified to profit or loss.
Non-derivative financial liabilities – measurement When first recognised, non-derivative financial liabilities are measured at fair value less directly attributable transaction costs. Subsequently, these financial liabilities are measured at amor-tised cost using the effective interest method.
11. Impairment Non-derivative financial assets Financial assets not designated as at fair value through profit or loss, including interests in entities accounted for using the equity method, are tested on every reporting date to determine whether there is any objective indication of impairment.
Objective indications that financial assets are impaired are: • The default or delay of a debtor, • The restructuring of an amount owed to the Group at conditions that the Group would other-
wise not consider, • Indications that a debtor or issuer will become insolvent, • Adverse changes in the payment status of borrowers or issuers, • The disappearance of an active market for a security, • Observable data that indicate a significant decrease in the expected payments from a group of
financial assets.
In the case of an investment in an equity instrument, a significant or prolonged decline in the fair value below its cost is also objective evidence of impairment. The Group considers a decline of 20 per cent as significant and a period of nine months as prolonged.

62 NOTES TO THE CONSOLIDATED FINANCIAL STATEMENTS
Financial assets measured at amortised cost The Group considers indications of impairment for these financial assets both at the level of the individual assets and collectively. All assets significant in themselves are tested for specific im-pairment. Those that prove not to be specifically impaired are then collectively tested for impair-ment that has occurred but not yet been identified. Assets not significant in themselves are collec-tively tested for impairment by pooling assets with similar risk characteristics in one group.
When testing for collective impairment, the Group uses historical information on the timing of payments and the value of the incurred losses, adjusted by a judgement on the part of the Management Board on whether the current economic conditions and credit conditions are such that the actual losses are probably higher or lower than the losses to be expected on the basis of historical trends.
Impairment is calculated as the difference between the carrying amount and the present value of the estimated future cash flows, discounted at the original effective interest rate of the asset. Losses are recognised in profit or loss. If the Group has no realistic hope of recovering the asset, the amounts are written off. If an event occurring after the recognition of impairment reduces the level of impairment, the reduction is recognised in profit or loss.
Available-for-sale financial assets Impairment of available-for-sale financial assets is recognised by reclassifying the losses accu-mulated in the revaluation reserve accumulated in equity to profit or loss. The accumulated loss that is reclassified from equity to profit or loss is the difference between the acquisition cost, net of any redemptions, and current fair value, less any impairment loss previously recognised in profit or loss. If the fair value of an impaired, available-for-sale debt instrument increases in a subsequent period and the increase can be objectively related to an event occurring after the impairment was recognised, the impairment is reversed, with the amount of the reversal recog-nised in profit or loss. In other cases, impairment reversal is recognised in other comprehensive income.
Associates accounted for using the equity method An impairment loss relating to an associate accounted for using the equity method is measured by comparing the recoverable amount of the shares with their carrying amount. An impairment loss is recognised in profit or loss. An impairment loss is reversed in the event of an advanta-geous change in the estimates used to determine the recoverable amount.

63NOTES TO THE CONSOLIDATED FINANCIAL STATEMENTS
Non-financial assets The carrying amounts of the Group’s non-financial assets – excluding inventories and deferred tax assets – are tested on every reporting date to determine whether there is an indication of impairment. If this is the case, the recoverable amount of the asset is estimated. The goodwill and intangible assets with indefinite useful lives are tested for impairment annually.
In order to test for impairment, assets are grouped into the smallest groups of assets whose continued use generates cash flows that are to the greatest possible extent independent of cash flows from other assets or cash-generating units (CGUs). Goodwill acquired in a business com-bination is allocated to the CGUs or groups of CGUs expected to benefit from the synergies of the combination.
The recoverable amount of an asset or a CGU is the higher of its value in use or its fair value less costs to sell. When calculating value in use, the estimated future cash flows are discounted to their present value, whereby a pre-tax discount rate is used that reflects current market as-sessments of the time value of money and the risks specific to the asset or CGU.
An impairment loss is recognised when the carrying amount of an asset or a CGU exceeds it recoverable amount.
Impairment losses are recognised in profit or loss. Impairment recognised for CGUs is first allocated to any goodwill allocated to the CGU and then allocated to the carrying amount of the other assets of the CGU (group of CGUs) on a proportional basis.
An impairment loss on goodwill is not reversed. In the case of other assets, an impairment loss is reversed only to the extent that it does not increase the carrying amount of the asset above the carrying amount that would have been determined net of depreciation or amortisa-tion had no impairment loss been recognised.
12. Other provisions The level of the provisions is calculated by discounting the expected future cash flows at a pre-tax interest rate that reflects current market assessments of the time value of money and the risks specific to the liability. The unwinding of the discount is recognised as a finance cost.
13. Determination of fair value A range of Group accounting policies and disclosures require the determination of the fair value of financial and non-financial assets and liabilities. The Group has defined a control framework with regard to the determination of fair value. This includes a measurement team, which bears general responsibility for monitoring all major measurements of fair value, including Level 3 fair values, and reports directly to the Management Board.

64 NOTES TO THE CONSOLIDATED FINANCIAL STATEMENTS
The measurement team carries out a regular review of the major unobservable input factors and the measurement adjustments. If information from third parties (e.g. price quotations from brokers or price information services) is used to determine fair values, the measurement team examines the evidence obtained from the third parties for the conclusion that such measure-ments meet the requirements of IFRS, including the level in the fair value hierarchy to which these measurements are attributable. Major items in the measurement are reported to the Audit Committee.
As far as possible, the Group uses data that are observable on the market when determining the fair value of an asset or a liability. On the basis of the input factors used in the valuation techniques, the fair values are assigned to different levels in the fair value hierarchy: • Level 1: Quoted prices (unadjusted) on active markets for identical assets and liabilities. • Level 2: Measurement parameters that are not quoted prices included in level 1 but which can
be observed for the asset or liability either directly (i.e. as a price) or indirectly (i.e. derived from prices).
• Level 3: Measurement parameters for assets or liabilities that are not based on observable market data.
If the input factors used to determine the fair value of an asset or a liability can be assigned to different levels of the fair value hierarchy, the entire fair value measurement is assigned to the level of the fair value hierarchy that corresponds to the lowest input factor significant for the measurement overall.
The Group recognises reclassifications between different levels of the fair value hierarchy at the end of the reporting period in which the change occurred.
Further information on the assumptions used in the determination of fair values is included in the following notes: • Note 3 –Investment property • Note 9 – Available-for-sale securities
14. Operating segments The Management Board of the UNIQA Insurance Group controls the Group based on the re-porting for the following five operating segments: • UNIQA Austria – this segment includes UNIQA Österreich Versicherungen AG, Salzburger
Landesversicherung AG and 50 per cent of FINANCE LIFE Lebensversicherung AG. • Raiffeisen Versicherung – this includes the remaining 50% of FINANCELIFE Lebensversi-
cherung AG together with Raiffeisen Versicherung AG. • UNIQA International – includes the Austrian holding companies UNIQA International AG
and UNIQA Internationale Beteiligungs-Verwaltungs GmbH in addition to all foreign insur-ance companies (with the exception of UNIQA RE). This segment is divided into the following main areas on a regional basis:
• Western Europe (WE – Switzerland, Italy and Liechtenstein) • Central Europe (CE – Czech Republic, Hungary, Poland and Slovakia)

65NOTES TO THE CONSOLIDATED FINANCIAL STATEMENTS
• Eastern Europe (EE – Romania and Ukraine) • Southeastern Europe (SEE – Albania, Bosnia and Herzegovina, Bulgaria, Croatia, Monte-
negro, Macedonia, Serbia and Kosovo) • Russia (RU) • Administration (the Austrian holding companies)
• Reinsurance – includes UNIQA Re (Switzerland) and the reinsurance company of UNIQA Insurance Group AG
• Group functions and consolidation – this segment includes the remaining items for UNIQA Insurance Group AG (investment result and administrative costs) as well as all other remain-ing Austrian and foreign service companies.
CHANGES IN MAJOR ACCOUNTING POLICIES
With the exception of the following changes, the Group applied the accounting policies outlined consistently to all periods presented in these consolidated financial statements.
The Group applied the following new standards and amendments to standards, including all of the following amendments to other standards, with these first being applied as of 1 January 2014.
IFRS 10 Consolidated Financial Statements IFRS 11 Joint Arrangements IFRS 10-12 Transition Guidance - Amendment to IFRS 10-12 IFRS 10, 12 Investment Entities - Amendment to IFRS 10, 12 and IAS 27IFRS 12 Disclosures of Interests in Other Entities IAS 27 Separate Financial Statements (2011) IAS 28 Investments in Associates and Joint Ventures (2011)IAS 32 Offsetting Financial Assets and Financial Liabilities - Amendments to IAS 32IAS 39 Novation of Derivatives and Continuation of Hedge Accounting (Amendment)IFRIC 21 Levies
Application of these new mandatory IFRSs has the following impact on the financial state-ments:
Control IFRS 10 “Consolidated financial statements” is based on the existing definition of control in terms of controlling subsidiaries to determine whether a company is to be included in the par-ent company’s consolidated financial statements. The standard includes a series of additional features and application guidelines in complex cases in order to determine whether there is control.
The Group’s basis of consolidation has not changed even under the new control model.
Joint Arrangements In the assessment as to whether there is joint management, IFRS 11 “Joint Arrangements” fo-cuses on the parties’ actual rights and obligations in relation to the entities involved. IFRS 11 makes a distinction between two types of joint arrangements: joint operations and joint ven-tures. Joint operations are provided if the shareholders acquire rights to the assets and obliga-tions for the liabilities under the joint arrangement. A shareholder accounts for their share in the assets, liabilities, sales revenues and expenses managed jointly. In contrast, joint ventures

66 NOTES TO THE CONSOLIDATED FINANCIAL STATEMENTS
are provided if the shareholder has rights to the net assets in the joint arrangement. Joint ven-tures are accounted for at equity
The Group does not currently have any joint arrangements to which IFRS 11 applies.
Disclosure of Interests in Other Entities IFRS 12 “Disclosure of Interests in Other Entities” consolidates the revised disclosure obliga-tions related to IAS 27, IFRS 10, IAS 31 and/or IFRS 11 and IAS 28 into one standard, including structured entities and other off-balance-sheet constructions.
Additional disclosures have been made based on the new application of IFRS 12 “Disclosure of Interests in Other Entities”, essentially for associates (Table 7).
Any other new mandatory IFRSs were either inapplicable for the Group or had no material impact on it.
NEW STANDARDS AND INTERPRETATIONS WHICH HAVE NOT YET BEEN APPLIED
A series of new standards, amendments to standards and interpretations were due to be applied for the first time in the first reporting period of a financial year starting after 1 January 2014 and were not applied in preparing these consolidated financial statements. Those which could be relevant for the Group are outlined below. The Group does not intend to early apply these standards.
IFRS 9 Financial Instruments not yet adopted by the EU IFRS 14 Regulatory Deferral Accounts not yet adopted by the EU IFRS 15 Revenue Recognition not yet adopted by the EU IFRS 9 “Financial Instruments” is deals with the classification, recognition and measurement of financial assets and financial liabilities. The full version of IFRS 9 was published in July 2014. This standard replaces the regulations of those sections of the existing IAS 39 that address the classification and measurement of financial instruments. IFRS 9 adheres to a mixed measure-ment model, but it simplifies this and sets out three principal measurement categories for fi-nancial assets: measurement at amortised cost, measurement at fair value with value fluctua-tions recognised in profit and loss (fair value through profit and loss) and measurement at fair value with value fluctuations recognised in other comprehensive income (fair value through OCI). The classification depends directly on the company’s business model as well as on the features of the contractually agreed payment flows for the financial assets. Shares of equity instruments must be measured at fair value, with fluctuations in fair value recognised in profit and loss, or with fluctuations in fair value recognised in other comprehensive income if the company irrevocably opts to do so upon first-time recognition of the equity instruments (with no subsequent reclassification in net profit for the year). There is also a new measurement model for impairments based on expected losses (expected credit losses model) which replaces the existing measurement model of actual losses incurred that was used in IAS 39 (incurred loss model). With financial liabilities there are no changes in the classification and measurement, with the exception of mandatory reporting of own creditworthiness risk in other comprehen-sive income for financial liabilities designated at fair value and recognised in profit and loss. IFRS 9 eases the requirements in relation to hedging effectiveness by removing the previous narrow limits of hedging effectiveness. There is now a requirement for an economic relation-

67NOTES TO THE CONSOLIDATED FINANCIAL STATEMENTS
ship between the underlying transaction and the hedging instrument, and also that the hedged part (hedged ratio) corresponds with the assumptions and conditions with which the Company manages the items as part of its risk management activities. Furthermore, hedging documenta-tion must be prepared as currently prescribed, whereby it will differ from the documentation required under IAS 39. The standard applies to reporting periods beginning on or after 1 January 2018. Earlier application is permitted. The Group is currently ascertaining the impact of IFRS 9.
IFRS 15 “Revenue from Contracts with Customers” governs revenue recognition and sets out the basic principles for reporting of meaningful information on the type, amount, recogni-tion date and uncertainties regarding revenues and payment flows from contracts with custom-ers. Sales revenues are recorded if a customer has control over a delivered item or a service provided and has the ability to enjoy these goods and services and derive benefits from them. The standard replaces IAS 18 “Revenue” and IAS 11 “Construction Contracts” and the associated interpretations. The standard applies to reporting periods beginning on or after 1 January 2017. The Group is currently ascertaining the impact of IFRS 15.
There are no other standards or IFRIC interpretations that will have a material impact on UNIQA’s consolidated financial statements from a current perspective.
USE OF DISCRETIONARY DECISIONS AND ESTIMATES
The consolidated financial statements require the Management Board to make discretionary decisions, estimates and assumptions that relate to the application of accounting policies and the amounts stated for the assets, liabilities, income and expenses. Actual results may differ from these estimates. Estimates and their underlying assumptions are reviewed on an ongoing basis. Revisions to estimates are recorded prospectively.
The items below carry a not insignificant level of risk that significant adjustments to assets or liabilities may be necessary in the following year: • Deferred acquisition costs • Goodwill • Shares in associates/investments – insofar as the valuation does not take place based on stock
exchange prices or other market prices • Technical provisions • Provisions for pensions and similar obligations
Sensitivity analyses are shown in the Risk report in relation to the most significant uncertain-ties surrounding estimates.
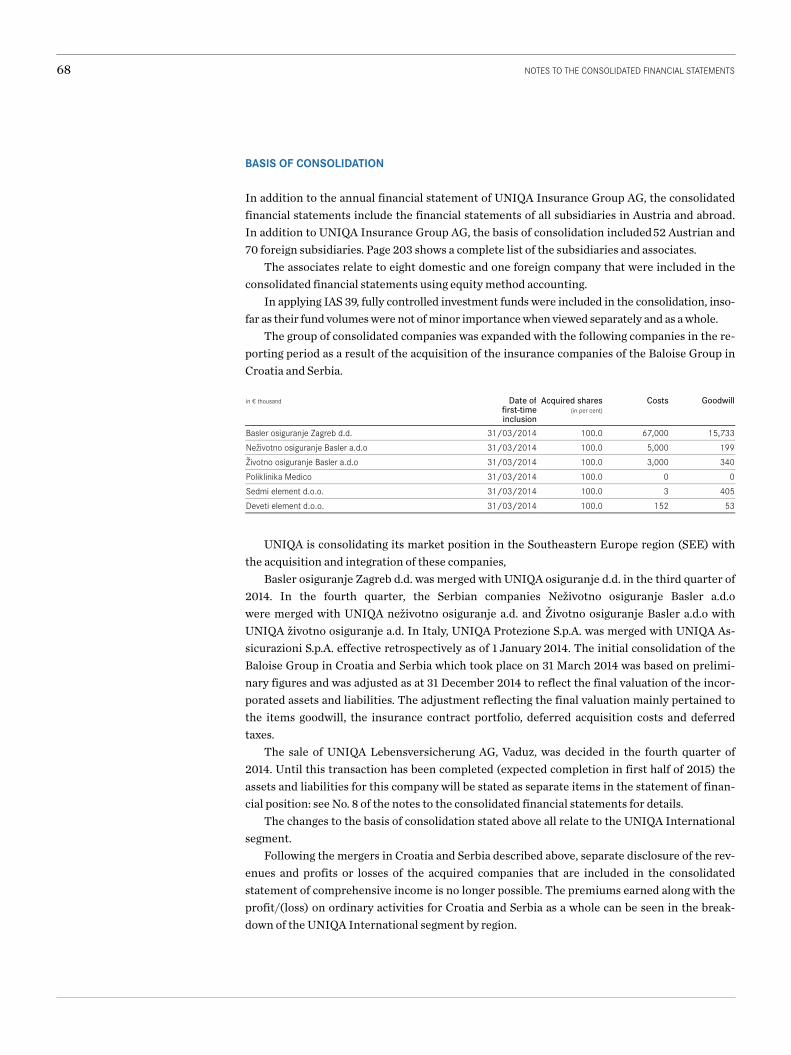
68 NOTES TO THE CONSOLIDATED FINANCIAL STATEMENTS
BASIS OF CONSOLIDATION
In addition to the annual financial statement of UNIQA Insurance Group AG, the consolidated financial statements include the financial statements of all subsidiaries in Austria and abroad. In addition to UNIQA Insurance Group AG, the basis of consolidation included 52 Austrian and 70 foreign subsidiaries. Page 203 shows a complete list of the subsidiaries and associates.
The associates relate to eight domestic and one foreign company that were included in the consolidated financial statements using equity method accounting.
In applying IAS 39, fully controlled investment funds were included in the consolidation, inso-far as their fund volumes were not of minor importance when viewed separately and as a whole.
The group of consolidated companies was expanded with the following companies in the re-porting period as a result of the acquisition of the insurance companies of the Baloise Group in Croatia and Serbia.
in € thousand Date offirst-timeinclusion
Acquired shares (in per cent)
Costs Goodwill
Basler osiguranje Zagreb d.d. 31/03/2014 100.0 67,000 15,733Neživotno osiguranje Basler a.d.o 31/03/2014 100.0 5,000 199Životno osiguranje Basler a.d.o 31/03/2014 100.0 3,000 340Poliklinika Medico 31/03/2014 100.0 0 0Sedmi element d.o.o. 31/03/2014 100.0 3 405Deveti element d.o.o. 31/03/2014 100.0 152 53
UNIQA is consolidating its market position in the Southeastern Europe region (SEE) with
the acquisition and integration of these companies, Basler osiguranje Zagreb d.d. was merged with UNIQA osiguranje d.d. in the third quarter of
2014. In the fourth quarter, the Serbian companies Neživotno osiguranje Basler a.d.o were merged with UNIQA neživotno osiguranje a.d. and Životno osiguranje Basler a.d.o with UNIQA životno osiguranje a.d. In Italy, UNIQA Protezione S.p.A. was merged with UNIQA As-sicurazioni S.p.A. effective retrospectively as of 1 January 2014. The initial consolidation of the Baloise Group in Croatia and Serbia which took place on 31 March 2014 was based on prelimi-nary figures and was adjusted as at 31 December 2014 to reflect the final valuation of the incor-porated assets and liabilities. The adjustment reflecting the final valuation mainly pertained to the items goodwill, the insurance contract portfolio, deferred acquisition costs and deferred taxes.
The sale of UNIQA Lebensversicherung AG, Vaduz, was decided in the fourth quarter of 2014. Until this transaction has been completed (expected completion in first half of 2015) the assets and liabilities for this company will be stated as separate items in the statement of finan-cial position: see No. 8 of the notes to the consolidated financial statements for details.
The changes to the basis of consolidation stated above all relate to the UNIQA International segment.
Following the mergers in Croatia and Serbia described above, separate disclosure of the rev-enues and profits or losses of the acquired companies that are included in the consolidated statement of comprehensive income is no longer possible. The premiums earned along with the profit/(loss) on ordinary activities for Croatia and Serbia as a whole can be seen in the break-down of the UNIQA International segment by region.

69NOTES TO THE CONSOLIDATED FINANCIAL STATEMENTS
RISK REPORT
1. Risk strategy Principles We have set ourselves ambitious goals in connection with our corporate strategy UNIQA 2.0. In summary, we are working towards sustainable and profitable growth. We are taking the initia-tive, optimising processes and building on innovations. We are doing this in order keep the promises we made to our customers, our shareholders and our employees. In addition, we make sure we have a business strategy that knows the right answer to all of our Company's risks. The Management Board has therefore adopted a risk strategy borne by four principles: • We know our responsibility • We know our risk • We know our capacity to take on risk • We know our opportunities
With these four principles, we will move confidently into the future and maintain a financial strength that allows us to achieve our corporate goals, keep our promises and fulfil our obliga-tions even in turbulent times. Organisation Our core business is to relieve our customers of risk, pool the risk to reduce it, and thereby gen-erate profit for our Company. At the heart of this business is an understanding of risks and their specific attributes.
In order to ensure that we keep our focus on risk, we have created a separate risk function in the Group's Management Board with a Group Chief Risk Officer and made the function of Chief Risk Officer a part of the Management Board in our regional companies. This ensures that decision-making is risk-based in all relevant bodies. We have established processes that allow us to identify, analyse and manage risks. Our business involves a large range of different risk types, so we employ specialists to identify and manage them.
We regularly validate our risk profile at all levels of the hierarchy and hold discussions in specially instituted committees with the members of the Management Board. We draw on in-ternal and external sources to obtain a complete picture of our risk position. We regularly check for new threats both in the Group and in our subsidiaries.
Risk-bearing capacity and risk appetite We take risks and do so in full knowledge of our risk-bearing capacity. We define risk-bearing capacity as our ability to absorb potential losses from extreme events so that our medium- and long-term objectives are not put in danger.
Our risk decisions centre on our economic capital model (ECM), which we use to quantify risk and determine economic capital. The ECM is based on the standard model according to Solvency II and also reflects our own risk assessment. This is expressed in the quantification of the risks from the non-life sectors, in which we focus on a stochastic cash flow model, additional capital requirements of government bonds and a mark-to-market valuation of asset-backed securities. Based on this model, we are aiming in the medium term for risk capital cover (capital ratio) of 150–160 per cent in 2015. In the medium term, the capital ratio should be at least 170 per cent.

NOTES TO THE CONSOLIDATED FINANCIAL STATEMENTS70
We also seek external confirmation of the path we have chosen. Standard & Poor´s has given us a credit rating of A–. One of our key objectives is to maintain the rating at least at this level and to improve it over the long term as the corporate strategy is implemented.
Non-quantifiable risks, in particular operational risk, litigation risk and strategic risk are identified as part of the risk assessment process and then assessed using scenario-based tech-niques. This assessment is then used as the basis for implementing any necessary risk mitiga-tion measures.
Our risk strategy specifies the risks we intend to assume and those we plan to avoid. As part of our strategy process, we define our risk appetite on the basis of our risk-bearing capacity. This risk appetite is then used to determine tolerances and operational limits, which provide us with an early warning system sufficient for us to initiate prompt corrective action should we deviate from our targets. We also consider risks outside our defined appetite. We counter risks that fall into this category, such as reputational risk, with proactive measures, transparency and careful assessment.
We focus on risks that we understand and can actively manage. We divest ourselves of any investments in which the business principles are inconsistent with our core business. We con-sciously take on risk associated with life, health and non-life underwriting in order to consist-ently generate our income from our core business. We aim for a balanced mix of risk to achieve the greatest possible effect from diversification.
We analyse our income and the underlying risk, optimizing our portfolio using value-based principles. We therefore strive for a balance between risk and return.
Opportunities Risk also means opportunity. We regularly analyse trends, risks and phenomena that influence our society and thus our customers and ourselves. We involve our employees in the whole of the business to identify and analyse trends at an early stage, produce suitable action plans and de-velop innovative approaches.
2. Risk management system The focus of risk management with management structures and defined processes is the at-tainment of the strategic goals of the UNIQA Group and its subsidiaries.
The UNIQA Group's Risk Management Guidelines form the basis for a uniform standard at various company levels. The guidelines are approved by the Group CRO and the full Manage-ment Board and describe the minimum requirements in terms of organisational structure and process structure. They also provide a framework for all risk management processes for the most important risk categories.

71NOTES TO THE CONSOLIDATED FINANCIAL STATEMENTS
In addition to the Group Risk Management Guidelines, similar guidelines have also been prepared and approved for the Company's subsidiaries. The Risk Management Guidelines at subsidiary level were approved by the Management Board of the UNIQA subsidiaries and are consistent with the UNIQA Group Risk Management Guidelines.
They aim to ensure that risks relevant to the UNIQA Group are identified in advance and evaluated. If necessary, proactive measures are introduced to transfer or minimise the risk.
Intensive training on the content and utilisation of these guidelines is required in order to ensure that risk management is incorporated in everyday business activities. Very extensive informative and training measures have therefore been taken since 2012; they will be continued in the future and extended to additional target groups.
2.1. Organisational structure (governance) The detailed set-up of the process and organisational structure of risk management is set out in the UNIQA Group's Risk Management Guidelines. These reflect the principles embodied in the concept of “three lines of defence” and the clear differences between the individual lines of defence.
First line of defence: risk management within the business activity Those responsible for business activities must develop and put into practice an appropriate risk control environment to identify and monitor the risks that arise in connection with the busi-ness and processes.
Second line of defence: supervisory functions including risk management functions The risk management function and the supervisory functions, such as managerial accounting and financial control, must monitor business activities without encroaching on operational activities.
Third line of defence: internal and external auditing This enables an independent review of the formation and effectiveness of the entire internal control system, which comprises risk management and compliance (e.g. internal auditing).

NOTES TO THE CONSOLIDATED FINANCIAL STATEMENTS72
UNIQA Holding Management Board• Active risk management and controlling through value-orientated principles • Approves the UNIQA risk management strategy• Approves the risk limit for operating companies • Highest authority for decisions regarding risk transfer and mitigation
UNIQA Holding CRO1)
• Functional management of the UNIQA risk management unit • Chair of the UNIQA Risk Management Committee • Responsible for shaping the risk management strategy• Monitors the overall risk situation • Appropriate structures for risk management and reporting
Group Risk Committee• Defi nes the risk management strategy • Prepares and monitors risk-bearing capacity and risk limits and the “value-creating units” in the Group • Defi nes capital allocation and sets coherent limits • Approves the model change (capital model, partial models)
Group Risk Management Functions • Defi nes the UNIQA risk management process • Conducts the uniform risk management process • Coordinates the calculation of solvency capital requirements and minimum capital requirements • Defi nes minimum standards for all risk management processes • Ensures the eff ective and timely reporting of risk management information• Prepares and monitors risk limits for the company
Operating Companies (CRO, RM)• Conducts the uniform UNIQA BU risk management process in accordance with Group standards • Prepares and maintains minimum standards for the specifi c risk management processes for all risk categories • Prepares and monitors risk limits • Monitors overall risk management performance and ensures eff ective and timely reporting
1) Beginning 1 January 2015 in an interlocking directorate together with the CFO
UNIQA Holding Management Board
UNIQA Holding CRO
Group Risk Committee
Group Actuarial & Risk Management
Local Risk Committees
Operating Company (CRO, RM)
Management Board and Group functions The UNIQA Group Management Board is responsible for establishing the business policy ob-jectives and determining the associated risk strategy. The core components of the risk manage-ment system and the associated governance are embedded in the UNIQA Group Risk Manage-ment Policy adopted by the Management Board.

73NOTES TO THE CONSOLIDATED FINANCIAL STATEMENTS
The function of Chief Risk Officer (CRO) is a separate area of responsibility at the Group Management Board level. This ensures that risk management is represented on the Manage-ment Board. The CRO is supported in the implementation and fulfilment of risk management duties by the following units: Group Risk Management, Group Actuarial and Group Financial Risk Management. During the course of 2015, refinements in the organisational structure will lead to a merger of these units so that the Company can progress as efficiently as possible in the final implementation phase of Solvency II.
A central component of the risk management organisation is the risk management commit-tee for the UNIQA Group. This committee carries out monitoring and initiates appropriate action in relation to the current development as well as the short- and long-term management of the risk profile. The risk management committee establishes the risk strategy, monitors and controls compliance with risk-bearing capacity and limits, and therefore plays a central role in the management process implemented under the UNIQA Group's risk management system.
Operative insurance companies In the operative insurance companies, the CRO function has also been established at the Man-agement Board level, with the functions of the risk manager at the next level down. A consistent, uniform risk management system has therefore been set up throughout the Group.
As at Group level, each of the operative insurance companies has its own risk management committee, which forms a central element of the risk management organisation. This commit-tee is responsible for the management of the risk profile and the associated specification and monitoring of risk-bearing capacity and limits.
At its meetings, the Supervisory Board of the UNIQA Group receives comprehensive risk re-ports.
2.2. Risk management process The UNIQA Group's risk management process delivers periodic information about the risk profile and enables the top management to make the decisions for the long-term achievement of objectives.
The process concentrates on risks relevant to the Company and is defined for the following risk categories: • Actuarial risk (property and casualty insurance, health and life insurance) • Market risk/Asset-Liability Management risk (ALM risk) • Credit risk/default risk • Liquidity risk • Concentration risk • Strategic risk • Reputational risk • Operational risk • Contagion risk
A Group-wide, standardised risk management process regularly identifies, evaluates and re-ports on risks to the UNIQA Group and its subsidiaries within these risk categories.

NOTES TO THE CONSOLIDATED FINANCIAL STATEMENTS74
UNIQA Group – risk management
process
Analysis, evaluation,
measurement
Monitoring, control
Establish and identify
context
Reporting
Limits, early warning
indicators
Risk management process in the UNIQA Group
Risk identification: Risk identification is the starting point for the risk management process, systematically record-ing all major risks and describing them in as much detail as possible. In order to conduct as complete a risk identification as possible, different approaches are used in parallel, and all risk categories, subsidiaries, processes and systems are included.
Evaluation/measurement: The risk categories of market risk, actuarial risk, counterparty default risk and concentration risk are evaluated in the UNIQA Group framework by means of a quantitative method based on the standard approach of Solvency II and the ECM approach (economic capital model) ap-proach. Furthermore, risk drivers are identified for the results from the standard approach and analysed to assess whether the risk situation is adequately represented (in accordance with ORSA).
All other risk categories are evaluated quantitatively or qualitatively with their own risk scenarios.
Scenario analysis in UNIQA risk management: One essential element of the risk management process is the derivation and development of risk scenarios based on the economic, internal and external risk situation of the UNIQA Group.
A scenario is a possible internal or external event that has a short-term or medium-term effect on consolidated profit or loss, the solvency position or sustainability. The scenario is formulated with respect to its inherent characteristic (e.g. the start of Greece's insolvency) and evaluated in terms of its financial effect on the UNIQA Group. The likelihood that the scenario will actually occur is also considered.

75NOTES TO THE CONSOLIDATED FINANCIAL STATEMENTS
Limits/early warning indicators: The limit and early warning system determines risk-bearing capacity (available equity accord-ing to IFRS, financial equity) and capital requirements on the basis of the risk situation at ongo-ing intervals, thereby deriving the level of coverage. If critical coverage thresholds are reached, then a precisely defined process is set in motion, the aim of which is to bring the level of solven-cy coverage back to a non-critical level.
Reporting: A risk report is prepared twice a year for each operational company and for the UNIQA Group on the basis of detailed risk analysis and monitoring. The risk report for each individual UNIQA subsidiary and the UNIQA Group itself has the same structure, providing an overview of major risk indicators such as risk-bearing capacity, solvency requirements and risk profile. A reporting form is also available for the UNIQA Group and all subsidiaries, which provides the manage-ment with a monthly update regarding the most significant risks. 2.3. Activities and objectives in 2014 Based on external and internal developments, activities in 2014 focused on the following: • Preparation work for the implementation of Solvency II • Further development and implementation of the liability-driven ALM approach
Preparation work for the implementation of Solvency II Solvency II is an EU-wide project, the objective of which is to achieve a fundamental reform of solvency regulations (capital requirements) for insurance companies. The existing static system for determining capital requirements is to be superseded by a risk-based system. One of the main changes in the new system is that it is to take greater account of qualitative elements such as internal risk management.
Following publication of the preparation guidelines by the European Insurance and Occu-pational Pensions Authority (EIOPA) in October 2013 and the implementation of these guide-lines in the Austrian Insurance Supervision Act (VAG) of June 2014, there is now clarity regard-ing the necessary preparation work required before Solvency II comes into force on 1 January 2016. The following topics are addressed in the preparation guidelines: • Requirements for the risk management system1) • Assessment of the entity-specific risk2) • Requirements for the reporting system3) • Pre-application for internal models4)
1) “System of governance” (EIOPA-CP-13/008), 2) “Forward-looking assessment of the undertaking’s own risks (based on the own risk and solvency assessment (ORSA) principles” (EIOPA-CP-13/009), 3) “Submission of information to national competent authorities” (EIOPA-CP-13/010), 4) “Pre-application for internal models” (EIOPA-CP-13/011)
NOTES TO THE CONSOLIDATED FINANCIAL STATEMENTS76
In 2014, further specific preparatory steps were taken both in the UNIQA Group and in the operating units based on this information. The steps primarily consisted of modifications to the governance structure to satisfy the requirements for key functions under Solvency II, the prep-aration of an initial ORSA report (Own Risk and Solvency Assessment), which was submitted for information to the Supervisory Board in November 2014, and the preparation of the infrastruc-ture to meet future reporting requirements. A significant portion of the preparatory work was also accounted for by the activities related to the partial internal model in connection with the actuarial risk arising from property/casualty insurance.
In addition, a comprehensive training programme for senior managers, other managers, and employees in key functions is a core component of a fully functioning Group-wide risk man-agement framework. Understanding of the objectives and the impact of the risk management approach in the context of value-based management should be achieved. A great deal of im-portance is also attached to training the Supervisory Board of the UNIQA Group so that the members of the Supervisory Board are well informed about the ongoing developments in the management approach (economic management) and can take these developments into account with respect to their supervisory activities.
In both cases, the discussion about the use of the information from the risk capital models, in particular from the partial internal model relating to property/casualty insurance, is a rele-vant point, allowing users to make the connection between this information and the ongoing business.
Further development and implementation of the liability-driven ALM approach In 2014, further development work was carried out on the ALM processes and associated gov-ernance developed over the last few years. The priority was on stabilising the processes that have been introduced and on implementing a project to gradually reduce the AL mismatch, especially in life insurance.
The option of running a regular/year-round procedure to draw up the risk profile and asso-ciated limits represents a key element of the ALM process in the UNIQA Group. Management is carried out on the basis of risk capital consumption and associated limits, which enables the Group to make strategic decisions on the basis of a value-based risk/return analysis.
In 2014, the Group focused not only on the necessary standard processes but also on scenar-io analyses, especially the possible changes in the liabilities profile depending on different in-terest rate situations. In this case, the analysis of the life insurance business plays a central role because it is difficult to predict a change in the lapse or surrender pattern for customer policies in response to a specific trend in interest rates. Associated risks were analysed and action im-plemented to cushion these risks.
3. Challenges and priorities in risk management for 2015 Challenges The period of low interest rates continued throughout 2014, with rates falling to historically low levels in some cases. This situation has a particularly marked effect in life insurance. Depending on the investment strategy, the persistently low interest rates can lead to a situation in which the income generated is insufficient to finance the guarantees made to policyholders. The topic of low interest rates continues to be of concern to the entire European insurance industry and is leading to intensive discussions about how insurance companies can ensure that customer options and guarantees (in both existing and new business) are financed over the long term.

77NOTES TO THE CONSOLIDATED FINANCIAL STATEMENTS
Significant measures taken by the UNIQA Group within the defined life strategy have been to focus on implementing the ALM approach including stringent management rules (e.g. regard-ing the management of profit sharing) and to provide continuous portfolio management to support the new business strategy in the personal injury insurance business.
One specific issue is the question of requirements (which vary from country to country) to recognise supplementary discount rate provisions, i.e. requirements to set aside special provi-sions in the respective local accounting if interest rates are low. As at 31 December 2014, UNIQA had set aside a provision in the amount of €34.1 million in its Austrian companies because there is a statutory requirement in Austria to recognise this special provision. As the supplementary discount rate provision is to be built up over a period of 10 years in Austria, corresponding ex-penses are to be expected (in local accounting) over the coming years. This special provision in the local accounting is to be seen alongside the liability adequacy test (LAT) to check whether the provisions in the IFRS financial statements are adequate. Depending on the interest rate situation and the resulting planning of investment income, there is the fundamental risk in the future of a potential provision requirement as a consequence of the LAT.
With regard to the insurance market in CEE countries, the expected economic situation in the Eastern European markets poses a certain challenge to the Group to achieve disproportion-ately high growth in the short term and compared to the Western European insurance markets. For example, the Group was unable to record any premium growth in this region in 2014. The premium volume for the entire region contracted, mainly in the life insurance business, alt-hough this also continued to be attributable to a sharp drop in single premium business in Poland and a deliberate reduction in the volume of motor vehicle insurance in selected markets. Given this disappointing trend in the past year, expectations of higher premium revenue in 2015 remain moderate.
The continued political uncertainty in Ukraine caused by the separatist movement in the east of the country raises questions about whether the country will be able to go on servicing some of its borrowing. As at 31 December 2014, the UNIQA Group’s portfolio of Ukrainian gov-ernment bonds came to a nominal value of €34.1 million and a fair value of €25.2 million. Of these, a nominal value of €30.1 million are invested in the Ukrainian subsidiary.
The Ukrainian currency, the hryvnia (UAH), weakened by approximately 41 per cent against the euro during the course of 2014 (exchange rate as at 31 December 2014: 0.0523; as at 31 December 2013: 0.088). The total value of all the UAH securities in the UNIQA Group amounts to a fair value of €4.0 million.
Together with the fall in the price of oil in December 2014, the EU sanctions imposed on Russia caused an immediate and sharp drop in the value of the rouble against the euro (ex-change rate as at 31 December 2014: 0.0142, as at 31 December 2013: 0.0221). In turn, this led to a volatile interest rate environment and the devaluation of government bonds. The total value of all the RUB securities in the UNIQA Group amounts to a fair value of €47.9 million, of which €37.7 million are invested in the Russian subsidiary. The nominal value of Russian government bonds in the UNIQA Group’s portfolio amounts to €123.0 million (of which €55.7 million in the Russian subsidiary), with a fair value of €102.3 million.
In terms of actuarial risk, the further development of the motor business in CEE countries (comprehensive vehicle insurance, including liability insurance) continues to represent the greatest challenge because this business segment accounts for a considerable proportion of the property/casualty insurance in the CEE region. The most significant difficulties are, firstly, that there is a continuously changing legal environment leading to higher benefit payments in the

NOTES TO THE CONSOLIDATED FINANCIAL STATEMENTS78
event of personal injury claims and, secondly, that many markets are still subject to a price war as companies vie to win customer segments. UNIQA increasingly relies on a professional pricing approach. In addition to conducting ongoing market analyses, the Group carries out standard-ised profitability tests to ensure that pricing is appropriate. In addition, guidelines are intended to ensure that international insurance claims (known as green card claims) are settled within UNIQA affiliated companies or in conjunction with specified partners.
After the Solvency II Directive (Directive 2009/138/EC) has been implemented into Austrian law with the Insurance Supervision Act 2016, which is a complete revision of the exist-ing Austrian legislation, new versions of all existing regulations will also be enacted. One of the main challenges in 2015 will be to provide detailed support for this process. The new Insurance Supervision Act was published in the Austrian Federal Gazette on 20 February 2015 and will come into force on 1 January 2016.
The preparatory work in connection with Solvency II is closely associated with the Insurance Supervision Act 2016. In addition to the new reporting obligations, the biggest chal-lenge in this preparatory work is the project being undertaken by the UNIQA Group to promptly apply for a partial internal model relating to property/casualty insurance. This project is subject to a very narrow timeframe because of the late publication of the regulatory requirements. Suf-ficient resources must therefore be dedicated to the project to enable the Group to submit an approval application in a timely manner.
As regards operational risk, there is a need for some capital investment in the renewal of IT infrastructure and systems. In the short- and medium terms, the Group is faced in numerous instances with a switch between generations of technologies to enable it to maintain the proper operation of the business and respond to changing customer and market expectations.
A strategic question for 2015 is how to proceed with the handling of the changing circum-stances in CEE countries in relation to associated partners. In February 2015, UNIQA's key partner in international banking sales (Raiffeisen Bank International) announced its intention to withdraw from the Polish and Slovenian markets. Even though the impact is immaterial be-cause the business involved represents a small proportion of the Group's overall business, there remains the issue of the subsequent strategic direction of bank sales in these markets. Another ongoing challenge is the question of reputational risk. This is the risk of an unexpected adverse change in enterprise value caused by damage to UNIQA's reputation. The identification of repu-tational risk is an important part of the risk management process. These risks are discussed in the quarterly committee meetings and the Management Board initiates appropriate corrective action. A risk assessment in accordance with a risk map, i.e. a presentation of the key risks faced by the UNIQA Group across all risk classes, is also presented for information purposes to the Supervisory Board.

79NOTES TO THE CONSOLIDATED FINANCIAL STATEMENTS
Priorities As in the past year, further preparatory work relating to Solvency II will continue to have a very high priority in 2015. In accordance with the transition guidelines that have been put in place (section 130c of the Insurance Supervision Act), the Group will have to meet a range of first-time reporting obligations to the supervisory authorities in 2015. Quantitative information in connection with the solvency calculation and also qualitative information, particularly in rela-tion to governance requirements, must be prepared at Group level by mid-July 2015. In addition, we will continue to expand our partial internal model as part of the advance approval process and adapt processes and models in line with the evolving Solvency II standards. The forward-looking own risk and solvency assessment (ORSA) also forms a core component of the prepara-tion for Solvency II. Whereas the ORSA requirements in 2014 were focused on the assessment of the overall solvency requirement, further elements will be added in 2015 to facilitate the presentation of a complete picture of the risk assessment: Firstly, an in-depth analysis of the extent to which the solvency requirements and technical provisions are satisfied on an ongoing basis; secondly, a review to establish whether the calculation used for the solvency capital re-quirement appropriately reflects the risk profile of the Company.
Further developments at UNIQA in connection with value-based management are also closely linked to the implementation of Solvency II. In the future, capital management and also the planning of estimated income will be extensively based on the risk capital position in the Group, the individual operating units and their areas of business. We have set ourselves the objective of achieving a transparent presentation of our approach to capital, the most signifi-cant risks and related stress, the associated target returns and an appropriate dividend policy. From the starting point of a defined risk-bearing capacity, the target returns are to be selected such that the return on risk capital permanently exceeds the cost of capital, ensuring ongoing dividend payments, while at the same time not jeopardising risk-bearing capacity.
A further priority for 2015 is to continue the strategic programmes relating to cost manage-ment, the further development of the life insurance strategy, including portfolio management (in-force management), capital investment from an ALM perspective and the associated inter-nal processes. The use of the latest standards in underwriting the risk in the property and casu-alty insurance business, primarily in connection with international insurance claims (green card insurance), is another area of focus. All programmes are to make a contribution to enable the Group to achieve the planned profits in 2015 and sustain this level in the years ahead. Par-ticularly in this period of low interest rates and significant volatility in capital markets, the successful implementation of projects that stabilise or improve net profit in the core operating business is central to our activities.
In life insurance, another important milestone was achieved in the area of new product de-sign in December 2014. At UNIQA Österreich and Raiffeisen Versicherung AG, the lowering of the maximum permissible discount rate (as of 1 January 2015 to 1.50 per cent) was used to com-pletely revise the products in the classic life insurance line, and give them a new title: “New Classic”. The “New Classic” will give customers a 100 per cent capital guarantee on net pre-miums, high repurchase values from the beginning, along with the possibility of making variable additional payments and withdrawals during the term. In addition, costs and fees are spread out proportionally over the entire term and no longer taken from the premium but rather from the profit. The entire premium amount (excl. insurance tax) thus flows directly into the investment, resulting in a considerably higher savings premium from the beginning than is offered by con-
NOTES TO THE CONSOLIDATED FINANCIAL STATEMENTS80
ventional life insurance. This means the product offers customers much more transparency and flexibility.
From the Company’s point of view, this product concept has the advantage that, among other things, the discount rate is set at 0 per cent, which leads, in particular on longer terms, to a reduction of the guarantee requirement. In addition, this new product concept also meets the future legal requirements concerning transparency and capital adequacy. The sales success in the first three months after the launch of this product are impressive proof that the concept has been understood and accepted by both customers and the sales people. The successful position-ing of the product on the Austrian market and the transfer of the ideas on which it is based into other markets are a priority for 2015 – at the same time offering the opportunity to make life insurance future-oriented.
4. Capitalisation On the basis of the current regulatory requirements, available own funds and the risk capital requirement are calculated in accordance with Solvency I.
When Solvency II comes into force, the definitions and methods used to calculate available own funds as well as capital requirements and management standards will be replaced by Solvency II standards.
As at 31 December 2014, the solvency ratio on the basis of the regulatory provisions was 295.4 per cent. Eligible equity amounted to €3,442.2 million; which included eligible subor-dinated liabilities of €250.0 million up to half of the equity requirement and eligible subordin-ated liabilities of €286.5 million up to a quarter of the equity requirement. The solvency re-quirement is €1,165.2 million.
4.1. Statutory requirements Risk capital requirements and available equity are currently calculated according to Solvency I regulations. These will be replaced when the Solvency II provisions take effect. In order to guarantee a smooth transition between these two different calculation methods, the UNIQA Group has performed parallel calculations since 2008. One consequence of these efforts is an early Group-wide introduction of the new methods and processes. Gaps and shortcomings will thus be identified early and promptly rectified.
4.2. Internal capital adequacy The UNIQA Group defines its risk appetite on the basis of an economic capital model (ECM). The cover for quantifiable risks with eligible own funds (capital ratio) should lie between 150 and 160 per cent in 2015. In the medium term, the capital ratio should be at least 170 per cent.
As at 31 December 2013, the solvency ratio in accordance with the ECM was 160.9 per cent. Details for the reporting date of 31 December 2014, including a detailed analysis of changes, can be found in the ECM report.
4.3. Standard and Poor's model In addition to regulatory and internal provisions, the Group also takes into account the capital requirements specified by an external rating agency to ensure that the Group's credit quality is presented objectively and can be compared with other entities. Therefore, the UNIQA Group is regularly rated by the rating agency Standard & Poor's. UNIQA Insurance Group AG has been given an “A–” credit rating by Standard & Poor’s. UNIQA Österreich Versicherungen AG and

81NOTES TO THE CONSOLIDATED FINANCIAL STATEMENTS
UNIQA Re AG each have a rating of “A”; UNIQA Versicherung AG in Liechtenstein is rated with “A–” and the supplementary capital bond with "BBB". Standard & Poor’s rates the outlook for all the companies as stable. The UNIQA Group includes the impact on its rating in its capital planning process with the objective of improving the rating over the long term as the corporate strategy is implemented. 5. Risk profile The risk profile of the UNIQA Group is very strongly influenced by life insurance and health insurance portfolios in the Austrian life and health insurance companies UNIQA Österreich and Raiffeisen Versicherung AG. This situation means that market risk plays a central role in the UNIQA Group’s risk profile. The composition of market risk is described in the section "Market risk".
The subsidiaries in Central Europe (CE: Hungary, Czech Republic, Slovakia and Poland) op-erate insurance business in the property and casualty segment and in the life and health insur-ance segment.
In the South Eastern Europe (SEE) and Eastern Europe (EE) regions, insurance business is currently conducted primarily in the property/casualty segment, in particular in the motor vehicle insurance segment.
This structure is important to the UNIQA Group, because it creates a high level of diversifi-cation from the life and health insurance lines dominated by the Austrian companies.
The distinctive risk features of the regions are also reflected in the risk profiles determined by using the internal measurement approach.
After every calculation for the life, non-life and composite insurers in the UNIQA Group, benchmark profiles are created and compared with the risk profile for each company. The benchmark profiles show that, for composite insurers, there is a balance between market and actuarial risk. Composite insurers are also in a position to achieve the highest diversification effect.
Market risk Based on the categories defined in the Solvency II standard formula, market risk comprises interest rate, spread, equity, real property, currency and liquidity risk. Market risk is very heavily influenced by interest rate risk, which arises if there is a mismatch between asset and liability maturities. This particularly affects life insurance business. UNIQA has considerably reduced interest rate risk in the last two years by establishing an ALM process as the foundation for creating an ALM-based asset allocation approach.
Aside from a substantial reduction in interest rate risk, the implementation of ALM-based asset allocation caused an increase in spread risk, which is now the greatest single risk faced by UNIQA. Spread risk is defined as the risk of price volatility from changes in credit risk premiums. In the case of fixed-income securities, this risk increases under the Solvency II standard formula depending on rating and duration.

NOTES TO THE CONSOLIDATED FINANCIAL STATEMENTS82
In the last few years, the UNIQA Group has sharply reduced its equity risk, which now plays a rather subordinate role in the same way as currency and concentration risk.
All market risks are actively managed using the existing market risk management tools in the context of risk-bearing capacity and are integrated into company decision-making and management (for example, in quarterly ALM committee meetings at the highest management level).
Asset allocation in € thousand
31/12/2014 31/12/2013
Fixed-income securities 19,281,012 16,741,493Equities 280,652 298,839Alternative investments 41,087 59,077Equity investments 830,185 896,285Loans 119,946 125,156Real estate 1,702,738 1,864,010Liquid funds 1,359,072 1,890,828Total 23,614,692 21,875,688
Market risk categories Interest rate risk Interest rate risk arises on all statement of financial position asset and liability items whose value fluctuates as a result of changes in risk-free yield curves or associated volatility. Given the investment structure and the high proportion of interest-bearing securities in the asset allocation, interest rate risk forms an important part of market risk. The average coupon on fixed-income securities is 3.2 per cent.
The following table shows the maturity structure of interest-bearing securities and bonds reclassified as loans.
Exposure by term in € thousand
31/12/2014 31/12/2013
Up to 1 year 1,315,407 2,271,242More than 1 year up to 3 years 2,874,526 2,084,284More than 3 years up to 5 years 2,681,542 2,477,658More than 5 years up to 7 years 3,388,525 1,598,831More than 7 years up to 10 years 3,209,569 2,706,676More than 10 years up to 15 years 2,553,315 1,647,191More than 15 years 3,073,726 3,915,063Total 19,096,609 16,700,944
Spread risk: Spread risk refers to the risk of changes in the price of statement of financial position asset or liability items as a consequence of changes in credit risk premiums or associated volatility. When investing in securities, UNIQA chooses securities with a wide variety of ratings, taking into consideration the potential risks and returns. The following table shows the credit quality structure for interest-bearing investments.

83NOTES TO THE CONSOLIDATED FINANCIAL STATEMENTS
Exposure by rating in € thousand
31/12/2014 31/12/2013
AAA 4,964,965 4,569,254AA 3,986,746 2,837,120A 4,130,316 3,519,567BBB 3,648,213 3,713,019
BB 1,394,028 963,252B 363,890 615,865<=CCC 158,390 113,790Not rated 450,061 369,076Total 19,096,609 16,700,944
Equity risk Equity risk arises from movements in the value of equities and similar investments as a result of fluctuations in international stock markets. The effective equity weighting is controlled by hedging with the use of derivatives.
Currency risk Currency risk is caused by fluctuations in exchange rates and associated volatility. Given the international nature of the insurance business, UNIQA invests in securities denominated in different currencies, thus following the principle of matching liabilities with assets in the same currency to cover liabilities created by the products. Despite the use of derivative financial instruments for hedging purposes, the currency risks of the investments do not always match the currency risks in the technical provisions and liabilities. The greatest component of this risk arises from investments in US dollars. The following table shows a breakdown of assets and liabilities by currency.
Currency risk 31/12/2014in € thousand Assets Provisions and liabilitiesEUR 29,492,947 27,734,138USD 960,329 50,569CZK 450,157 411,716HUF 463,492 434,998PLN 906,474 804,231RON 183,090 121,490Other 581,380 378,291Total 33,037,868 29,935,434 Currency risk 31/12/2013in € thousand Assets Provisions and liabilitiesEUR 26,570,544 25,954,856USD 1,782,967 25,523CZK 379,970 371,157HUF 435,743 399,856PLN 1,062,974 967,111RON 178,334 179,335Other 591,183 318,739Total 31,001,715 28,216,576

NOTES TO THE CONSOLIDATED FINANCIAL STATEMENTS84
Liquidity risk UNIQA has payment obligations that it must meet on a daily basis. It therefore carries out detailed liquidity planning covering a period of one year. A minimum liquidity balance is specified by the Management Board and is made available as a cash reserve on a day-to-day basis.
In addition, a majority of the securities portfolio is listed in liquid markets and can be sold quickly and without significant markdowns if cash is required. When investing in fixed-income securities and choosing the contractual maturities, UNIQA takes into account the existing contractual maturities in the business segment concerned.
In relation to private equity investments, there are further payment obligations amounting to €1.0 million (2013: €1.0 million).
Sensitivities Market and credit risk management is integrated as a fixed part of the structured investment process. Key figures used to measure, monitor and actively manage investment risk include, in particular, data from stress tests and sensitivity analyses in addition to figures from the estab-lished market and credit risk models (MCEV, SCR, ECR, etc.).
The following table shows the most important market risks in the form of key sensitivity figures. These key figures represent a snapshot on the reporting date and are only intended as an indication of future changes in fair value. Depending on the recognition and measurement principles that need to be applied, any future losses in fair value could lead to different changes in equity to be recognised in profit or loss or in other comprehensive income. The key figures are calculated theoretically on the basis of actuarial principles and do not take into considera-tion any diversification effects between the individual market risks or countermeasures taken in the various market scenarios.

85NOTES TO THE CONSOLIDATED FINANCIAL STATEMENTS
Sensitivities Interest rate risk 31/12/2014 31/12/2013in € thousand +100 basis points – 100 basis points +100 basis points – 100 basis pointsHigh grade – 960,306 813,246 – 669,323 746,714Corporates – 159,784 86,179 – 128,246 128,288Other – 26,440 16,721 – 40,717 54,234Total – 1,146,530 916,146 – 838,286 929,236 Spread risk: 31/12/2014 31/12/2013in € thousand + – + –AAA (0 basis points) 0 0 0 0AA (25 basis points) – 90,756 89,770 – 51,287 53,207A (50 basis points) – 106,631 87,171 – 64,108 66,281BBB (75 basis points) – 152,255 116,279 – 161,979 182,828BB (100 basis points) – 40,909 19,747 – 29,373 31,249B (125 basis points) – 11,567 7,480 – 9,622 – 437<=CCC (150 basis points) – 28,209 8,239 16,910 26,417NR (100 basis points) – 14,539 11,371 50,247 – 8,902Total – 444,866 340,058 – 249,213 350,644 Equity risk 31/12/2014 31/12/2013in € thousand 30% – 30% 30% – 30%Total 206,603 – 134,989 165,785 – 143,457 Currency risk 31/12/2014 31/12/2013in € thousand 10% – 10% 10% – 10%USD 30,688 – 28,308 33,794 – 33,740HUF 19,016 – 19,042 8,079 – 8,108RON 14,314 – 14,337 5,749 – 5,769CZK 30,455 – 30,512 14,840 – 14,893PLN 40,800 – 40,877 20,663 – 20,737Other 39,624 – 37,819 26,458 – 26,554Total 174,897 – 170,896 109,582 – 109,801
Effect of the ascertained changes in fair value on the income statement/equity
2014 in € thousand
Interest rate shock (+100 bp)
Interest rate shock (-100 bp)
Spread shock (increase in spread)
Spread shock (decrease in
spread)
Equity shock (+30%)
Equity shock (-30%)
Currency shock* (+10%)
Currency shock* (-10%)
Income statement 12,303 – 3,801 247 6,451 120,821 – 134,989 150,908 – 146,889Equity – 1,158,833 919,947 – 445,113 333,607 85,781 0 7,481 – 7,496Total – 1,146,530 916,146 – 444,866 340,058 206,603 – 134,989 158,390 – 154,385 * Currency shock from real estate amounting to €16.5 million (+10%) and €16.5 million (-10%) will not be incurred either on the income statement or in
equity because real estate is recognised at the carrying amount and shocks on a fair value basis.
2013 in € thousand
Interest rate shock (+100 bp)
Interest rate shock (-100 bp)
Spread shock (increase in
spread)
Spread shock (decrease in
spread)
Equity shock (+30%)
Equity shock (-30%)
Currency shock* (+10%)
Currency shock* (-10%)
Income statement 33,978 – 38,669 37,280 – 35,214 36,548 – 93,666 103.843 – 104.051Equity – 872,264 967,905 – 286,492 385,858 129,237 – 49,790 3.118 – 3.124Total – 838,286 929,236 – 249,213 350,644 165,785 – 143,457 106.961 – 107.175 * Currency shock from real estate amounting to €2.6 million (+10%) and €2.6 million (-10%) will not be incurred either on the income statement or in equity
because real estate is recognised at the carrying amount and shocks on a fair value basis.

NOTES TO THE CONSOLIDATED FINANCIAL STATEMENTS86
Sensitivities – sensitivity analysis covering the market consistent embedded value for the life and health insurance business The market consistent embedded value (MCEV) is calculated in accordance with the market consistent embedded value principles defined by the CFO Forum and in accordance with the Basis For Conclusions published in the UNIQA Group in October 2009. The embedded value comprises the assets by fair value and the portfolio value of the insurance business. The port-folio value of the business equates to the present value of distributable profits after tax, net of the costs of capital. The MCEV corresponds to an actuarial valuation of the insurance company on a going concern basis, although the value of future new business is specifically excluded.
The assumptions used in the projection to determine the portfolio value are based on best estimates, i.e. realistic estimates using operating and economic assumptions based on future expectations and historical observations. An embedded value calculation requires a number of economic and operating assumptions. Although UNIQA believes these assumptions to be rea-sonable and sensible, they cannot be predicted with any certainty because of numerous influ-encing factors beyond the Company's control. For this reason, actual results may differ materi-ally from the profits forecast in the assessment of embedded value.
The shareholder portion calculation takes into account all available income sources; in clas-sic life insurance in Austria, the requirements of the Austrian Profit-Sharing Regulation are taken into account in particular. In all other countries for which the calculation is carried out, the most realistic growth in future profit participation is assumed, likewise taking into account the relevant legal framework. The projected profits are influenced by assumptions relating to mortality, policy cancellation, costs, capital selection, inflation and investment income.
The assumed interest rate depends on the capital market on the measurement date and is determined using the latest derivation method for yield curves under Solvency II. To facilitate an assessment of the impact from the interest rate assumption, two yield curve sensitivities were calculated in the embedded value, with +/- 100 bp applied to the capital market data for the interest rates. For the interest rate assumptions in accordance with the latest liquid market data, the calculation assumes a convergence within 40 years to a long-term interest rate of 4.2 per cent per cent. This corresponds to the latest requirements from EIOPA relating to the derivation method for risk-free interest rates and is also applied in the sensitivity analyses; consequently, the calculation does not produce mere parallel shifts in the yield curves.
The sensitivities specified below only relate to those companies in the UNIQA Group that have been measured using projection calculations (Austria, Italy, Czech Republic, Slovakia, Hungary, Poland, Russia). As at 31 December 2014, the scope of this measurement process cov-ered more than 96 per cent of the life insurance business reserves in the UNIQA Group.

87NOTES TO THE CONSOLIDATED FINANCIAL STATEMENTS
Market consistent embedded value sensitivities 2014 2013Change in % of base value Equities and real estate – 10% – 5.82 – 5.01Yield curve +1% 8.82 4.98Yield curve – 1% – 19.60 – 10.08Administration expenses – 10% 2.32 2.22Rate of cancellations – 10% 1.40 1.75Mortality – endowment assurance and life insurance – 5% 1.51 1.33Mortality – pension insurance – 5% – 0.31 – 0.14
Further risks The investment in STRABAG SE, the portfolio of asset-backed securities and the assets related to Hypo Group Alpe Adria (HGAA) and HETA Asset Resolution AG (HETA) continue to be care-fully monitored.
As at 31 December 2014, UNIQA held a 13.8 per cent stake in STRABAG SE (31 Decem- ber 2013: 14.7 per cent). UNIQA is continuing to treat STRABAG SE as an associate due to con-tractual arrangements. The carrying amount of the investment in STRABAG SE at 31 Decem-ber 2014 amounted to €456.5 million (31 December 2013: 471.4 million), which equated to €29.1 per share.
The UNIQA Group held 1.8 per cent (2013: 1.8 per cent) of its investments in asset-backed securities (ABSs). The valuation of ABSs is subject to model risk because most of the securities included in the direct portfolio and in the funds portfolio are priced using a mark-to-model method. There is a run-off in the ABS portfolio and, due to the general recovery of the asset class, carries a declining risk in comparison to previous years.
In 2014, the nationalised Hypo Alpe-Adria-Bank (HAA) was transferred to the “bad bank” Heta Asset Resolution AG, which is owned by the Republic of Austria. The function of this bad bank is to wind down the non-performing portion of HAA, which was nationalised in 2009, in the most effective way while at the same time preserving as much value as possible. In addition, the Austrian parliament passed the HAA Recovery and Resolution Act. This act wiped out HAA's subordinated debt, including debt guaranteed by the Austrian federal state of Carinthia. The bail-in affected subordinated bonds held by UNIQA with a nominal value of €36 million and a loss of €-34.1 million, which is a total impairment loss. Legal action was already initiated in 2014 to protect the interests of the beneficiaries of the cover pool and those of UNIQA.
As a consequence of the decision on 1 March 2015 issued by the Austrian Financial Market Authority (FMA) to impose a moratorium on debt and interest payments by Heta Asset Resolution AG, UNIQA anticipates that it will need to recognise an impairment loss in the first quarter of 2015 for senior bonds issued by the former HAA. At the end of 2014, UNIQA had still classified this debt as recoverable because of the guarantee from the state of Carinthia. The amount of the impairment loss will be determined on the basis of the edict from the FMA and the change to the legal position. Within UNIQA’s portfolio, this affects bonds with a nominal value of €25 million and an amortised cost of €21.3 million.

NOTES TO THE CONSOLIDATED FINANCIAL STATEMENTS88
Asset liability management (ALM) Market and credit risks have different weightings and various degrees of seriousness, depending on the investment structure. The effects of the financial risks on the value of the investments also influence the level of technical liabilities. There is therefore – particularly in life insurance – a dependence between the growth of assets and debts from insurance contracts. UNIQA moni-tors the income expectations and risks of assets and liabilities arising from insurance policies as part of the asset liability management (ALM) process. The objective is to achieve a return on capital that is sustainably higher than the technical liabilities carried forward while retaining the greatest possible security. To do this, assets and debts are allocated to different accounting groups. The following table shows the main accounting groups generated by the various product categories.
Investments in € thousand
31/12/2014 31/12/2013
Long-term life insurance contracts with guaranteed interest and profit sharing 16,500,617 15,242,429Long-term unit-linked and index-linked life insurance contracts 5,386,650 5,332,611Long-term health insurance contracts 3,128,747 2,748,864Short-term property and casualty insurance contracts 4,196,663 4,059,744Total 29,212,677 27,383,649
These values refer to the following statement of financial position items: A. I. Land and buildings for own use B. Investment property D. Investment in associates E. Investments F. Investments in unit-linked and index-linked life insurance L. Current bank balances and cash-in-hand
Technical provisions and liabilities (retained) in € thousand
31/12/2014 31/12/2013
Long-term life insurance contracts with guaranteed interest and profit sharing 15,607,593 14,577,386Long-term unit-linked and index-linked life insurance contracts 5,306,000 5,251,035Long-term health insurance contracts 2,677,684 2,571,458Short-term property and casualty insurance contracts 2,757,870 2,606,084Total 26,349,146 25,005,963
These values relate to the following statement of financial position items: C. Technical provisions D. Technical provisions for unit-linked and index-linked life insurance G. I. Reinsurance liabilities (only securities account liabilities from reinsurance ceded) G. Reinsurers' share of technical provisions H. Reinsurers' share of technical provisions for unit-linked and index-linked life insurance

89NOTES TO THE CONSOLIDATED FINANCIAL STATEMENTS
Due to the particular importance of the ALM process in life insurance, the focus below is placed on this segment. For practical reasons, it is not possible to fully achieve the objective of matching cash flows for assets and liabilities. The duration of the assets in life insurance is 6.7 years (2013: 5.8 years), while for liabilities it is considerably longer. This is referred to as a duration gap. It gives rise to interest rate risk and this risk is backed by capital in the ECR model. The discount rate that may be used in the costing when new business is written is based in most UNIQA companies on a maximum discount rate imposed by the relevant local supervisory au-thority. In all those countries in which the maximum permissible discount rate is not imposed in this way, appropriate prudent, market-based assumptions are made by the actuaries respon-sible for the calculation. In the core market of Austria, the maximum discount rate is currently 1.5 per cent per year. However, the portfolio also includes older contracts with different dis-count rates. In the relevant markets of the UNIQA Group, these rates amount to as much as 4.0 per cent per year.
The following table provides an indication of the average discount rates for each region.
Average technical discount rates, core business by region and currency EUR USD CHF Local currency
in per cent Austria (AT) 2.5 - - -Western Europe (WE) 2.0 - 2.6** -Central Europe (CE) 3.6 - - 3.3 Southeastern Europe (SEE) 3.1 - - 2.9 Eastern Europe (EE) 3.4 4.0 - 3.5 Russia (RU) 3.0 3.0 - 4.0 Definition of regions: AT - Austria WE - Italy, Liechtenstein CE - Poland, Hungary, Czech Republic, Slovakia SEE - Bulgaria, Serbia, Bosnia and Herzegovina, Croatia, Albania, Montenegro*, Kosovo, Macedonia EE - Romania, Ukraine* RU - Russia *Not included ** 2.6 restated value in 2013
As these discount rates are guaranteed by the insurance company, the financial risk lies in not being able to generate these returns. Because classic life insurance business predominantly invests in interest-bearing securities (bonds, loans, etc.), the unpredictability of long-term interest rate trends is the most significant financial risk for a life insurance company. Invest-ment and reinvestment risk arises from the fact that premiums received in the future must be invested to achieve the rate of return guaranteed when a policy is written. However, it is entirely possible that no appropriate securities will be available at the time the premium is received. In the same way, future income must be reinvested to achieve a return equivalent to at least the original discount rate. For this reason, UNIQA has already decided to offer products to its key markets that are only based on a low or zero discount rate.

NOTES TO THE CONSOLIDATED FINANCIAL STATEMENTS90
Actuarial risks Non-life The actuarial risk in the non-life segment is broken down into the three risk categories of pre-mium, reserve and catastrophe risk.
Premium risk is defined as the risk that future benefits and expenses in connection with in-surance operations will exceed the premiums collected for the insurance concerned. Such a loss may also be caused in insurance operations by exceptionally significant, but rare loss events, known as major claims or shock losses. Appropriate distribution assumptions are made to en-sure that these events are also adequately incorporated into risk modelling.
Natural disasters represent a further threat from events that are infrequent but that never-theless cause substantial losses. This risk includes financial losses caused by natural hazards, such as floods, storms, hail or earthquakes. In contrast to major individual claims, insurance companies in this case refer to cumulative losses.
Reserve risk refers to the risk that technical provisions recognised for claims that have al-ready occurred will turn out to be inadequate. The loss in this case is referred to as run-off loss. The claims reserve is calculated using actuarial methods. External factors, such as changes in the amount or frequency of claims, legal decisions, repair and/or handling costs, can lead to differences compared with estimates.
To counter and actively manage these risks, UNIQA runs a number of processes integrated into its insurance operations. For example, Group guidelines specify that new products may only be launched if they satisfy certain profitability criteria. Major claims and losses from nat-ural disasters are appropriately managed by means of special risk management in the under-writing process (primarily in corporate activities) and by the provision of suitable reinsurance capacity.
In connection with claim reserves, guidelines also specify the procedures to be followed by local units when recognising such reserves in accordance with IFRS. A quarterly monitoring system and an internal validation process safeguard the quality of the reserves recognised in the whole of the Group.
An essential element in risk assessment and further risk management is the use of the non-life partial model. This risk model uses stochastic simulations to quantify the risk capital re-quirement for each risk class at both Company and Group levels. The model also produces fur-ther key figures that are then used as part of the risk- and value-based management of the in-surance business.
Life The risk of an individual insurance contract lies in the occurrence of the insured event. The occurrence is considered random and therefore unpredictable. Various risks exist in life insur-ance, particularly in classic life insurance. The insurance company takes on this risk for a cor-responding premium. When calculating the premium, the actuary refers to the following care-fully selected calculation bases: • Interest: The discount rate is set so low that it can be produced as expected in each year. • Mortality: The probabilities of dying are deliberately and carefully calculated for each type of
insurance. • Costs: These are calculated in such a way that the costs incurred by the policy can be perma-
nently covered by the premium.

91NOTES TO THE CONSOLIDATED FINANCIAL STATEMENTS
Carefully selecting the calculation bases gives rise to well-planned profits, an appropriate amount of which is credited to the policyholders as part of profit sharing.
The calculation of the premium is also based on the acceptance of a large, homogenous in-ventory of independent risks, so that the randomness inherent in an individual insurance policy is balanced out by the law of large numbers. The following risks exist for a life insurance company: • The calculation bases prove to be insufficient despite careful selection. • Random fluctuations prove disadvantageous for the insurer. • Policyholders exercise certain implicit options to their advantage.
The risks of the insurer can be roughly divided into actuarial and financial risks.
Long-term life insurance contracts with guaranteed interest and profit sharingin € thousand
31/12/2014 31/12/2013
Austria (AT) 12,035,723 11,879,899Western Europe (WE) 2,702,524 2,085,404Central Europe (CE) 296,710 303,144Eastern Europe (EE) 26,320 35,019Southeastern Europe (SEE) 458,006 195,052Russia (RU) 88,310 78,867 15,607,593 14,577,386 Long-term unit-linked and index-linked life insurance contracts in € thousand
31/12/2014 31/12/2013
Austria (AT) 4,458,977 4,335,070Western Europe (WE) 419,192 515,550Central Europe (CE) 425,899 399,218Eastern Europe (EE) 0 0Southeastern Europe (SEE) 1,932 1,198Russia (RU) 0 0 5,306,000 5,251,035
UNIQA's portfolio consists primarily of long-term insurance contracts. Short-term assurances payable at death play a minor role.
The table below shows the distribution of the premium portfolio by type and region.

NOTES TO THE CONSOLIDATED FINANCIAL STATEMENTS92
Premium portfolio in % Endowment assurance Life insurance Pension insurance 2014 2013 2014 2013 2014 2013Austria (AT) 46.3 43.9 9.0 9.0 14.1 16.1Western Europe (WE) 72.2 73.3 8.0 8.5 16.3 16.5Central Europe (CE) 18.2 20.5 2.8 3.2 0.2 0.2Southeastern Europe (SEE) 85.4 81.7 5.1 6.6 0.6 0.4Eastern Europe (EE) 53.8 49.3 9.1 21.8 0.0 0.0Russia (RU) 94.4 90.9 0.0 0.0 0.0 0.0Total 49.2 46.4 7.7 8.0 11.3 13.5
Premium portfolio in % Unit-linked and index-linked Residual debt insurance Other 2014 2013 2014 2013 2014 2013Austria (AT) 29.6 30.1 0.0 0.0 1.1 0.9Western Europe (WE) 3.5 1.8 0.0 0.0 0.0 0.0Central Europe (CE) 56.1 55.6 10.9 7.5 11.8 13.1Southeastern Europe (SEE) 1.4 1.5 0.8 0.9 6.7 8.8Eastern Europe (EE) 0.0 0.0 30.4 28.9 6.7 0.0Russia (RU) 0.0 0.0 5.6 9.1 0.0 0.0Total 27.5 28.7 1.9 1.1 2.4 2.3 Definition of regions: AT - Austria WE - Italy, Liechtenstein CEE - Poland, Hungary, Czech Republic, Slovakia EE - Romania, Ukraine*
SEE - Bulgaria, Serbia, Bosnia and Herzegovina, Croatia, Albania, Montenegro**, Kosovo*, Macedonia* RU - Russia * Not included in 2013 ** Not included in 2013 or 2014
Mortality With respect to assurance involving death risk, premiums are calculated based on an accounting table, implicitly allowing for the safety loading of risk premiums.
Using risk selection (health examinations) means that the mortality probabilities of the portfolio are consistently smaller than those of the overall population; In addition, the gradual improvement of mortality rates means that the real mortality probabilities are consistently smaller than the values shown in the accounting table. Analyses of mortality data carried out at Group level show that, historically, the level of premiums has been sufficient to cover the death benefits.
Due to the large number of lives insured by the UNIQA Group in the Austrian market, the development of mortality is of particular importance here. According to the 2010/2012 mortal-ity table published by Statistics Austria, life expectancy has increased and is over 80 years for new-borns for the first time.
Life expectancy at birthMortality table Men Women1970–72 66.6 73.71980–82 69.2 76.41990–92 72.5 79.02000–02 75.5 81.52010–12 78.0 83.3

93NOTES TO THE CONSOLIDATED FINANCIAL STATEMENTS
The reduction in the probability of dying for any given age is causing a huge amount of uncer-tainty in the annuities business. Improvements in mortality rates as a result of medical progress and changed lifestyles are virtually impossible to extrapolate.
Attempts to predict this effect were made when producing the generation tables. However, such tables only exist for the Austrian population and this data cannot be applied to other coun-tries. In the UNIQA Group, longevity risk relates mainly to the Austrian life insurance com-panies because very few pension products are sold in the regions covered by the international business.
Homogeneity and independence of insurance risks An insurance company takes great pains to compose a portfolio of the most homogenous, inde-pendent risks possible, in accordance with the classic, deterministic approach to calculating premiums. Because this is virtually impossible in practice, a considerable risk arises for the insurer due to random fluctuations, in particular from the outbreak of epidemic illnesses, as not only could the calculated mortality probabilities prove to be too low, the independence of the risks can also no longer be assumed. Antiselection The portfolios of the UNIQA Group, above all in Austria, contain large quantities of risk insur-ance policies with a premium adjustment clause. This allows the insurer to raise the premiums in case of an (unlikely) worsening of the mortality behaviour. However, this presents the danger of possible antiselection behaviour, meaning that policies for good risks tend to be terminated while worse ones remain in the portfolio.
The right to choose pensions for deferred retirement annuities also results in antiselection. Only those policyholders who feel very healthy choose the annuity payment; all others choose partial or full capital payment. In this way, the pension portfolio tends to consist of mostly healthier people, i.e. from the insurer’s point of view worse risks than the population average.
This phenomenon is countered by corresponding modifications to the retirement mortality tables. A further possibility exists in the requirement that the intention to exercise the right to choose annuity payments must be announced no later than one year in advance of the expira-tion.
Costs Besides the risks discussed above, the cost risk must also be mentioned: the insurer guarantees that it will deduct only the calculated costs for the entire term of the policy. The business risk here is that the cost premiums are insufficient (e.g. due to cost increases resulting from infla-tion).
Health The health insurance business is operated primarily in Austria (92.4 per cent is domestic and 7.6 per cent is international). As a result, the focus lies on risk management in Austria.

NOTES TO THE CONSOLIDATED FINANCIAL STATEMENTS94
Health insurance is a loss insurance which is calculated under consideration of biometric risks and is operated in Austria “similar to life insurance”.
Terminations by the insurer are not possible except in the case of obligation violations by the insured. Premiums must therefore be calculated in such a way that the premiums are suffi-cient to cover the insurance benefits that generally increase with age, assuming probabilities that remain constant. The probabilities and cost structures can change frequently over time. For this reason, it is possible to adjust the premiums for health insurance as necessary to the changed calculation bases.
When taking on risks, the existing risk of the individual is also evaluated. If it is established that an illness already exists for which the cost risk is expected to be higher than for the calcu-lated portfolio, then either this illness is excluded from the policy, an adequate risk surcharge is demanded or the risk is not underwritten.
In health insurance, assurance coverage (“aging provision”) is built up through calculation according to the “type of life insurance” and reduced again in later years because this is used to finance an ever larger part of the benefits that increase with age.
The discount rate for this actuarial reserve is 3.0 or 2.5 per cent. If the discount rate of 3.0 per cent is not achieved by the investment, there are safety margins in the premiums that can be used to cover the insufficient investment results. Because a guideline was published by the FMA in October 2013 about the discount rate in health insurance, starting in January 2014 new business has been calculated with a discount rate of 2.5 per cent. This results in an im-provement of the risk in cases where the investment results are insufficient. In addition, an additional sub-portfolio of business at older rates has been based on the discount rate of 2.5 per cent. The average discount rate was approximately 2.97 per cent as at 31 December 2014.
The legal risks arise primarily from the effects that changes to legislation have on the exist-ing private health insurance business model. This includes, in particular, changes to the legal framework that make it harder or impossible to adapt to changed circumstances or that sharply reduce the income opportunities. Developments in this area will be observed by the insurance association, and an attempt will be made where necessary to react to negative developments from the perspective of the private health insurer.
The EU Directive on the equal treatment of men and women in insurance, which is imple-mented in Austria by the Insurance Amendment Act 2006 (VersRÄG 2006), was also taken into account in the calculation of premiums at the end of the 2nd quarter of 2007. This stipulated that the costs of birth and pregnancy be distributed across both sexes. No significant risk to profit has been identified here.
In the meantime, a European Court of Justice decision regarding insurance policies results in a new situation as of 21 December 2012: as of that date only completely identical premiums are allowed for men and women, excluding considerations such as age and individual pre-existing conditions. Experience in 2013 and 2014 has shown that this has not resulted in any negative development of the portfolio structure of new business.

95NOTES TO THE CONSOLIDATED FINANCIAL STATEMENTS
The risk of the health insurance business outside Austria is currently dominated primarily by UNIQA Assicurazioni in Milan (approx. €34.3 million in annual premiums). This Company presently has stable portfolios, meaning that insurance risk scarcely changes. For tariffs with outdated calculation bases, whose holdings are aging, the insured will be converted in the com-ing years to tariffs with a modern calculation basis. Because this affects tariffs that are not life-long, the conversion problem is less significant than it is for life-long tariffs.
The remaining premiums (approx. €39.2 million) are divided among multiple companies and are of only minor importance there. Only in Switzerland (Geneva) is health insurance the primary business (approx. €8.6 million); however, the Swiss Solvency Test showed there was sufficient risk capital.
Life-long health insurance policies without termination options by the insurer rarely exist outside of Austria, meaning that the risk can be considered low for this reason as well.
Other risks Operational risk Operational risk includes losses that are caused by insufficient or failed internal processes, as well as losses caused by systems, human resources or external events.
Operational risk includes legal risk, but not reputation or strategic risk. Legal risk is the risk of uncertainty due to lawsuits or uncertainty in the applicability or interpretation of contracts, laws or other legal requirements.
The UNIQA Group’s risk management process also defined the risk process for operational risks in terms of methodology, workflow and responsibilities. The risk manager is responsible for compliance in all subsidiaries.
A distinctive feature of operational risk is that it can surface in all processes and depart-ments. This is why operational risk is identified and evaluated in every operational company at a very broad level in the UNIQA Group. Risks are identified with the help of a standardised risk catalogue that is regularly checked for completeness. Scenarios are defined for evaluating these risks; these scenarios are meant to convey the likelihood of occurrence and the possible amount of the claim. The results are then presented by the risk manager in the form of a summarised risk report.
This process is usually conducted twice a year.
Business continuity management According to international standards, the UNIQA Group – as a financial service provider – forms part of the critical infrastructure of key importance to the national community. If this infrastructure were to fail or become impaired, it would cause considerable disruption to public safety and security or lead to other drastic consequences.
As a rule, emergencies, crises and disasters are unexpected events for which it is impossible to plan. However, systems and processes can be put in place to deal with such events. The sys-tems and processes must then be treated as a special responsibility of management and must be dealt with professionally, efficiently and as quickly as possible.

NOTES TO THE CONSOLIDATED FINANCIAL STATEMENTS96
UNIQA has implemented a Business Continuity Management system (BCM) covering the is-sues of crisis prevention, crisis management and business recovery (including business conti-nuity plans). The main objectives are as follows: • to prevent personal injury to, or death of, employees or third parties, • to minimise the impact from failure of key business processes, • to be appropriately prepared with continuously updated emergency and recovery plans.
The UNIQA BCM model is based on international rules and standards and will continue to be implemented in 2015. The implementation of a BCM system forms part of UNIQA’s response to the requirements imposed by relevant authorities (solvency, critical infrastructure) and the market (calls for tender). This holistic approach to a risk management system not only reduces potential losses following an event but also enhances the quality of day-to-day operations.
Reputational and strategic risks Reputational risk describes the risk of loss that arises due to possible damage to the Company’s reputation, a deterioration in prestige, or a negative overall impression due to negative percep-tion by customers, business partners, shareholders or supervisory agencies.
Reputational risks that occur in the course of core processes such as claims processing or advising and service quality are identified, evaluated and managed the same as operational risk in our subsidiaries.
The most important reputational risks are presented, like operational risks, in an aggregated form in the risk report.
Group risk management then analyses whether the risk observed in the Group or in another unit may occur, and whether the danger of “contagion” within the Group is possible.
Strategic risk describes the risk that results from management decisions or insufficient im-plementation of management decisions that may influence current/future income or solvency. This includes the risk that arises from management decisions that are inadequate because they ignore a changed business environment.
Like operational and reputational risks, strategic risks are evaluated twice a year. Further-more, important decisions in various committees, such as the Risk Committee, are discussed with the Management Board. As outlined in the explanation of the risk management process, the management receives a monthly update regarding the most significant risks in the form of a heat map.
6. Impairment test Goodwill arises from company mergers and acquisitions. It represents the difference between the acquisition costs and the proportional and current corresponding net fair value of identifi-able assets, debts and specific contingent liabilities. In accordance with IAS 36, goodwill is not subject to amortisation, but reported at the acquisition cost less any accrued impairments.
For the purpose of the impairment test, the UNIQA Group has allocated the goodwill into “cash-generating units” (CGUs). These CGUs are the smallest identifiable groups of assets that generate cash flows that are to the greatest possible extent independent from the cash generat-ing units of other assets or other groups of assets. The impairment test involves a comparison between the amount that can be generated by selling or using each CGU, the present value of future cash flows with its value to be covered, consisting of goodwill, the proportional net assets and any capital increases and internal loans. If the resulting value exceeds the realisable value of

97NOTES TO THE CONSOLIDATED FINANCIAL STATEMENTS
the unit based on the discounted cash flow method, an impairment loss is recognised. The im-pairment test was carried out on 1 October 2014. If there were any particular deviations from the planned performance in the fourth quarter, the CGUs were updated individually. The UNIQA Group has allocated goodwill to the following CGUs, which coincide with the countries in which UNIQA is active, with the exception of the Sigal Group, in which the three countries of Albania, Kosovo and Macedonia were combined as one CGU due to their similar development and organisational connection:
• Albania/Kosovo/Macedonia as “Sigal Group” sub-group (SEE) • Bosnia and Herzegovina (SEE) • Bulgaria (SEE) • Italy as sub-group (WE) • Croatia (SEE) • Liechtenstein (WE) • UNIQA Österreich (AT) • Poland (CE) • Romania (EE) • Russia (RU) • Switzerland (WE) • Serbia (SEE) • Montenegro (SEE) • Slovakia (CE) • Czech Republic (CE) • Ukraine (EE) • Hungary (CE) • UNIQA Re

NOTES TO THE CONSOLIDATED FINANCIAL STATEMENTS98
Goodwill breakdown
Cash-generating unit – insurance 30/9/2014in € thousand Bosnia and Herzegovina 1,887Bulgaria 55,811Italy 121,718Croatia* 32,206Liechtenstein -Montenegro 81UNIQA Österreich 37,737Poland 28,457Romania 127,990Russia 72Switzerland -Serbia* 19,829“Sigal Group” 20,253Slovakia 120Czech Republic 7,712Ukraine 18,774Hungary 17,219UNIQA Re -
Breakdown of total Group goodwill 30/9/2014 30/9/2013Region in € thousand Austria (AT) 37,737 37,737Western Europe (WE) 121,718 123,455Central Europe (CE) 53,508 54,411Eastern Europe (EE) 146,764 152,120Southeastern Europe (SEE)* 130,068 98,251Russia (RU) 72 87Total 489,867 466,061 *)Due to the final purchase price allocation from the acquisition of the Baloise Group, the goodwill for Croatia was reduced by €16,040 thousand and for
Serbia increased by €10 thousand as at 31 December 2014. Consequently, the goodwill for the region of Southeastern Europe also decreased by €16, 030 thousand.
The UNIQA Group calculates the recoverable amount on the basis of value in use by applying generally accepted valuation principles by means of the discounted cash flow method (DCF). The budget projections (detailed planning phase) of the CGUs, the estimate of the long-term net profits achievable by the CGUs and long-term growth rates (perpetuity) are used as the starting point for determination of the capitalised value.
The capitalised value is determined by discounting the future profits with a suitable capital-isation rate after assumed retention to strengthen the capital base. In the process, the capital-ised values are separated by statement of financial position segments, which are then totalled to yield the value for the entire Company.
Taxes on operating income were set at the average effective tax rate of the past three years. The assumptions with regard to risk-free interest rate, market risk premium and segment
betas made for determination of the capitalisation rate are consistent with the parameters used in the UNIQA planning and controlling process and are based on the capital asset pricing model.

99NOTES TO THE CONSOLIDATED FINANCIAL STATEMENTS
In order to depict the economic situation and the financial crisis in the income values as ac-curately as possible in consideration of the volatility on the markets, the capitalisation rate was calculated as follows: a uniform, risk-free interest rate according to the Svensson method (Ger-man treasury bonds with 30 year maturities) was used as a base interest rate.
In the reporting period, the beta factor was determined for the first time on the basis of the monthly betas over the last five years for a defined peer group. The betas for the non-life, life and health segments were determined using the revenues in the relevant segments of the indi-vidual peer group companies. The health insurance segment, which is strongly focused on the Austrian market, is operated in a manner similar to life insurance. A uniform beta for personal injury insurance is therefore used in relation to the life and health insurance business.
The market risk premium was determined conservatively on the basis of the current stand-ards issued by the Kammer der Wirtschaftstreuhänder (Austrian Chamber of Public Account-ants and Tax Advisors). The calculations published by Damodaran were used to determine the country risk premium. The country risk premium in accordance with the Damodaran method is calculated as follows: starting from the rating of the country concerned (from Moody's), UNIQA obtains the yield spread from credit default swap spreads with the same rating as risk-free gov-ernment bonds and adjusts this spread to reflect the volatility difference between equity and bond markets. UNIQA also assumes that country risk will decline over the next few years on the basis of subsequent trends.
The calculation in 2014 also factored in the inflation differential for countries outside the euro zone. In general, the inflation differential represents inflation trends in different countries and is used as a key indicator in assessing competitiveness. In order to calculate the inflation differential, the deviation of the inflation forecast for the country of the CGU in question in relation to the inflation forecast for a risk-free environment (Germany, in this case) was used. This is adjusted annually in the detailed planning with the expected inflation and subsequently applied for perpetuity with the value of the last year of the detailed planning phase.

NOTES TO THE CONSOLIDATED FINANCIAL STATEMENTS100
The capitalisation rate is listed below for all CGUs:
Cash-generating unit Discount factor Discount factor perpetuityin per cent Property/ casualty Life & health Property/ casualty Life & healthBosnia and Herzegovina 17.8 18.6 14.1 14.9Bulgaria 8.4 9.2 10.6 11.4Italy 11.2 11.9 10.1 10.9Croatia 10.7 11.5 11.5 12.3Liechtenstein 7.1 7.8 7.6 8.4Montenegro 15.3 16.0 11.3 12.1UNIQA Austria 8.3 9.1 8.3 9.1Poland 8.5 9.2 10.2 10.9Romania 11.9 12.6 11.7 12.5Russia 16.7 17.4 12.9 13.7Switzerland 7.1 7.8 7.6 8.4Serbia 16.5 17.3 14.4 15.1“Sigal Group” 14.2–15.5 14.9–16.3 11.5–13.4 12.2–14.1Slovakia 9.6 10.4 9.4 10.1Czech Republic 8.5 9.3 9.5 10.3Ukraine 27.0 27.7 17.4 18.1Hungary 10.9 11.7 12.0 12.8 Regions Austria 8.3 9.1 8.3 9.1Western Europe (WE) 7.1–11.2 7.8–11.9 7.6–10.1 8.4–10.9Central Europe (CE) 8.5–10.9 9.2–11.7 9.4–12.0 10.1–12.8Eastern Europe (EE) including Russia 11.9–27.0 12.6–27.7 11.7–17.4 12.5–18.1South Eastern Europe (SEE) 8.4–17.8 9.2–18.6 10.6–14.4 11.4–15.1 The discount rate ranges listed for the Sigal Group and the regions relate to the spread over the respective countries grouped under these headings. Source: Damodaran and derived factors

101NOTES TO THE CONSOLIDATED FINANCIAL STATEMENTS
The following discount rates were applied in the previous year (reporting date impairment test 31 December 2013):
Cash-generating unit Discount factor Discount factor perpetuityin per cent Property/ casualty Life & health Property/ casualty Life & healthAlbania 15.1 16.4 15.5 16.7Bosnia and Herzegovina 19.1 20.4 18.9 20.1Bulgaria 11.5 12.7 11.5 12.7Italy 10.5 11.7 10.6 11.8Kosovo 14.4 15.6 13.9 15.2Croatia 13.2 14.5 12.9 14.2Liechtenstein 6.1 7.3 7.7 9.0Macedonia 14.8 16.0 13.9 15.2Montenegro 13.4 14.6 13.1 14.4UNIQA Austria 8.0 9.2 8.9 10.1Poland 9.2 10.4 10.9 12.2Romania 12.6 13.8 13.3 14.5Russia 14.7 15.9 12.4 13.6Switzerland 6.1 7.3 7.7 9.0Serbia 15.9 17.1 14.9 16.2Slovakia 10.1 11.3 11.1 12.4Czech Republic 10.0 11.3 10.7 12.0Ukraine 22.3 23.6 19.7 20.9Hungary 12.9 14.2 13.6 14.9 Source: Damodaran and derived factors
Cash flow forecast (multi-phase model) Phase 1: five-year company planning The detailed company planning generally encompasses a period of five years. The company plans used for the calculation are the result of a structured and standardised management dia-logue in the UNIQA Group with the participation of UNIQA International, in combination with the reporting and documentation process integrated into this dialogue. The plans are formally approved by the Management Board and also include material assumptions regarding the com-bined ratio, investment income, market shares and the like. Phase 2: perpetuity The last year of the detailed planning phase is used as the basis for determining the cash flows in phase 2. The growth in the start-up phase leading up to phase two was determined using a projection of the growth in insurance markets. It was assumed that the insurance markets would come into line with the Austrian level in terms of density and penetration in 40 to 60 years.

NOTES TO THE CONSOLIDATED FINANCIAL STATEMENTS102
Uncertainty and sensitivity Various studies and statistical analyses were used as sources to provide a basis for determining the growth rates in order to consistently and realistically reflect the market situation and mac-roeconomic development. The reference sources included the following studies and materials: • Internal research at UNIQA Capital Markets GmbH • Raiffeisen Research • Wiener Institut für Internationale Wirtschaftsvergleiche • Österreichische Nationalbank • Business Monitor International • Damodaran – country risks, growth rate estimations, multiples • VVO • Insurance Europe • Swiss Re Sigma Report
Sensitivity analyses In order to substantiate the results of the calculation and estimation of the value in use, random sensitivity analyses with regard to the capitalisation rate and the main value drivers are per-formed.
These analyses show that sustained surpluses on the part of the individual CGUs are highly dependent on the actual development of these assumptions within the individual national or regional economies (GDP, insurance density, purchasing power parities in particular in the CEE markets), as well as the associated implementation of the individual profit goals. These fore-casts and the related assessment of how the situation in the markets will develop in the future, under the influence of the continuing financial crisis in individual markets, are the largest un-certainties in connection with valuation results.
In the event that the recovery from the economic crisis turns out to be much weaker and slower than assumed in the business plans and fundamental forecasts, and the insurance mar-ket trends differ entirely from the assumptions made in those business plans and forecasts, the individual CGUs may incur impairment losses. Despite slower economic growth, income expec-tations have not changed significantly compared to previous years.
A sensitivity analysis shows that if there is a rise in interest rates of 50 basis points in the countries of Bulgaria, Croatia and Romania, there could be a convergence between the value in use and the carrying amount or a value in use that is lower than the carrying amount. If there were a stronger rise in interest rates of 100 basis points or more, Bosnia/Herzegovina would also be affected. If the underlying cash flows change by -5.0 per cent, there will also be a risk of a convergence or a value in use that is lower than the carrying amount in the countries of Bulgaria, Croatia and Romania. This list expands to include Herzegovina when there is a deviation of more than -10.0 per cent in the cash flows.
In 2014, an impairment loss of €25 million was recognised for Romania.
Backtesting: Backtesting is regularly carried out on the planning for the individual countries. The objective is to obtain information for internal purposes on the extent to which the operating units plan their results accurately and on the extent to which details useful with regard to subsequent develop-

103NOTES TO THE CONSOLIDATED FINANCIAL STATEMENTS
ment are highlighted. This backtesting can also be used to draw conclusions to be applied to the latest round of planning, thereby enhancing planning accuracy in forthcoming financial plans.
7. Reinsurance The Management Board of the holding company determines, directly and indirectly, the stra-tegic contents of reinsurance policy with its decisions regarding risk and capital policy. The following principles can be derived from external reinsurance to inform purchasing.
Reinsurance structures sustainably support the optimisation of the required risk capital and the management of the use of this risk capital. Great importance is attached to the maximum use of diversification effects. Decisions regarding all reinsurance business ceded are taken with special consideration of their effects on the required risk capital. Continuous analysis of rein-surance purchasing for efficiency characteristics is an essential component of internal risk management processes.
UNIQA Re AG in Zurich is responsible for the operational implementation of these tasks. It is responsible for and guarantees the implementation of reinsurance policies issued by the Management Board of the holding company. It is responsible for issuing Group-wide guidelines governing all activities, organisation and questions regarding internal and external reinsurance relationships. UNIQA Re AG is available to all Group companies as the risk carrier for their reinsurance needs. Naturally, internal risk transfers are subject to the same requirements and valuation processes in terms of efficiency measurement, risk capital optimisation and diversifi-cation as retrocessions to external reinsurance partners.
The assessment of the exposure of the portfolios assumed by the Group companies is of cen-tral importance. Periodic risk assessments have been performed for years in the interest of a value-based management of the capital commitment. Extensive data are used to assess risk capital requirements for affected units. Reinsurance programmes are consistently structured systematically in accordance with their influence on the cedent’s risk situation.
For the property and casualty insurer, promises of performance for protection against losses resulting from natural disasters frequently represent the greatest stress on risk capital by far due to the volatile nature of such claims and the conceivable amount of catastrophic damages. The UNIQA Group has set up a specialised unit within UNIQA Re AG in order to deal with this problem. Exposure is constantly monitored and evaluated at the country and Group levels in cooperation with internal and external authorities. The UNIQA Group substantially eases the pressure on its risk capital through the targeted utilisation of all applicable diversification ef-fects and the launching of a highly efficient retrocession programme.
UNIQA Re AG has assumed almost all of the UNIQA Group’s required reinsurance business ceded in the reporting period. Only in the life insurance line was a portion of the necessary cessions given directly to external reinsurance partners. The Group’s retrocessions in the non-life insurance line were carried out on a non-proportional basis. The Group assumes reasonable deductibles in the affected programmes based on risk and value-based approaches.

104 NOTES TO THE CONSOLIDATED FINANCIAL STATEMENTS
Segment reporting
CONSOLIDATED STATEMENT OF FINANCIAL POSITION – CLASSIFIED BY SEGMENT
Property and casualty insurance Health insurancein € thousand 31/12/2014 31/12/2013 31/12/2014 31/12/2013Assets A. Property, plant and equipment 136,214 137,423 27,494 29,609 B. Investment property 219,380 216,642 312,145 287,568 C. Intangible assets 483,441 498,087 225,769 225,324 D. Investment in associates 43,374 43,397 173,520 192,025 E. Investments 4,013,081 3,840,288 2,507,148 2,177,347 F. Unit-linked and index-linked life insurance investments 0 0 0 0G. Reinsurers' share of technical provisions 155,799 129,348 1,002 1,067H. Reinsurers' share of technical provisions
for unit-linked and index-linked life insurance 0 0 0 0I. Receivables including insurance receivables 1,089,632 1,504,734 193,922 258,416J. Income tax receivables 38,209 53,146 1,111 164 K. Deferred tax assets 1,409 5,835 394 519 L. Current bank balances and cash-in-hand 234,646 242,382 143,859 107,219M. Assets in disposal groups held for sale 0 0 0 0Total assets by segment 6,415,185 6,671,282 3,586,364 3,279,258 Equity and liabilities B. Subordinated liabilities 604,187 604,132 0 0 C. Technical provisions 2,914,745 2,737,773 2,677,800 2,571,539 D. Technical provisions for unit-linked and
index-linked life insurance 0 0 0 0E. Financial liabilities 11,485 6,288 28,557 29,716 F. Other provisions 772,838 773,153 17,520 21,013 G. Liabilities and other items classified as equity and
liabilities 671,877 1,209,137 190,034 148,204 H. Income tax liabilities 30,774 28,775 597 1,572 I. Deferred tax liabilities 77,773 41,183 141,392 92,563 J. Liabilities in disposal groups held for sale 0 0 0 0Total equity and liabilities by segment 5,083,679 5,400,440 3,055,901 2,864,606
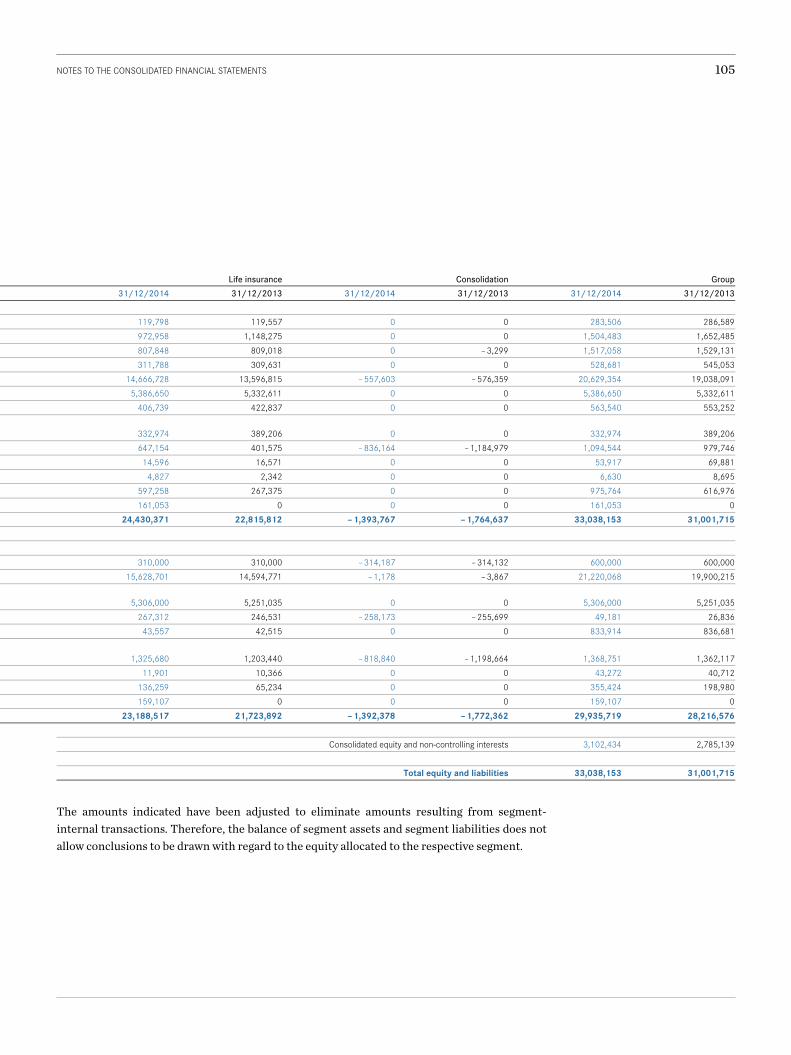
105NOTES TO THE CONSOLIDATED FINANCIAL STATEMENTS
Life insurance Consolidation Group 31/12/2014 31/12/2013 31/12/2014 31/12/2013 31/12/2014 31/12/2013 119,798 119,557 0 0 283,506 286,589 972,958 1,148,275 0 0 1,504,483 1,652,485 807,848 809,018 0 – 3,299 1,517,058 1,529,131 311,788 309,631 0 0 528,681 545,053 14,666,728 13,596,815 – 557,603 – 576,359 20,629,354 19,038,091 5,386,650 5,332,611 0 0 5,386,650 5,332,611 406,739 422,837 0 0 563,540 553,252 332,974 389,206 0 0 332,974 389,206 647,154 401,575 – 836,164 – 1,184,979 1,094,544 979,746 14,596 16,571 0 0 53,917 69,881 4,827 2,342 0 0 6,630 8,695 597,258 267,375 0 0 975,764 616,976 161,053 0 0 0 161,053 0 24,430,371 22,815,812 – 1,393,767 – 1,764,637 33,038,153 31,001,715 310,000 310,000 – 314,187 – 314,132 600,000 600,000 15,628,701 14,594,771 – 1,178 – 3,867 21,220,068 19,900,215 5,306,000 5,251,035 0 0 5,306,000 5,251,035 267,312 246,531 – 258,173 – 255,699 49,181 26,836 43,557 42,515 0 0 833,914 836,681 1,325,680 1,203,440 – 818,840 – 1,198,664 1,368,751 1,362,117 11,901 10,366 0 0 43,272 40,712 136,259 65,234 0 0 355,424 198,980 159,107 0 0 0 159,107 0 23,188,517 21,723,892 – 1,392,378 – 1,772,362 29,935,719 28,216,576 Consolidated equity and non-controlling interests 3,102,434 2,785,139 Total equity and liabilities 33,038,153 31,001,715
The amounts indicated have been adjusted to eliminate amounts resulting from segment-internal transactions. Therefore, the balance of segment assets and segment liabilities does not allow conclusions to be drawn with regard to the equity allocated to the respective segment.

106 NOTES TO THE CONSOLIDATED FINANCIAL STATEMENTS
OPERATING SEGMENTS
UNIQA Austria Raiffeisen Versicherung UNIQA International
in € thousand 1–12/2014 1–12/2013 1–12/2014 1–12/2013 1–12/2014 1–12/2013Premiums written (gross), including savings portion from the unit-linked and index-linked life insurance. 2,773,542 2,806,699 905,290 878,474 2,353,062 2,162,358Premiums earned (net), including savings portion from the unit-linked and index-linked life insurance 2,137,021 2,196,206 793,957 767,663 1,822,239 1,634,118Savings portion in unit-linked and index-linked life insurance (gross) 152,378 209,844 152,378 209,844 239,898 308,243Savings portion in unit-linked and index-linked life insurance (net) 143,121 197,015 143,121 197,015 239,898 308,243
Premiums written (gross) 2,621,163 2,596,856 752,912 668,630 2,113,164 1,854,115
1. Premiums earned (net) 1,993,900 1,999,191 650,837 570,648 1,582,342 1,325,874 2. Technical interest income 229,055 242,023 219,626 209,939 96,615 85,966 3. Other insurance income 3,137 7,268 917 526 25,931 10,164 4. Insurance benefits – 1,637,225 – 1,680,518 – 685,206 – 629,983 – 1,253,637 – 960,118 5. Operating expenses – 393,975 – 418,113 – 101,457 – 111,748 – 434,847 – 454,669 6. Other technical expenses – 37,881 – 40,762 – 14,841 – 15,978 – 50,823 – 40,345 7. Technical result 157,010 109,088 69,876 23,404 – 34,419 – 33,128 8. Net investment income 363,015 379,086 267,048 251,636 174,330 143,106 9. Other income 7,513 2,240 1,736 837 26,774 15,707 10. Reclassification of technical interest income – 229,055 – 242,023 – 219,626 – 209,939 – 96,615 – 85,966 11. Other operating expenses – 12,049 – 8,663 – 123 – 1,091 – 40,688 – 12,947 12. Non-technical result 129,424 130,640 49,035 41,443 63,800 59,900 13. Operating profit/(loss) 286,434 239,728 118,911 64,848 29,381 26,77214. Amortisation of goodwill and impairment losses – 1,875 – 1,916 – 189 – 261 – 30,228 – 5,124 15. Finance costs – 10,627 – 6,812 – 10,094 0 – 317 – 109 16. Profit/(loss) from ordinary activities 273,932 231,001 108,628 64,587 – 1,164 21,539 Combined ratio (property and casualty insurance, after reinsurance) 91.6% 91.6% 86.6% 90.4% 102.3% 102.8%Cost ratio (after reinsurance) 18.4% 19.0% 12.8% 14.6% 23.9% 27.8%
IMPAIRMENT BY SEGMENT
UNIQA Austria Raiffeisen Versicherung UNIQA International
in € thousand 1–12/2014 1–12/2013 1–12/2014 1–12/2013 1–12/2014 1–12/2013Goodwill Change in impairment in current year 0 0 0 0 – 25,000 0
of which recognised in profit or loss 0 0 0 0 – 25,000 0 Investments Change in impairment in current year – 11,599 – 33,608 – 25,796 – 33,551 – 193 – 1,157
of which recognised in profit or loss – 20,665 – 38,509 – 37,458 – 39,202 – 193 – 1,157 of which reversed in profit or loss 9,066 4,901 11,662 5,652 0 0

107NOTES TO THE CONSOLIDATED FINANCIAL STATEMENTS
Reinsurance Group functionsand consolidation
Group
1–12/2014 1–12/2013 1–12/2014 1–12/2013 1–12/2014 1–12/2013 1,189,327 1,633,116 – 1,156,866 – 1,595,140 6,064,355 5,885,506 1,080,886 1,073,625 4,932 – 30,739 5,839,035 5,640,873 0 0 0 0 544,654 727,931 0 0 0 0 526,139 702,272 1,189,327 1,633,116 – 1,156,866 – 1,595,140 5,519,700 5,157,576 1,080,886 1,073,625 4,932 – 30,739 5,312,896 4,938,600 0 0 15,088 – 48,128 560,384 489,799 1,115 9,333 3,392 – 3,784 34,492 23,508 – 800,808 – 782,508 – 6,785 93,680 – 4,383,662 – 3,959,448 – 335,108 – 333,557 – 9,943 – 36,081 – 1,275,330 – 1,354,167 – 12,193 – 12,215 18,440 19,779 – 97,298 – 89,521 – 66,109 – 45,321 25,124 – 5,272 151,482 48,772 31,325 21,813 28,657 – 15,640 864,375 780,002 5,270 5,842 21,135 15,964 62,428 40,589 0 0 – 15,088 48,128 – 560,384 – 489,799 – 975 – 311 – 16,499 – 9,402 – 70,334 – 32,413 35,621 27,344 18,204 39,051 296,084 298,379 – 30,488 – 17,976 43,328 33,779 447,566 347,151 0 0 0 0 – 32,292 – 7,301 0 0 – 16,304 – 25,360 – 37,343 – 32,281 – 30,488 – 17,976 27,024 8,419 377,932 307,569 104.8% 103.6% 99.5% 99.8% 31.0% 31.1% 21.8% 24.0%
Reinsurance Group functionsand consolidation
Group
1–12/2014 1–12/2013 1–12/2014 1–12/2013 1–12/2014 1–12/2013 0 0 0 0 – 25,000 0 0 0 0 0 – 25,000 0 0 0 – 31,489 – 12,921 – 69,077 – 81,236 0 0 – 31,628 – 13,049 – 89,944 – 91,917 0 0 139 128 20,867 10,681

108 NOTES TO THE CONSOLIDATED FINANCIAL STATEMENTS
OPERATIONAL SEGMENTS – CLASSIFIED BY SEGMENT
Property and casualty insurance UNIQA Austria Raiffeisen Versicherung UNIQA International
in € thousand 1–12/2014 1–12/2013 1–12/2014 1–12/2013 1–12/2014 1–12/2013Premiums written (gross) 1,362,614 1,326,241 153,154 145,664 1,084,898 1,093,683
1. Premiums earned (net) 753,037 747,573 79,775 76,779 588,155 599,210 2. Technical interest income 0 0 0 0 0 0 3. Other insurance income 2,278 3,896 139 169 19,818 6,000 4. Insurance benefits – 516,544 – 493,546 – 57,140 – 52,852 – 372,714 – 366,053 5. Operating expenses – 173,126 – 190,869 – 11,963 – 16,584 – 228,898 – 250,232 6. Other technical expenses – 16,556 – 20,496 – 992 – 892 – 34,283 – 22,819 7. Technical result 49,089 46,559 9,820 6,619 – 27,921 – 33,894 8. Net investment income 58,264 44,010 3,539 3,521 38,178 39,071 9. Other income 4,886 1,543 827 2 13,385 7,237 10. Reclassification of technical interest income 0 0 0 0 0 0 11. Other operating expenses – 11,516 – 7,663 – 120 – 1,090 – 16,851 – 8,731 12. Non-technical result 51,634 37,891 4,246 2,432 34,713 37,577 13. Operating profit/(loss) 100,723 84,450 14,066 9,051 6,791 3,68314. Amortisation of goodwill and impairment losses 0 0 0 0 – 27,847 – 2,549 15. Finance costs 0 – 1,758 0 0 – 313 – 109 16. Profit/(loss) from ordinary activities 100,723 82,692 14,066 9,051 – 21,368 1,025
Health insurance UNIQA Austria Raiffeisen Versicherung UNIQA International
in € thousand 1–12/2014 1–12/2013 1–12/2014 1–12/2013 1–12/2014 1–12/2013Premiums written (gross) 887,275 866,218 0 0 73,547 71,413
1. Premiums earned (net) 886,949 865,169 0 0 71,725 69,821 2. Technical interest income 70,555 67,257 0 0 0 0 3. Other insurance income 118 556 0 0 1,406 65 4. Insurance benefits – 744,309 – 736,231 0 0 – 45,724 – 42,522 5. Operating expenses – 129,966 – 122,605 0 0 – 30,669 – 28,669 6. Other technical expenses – 6,685 – 5,942 0 0 – 371 – 414 7. Technical result 76,662 68,203 0 0 – 3,632 – 1,719 8. Net investment income 123,906 93,588 0 0 1,714 1,596 9. Other income 193 85 0 0 2,039 2,193 10. Reclassification of technical interest income – 70,555 – 67,257 0 0 0 0 11. Other operating expenses – 21 0 0 0 – 1,380 – 434 12. Non-technical result 53,522 26,415 0 0 2,374 3,355 13. Operating profit/(loss) 130,185 94,618 0 0 – 1,258 1,63614. Amortisation of goodwill and impairment losses 0 0 0 0 0 0 15. Finance costs 0 0 0 0 0 0 16. Profit/(loss) from ordinary activities 130,185 94,618 0 0 – 1,258 1,636

109NOTES TO THE CONSOLIDATED FINANCIAL STATEMENTS
Reinsurance Group functionsand consolidation
Group
1–12/2014 1–12/2013 1–12/2014 1–12/2013 1–12/2014 1–12/2013 1,136,028 1,578,152 – 1,115,771 – 1,553,211 2,620,922 2,590,529 1,055,646 1,047,894 6,325 – 29,965 2,482,938 2,441,490 0 0 0 0 0 0 631 8,990 3,807 – 4,954 26,674 14,101 – 775,981 – 756,390 – 1,205 34,995 – 1,723,584 – 1,633,846 – 330,550 – 329,045 – 1,529 – 16,506 – 746,065 – 803,236 – 7,677 – 7,761 11,716 13,301 – 47,791 – 38,666 – 57,930 – 36,313 19,115 – 3,130 – 7,828 – 20,159 19,532 9,658 15,182 2,354 134,696 98,614 5,237 5,822 10,785 7,088 35,119 21,692 0 0 0 0 0 0 – 926 – 293 – 6,649 – 5,669 – 36,061 – 23,446 23,843 15,187 19,318 3,773 133,753 96,860 – 34,088 – 21,126 38,433 643 125,926 76,702 0 0 0 0 – 27,847 – 2,549 0 0 – 36,791 – 25,025 – 37,104 – 26,891 – 34,088 – 21,126 1,642 – 24,382 60,975 47,261
Reinsurance Group functionsand consolidation
Group
1–12/2014 1–12/2013 1–12/2014 1–12/2013 1–12/2014 1–12/2013 1,544 1,585 – 1,591 – 1,642 960,776 937,574 1,424 1,258 – 112 – 63 959,986 936,184 0 0 0 0 70,555 67,257 0 0 0 0 1,524 621 – 252 – 268 9,762 10,285 – 780,523 – 768,736 – 503 – 364 – 2,231 – 10,439 – 163,368 – 162,077 0 0 – 247 – 440 – 7,302 – 6,796 669 626 7,172 – 658 80,872 66,451 6 7 – 8,612 – 15,792 117,014 79,399 0 0 1,819 3,601 4,051 5,879 0 0 0 0 – 70,555 – 67,257 0 0 0 0 – 1,401 – 434 7 7 – 6,794 – 12,190 49,109 17,586 676 632 379 – 12,848 129,981 84,038 0 0 0 0 0 0 0 0 – 234 – 298 – 234 – 298 676 632 144 – 13,146 129,747 83,740
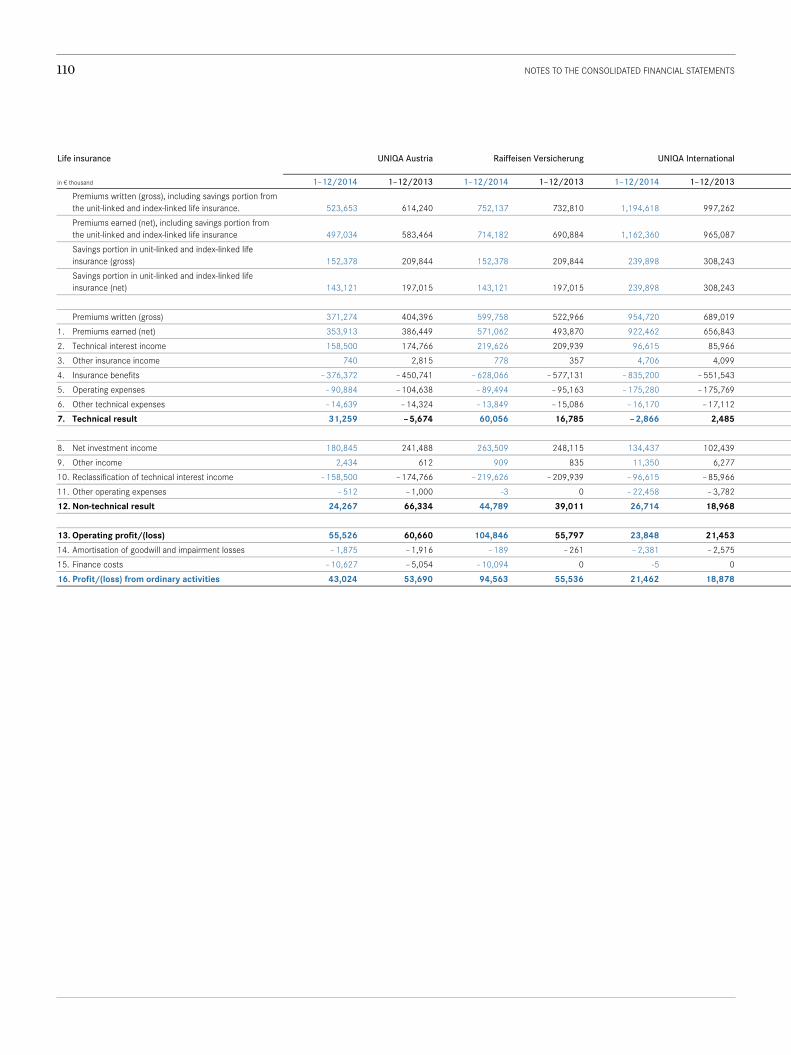
110 NOTES TO THE CONSOLIDATED FINANCIAL STATEMENTS
Life insurance UNIQA Austria Raiffeisen Versicherung UNIQA International
in € thousand 1–12/2014 1–12/2013 1–12/2014 1–12/2013 1–12/2014 1–12/2013Premiums written (gross), including savings portion from the unit-linked and index-linked life insurance. 523,653 614,240 752,137 732,810 1,194,618 997,262Premiums earned (net), including savings portion from the unit-linked and index-linked life insurance 497,034 583,464 714,182 690,884 1,162,360 965,087Savings portion in unit-linked and index-linked life insurance (gross) 152,378 209,844 152,378 209,844 239,898 308,243Savings portion in unit-linked and index-linked life insurance (net) 143,121 197,015 143,121 197,015 239,898 308,243 Premiums written (gross) 371,274 404,396 599,758 522,966 954,720 689,019
1. Premiums earned (net) 353,913 386,449 571,062 493,870 922,462 656,843 2. Technical interest income 158,500 174,766 219,626 209,939 96,615 85,966 3. Other insurance income 740 2,815 778 357 4,706 4,099 4. Insurance benefits – 376,372 – 450,741 – 628,066 – 577,131 – 835,200 – 551,543 5. Operating expenses – 90,884 – 104,638 – 89,494 – 95,163 – 175,280 – 175,769 6. Other technical expenses – 14,639 – 14,324 – 13,849 – 15,086 – 16,170 – 17,112 7. Technical result 31,259 – 5,674 60,056 16,785 – 2,866 2,485 8. Net investment income 180,845 241,488 263,509 248,115 134,437 102,439 9. Other income 2,434 612 909 835 11,350 6,277 10. Reclassification of technical interest income – 158,500 – 174,766 – 219,626 – 209,939 – 96,615 – 85,966 11. Other operating expenses – 512 – 1,000 -3 0 – 22,458 – 3,782 12. Non-technical result 24,267 66,334 44,789 39,011 26,714 18,968 13. Operating profit/(loss) 55,526 60,660 104,846 55,797 23,848 21,45314. Amortisation of goodwill and impairment losses – 1,875 – 1,916 – 189 – 261 – 2,381 – 2,575 15. Finance costs – 10,627 – 5,054 – 10,094 0 -5 0 16. Profit/(loss) from ordinary activities 43,024 53,690 94,563 55,536 21,462 18,878

111NOTES TO THE CONSOLIDATED FINANCIAL STATEMENTS
Reinsurance Group functionsand consolidation
Group
1–12/2014 1–12/2013 1–12/2014 1–12/2013 1–12/2014 1–12/2013 51,755 53,379 – 39,505 – 40,288 2,482,657 2,357,403 23,815 24,474 – 1,280 – 710 2,396,111 2,263,199 0 0 0 0 544,654 727,931 0 0 0 0 526,139 702,272 51,755 53,379 – 39,505 – 40,288 1,938,002 1,629,472 23,815 24,474 – 1,280 – 710 1,869,971 1,560,927 0 0 15,088 – 48,128 489,829 422,542 484 344 – 415 1,171 6,294 8,786 – 24,574 – 25,850 – 15,342 48,400 – 1,879,555 – 1,556,865 – 4,056 – 4,147 – 6,183 – 9,136 – 365,897 – 388,854 – 4,516 – 4,454 6,970 6,918 – 42,205 – 44,058 – 8,848 – 9,633 – 1,163 – 1,484 78,438 2,479 11,787 12,148 22,087 – 2,202 612,665 601,989 33 20 8,532 5,275 23,258 13,019 0 0 – 15,088 48,128 – 489,829 – 422,542 – 49 – 18 – 9,851 – 3,732 – 32,872 – 8,533 11,771 12,150 5,680 47,469 113,222 183,932 2,924 2,517 4,517 45,985 191,660 186,411 0 0 0 0 – 4,445 – 4,752 0 0 20,721 – 38 -5 – 5,092 2,924 2,517 25,238 45,947 187,210 176,568

112 NOTES TO THE CONSOLIDATED FINANCIAL STATEMENTS
UNIQA INTERNATIONAL CLASSIFIED ACCORDING TO REGIONS
Premiums earned (net) Net investment income
in € thousand 2014 2013 2014 2013Switzerland 8,592 7,817 251 219 Italy 777,831 514,900 79,525 73,801 Liechtenstein 1,223 2,342 1,616 2,288
Western Europe (WE) 787,646 525,059 81,392 76,308Czech Republic 111,833 119,161 7,178 8,486 Hungary 56,556 58,915 5,152 8,021 Poland 181,181 192,406 15,136 14,907 Slovakia 57,566 55,488 4,201 3,573
Central Europe (CE) 407,136 425,970 31,667 34,988Romania 58,081 71,893 4,526 5,394 Ukraine 59,278 80,576 9,766 5,883
Eastern Europe (EE) 117,358 152,469 14,292 11,277Albania 20,229 17,360 733 778 Bosnia and Herzegovina 22,683 21,448 2,404 2,044 Bulgaria 38,715 35,696 649 1,322 Croatia 54,445 23,745 17,282 6,207 Montenegro 9,918 8,653 594 525 Macedonia 9,977 9,343 343 323 Serbia 37,400 31,821 6,579 3,066 Kosovo 11,255 9,976 246 459
Southeastern Europe (SEE) 204,623 158,044 28,828 14,723Russia 65,578 64,332 19,541 6,006
Russia (RU) 65,578 64,332 19,541 6,006Austria 0 0 – 1,389 – 196
Administration 0 0 – 1,389 – 196UNIQA International 1,582,342 1,325,874 174,330 143,106of which
Profit/(loss) from ordinary activities Insurance Impairment (Romania)

113NOTES TO THE CONSOLIDATED FINANCIAL STATEMENTS
Insurance benefits Operating expenses Profit/(loss) from ordinary activities
2014 2013 2014 2013 2014 2013 – 6,718 – 6,493 – 3,162 – 3,010 910 460 – 751,926 – 484,717 – 73,009 – 65,436 21,444 24,478 – 6,527 – 811 – 2,125 – 2,098 – 4,656 – 88 – 765,172 – 492,021 – 78,296 – 70,545 17,698 24,850 – 68,989 – 69,026 – 39,182 – 47,992 10,283 10,823 – 25,329 – 15,743 – 32,890 – 40,870 – 4,642 1,717 – 116,624 – 122,167 – 67,078 – 68,988 9,852 9,423 – 34,879 – 31,517 – 20,547 – 21,294 6,474 6,996 – 245,821 – 238,454 – 159,698 – 179,143 21,967 28,958 – 44,889 – 54,689 – 23,621 – 34,605 – 35,533 – 15,972 – 24,697 – 38,178 – 41,279 – 43,316 7,273 5,914 – 69,586 – 92,866 – 64,899 – 77,921 – 28,261 – 10,058 – 8,179 – 7,795 – 9,602 – 9,682 3,225 907 – 16,638 – 14,742 – 8,105 – 8,347 1,004 1,045 – 25,887 – 19,957 – 17,907 – 16,418 – 4,587 329 – 42,722 – 18,769 – 22,292 – 9,426 3,985 1,197 – 5,312 – 4,736 – 5,088 – 5,255 – 334 – 1,162 – 5,152 – 3,937 – 4,934 – 6,293 535 – 115 – 20,218 – 21,989 – 17,153 – 14,815 2,820 – 3,371 – 4,787 – 4,404 – 4,618 – 5,655 1,192 405 – 128,895 – 96,329 – 89,699 – 75,891 7,840 – 766 – 44,163 – 40,448 – 16,826 – 24,375 5,693 5,373 – 44,163 – 40,448 – 16,826 – 24,375 5,693 5,373 0 0 – 25,429 – 26,793 – 26,102 – 26,819 0 0 – 25,429 – 26,793 – 26,102 – 26,819 – 1,253,637 – 960,118 – 434,847 – 454,669 – 1,164 21,539 49,938 48,358 – 25,000 0

114 NOTES TO THE CONSOLIDATED FINANCIAL STATEMENTS
CONSOLIDATED STATEMENT OF FINANCIAL POSITION DISCLOSURES 2014
Changes in asset items in € thousand
Carrying amounts31/12/2013
Currency difference
Additions Unrealised gains and losses
A. Property, plant and equipment I. Land and buildings for own use 198,433 – 2,269 10,488 0II. Other property, plant and equipment
1. Other property, plant and equipment 59,496 – 1,293 20,221 02. Inventories 5,661 0 3. Other assets 22,998 13,317 Total A. II. 88,156 – 1,293 33,539 0
Total A. 286,589 – 3,562 44,026 0B. Investment property 1,652,485 – 23,126 57,482 0C. Intangible assets
I. Deferred acquisition costs 994,501 – 18,263 265,859 0II. Goodwill
1. Goodwill 471,780 – 11,553 16,739 02. Insurance contract portfolio 38,394 – 34 7,025 0Total C. II. 510,174 – 11,587 23,764 0
III. Other intangible assets 1. Internally-developed software 2,881 – 226 7,158 02. Purchased intangible assets 21,574 – 682 37,703 0Total C. III. 24,455 – 908 44,861 0
Total C. 1,529,131 – 30,758 334,483 0D. Investment in associates 545,053 0 18 – 7,445E. Investments
I. Variable-income securities 1. Shares, units and other variable-income securities, including equity investments and shares in affiliated companies 863,810 – 586 190,550 – 19,8342. At fair value through profit or loss 131,264 0 16,705 0Total E. I. 995,074 – 586 207,255 – 19,834
II. Fixed-income securities 1. Debt securities and other fixed-income securities 15,136,246 – 47,113 9,053,049 1,336,4612. At fair value through profit or loss 439,374 – 30 110,607 0Total E. II. 15,575,620 – 47,142 9,163,656 1,336,461
III. Loans and other investments 1. Loans
a) Debt securities issued by and loans to affiliated companies 1,759 0 143 0b) Debt securities issued by and loans to other long-term investees and investors 1,955 0 57 0c) Mortgage receivables 42,831 0 2,920 0d) Loans and advance payments on policies 12,051 24 11,658 0e) Other loan receivables and registered bonds 886,217 167 3,518 3,057Total E. III. 1. 944,813 191 18,296 3,057
2. Bank balances 1,273,852 – 16,636 8,843 – 1,449 3. Deposits retained on assumed reinsurance 126,761 0 1,197 0 Total E. III. 2,345,426 – 16,445 28,336 1,608
IV. Derivative financial instruments (trading portfolio) 73,381 14 97,330 0 V. Investments under investment agreements 48,590 – 557 5,631 0 Total E. 19,038,091 – 64,716 9,502,208 1,318,234
F. Unit-linked and index-linked life insurance investments 5,332,611 – 15,076 2,345,571 25,956 Grand total 28,383,959 – 137,237 12,283,789 1,336,745

115NOTES TO THE CONSOLIDATED FINANCIAL STATEMENTS
Redemption Reclassifications Disposals Reversal of impairment losses
Depreciation, amortisation and impairment losses
Carrying amount31/12/2014
0 – 3,421 7,216 0 8,268 187,746 0 – 4,151 3,674 0 16,462 54,138 354 5,307 0 36,315 0 – 4,151 4,028 0 16,462 95,760 0 – 7,573 11,244 0 24,731 283,506 0 7,573 110,905 38 79,066 1,504,483 0 0 0 0 243,145 998,952 0 0 0 0 25,000 451,966 0 0 0 0 7,292 38,093 0 0 0 0 32,292 490,059 0 0 5,161 0 637 4,014 0 0 4,461 0 30,103 24,032 0 0 9,621 0 30,740 28,046 0 0 9,621 0 306,177 1,517,058 0 0 28,554 21,390 1,781 528,681 1 6,257 392,988 6,315 28,335 625,189 0 – 121 48,803 10,851 11,891 98,005 1 6,136 441,792 17,166 40,226 723,194 – 24,674 279 7,529,555 121,530 29,901 18,016,323 – 460 121 159,566 32,833 58,249 364,630 – 25,134 400 7,689,121 154,363 88,149 18,380,953 0 0 101 0 0 1,800 0 0 2,012 0 0 0 0 0 10,723 642 1,019 34,651 0 0 9,488 0 9 14,236 2,391 – 7,056 100,031 931 4,279 784,916 2,391 – 7,056 122,356 1,574 5,306 835,603 – 41 0 881,524 8,096 1,096 390,046 0 0 4,405 0 0 123,554 2,350 – 7,056 1,008,285 9,670 6,402 1,349,202 0 0 55,049 46,657 39,993 122,340 0 0 0 0 0 53,664 – 22,783 – 520 9,194,247 227,857 174,770 20,629,354 0 520 2,467,813 269,202 104,321 5,386,650 – 22,783 0 11,822,385 518,487 690,845 29,849,731

116 NOTES TO THE CONSOLIDATED FINANCIAL STATEMENTS
CONSOLIDATED STATEMENT OF FINANCIAL POSITION DISCLOSURES 2013
Changes in asset items in € thousand
Carrying amount31/12/2012
Currency difference
Additions Unrealised gains and losses
A. Property, plant and equipment I. Land and buildings for own use 194,151 – 2,381 24,651 0II. Other property, plant and equipment
1. Other property, plant and equipment 58,342 – 375 19,303 02. Inventories 5,465 196 3. Other assets 48,796 0 Total A. II. 112,604 – 375 19,499 0
Total A. 306,755 – 2,756 44,150 0B. Investment property 1,690,763 – 5,772 61,315 0C. Intangible assets
I. Deferred acquisition costs 931,981 – 4,117 265,135 0II. Goodwill
1. Goodwill 477,964 – 3,691 0 02. Insurance contract portfolio 45,789 – 94 0 0Total C. II. 523,753 – 3,785 0 0
III. Other intangible assets 1. Internally-developed software 2,460 – 47 852 02. Purchased intangible assets 22,709 – 472 10,595 0Total C. III. 25,170 – 519 11,447 0
Total C. 1,480,903 – 8,420 276,582 0D. Investment in associates 544,522 0 0 – 11,367E. Investments
I. Variable-income securities 1. Shares, units and other variable-income securities, including equity
investments and shares in affiliated companies 1,399,352 – 814 284,264 – 7,8072. At fair value through profit or loss 371,262 -2 89,534 0Total E. I. 1,770,614 – 816 373,797 – 7,807
II. Fixed-income securities 1. Debt securities and other fixed-income securities 13,186,622 – 31,434 6,429,167 – 166,9012. At fair value through profit or loss 441,623 1 33,259 0Total E. II. 13,628,244 – 31,433 6,462,426 – 166,901
III. Loans and other investments 1. Loans
a) Debt securities issued by and loans to affiliated companies 1,421 -2 482 0b) Debt securities issued by and loans to other long-term investees and investors 552 0 4,082 0c) Mortgage receivables 51,399 0 1,045 0d) Loans and advance payments on policies 13,011 -6 3,753 0e) Other loan receivables and registered bonds 1,023,265 – 366 7,880 3,636Total E. III. 1. 1,089,649 – 374 17,243 3,636
2. Bank balances 1,189,217 – 10,593 84,959 881 3. Deposits retained on assumed reinsurance 129,755 0 1,126 0 Total E. III. 2,408,621 – 10,966 103,327 4,517
IV. Derivative financial instruments (trading portfolio) 62,206 – 36 78,784 0 V. Investments under investment agreements 43,064 0 5,526 0 Total E. 17,912,749 – 43,252 7,023,861 – 170,192
F. Unit-linked and index-linked life insurance investments 5,023,764 – 10,859 1,988,256 1,272 Grand total 26,959,457 – 71,060 9,394,164 – 180,286

117NOTES TO THE CONSOLIDATED FINANCIAL STATEMENTS
Redemption Reclassifications Disposals Reversal of impairment losses
Depreciation, amortisation and impairment losses
Carrying amounts31/12/2013
0 – 10,673 229 0 7,087 198,433 0 – 376 2,297 0 15,101 59,496 0 5,661 25,799 22,998 0 – 376 28,095 0 15,101 88,156 0 – 11,049 28,324 0 22,188 286,589 0 11,045 41,142 0 63,723 1,652,485 0 0 0 0 198,498 994,501 0 0 2,493 0 0 471,780 0 0 0 0 7,301 38,394 0 0 2,493 0 7,301 510,174 0 351 102 0 633 2,881 0 – 347 2,091 21 8,842 21,574 0 3 2,193 21 9,474 24,455 0 3 4,687 21 215,272 1,529,131 0 0 7,964 24,471 4,609 545,053 -5 0 778,690 3,954 36,443 863,810 – 339 0 329,133 15,688 15,746 131,264 – 344 0 1,107,823 19,643 52,189 995,074 2,199 – 303 4,154,517 86,079 214,665 15,136,246 1,848 0 37,111 16,638 16,884 439,374 4,047 – 303 4,191,628 102,717 231,549 15,575,620 0 0 142 0 0 1,759 0 0 2,679 0 0 1,955 0 – 1,293 9,433 1,112 0 42,831 0 0 4,718 31 21 12,051 922 1,293 149,647 16 783 886,217 922 0 166,620 1,159 804 944,813 41 0 0 9,926 579 1,273,852 0 0 4,119 0 0 126,761 963 0 170,739 11,086 1,383 2,345,426 0 0 52,114 43,736 59,194 73,381 0 0 0 0 0 48,590 4,667 – 303 5,522,305 177,181 344,316 19,038,091 790 303 1,727,634 130,114 73,395 5,332,611 5,456 0 7,332,056 331,787 723,502 28,383,959

118 NOTES TO THE CONSOLIDATED FINANCIAL STATEMENTS
1. Land and buildings for own use
in € thousand 31/12/2014 31/12/2013Carrying amount by segment
Property and casualty insurance 82,868 85,728Health insurance 10,963 11,545Life insurance 93,915 101,159
187,746 198,433Fair value by segment
Property and casualty insurance 105,658 115,391Health insurance 13,849 14,648Life insurance 150,082 148,060
269,589 278,098Cost 288,860 295,133Accumulated depreciation – 101,114 – 96,701Carrying amounts 187,746 198,433 Useful life of land and buildings 10–80 years 10–80 years
Additions from company acquisitions in € thousand
31/12/2014 31/12/2013
Land and buildings for own use 4,589 0
The fair values are derived from expert reports.
2. Other property, plant and equipment
in € thousand 31/12/2014 31/12/2013Other property, plant and equipment 54,138 59,496Inventories 5,307 5,661Other assets 36,315 22,998Total 95,760 88,156
Other property, plant and equipment Changes in the financial year in € thousand Cost at 31/12/2013 205,775Accumulated depreciation at 31/12/2013 – 146,278Carrying amount at 31/12/2013 59,496 Changes due to currency translation – 1,293Additions 20,221Disposals – 3,674Reclassifications – 4,151Depreciation, impairment losses and reversal of impairment losses – 16,462Carrying amount as at 31/12/2014 54,138 Cost as at 31/12/2014 212,585Accumulated depreciation at 31/12/2014 – 158,447Carrying amount as at 31/12/2014 54,138

119NOTES TO THE CONSOLIDATED FINANCIAL STATEMENTS
Property, plant and equipment refers mainly to operating and office equipment. It is depreciat-ed over its useful life of 4 to 10 years. The depreciation charges are recognised in the income statement on the basis of allocated operating expenses under the items insurance benefits, operating expenses and net investment income.
Additions from company acquisitions in € thousand
31/12/2014 31/12/2013
Other property, plant and equipment 2,118 0
3. Investment property
in € thousand 31/12/2014 31/12/2013Carrying amount by segment
Property and casualty insurance 219,380 216,642Health insurance 312,145 287,568Life insurance 972,958 1,148,275
1,504,483 1,652,485Fair value by segment
Property and casualty insurance 384,130 343,874Health insurance 497,845 366,289Life insurance 1,354,047 1,662,408
2,236,021 2,372,571Cost 2,109,251 2,217,125Accumulated depreciation – 604,769 – 564,640Carrying amounts 1,504,483 1,652,485 Useful lives for land and buildings 10–80 years 10–80 years
Additions from company acquisitions in € thousand
31/12/2014 31/12/2013
Investment property 9,835 0
The fair values are derived from expert reports.
in € thousand 31/12/2014Change in impairment in current year 33,282
of which recognised in profit or loss 33,282

120 NOTES TO THE CONSOLIDATED FINANCIAL STATEMENTS
4. Deferred acquisition costs
in € thousand 2014 2013Property and casualty insurance
At 1/1 162,718 163,273Changes due to currency translation – 3,507 – 2,231Change in basis of consolidation 564 0Additions 99,338 97,783Amortisation – 95,005 – 96,107At 31/12 164,107 162,718
Health insurance At 1/1 222,472 222,889Changes due to currency translation – 142 – 284Change in basis of consolidation 0 0Additions 10,152 12,300Interest capitalised 7,571 7,466Amortisation – 17,122 – 19,898At 31/12 222,933 222,472
Life insurance At 1/1 609,311 545,819Changes due to currency translation – 14,614 – 1,602Change in basis of consolidation 10,564 0Additions 128,751 132,608Interest capitalised 8,918 14,978Amortisation – 131,019 – 82,492At 31/12 611,912 609,311
In the consolidated financial statementsAt 1/1 994,501 931,981Changes due to currency translation – 18,263 – 4,117Change in basis of consolidation 11,128 0Additions 238,241 242,691Interest capitalised 16,490 22,444Amortisation – 243,145 – 198,498At 31/12 998,952 994,501
5. Goodwill
in € thousand
Goodwill Insurance contract
portfolioCost at 31/12/2013 567,646 175,942Accumulated amortisation and impairment losses at 31/12/2013 – 95,866 – 137,548Carrying amount at 31/12/2013 471,780 38,394 Cost as at 31/12/2014 572,951 169,340Accumulated amortisation at 31/12/2014 – 120,985 – 131,246Carrying amount at 31/12/2014 451,966 38,093
There were additions in 2014 in Croatia and Serbia – see also information on the basis of consol-idation, page 106. An impairment loss of €25,000 thousand was recognised on the goodwill of the Romanian company UNIQA Asigurari S.A. (UNIQA International segment). This amount is

121NOTES TO THE CONSOLIDATED FINANCIAL STATEMENTS
included in item 14 amortisation of goodwill and impairment losses on the consolidated income statement.
in € thousand
Goodwill Insurance contract
portfolioAccumulated amortisation at 31/12/2014 120,985 131,246
of which impairment losses 82,661 0of which current amortisation 38,324 131,246
in € thousand 31/12/2014Change in impairment in current year 25,000
of which recognised in profit or loss 25,000
Due to the continuing difficult market environment in Romania, the budget figures were re-vised, resulting in a need for impairment.
Goodwill per country in € thousand
31/12/2014 31/12/2013
Austria 39,757 39,757Germany 930 930Italy 121,718 121,718Western Europe (WE) 122,647 122,647Czech Republic 7,647 7,733Hungary 16,996 18,063Poland 27,828 28,624Slovakia 1,423 1,423Central Europe (CE) 53,894 55,842Romania 105,198 126,394Ukraine 16,223 28,438Eastern Europe (EE) 121,421 154,832Albania 20,259 20,170Bosnia and Herzegovina 1,887 1,887Bulgaria 55,926 55,926Croatia 16,578 384Montenegro 81 81Serbia 19,403 20,104Cyprus 63 63Southaastern Europe (SEE) 114,197 98,614Russia (RU) 49 87Total 451,966 471,780

122 NOTES TO THE CONSOLIDATED FINANCIAL STATEMENTS
Company acquisitions 2014in € thousand
Amounts recognised at the
time of acquisition
Carrying amount of the acquired
companiesAssets 357,816 357,816Property, plant and equipment 6,706 6,706Investment property 9,835 9,835Intangible assets 18,987 18,987Investment in associates 0 0Investments 298,986 298,986Unit-linked and index-linked life insurance investments 4 4Reinsurers' share of technical provisions 2,867 2,867Receivables including insurance receivables 17,199 17,199Income tax receivables 0 0Deferred tax assets 131 131Current bank balances and cash-in-hand 3,100 3,100 Equity and liabilities 357,816 357,816Total equity 58,405 58,405Subordinated liabilities 0 0Technical provisions 283,375 283,375Technical provisions for unit-linked and index-linked life insurance 4 4Financial liabilities 0 0Other provisions 136 136Liabilities and other items classified as equity and liabilities 13,716 13,716Income tax liabilities 0 0Deferred tax liabilities 2,180 2,180Currency difference at first entry 0 0
6. Other intangible assets
in € thousand
Internally-developed
software
Purchasedintangible
assetsCost at 31/12/2013 40,560 137,329Accumulated amortisation at 31/12/2013 – 37,679 – 115,755Carrying amount at 31/12/2013 2,881 21,574 Cost as at 31/12/2014 14,253 168,705Accumulated amortisation at 31/12/2014 – 10,238 – 144,673Carrying amount as at 31/12/2014 4,014 24,032
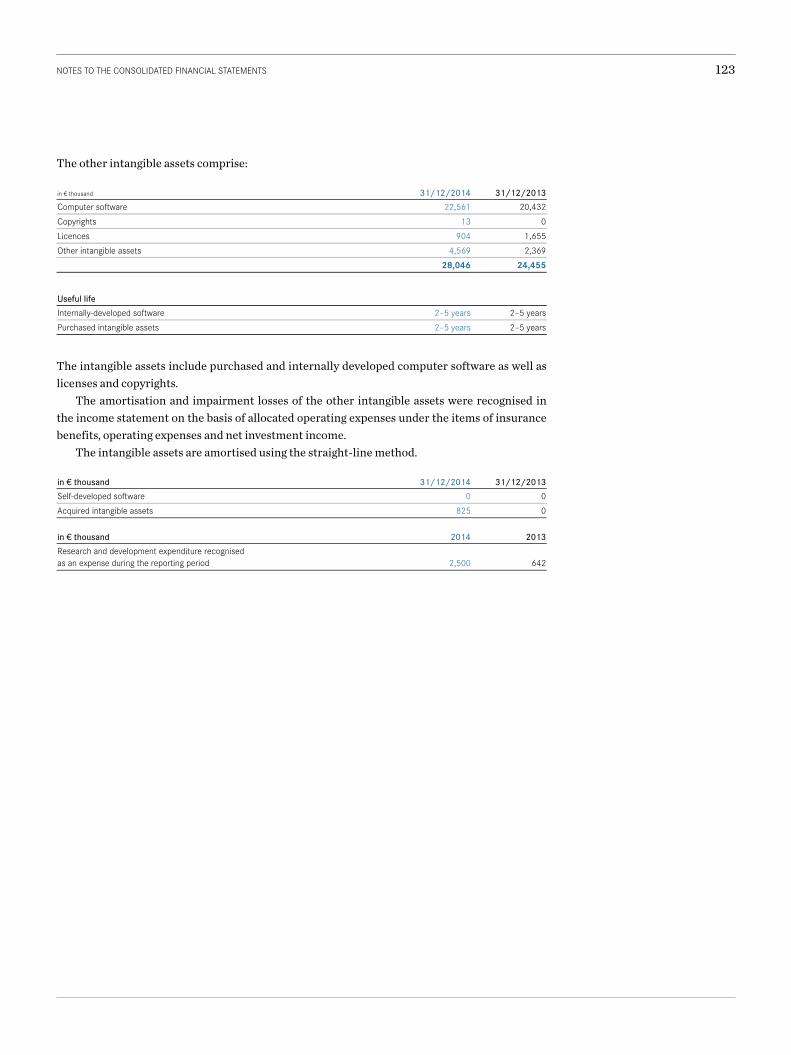
123NOTES TO THE CONSOLIDATED FINANCIAL STATEMENTS
The other intangible assets comprise:
in € thousand 31/12/2014 31/12/2013Computer software 22,561 20,432Copyrights 13 0Licences 904 1,655Other intangible assets 4,569 2,369 28,046 24,455
Useful life Internally-developed software 2–5 years 2–5 yearsPurchased intangible assets 2–5 years 2–5 years
The intangible assets include purchased and internally developed computer software as well as licenses and copyrights.
The amortisation and impairment losses of the other intangible assets were recognised in the income statement on the basis of allocated operating expenses under the items of insurance benefits, operating expenses and net investment income.
The intangible assets are amortised using the straight-line method.
in € thousand 31/12/2014 31/12/2013Self-developed software 0 0Acquired intangible assets 825 0 in € thousand 2014 2013Research and development expenditure recognised as an expense during the reporting period 2,500 642

124 NOTES TO THE CONSOLIDATED FINANCIAL STATEMENTS
7. Investments in companies accounted for under the equity method
in € thousand 31/12/2014 31/12/2013Carrying amounts for
Investments in companies accounted for under the equity method 528,681 545,053
Investments in associates of minor importance are shown on the balance sheet under variable-income securities as available for sale (Assets E. I. 1.). The Group now owns just 50 per cent of Dekra Expert Muszaki Szakertöi Kft., which was consolidated up until now. Therefore, this company is managed as a company accounted for under equity method accounting as of 31 December 2014. Investment in associates in € thousand
31/12/2014 31/12/2013
Fair value of associates listed on a public stock exchange (STRABAG SE) 285,029 355,040Profits/losses for the period 19,970 20,023
Because of the later publication of Strabag SE’s financial accounting that is relevant for the stock exchange, the information regarding the 2014 financial year was published in accordance with IFRS 12 with the amounts from 30 September 2014. To estimate the profit/(loss) for the full year, information was used that is available to the Group because of its significant influence. Statement of financial position and profit/(loss) figures for companies accounted for under the equity method in € thousand
Strabag (30/9/2014)
Other (31/12/2013)
Strabag (30/9/2013)
Other(31/12/2012)
Statement of financial position Cash and cash equivalents 1,135,414 25,133 1,064,745 33,273Other current assets 4,955,002 422,304 4,732,573 472,510Current assets 6,090,416 447,437 5,797,318 505,783Non-current assets 4,404,058 173,038 4,501,962 157,449Total assets 10,494,474 620,475 10,299,280 663,232 Current financial liabilities 2,324,559 103,325 396,380 84,992Other current liabilities 1,517 59,487 4,284,157 33,992Current liabilities 2,326,076 162,812 4,680,537 118,984Non-current financial liabilities 4,608,441 248,955 1,377,912 301,652Other non-current liabilities 391,310 16,079 1,129,817 32,143Non-current liabilities 4,999,751 265,034 2,507,729 333,795Total liabilities 7,325,827 427,846 7,188,266 452,779 Consolidated income statement Sales 8,892,290 161,955 8,806,467 147,226Depreciation, amortisation and impairment losses – 285,543 – 3,277 – 289,222 – 1,940Interest income 44,177 15,224 45,850 47Interest expenses 69,031 – 32,776 – 64,456 – 10,320Profit before taxes 39,425 3,126 21,021 – 72,996Taxes on income – 19,150 – 10,972 – 12,459 – 3,581Profit after taxes 20,275 – 7,917 8,562 – 77,780Other comprehensive income – 32,463 6 – 13,467 0Total comprehensive income – 12,188 – 7,911 – 4,905 – 77,780

125NOTES TO THE CONSOLIDATED FINANCIAL STATEMENTS
Shares in equity-accounted companies in € thousand
2014 2013
Carrying amount at 1/1 545,053 544,522Additions 18 0Disposals – 20,690 – 4,017Total adjustment to comprehensive income 12,164 8,495dividends received – 7,865 – 3,947Carrying amount at 31/12 528,681 545,053
8. Assets and liabilities in disposal groups held for sale
in € thousand 31/12/2014 31/12/2013Assets A. Property, plant and equipment
II. Other property, plant and equipment 7 0E. Investments
II. Fixed-income securities 1. Available for sale 43,909 0
III. Loans and other investments 1. Loans 8,317 0
F. Unit-linked and index-linked life insurance investments 96,368 0I. Receivables, including insurance receivables
II. Other receivables 1,485 0III. Other assets 6 0
J. Income tax receivables 4 0K. Deferred tax assets 58 0L. Current bank balances and cash-in-hand 10,899 0M. Assets in disposal groups held for sale 161,053 0
in € thousand 31/12/2014 31/12/2013Equity and liabilities C. Technical provisions
II. Insurance provision 58,682 0III. Provision for unsettled claims 983 0V. Provision for profit-related premium refunds and/or policyholder profit participation 2,573 0
D. Technical provisions for unit-linked and index-linked life insurance 96,072 0
F. Other provisions II. Other provisions 38 0
G. Liabilities and other items classified as equity and liabilities II. Other liabilities 380 0
H. Income tax liabilities 1 0I. Deferred tax liabilities 377 0J. Liabilities in disposal groups held for sale 159,107 0
The sale of UNIQA Lebensversicherung AG, Vaduz, was decided in the fourth quarter of 2014, and the asset and liability items for this company are broken down here.

126 NOTES TO THE CONSOLIDATED FINANCIAL STATEMENTS
9. Available-for-sale securities
Type of investment Cost Fluctuation in value not recognised in profit or loss
Accumulated valuation allowances
Exchange differences through profit or loss
Fair values
in € thousand 31/12/2014 31/12/2013 31/12/2014 31/12/2013 31/12/2014 31/12/2013 31/12/2014 31/12/2013 31/12/2014 31/12/2013Shares in affiliated companies 21,708 17,587 0 0 0 0 0 0 21,708 17,587Equity 48,393 134,805 4,278 99,297 – 22,155 – 21,578 0 0 30,516 212,524Equity funds 267,141 271,512 29,567 32,889 – 19,386 – 18,926 0 0 277,322 285,475Bonds not capital-guaranteed 27,812 207,731 – 122 – 840 – 11,842 – 24,903 0 0 15,848 181,987Other variable-income securities 30,097 34,094 – 3,696 – 32 0 0 0 0 26,402 34,063Equity investments and other investments 217,430 139,759 65,833 10,909 – 29,869 – 18,495 0 0 253,394 132,174Fixed-income securities 16,647,139 15,143,349 1,536,105 335,193 – 190,599 – 246,556 23,677 – 95,741 18,016,323 15,136,246Total 17,259,720 15,948,837 1,631,966 477,417 – 273,851 – 330,458 23,677 – 95,741 18,641,512 16,000,055
Type of investment Accumulated valuation
allowancesof which
prior year cumulative of which
current yearin € thousand 31/12/2014 31/12/2013 31/12/2014 31/12/2013 31/12/2014 31/12/2013Shares in affiliated companies 0 0 0 0 0 0Equity – 22,155 – 21,578 – 20,611 – 11,109 – 1,543 – 10,470Equity funds – 19,386 – 18,926 – 18,024 – 12,985 – 1,362 – 5,941Bonds not capital-guaranteed – 11,842 – 24,903 – 8,436 – 14,403 – 3,406 – 10,500Other variable-income securities 0 0 0 0 0 0Equity investments and other investments – 29,869 – 18,495 – 16,007 – 15,407 – 13,862 – 3,088Fixed-income securities – 190,599 – 246,556 – 180,485 – 207,349 – 10,114 – 39,208Total – 273,851 – 330,458 – 243,564 – 261,252 – 30,287 – 69,206
Type of investment Change in valuation
allowance current year
of which impairment/
reversal of impairment loss
through profit or loss
of which change
due to disposal
Reversal of impairment loss –
equity
in € thousand 31/12/2014 31/12/2014 31/12/2014 31/12/2014Shares in affiliated companies 0 0 0 0Equity – 576 – 1,543 945 22Equity funds – 461 – 1,362 703 198Bonds not capital-guaranteed 13,061 – 3,406 16,467 0Other variable-income securities 0 0 0 0Equity investments and other investments – 11,374 – 13,862 2,488 0Fixed-income securities 55,957 – 10,114 66,071 0Total 56,607 – 30,287 86,674 220
Change in equity Recognised directly in
equityWithdrawal through profit
or loss1)
Change in unrealised gains/losses
in € thousand 31/12/2014 31/12/2013 31/12/2014 31/12/2013 31/12/2014 31/12/2013Other available-for-sale securities2) Gross 1,318,234 – 170,192 – 174,736 – 239,082 1,143,498 – 409,274Deferred tax – 127,346 21,194 11,112 28,104 – 116,234 49,299Deferred profit participation – 893,479 76,778 98,135 150,511 – 795,344 227,290Proportion of non-controlling interests 1,326 158 399 428 1,725 586Net 298,735 – 72,062 – 65,090 – 60,038 233,645 – 132,099 1) Withdrawals through profit or loss due to disposals and impairments. 2) Including reclassified securities.

127NOTES TO THE CONSOLIDATED FINANCIAL STATEMENTS
Hierarchy for instruments that are reported in the statement of financial position at current fair value The table below depicts the financial instruments for which subsequent valuation is performed at the current market value. Assets at fair value Level 1 Level 2 Level 3 Group totalin € thousand 31/12/2014 31/12/2014 31/12/2014 31/12/2014Available-for-sale securities 14,164,806 3,852,616 624,090 18,641,512
Shares in affiliated companies 103 21,593 12 21,708Shares 6,908 23,285 323 30,516Equity funds 224,880 52,442 0 277,322Bonds not capital-guaranteed 3,506 12,342 0 15,848Other variable-income securities 0 26,402 0 26,402Equity investments and other investments 0 59,359 194,035 253,394Fixed-income securities 13,929,409 3,657,195 429,719 18,016,323
Assessed at fair value through profit or loss 158,976 295,468 8,191 462,635Derivative financial instruments1) 0 89,851 0 89,851Total 14,323,782 4,237,935 632,281 19,193,998 1) See Table 10 for details
No transfers between Levels 1 and 2 took place during the reporting period. The entire portfolio of asset-backed securities was classified as Level 3 within fixed-income securities. Other shares and equity investments (RZB shares) for which there is a valuation report were also classified in Level 3. Otherwise, there are no other Level 3 assets as at 31 December 2014. Assets at fair value Level 1 Level 2 Level 3 Group totalin € thousand 31/12/2013 31/12/2013 31/12/2013 31/12/2013Available-for-sale securities 13,266,081 2,006,732 727,242 16,000,055
Shares in affiliated companies 175 17,400 12 17,587Shares 13,868 21,663 176,993 212,524Equity funds 260,289 25,185 1 285,475Bonds not capital-guaranteed 7,946 174,042 0 181,987Other variable-income securities 0 34,063 0 34,063Equity investments and other investments 1,119 61,527 69,527 132,174Fixed-income securities 12,982,685 1,672,853 480,708 15,136,246
Assessed at fair value through profit or loss 182,152 382,768 5,718 570,638Derivative financial instruments1) 561 64,519 0 65,079Total 13,448,794 2,454,019 732,959 16,635,773 1) See Table 10 for details
There were also no transfers made between Levels 1 and 2 in the previous year. The entire port-folio of asset-backed securities was classified as Level 3 within fixed-income securities. Other shares (RZB shares) and equity investments for which there is a valuation report were also classified in Level 3. Otherwise there are no other Level 3 assets as at 31 December 2013.

128 NOTES TO THE CONSOLIDATED FINANCIAL STATEMENTS
Reconciliation of Level 3 fair value measurements for financial assets:
Level 3 assets at fair valuein € thousand
Available-for-sale securities
Assessed at fair value through profit or loss
Derivative financial instruments
Total
At 1/1/2014 727,242 5,718 0 732,959Foreign exchange differences -1 0 0 -1Total gains/losses included in income statement 24,244 1,762 0 26,006Total gains/losses included in equity (revaluation reserve) – 6,404 0 0 – 6,404Purchases 7,864 901 0 8,766Sales – 128,993 – 52 0 – 129,045Issues 0 0 0 0Redemptions 0 0 0 0Amounts carried forward 138 – 138 0 0At 31/12/2014 624,090 8,191 0 632,281
The sensitivity analysis is mainly concerned with the ABS portfolio and the RZB shares.
The sensitivity analysis of the ABS portfolio with regard to a rise or a fall in the default rates in the investments underlying the ABS structures is based on the forecast values from Moody’s Investors Service.
The sensitivities for these model-based analyses of the securities are also determined using Moody’s default scenarios. According to Moody’s, these default scenarios correspond to the 10 per cent quantile or the 90 per cent quantile of the distribution function of the defaults.
Sensitivity analysis ABS 2014in € thousand
Upside Downside
Total gains/losses 195 – 1,245Through profit or loss 65 – 260Through equity 130 – 985
The sensitivity analysis of the RZB shares was determined in the course of a valuation report and relates to a change in the discount interest rate and the increase or decrease in the growth rate.
Sensitivity analysis RZB 2014in € thousand
Upside Downside
Effect of changes in the discount insurance rate (+/– 1 per cent) 18,600 – 14,900Through profit or loss 0 0Through equity 18,600 – 14,900
Effect of changes in the growth rate (+/– 1 per cent) 300 – 400Through profit or loss 0 0Through equity 300 – 400

129NOTES TO THE CONSOLIDATED FINANCIAL STATEMENTS
Level 3 assets at fair value in € thousand
Available-for-sale securities
At fair value through profit or
loss
Derivative financial
instruments
Total
As at 1/1/2013 598,483 4,659 0 603,143Foreign exchange differences 11 0 0 11Total gains/losses included in income statement – 19,916 1,047 0 – 18,869Total gains/losses included in equity (revaluation reserve) 10,393 0 0 10,393Purchases 2,858 386 0 3,244Sales – 147,400 0 0 – 147,400Issues 0 0 0 0Redemptions -2 – 100 0 – 103Amounts carried forward 282,815 – 274 0 282,541At 31/12/2013 727,242 5,718 0 732,959
The sensitivity analysis is mainly concerned with the ABS portfolio and the RZB shares.
The sensitivity analysis of the ABS portfolio with regard to a rise or a fall in the default rates in the investments underlying the ABS structures is based on the forecast values from Moody’s Investors Service.
The sensitivities for these model-based analyses of the securities are also determined using Moody’s default scenarios. According to Moody’s, these default scenarios correspond to the 10 per cent quantile or the 90 per cent quantile of the distribution function of the defaults.
Sensitivity analysis ABS 2013 in € thousand
Upside Downside
Total gains/losses 300 – 2,300Through profit or loss 0 – 2,800Through equity 300 500
The sensitivity analysis of the RZB shares was determined in the course of a valuation report and refers to a change in the discount interest rate and the increase or decrease of the growth rate.
Sensitivity analysis RZB 2013 in € thousand
Upside Downside
Effect of changes in the discount insurance rate (+/– 1 per cent) 15,500 – 13,600Through profit or loss 0 0Through equity 15,500 – 13,600
Effect of changes in the growth rate (+/– 1 per cent) 13,600 – 9,700Through profit or loss 0 0Through equity 13,600 – 9,700
Default risk rating in € thousand
31/12/2014
Issuer countries Equity securities IE, NL, UK, US 92,286AT, BE, CH, DE, DK, FR, IT 75,889ES, FI, NO, SE 0Remaining EU 106,859Other countries 32,803
Issuer countries equity securities total 307,837Other equity investments 253,394Total variable-income securities 561,231

130 NOTES TO THE CONSOLIDATED FINANCIAL STATEMENTS
10. Derivative financial instruments
in € thousand 31/12/2014 31/12/2013Fair values Equity risk 60,975 37,950Interest rate risk 10,977 – 7,021Foreign currency risk 17,899 34,150Total 89,851 65,079 Statement of financial position disclosuresInvestments 122,340 73,381Financial liabilities – 32,489 – 8,301
11. Loans
Carrying amountsin € thousand 31/12/2014 31/12/2013Loans to affiliated companies 1,800 1,759Loans to other long-term investees and investors 0 1,955Mortgages 34,651 42,831Loans and advance payments on policies 14,236 12,051Other loans 69,260 91,100Registered bonds 0 7,056Reclassified bonds 715,656 788,061Total 835,603 944,813
Impairments in € thousand
31/12/2014 31/12/2013
Cumulative impairment losses 30,382 31,094
On 1 July 2008, securities previously available for sale were reclassified in accordance with IAS 39/50E as other loans. Overall, fixed-income securities with a carrying amount of €2,129,552 thousand were reclassified. The corresponding revaluation reserve as at 30 June 2008 was €98,208 thousand.
Reclassified bonds in € thousand
2014 2013 2012 2011 2010 2009 2008
Carrying amount at 31/12 715,656 788,061 906,435 1,089,093 1,379,806 1,796,941 2,102,704Fair value at 31/12 759,872 812,455 928,162 981,394 1,345,580 1,732,644 1,889,108Change in fair value 19,822 129,426 129,426 – 73,987 30,586 149,299 – 213,596Redemption income/expense 2,391 348 348 332 473 5,917 – 61Impairment – 3,539 0 0 – 25 – 8,043 0 0
Contractual maturities Carrying amountsin € thousand 31/12/2014 31/12/2013No maturity date 10,647 10,542Up to 1 year 432,470 439,866More than 1 year up to 5 years 256,381 271,800More than 5 years up to 10 years 56,880 135,993More than 10 years 79,225 86,612Total 835,603 944,813

131NOTES TO THE CONSOLIDATED FINANCIAL STATEMENTS
Fair valuesin € thousand 31/12/2014 31/12/2013Loans to affiliated companies 1,800 1,759Loans to other long-term investees and investors 0 1,955Mortgages 34,651 42,831Loans and advance payments on policies 14,236 12,051Other loans 69,260 91,100Registered bonds 0 7,056Reclassified bonds 759,872 812,455Total 879,818 969,206
Contractual maturities Fair valuesin € thousand 31/12/2014 31/12/2013No maturity date 10,647 10,542Up to 1 year 426,904 424,837More than 1 year up to 5 years 282,047 294,004More than 5 years up to 10 years 61,301 145,356More than 10 years 98,920 94,466Total 879,818 969,206
Impairment in € thousand
31/12/2014 31/12/2013
Change in impairment in current year 5,507 804of which recognised in profit or loss 5,507 804
12. Other investments
in € thousand 31/12/2014 31/12/2013Bank deposits 390,046 1,273,852Deposits retained on assumed reinsurance 123,554 126,761Total 513,600 1,400,614

132 NOTES TO THE CONSOLIDATED FINANCIAL STATEMENTS
13. Receivables including insurance receivables
in € thousand 31/12/2014 31/12/2013I. Reinsurance receivables
1. Reinsurance settlement receivables 45,883 84,821 45,883 84,821II. Other receivables
Insurance receivables1. from policyholders 298,295 270,6502. from insurance brokers 66,628 77,4633. from insurance companies 19,842 21,262
384,765 369,374Other receivablesInterest and rent 244,462 232,116Other tax refund claims 58,583 37,776Receivables from employees 3,055 3,208Other receivables 323,829 213,672
629,929 486,772Total other receivables 1,014,694 856,146 Subtotal 1,060,577 940,968
of which receivables with a remaining maturity of up to 1 year 1,048,215 913,004more than 1 year 12,362 27,963
1,060,577 940,968of which receivables which are not yet impaired
up to 3 months past due 12,774 13,096more than 3 months past due 2,515 2,880
III. Other assets
Prepaid expenses and deferred charges 33,967 38,778 33,967 38,778Total receivables including insurance receivables 1,094,544 979,746
Impairments in € thousand
31/12/2014 31/12/2013
Cumulative impairment losses – 11,563 – 8,961

133NOTES TO THE CONSOLIDATED FINANCIAL STATEMENTS
14. Income tax receivables
in € thousand 31/12/2014 31/12/2013Income tax receivables 53,917 69,881
of which receivables with a remaining maturity of up to 1 year 52,536 69,881more than 1 year 1,381 0
15. Deferred tax assets
Recognition originates from in € thousand
31/12/2014 31/12/2013
Insurance items 781 – 103Investments – 521 – 2,070Loss carryforwards 2,495 5,185Other 3,875 5,683Total 6,630 8,695
of which not recognised in profit or loss 0 0
Deferred tax assets in € thousand
31/12/2014 31/12/2013
up to 1 year 4,314 6,479more than 1 year 2,316 2,216
Total 6,630 8,695
For loss carryforwards in the amount of €66,530 thousand, the deferred tax of €10,179 thousand was not capitalised because utilisation will not be possible in the foreseeable future.

134 NOTES TO THE CONSOLIDATED FINANCIAL STATEMENTS
16. Subscribed capital
31/12/2014 31/12/2013Number of authorised and issued no-par shares 309,000,000 309,000,000
of which fully paid up 309,000,000 309,000,000
The subscribed capital and capital reserves correspond to values from the individual financial statements of UNIQA Insurance Group AG.
On 9 October 2013, the Management Board of UNIQA Insurance Group AG determined the subscription and offer price and the total number of shares to be issued as part of the capital increase (re-IPO) with the approval of the Working Committee of the Supervisory Board of UNIQA. The subscription and offer price was set at €8.00 per share, with a total of 94,752,100 shares (including 6,650,000 greenshoe shares) placed with investors.
The Company’s share capital was increased from €214,247,900 to €309,000,000 by issuing a total of 94,752,100 shares. Each share conveys one vote. The change in the total number of voting rights and the increase in the share capital took effect on 22 October 2013.
As part of the capital increase (re-IPO) in October 2013, employees of UNIQA Insurance Group AG and of its affiliated Austrian Group companies subscribed for 564,315 new no-par value shares. This represented a benefit of 20 per cent compared with the subscription and offer price.
The new shares have been admitted for public trading in the Prime Market segment on the Vienna Stock Market.
The costs of the capital increase have been deducted directly from the share premium at an amount of €32,691 thousand, minus tax effects.
In accordance with the resolution of the Annual General Meeting dated 27 May 2013, the Management Board is authorised to increase the Company’s share capital up to and including 30 June 2018 with the approval of the Supervisory Board by a total of up to €12,371,850 by issu-ing up to 12,371,850 no-par value bearer or registered shares in exchange for payment in cash or in kind, one time or several times.
In accordance with the resolution of the Annual General Meeting dated 26 May 2014, the Management Board is authorised to increase the Company’s share capital up to and including 30 June 2019 with the approval of the Supervisory Board by a total of up to €81,000,000 by issu-ing up to 81,000,000 no-par value bearer or registered shares in exchange for payment in cash or in kind, one time or several times.

135NOTES TO THE CONSOLIDATED FINANCIAL STATEMENTS
Unrealised gains and losses from the revaluation of available-for-sale investments impacted the revaluation reserve, taking into account deferred profit participation (for life insurance) and deferred taxes.
Actuarial gains and losses from pension and severance payment provisions were posted as “actuarial gains and losses from defined benefit obligations” after deducting deferred policy-holder profit participation and deferred taxes.
Capital requirements Business performance as a result of organic growth and acquisitions influences the capital re-quirements of the UNIQA Group. In the context of Group management, the appropriate cover-age of the solvency requirement on a consolidated basis is constantly monitored.
As at 31 December 2014, the adjusted equity amounted to €3,442,237 thousand (2013: €3,285,612 thousand). In ascertaining the adjusted equity, intangible economic assets (in particular goodwill) and equity investments in banks and insurance companies are deducted from equity and various forms of hybrid capital (in particular supplemental capital) and latent reserves in investments (in particular in land and buildings) are added.
With a statutory requirement for adjusted equity of €1,165,169 thousand (2013: €1,145,891 thousand), the statutory requirements were exceeded by €2,277,068 thousand (2013: €2,139,722 thousand), resulting in a coverage rate of 295.4 per cent (2013: 286.7 per cent). With the change to Section 81h paragraph 2 of the Insurance Supervisory Act (VAG), the volatility reserve was added as part of the available capital as of the third quarter of 2008. This increased the adjusted equity by €135,391 thousand (2013: €103,767 thousand).
The adjusted equity funding is ascertained on the basis of the available consolidated finan-cial statements (in accordance with Section 80b of the Insurance Supervisory Act).
in € thousand 31/12/2014 31/12/2013Adjusted own funds without deduction pursuant to section 86h paragraph 5 of the Austrian Insurance Supervision Act (VAG) 3,442,237 3,285,612Adjusted own funds with deduction pursuant to section 86h paragraph 5 of the VAG 3,306,846 3,181,846

136 NOTES TO THE CONSOLIDATED FINANCIAL STATEMENTS
The Management Board is also authorised until 27 November 2015 to acquire treasury shares up to a maximum of 10 per cent of the share capital, including with repeated utilisation of the 10 per cent limit, both via the Stock Exchange as well as over the counter, while also disapplying the proportionate modification rights of shareholders. In the financial year and in the previous year, none of the Company’s treasury shares were acquired over the stock exchange. At the re-porting date, treasury shares can be broken down as follows:
31/12/2014 31/12/2013Shares held by: UNIQA Insurance Group AG
Cost in € thousand 10,857 10,857Number of shares 819,650 819,650Share of subscribed capital in % 0.27 0.27
In the figure for “earnings per share”, the consolidated profit/(loss) is set against the average number of ordinary shares in circulation.
Earnings per share 2014 2013Consolidated profit in € thousand 289,863 284,660Treasury shares at the reporting date 819,650 819,650Average number of shares in circulation 308,180,350 235,294,119Earnings per share (in euros)1) 0.94 1.21Dividend per share2) 0.42 0.35Dividend payment in € thousand2) 129,436 107,863 1) Calculated based on consolidated profit. 2) For the financial year, subject to resolution being passed by the Annual General Meeting.
Without taking into consideration the profit/(loss) from discontinued operations (after taxes), this result amounted to €1.00 per share in the 2013 financial year.
The diluted earnings per share is equal to the basic earnings per share in the financial year and in the previous year.
Change in the tax amounts taken directly to equityin € thousand
31/12/2014 31/12/2013
Effective tax 0 10,596Deferred taxes – 107,319 50,765Total – 107,319 61,362

137NOTES TO THE CONSOLIDATED FINANCIAL STATEMENTS
17. Adjustment item for non-controlling interests
in € thousand 31/12/2014 31/12/2013In revaluation reserve – 1,377 503In actuarial gains and losses on defined benefit obligations 0 0In net retained profit 4,685 4,128In other equity 16,884 17,381Total 20,193 22,012
18. Subordinated liabilities
in € thousand 31/12/2014 31/12/2013Supplementary capital 600,000 600,000
Fair value in € thousand
31/12/2014 31/12/2013
Supplementary capital 663,648 631,491
In December 2006, UNIQA Insurance Group AG issued bearer debentures with a nominal value of €150,000 thousand for deposited supplementary capital in accordance with section 73c para-graph of the Austrian Insurance Supervisory Act. According to the terms and conditions of the bearer debentures, the contributed capital of UNIQA Insurance Group AG is agreed to remain at the Company’s disposal for at least 5 years, with no ordinary or extraordinary cancellation possible. Interest is applied only insofar as this is covered in the net profit for the year of the issuer. The interest rate up to December 2016 is 5.079 per cent.
In January 2007, UNIQA Insurance Group AG issued bearer debentures with a nominal value of €100,000 thousand for deposited supplementary capital in accordance with section 73c paragraph of the Austrian Insurance Supervisory Act. According to the terms and conditions of the bearer debentures, the deposited capital of UNIQA Insurance Group AG is agreed to remain at the Company’s disposal for at least 5 years, with no ordinary or extraordinary cancellation possible. Interest is applied only insofar as this is covered in the net profit for the year of the issuer. The interest rate up to December 2016 is 5.342 per cent.
In July 2013, UNIQA Insurance Group AG successfully placed a supplementary capital bond in the volume of €350 million with institutional investors in Europe. The bond has a maturity period of 30 years and may only be cancelled after 10 years. The coupon equals 6.875 per cent per annum. The supplementary capital bond meets both the current supervisory requirements related to equity netting (supplementary capital under Solvency I) along with the foreseeable requirements for equity netting under the Solvency II regime which comes into force in 2016. The issue was also aimed at replacing older supplementary capital bonds from Austrian insur-ance groups and at bolstering UNIQA’s capital resources and capital structure in preparation for Solvency II and optimising these over the long term. The supplementary capital bond has been listed on the Luxembourg Stock Exchange since the end of July 2013. The issue price was set at 100 per cent.

138 NOTES TO THE CONSOLIDATED FINANCIAL STATEMENTS
19. Unearned premiums
in € thousand 31/12/2014 31/12/2013Property and casualty insuranceGross 607,373 612,723Reinsurers’ share – 15,939 – 14,592 591,435 598,131Health insurance Gross 19,268 18,865Reinsurers’ share – 92 – 51 19,176 18,815In the consolidated financial statementsGross 626,641 631,588Reinsurers’ share – 16,030 – 14,643Total (amount consolidated) 610,611 616,945
20. Insurance provision
in € thousand 31/12/2014 31/12/2013Property and casualty insuranceGross 12,565 13,154Reinsurers’ share – 135 – 383 12,431 12,772Health insurance Gross 2,436,865 2,327,656Reinsurers’ share – 886 – 985 2,435,979 2,326,671Life insurance Gross 14,323,869 14,106,599Reinsurers’ share – 393,286 – 412,018 13,930,583 13,694,581In the consolidated financial statementsGross 16,773,299 16,447,408Reinsurers’ share – 394,307 – 413,385Total (amount consolidated) 16,378,992 16,034,023
The interest rates used as an accounting basis were as follows:
In the area of Figures in per cent
Health insurance under SFAS 60
Life insurance underSFAS 120
2014 For insurance provision 2.50 – 5.50 0.00– 4.00For deferred acquisition costs 2.50 – 5.50 3.20– 3.77 2013 For insurance provision 3.50 – 5.50 1.75– 4.00For deferred acquisition costs 3.50 – 5.50 3.03– 3.28

139NOTES TO THE CONSOLIDATED FINANCIAL STATEMENTS
21. Provision for unsettled claims
in € thousand 31/12/2014 31/12/2013Property and casualty insurance Gross 2,240,465 2,054,700Reinsurers’ share – 137,605 – 112,623 2,102,860 1,942,077Health insurance Gross 165,204 169,787Reinsurers’ share – 25 – 32 165,179 169,756Life insurance Gross 179,174 143,395Reinsurers’ share – 13,590 – 10,965 165,584 132,429In the consolidated financial statements Gross 2,584,844 2,367,882Reinsurers’ share – 151,220 – 123,620Total (amount consolidated) 2,433,623 2,244,262
The provision for unsettled claims (claim provision) developed in the property and casualty insurance as follows:
in € thousand 2014 20131. Claim provision as at 1/1
a) Gross 2,054,700 2,056,950b) Reinsurers’ share – 112,623 – 148,311c) Net 1,942,077 1,908,640
2. Plus (net) claim expenditure a) Current year claims 1,584,660 1,547,165b) Prior-year claims – 1,077 – 104,311c) Total 1,583,583 1,442,854
3. Less (net) claims paid a) Current year claims – 748,529 – 758,952b) Prior-year claims – 691,517 – 640,675c) Total – 1,440,046 – 1,399,627
4. Currency translation – 13,638 – 10,0365. Change in basis of consolidation 32,736 06. Other changes – 1,851 2467. Claim provision as at 31/12
a) Gross 2,240,465 2,054,700b) Reinsurers’ share – 137,605 – 112,623c) Net 2,102,860 1,942,077

140 NOTES TO THE CONSOLIDATED FINANCIAL STATEMENTS
Claim payments in € thousand
2004 2005 2006 2007 2008 2009 2010 2011 2012 2013 2014 Total
Reporting year 506,496 541,992 602,454 640,900 733,524 800,899 812,528 767,970 833,321 863,097 818,529 1 year later 780,215 837,533 911,628 989,944 1,107,920 1,203,704 1,203,796 1,150,350 1,234,282 1,280,246 2 years later 850,270 910,475 994,915 1,075,422 1,201,811 1,307,286 1,301,263 1,264,883 1,357,738 3 years later 881,472 940,400 1,033,923 1,118,974 1,248,251 1,369,236 1,351,569 1,316,791 4 years later 900,848 960,224 1,059,268 1,153,137 1,276,853 1,397,631 1,378,128 5 years later 913,592 977,093 1,073,369 1,172,272 1,298,363 1,416,009 6 years later 924,652 987,368 1,086,018 1,187,312 1,312,041 7 years later 930,303 998,753 1,096,696 1,198,564 8 years later 935,653 1,006,642 1,103,398 9 years later 942,387 1,012,799 10 years later 946,791 Claim payments and provisions in € thousand
2004 2005 2006 2007 2008 2009 2010 2011 2012 2013 2014
Reporting year 989,932 1,064,483 1,166,028 1,262,285 1,368,208 1,496,034 1,476,426 1,442,967 1,552,546 1,616,122 1,650,376 1 year later 999,530 1,064,413 1,169,667 1,238,345 1,359,204 1,494,769 1,481,053 1,447,808 1,556,176 1,605,972 2 years later 997,010 1,066,230 1,155,653 1,242,653 1,374,094 1,502,903 1,487,140 1,454,252 1,570,091 3 years later 997,180 1,045,615 1,158,182 1,244,311 1,378,045 1,499,063 1,477,384 1,457,201 4 years later 997,125 1,044,507 1,155,169 1,254,712 1,376,275 1,495,039 1,482,301 5 years later 983,521 1,047,170 1,155,577 1,262,541 1,374,344 1,498,206 6 years later 982,851 1,050,113 1,150,713 1,264,911 1,382,112 7 years later 982,121 1,049,680 1,150,517 1,268,575 8 years later 982,638 1,050,616 1,153,108 9 years later 978,483 1,049,903 10 years later 981,729 Settlement gains/losses – 3,246 713 – 2,591 – 3,663 – 7,767 – 3,166 – 4,917 – 2,948 – 13,915 10,150 – 31,351 Settlement gains/losses before 2004 – 11,371 Total settlement gains/losses – 42,722 Statement of financial position provision 34,937 37,104 49,710 70,011 70,071 82,197 104,173 140,410 212,353 325,726 831,847 1,958,539Statement of financial position provision for claim years before 2004 234,765Plus other provision components (internal loss adjustment costs, etc.) 47,161Claim provision (gross as at 31/12/2014) 2,240,465

141NOTES TO THE CONSOLIDATED FINANCIAL STATEMENTS
22. Provision for premium refunds
Provision for non-profit related premium refunds Gross in € thousand
2014 2013
At 1/1 46,479 44,578Changes for: Other changes 3,264 1,901At 31/12 49,743 46,479
Provision for profit-related premium refunds and/or policyholder profit participation:
Gross in € thousand
2014 2013
a) Provision for profit-related premium refunds and/or profit participation
At 1/1 218,323 198,857Changes for: Other changes – 29,842 19,466At 31/12 188,481 218,323
b) Deferred profit participation
At 1/1 142,353 367,864Changes for: Fluctuations in value, available-for-sale securities – 251,708 589,950Actuarial gains and losses on defined benefit obligations – 4,579 – 21,084Revaluations through profit or loss 1,066,736 – 794,377At 31/12 952,801 142,353
Total 1,141,282 360,676

142 NOTES TO THE CONSOLIDATED FINANCIAL STATEMENTS
23. Technical provisions
Gross in € thousand
Unearned premiums
Insurance provision
Provisionfor
unsettledclaims
Provisionfor
non-profit relatedpremium refunds
Provision for
non-profit related premium refunds
and/or policyholder
profit participation
Othertechnical
provisions
Total for Group
Property and casualty insurance At 31/12/2013 612,723 13,154 2,054,700 33,648 580 19,175 2,733,981Foreign exchange differences – 12,683 – 667 – 13,730 – 43 -6 – 59 – 27,188Change in basis of consolidation 12,616 0 33,252 0 0 0 45,868Portfolio changes 5,073 – 1,801 0 3,271Additions 387 2,388 2,050 5,276 10,101Disposals – 309 – 525 – 1,671 – 7,567 – 10,073Premiums written 2,328,252 2,328,252Premiums earned – 2,338,607 – 2,338,607Claims – reporting year 1,647,629 1,647,629Claim payments – reporting year – 763,303 – 763,303Change in claims – previous years 6,805 6,805Claim payments – previous years – 723,086 – 723,086At 31/12/2014 607,373 12,565 2,240,465 35,468 952 16,825 2,913,649 Health insurance At 31/12/2013 18,865 2,327,656 169,787 10,108 44,319 806 2,571,540Foreign exchange differences 652 – 61 – 502 – 24 0 -3 61Change in basis of consolidation 0 0 0 0 0 0Portfolio changes 1,007 424 0 1,431Additions 109,405 9,756 17,507 200 136,868Disposals – 135 – 9,017 – 17,173 – 13 – 26,339Premiums written 945,778 945,778Premiums earned – 947,034 – 947,034Claims – reporting year 672,269 672,269Claim payments – reporting year – 478,830 – 478,830Change in claims – previous years – 20,418 – 20,418Claim payments – previous years – 177,525 – 177,525At 31/12/2014 19,268 2,436,865 165,204 10,823 44,652 989 2,677,800 Life insurance At 31/12/2013 0 14,106,599 143,395 2,723 315,777 26,201 14,594,694Foreign exchange differences – 43,531 – 784 – 16 10,738 – 189 – 33,781Change in basis of consolidation 217,633 2,600 0 220,233Portfolio changes 547,416 345 – 59 501 548,203Additions 102,350 745 774,392 1,342 878,829Disposals – 606,598 0 – 5,170 – 1,409 – 613,178Premiums written 0Premiums earned 0Claims – reporting year 2,395,353 2,395,353Claim payments – reporting year – 2,196,339 – 2,196,339Change in claims – previous years 14,404 14,404Claim payments – previous years – 179,798 – 179,798At 31/12/2014 0 14,323,869 179,174 3,452 1,095,678 26,446 15,628,619 Total for Group At 31/12/2013 631,588 16,447,408 2,367,882 46,479 360,676 46,182 19,900,215Foreign exchange differences – 12,031 – 44,258 – 15,016 – 83 10,732 – 251 – 60,907Change in basis of consolidation 12,616 217,633 35,851 0 0 0 266,100Portfolio changes 6,079 547,416 – 1,033 – 59 501 552,904Additions 212,142 12,889 793,948 6,818 1,025,798Disposals – 607,043 – 9,542 – 24,015 – 8,989 – 649,589Premiums written 3,274,030 3,274,030Premiums earned – 3,285,642 – 3,285,642Claims – reporting year 4,715,251 4,715,251Claim payments – reporting year – 3,438,472 – 3,438,472Change in claims – previous years 791 791Claim payments – previous years – 1,080,410 – 1,080,410At 31/12/2014 626,641 16,773,299 2,584,844 49,743 1,141,282 44,260 21,220,068
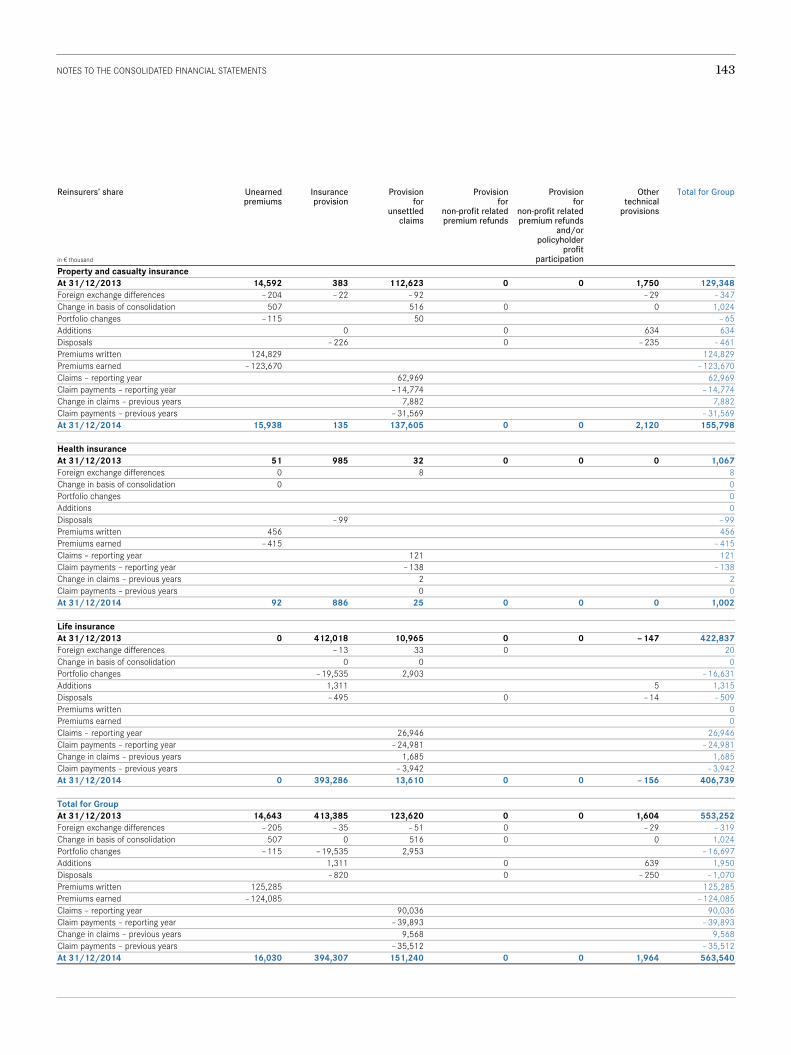
143NOTES TO THE CONSOLIDATED FINANCIAL STATEMENTS
Reinsurers’ share in € thousand
Unearned premiums
Insurance provision
Provisionfor
unsettledclaims
Provisionfor
non-profit relatedpremium refunds
Provision for
non-profit related premium refunds
and/or policyholder
profit participation
Othertechnical
provisions
Total for Group
Property and casualty insurance At 31/12/2013 14,592 383 112,623 0 0 1,750 129,348Foreign exchange differences – 204 – 22 – 92 – 29 – 347Change in basis of consolidation 507 516 0 0 1,024Portfolio changes – 115 50 – 65Additions 0 0 634 634Disposals – 226 0 – 235 – 461Premiums written 124,829 124,829Premiums earned – 123,670 – 123,670Claims – reporting year 62,969 62,969Claim payments – reporting year – 14,774 – 14,774Change in claims – previous years 7,882 7,882Claim payments – previous years – 31,569 – 31,569At 31/12/2014 15,938 135 137,605 0 0 2,120 155,798 Health insurance At 31/12/2013 51 985 32 0 0 0 1,067Foreign exchange differences 0 8 8Change in basis of consolidation 0 0Portfolio changes 0Additions 0Disposals – 99 – 99Premiums written 456 456Premiums earned – 415 – 415Claims – reporting year 121 121Claim payments – reporting year – 138 – 138Change in claims – previous years 2 2Claim payments – previous years 0 0At 31/12/2014 92 886 25 0 0 0 1,002 Life insurance At 31/12/2013 0 412,018 10,965 0 0 – 147 422,837Foreign exchange differences – 13 33 0 20Change in basis of consolidation 0 0 0Portfolio changes – 19,535 2,903 – 16,631Additions 1,311 5 1,315Disposals – 495 0 – 14 – 509Premiums written 0Premiums earned 0Claims – reporting year 26,946 26,946Claim payments – reporting year – 24,981 – 24,981Change in claims – previous years 1,685 1,685Claim payments – previous years – 3,942 – 3,942At 31/12/2014 0 393,286 13,610 0 0 – 156 406,739 Total for Group At 31/12/2013 14,643 413,385 123,620 0 0 1,604 553,252Foreign exchange differences – 205 – 35 – 51 0 – 29 – 319Change in basis of consolidation 507 0 516 0 0 1,024Portfolio changes – 115 – 19,535 2,953 – 16,697Additions 1,311 0 639 1,950Disposals – 820 0 – 250 – 1,070Premiums written 125,285 125,285Premiums earned – 124,085 – 124,085Claims – reporting year 90,036 90,036Claim payments – reporting year – 39,893 – 39,893Change in claims – previous years 9,568 9,568Claim payments – previous years – 35,512 – 35,512At 31/12/2014 16,030 394,307 151,240 0 0 1,964 563,540

144 NOTES TO THE CONSOLIDATED FINANCIAL STATEMENTS
Net in € thousand
Unearned premiums
Insurance provision
Provisionfor
unsettledclaims
Provisionfor
non-profit relatedpremium refunds
Provision for
non-profit related premium refunds
and/or policyholder
profit participation
Othertechnical
provisions
Total for Group
Property and casualty insurance At 31/12/2013 598,131 12,772 1,942,077 33,648 580 17,425 2,604,633Foreign exchange differences – 12,478 – 645 – 13,638 – 43 -6 – 30 – 26,841Change in basis of consolidation 12,108 0 32,736 0 0 0 44,844Portfolio changes 5,188 – 1,851 0 0 3,336Additions 387 2,388 2,050 4,641 9,466Disposals – 84 – 525 – 1,671 – 7,332 – 9,611Premiums written 2,203,423 2,203,423Premiums earned – 2,214,937 – 2,214,937Claims – reporting year 1,584,660 1,584,660Claim payments – reporting year – 748,529 – 748,529Change in claims – previous years – 1,077 – 1,077Claim payments – previous years – 691,517 – 691,517At 31/12/2014 591,435 12,431 2,102,860 35,468 952 14,704 2,757,850 Health insurance At 31/12/2013 18,815 2,326,671 169,755 10,108 44,319 806 2,570,473Foreign exchange differences 652 – 61 – 510 – 24 0 -3 54Change in basis of consolidation 0 0 0 0 0 0Portfolio changes 1,007 424 0 0 0 1,431Additions 109,405 9,756 17,507 200 136,868Disposals – 36 – 9,017 – 17,173 – 13 – 26,240Premiums written 945,322 945,322Premiums earned – 946,619 – 946,619Claims – reporting year 672,148 672,148Claim payments – reporting year – 478,693 – 478,693Change in claims – previous years – 20,420 – 20,420Claim payments – previous years – 177,525 – 177,525At 31/12/2014 19,176 2,435,979 165,179 10,823 44,652 989 2,676,798 Life insurance At 31/12/2013 0 13,694,581 132,429 2,723 315,777 26,347 14,171,858Foreign exchange differences – 43,518 – 817 – 16 10,738 – 189 – 33,801Change in basis of consolidation 217,633 2,600 0 0 220,233Portfolio changes 566,951 – 2,558 0 – 59 501 564,834Additions 101,039 745 774,392 1,338 877,514Disposals – 606,103 0 – 5,170 – 1,395 – 612,669Premiums written 0Premiums earned 0Claims – reporting year 2,368,407 2,368,407Claim payments – reporting year – 2,171,358 – 2,171,358Change in claims – previous years 12,719 12,719Claim payments – previous years – 175,857 – 175,857At 31/12/2014 0 13,930,583 165,565 3,452 1,095,678 26,603 15,221,880 Total for Group At 31/12/2013 616,946 16,034,023 2,244,261 46,479 360,676 44,578 19,346,963Foreign exchange differences – 11,826 – 44,223 – 14,965 – 83 10,732 – 222 – 60,588Change in basis of consolidation 12,108 217,633 35,335 0 0 0 265,077Portfolio changes 6,195 566,951 – 3,986 0 – 59 501 569,601Additions 210,832 12,889 793,948 6,179 1,023,848Disposals – 606,223 – 9,542 – 24,015 – 8,740 – 648,519Premiums written 3,148,745 3,148,745Premiums earned – 3,161,557 – 3,161,557Claims – reporting year 4,625,215 4,625,215Claim payments – reporting year – 3,398,580 – 3,398,580Change in claims – previous years – 8,778 – 8,778Claim payments – previous years – 1,044,898 – 1,044,898At 31/12/2014 610,611 16,378,992 2,433,604 49,743 1,141,282 42,296 20,656,528
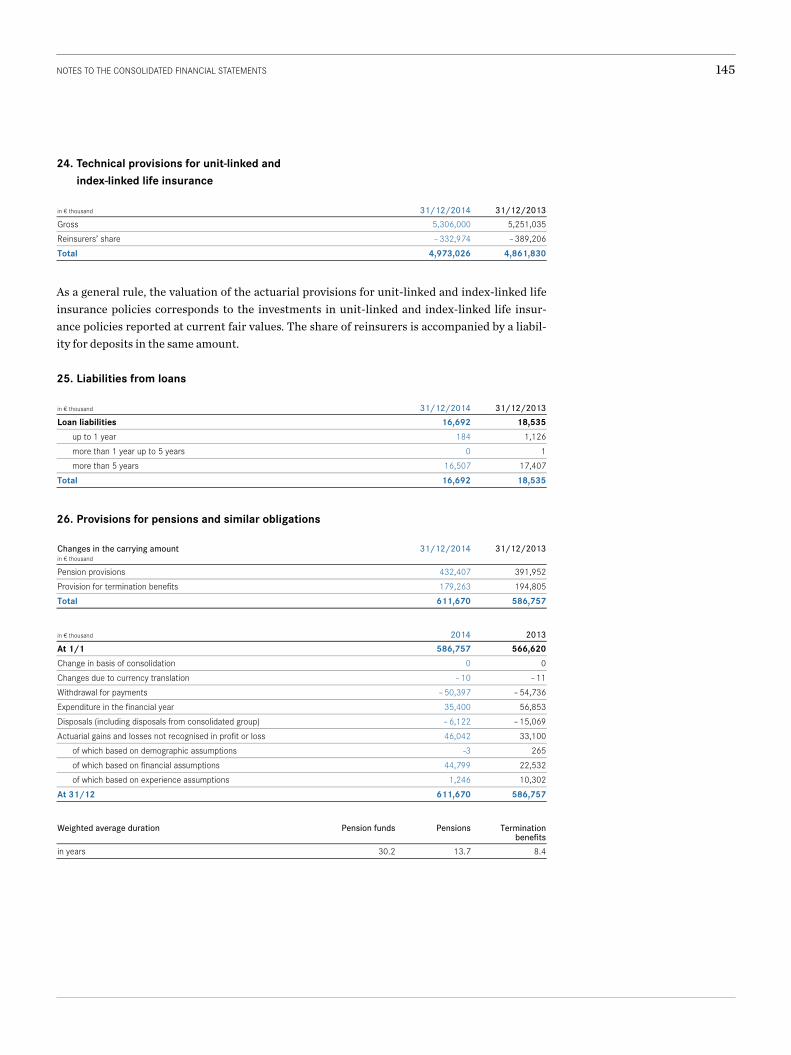
145NOTES TO THE CONSOLIDATED FINANCIAL STATEMENTS
24. Technical provisions for unit-linked and index-linked life insurance
in € thousand 31/12/2014 31/12/2013Gross 5,306,000 5,251,035Reinsurers’ share – 332,974 – 389,206Total 4,973,026 4,861,830
As a general rule, the valuation of the actuarial provisions for unit-linked and index-linked life insurance policies corresponds to the investments in unit-linked and index-linked life insur-ance policies reported at current fair values. The share of reinsurers is accompanied by a liabil-ity for deposits in the same amount.
25. Liabilities from loans
in € thousand 31/12/2014 31/12/2013Loan liabilities 16,692 18,535
up to 1 year 184 1,126more than 1 year up to 5 years 0 1more than 5 years 16,507 17,407
Total 16,692 18,535
26. Provisions for pensions and similar obligations
Changes in the carrying amount in € thousand
31/12/2014 31/12/2013
Pension provisions 432,407 391,952Provision for termination benefits 179,263 194,805Total 611,670 586,757
in € thousand 2014 2013At 1/1 586,757 566,620Change in basis of consolidation 0 0Changes due to currency translation – 10 – 11Withdrawal for payments – 50,397 – 54,736Expenditure in the financial year 35,400 56,853Disposals (including disposals from consolidated group) – 6,122 – 15,069Actuarial gains and losses not recognised in profit or loss 46,042 33,100
of which based on demographic assumptions -3 265of which based on financial assumptions 44,799 22,532of which based on experience assumptions 1,246 10,302
At 31/12 611,670 586,757
Weighted average duration Pension funds Pensions Termination
benefitsin years 30.2 13.7 8.4

146 NOTES TO THE CONSOLIDATED FINANCIAL STATEMENTS
Present value of obligationsin € thousand
2014 2013
At 1/1 649,573 630,834Current service cost 23,412 52,350Interest expense 17,195 18,265Payments – 55,856 – 69,805Past service cost 4,737 0Disposals (including disposals from consolidated group) – 6,122 – 15,069Actuarial gains and losses not recognised in profit or loss 50,225 32,997
of which based on demographic assumptions -3 10,302of which based on financial assumptions 48,981 265of which based on experience assumptions 1,246 22,429
At 31/12 683,162 649,573
Sensitivity analysis 2014Figures in per cent
Pension funds Pensions Termination benefits
Remaining life expectancy Change in DBO (+ 1 year) 2.9 4.4 Change in DBO (– 1 year) – 3.2 – 4.7 Discount rate Change in DBO (+ 1%) – 24.6 – 11.6 – 8.0Change in DBO (– 1%) 35.3 14.5 9.1Rate of increase for future salary delta Change in DBO (+ 0.75%) 4.0 0.4 6.6Change in DBO (– 0.75%) – 3.8 – 0.4 – 6.1Rate of increase for future pensions Change in DBO (+ 0.25%) 4.2 2.9 Change in DBO (– 0.25%) – 4.0 – 2.8
Sensitivity analysis 2013Figures in per cent
Pension funds Pensions Termination benefits
Remaining life expectancy Change in DBO (+ 1 year) 2.8 3.9 Change in DBO (– 1 year) – 3.0 – 4.1 Discount rate Change in DBO (+ 1%) – 24.0 – 11.5 – 8.1Change in DBO (– 1%) 34.2 14.3 9.2Rate of increase for future salary delta Change in DBO (+ 0.75%) 4.0 0.4 6.7Change in DBO (– 0.75%) – 3.7 – 0.4 – 6.2Rate of increase for future pensions Change in DBO (+ 0.25%) 4.1 2.8 Change in DBO (– 0.25%) – 3.9 – 2.7
Final pension funds contribution: Board members, special policyholders and active employees in Austria who meet the criteria for inclusion are subject to a defined contribution pension fund scheme. The beneficiaries are entitled to a final pension fund contribution. The works council agreement states the extent to which a final pension fund contribution is provided to the beneficiary’s individual assurance cover account in the event of a transfer to the old-age pension or of an incapacity to work or the death as a participant.

147NOTES TO THE CONSOLIDATED FINANCIAL STATEMENTS
There are individual contractual pension obligations, pension allowances in accordance with association recommendations and administrative pensions. Individuals who have an indi-vidual contractual obligation can generally claim a pension when they reach the age of 65, but not before the age of 62, and in the event of an inability to work. The amount of the pension generally depends on the number of their years of service and their last salary before leaving their active employment. In the event of death, the spouse of the individual entitled to the claim receives a pension at 60%, 50% or 40% depending on the policy. The pensions are suspended for any period in which a termination benefit is paid and their value is generally guaranteed.
The defined contribution plan is financed completely by Uniqa. The pensions are financed through provisions that are based on individual policies or on the association recommenda-tions. For the final pension contribution, the financing is carried out over a pension fund. The financing is specified in the business plan, in the works council agreement and in the pension fund contract. Termination benefit entitlements: If the employment lasted three years without interruption, the employee is entitled to termina-tion benefits when the employment is terminated, unless the employee quits, leaves without an important reason or is guilty of something resulting in early dismissal. The amount is double the salary owed to the employee in the last month of the employee relationship and increases after five years of employment to three times, after ten years of employment to four times, after fifteen years of employment to six times, after twenty years of employment to nine times and after twenty-five years of employment to twelve times the monthly salary. If the employment ends due to the death of the employee, the termination benefit only amounts to half of the above-mentioned amounts and is only owed to the legal beneficiaries who were legal dependents of the deceased. For employees who joined the Company after 31 December 2002, the statutory provisions of the BMSFB apply. These people are therefore, as instructed, not included in the calculation of the termination benefits.
The UNIQA Group’s repositioning led to an expected reduction of staff which is covered by provisions for social capital amounting to €17,088 thousand (2013: €42,136 thousand).
Calculation factors applied In per cent
2014 2013
Discount rate 2.50% 3.00%Valorisation of remuneration 3.00% 3.00%Valorisation of pensions 2.00% 2.00%Employee turnover rate dependent on years of service dependent on years of service
Calculation principles AVÖ 2008 P – Pagler &
Pagler/salaried employeesAVÖ 2008 P – Pagler &
Pagler/salaried employees
Details of expenses for pensions and similar obligations recognised in the income statement in € thousand
31/12/2014 31/12/2013
Current service cost 15,441 38,794Past service cost 4,737 0Interest expense 15,259 18,259Income and expenses from plan changes – 35 – 201Total 35,400 56,853

148 NOTES TO THE CONSOLIDATED FINANCIAL STATEMENTS
Movement in pension provision’s plan assets 2014 2013Fair value of plan assets at 1/1 62,816 64,214Interest income 1,936 2,135Allocation to fund 7,971 8,586Payments – 5,413 – 10,244Gain/loss Other comprehensive income 4,182 – 1,876Fair value of plan assets at 31/12 71,492 62,816
Classes of plan assetsIn per cent
2014 2013
Bonds – euro 35.1 28.6Bonds – Euro High Yield 3.3 5.1Corporate bonds – euro 17.8 18.1Equities – euro 7.4 8.3Equities – non-euro 6.9 7.7Equities – emerging markets 3.6 2.0Alternative investment instruments 0.9 3.1Land and buildings 0.0 1.9Cash 6.4 0.0Synthetic cash position 0.0 3.3HTM bonds/term deposits 18.6 22.0Total 100.0 100.0
Under the defined contribution company pension scheme, the employer pays the fixed amounts into company pension funds. The employer has satisfied their obligation by making these con-tributions.
in € thousand 31/12/2014 31/12/2013Contributions to company pension funds 2,293 2,199
27. Other provisions
in € thousand
Carrying amounts
31/12/2013
Changesfrom currency
translation
Changes in thebasis of
consolidation
Requirement Reversals Reclas-sifications
Additions Carrying amount
31/12/2014Jubilee benefit provision 15,343 0 0 – 50 – 674 0 265 14,884Customer services and marketing provisions 73,775 – 163 0 – 63,336 – 3,539 0 69,026 75,763Provision for variable remuneration components 27,485 0 0 – 26,676 – 377 0 18,005 18,438Provision for legal and consulting expenses 10,720 -6 – 38 – 2,324 – 792 – 1,228 2,705 9,037Provision for premium adjustments from reinsurance contracts 9,354 – 10 0 – 4,922 0 0 3,489 7,911Provision for portfolio maintenance commission 2,667 – 25 0 – 173 0 0 705 3,174Other provisions 110,579 – 195 – 222 – 59,232 – 31,887 1,228 72,767 93,038Total 249,924 – 399 – 260 – 156,714 – 37,269 0 166,963 222,245
Other provisions include a provision of €10,000 thousand (2013: €10,000 thousand) for liability in connection with the sale of Mannheimer AG Holding.
The provision for variable salary components includes a provision for share-based compen-sation amounting to €600 thousand. Further disclosures concerning the underlying “Long Term Incentive Programme (LTI)” can be found under Other Information (page 198).

149NOTES TO THE CONSOLIDATED FINANCIAL STATEMENTS
28. Liabilities and other items classified as equity and liabilities
in € thousand 31/12/2014 31/12/2013I. Reinsurance liabilities
1. Deposits retained on assumed reinsurance 719,592 797,1712. Reinsurance settlement liabilities 38,991 36,885
758,583 834,056II. Other liabilities
Insurance liabilities Direct insurance liabilities
to policyholders 178,926 116,486to insurance brokers 70,611 70,778to insurance companies 12,781 6,811
262,317 194,076Liabilities to banks 0 350Other liabilities 321,222 310,596
of which for taxes 46,814 55,179of which for social security 12,605 11,564of which from fund consolidation 2,645 19,204
Total other liabilities 583,539 505,022 Subtotal 1,342,123 1,339,077
of which liabilities with a maturity of up to 1 year 951,566 896,119more than 1 year up to 5 years 3,033 4,378more than 5 years 387,524 438,580
1,342,123 1,339,077III. Other items classified as equity and liabilities
Deferred income 26,628 23,040 Liabilities and other items classified as equity and liabilities 1,368,751 1,362,117
The item Deferred income basically comprises the balance of the deferred income from the settlement of indirect business.
in € thousand 31/12/2014 31/12/2013Other provisions with a high probability of utilisation (more than 90 per cent)
in up to 1 year 116.655 128.805in more than 1 year up to 5 years 9.453 11.726in more than 5 years 11.981 12.961
138.088 153.491Other provisions with a low probability of utilisation (less than 90 per cent)
in up to 1 year 81.640 93.510in more than 1 year up to 5 years 2.517 2.899in more than 5 years 0 23
84.156 96.432Total 222.245 249.924

150 NOTES TO THE CONSOLIDATED FINANCIAL STATEMENTS
29. Income tax liabilities
Losses from foreign subsidiaries were also included within the scope of group taxation as part of the determination of taxable income. The tax realisation for these losses is accompanied by a future tax obligation to pay income taxes at an unspecified point in time. These tax liabilities are assessed at zero from a discounted perspective unless the sale of an equity investment or own loss realisation on the part of subsidiaries can be foreseen.
in € thousand 31/12/2014 31/12/2013Income tax liabilities 43,272 40,712
of which liabilities with a maturity of up to 1 year 18,545 14,187more than 1 year up to 5 years 24,303 26,525more than 5 years 425 0
30. Deferred tax liabilities
Recognition originates from in € thousand
31/12/2014 31/12/2013
Insurance items 175,411 164,575Untaxed reserves 34,145 35,591Investments 227,683 43,583Social capital – 74,497 – 68,745Loss carryforwards – 6,018 – 6,227Other – 1,300 30,203Total 355,424 198,980
of which not recognised in profit or loss 124,189 16,871
Deferred tax liabilitiesin € thousand
31/12/2014 31/12/2013
up to 1 year 29,924 1,109more than 1 year 325,500 197,871
Total 355,424 198,980

151NOTES TO THE CONSOLIDATED FINANCIAL STATEMENTS
NOTES TO THE CONSOLIDATED INCOME STATEMENT
31. Premiums written
Direct insurance in € thousand
2014 2013
Property and casualty insurance 2,581,315 2,553,745Health insurance 960,775 937,572Life insurance 1,923,396 1,614,051Total (amount consolidated) 5,465,486 5,105,368 of which from:
Austria 3,362,882 3,254,807Remaining EU member states and other states which are party to the Agreement on the European Economic Area 1,751,709 1,529,803Other countries 350,894 320,758
Total (amount consolidated) 5,465,486 5,105,368
Indirect insurance in € thousand
2014 2013
Property and casualty insurance 39,608 36,784Health insurance 1 2Life insurance 14,606 15,421Total (amount consolidated) 54,215 52,207
in € thousand 2014 2013Total (amount consolidated) 5,519,700 5,157,576
Property and casualty insurance premiums written in € thousand
2014 2013
Direct insurance Fire and business interruption insurance 255,537 247,932Household insurance 146,551 140,524Other property insurance 238,409 236,768Motor TPL insurance 658,865 653,490Other motor insurance 471,215 494,020Casualty insurance 326,029 320,953Liability insurance 245,851 237,162Legal expense insurance 76,905 73,633Marine, aviation and transport insurance 87,285 81,353Other insurance 74,667 67,910Total 2,581,315 2,553,745 Indirect insurance Marine, aviation and transport insurance 2,036 3,638Other insurance 37,571 33,146Total 39,608 36,784Total direct and indirect insurance (amount consolidated) 2,620,922 2,590,529
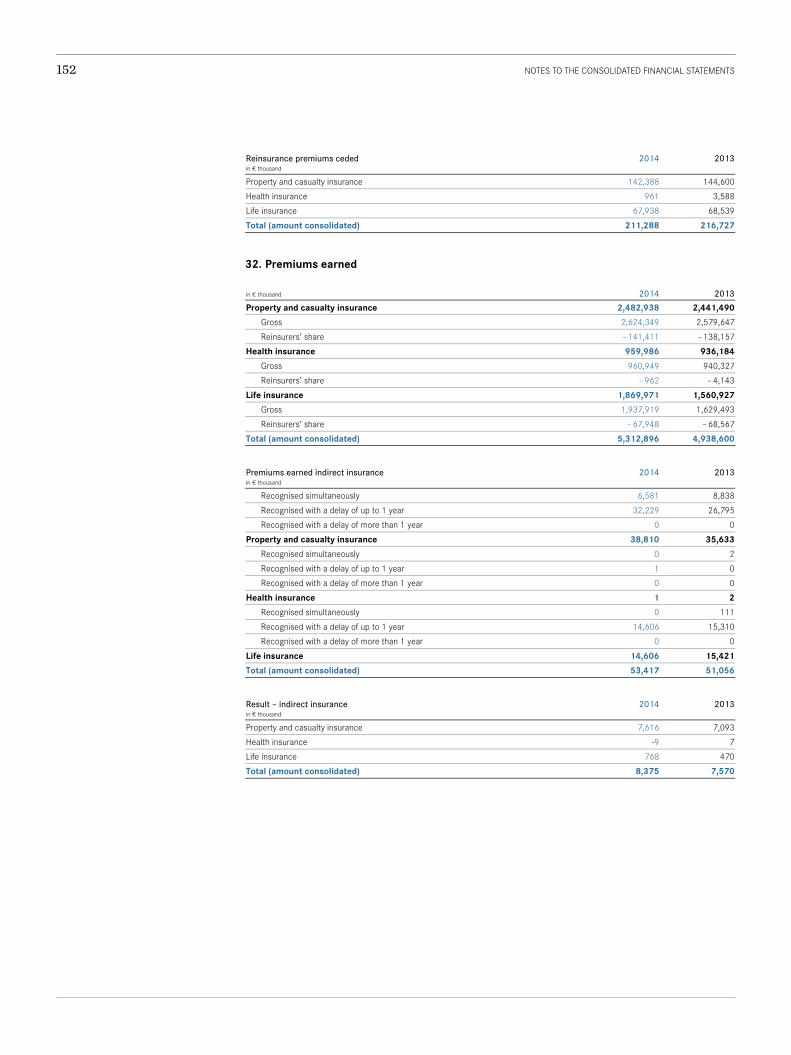
152 NOTES TO THE CONSOLIDATED FINANCIAL STATEMENTS
Reinsurance premiums cededin € thousand
2014 2013
Property and casualty insurance 142,388 144,600Health insurance 961 3,588Life insurance 67,938 68,539Total (amount consolidated) 211,288 216,727
32. Premiums earned
in € thousand 2014 2013Property and casualty insurance 2,482,938 2,441,490
Gross 2,624,349 2,579,647Reinsurers’ share – 141,411 – 138,157
Health insurance 959,986 936,184Gross 960,949 940,327Reinsurers’ share – 962 – 4,143
Life insurance 1,869,971 1,560,927Gross 1,937,919 1,629,493Reinsurers’ share – 67,948 – 68,567
Total (amount consolidated) 5,312,896 4,938,600
Premiums earned indirect insurancein € thousand
2014 2013
Recognised simultaneously 6,581 8,838Recognised with a delay of up to 1 year 32,229 26,795Recognised with a delay of more than 1 year 0 0
Property and casualty insurance 38,810 35,633Recognised simultaneously 0 2Recognised with a delay of up to 1 year 1 0Recognised with a delay of more than 1 year 0 0
Health insurance 1 2Recognised simultaneously 0 111Recognised with a delay of up to 1 year 14,606 15,310Recognised with a delay of more than 1 year 0 0
Life insurance 14,606 15,421Total (amount consolidated) 53,417 51,056
Result – indirect insurancein € thousand
2014 2013
Property and casualty insurance 7,616 7,093Health insurance -9 7Life insurance 768 470Total (amount consolidated) 8,375 7,570

153NOTES TO THE CONSOLIDATED FINANCIAL STATEMENTS
33. Insurance benefits
Gross Reinsurers’ share Retentionin € thousand 2014 2013 2014 2013 2014 2013Property and casualty insurance Claims expenses
Claims paid 1,583,498 1,596,362 – 45,185 – 87,734 1,538,314 1,508,628Change in provision for unsettled claims 164,927 48,797 – 23,849 35,963 141,078 84,761
Total 1,748,425 1,645,160 – 69,034 – 51,771 1,679,391 1,593,389Change in insurance provision 58 1,051 14 – 14 72 1,036Change in other technical provisions 2,001 – 979 0 0 2,001 – 979Non-profit related and profit-related premium refund expenses 42,120 40,400 0 0 42,120 40,400Total benefits 1,792,604 1,685,632 – 69,020 – 51,785 1,723,584 1,633,846 Health insurance Claims expenses
Claims paid 647,507 629,130 – 152 – 21 647,355 629,109Change in provision for unsettled claims – 3,843 5,176 -3 -4 – 3,846 5,172
Total 643,664 634,305 – 155 – 25 643,509 634,280Change in insurance provision 109,281 108,219 99 106 109,380 108,325Change in other technical provisions 77 318 0 0 77 318Profit-related and non-profit related refund expenses 27,557 25,813 0 0 27,557 25,813Total benefits 780,579 768,655 – 56 81 780,523 768,736 Life insurance Claims expenses
Claims paid 1,857,028 1,467,988 – 154,102 – 127,339 1,702,925 1,340,650Change in provision for unsettled claims 89,726 – 3,161 – 2,437 255 87,289 – 2,906
Total 1,946,754 1,464,827 – 156,540 – 127,083 1,790,214 1,337,744Change in insurance provision – 72,149 38,130 91,577 60,152 19,428 98,283Change in other technical provisions 480 738 0 0 480 738Non-profit related and profit-related premium refund expenses and/or (deferred) benefit participation expenses 69,432 120,100 0 0 69,432 120,100Total benefits 1,944,517 1,623,796 – 64,962 – 66,931 1,879,555 1,556,865 Total (amount consolidated) 4,517,700 4,078,083 – 134,038 – 118,635 4,383,662 3,959,448

154 NOTES TO THE CONSOLIDATED FINANCIAL STATEMENTS
34. Operating expenses
in € thousand 2014 2013Property and casualty insurancea) Acquisition costs
Payments 560,109 553,481Change in deferred acquisition costs – 4,908 – 5,072
b) Other operating expenses 201,362 265,627c) Reinsurance commissions and share of profit from reinsurance ceded – 10,499 – 10,799 746,065 803,236Health insurance a) Acquisition costs
Payments 101,717 92,918Change in deferred acquisition costs – 532 117
b) Other operating expenses 62,647 69,725c) Reinsurance commissions and share of profit from reinsurance ceded – 463 – 683 163,368 162,077
Life insurance a) Acquisition costs
Payments 294,000 355,696Change in deferred acquisition costs – 11,794 – 54,612
b) Other operating expenses 98,773 104,590c) Reinsurance commissions and share of profit from reinsurance ceded – 15,082 – 16,820 365,897 388,854Total (amount consolidated) 1,275,330 1,354,167

155NOTES TO THE CONSOLIDATED FINANCIAL STATEMENTS
35. Net investment income
By segment Property and casualty insurance
Health insurance Life insurance Group
in € thousand 2014 2013 2014 2013 2014 2013 2014 2013I. Investment property 15,440 5,691 7,933 25,390 95,198 69,457 118,571 100,538II. Investment in associates 435 3,056 11,715 8,679 11,434 10,494 23,583 22,229III. Variable-income securities 16,880 27,795 5,769 7,043 17,856 101,468 40,505 136,305
1. Available for sale 16,352 27,369 5,229 6,520 11,228 96,695 32,809 130,5832. At fair value through profit or loss 528 426 540 523 6,628 4,773 7,696 5,722
IV. Fixed-income securities 111,341 64,099 113,181 37,381 540,680 374,331 765,202 475,8111. Available for sale 111,680 63,243 112,651 35,258 558,091 355,046 782,422 453,5482. At fair value through profit or loss – 339 856 530 2,122 – 17,412 19,285 – 17,221 22,263
V. Loans and other investments 10,461 19,615 6,715 7,372 54,802 68,334 71,977 95,3201. Loans 1,501 3,174 3,684 5,331 18,825 30,327 24,009 38,8322. Other investments 8,960 16,441 3,031 2,041 35,977 38,007 47,968 56,488
VI. Derivative financial instruments (trading portfolio) – 6,674 1,140 – 19,388 3,662 – 71,190 23,976 – 97,252 28,779VII. Investment administration expenses, interest paid and
other investment expenses – 13,187 – 22,781 – 8,909 – 10,128 – 36,114 – 46,071 – 58,210 – 78,981Total (amount consolidated) 134,696 98,614 117,014 79,399 612,665 601,989 864,375 780,002
Income from available-for-sale fixed-income securities includes gains of €37,388 thousand and income from fixed income securities at fair value through profit or loss includes gains of €1,762 thousand from Level 3 valuations (hierarchy for instruments recognised at fair value in the statement of financial position).

156 NOTES TO THE CONSOLIDATED FINANCIAL STATEMENTS
By income type Current income Reversal of impairment losses Gains on disposals
in € thousand 2014 2013 2014 2013 2014 2013I. Investment property 77,458 75,008 38 0 126,508 93,168II. Investment in associates 19,970 20,023 0 0 3,613 2,207III. Variable-income securities 44,338 57,621 17,180 19,643 32,760 133,030
1. Available for sale 34,803 52,369 6,329 3,954 32,063 129,707 2. At fair value through profit or loss 9,535 5,252 10,851 15,688 696 3,323
IV. Fixed-income securities 528,699 529,973 159,182 104,221 210,754 80,7401. Available for sale 511,492 509,601 126,345 87,591 206,831 78,384 2. At fair value through profit or loss 17,207 20,372 32,837 16,629 3,923 2,355
V. Loans and other investments 67,595 83,440 9,709 11,134 4,515 3,7601. Loans 27,101 36,371 1,604 1,160 3,942 3,353 2. Other investments 40,493 47,069 8,104 9,974 572 408
VI. Derivative financial instruments (trading portfolio) – 10,285 – 5,779 38,059 33,952 84,538 73,489VII. Investment administration expenses, interest paid and other
investment expenses – 58,210 – 78,981 0 0 0 0Total (amount consolidated) 669,565 681,306 224,168 168,949 462,686 386,394
The adjustment of valuation allowances relates both the reversal of impairment losses as well as the impairment of financial assets, excluding assets held for trading and financial assets at fair value through profit or loss. The interest income from impaired portfolio items amounts to €19,148 thousand (2013: €45,935 thousand). The net investment income of €864,375 thousand includes realised and unrealised gains and losses amounting to €194,809 thousand, which in-clude currency gains of €25,776 thousand. These are essentially the result of investments in US dollars amounting to €36,738 thousand. The currency gains in the underlying US dollar securi-ties amounted to around €128,912 thousand, and these were accompanied by expenditures from derivative financial instruments within the scope of hedging transactions amounting to €92,174 thousand. In addition, currency effects amounting to €9,277 thousand were recognised directly in equity.
Income from investment property includes rent revenue in the amount of €112,048 thou-sand (2013: €114,898 thousand) and direct operational expenses in the amount of €34,591thousand (2013: €39,890 thousand).
Of which available-for-sale securities Type of investment
Current income Reversal of impairment losses Gains on disposals
in € thousand 2014 2013 2014 2013 2014 2013III. Variable-income securities
1. Available for sale 34,803 52,369 6,329 3,954 32,063 129,707 Shares in affiliated companies 702 331 0 0 11 14,790 Equity 1,745 27,478 1,066 118 2,626 55,911 Equity funds 12,353 4,898 0 1,719 29,104 14,995 Bonds not capital-guaranteed 9,098 8,707 5,263 2,117 188 2,441 Other variable-income securities 1,525 912 0 0 0 0 Equity investments and other investments 9,380 10,043 0 1 135 41,569
IV. Fixed-income securities 1. Available for sale
Fixed-income securities 511,492 509,601 126,345 87,591 206,831 78,384
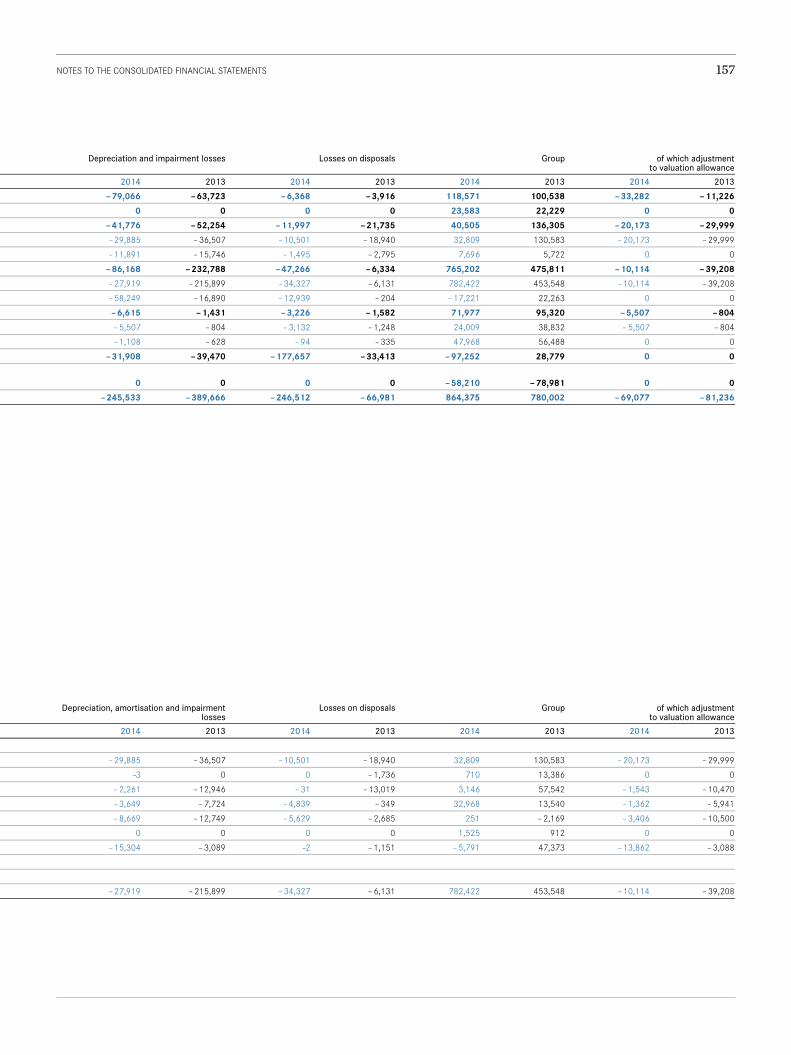
157NOTES TO THE CONSOLIDATED FINANCIAL STATEMENTS
Depreciation and impairment losses Losses on disposals Group of which adjustment to valuation allowance
2014 2013 2014 2013 2014 2013 2014 2013 – 79,066 – 63,723 – 6,368 – 3,916 118,571 100,538 – 33,282 – 11,226 0 0 0 0 23,583 22,229 0 0 – 41,776 – 52,254 – 11,997 – 21,735 40,505 136,305 – 20,173 – 29,999 – 29,885 – 36,507 – 10,501 – 18,940 32,809 130,583 – 20,173 – 29,999 – 11,891 – 15,746 – 1,495 – 2,795 7,696 5,722 0 0 – 86,168 – 232,788 – 47,266 – 6,334 765,202 475,811 – 10,114 – 39,208 – 27,919 – 215,899 – 34,327 – 6,131 782,422 453,548 – 10,114 – 39,208 – 58,249 – 16,890 – 12,939 – 204 – 17,221 22,263 0 0 – 6,615 – 1,431 – 3,226 – 1,582 71,977 95,320 – 5,507 – 804 – 5,507 – 804 – 3,132 – 1,248 24,009 38,832 – 5,507 – 804 – 1,108 – 628 – 94 – 335 47,968 56,488 0 0 – 31,908 – 39,470 – 177,657 – 33,413 – 97,252 28,779 0 0 0 0 0 0 – 58,210 – 78,981 0 0 – 245,533 – 389,666 – 246,512 – 66,981 864,375 780,002 – 69,077 – 81,236
Depreciation, amortisation and impairment losses
Losses on disposals Group of which adjustment to valuation allowance
2014 2013 2014 2013 2014 2013 2014 2013 – 29,885 – 36,507 – 10,501 – 18,940 32,809 130,583 – 20,173 – 29,999 -3 0 0 – 1,736 710 13,386 0 0 – 2,261 – 12,946 – 31 – 13,019 3,146 57,542 – 1,543 – 10,470 – 3,649 – 7,724 – 4,839 – 349 32,968 13,540 – 1,362 – 5,941 – 8,669 – 12,749 – 5,629 – 2,685 251 – 2,169 – 3,406 – 10,500 0 0 0 0 1,525 912 0 0 – 15,304 – 3,089 -2 – 1,151 – 5,791 47,373 – 13,862 – 3,088 – 27,919 – 215,899 – 34,327 – 6,131 782,422 453,548 – 10,114 – 39,208

158 NOTES TO THE CONSOLIDATED FINANCIAL STATEMENTS
36. Other income
in € thousand 2014 2013a) Other non-insurance income 55,669 37,086
Property and casualty insurance 28,360 18,188Health insurance 4,051 5,879Life insurance 23,258 13,019
of which services 5,797 7,379changes in exchange rates 28,862 13,217other 21,010 16,490
b) Other income 6,758 3,504from currency translation 517 490other 6,242 3,014
Total (amount consolidated) 62,428 40,589
37. Other expenses
in € thousand 2014 2013a) Other non-technical expenses 64,182 30,186
Property and casualty insurance 29,909 21,219Health insurance 1,401 434Life insurance 32,872 8,533
of which services 467 1,288exchange rate losses 34,816 7,372motor vehicle registration 9,028 6,892special tax on the financial sector (Hungary) 0 0other 19,870 14,634
b) Other expenses 6,153 2,227For currency translation 4,611 1,474Other 1,541 753
Total (amount consolidated) 70,334 32,413
38. Tax expense
Income taxes in € thousand
2014 2013
Actual tax – reporting year 66,877 60,614Actual tax – previous years – 13,212 2,641Deferred taxes 31,390 6,456Total (amount consolidated) 85,055 69,711

159NOTES TO THE CONSOLIDATED FINANCIAL STATEMENTS
Reconciliation statement in € thousand
2014 2013
A. Profit/(loss) from ordinary activities 377,932 307,569B. Expected tax expense (A. * Group tax rate) 94,483 76,892
Adjusted by tax effects from 1. Tax-exempt investment income – 7,103 – 7,6532. Other – 2,325 86
Amortisation of goodwill and impairment losses 6,250 0Tax-neutral consolidation effects – 1,112 – 3,388Other non-deductible expenses/other tax-exempt income 3,866 13,007Changes in tax rates – 237 – 1,796Deviations in tax rates 196 – 5,422Prior-year taxes – 13,212 2,641Loss carryforwards no longer applicable and other 1,925 – 4,570
C. Income tax expense 85,055 69,711Average effective tax rate in per cent 22.5 22.7
The basic corporate income tax rate applied for all segments was 25 per cent. Deviating corpo-rate tax rates arise in life insurance in which minimum taxation is applied – with an assumed profit participation of 85 per cent.
The calculation of deferred taxes is based on the specific tax rates of each country that the Group companies are based in, which were between 9 and 35 per cent in 2014. Changes in tax rates already decided effective 31 December 2014 are taken into account.
OTHER DISCLOSURES
Employees
Personnel expenses1)
in € thousand 2014 2013
Salaries and wages 388,352 389,930Termination benefit expenses 3,573 63Pension expenses 52,375 28,091Statutory social security contributions as well as remuneration-dependent levies and mandatory contributions 108,676 110,429Other social expenses 8,498 8,981Total 561,473 537,494
of which selling 160,183 151,388of which administration 368,358 355,487
1) Data is based on IFRS measurement.
Average number of employees 2014 2013Total 14,336 14,277
of which selling 5,821 5,893of which administration 8,515 8,384
in € thousand 2014 2013Termination benefit and pension expenses were attributable to
Members of the Management Board and executives as defined by section 80(1) of the Aktiengesetz (AktG Austrian Stock Corporation Act) 8,319 8,352Other employees 39,013 41,331

160 NOTES TO THE CONSOLIDATED FINANCIAL STATEMENTS
Both figures include the expenses for pensioners and surviving dependants (basis: Austrian Commercial Code measurement). The indicated expenses were recharged to operating subsid-iaries based on defined company processes.
The active salaries of the members of the Management Board at UNIQA Insurance Group AG amounted to €3,344 thousand in the reporting period (2013: €4,923 thousand). The amount expended on pensions in the reporting period for former members of the Management Board and their survivors was €2,706 thousand (2013: €2,699 thousand).
The compensation to the members of the Supervisory Board for their work in the 2013 fi-nancial year was €380 thousand. Provisions of €444 thousand have been recognised for the remuneration to be paid for this work in 2014. The amount paid out in attendance fees and cash expenditures in the financial year was €33 thousand (2013: €31 thousand).
There are no advance payments or loans to or liabilities for members of the Management Board and the Supervisory Board.
Share-based remuneration agreement with cash settlement In the 2013 financial year, the UNIQA Group introduced a share-based remuneration pro-gramme for members of the Management Board of UNIQA Insurance Group AG and for select-ed members of the Management Board of UNIQA Österreich Versicherungen AG, Raiffeisen Versicherung AG and UNIQA International AG. In accordance with this programme, entitled employees are conditionally awarded virtual shares effective 1 January of the relevant financial year which give them the right to a cash payment after the end of the benefit period. The first conditional award took place retrospectively effective 1 January 2013 and included 246,888 virtual shares in the UNIQA Insurance Group AG. The length of the benefit period for each tranche runs until 31 December 2016. No further shares were awarded.
The precise payment amount is contingent upon achieving performance targets, building up and holding UNIQA ordinary shares in real terms and holding an employment contract as a member of the Management Board by the end of the relevant benefit period. The amount of the cash payment at the end of the fourth year is linked to the average price for the ordinary share in the second half of 2016 and on achieving both performance targets, which are both weighted 50%.
• Performance Target 1 – Total Shareholder Return (TSR): The degree of target achievement depends on the rank of the TSR of the UNIQA ordinary share among the companies managed in the DJ EuroStoxx TMI Insurance index.
• Performance Target 2 – Return on Equity (ROE): The degree of target achievement de-pends on the rank of the ROE of UNIQA among the companies managed in the DJ EuroStoxx TMI Insurance index.

161NOTES TO THE CONSOLIDATED FINANCIAL STATEMENTS
Determination of the fair values Determination of the first component (Performance Target 1) is based purely on market-based criteria (TSR), which results in an expected degree of achievement of 45%. The fair value was determined using Monte Carlo modelling. No employment and market independent perfor-mance conditions (Performance Target 2) linked to business transactions were taken into ac-count in determining the fair value. Measurement of the second component (Performance Target 2) is contingent upon non-market based criteria. The expected degree of achievement of 80% was determined based on performance as at 31 December 2013 and 31 December 2014, resulting in 80% target achievement.
The provision amount determined at year-end is split up into both components of the share-based obligation as follows:
in € thousand 1/1/2014 31/12/2014TSR tranche (Performance Target 1) 209 214ROE tranche (Performance Target 2) 218 380Total provision 427 594
The following parameters were used to determine the fair value on the date of the award and on the measurement date for the virtual shares:
Award date
1/1/2013Valuation date31/12/2014
TSR tranche (Performance Target 1) Fair value (in EUR) 6.69 3.47Share price (in EUR) 9.32 7.78Simulated share price as at 31/12/2016 7.71Exercise price (in EUR) 0.00 0.00Expected volatility (weighted average, in per cent) - 19.7Expected life (weighted average, in years) 4.0 2.0Discount rate (based on AA corporate bonds, in per cent) 1.2 0.1ROE tranche (Performance Target 2) Fair value (in EUR) 8.75 6.17Share price (in EUR) 9.32 7.78Exercise price (in EUR) 0.00 0.00Expected volatility (weighted average, in per cent) 0.0 0.0Expected life (weighted average, in years) 4.0 2.0Discount rate (based on AA corporate bonds, in per cent) 1.2 0.1
The expected volatility is based on an assessment of historical volatility for the Company’s share price over the past year.
No virtual shares were forfeited or exercised in the current financial year. The obligations from share-based remuneration are stated under Other provisions (Note 27)
and are also included under the statements on Related party transactions – individuals.
Group holding company The parent company of the UNIQA Group is UNIQA Insurance Group AG. This company is registered in the company registry of the Commercial Court of Vienna under FN 92933t. In addition to its duties as Group holding company, this company also performs the duties of a group reinsurer.

162 NOTES TO THE CONSOLIDATED FINANCIAL STATEMENTS
Related companies and persons Companies in the UNIQA Group maintain various relationships with related companies and persons.
In accordance with IAS 24, related companies are identified as those companies which either exercise a controlling or crucial influence on the UNIQA Group. The group of companies also includes the non-consolidated subsidiaries, associates and joint ventures of the UNIQA Group.
The related individuals include the members of management holding key positions for the purposes of IAS 24 along with their close family members. This also includes in particular the members of management in key positions at those companies which either exercise a control-ling or crucial influence on the UNIQA Group, along with their close family members.

163NOTES TO THE CONSOLIDATED FINANCIAL STATEMENTS
Related party transactions – companies
Companies with significant
influence on the UNIQA Group
Unconsolidated subsidiaries
Associates of the UNIQA Group
Other companies Total
Transactions 2014 Premiums written (gross) 318 1,592 812 58,659 61,381Interest income and expenses from loans with companies that are related parties 0 1,400 0 1,546 2,946Interest income and expenses from loans with banks that are related parties and from investments in companies that are related parties 374 4,366 10,110 30,874 45,724At 31/12/2014 Investments at fair value 138,935 198,305 519,123 385,211 1,241,574Bank deposits 0 417,723 261 358,177 776,161
Companies with significant
influence on the UNIQA Group
Unconsolidated subsidiaries
Associates of the UNIQA Group
Other companies Total
Transactions 2013 Premiums written (gross) 0 1,642 1,258 115,243 118,143Interest income and expenses from loans with companies that are related parties 572 185 0 602 1,359Interest income and expenses from loans with banks that are related parties and from investments in companies that are related parties 374 728 5,358 44,730 51,189At 31/12/2013 Investments at fair value 168,989 16,507 535,039 882,640 1,445,370Bank deposits 32 1,099 2,207 1,103,302 1,106,640
Related party transactions – individuals
in € thousand 2014 2013Premiums written (gross) 824 837Salaries and short-term benefits due in the short term1) 3,725 5,108Pension expenses 857 1,571Post-employment benefits 45 1,424Share-based payments 89 226Other income 251 300 1) This item includes fixed and variable Management Board and Supervisory Board remuneration components.
Other financial obligations and contingent liabilities
in € thousand 31/12/2014 31/12/2013Contingent liabilities from litigation risks 24,189 19,720
Austria 0 0Outside of Austria 24,189 19,720
Other contingent liabilities 12,125 10,830Austria 12,125 10,570Outside of Austria 0 261
Total 36,313 30,550

164 NOTES TO THE CONSOLIDATED FINANCIAL STATEMENTS
The companies of the UNIQA Group are involved in court proceedings in Austria and other countries in connection with their ordinary business operations as insurance companies. The result of the pending or threatened proceedings is often impossible to determine or predict.
In consideration of the provisions set aside for these proceedings, the management is of the opinion that these proceedings have no significant effects on the financial situation and the operating earnings of the UNIQA Group.
Ukraine (Non-Life) – Option to purchase granted During the incorporation of portions of the Ukrainian company Closed JSC Credo-Classic In-surance Company (now Private JSC UNIQA), agreements were entered into which obligate UNIQA Internationale Beteiligungs-Verwaltungs GmbH to purchase share packages of the local non-controlling shareholders through option agreements on the basis of a predefined purchase price formula. It was initially agreed to exercise the option in the second quarter of 2012, and this was postponed to the 2016 financial year as part of an amendment of the transaction con-tracts in 2011. In the 2013 financial year, these non-controlling interests were reclassified as equity within the scope of an adjustment for the previous year in accordance with IAS 8 and were stated as other Liabilities with rectification of the proportionate goodwill. The liability amounts to €4,844 thousand, unchanged from the previous year.
Lease expenses in € thousand 2014 2013Current lease expenses 7,826 6,825 Future lease payments in connection with the financing of the UNIQA Group headquarters in Vienna
up to 1 year 5,102 5,090more than 1 year up to 5 years 17,859 20,360more than 5 years 0 2,545
Total 22,961 27,996Income from subleases 550 692
We moved into the UNIQA Group headquarters – the UNIQA Tower – in 2004. The aforemen-tioned leasing obligations are based on the investment expenditures in connection with a spe-cific calculatory interest rate.
Expenses for the auditor of the financial statements The auditor fees in the financial year were €1,100 thousand (2013: €4,423 thousand); of which €280 thousand (2013: €223 thousand) is attributable to the annual audit, €652 thousand (2013: €4,110 thousand) to other auditing services and €168 thousand (2013: €90 thousand) to other services.

165NOTES TO THE CONSOLIDATED FINANCIAL STATEMENTS
Affiliated companies and associates at 31 December 2014
Company Type Domicile Equity in € million1)
Share of equity In per cent2)
Austrian insurance companies UNIQA Insurance Group AG (Group holding company) 1029 Vienna UNIQA Österreich Versicherungen AG Consolidated 1029 Vienna – 699.9 100.0Salzburger Landes-Versicherung AG Consolidated 5020 Salzburg – 29.0 100.0Raiffeisen Versicherung AG Consolidated 1029 Vienna – 762.1 100.0FINANCELIFE Lebensversicherung AG Consolidated 1029 Vienna – 87.0 100.0SK Versicherung Aktiengesellschaft Equity-accounted 1050 Vienna 11.7 25.0 Foreign insurance companies UNIQA Assurances S.A. Consolidated Switzerland, Geneva – 14.0 100.0UNIQA Re AG Consolidated Switzerland, Zurich – 250.2 100.0UNIQA Assicurazioni S.p.A. Consolidated Italy, Milan – 239.5 100.0UNIQA pojišťovna a.s. Consolidated Slovakia, Bratislava – 42.0 99.9UNIQA pojištovna, a.s. Consolidated The Czech Republic, Prague – 58.9 100.0UNIQA osiguranje d.d. Consolidated Croatia, Zagreb – 60.4 100.0UNIQA Towarzystwo Ubezpieczeń S.A. Consolidated Poland, Lodz – 84.4 98.6UNIQA Towarzystwo Ubezpieczeń na Zycie S.A. Consolidated Poland, Lodz – 13.8 99.8UNIQA Biztosító Zrt. Consolidated Hungary, Budapest – 17.9 100.0UNIQA Lebensversicherung AG Consolidated Liechtenstein, Vaduz – 4.4 100.0UNIQA Versicherung AG Consolidated Liechtenstein, Vaduz – 8.5 100.0UNIQA Previdenza S.p.A. Consolidated Italy, Milan – 153.5 100.0UNIQA Osiguranje d.d. Consolidated Bosnia and Herzegovina, Sarajevo – 7.5 99.8UNIQA Insurance plc. Consolidated Bulgaria, Sofia – 6.9 99.9UNIQA Life Insurance plc. Consolidated Bulgaria, Sofia – 5.6 99.7UNIQA životno osiguranje a.d. Consolidated Serbia, Belgrade – 7.4 100.0Insurance company "UNIQA" Consolidated Ukraine, Kiev – 10.4 100.0UNIQA LIFE Consolidated Ukraine, Kiev – 10.3 100.0UNIQA životno osiguranje a.d. Consolidated Montenegro, Podgorica – 1.8 100.0UNIQA neživotno osiguranje a.d. Consolidated Serbia, Belgrade – 11.1 100.0UNIQA neživotno osiguranje a.d. Consolidated Montenegro, Podgorica – 3.9 100.0UNIQA Asigurari S.A. Consolidated Romania, Bucharest – 42.4 100.0UNIQA Life S.A. Consolidated Romania, Bucharest – 5.9 100.0Raiffeisen Life Insurance Company LLC Consolidated Russia, Moscow 0.7 75.0UNIQA Life S.p.A. Consolidated Italy, Milan – 57.3 90.0SIGAL UNIQA GROUP AUSTRIA Sh.a. Consolidated Albania, Tirana – 22.7 68.6UNIQA AD Skopje Consolidated Macedonia, Skopje – 5.2 100.0SIGAL Life UNIQA Group AUSTRIA Sh.a. Consolidated Albania, Tirana – 4.5 100.0SIGAL UNIQA Group AUSTRIA Sh.a. Consolidated Kosovo, Priština – 3.7 100.0UNIQA Life AD Skopje Consolidated Macedonia, Skopje – 3.0 100.0SIGAL Life UNIQA Group AUSTRIA Sh.a Consolidated Kosovo, Priština – 3.8 100.0SH.A.F.P SIGAL Life UNIQA Group AUSTRIA Sh.A. Consolidated Albania, Tirana – 0.1 51.0 Austrian Group service companies UNIQA Real Estate Management GmbH Consolidated 1029 Vienna – 2.2 100.0Versicherungsmarkt-Servicegesellschaft m.b.H. Consolidated 1010 Vienna – 0.2 100.0Agenta Risiko– und Finanzierungsberatung Gesellschaft m.b.H. Consolidated 1010 Vienna – 1.2 100.0Raiffeisen Versicherungsmakler Vorarlberg GmbH Equity-accounted 6900 Bregenz 0.3 50.0Versicherungsbüro Dr. Ignaz Fiala Gesellschaft m.b.H. 4) 1010 Vienna 33.3RSG – Risiko Service und Sachverständigen GmbH 3) 1029 Vienna 100.0Dr. E. Hackhofer EDV-Softwareberatung Gesellschaft m.b.H. Consolidated 1070 Vienna 0.0 100.0UNIQA IT Services GmbH Consolidated 1029 Vienna – 0.7 100.0

166 NOTES TO THE CONSOLIDATED FINANCIAL STATEMENTS
Company Type Domicile Equity
in € million1)Share of equity
In per cent2)
UNIQA Capital Markets GmbH Consolidated 1020 Vienna – 4.5 100.0UNIQA International AG Consolidated 1029 Vienna – 196.7 100.0UNIQA Internationale Beteiligungs-Verwaltungs GmbH Consolidated 1029 Vienna – 553.8 100.0Alopex Organisation von Geschäftskontakten GmbH 3) 1020 Vienna 100.0RC RISK-CONCEPT Versicherungsmakler GmbH 3) 1029 Vienna 100.0Assistance Beteiligungs-GmbH Consolidated 1010 Vienna – 0.3 64.0Real Versicherungsvermittlung GmbH (previously: Real Versicherungs-Makler GmbH)
3) 1220 Vienna 100.0
Together Internet Services GmbH 4) 1030 Vienna 22.6UNIQA HealthService – Services im Gesundheitswesen GmbH 3) 1029 Vienna 100.0UNIQA Real Estate Beteiligungsverwaltung GmbH Consolidated 1029 Vienna – 16.6 100.0Privatklinik Grinzing GmbH 3) 1190 Vienna 100.0Versicherungsagentur Wilhelm Steiner GmbH 3) 1029 Vienna 100.0UNIQA Real Estate Finanzierungs GmbH Consolidated 1029 Vienna – 3.7 100.0UNIQA Group Audit GmbH Consolidated 1029 Vienna – 0.1 100.0Valida Holding AG Equity-accounted 1020 Vienna 81.1 40.1RVCM GmbH 4) 1010 Vienna 50.0NewMoove GmbH (previously: F&R Multimedia GmbH) 3) 1060 Vienna 61.0PremiaFIT Facility und IT Management u. Service GmbH 3) 1190 Vienna 75.0RHG Management GmbH Consolidated 1020 Vienna – 25.1 100.0UNIQA Finanzbeteiligung GmbH Consolidated 1020 Vienna – 136.3 100.0UNIQA International Corporate Business GmbH 3) 1029 Vienna 100.0 Foreign Group service companies UNIQA Raiffeisen Software Service Kft. Consolidated Hungary, Budapest – 0.5 60.0InsData spol. s.r.o. Consolidated Slovakia, Nitra – 2.2 98.0ProUNIQA s.r.o. 3) The Czech Republic, Prague 100.0UNIPARTNER s.r.o. Consolidated Slovakia, Bratislava 0.1 100.0UNIQA InsService spol. s.r.o. Consolidated Slovakia, Bratislava – 0.2 100.0UNIQA Ingatlanhasznosító Kft. Consolidated Hungary, Budapest – 4.7 100.0UNIQA Szolgáltató Kft. Consolidated Hungary, Budapest 3.7 100.0UNIQA Claims Services International Kft. 3) Hungary, Budapest 100.0RC Risk Concept Vaduz 3) Liechtenstein, Vaduz 100.0Első Közszolgálati Pénzügyi Tanácsadó Kft. 3) Hungary, Budapest 92.4UNIQA Számitástechnikai Szolgáltató Kft. Consolidated Hungary, Budapest – 0.1 100.0UNIQA Intermediazioni S.r.l. 3) Italy, Milan 100.0Vitosha Auto OOD Consolidated Bulgaria, Sofia – 0.1 100.0UNIQA Raiffeisen Software Service S.R.L. Consolidated Romania, Klausenburg – 0.2 60.0UNIQA Software Service Bulgaria OOD 3) Bulgaria, Plovdiv 99.0UNIQA Software Service Ukraine GmbH 3) Ukraine, Kiev 99.0UNIQA Assistance doo Sarajevo 3) Bosnia and Herzegovina, Sarajevo 99.8UNIQA Agent doo za zastupanje u osiguranju Banja Luka 3) Bosnia and Herzegovina, Banja Luka 99.8UNIQA Agent doo za zastupanje u osiguranju Sarajevo 3) Bosnia and Herzegovina, Sarajevo 99.8UNIQA Software Service Kft. 3) Hungary, Budapest 100.0UNIPROINS CONSULTANTA SA 3) Romania, Bucharest 100.0sTech d.o.o. 3) Serbia, Belgrade 100.0UNIQA Services Sp. z o.o. 3) Poland, Lodz 100.0Poliklinika Medico Consolidated Croatia, Rijeka – 0.2 100.0Dekra-Expert Műszaki Szakértői Kft. Equity-accounted Hungary, Budapest 0.7 50.0

167NOTES TO THE CONSOLIDATED FINANCIAL STATEMENTS
Company Type Domicile Equity
in € million1)Share of equity
In per cent2)
Financial and strategic equity investments – Austria Medial Beteiligungs-Gesellschaft m.b.H. Equity-accounted 1010 Vienna 31.3 29.6PremiQaMed Holding GmbH*) Consolidated 1010 Vienna – 75.5 100.0PremiQaMed Immobilien GmbH Consolidated 1010 Vienna – 19.8 100.0PremiQaMed Privatkliniken GmbH Consolidated 1190 Vienna – 7.0 100.0Ambulatorien Betriebsgesellschaft m.b.H. Consolidated 1190 Vienna – 0.6 100.0STRABAG SE*) Equity-accounted 9500 Villach 2,986.3 13.8PremiQaMed Management GmbH Consolidated 1190 Vienna – 0.4 100.0GENIA CONSULT Unternehmensberatungs Gesellschaft mbH 3) 1190 Vienna 74.0R-SKA Baden Betriebs-GmbH 4) 2500 Baden 49.0Privatklinik Villach Gesellschaft m.b.H. & Co. KG 4) 9020 Klagenfurt 34.9Privatklinik Villach Gesellschaft m.b.H. 4) 9020 Klagenfurt 25.0call us Assistance International GmbH Equity-accounted 1090 Vienna 0.9 61.0UNIQA Leasing GmbH 4) 1061 Vienna 25.0UNIQA Internationale Anteilsverwaltung GmbH Consolidated 1020 Vienna – 163.4 100.0UNIQA Beteiligungs-Holding GmbH Consolidated 1029 Vienna – 50.1 100.0UNIQA Erwerb von Beteiligungen Gesellschaft m.b.H. Consolidated 1029 Vienna – 11.5 100.0 Real-estate companies UNIQA Real Estate CZ, s.r.o. Consolidated The Czech Republic, Prague 15.0 100.0UNIQA Real s.r.o. Consolidated Slovakia, Bratislava 0.5 100.0UNIQA Real II s.r.o. Consolidated Slovakia, Bratislava 1.0 100.0Steigengraben-Gut Gesellschaft m.b.H. 3) 1020 Vienna 100.0Raiffeisen evolution project development GmbH Equity-accounted 1030 Vienna 131.9 20.0DIANA-BAD Errichtungs– und Betriebs GmbH Equity-accounted 1020 Vienna 1.1 33.0UNIQA Real Estate AG Consolidated 1029 Vienna – 168.1 100.0UNIQA Real Estate Zweite Beteiligungsverwaltung GmbH Consolidated 1020 Vienna – 19.6 100.0Design Tower GmbH Consolidated 1029 Vienna – 87.0 100.0Aspernbrückengasse Errichtungs– und Betriebs GmbH Consolidated 1029 Vienna – 10.2 99.0UNIQA Real Estate Holding GmbH Consolidated 1029 Vienna – 42.7 100.0UNIQA Real Estate Dritte Beteiligungsverwaltung GmbH Consolidated 1029 Vienna – 12.3 100.0UNIQA Real Estate Vierte Beteiligungsverwaltung GmbH Consolidated 1029 Vienna – 4.6 100.0“Hotel am Bahnhof” Errichtungs GmbH & Co KG Consolidated 1020 Vienna – 10.5 100.0GLM Errichtungs GmbH Consolidated 1010 Vienna – 1.6 100.0EZL Entwicklung Zone Lassallestraße GmbH & Co. KG Consolidated 1029 Vienna – 37.2 100.0Fleischmarkt Inzersdorf Vermietungs GmbH Consolidated 1020 Vienna – 7.4 100.0Praterstraße Eins Hotelbetriebs GmbH Consolidated 1020 Vienna – 2.5 100.0UNIQA Plaza Irodaház és Ingatlankezelő Kft. Consolidated Hungary, Budapest 1.2 100.0HKM Immobilien GmbH 3) Germany, Mannheim 100.0Floreasca Tower SRL Consolidated Romania, Bucharest 16.8 100.0Pretium Ingatlan Kft. Consolidated Hungary, Budapest 4.9 100.0UNIQA poslovni centar Korzo d.o.o. Consolidated Croatia, Rijeka 2.5 100.0UNIQA-Invest Kft. Consolidated Hungary, Budapest 9.4 100.0Knesebeckstraße 8–9 Grundstücksgesellschaft mbH Consolidated Germany, Berlin 2.2 100.0UNIQA Real Estate Bulgaria EOOD Consolidated Bulgaria, Sofia 1.3 100.0UNIQA Real Estate BH nekretnine, d.o.o. Consolidated Bosnia and Herzegovina, Sarajevo 3.7 100.0UNIQA Real Estate d.o.o. Consolidated Serbia, Belgrade 2.6 100.0
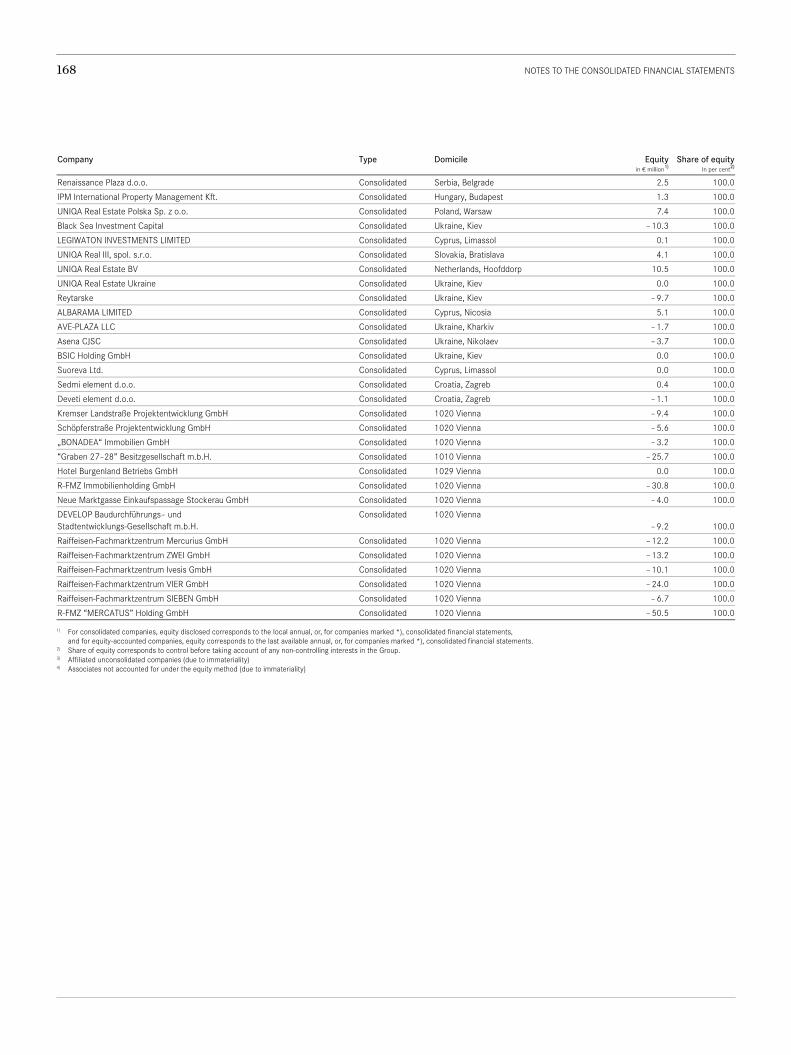
168 NOTES TO THE CONSOLIDATED FINANCIAL STATEMENTS
Company Type Domicile Equity
in € million1)Share of equity
In per cent2)
Renaissance Plaza d.o.o. Consolidated Serbia, Belgrade 2.5 100.0IPM International Property Management Kft. Consolidated Hungary, Budapest 1.3 100.0UNIQA Real Estate Polska Sp. z o.o. Consolidated Poland, Warsaw 7.4 100.0Black Sea Investment Capital Consolidated Ukraine, Kiev – 10.3 100.0LEGIWATON INVESTMENTS LIMITED Consolidated Cyprus, Limassol 0.1 100.0UNIQA Real III, spol. s.r.o. Consolidated Slovakia, Bratislava 4.1 100.0UNIQA Real Estate BV Consolidated Netherlands, Hoofddorp 10.5 100.0UNIQA Real Estate Ukraine Consolidated Ukraine, Kiev 0.0 100.0Reytarske Consolidated Ukraine, Kiev – 9.7 100.0ALBARAMA LIMITED Consolidated Cyprus, Nicosia 5.1 100.0AVE-PLAZA LLC Consolidated Ukraine, Kharkiv – 1.7 100.0Asena CJSC Consolidated Ukraine, Nikolaev – 3.7 100.0BSIC Holding GmbH Consolidated Ukraine, Kiev 0.0 100.0Suoreva Ltd. Consolidated Cyprus, Limassol 0.0 100.0Sedmi element d.o.o. Consolidated Croatia, Zagreb 0.4 100.0Deveti element d.o.o. Consolidated Croatia, Zagreb – 1.1 100.0Kremser Landstraße Projektentwicklung GmbH Consolidated 1020 Vienna – 9.4 100.0Schöpferstraße Projektentwicklung GmbH Consolidated 1020 Vienna – 5.6 100.0„BONADEA“ Immobilien GmbH Consolidated 1020 Vienna – 3.2 100.0“Graben 27–28” Besitzgesellschaft m.b.H. Consolidated 1010 Vienna – 25.7 100.0Hotel Burgenland Betriebs GmbH Consolidated 1029 Vienna 0.0 100.0R-FMZ Immobilienholding GmbH Consolidated 1020 Vienna – 30.8 100.0Neue Marktgasse Einkaufspassage Stockerau GmbH Consolidated 1020 Vienna – 4.0 100.0DEVELOP Baudurchführungs– und Stadtentwicklungs-Gesellschaft m.b.H.
Consolidated 1020 Vienna – 9.2 100.0
Raiffeisen-Fachmarktzentrum Mercurius GmbH Consolidated 1020 Vienna – 12.2 100.0Raiffeisen-Fachmarktzentrum ZWEI GmbH Consolidated 1020 Vienna – 13.2 100.0Raiffeisen-Fachmarktzentrum Ivesis GmbH Consolidated 1020 Vienna – 10.1 100.0Raiffeisen-Fachmarktzentrum VIER GmbH Consolidated 1020 Vienna – 24.0 100.0Raiffeisen-Fachmarktzentrum SIEBEN GmbH Consolidated 1020 Vienna – 6.7 100.0R-FMZ “MERCATUS” Holding GmbH Consolidated 1020 Vienna – 50.5 100.0 1) For consolidated companies, equity disclosed corresponds to the local annual, or, for companies marked *), consolidated financial statements, and for equity-accounted companies, equity corresponds to the last available annual, or, for companies marked *), consolidated financial statements. 2) Share of equity corresponds to control before taking account of any non-controlling interests in the Group. 3) Affiliated unconsolidated companies (due to immateriality) 4) Associates not accounted for under the equity method (due to immateriality)

169NOTES TO THE CONSOLIDATED FINANCIAL STATEMENTS
Approval for publication These consolidated financial statements were prepared by the Management Board as of the date of signing and approved for publication.
Declaration of the legal representatives Pursuant to Section 82 paragraph 4 of the Austrian Stock Market Act, the Management Board of UNIQA Insurance Group AG hereby confirms, that, to the best of our knowledge, the consoli-dated financial statements, which were prepared in accordance with the relevant accounting standards, give a true and fair view of the financial position, financial performance and cash flows of the group, and that the Group management report describes the relevant risks and uncertainties which the Group faces.
Vienna, 25 March 2015
Andreas Brandstetter Chairman of the Management Board
Hannes Bogner Member of the Management Board
Wolfgang Kindl Member of the Management Board
Thomas Münkel Member of the Management Board
Kurt Svoboda Member of the Management Board

170 AUDIT OPINION
Auditor’s Report
Report on the consolidated financial statements We have audited the German version of the accompanying consolidated financial statements of UNIQA Insurance Group AG, Vienna, for the financial year from 1 January to 31 December 2014. These consolidated financial statements comprise the consolidated balance sheet as at 31 December 2014, the separate consolidated income statement, the consolidated statement of comprehensive income, the consolidated cash flow statement and the consolidated statement of changes in equity for the financial year ending 31 December 2014, as well as the notes. Management’s Responsibility for the Consolidated Financial Statements and for the Accounting System The Company’s management is responsible for the Group accounting system and for the prepa-ration and fair presentation of the consolidated financial statements in accordance with Inter-national Financial Reporting Standards (IFRSs) as adopted by the EU and the additional re-quirements under Section 245a UGB (Austrian Commercial Code) and Section 80b VAG (Aus-trian Insurance Supervisory Act). This responsibility includes: designing, implementing and maintaining internal control relevant to the preparation and fair preparation and fair presenta-tion of consolidated financial statements that are free from material misstatement, whether due to fraud or error; selecting and applying appropriate accounting policies; making accounting estimates that are reasonable in the circumstances. Auditor’s Responsibility and Description of Type and Scope of the Statutory Audit Our responsibility is to express an opinion on these consolidated financial statements based on our audit. We conducted our audit in accordance with laws and regulations applicable in Austria and Austrian Standards on Auditing, as well as in accordance with International Standards on Auditing (ISAs) issued by the International Auditing and Assurance Standards Board (IAASB) of the International Federation of Accountants (IFAC). Those standards require that we comply with professional guidelines and that we plan and perform the audit to obtain reasonable assur-ance whether the consolidated financial statements are free from material misstatement.
An audit involves performing procedures to obtain audit evidence about the amounts and disclosures in the consolidated financial statements. The procedures selected depend on the auditor’s judgement, including the assessment of the risks of material misstatement of the con-solidated financial statements, whether due to fraud or error. In making those risk assessments, the auditor considers internal control relevant to the Group’s preparation and fair presentation of the consolidated financial statements, in order to design audit procedures that are appropri-ate in the circumstances, but not for the purpose of expressing an opinion on the effectiveness of the Group’s internal control. An audit also includes evaluating the appropriateness of accounting policies used and the reasonableness of accounting estimates made by management, as well as evaluating the overall presentation of the consolidated financial statements.
We believe that the audit evidence we have obtained is sufficient and appropriate to provide a reasonable basis for our audit opinion.

171AUDIT OPINION
Opinion Our audit did not give rise to any objections. In our opinion, which is based on the results of our audit, the consolidated financial statements comply with legal requirements and give a true and fair view of the financial position of the Group as at 31 December 2014 and of its financial per-formance and its cash flows for the financial year from 1 January to 31 December 2014 in ac-cordance with International Financial Reporting Standards (IFRSs) as adopted by the EU and the supplementary requirements of Section 80b VAG.
Comments on the Management Report for the Group Pursuant to statutory provisions, the management report for the Group is to be audited as to whether it is consistent with the consolidated financial statements and as to whether the other disclosures are not misleading with respect to the Company’s position. The auditor’s report also has to contain a statement as to whether the management report for the Group is consistent with the consolidated financial statements and whether the disclosures pursuant to Section 243a UGB are appropriate.
In our opinion, the management report for the Group is consistent with the consolidated fi-nancial statements. The disclosures pursuant to Section 243a UGB are appropriate.
Vienna, 25 March 2015
PwC Wirtschaftsprüfung GmbH
Mag. Liane Hirner Wirtschaftsprüfer
(Austrian Certified Public Accountant)
Disclosure, publication and duplication of the consolidated financial statements together with the auditor’s report according to Section 281 paragraph 2 UGB in a form not in accordance with statutory requirements and differing from the version audited by us is not permitted. Reference to our audit may not be made without prior written permission from us.

Pursuant to Section 82 paragraph 4 of the Austrian Stock Exchange Act the Management Board of UNIQA Insurance Group AG confirms,
that, to the best of our knowledge, the consolidated financial statements give a true and fair view of the assets, liabilities, financial position and profit or loss of the Group as required by the appli-cable accounting standards and that the Group management report gives a true and fair view of the development and performance of the business and the position of the Group, together with a description of the principal risks and uncertainties the Group faces;
that, to the best of our knowledge. the separate financial statements give a true and fair view of the assets, liabilities, financial position and profit or loss of the parent company as required by the applicable accounting standards and that the management report gives a true and fair view of the development and performance of the business and the position of the company, together with a description of the principal risks and uncertainties the company faces.
Vienna, 25 March 2015
Statement by the Legal Representatives
172 ANNUAL FINANCIAL REPORT 2014
Thomas MünkelMember of the Management Board
Kurt SvobodaMember of the Management Board
Andreas BrandstetterChairman of the Management Board
Hannes BognerMember of the Management Board
Wolfgang KindlMember of the Management Board

IMPRINTOwner and publisherUNIQA Insurance Group AGCommercial registry no.: 92933tData processing register: 0055506
Concept, advice and designKatharina Ehrenmüller, Jo Santos / www.neadesign.atEditorial workClaudia Riedmann / www.schreibagentur.atTranslation and linguistic consultingASI GmbH / www.asint.atPhotographyThomas Topf / www.thomastopf.comImage editingBernsteiner Design DepartmentPaperMunken Pure, 240/120/90 gPrinted byAV+Astoria Druckzentrum GmbHProductionLindenau Productions
ContactUNIQA Insurance Group AGInvestor RelationsUntere Donaustraße 21, 1029 Vienna, AustriaPhone: (+43) 01 21175-3773E-mail: [email protected]
www.uniqagroup.com
InformationUNIQA’s Group Report is published inGerman and English and can be downloadedas a PDF file from the Investor Relationsarea on our Group website. The interactiveonline version is also available atreports.uniqagroup.com.
Clause regarding predictions about the future This report contains statements which refer to the future development of the UNIQA Group. These statements present estimations which were reached upon the basis of all of the information available to us at the present time. If the assumptions on which they are based do not occur, the actual events may vary from the results currently expected. As a result, no guarantee can be provided for the information given.