Shape-based Invariant Texture Indexingcurrent state of the art in locally invariant texture...
25
HAL Id: hal-00355070 https://hal.archives-ouvertes.fr/hal-00355070v1 Submitted on 22 Jan 2009 (v1), last revised 26 Jun 2013 (v2) HAL is a multi-disciplinary open access archive for the deposit and dissemination of sci- entific research documents, whether they are pub- lished or not. The documents may come from teaching and research institutions in France or abroad, or from public or private research centers. L’archive ouverte pluridisciplinaire HAL, est destinée au dépôt et à la diffusion de documents scientifiques de niveau recherche, publiés ou non, émanant des établissements d’enseignement et de recherche français ou étrangers, des laboratoires publics ou privés. Shape-based Invariant Texture Indexing Gui-Song Xia, Julie Delon, Yann Gousseau To cite this version: Gui-Song Xia, Julie Delon, Yann Gousseau. Shape-based Invariant Texture Indexing. International Journal of Computer Vision, Springer Verlag, 2009, pp.1-22. 10.1007/s11263-009-0312-3. hal- 00355070v1
Transcript of Shape-based Invariant Texture Indexingcurrent state of the art in locally invariant texture...

HAL Id: hal-00355070https://hal.archives-ouvertes.fr/hal-00355070v1
Submitted on 22 Jan 2009 (v1), last revised 26 Jun 2013 (v2)
HAL is a multi-disciplinary open accessarchive for the deposit and dissemination of sci-entific research documents, whether they are pub-lished or not. The documents may come fromteaching and research institutions in France orabroad, or from public or private research centers.
L’archive ouverte pluridisciplinaire HAL, estdestinée au dépôt et à la diffusion de documentsscientifiques de niveau recherche, publiés ou non,émanant des établissements d’enseignement et derecherche français ou étrangers, des laboratoirespublics ou privés.
Shape-based Invariant Texture IndexingGui-Song Xia, Julie Delon, Yann Gousseau
To cite this version:Gui-Song Xia, Julie Delon, Yann Gousseau. Shape-based Invariant Texture Indexing. InternationalJournal of Computer Vision, Springer Verlag, 2009, pp.1-22. 10.1007/s11263-009-0312-3. hal-00355070v1

Invariant Texture Indexing Using Topographic Maps
Gui-Song Xia, Julie Delon and Yann Gousseau
Telecom ParisTech, LTCI CNRS,
46, rue Barrault, 75013 Paris, France
xia,delon,[email protected]
Abstract
This paper introduces a new texture analysis scheme which is invariant to local geometric
and radiometric changes. The proposed methodology relies on the topographic map of images,
obtained from the connected components of level sets. This morphological tool, providing a
multi-scale and contrast-invariant representation of images, is shown to be well suited to
texture analysis. We first make use of invariant moments to extract geometrical information
from the topographic map. This yields features that are invariant to local similarities or local
affine transformations. These features are invariant to any local contrast change. We then
relax this invariance by computing additional features that are invariant to local affine contrast
changes and investigate the resulting analysis scheme by performing classification and retrieval
experiments on three texture databases. The obtained experimental results outperform the
current state of the art in locally invariant texture analysis.
Keywords: Topographic map, level lines, texture analysis, local invariance.
1 Introduction
Texture is widely considered as a fundamental ingredient of the structure of natural images. Theanalysis of texture, though, is a long standing and challenging problem in image processing andcomputer vision. Yves Meyer recently coined texture as “a subtle balance between repetition andinnovation” [1]. Indeed, the repetitive nature of texture oriented some of the very early research onautomatic texture discrimination toward frequency or autocorrelation analysis, see e.g. [2]. Next,in order to deal with local transitions as well as with the “innovation” part of textures, one hasfavored localized, Gabor or wavelet-like analysis, see e.g. [3]. The ability of such mathematical toolsto handle multi-scale structures has made them one of the more popular tool for analyzing textures.One limitation of such approaches, however, lies in their difficulty in efficiently representing thegeometrical aspects of textures, such as sharp transitions and elongated contours. In order toovercome this difficulty, alternative wavelet-like approaches have been proposed to enable moreefficient representations of structured textures, see e.g. [4].
The Mathematical Morphology school has long ago [5, 6] proposed a radically different multi-scale analysis tool for texture, the so-called granulometry. These are obtained from an imageby applying elementary morphological operations with structuring elements of increasing sizes.Because such basic morphological operations operate on the level sets of images, the resultinganalysis enables a direct handling of the edges and the shapes contained in textures. In this work,we show that by using a morphological multi-scale decomposition of images, the topographic mapas introduced by Caselles et al. [7], we can perform efficient texture analysis, while being invariantto local radiometric and geometrical changes.
Indeed, a challenging issue when analyzing texture is that texture surfaces are usually perceivedunder unknown viewing conditions. Except when dealing with a controlled image acquisitionprotocol, for instance in specific industrial applications, texture analysis methods should complywith some invariance requirements. The most basic ones are translation, scale and orientation
1

1 INTRODUCTION 2
invariances. It is also desirable to achieve invariance to some contrast changes, in order to dealwith variable lighting conditions. Next, the requirement of invariance with respect to viewpointchanges for flat texture yields analyses that are invariant with respect to affine or projectivetransforms. Moreover, textures can live on non-flat surfaces, as it is the case for bark on a tree orfor folded textiles. Such an example is shown in Figure 1, where two different samples of the sametexture class (plaid) from the UIUC database [8] are displayed. Several recent approaches to theanalysis of such textures have been to extract features that are local and individually invariantto some geometric transforms, such as similarity or affine transforms, [9, 10]. In contrast withpreviously developed approaches to the problem of invariant 3D texture analysis, such locallyinvariant methods do not need any learning of the deformations [11, 12] or explicit modeling [13]of the 3D surfaces. In this paper, we show that a morphological analysis relying on the topographicmap enables retrieval and classification of textures that equal or outperform the existing locallyinvariant approaches on several databases.
Figure 1: Two samples of the same texture class from the UIUC database [8]. This texture lies onnon-rigid surfaces implying complex deformations between the samples.
1.1 Previous and related work
This section briefly summarizes different directions that have been explored for the invariant anal-ysis of texture images. Texture analysis has been a very active research field over the last fourdecades, and an exhaustive study of this field is of course beyond the scope of this paper. Somesurveys and comparative studies of existing methods can be found in [14, 15, 16, 17, 18], the lastone being devoted to invariant texture analysis. In what follows, we first focus on classical ap-proaches and the type of global invariances they allow. By global invariances, we mean invariancesto global transforms of the image. We then summarize recent approaches to the analysis of texturethat are invariant under local transforms of images. We focus on methods that are invariant bydesign and do not include in this short discussion methods that are invariant as the result of alearning process [11, 12] or an explicit modeling of 3D textures surfaces [13].
The use of co-occurrence matrices [19] is still a popular approach, relying on non-parametricstatistics at the pixel level. Rotation invariance can be achieved for such methods by using polarcoordinate systems, as detailed in [20]. In a related direction, Pietikainen et al. [21, 22] propose arotation invariant local binary pattern (joint distribution of gray values on circular local neighbor-hoods) to describe texture images. Still at the pixel level, Kashyap and Khotanzad [23] developedrotation invariant autoregressive models. Cohen et al. [24], among others, have introduced rotationinvariant Gaussian Markov random fields to model textures. However, the design of scale invariantMarkov random field rapidly implies very involved computations, see e.g. [25]. Of course, pixelstatistics can be averaged over different neighborhoods and make use of multi-resolution schemes,but these statistics are certainly not the easiest way to achieve scale or affine invariant analyses oftextures.
A second popular and efficient way to analyze textures relies on filtering. Many works havefocused on different filter bank families, different sub-band decompositions, and on the optimization

1 INTRODUCTION 3
of filters for texture feature separation, see e.g. [26, 17, 12]. Many of these approaches enabletranslation invariance (by using over-complete representations), rotation and scale invariance, byusing effective filter designs, see e.g. [27, 28, 29, 11, 30, 10]. Some contrast invariance can also beachieved by normalizing responses to filters.
As already mentioned, an alternative approach to the analysis of textures has been proposed bythe mathematical morphology school in the framework of granulometry. The idea is to characterizean image by the way it evolves under morphological operations such as opening or closing whenthe size of the structuring elements is increased [6, 31]. These ideas have been successfully appliedto the classification of textures, see e.g. [32, 33], as well as the related approach [34], making useof stochastic geometry. Several works rely on the theory of connected operators [35] to computegranulometry without the need for structuring elements, see [36, 37], thus potentially enablinggreater geometrical invariances. However, there are few works showing the benefit of the geometri-cal nature of morphological operators to achieve similarity or affine invariant texture classification,with the notable exception of [38], where a shape-size pattern spectra is proposed as a way toclassify images. In particular, it is shown that this spectra enables rotation-invariant classificationof texture images. In [39], it is proposed to globally use the Earth Mover’s Distance between to-pographic maps to perform scale invariant texture classification. To the best of our knowledge, nowork has proposed the use of morphological attributes to achieve viewpoint invariant descriptionof textures. Concerning radiometric invariant analysis of texture, the benefit of using contrast in-variant morphological operators to recognize texture under various illumination conditions has notyet been demonstrated. Authors of [40] have developed an illumination invariant morphologicalscheme to index textures, but they achieve invariance thanks to histogram modification techniquesand not by using the contrast invariant properties of morphological analysis.
Fractal geometry has also been used in the description of textures, see e.g. the early work [41].Such approaches have also been shown to enable globally invariant texture analysis. Recently, Xu etal [42] proposed the use of multifractal spectrum vectors to describe textures while achieving globalinvariance under bi-Lipschitz transforms, a general class of transforms which includes perspectivetransforms and smooth texture surface deformations.
Recently, several works have proposed to use individually normalized local features in orderto represent textures while being locally invariant to geometric or radiometric transforms, see [8,43, 44, 10]. In [8] and [43], a set of interest local affine regions are selected to build a sparserepresentation of textures relying on affine invariant descriptors. Textures are represented thanksto bag-of-features, a method that has been proved very efficient to recognize object categories,see e.g. [45]. In [44], textures are characterized statistically by the full joint PDF of their localfractal dimension and local fractal length, and this approach is shown to be discriminative andaffine invariant. Very recently, Mellor et al. [10] have shown that similar local invariances can beobtained using a filter bank approach. These authors develop a new family of filters, enabling atexture analysis that is locally invariant to contrast changes and to similarities.
1.2 Our Contributions
As explained earlier in the introduction, the goal of this paper is to introduce a new method fortexture analysis that in spirit is similar to morphological granulometries, while allowing a highdegree of geometrical and radiometric invariances. The approach relies on the complete set oflevel lines of the image, the so-called topographic map, introduced by Caselles et al [7]. Theshapes (that is, the interiors of the connected components of level lines) are the basic elements onwhich the proposed texture analysis is performed. We exhibit a set of simple statistics on theseshapes, obtained using classical invariant shape moments. Therefore, and because each shape isindividually normalized, the proposed texture indexing is invariant to local geometrical transforms,allowing for the recognition of non-rigid textures. Various experiments of texture classification andretrieval demonstrate state-of-the-art results among locally invariant texture indexing methods, onvarious databases.
The paper is organized as follows. First, in Section 2, we briefly recall the definition andelementary properties of the topographic map. Next, in Section 3 local features based on the

2 TOPOGRAPHIC MAP 4
topographic map are defined. In Section 4, the efficiency of these features to classify or retrievetexture is demonstrated on three databases: Brodatz’s texture photo album [46], UIUC dataset [8]and Xu’s database [47]. A short version of this work has appeared in [48].
2 Topographic map
In this section, we recall the definition of the topographic map and its main properties. Thetopographic map has been suggested as an efficient way to represent images by Caselles et al. [49, 7].It is made of the level lines, defined as the connected components of the topological boundaries ofthe level sets of the image. As we shall see, this map inherits a tree structure from the nestingproperties of level sets and is an elegant way to completely represent the geometric information ofan image while remaining independent of the contrast.
The upper level sets of an image u : Ω 7→ R are defined as the sets
χλ(u) = x ∈ Ω; u(x) ≥ λ,
where λ ∈ R. We can define in the same way the lower level sets χλ(u) of u by inverting theinequality. Remark that if ϕ is a strictly increasing contrast change, then
χϕ(λ)(ϕ(u)) = χλ(u),
which means that the set of all upper level sets remains the same under increasing contrast changes.Moreover, the image is completely described by its upper level sets. Indeed, u can be reconstructedthanks to the following formula
u(x) = supλ ∈ R; x ∈ χλ(u).
Of course, the same property holds for lower level sets. Now, observe that these upper (lower)level sets constitute a decreasing (increasing) family. Indeed, if λ is greater than µ, then χλ(u) isincluded in χµ(u) (and conversely χλ(u) contains χµ(u)). It follows that the connected componentsof upper level sets (respectively of the lower level sets) are naturally embedded in a tree structure.Several authors [35, 49, 50], have proposed to use these trees of connected components (one forthe upper level sets, one for the lower level sets) as an efficient way to represent and manipulateimages, thanks to their hierarchical structure and their robustness to local contrast changes.
Now, the notion of level lines (topological boundaries of level sets) enables to merge bothtrees, which motivates further the use of the topographic map to represent images. Monasse andGuichard fully exploited this fact and, drawing on the notion of shape, developed an efficient wayto compute this hierarchical representation of images [51], called Fast Level Set Transform (FLST).A shape is defined as a connected component of an upper or lower level set, whose holes have beenfilled. A hole of a set A in an image is defined as a connected component of the complementary setof A that does not intersect the border of the image. It is shown in [51] that the set of shapes of animage has a tree structure. Under some regularity assumption on the image, this tree is equivalentto the topographic map (that is the set of all level lines). For discrete images, the only technicalityneeded in order to define the shapes is that two different notions of connectivity should be adoptedfor level sets : 8-connectivity for upper level sets and 4-connectivity for lower sets (the oppositeconvention could of course be adopted). For more precision and results on the topographic map, werefer to the recent monograph [52]. For the experiments performed in this paper, we compute thetopographic maps using the FLST code available in the free processing environment Megawave21.For a recent alternative to the computation of the topographic map, see [53]. An example of therepresentation of a synthetic image by its topographic map is shown in Fig. 2.
The topographic map has a natural scale-space structure, where the notion of scale correspondsto the areas of the shapes [55]. This is of course a first motivation to investigate its use for textureanalysis. Moreover, because it is made of the level lines of the image, the topographic map permits
1http://www.cmla.ens-cachan.fr/Cmla/Megawave/

2 TOPOGRAPHIC MAP 5
I, 0
C, 1
G,1B, 2
E, 3 F, 4
A, 5
H, 5 A
H I
FE G
DCB
D, 3
Figure 2: Representation of an image by its topographic map (this example is taken from [54]).Left: an original digital image, with gray levels from 0 to 5; Right: representation of the image byits tree of shapes, where (A,B, . . . , I) denote the corresponding shapes.
(b) (c) (d)
(e) (f) (g)
(a)
Figure 3: Representation of a texture image by its topographic map. (a) original texture imageD41 (of size 640 × 640) taken from Brodatz’s photo album [46]; (b) all shapes boundaries; (c)-(g) shape boundaries at different scales, respectively for shapes of areas in [1, 10], in [11, 125], in[126, 625], in [626, 3125], and in [3126, 409600].

3 INVARIANT TEXTURE DESCRIPTORS 6
to study textures at several scales without geometric degradation when going from fine to coarsescales. This is actually a very strong property of this scale-space representation. Contrarily toapproaches using the linear scale space or linear filtering, it allows a faithful account of the geometryat all scales. Figure 3 illustrates this ability. This figure shows a needlework texture, in whichthe smallest scales represent the fine net of the needlework, while the large scales capture theboundaries of the flowers that are represented.
Next, the topographic map is invariant to any increasing contrast change. In fact, it is eveninvariant to any local contrast change as defined in [56]. This property is of primary interest todefine texture analysis schemes that are robust to illumination changes. Last, the basic elements ofthe topographic map are shapes obtained from connected components of the level sets. Therefore,it provides a local representation of the image. As we shall see, this locality, combined with thefact that the topographic map is by nature a geometric representation of images, enables us todevelop analysis schemes that are invariant to local geometrical distortions.
Now, it remains to show that the set of level lines contains pertinent information about thestructure of textures. This fact is suggested in the original paper on the topographic map ofimages [7], where it is stated that “no matter how complicated the patterns of the level linesmay be, they reflect the structure of the texture”. A first attempt at using the topographic mapto classify texture images has been proposed in [39]. In the context of satellite imaging, scalescomputed from contrasted level lines have proven useful to discriminate between different texturedareas [57]. The use of level lines in the context of texture synthesis has also been investigatedin [58]. In the remaining of this work, we show the usefulness of level lines to index textures whilebeing robust to viewpoints and illumination changes.
3 Invariant Texture Descriptors
The goal of this section is to define texture features that are both invariant to some geometricchanges and discriminative enough. These features will be obtained from the shapes of the topo-graphic map and it is therefore quite natural to consider the classical invariant shape moments,whose definition is recalled in this section. Observe that such shape moments are already used forimage registration in [59] and texture recognition in [39]. However, it is well known that these mo-ments rapidly loose robustness as their order increases, so that only a small number of these can beused to analyze real world textures. In order to enrich the proposed analysis, we take into accountmulti-scale shape dependencies on the topographic map. The resulting features are invariant toany local contrast change. Last, we suggest some contrast information that can be extracted fromthe shapes and will allow to improve the discriminative power of the proposed analysis schemewhile still being invariant to local affine contrast changes.
3.1 Marginals of invariant moments
In this section, we first give a short reminder on the invariant moments that can be extracted fromthe inertia matrix of a shape, focusing on invariances to similarity and affine transforms. Moreinformation on this classical subject can be found e.g. in [60, 61, 62, 63]. Then, we show how thismoments can be applied to shapes of the topographic map in order to perform locally invarianttexture analysis.
3.1.1 Invariant moments reminder
For p, q integer values, the two-dimensional (p+q)th order central moment µpq(s) of a shape s ⊂ R2
is defined as
µpq(s) =
∫ ∫
s
(x − x)p(y − y)q dxdy, (1)
where (x, y) is the center of mass of the shape, i.e.
x =1
µ00(s)
∫ ∫
s
x dxdy, and y =1
µ00(s)
∫ ∫
s
y dxdy. (2)

3 INVARIANT TEXTURE DESCRIPTORS 7
For the sake of simplicity, we will omit the variable s in the following and write µpq instead ofµpq(s). Note that µ00 is the area of the shape and that all central moments µpq are invariant totranslations.
In order to achieve invariance to scale changes, it is well known and easily shown that momentshave to be normalized in the following way
ηpq = µpq/µ(p+q+2)/200 . (3)
As a consequence, any function of the normalized moments ηpq is invariant to both scale changesand translations of the shape s. Now, the sensitivity to noise of these moments quickly increases astheir order increases. We observed experimentally that moments of order bigger than two are notrobust enough to faithfully account for texture characteristics, and we therefore limit the analysisto moments of order smaller than 2. Since η00 = 1 and η01 = η10 = 0, invariant features are allobtained from the normalized inertia matrix
C =
(
η20 η11
η11 η02
)
. (4)
In order to achieve rotation invariance, only two features remain, namely λ1 and λ2, the twoeigenvalues of C, with λ1 ≥ λ2. Observe that using these values boils down to fit to the shapean ellipse with semi-major axis 2
√λ1 and semi-minor axis 2
√λ2. Note also that from the seven
similarity invariants proposed in the seminal work by Hu [60], the only ones of order two are λ1+λ2
and (λ1 − λ2)2. Now, any function of λ1 and λ2 would also be invariant to similarity. We chose to
useǫ = λ2/λ1, (5)
and
κ =1
4π√
λ1λ2
, (6)
because these invariants have a clearer intuitive meaning and a simpler range than Hu’s mo-ments. The first one lies between 0 and 1 and describes the elongation or the flatness of the shape.It can be shown that the second one also lies between 0 and 1. This invariant can be seen as ameasure of the compactness of the shape, which reaches its maximum at ellipses. Indeed, κ is adimensionless ratio between the area of the shape (1 for a normalized shape) and the area of thebest ellipse fitting the shape. Note that this invariant is more robust than a measure relying on theboundary of the shape, such as the isoperimetric ratio 4π
p2 (where p is the perimeter of the shape).
Next, observe that κ (but not ǫ) is further invariant to affine transforms. In fact, κ−2 is the firstaffine invariant of Flusser et al., defined in [61].
3.1.2 Texture features from second order moments
As a first feature to represent textures, we simply compute the marginals over all shapes of thetwo features κ and ǫ. More precisely, for each of these two features, we compute a 1D-histogramby scanning all the shapes of the topographic map. The resulting 1D-histograms are invariantto any local contrast change, even decreasing ones. Now, it is well known that contrast inversionstrongly affects the visual perception. For this reason, we restrict the invariance to any localincreasing contrast change [56] by splitting each of the previous 1D-histograms in two histograms,one for shapes originating from upper level sets (bright shapes) and one for shapes originating fromlower level sets (dark shapes). The concatenations of the bright and dark histograms are calledrespectively elongation histogram (EH) and compactness histogram (CpH).
Observe that since moments are individually normalized for each shape, the resulting featuresare invariant to local geometrical changes (similarity for EH and affinity for CpH). More precisely,applying a different geometrical transform on each shape does not affect the overall marginalsof κ and ǫ. In particular, this should allow to recognize texture that have undergone non-rigidtransforms.

3 INVARIANT TEXTURE DESCRIPTORS 8
3.2 Dependencies in the topographic map
As explained in the previous section, requiring geometrical invariances and robustness restricts thenumber of possible invariant moments to two. In order to define new features from the topographicmap without going into complex geometrical descriptors relying e.g. on the boundary of shapes, itis natural to take shape dependencies into account. Indeed, invariant moment marginals as definedin the previous section do not reflect the relative positions or inclusions between shapes. Let usillustrate this point by a toy-example. Figure 4 shows two simple synthetic textures and theircorresponding topographic maps. These two images share the same histograms EH and CpH, inspite of their structural differences.
(a) Texture 1 (b) Texture 2
(c) Topographic map of (a) (d) Topographic map of (b)
Figure 4: Toy example: two synthetic textures and their corresponding topographic maps. Bothimages have the same shape marginals but different tree structures, as shown in (c) and (d).
We claim that the topographic map, because of its hierarchical structure, enables the extractionof shape dependency in an easy and intuitive way. In this work, we focus on children-parentsrelationships within the tree, although other relationships could be interesting.Definition (Ancestor family NM) Let s be a shape of the image. Let sm be the m-th cascadedancestor of s, where m is an integer. That is, s1 is the parent shape of s, s2 the parent shape ofs1, etc. For M ≥ 1, the M th ancestor family of s is defined as NM = sm, 1 ≤ m ≤ M.
Now, it is quite simple to extract affine invariant information from these ancestor families.Recall that µ00(s) is the area of the shape s. An affine transformation AX + b on s changes µ00(s)into det(A)µ00(s). As a consequence, if we define for any shape s
α(s) =µ00(s)
〈µ00(s′)〉s′∈NM
, (7)
where 〈·〉s′∈NM is the mean operator on NM , then α is locally affine invariant, in the sense that foreach shape s, α(s) is only sensitive to transformations applied to its M direct ancestors. Remarkalso that 0 < α < 1. Again, the distribution of α is represented by a 1D-histogram, split into darkand bright shapes. The corresponding feature is called scale ratio histogram (SRH).Remark Other features could be extracted from the ancestor family, built e.g. from elongation orcompactness as defined in the previous section. However for the purpose of texture indexing, andin particular for the classification and retrieval tasks to be considered in the experimental section,we did not find them to be overly discriminative. These could however be useful for different tasks.
In what follows, we use two sets of texture features. The first one, called SI, is made of thefeatures that are invariant to (local) similarity transforms, while the second one, called AI, is madeof the (locally) affine invariant features. That is,

4 EXPERIMENTS 9
- SI = CpH+SRH+EH,- AI = CpH+SRH,
where, as defined before, EH stands for elongation histogram, CpH for compactness histogram andSRH for scale ratio histogram. These are geometric features, in the sense that they are invariant toany (local) increasing contrast change. We believe that these descriptors illustrate the usefulness ofthe topographic map to analyze texture images, in particular allowing for relatively easy handlingof invariances.
3.3 Contrast information
The previous geometric features are invariant to any local increasing contrast change, as definedin [7]. This is a very strong invariance and we are not aware of any texture analysis scheme havingthis property. Now, we observed that this invariance is too strong to efficiently recognize manytexture classes. In this section, we define contrast features that are invariant to local affine contrastchanges. This is coherent with the contrast invariances considered in recent works to which wewill compare our results, such as [8, 10, 42].
We choose to compute intensity histograms after local normalization by mean and variance on aneighborhood. Such photometric normalization approaches are relatively standard and have beenused in local descriptors, see [64, 65]. Schaffalitzky et. al [65] enable their texture descriptors tobe invariant to local affine illumination changes by normalizing the intensity of each point by themean and standard deviation over a local adaptive neighborhood (a support region with detectedadaptive scale). We follow a similar path, except that we rely on the topographic map to definelocal neighborhoods.
More precisely, at each pixel x, a normalized grey level value is computed as
γ(x) =u(x) − means(x)(u)
√
vars(x)(u), (8)
where s(x) is the smallest shape of the topographic map containing x, means(x)(u) and vars(x)(u)are respectively the mean and the variance of u over s(x). This results in a contrast histogram(CtH), computed by scanning all pixels of u. Thanks to the adopted normalization, the resultingfeature is invariant to local affine contrast changes, as the features in [8, 10, 42].
One particularity of the proposed normalization (8) is that the normalized value γ(x) at x willgenerally be negative for shapes coming from an upper level set, and positive for shapes comingfrom a lower level set (this property is not systematic but very often satisfied on natural images).
Observe that this last feature, CtH, is not invariant to local similarity (or affine) transforms.Indeed, contrast histograms are computed on a pixel by pixel basis which breaks the geometricalinvariances we add preserved so far. Now, we observed that this feature is very robust to geometricaldistortions of the textures, even in some extreme cases, as will be demonstrated by the experimentalsection.
4 Experiments
In this section, we first explain how to compare texture images using the features introduced inthe previous section. We then investigate the performances of the resulting comparison scheme byconfronting it with state-of-the-art texture descriptors. More precisely, we follow the experimentalprotocols presented in [8] and reproduced in [10]. These protocols consist of retrieval and classi-fication tasks. In order to meet the standards of the current literature in texture indexing, theseexperiments are performed on three different databases, namely the classical Brodatz database,the UIUC database [8] and the more recent Xu’s database [47]. The descriptors introduced inthis paper show on these three databases similar or better results than the descriptors presentedin [8, 10, 42]. For the sake of completeness, all the results of our retrieval experiments are availableat the Internet address [66].

4 EXPERIMENTS 10
The last part of this section is devoted to a discussion on the real meaning of invariance andon the trade-off between invariance and discriminative power.
For all experiments of this section, histograms EH, CpH and SRH are computed over 25 binsfor bright shapes and 25 bins for dark shapes. Histogram CtH is computed over 50 bins. The valueof M used to compute SRH is set to M = 3.
4.1 Descriptors comparison
Two texture samples u and v can be compared by comparing their descriptors, that is by comparingthe histograms they are made of. For this purpose, we use the Jeffrey divergence, a modificationof the Kullback-Leibler (KL) divergence.Jeffrey Divergence: Let P = (p1, . . . pN ) and Q = (q1, . . . qN ) be two discrete distributions, theJeffrey divergence between P and Q is defined as
D(P, Q) =∑
i
(pilogpi
mi+ qilog
qi
mi) (9)
where mi = pi+qi
2 .Let us denote by Dk(u, v) the Jeffrey divergence between the kth histograms of the descriptors
of u and v (in this paper k ∈ 1, . . . 3 if we use the descriptor AI+CtH and k ∈ 1, . . . 4 if we useSI+CtH). The final distance between u and v can be computed as a weighted sum of the distancesDk(u, v),
D(u, v) =
∑Kk=1 ωkDk(u, v)
∑Kk=1 ωk
(10)
where ωk is the weight assigned to the kth feature. For the sake of simplicity, in the followingexperiments the weights ωk have been chosen as equal. These weights could have been adapted bylearning their respective discriminative power on a training data set (see e.g. [43]).
4.2 Comparative evaluations
4.2.1 Experimental protocols
As explained before, we reproduce exactly the retrieval and classification experiments described inthe papers of Lazebnik et al. [8], Mellor et al. [10] and Xu et al. [47].
Recall that the approach of Lazebnik et al. relies on local descriptors. These descriptorsare computed on a sparse set of affine invariant regions of interest. This kind of approach ispopular in computer vision and known to be very efficient for object recognition. In the work ofLazebnik et al., the best results are obtained with the combination of two region detectors (Harrisand Laplacian) and two local descriptors (spin images and RIFT descriptors). The correspondingtexture description, which is denoted by (H+L)(S+R), is locally invariant to affine transformationsand locally robust to affine contrast changes. The approach of Mellor et al. relies on histograms ofseveral invariant combinations of linear filters. This description is locally invariant to similaritiesand globally invariant to contrast changes. Finally, the method developed by Xu et al. is based ona multifractal description of textures. Their description is invariant under many viewpoint changesand non-rigid deformations, as well as local affine contrast changes.
In order to compare the performances of the descriptors we introduced with the best resultsprovided by these papers, experiments are performed on three different databases: the Brodatzdatabase, the UIUC database [8] and Xu’s database [47]. It is worth noticing that the correspondingresults should be taken cautiously and not directly compared with other retrieval or classificationexperiments which do not follow exactly the same experimental protocols.
The retrieval experiment consists in using one sample of the database as a query and retriev-ing the Nr most similar samples. The average number of correctly retrieved samples (generallycalled recall) when the query spans the whole database is drawn as a function of Nr.

4 EXPERIMENTS 11
For the classification experiment, Nt samples are extracted from each class and used as atraining set. Each remaining sample in the database is then affected to the class which containsthe nearest training sample. For each value Nt, an average classification rate is computed byusing randomly selected training sets, in order to eliminate the dependence of the results on someparticular sets.
4.2.2 Databases
The tree different databases used for the comparison tasks are now briefly described.
• Brodatz Dataset: The Brodatz’s photo album [46] is a well known benchmark databaseused to evaluate texture recognition algorithms. Although it lacks some interclass variations,Lazebnik et al. [8] point out that this database is a challenging platform for testing thediscriminative power of texture descriptors, thanks to its variety of scales and geometricpatterns. This database contains 111 different texture images. Following the protocols of [8,10], we divide each of these images into 9 non overlapping samples of resolution 215×215. Asa result, the complete dataset is composed of 111 texture classes, each one being representedby 9 samples (all in all, 999 samples).
• UIUC Database: This texture database [8] contains 25 texture classes, each one beingcomposed of 40 samples of size 640 × 480 (i.e. 1000 samples altogether). Inside each class,the samples are subject to drastic viewpoint changes, contrast changes or even non-rigiddeformations.
• Xu’s Database: This database, introduced by Xu et al [47] in order to test globally projec-tive invariant features, is composed of 25 different textures classes, each one being representedby 40 samples (1000 samples altogether). These samples show strong viewpoint and scalechanges, and significant contrast differences. They represent textures of manufactured ob-jects, textures of plants, floors or walls. The resolution of these images is 1280 × 960.
4.2.3 Performances on Brodatz
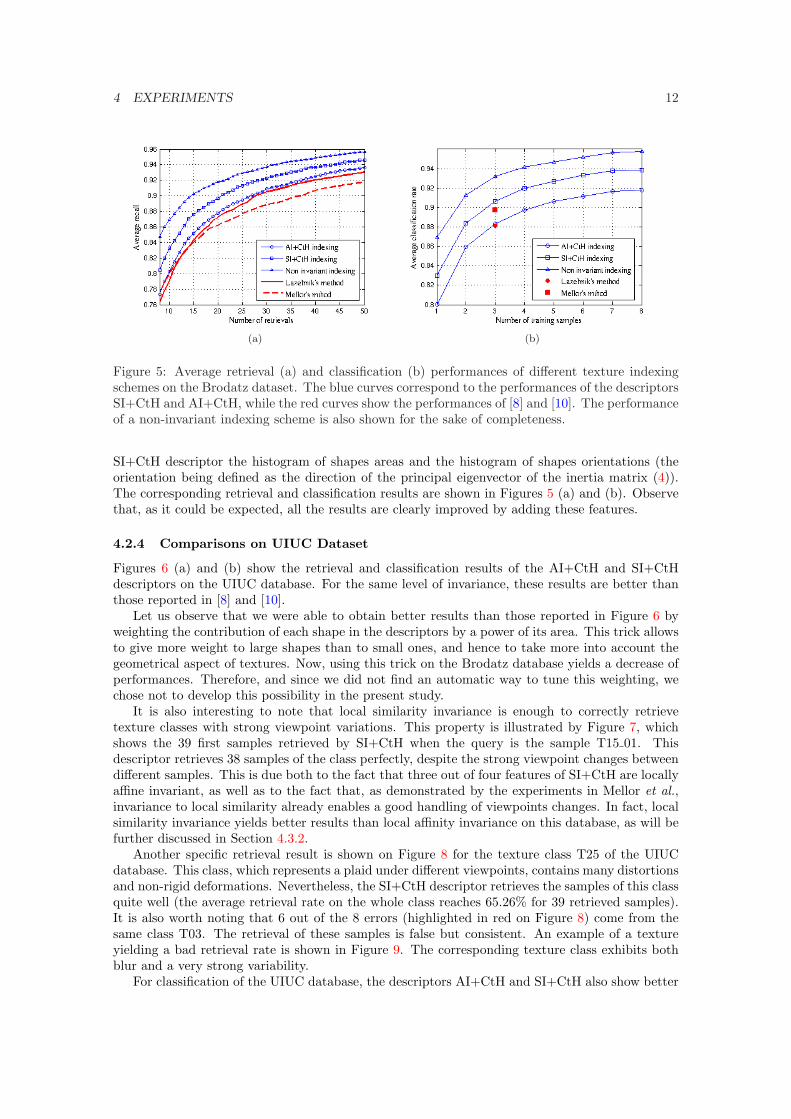
Figure 5 shows the retrieval and classification results obtained with the different indexing schemeson the Brodatz database.
In the retrieval experiment, shown on Figure 5 (a), the number of retrieved samples Nr takesvalues from 8 to 50. Since each class contains 9 samples, a perfect indexing method should reachan average recall of 100% for Nr = 8. For this number of retrieved samples, the affine invari-ant descriptor AI+CtH reaches 77.33%, while the similarity invariant descriptor SI+CtH reaches80.44%. These results slightly outperform those of Lazebnik’s affine invariant texture descriptor(H+L)(R+S) (76.97% recall) and Mellor’s similarity invariant texture descriptors (77.65% recall).This trend remains valid when Nr increases. It should be remarked that in order to obtain suchresults on Brodatz, Lazebnik et al. add a shape channel to their description, and lose thereby theirinvariance to local affine changes.
Following [8, 10], classification rates are estimated by averaging the results on randomly selectedtraining sets. When the number of training samples is 3 for each class, the average classificationrate reaches 88.31% for AI+CtH and 90.66% for SI+CtH. For the same level of invariance, theseresults are equivalent to those reported by Lazebnik et al. (88.15%) and Mellor et al. (89.71% fortheir similarity invariant descriptor) with the same protocol.
Now, as observed in [10], some images of the original Brodatz database represent the sametexture at different scales. Nevertheless, these images are considered as different textures bythe experimental protocol, which penalizes invariant indexing schemes. In the same way, weshould keep in mind that texture samples are created by cutting each texture of the Brodatzdatabase into pieces. As a consequence, the resulting dataset lacks of viewpoint and scale changes.Consequently, a well chosen non-invariant indexing scheme should naturally provide better resultson this database. In order to check this statement and for the sake of completeness, we tried toadd some non-invariant features to our invariant descriptors. For this purpose, we added to the
4 EXPERIMENTS 12
(a) (b)
Figure 5: Average retrieval (a) and classification (b) performances of different texture indexingschemes on the Brodatz dataset. The blue curves correspond to the performances of the descriptorsSI+CtH and AI+CtH, while the red curves show the performances of [8] and [10]. The performanceof a non-invariant indexing scheme is also shown for the sake of completeness.
SI+CtH descriptor the histogram of shapes areas and the histogram of shapes orientations (theorientation being defined as the direction of the principal eigenvector of the inertia matrix (4)).The corresponding retrieval and classification results are shown in Figures 5 (a) and (b). Observethat, as it could be expected, all the results are clearly improved by adding these features.
4.2.4 Comparisons on UIUC Dataset
Figures 6 (a) and (b) show the retrieval and classification results of the AI+CtH and SI+CtHdescriptors on the UIUC database. For the same level of invariance, these results are better thanthose reported in [8] and [10].
Let us observe that we were able to obtain better results than those reported in Figure 6 byweighting the contribution of each shape in the descriptors by a power of its area. This trick allowsto give more weight to large shapes than to small ones, and hence to take more into account thegeometrical aspect of textures. Now, using this trick on the Brodatz database yields a decrease ofperformances. Therefore, and since we did not find an automatic way to tune this weighting, wechose not to develop this possibility in the present study.
It is also interesting to note that local similarity invariance is enough to correctly retrievetexture classes with strong viewpoint variations. This property is illustrated by Figure 7, whichshows the 39 first samples retrieved by SI+CtH when the query is the sample T15 01. Thisdescriptor retrieves 38 samples of the class perfectly, despite the strong viewpoint changes betweendifferent samples. This is due both to the fact that three out of four features of SI+CtH are locallyaffine invariant, as well as to the fact that, as demonstrated by the experiments in Mellor et al.,invariance to local similarity already enables a good handling of viewpoints changes. In fact, localsimilarity invariance yields better results than local affinity invariance on this database, as will befurther discussed in Section 4.3.2.
Another specific retrieval result is shown on Figure 8 for the texture class T25 of the UIUCdatabase. This class, which represents a plaid under different viewpoints, contains many distortionsand non-rigid deformations. Nevertheless, the SI+CtH descriptor retrieves the samples of this classquite well (the average retrieval rate on the whole class reaches 65.26% for 39 retrieved samples).It is also worth noting that 6 out of the 8 errors (highlighted in red on Figure 8) come from thesame class T03. The retrieval of these samples is false but consistent. An example of a textureyielding a bad retrieval rate is shown in Figure 9. The corresponding texture class exhibits bothblur and a very strong variability.
For classification of the UIUC database, the descriptors AI+CtH and SI+CtH also show better

4 EXPERIMENTS 13
(a) (b)
Figure 6: Average retrieval (a) and classification (b) performances of different texture indexingschemes on the UIUC database. The blue curves correspond to the performances of the descriptorsSI+CtH and AI+CtH, while the red curves show the performances of [8] and [10].
Figure 7: One of the best retrieval results on the UIUC database, obtained on the texture classT15 using the SI+CtH descriptor. The query image is in first position and the 39 most similarsamples follow, ordered according to their matching scores. Retrieval results for all texture samplesare available at the address [66].

4 EXPERIMENTS 14
Figure 8: Retrieval result obtained on the texture class T25 of the UIUC database with thedescriptor SI+CtH. The query image is in first position and the 39 most similar samples follow,ordered according to their matching scores. Retrieval errors are indicated in red. Retrieval resultsfor all texture samples are available at the address [66].
performances than the methods of Lazebnik et al. [8] and Mellor et al. [10]. More precisely, theclassification rate reached by AI+CtH is 66.56% and the one reached by SI+CtH is 70.69% whenonly one sample is used. These numbers should be compared to the rates of 62.15% and 67.10%achieved respectively in [8] and [10]. An interesting point is that the performances of our descriptorsdecrease on texture classes containing blur. The descriptors provided in the work of Lazebnik etal. [8] appear to be more robust to blur and perform better on these specific classes. This isprobably due to the use of the linear scale space in the process of keypoints extraction.
4.2.5 Comparisons on Xu’s Dataset
Using the same strategy as before, Figure 10 shows the retrieval and classification performances ofthe descriptors AI+CtH and SI+CtH, along with the results obtained by the method of Xu [42],as well as those obtained on this database with the method of Lazebnik [8] as reported in [42].Observe that our indexing scheme is particularly well adapted to this database. Indeed, the curvesof Figure 10 show that both SI+CtH and AI+CtH descriptors perform significantly better thanother methods. This may be due to the fact that this representation relies on geometry and isthereby well adapted to highly resolved and structured textures. Figure 11 shows two specificretrieval results, an almost perfect result on a texture made of apple stacks, as well as a result ona texture made of bamboos, for which the retrieval rate is roughly the one we get on the wholedatabase. The AI+CtH and SI+CtH descriptors deal quite well with large scale and illuminationchanges on the fruit texture. Concerning the bamboos texture, one observes that textures RT21and RT20 (corn leaves) are visually very similar and relatively hard to discriminate.
Two conclusions arise after the comparison of the descriptors proposed in this paper with theapproaches of [8, 10, 42] on three different texture databases. First, both AI+CtH and SI+CtHare efficient for texture retrieval and classification. These descriptors show robust and consistentresults on all three datasets, outperforming state of the art approaches. Second, similarity invariant

4 EXPERIMENTS 15
Figure 9: A “bad” retrieval result obtained on the UIUC database with the descriptor SI+CtH.The query image is in first position and the 39 most similar samples follow, ordered according totheir matching scores. This result corresponds to the class T19. The corresponding texture classexhibits both blur and a very strong variability. Observe also that one half of the retrieval errors(indicated in red) are from the texture class T17, which at some scales looks similar to the classT19.
(a) (b)
Figure 10: Average retrieval (a) and classification (b) performances of different texture indexingschemes on Xu’s database [47]. The blue curves correspond to the performances of the descriptorsSI+CtH and AI+CtH, while the red curves show the performances of [47] on this database, as wellas those using the method from [8] as reported by [47].

4 EXPERIMENTS 16
(a)
(b)
Figure 11: Two retrieval results, respectively on (a) class RT9 and (b) class RT21 of Xu’s database,using the descriptor SI+CtH. The query image is in first position and the 39 most similar samplesare ordered according to their matching scores. Both examples correspond to non-planar textures.Observe that all errors for the class RT21 (bamboos) come from the class RT20 (corn leaves),which is visually quite similar to RT21. Retrieval results for all texture samples are available atthe address [66].

4 EXPERIMENTS 17
descriptors always perform better than affine invariant descriptors on all three databases. Thisaspect will be discussed in the last part of the section.
It is also worth noting that the texture features that we introduced are relatively compact insize. More precisely, each texture sample is represented by 4 histograms of 50 bins each, i.e. 200values altogether. This size is comparable to that of Xu’s descriptors [42], which use 78 values foreach texture sample. In comparison, Lazebnik et al. [8] use between 1200 and 4000 values for eachsample (40 clusters of 32 or 100-dimensional descriptors), while Mellor et al. [10] represent eachsample by a histogram of 4096 bins.
4.3 On invariance and discriminative power
4.3.1 Invariance to resolution changes
It was shown in section 3 that descriptors SI and AI are invariant to, respectively, local similar-ities and local affine transforms. In particular, the invariance to scale changes was ensured bythe use of normalized moments computed on the topographic map, which do not change under aperfect, theoretical scale change. However, in practice, scale changes on images often imply res-olution changes. These changes can affect texture indexing methods, as investigated in [67] Suchtransformations involve blur, which affects the topographic map of images. In order to check therobustness of the descriptors to such changes, we set up the following experiment. Starting from20 highly resolved texture images (see Figure 12), we build a database of 20 texture classes. Ineach class, the samples are generated by zooming each original texture image by a factor t, usingbilinear interpolation. Here t takes its values among T as follows,
T = 0.125, 0.15, 0.175, 0.2, 0.225, 0.25, 0.3,
0.35, 0.4, 0.45, 0.5, 0.6, 0.7, 0.8, 0.9.
As a consequence, the whole database contains 20 classes of 16 samples, i.e. 320 texturesamples. The size of the original images being 3072 × 2040, the smallest image size is 384 × 255.
Figure 12: Set of 3072 × 2040 texture images used to compute a multiresolution database. Foreach image, 15 samples are created by sub-sampling the original image with a zoom factor t takingits value in the set T = 0.125, 0.15, 0.175, 0.2, 0.225, 0.25, 0.3, 0.35, 0.4, 0.45, 0.5, 0.6, 0.7, 0.8, 0.9.

4 EXPERIMENTS 18
Figure 13 shows the histograms SRH, CpH, EH and CtH of the 15-th texture shown in Figure 12(pebble beach) for different zoom factors t. Observe that the curves coincide as long as the zoomfactor remains larger than 0.5 (blue curves). When this factor decreases, the histograms move awayfrom the original ones (for t = 1) but remain close to it. This proves empirically the robustness ofthese features to real resolution changes with a zoom factor larger than .125.
In order to test the discriminative power of these features within the framework of resolutionchanges, we perform a simple retrieval experiment on this multiresolution database. For each zoomvalue t in T , and each texture class i, let M i
t be the subset of the class made of the images havinga resolution larger than t. A sample of resolution t and class i being given, its retrieval rate isdefined as the proportion of well retrieved samples in M i
t . As usual, the final retrieval rate r(t) isthe mean of the retrieval rates over all samples of resolution t. Figure 14 shows the curves of r(t)when t varies from 0.125 to 1 and when using different texture descriptors. Observe that up to ascale factor of 4, the retrieval results are perfect for SI+CtH.
(a) (b)
(c) (d)
Figure 13: Histograms (a) SRH, (b) EH, (c) CpH and (d) CtH of the pebble beach texture, the15th texture image shown in Fig. 12, for different zoom factors t.
4.3.2 Local invariance vs discriminative power
Following the experiments of section 4.2, the question of the level of invariance required to indexa particular database arises naturally. We saw on Brodatz that removing invariance to scaleand orientation greatly improved the results, which seems to be coherent with the fact that thisdatabase does not present many geometric distortions. Of course, the best level of invariancedepends on the database. On UIUC and Xu’s databases, all descriptors invariant to local similaritychanges show significantly better results than locally affine invariant descriptors, which confirmsthe results presented in [10]. Moreover, we observe that the advantage of similarity invariance on

5 CONCLUSION 19
Figure 14: Average retrieval performances of the descriptors SI+CtH and AI+CtH on the mul-tiresolution database presented in section 4.3.1.
affine invariance remains true if we restrict ourselves to textures containing strong distortions. Thiscan be surprising since these two databases contain classes with strong non-rigid deformations. Wecould theoretically expect that local affine invariance, or even local projective invariance would beneeded to index such classes correctly (recall that Xu’s database, for instance, has been built onpurpose to test projective invariant descriptors). The fact that features that are only invariant tolocal similarities show the best results despite these variations can only be explained by a betterdiscriminative power. In other words, there is a natural trade-off between the level of invarianceof a texture description and the discriminative power of this description.
Observe that the question of the best level of invariance needed for indexing is also addressedin [43, 68], where learning is used to estimate the optimal weights of the different descriptors.
These remarks also lead to question the need for further invariance in texture indexing. Theprevious observations suggest that achieving invariance to local similarities may be enough toaccount for viewpoint variations or non-rigid deformations. Furthermore, to the best of our knowl-edge, there exists no texture database in the literature on which complete local affine invarianceis needed (in the sense that it yields better results than weaker invariances). Without such adatabase, it seems vain to try to develop features with more sophisticated invariances.
5 Conclusion
In this paper, it is shown that the topographic map is an efficient and intuitive tool to analyzetexture images. Geometrical features are computed from the level sets of images, enabling state-of-the-art retrieval and classification results on challenging databases. In particular, this showsthat morphological, granulometry-like indexing methods can deal with complex, potentially highlyresolved texture images, even in the case of non-rigid transforms. To the best of our knowledge, suchinvariant analysis were only reported in the literature using wavelet-like features, local descriptorsor pixel-based features.
This work opens several perspectives. First, the hierarchical structure of the topographic mapis only partially accounted for in the present work. It is of interest to further investigate thedescriptive power of statistics on the tree of level lines, making use of specific neighborhoods andhigher dependencies in the tree, possibly using probabilistic graphical models. One difficulty isto achieve this while preserving radiometric and geometric invariances. Next, and going beyondlocal contrast invariances, one could study the behavior of level line statistics under illuminationchanges in greater details. We show in this paper that lines statistics yield efficient retrieval resultson databases with varying illumination conditions. The next step could be either to explicitlymodel level lines variations or to investigate the ability of the topographic map to learn the effects

6 ACKNOWLEDGEMENT 20
of illumination changes using databases such as CUReT [69]. Next, the topographic map has ascale-space structure in which no regularization of the geometry is involved. This could allow forspatially accurate boundaries in the context of texture segmentation. Other possible applicationsof the proposed framework include the registration of non-rigid objects, shape from texture ormaterial recognition. Another possible extension is the design of locally invariant morphologicalfilters, that could be designed by pruning the topographic map depending on features values.
6 Acknowledgement
The authors would like to thank Matthew Mellor, who kindly provided us with his texture analysiscodes, Thomas Hurtut, who helped creating the web page [66], as well as Luo Bin and Henri Maıtrefor their comments and suggestions.
References
[1] Y. Meyer, Workshop : An interdisciplinary approach to Textures and Natural Images Pro-cessing, Institut Henri Poincare, Paris, January 2007.
[2] H. Kaizer, “A quantification of textures on aerial photographs,” Boston University, Tech. Rep.121, 1955.
[3] A. K. Jain and F. Farrokhnia, “Unsupervised texture segmentation using gabor filters,” Pat-tern Recognition, vol. 24, no. 12, pp. 1167–1186, 1991.
[4] G. Peyre, “Texture processing with grouplets,” Paris-Dauphine University, Tech. Rep., 2008.
[5] G. M. A. Haas and J. Serra, “Morphologie mathematique et granulometries en place,” Annalesdes Mines, vol. 11, pp. 736–753, 1967.
[6] J. Serra, Image Analysis and Mathematical Morphology. Academic Press, 1982.
[7] V. Caselles, B. Coll, and J.-M. Morel, “Topographic maps and local contrast changes in naturalimages,” International Journal of Computer Vision, vol. 33, no. 1, pp. 5–27, 1999.
[8] S. Lazebnik, C. Schmid, and J. Ponce, “A sparse texture representation using local affineregions,” IEEE Trans. Pattern Analysis and Machine Intelligence, vol. 27, no. 8, pp. 1265–1278, 2005.
[9] ——, “Affine-invariant local descriptors and neighborhood statistics for texture recognition,”in Proc. International Conference on Computer Vision, 2003, pp. 649–655.
[10] M. Mellor, B.-W. Hong, and M. Brady, “Locally rotation, contrast, and scale invariant descrip-tors for texture analysis,” IEEE Trans. Pattern Analysis and Machine Intelligence, vol. 30,no. 1, pp. 52–61, 2008.
[11] M. Varma and A. Zisserman, “Classifying images of materials: achieving viewpoint and illu-mination independence,” in Proc. European Conference on Computer Vision, 2002, pp. III:255–271.
[12] T. Leung and J. Malik, “Representing and recognizing the visual appearance of materialsusing three-dimensional textons,” International Journal of Computer Vision, vol. 43, no. 1,pp. 29–44, 2001.
[13] J. Wu and M. Chantler, “Combining gradient and albedo data for rotation invariant classifi-cation of 3d surface texture,” in Proc. International Conference on Computer Vision, 2003,pp. 848–855.

REFERENCES 21
[14] R. M. Haralick, “Statistical and structural approaches to texture,” Proceedings of the IEEE,vol. 67, no. 5, pp. 786–804, 1979.
[15] M. Tuceryan and A. K. Jain, “Texture analysis,” Handbook of pattern recognition and computervision, pp. 235–276, 1993.
[16] T. R. Reed and J. M. H. du Buf, “A review of recent texture segmentation and feature extrac-tion techniques,” Computer Vision, Graphics and Image Processing: Image Understanding,vol. 57, no. 3, pp. 359–372, 1993.
[17] T. Randen and J. H. Husoy, “Filtering for texture classification: A comparative study,” IEEETrans. Pattern Analysis and Machine Intelligence, vol. 21, no. 4, pp. 291–310, 1999.
[18] J. Zhang and T. Tan, “Brief review of invariant texture analysis methods,” Pattern Recogni-tion, vol. 35, no. 3, pp. 735–747, 2002.
[19] R. M. Haralick, K. Shanmugam, and I. Dinstein, “Textural features for image classification,”IEEE Trans. Systems, Man and Cybernetics, vol. SMC-3, no. 6, pp. 610–621, 1973.
[20] L. Davis, “Polarograms: a new tool for image texture analysis,” Pattern Recognition, vol. 13,no. 3, pp. 219–223, 1981.
[21] M. Pietikainen, T. Ojala, and Z. Xu, “Rotation-invariant texture classification using featuredistributions,” Pattern Recognition, vol. 33, no. 1, pp. 43–52, January 2000.
[22] T. Ojala, M. Pietikainen, and T. Maenpaa, “Multiresolution gray-scale and rotation invarianttexture classification with local binary patterns,” IEEE Trans. Pattern Analysis and MachineIntelligence, vol. 24, no. 7, pp. 971–987, 2002.
[23] R. L. Kashyap and A. Khotanzad, “A model-based method for rotation invariant textureclassification,” IEEE Trans. Pattern Analysis and Machine Intelligence, vol. 8, no. 4, pp.472–481, 1986.
[24] F. S. Cohen, Z. Fan, and M. A. Patel, “Classification of rotated and scaled textured imagesusing gaussian markov random field models,” IEEE Trans. Pattern Analysis and MachineIntelligence, vol. 13, no. 2, pp. 192–202, 1991.
[25] B. Gidas, “A renormalization group approach to image processing problems,” IEEE Trans.Pattern Analysis and Machine Intelligence, vol. 11, no. 2, pp. 164–180, 1989.
[26] E. P. Simoncelli and J. Portilla, “Texture characterization via joint statistics of wavelet coef-ficient magnitudes,” in Proc. International Conference on Image Processing, 1998, pp. 4–7.
[27] J. Chen and A. Kundu, “Rotation and gray scale transform invariant texture identificationusing wavelet decomposition and hidden markov model,” IEEE Trans. Pattern Analysis andMachine Intelligence, vol. 16, no. 2, pp. 208–214, 1994.
[28] C. Schmid, “Constructing models for content-based image retrieval,” in Proc. Computer Visionand Pattern Recognition, 2001, pp. II:39–45.
[29] M. N. Do and M. Vetterli, “Rotation invariant texture characterization and retrieval usingsteerable wavelet-domain hidden markov models,” IEEE Trans. Multimedia, vol. 4, no. 4, pp.517–527, 2002.
[30] C. Pun, “Rotation-invariant texture feature for image retrieval,” Computer Vision and ImageUnderstanding, vol. 89, no. 1, pp. 24–43, 2003.
[31] P. Maragos, “Pattern spectrum and multiscale shape representation,” IEEE Trans. PatternAnalysis and Machine Intelligence, vol. 11, no. 7, pp. 701–716, 1989.

REFERENCES 22
[32] Y. Chen and E. Dougherty, “Gray-scale morphological granulometric texture classification,”Optical Eng., vol. 33, no. 8, pp. 2713–2722, 1994.
[33] A. Asano, M. Miyagawa, and M. Fujio, “Texture modelling by optimal gray scale structuringelements using morphological pattern spectrum,” in Proc. International Conference on PatternRecognition, 2000, pp. III: 475–478.
[34] G. Ayala and J. Domingo, “Spatial size distributions: Applications to shape and textureanalysis,” IEEE Trans. Pattern Analysis and Machine Intelligence, vol. 23, no. 12, pp. 1430–1442, 2001.
[35] P. Salembier and J. Serra, “Flat zones filtering, connected operators, and filters by reconstruc-tion,” IEEE Trans. Image Processing, vol. 4, no. 8, pp. 1153–1160, 1995.
[36] W. Li, V. Haese Coat, and J. Ronsin, “Residues of morphological filtering by reconstructionfor texture classification,” Pattern Recognition, vol. 30, no. 7, pp. 1081–1093, 1997.
[37] N. Fletcher and A. Evans, “Texture segmentation using area morphology local granulome-tries,” in Proc. International Symposium on Mathematical Morphology, vol. 30, 2005, pp.367–376.
[38] E. R. Urbach, J. B. T. M. Roerdink, and M. H. F. Wilkinson, “Connected shape-size pat-tern spectra for rotation and scale-invariant classification of gray-scale images,” IEEE Trans.Pattern Analysis and Machine Intelligence, vol. 29, no. 2, pp. 272–285, 2007.
[39] H. M. Hamdan and L. M. Larson, “Texture classification through level lines,” in Proc. Inter-national Conference on Image Processing, 2002, pp. 937–940.
[40] A. Hanbury, U. Kandaswamy, and D. A. Adjeroh, “Illumination-invariant morphological tex-ture classification,” in Proc. International Symposium on Mathematical Morphology, vol. 30,2005, pp. 377–386.
[41] S. Peleg, J. Naor, R. Hartley, and D. Avnir, “Multiple resolution texture analysis and classi-fication,” IEEE Trans. Pattern Analysis and Machine Intelligence, vol. 6, no. 4, pp. 518–523,1984.
[42] Y. Xu, H. Ji, and C. Fermuller, “A projective invariant for textures,” in Proc. ComputerVision and Pattern Recognition, 2006, pp. 1932–1939.
[43] J. Zhang, M. Marszalek, S. Lazebnik, and C. Schmid, “Local features and kernels for classi-fication of texture and object categories: A comprehensive study,” International Journal ofComputer Vision, vol. 73, no. 2, pp. 213–238, 2007.
[44] M. Varma and R. Garg, “Locally invariant fractal features for statistical texture classification,”in Proc. International Conference on Computer Vision, 2007, pp. 1–8.
[45] F.-F. Li and P. Perona, “A bayesian hierarchical model for learning natural scene categories,”in Proc. Computer Vision and Pattern Recognition, 2005, pp. II: 524–531.
[46] P. Brodatz, Textures: A Photographic Album for Artists and Designers. New York: Dover,1966.
[47] Y. Xu, H. Ji, and C. Fermuller, “Viewpoint invariant texture descrip-tion using fractal analysis,” submitted manuscript, 2008. [Online]. Available:http://www.cfar.umd.edu/∼fer/website-texture/texture.htm
[48] G.-S. Xia, J. Delon, and Y. Gousseau, “Locally invariant texture analysis from the topographicmap,” in Proc. International Conference on Pattern Recognition, 2008.

REFERENCES 23
[49] V. Caselles, B. Coll, and J. Morel, “Scale space versus topographic map for natural images,”in Proc. International Conference on Scale-Space Theory in Computer Vision, vol. 11, 1997,pp. 29–49.
[50] H. J. A. M. Heijmans, “Connected morphological operators for binary images,” ComputerVision and Image Understanding, vol. 73, no. 99-120, 1999.
[51] P. Monasse and F. Guichard, “Fast computation of a contrast invariant image representation,”IEEE Trans. Image Processing, vol. 9, no. 5, pp. 860–872, 2000.
[52] V. Caselles and P. Monasse, Geometric Description of Topographic Maps and Applications toImage Processing, ser. Lecture Notes in Mathematics. Springer, 2008, to Appear.
[53] Y. Song, “A topdown algorithm for computation of level line trees,” IEEE Trans. ImageProcessing, vol. 16, no. 8, pp. 2107–2116, 2007.
[54] P. Monasse, “Morphological representation of digital images and application to registration,”Ph.D. dissertation, Paris-Dauphine University, June 2000.
[55] P. Monasse and F. Guichard, “Scale-space from a level lines tree,” Journal of Visual Commu-nication and Image Representation, vol. 11, no. 2, pp. 224–236, 2000.
[56] V. Caselles, J.-L. Lisani, J.-M. Morel, and G. Sapiro, “Shape preserving local histogrammodification,” IEEE Trans. Image Processing, vol. 8, no. 2, pp. 220–230, 1999.
[57] L. Bin, J.-F. Aujol, and Y. Gousseau, “Local scale measure from the topographic map andapplication to remote sensing images,” Telecom ParisTech, Tech. Rep. D020, 2008, submitted.
[58] Y. Gousseau, “Texture synthesis through level sets,” in Proc. International Workshop onTexture Analysis and Synthesis, Copenhagen, 2002, pp. 53–57.
[59] P. Monasse, “Contrast invariant registration of images,” in Proc. International Conference onAcoustics, Speech and Signal Processing, 1999, pp. 3221–3224.
[60] M. K. Hu, “Visual pattern recognition by moment invariants,” IRE Trans. Information The-ory, vol. 8, pp. 179–187, 1962.
[61] J. Flusser and T. Suk, “Pattern recognition by affine moment invariants,” Pattern Recognition,vol. 26, pp. 167–174, 1993.
[62] S. Liao and M. Pawlak, “On image-analysis by moments,” IEEE Trans. Pattern Analysis andMachine Intelligence, vol. 18, no. 3, pp. 254–266, 1996.
[63] D. Zhang and G. Lu, “Review of shape representation and description techniques,” PatternRecognition, vol. 37, no. 1, pp. 1–19, 2004.
[64] S. Obdrzalek and J. Matas, “Object recognition using local affine frames on distinguishedregions,” in Proc. British Machine Vision Conference, 2002, pp. 113–122.
[65] F. Schaffalitzky and A. Zisserman, “Viewpoint invariant texture matching and wide baselinestereo,” in Proc. International Conference on Computer Vision, vol. 2, 2001, pp. 636–643.
[66] G.-S. Xia. (2009) Invariant texture analysis web page. [Online]. Available:http://www.tsi.enst.fr/∼xia/texture.html
[67] B. Luo, J.-F. Aujol, Y. Gousseau, and S. Ladjal, “Indexing of satellite images with differentresolutions by wavelet features,” IEEE Trans. on Image Processing, vol. 17, no. 8, pp. 1465–1472, 2008.
[68] M. Varma and D. Ray, “Learning the discriminative power-invariance trade-off,” in Proc.International Conference on Computer Vision, 2007, pp. 14–21.

REFERENCES 24
[69] K. Dana, B. Van-Ginneken, S. Nayar, and J. Koenderink, “Reflectance and Texture of RealWorld Surfaces,” ACM Transactions on Graphics (TOG), vol. 18, no. 1, pp. 1–34, 1999.