Shanghai Digital Greening Project Scanning For Infrastructure
20
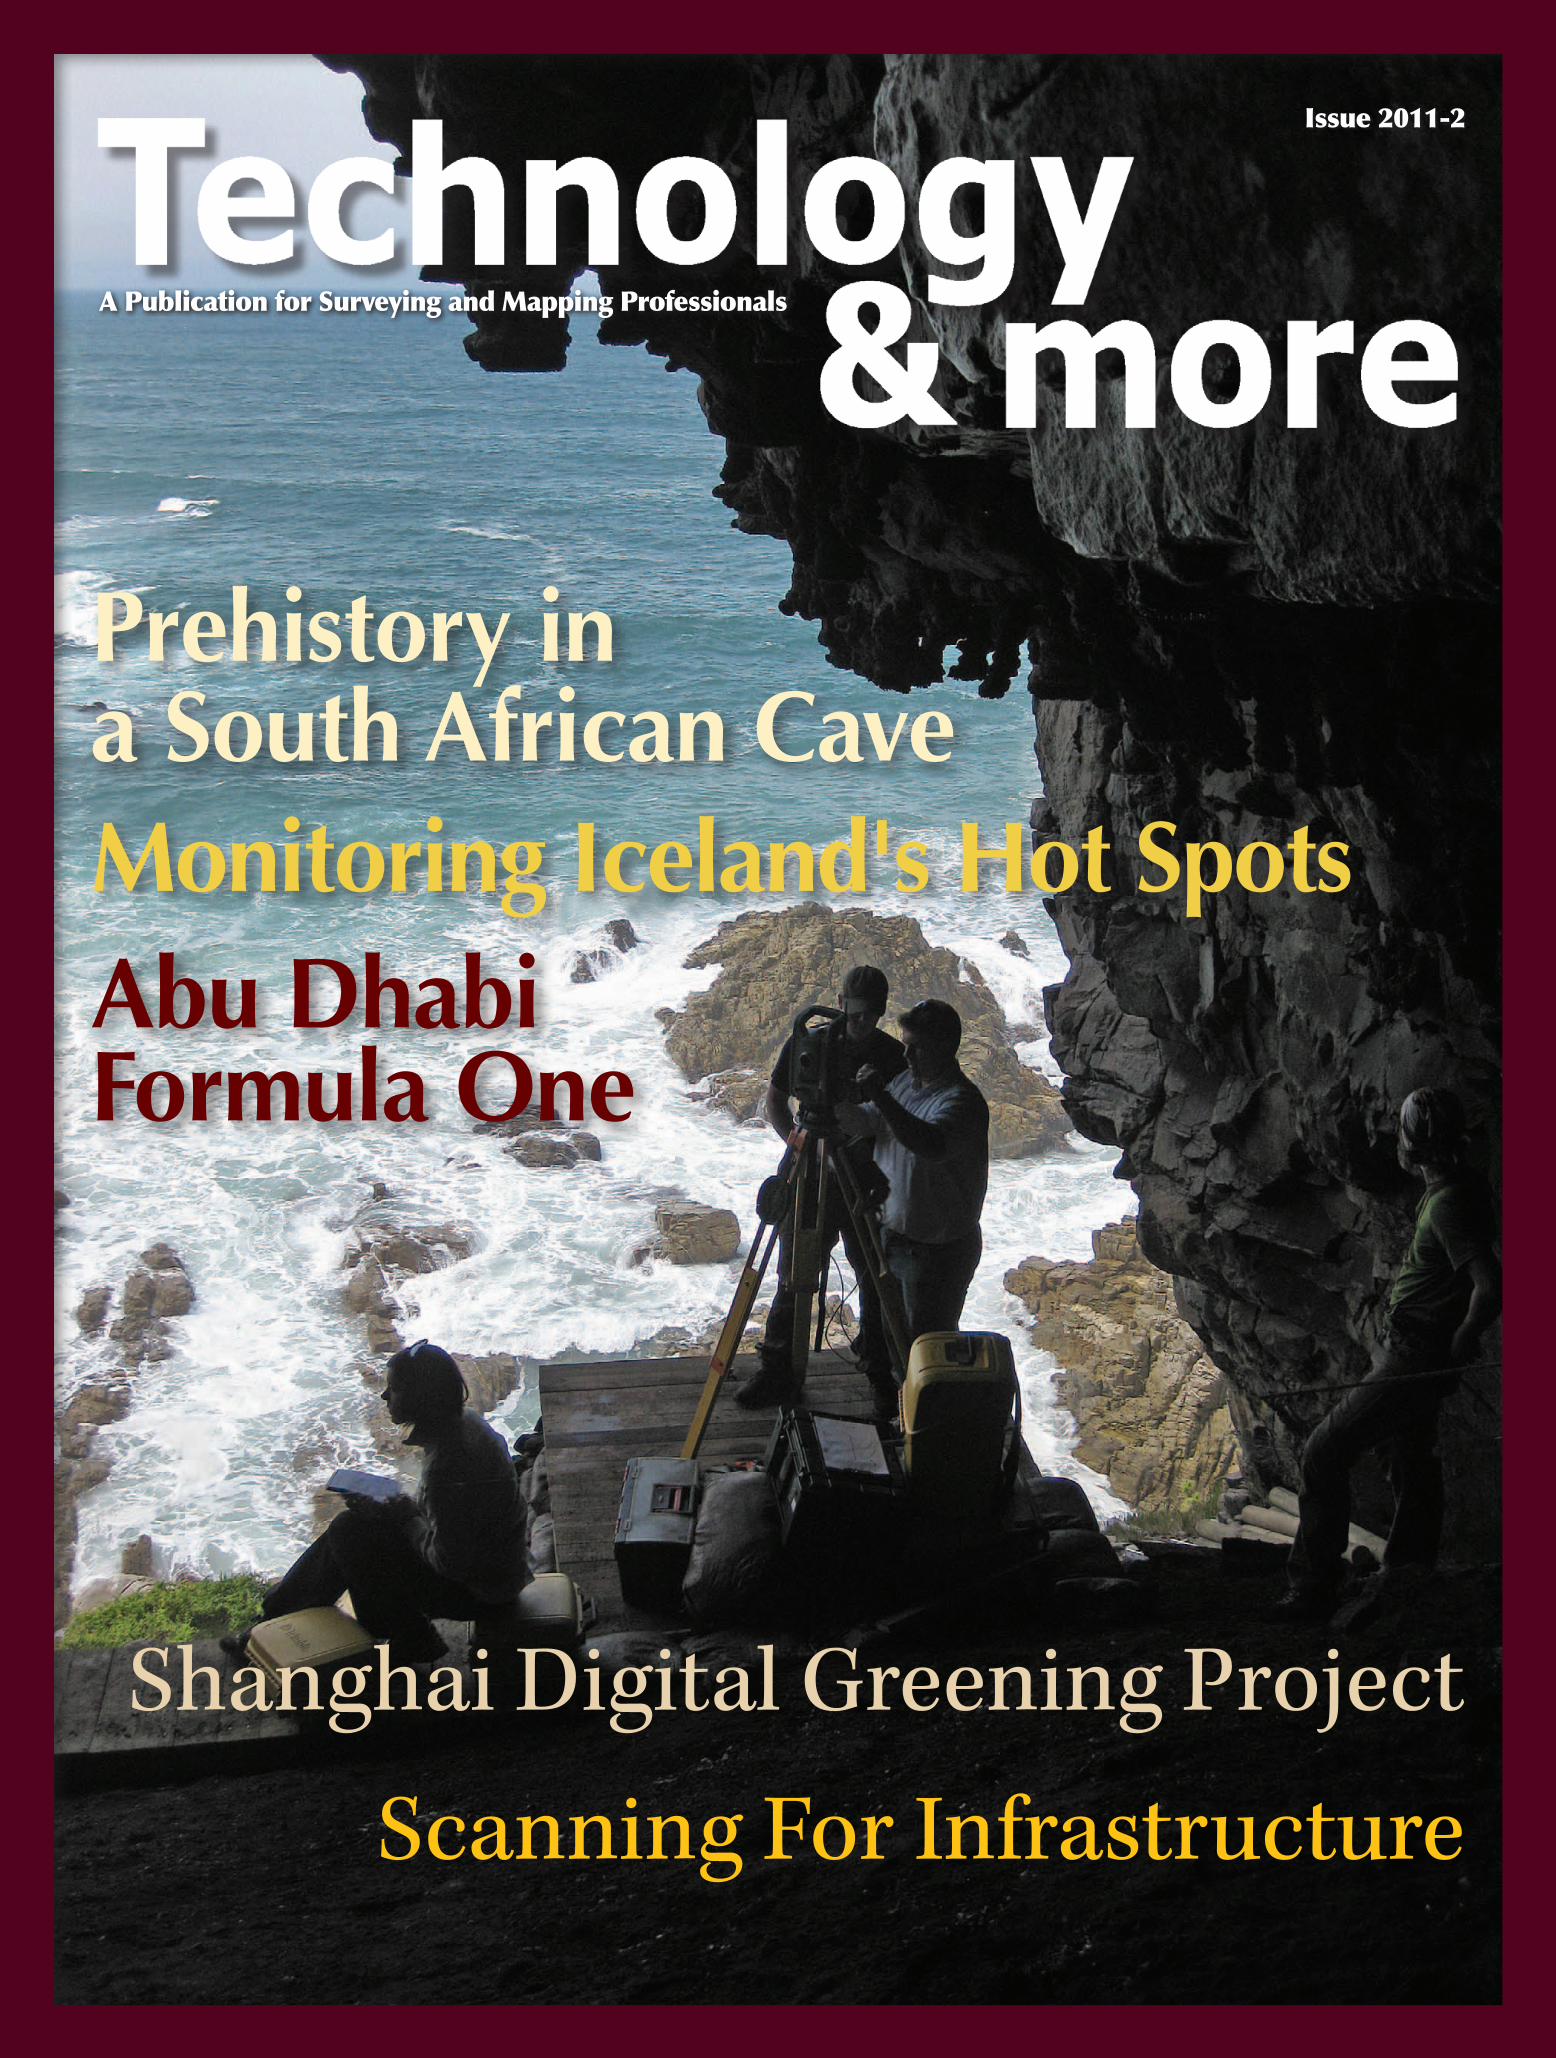
A Publication for Surveying and Mapping Professionals Issue 2011-2 Prehistory in a South African Cave Monitoring Iceland's Hot Spots Abu Dhabi Formula One Shanghai Digital Greening Project Scanning For Infrastructure
Transcript of Shanghai Digital Greening Project Scanning For Infrastructure
A Publication for Surveying and Mapping Professionals
Issue 2011-2
Prehistory in a South African Cave Monitoring Iceland's Hot SpotsAbu Dhabi Formula One
Shanghai Digital Greening Project
Scanning For Infrastructure

INSIDE:Welcome to the latest issue of Technology&more!
Trimble Engineering & Construction5475 Kellenburger Rd.Dayton, OH, 45424-1099Phone: 1-937-233-8921 Fax: 1-937-245-5145Email: T&[email protected]
Published by: Editor-in-Chief: Omar SoubraEditorial Team: Angie Vlasaty; Lea Ann McNabb; Heather Silvestri; Eric Harris; Susanne Preiser;Emmanuelle Tarquis; Grainne Woods; Christiane Gagel; Lin Lin Ho; Bai Lu; Echo Wei; Maribel Aguinaldo; Masako Hirayama; Stephanie Kirtland, Survey Technical Marketing TeamArt Director: Tom Pipinou
Dear Readers,
Welcome to the second issue of Technology&more for 2011. We continue to be impressed with the variety of innovative and interesting projects in which our customers are involved. Each of these projects—from the Americas to Europe, Asia, Africa and the Middle East—demonstrates the enhanced productivity and capability that are gained through the use of Trimble® technology.
In this issue, you’ll read about the largest remedial dredging project still underway in the U.S. that is removing PCB contamination from Wisconsin’s Fox River; how a world-class Formula One auto race-track was built in record time under tough climatic conditions in Abu Dhabi, with many of the calcula-tions being done at the home office in Germany; and about the 3D scanning and spatial imaging technology that is being used to help discover and document human artifacts from the dawn of civilization in South Africa. You’ll also learn about the Juneau (Alaska) Icefield Research Program that takes place each summer to measure the advance and retreat of glaciers in this era of climate change; find out how Iceland is monitoring its volcanoes after recent eruptions made front-page news; and see how the City of Shanghai is mapping and
monitoring its “greenness” in order to improve the quality of life for its citizens.
You’ll also learn how—and why—3D scanning and high-capacity data processing is playing an increasingly important role in boosting productivity in large-scale infrastructure construction projects. Basic scanning technology and the use of specialized software for processing and managing the 3D data is described.
Around the world, around the clock, Trimble technology is helping surveyors and many others do their jobs better, faster and more productively. If you’d like to share information with Technology&more readers about an innovative project, you’re involved with, we’d like to hear about it: just email [email protected]. We’ll even write the article for you.
We hope you’ll enjoy this issue of Technology&more.
Chris Gibson
© 2011, Trimble Navigation Limited. All rights reserved.Trimble, the Globe & Triangle logo, eCognition, GPScorrect,Juno, RealWorks, TSC1 and TSC2 are trademarks of Trimble Navigation Limited or its subsidiaries, registered in United States Patent and Trademark Office. CU, GeoXT, GX, Survey Controller and VX are trademarks of Trimble Navigation Limited or its subsidiaries. All other trademarks are the property of their respective owners.
U.S. Pg. 6
CHINA Pg. 11
Chris Gibson: Vice President
www.northstarstudio.com
SOUTH AFRICA Pg. 4
ICELAND Pg. 8
-1- Technology&more; 2011-2
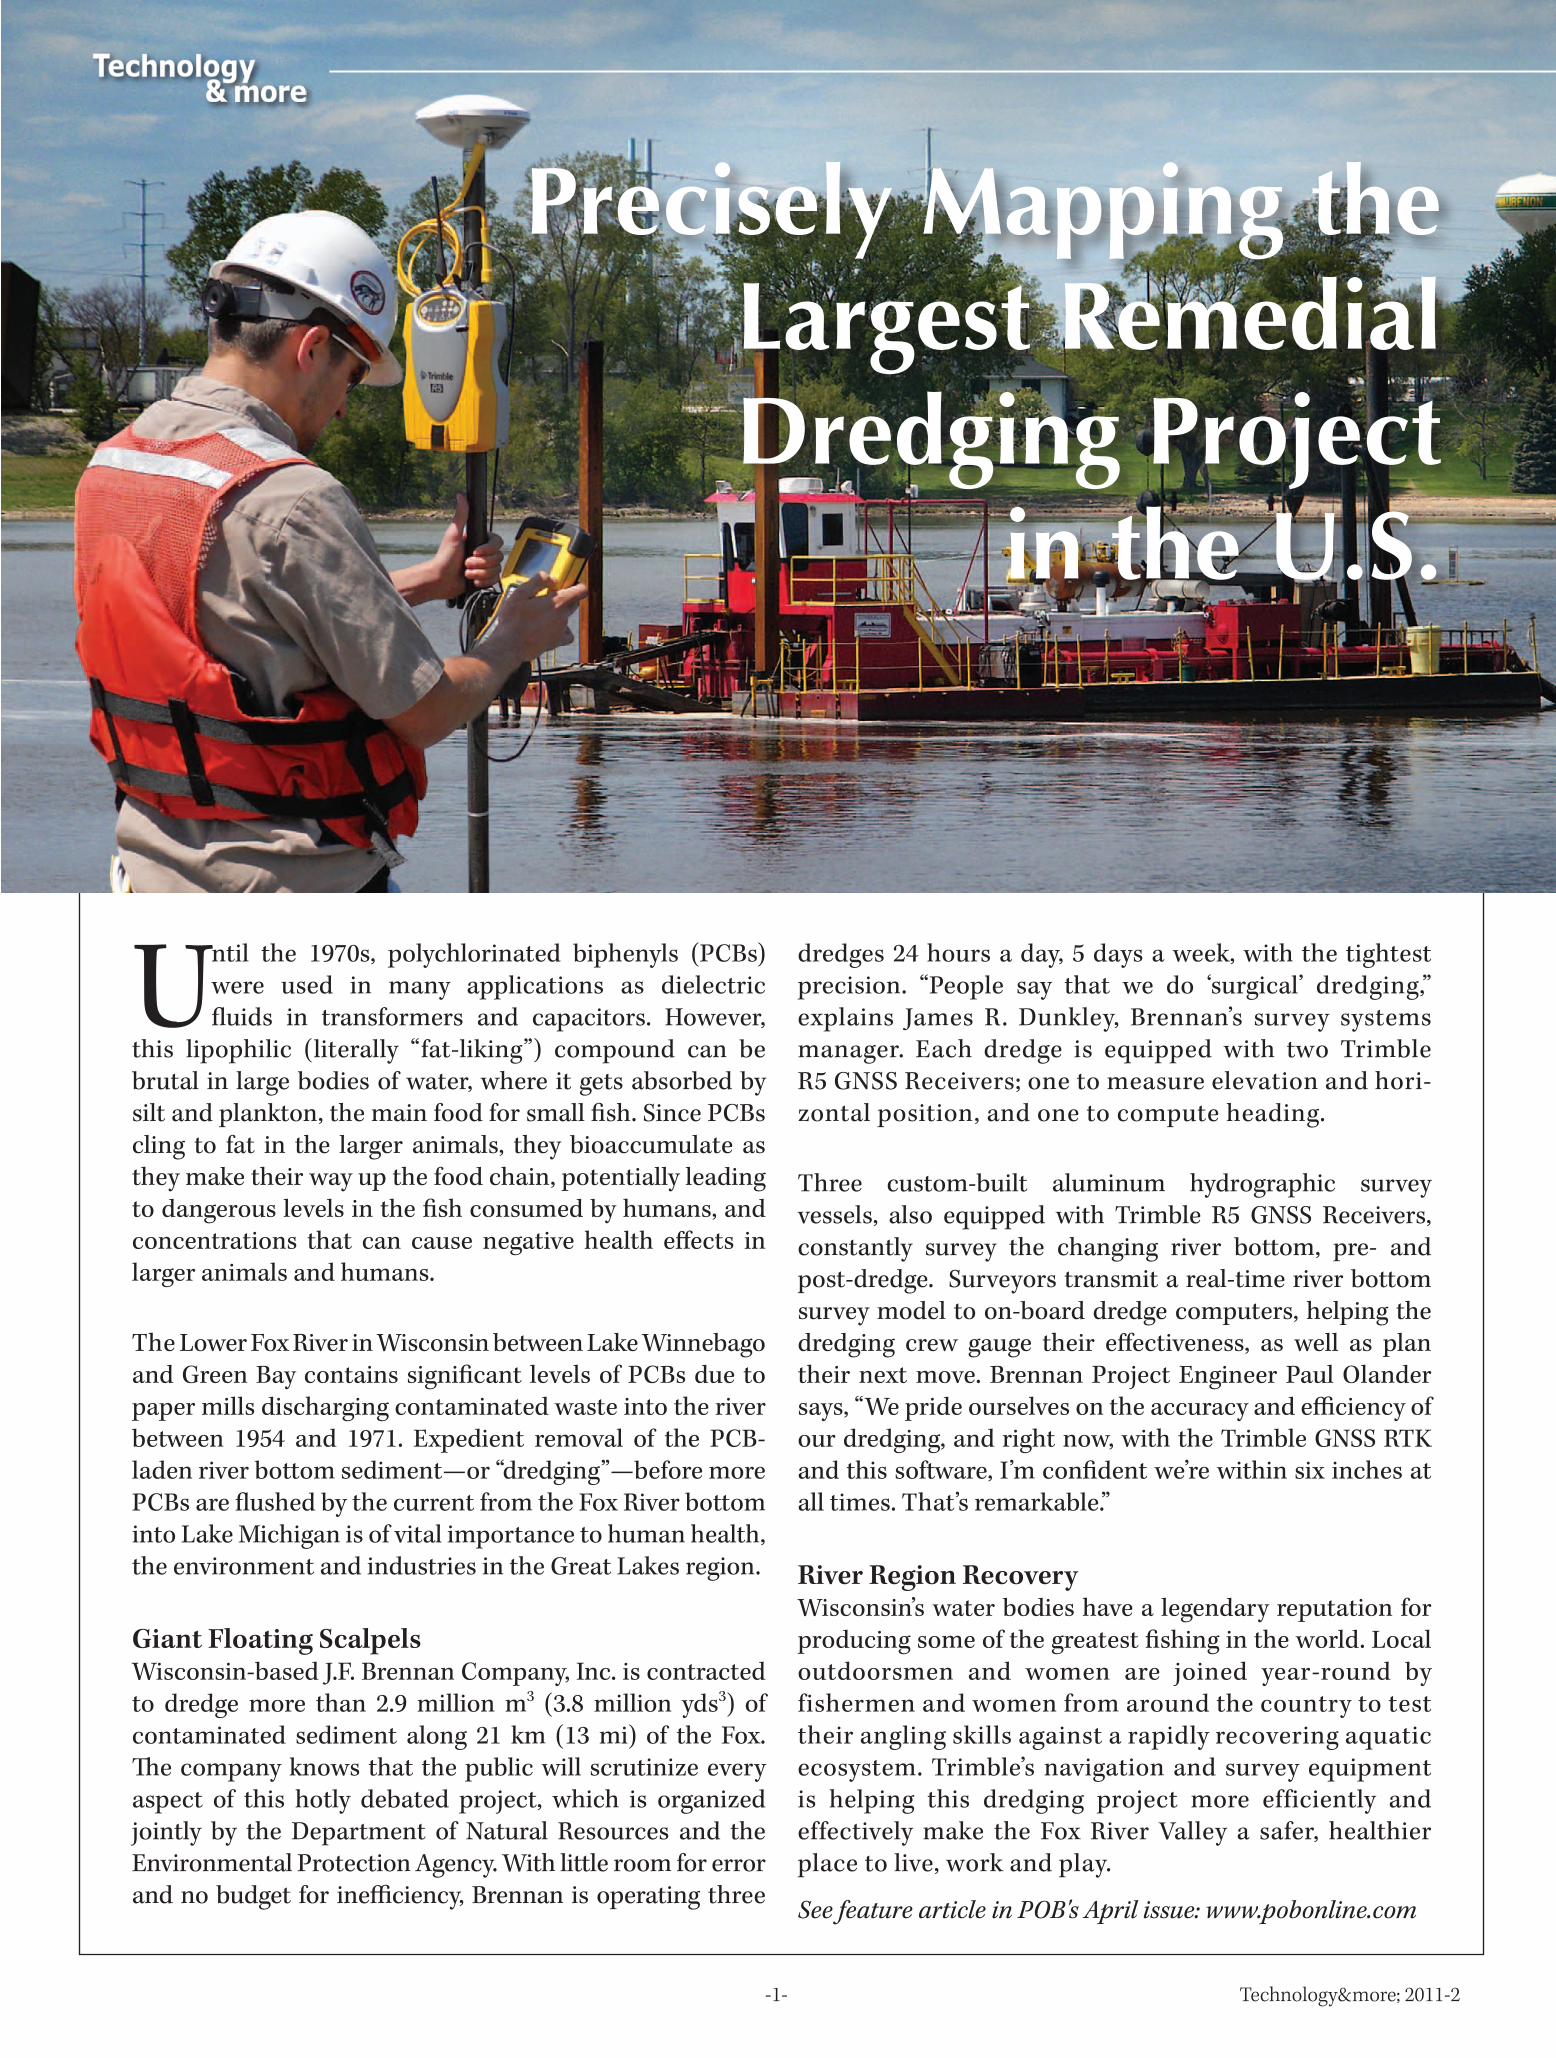
Precisely Mapping the Largest RemedialDredging Project
in the U.S.
Until the 1970s, polychlorinated biphenyls (PCBs) were used in many applications as dielectric fluids in transformers and capacitors. However,
this lipophilic (literally “fat-liking”) compound can be brutal in large bodies of water, where it gets absorbed by silt and plankton, the main food for small fish. Since PCBs cling to fat in the larger animals, they bioaccumulate as they make their way up the food chain, potentially leading to dangerous levels in the fish consumed by humans, and concentrations that can cause negative health effects in larger animals and humans.
The Lower Fox River in Wisconsin between Lake Winnebago and Green Bay contains significant levels of PCBs due to paper mills discharging contaminated waste into the river between 1954 and 1971. Expedient removal of the PCB-laden river bottom sediment—or “dredging”—before more PCBs are flushed by the current from the Fox River bottom into Lake Michigan is of vital importance to human health, the environment and industries in the Great Lakes region.
Giant Floating ScalpelsWisconsin-based J.F. Brennan Company, Inc. is contracted to dredge more than 2.9 million m3 (3.8 million yds3) of contaminated sediment along 21 km (13 mi) of the Fox. The company knows that the public will scrutinize every aspect of this hotly debated project, which is organized jointly by the Department of Natural Resources and the Environmental Protection Agency. With little room for error and no budget for inefficiency, Brennan is operating three
dredges 24 hours a day, 5 days a week, with the tightest precision. “People say that we do ‘surgical’ dredging,” explains James R. Dunkley, Brennan’s survey systems manager. Each dredge is equipped with two Trimble R5 GNSS Receivers; one to measure elevation and hori-zontal position, and one to compute heading.
Three custom-built aluminum hydrographic survey vessels, also equipped with Trimble R5 GNSS Receivers, constantly survey the changing river bottom, pre- and post-dredge. Surveyors transmit a real-time river bottom survey model to on-board dredge computers, helping the dredging crew gauge their effectiveness, as well as plan their next move. Brennan Project Engineer Paul Olander says, “We pride ourselves on the accuracy and efficiency of our dredging, and right now, with the Trimble GNSS RTK and this software, I’m confident we’re within six inches at all times. That’s remarkable.”
River Region RecoveryWisconsin’s water bodies have a legendary reputation for producing some of the greatest fishing in the world. Local outdoorsmen and women are joined year-round by fishermen and women from around the country to test their angling skills against a rapidly recovering aquatic ecosystem. Trimble’s navigation and survey equipment is helping this dredging project more efficiently and effectively make the Fox River Valley a safer, healthier place to live, work and play.
See feature article in POB's April issue: www.pobonline.com

-2- Technology&more; 2011-2
Few events thrill fans as much as Formula One Grand Prix racing, so when the German firm Bickhardt Bau AG was asked to build a high-quality racetrack in record time in extreme climatic conditions, they jumped at the chance. The 1,600-person firm, based in the town of Kirchheim, specializes in racetracks and is one of
the most experienced in Formula One construction. They are also noted for overcoming construction challenges in exotic locations. Bickhardt designed and staked the binder and surface courses in very swampy conditions at the Shanghai International Circuit, which required extraordinary pavement stabilization measures. And they built the Hockenheimring track in Baden-Württemberg, the biennial home of the Formula One German Grand Prix. “I know of no other racetrack that is as even as Hockenheim,” says Norbert Haug, vice-president of Mercedes-Benz Motorsport. “It was created in ‘racing speed’ and is of the very highest quality.”
A Race to the FinishBickhardt Bau AG Completes a
World-Class Formula One Circuit
However, the Yas Marina Circuit, built on man-made Yas Island in Abu Dhabi, was a unique challenge for Bickhardt because of the region’s exceptionally high temperatures, humidity and the lack of local construction materials. In addition, the company had just a year to complete construction. About the LocationAbu Dhabi is located on the northeastern part of the Persian Gulf and comprises about 80 percent of the United Arab Emirates. Riches from oil reserves have transformed this mostly coastal desert Emirate into a modern metropolis. The extremely hot year-round temperature averages 27ºC (80.6ºF) but the coastal location pushes humidity to a stifling 80 percent. In comparison, the year-round average in Las Vegas is just 19ºC (66.2ºF) with much lower humidity. Dealing with these conditions was Bickhardt’s 25-member Abu Dhabi team, which included survey engineer Markus Bolaender, his assistant Jürgen Heinemann and project manager Frank Dittrich.
Frank Straub in Kirchheim remotely supported the team, and all worked 6 days a week from July 2008 to August 2009, with the exception of one desert sight-seeing trip. “On the seventh day they would get a good night’s rest, and do washing, emailing, etc.” says Horst Walther, Bickhardt’s survey division manager, who oversaw survey operations from Kirchheim.
An Extraordinary TrackFormer winning racer and renowned track designer Hermann Tilke designed the Yas Marina Circuit. Tilke’s extensive range of tracks is known for long straightaways and hairpin curves. Yas Marina is home of the second longest straightaway in Formula One racing, and has recorded top speeds of up to 320 kmh (200 mph).
In Formula One racing, where such high speeds are common, even the slightest surface irregularities could mean disaster. Consequently, tolerances were exceptionally tight. “Sub-grade surfaces had to be within four centimeters (1.5 inches) of design,” says

-3- Technology&more; 2011-2
Walther. “Subbase had to be within three centimeters (1.2 inches), granular base within two centimeters (0.8 inch), and the final surface had to be extraordinarily flat: In any four meters (13.1 feet) of track, no more than two millimeters (0.08 inch) of deviation was permissible.”
Using a Trimble 5800 GPS Receiver, Bickhardt established a control network of concrete monuments, set deep to minimize the effect of high surface temperatures. They also used a Trimble 5800 to stake the subgrade and drain-age system. Other staking was done with a Trimble 5600 Total Station and SPS730 Universal Total Station. The SPS730 was used to control the Trimble GCS900 Grade Control System that guided earth-moving equipment. Bickhardt transmitted data to and from the site via email and performed precision and quality control calculations in Germany using the firm’s proprietary CAD system CARD/1. “This system worked very well,” says Walther. “The digital terrain models calculated in Germany allowed excellent control and formed the basis for all stakeout and machine control work. We adapted last-minute changes quickly, and used a centralized document management system to keep all stakeholders informed of the current project status.” Bickhardt performed staking during relatively cool times of day, constantly checking with benchmarks. “The Trimble SPS730 performed well with the Trimble GCS900, and we were easily within tolerance on the subbase levels,” Walther says.
Three Vögele paving machines worked simultaneously with six Hamm steel rollers to efficiently pave the track. To counter heat, paving was done at night, utilizing the world’s largest permanent sports venue lighting system. “With all the steel rollers operating, it looked like a race,” jokes Walther.
World-Class PraiseNow complete, the popular Yas Marina Circuit is the anchor of the ambitious Yas Island development, which includes a theme park, water park, residences and ho-tels. The track itself passes the marina and underneath the Yas Marina Hotel, and is the home of the Abu Dhabi Grand Prix, the last race on the Formula One calendar. Notably, there have been no complaints of track un-evenness from drivers. “The complete surveying on this project was made pos-sible by the fusion of innovative instruments such as GPS, total stations and machine control technology,” Walther says. “This allowed a single survey to manage the site very effectively and comply with all tolerances.” Though Yas Marina was the perfect storm of project challenges—remote site, extreme climate, very tight tolerances, and an even tighter construction schedule—in Abu Dhabi it has created an excellent emblem of the state it has become: modern, powerful, resourceful and extremely fast. And thanks to Trimble and the survey team of Bickhardt Bau AG, very precise.
See feature article in POB's January issue: www.pobonline.com

-4- Technology&more; 2011-2
The coastal path along South Africa’s De Hoop Nature Reserve on the Western Cape is renowned for its breath-taking vistas, sweeping cliffs, iridescent
waters and rugged fynbos (scrublands). However, it’s not the exquisite surroundings that draw archaeologists to this remote setting, but Klipdrift Shelter, a new archaeological site of great importance to the understanding of human history.
Professor Christopher Henshilwood is a world-renowned archaeologist and a research professor at the University of the Witwatersrand, South Africa, and at the University of Bergen, Norway. He and his international team of students have carried out research for 20 years at Blombos Cave, located 30 km (19 mi) west of Klipdrift, where they excavated engraved stones, bones and beads used as jewelry more than 70,000 years ago. Their discoveries at Blombos are of international significance as they indisputably show that Homo sapiens had modern behaviors and thought processes as well as complex social structures in southern Africa 60,000 years prior to the oldest dated similar evidence in Europe. The discoveries also show that the origins of all people in the world today lie in southern Africa and that the forefathers and mothers of us all once lived in this region.
But now Henshilwood and his team’s attention is directed towards Klipdrift Shelter for a five-year study, in the hopes that new information about our ancient social organization and practices will be revealed to further advance our understanding of human origins.
Preparing Klipdrift Shelter for Archaelogical StudyKlipdrift Shelter is a sloping, shell- and rock-littered hollow located halfway up a precarious cliff face. It is this inacces-sibility that has helped preserve the cave’s treasures—in the words of Henshilwood: “Many of the origins of modernhuman behavior lie here along this coast.”
Far below the cave, Henshilwood’s team erected fixed tents to serve as a base for six weeks of initial study and site preparation. They then had to hoist their equipment to the cave using pulleys and ropes. They also used rope harnesses for safety while scaling the rock wall to and from the base camp each day.
One of the overall objectives at Klipdrift Shelter is to link a precise distribution map of archaeological material with human behavior, thereby linking the actions ancient people engaged in to a precise location in the cave: if cooking always happened in one area, it would be a “kitchen” of sorts. To assist them, the team is implementing a pioneering new methodology for archaeological extraction: spatial imaging using a Trimble VX™ Spatial Station generously funded by Bergen University. Unlike the Blombos site, which was processed using the standard practice of manually measuring 50x50 cm (20x20 in) squares with nine peripheral values per unit, at Klipdrift the team employs a 3D scan (measured by the Trimble VX) and an accurate spatial grid. Each unit will have 500 satellite values. The team plans to use the 3D mapping and spatial data to help identify and record patterns
High Risk, High RewardUncovering Homo Sapiens’ MostAncient Archaeological Artifacts
Cover Story
-5- Technology&more; 2011-2
that reveal ordering systems, such as sleeping, eating and living areas, which indicate a complex social structure. This will allow specialists to interpret the data to better understand how ancient people used space within their living quarters.
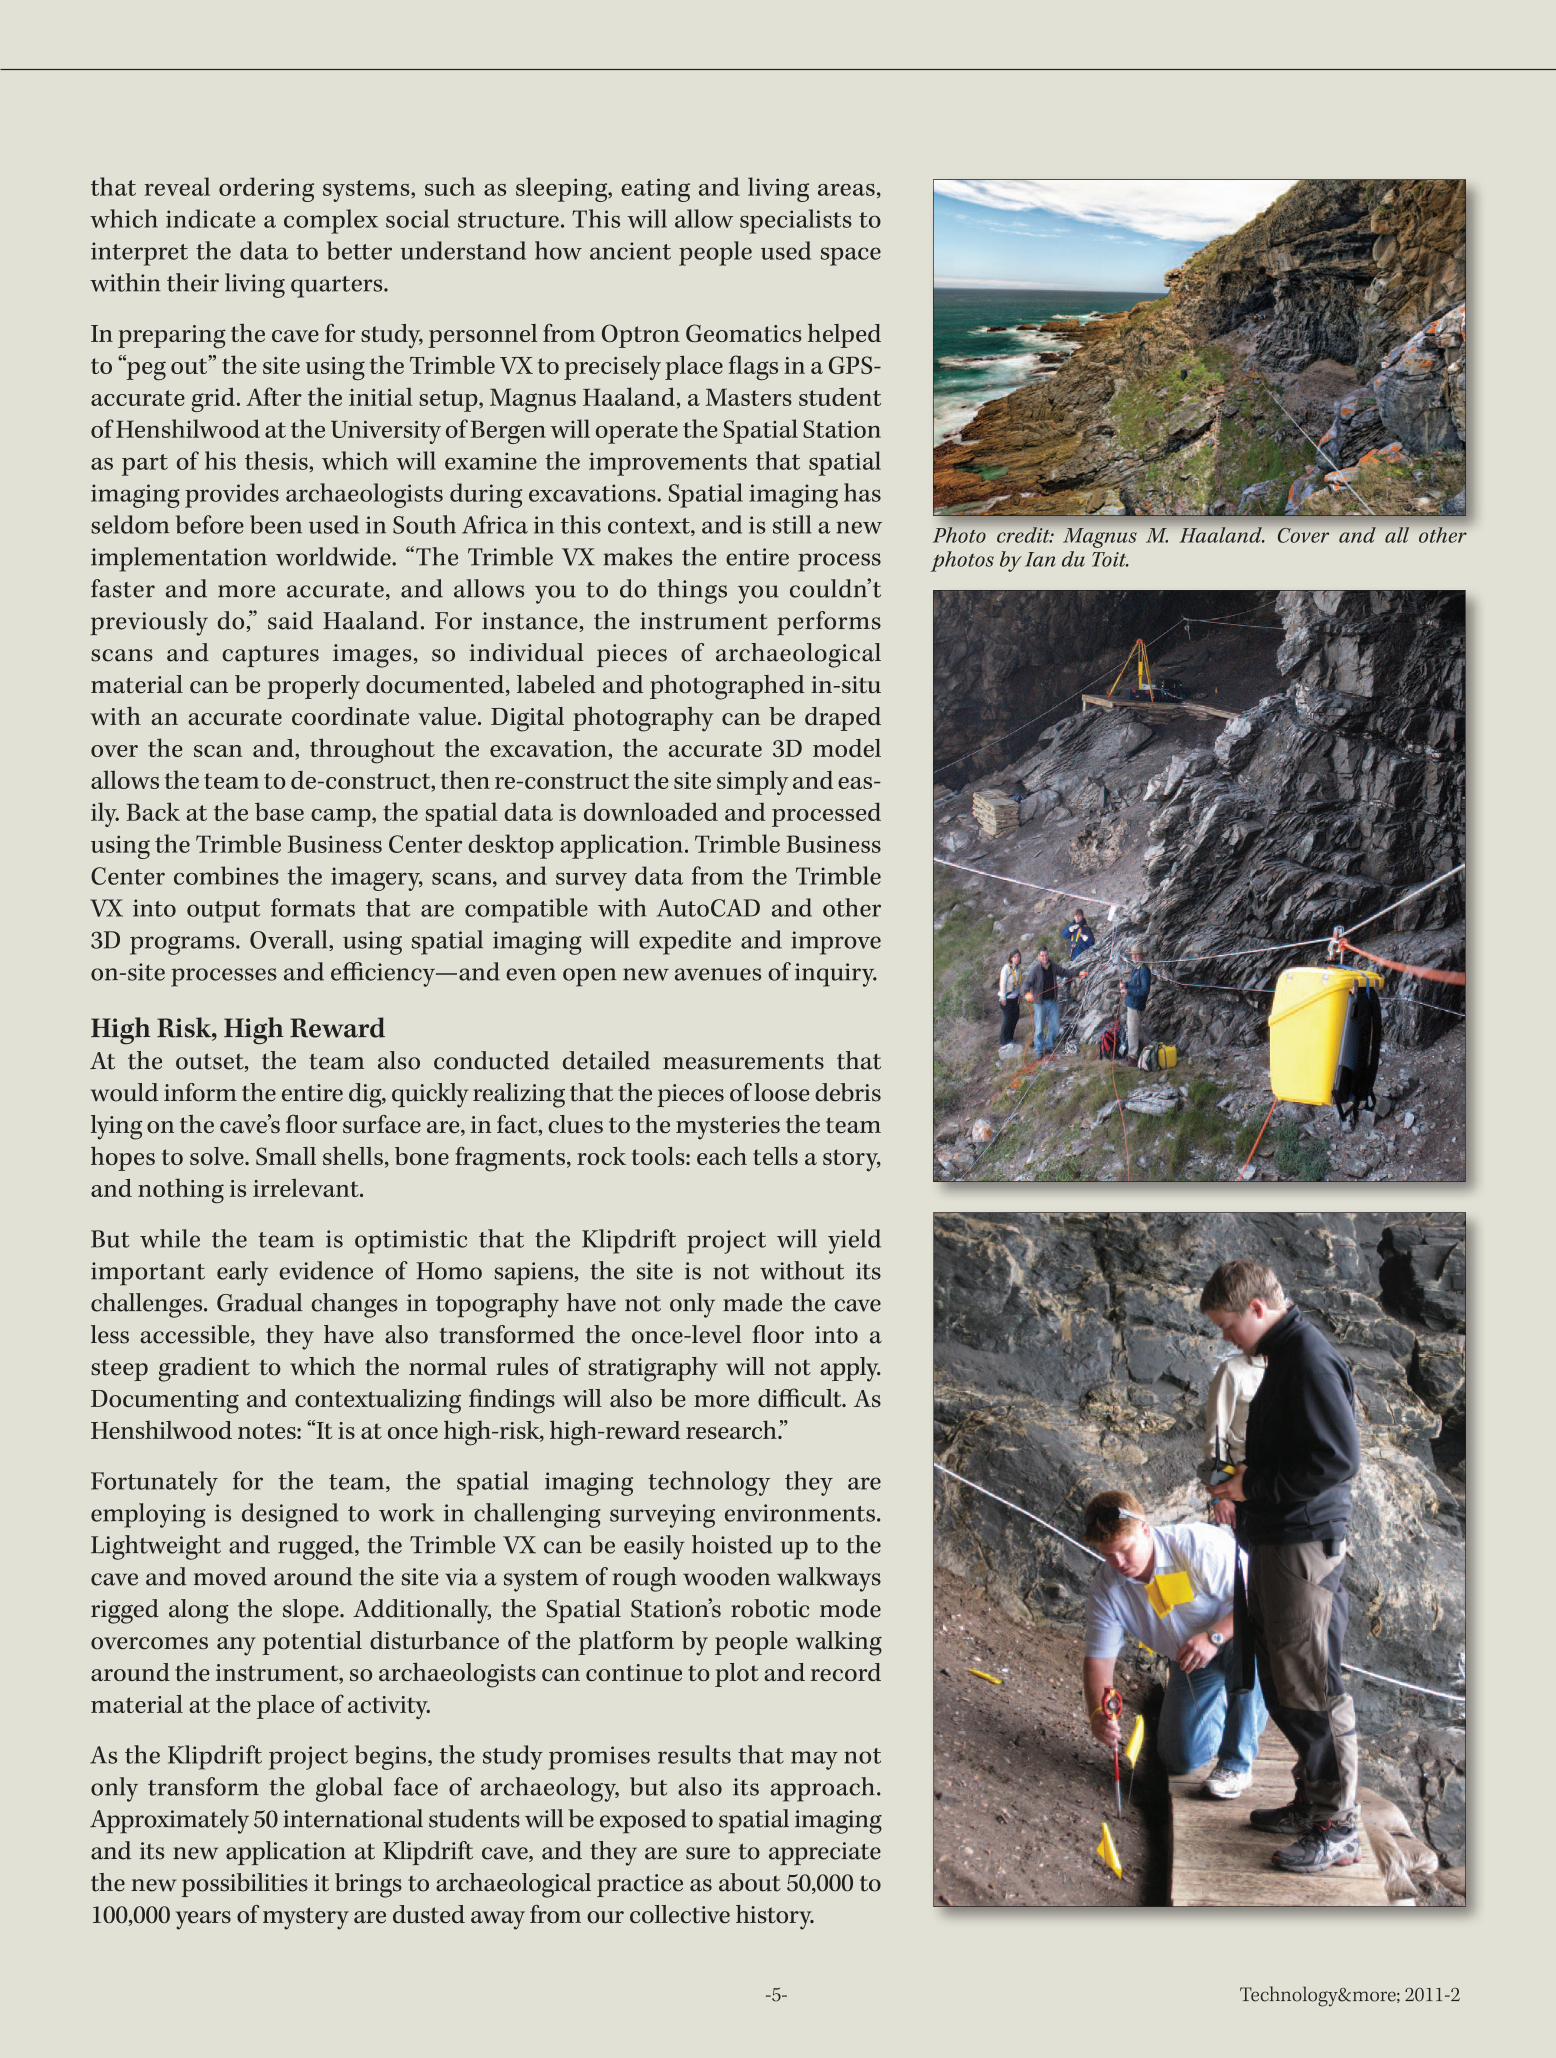
In preparing the cave for study, personnel from Optron Geomatics helped to “peg out” the site using the Trimble VX to precisely place flags in a GPS-accurate grid. After the initial setup, Magnus Haaland, a Masters student of Henshilwood at the University of Bergen will operate the Spatial Station as part of his thesis, which will examine the improvements that spatial imaging provides archaeologists during excavations. Spatial imaging has seldom before been used in South Africa in this context, and is still a new implementation worldwide. “The Trimble VX makes the entire process faster and more accurate, and allows you to do things you couldn’t previously do,” said Haaland. For instance, the instrument performs scans and captures images, so individual pieces of archaeological material can be properly documented, labeled and photographed in-situ with an accurate coordinate value. Digital photography can be draped over the scan and, throughout the excavation, the accurate 3D model allows the team to de-construct, then re-construct the site simply and eas-ily. Back at the base camp, the spatial data is downloaded and processed using the Trimble Business Center desktop application. Trimble Business Center combines the imagery, scans, and survey data from the Trimble VX into output formats that are compatible with AutoCAD and other 3D programs. Overall, using spatial imaging will expedite and improve on-site processes and efficiency—and even open new avenues of inquiry.
High Risk, High RewardAt the outset, the team also conducted detailed measurements that would inform the entire dig, quickly realizing that the pieces of loose debris lying on the cave’s floor surface are, in fact, clues to the mysteries the team hopes to solve. Small shells, bone fragments, rock tools: each tells a story, and nothing is irrelevant.
But while the team is optimistic that the Klipdrift project will yield important early evidence of Homo sapiens, the site is not without its challenges. Gradual changes in topography have not only made the cave less accessible, they have also transformed the once-level floor into a steep gradient to which the normal rules of stratigraphy will not apply. Documenting and contextualizing findings will also be more difficult. As Henshilwood notes: “It is at once high-risk, high-reward research.”
Fortunately for the team, the spatial imaging technology they are employing is designed to work in challenging surveying environments. Lightweight and rugged, the Trimble VX can be easily hoisted up to the cave and moved around the site via a system of rough wooden walkways rigged along the slope. Additionally, the Spatial Station’s robotic mode overcomes any potential disturbance of the platform by people walking around the instrument, so archaeologists can continue to plot and record material at the place of activity.
As the Klipdrift project begins, the study promises results that may not only transform the global face of archaeology, but also its approach. Approximately 50 international students will be exposed to spatial imaging and its new application at Klipdrift cave, and they are sure to appreciate the new possibilities it brings to archaeological practice as about 50,000 to 100,000 years of mystery are dusted away from our collective history.
Photo credit: Magnus M. Haaland. Cover and all other photos by Ian du Toit.

-6- Technology&more; 2011-2
Spending the summer on an icefield may not be the ideal vacation for most people, but for many researchers, it’s the opportunity of a lifetime. Each year, 50 to 60 professors,
scientists and students travel to Alaska for the Juneau Icefield Research Program (JIRP), the longest continuous research study of a glacial system in the Western Hemisphere.
JIRP grew out of research conducted in 1946 to understand glaciers as they relate to climate change. Until the 1980s, measuring positions relied on optical observations using theodolites. The emergence of EDM, tachymeters and total stations improved results, though optical methods were still limited by instrument range, refraction and poor weather. This changed in 1992, when researchers began using GPS, and evolved further in 2010 with the use of GNSS.
“GPS/GNSS enables the surveyors to capture data over the entire icefield rather than just at select regions,” says Ronny Wenzel, a graduate engineer from the University of the Bundeswehr in Germany1. “This provides researchers with a much more comprehensive view of the icefield and its behavior.”
Conducting the SurveysIn 2010, the team used Trimble 5700 GPS, Trimble R7 and Trimble R7 GNSS Receivers with Trimble TSC1® and TSC2® Controllers running Trimble Survey Controller™ Software extensively for the static and RTK measurements. The surveyors set up the base station over an established benchmark to support RTK surveys for two rover teams, each surveying a profile by navigating to within 50 cm (1.6 ft) of the stakeout points already uploaded to the rover. That position was recorded, but glacier velocity surveys require measuring the
point twice, so a wand was placed in the snow at the first point and measured again a couple days later.
“We tried to achieve the typical RTK accuracies of 2 to 3 cm (0.75 to 1.2 in),” Wenzel notes. “Even in areas with poor radio communication due to obstacles such as icefalls or mountains, our precision was always better than 5 cm (2 in) horizontally. For the vertical component, the RTK accuracy of several centimeters is normal, especially on the variable icefield surface.”
The surveyors covered 2,620 km (1,628 mi) to take measure-ments at 1,030 points. They surveyed 380 km (236 mi) of profiles in 26 days, collecting points at intervals of 500 m (1,640 ft) on longitudinal profiles and of 50-300 m (164-984 ft) on transverse profiles. An additional 4,650 points were col-lected in continuous topo mode. All points were added to a database of GPS/GNSS points gathered from 1992 to 2010, which now contains some 5,500 discrete stakeout points and around 32,000 surveyed coordinates.
Analyzing the DataData collected within JIRP are analyzed to understand the icefield’s velocity, direction, height change, strain rates and movement due to plate tectonics. Glacier velocity and direction are determined by performing two surveys at each profile. The observed coordinates are compared, using simple trigonometry to determine the distance and direction of movement.
Long-term faculty, JIRP surveyor and head of logistics Scott McGee has been tracking glacier velocities since 1988, and reports velocities have remained steady. “Today’s GPS/GNSS
Hot Research in Cold SurroundingsGNSS Plays a Central Research Role on
One of the Planet’s Major IcefieldsAfter eight days of non-flyable weather conditions, a helicopter from Juneau’s "Coastal Helicopters" finally brought the long-expected survey equipment, food and supply to a JIRP main camp. All images courtesy of JIRP.

-7- Technology&more; 2011-2
surveys corroborate surface velocities obtained via theodolite and electronic distance measuring (EDM) surveys done in the 1950s to the 1980s.”
“To have an exact annual surface elevation change, the heights of a given profile point have to be interpolated to a reference day, which means we usually have to reduce and add the impacts of slope and daily ablation data from surveys and mass balance work,” says Wenzel. Monitoring these aspects of the glacier’s behavior provides short-term weather patterns and long-term climate change.
Validating TerraSAR-X with GNSSFor assessing overall changes of the icefield's glacier extent, the experts are resorting to satellite data of the German radar satellite TerraSAR-X, provided by Astrium GEO-Information Services.
The geo-information experts have also used this opportunity to assess the quality of an innovative concept of extracting specific points from this radar satellite data which could be used for Ground Control: Wenzel installed corner reflectors to reflect the radar beam back to the satellite. GNSS was used to measure the location of the corner reflector’s centerpoint with centimeter precision. Comparing these ground measurements with the values extracted from TerraSAR-X data confirmed the high precision of the satellite's measurements. This successful demonstration of the usability of TerraSAR-X radar data for glacier monitoring and ground control measurements was an important step for JIRP.
“Since JIRP introduced GPS to its program, we have been able to gather better information,” McGee says. “With GPS we don't have to wait for clear visibility. Since GPS/GNSS is not affected by atmo-spheric refraction over the glacier surface, the data is much more accurate than what could be obtained using theodolites and total stations. By using continuous mode for collecting points, we can essentially scan the surface and create accurate grids from glacial structures. One thing that has not changed, though, is that it’s still all about X,Y,Z and time, the four parameters that provide the most information about the behavior of the glaciers.”
Using GPS/GNSS allowed the teams to overcome an 8-day delay (25 percent of measuring time) and expand the surveys by 50 km (31 mi). McGee adds that using GPS/GNSS on the icefield allows them to go out in any weather, including total whiteout, and still return with new data to add to the database:
“And that’s pretty cool.”
*Sinning Vermessungsgeräte GmbH and Trimble Germany generously supported the 2010 JIRP expedition by providing state-of-the-art Trimble GNSS equipment.
For more information on JIRP visit www.juneauicefield.com and www.crevassezone.org
See feature article in Professional Surveyor’s March issue: www.profsurv.com
1 Prof. Dr.-Ing. Walter M. Welsch from UniBw Munich joined JIRP geodetic projects in 1981. Today, the central European universities UniBw Munich, TU Munich, TU Darmstadt, Beuth-University Berlin and ETH Zurich are involved in JIRP and support the program's survey projects with scientific staff, lectur-ers and survey equipment to contribute to climate research and teach young scientists in this unique environment.
Comparing several earth-exploring satellites, the graph shows the retreat of the Canadian Llewellyn Glacier terminus since 1984 by about one third. Graph courtesy of Paul Illsley, JIRP.

-8- Technology&more; 2011-2
Monitoring Iceland’s Hot Spots
Iceland’s Eyjafjallajökull volcano had been quiet for nearly 190 years. When it awoke, the whole world knew about it.
Located along the southern coast of Iceland, about 140 km (87 mi) east of Reykjavik, Eyjafjallajökull is a classic, cone-shaped volcanic mountain. It towers above a thin, flat strip of fertile land to the south that is dotted with farms and fringed by black, sandy beaches bordering the North Atlantic. On the volcano’s north side, inland slopes descend towards a former deep fjord and a broad valley filled with ancient flood and river sediments. The mountain is one of dozens of volcanoes on Iceland’s main island. Like its counterparts, Eyjafjallajökull’s snow-covered summit and flanks are important contributors to Iceland’s economy. The mountain is a popular tourist destination and an important source of freshwater for the regions residents and agriculture.
Because of its height—the summit elevation is roughly 1,660 m (5,450 ft)—Eyjafjallajökull has a massive ice cap.
Ice and snow up to 200 m (660 ft) thick cover more than 80 km2 (30 mi2) of the main crater and upper slopes. On the mountain’s northern slopes, the ice cap feeds two large glaciers: the Steinsholt Glacier and nearby Gígjökull (Crater Glacier). Steep and heavily crevassed, Crater Glacier originates within the volcano’s 2.5 km-wide (1.5 mi), top crater. The glacier runs northward for 7.5 km (4.7 mi), descending roughly 1,400 m (4,600 ft) across the icecap and through a steep icefall. It finally drains into a glacial lagoon tucked behind a high termi-nal moraine.
Crater Glacier is a well-known, heavily studied ice field. For decades, the Iceland Glaciological Society (IGS) has collaborated with the Hydrological Department of the Iceland Meteorological Office to conduct measure-ments and monitoring on Iceland’s glaciers. IGS has approximately 40 different glacial monitoring stations across the country, and has monitored Crater Glacier for more than 40 years. The methods for monitoring have
The surveyors use a total station to determine the height of the volcanic plume. The airborne ash disrupted air travel for several days. The instrument shown is a Geodimeter total station. Trimble acquired the Geodimeter brand in 2000. Photo: Pall Bjarnason

changed over time, evolving from simple wooden pegs along the glacier’s margin to total stations and GPS.
In November 2009, surveyors from EFLA Consulting Engineers in Reykjavik traveled to Crater Glacier to conduct monitoring measurements. To measure the location of the glacier’s face, the team used Trimble GPS systems, comparing their results to GPS mea-surements taken in previous years. The GPS data is tied to Iceland’s IGSGPS network of continuously operating GPS reference stations, and seismic data is provided by the SIL (South Iceland Lowland) system of seismic sensors. Several years earlier, survey teams had used static GPS to establish a control monument on the lagoon’s north shore. This marker served as the reference point for RTK measurements along the glacier margin, and the team set up a Trimble 5800 GPS System with UHF radio. “We have coordinated the measurements on Gígjökull for several years,” said Páll Bjarnason, manager for geodesy and GIS at EFLA. “GPS has changed everything. It’s made it faster, a lot easier and more accurate.”
Faced with a landscape too rugged even for all-terrain vehicles, the team crossed the glacier’s lagoon in a rubber dinghy. When they reached the base of the glacier, they used RTK to establish coordinates for a temporary instrument station. Next, they set up a Trimble VX Spatial Station equipped with a Trimble CU Controller running Trimble Survey Controller Software. The information from the Spatial Station would be used as baseline data for comparisons with future scans to determine the shape and thickness of the ice at the glacier’s forward margin. The team set the Trimble VX to automatically collect points at 5-m (16-ft) intervals. The instrument scanned an area of roughly 7,000 m2 (1.7 acres) on the face of the glacier and collected approxi-mately 300 individual points. The distances measured ranged from 100-250 m (300–750 ft).
While the Trimble VX conducted the scan, the team used a Trimble 5800 GPS System to make RTK measurements along the glacier’s edge. They completed all of the work in one day, leaving the site after nightfall. In the office, technicians downloaded the GPS and Spatial Station data into Trimble RealWorks® Software and AutoCAD and analyzed the measurements; comparing the GPS work against earlier observations. Based on their data, the teams determined that Crater Glacier had retreated by 53 m (170 ft) in the period from 2007 to 2009.
Working at the base of Crater Glacier, EFLA surveyors measure the extent and depth of the glacial ice. Pall Bjarnason (left) and SveinnSvavarsson. Photo: Armann Ingi
Shortly after the main eruption, the end of Crater Glacier is covered with debris. The glacial lagoon has disappeared beneath the mud and alluvial flow. Credit: Pall Bjarnason
-9- Technology&more; 2011-2
The survey team sets up their GPS base station on the north side of the Crater Glacier lagoon. They tied all measurements to Iceland’s ISGPS network. Photo: Pall Bjarnason

-10- Technology&more; 2011-2
The 2010 EruptionEven in a country where volcanic activity is com-monplace, the Eyjafjallajökull eruption was big news. The mountain had been stable since its last eruption occurred in 1823. But soon after the 2009 survey, a net-work of seismic and GPS monitoring stations detected a steady rise in the land around the mountain. Eyjafjal-lajökull was preparing to erase decades of hard work by the surveyors and researchers.
Through early 2010, the monitoring sensors revealed increasing activity in the area, and Eyjafjallajökull began to erupt on March 20. The initial eruption, which was mainly a flow of lava from a fissure on the mountain’s east side, was considered relatively tame, and tourists flocked to view the spectacle from nearby hiking trails. Then, on April 14, an explosive eruption in Eyjafjallajökull’s main crater unleashed clouds of steam and ash together with multiple jökulhaup ( fast-moving floods caused by rapid melting of snow and ice) that transformed the landscape around the volcano.
The eruption shot a plume of steam and volcanic ash more than eight km ( five mi) into the atmosphere, disrupting or shutting down air traffic over large parts of Europe and the North Atlantic. During the eruption, the Icelandic Meteorological Office needed to issue forecasts on the ash distribution. The eruption plume was often not visible on radar, and the surveyors used total stations and angular measurements to determine the height of the eruption cloud. The major eruption finally stopped in mid-May. Although roughly 800 local residents were forced to evacuate, no lives were lost, and the heaviest damage was confined to the remote areas surrounding the mountain.
Measuring the Health of Iceland’s Glaciers Iceland’s glaciers play a major role in the nation’s economy. Iceland has no coal or petroleum resources, and relies on geothermal and hydropower to produce virtually all of its electricity. The glaciers are the primary source of water for production of electricity in Iceland, which gets more than 70 percent of its electricity from hydropower. The coun-try’s clean, low-cost power has attracted investment from numerous foreign manufacturing firms, and Iceland’s cool climate and cheap electricity makes it an attractive location for large data centers.
In addition to the economic impacts, tracking glacial size and behavior is a useful indicator of climate change. In the last thousand years, Iceland’s glaciers and ice
caps have undergone some notable changes. During the “Little Ice Age” that extended from the 16th to 19th centuries the glaciers expanded, reaching their maximum size by the late 1800s. Beginning in 1920, a warming period caused the glaciers to recede by 2–4 km (1.2–2.5 mi). Subsequent cooling let glaciers advance until the 1990s, when a general recession again took over.
In 2000, glacial ice covered about 11 percent of Iceland’s territory. Current measurements show that Iceland is losing about 0.2 to 0.3 percent of its ice volume every year. If current climate forecasts hold, the country’s glaciers are expected to shrink by 50 percent by the end of the century, and could vanish within 300 years.
With Eyjafjallajökull’s large eruption, melting ice and debris flows from the volcano caused widespread damage and flooding. A jökulhaup moved down Crater Glacier, flooding the area with ash and debris and eras-ing the glacial lagoon. The spot where the Trimble VX had worked a few months earlier was covered by a thick (20 m or 66 ft) layer of mud and rock.
Because of the radical change to Crater Glacier caused by Eyjafjallajökull, its pre-2010 configuration can no longer serve as a source of comparative measurements needed to track climate change over the past decades. But Bjarnason said that plans are already underway to resume monitoring, starting with updated GPS measurements. By collecting new baseline data using GPS and total stations, researchers can establish an accurate reference for evaluating the glacier’s behavior in the future.
For more info on the SIL system see: http://en.vedur.is/#tab=skjalftar
The initial eruption in the Fimmvorduhals area east of Eyjafjal-lajökull’s main crater. The eruption produced a fissure 300 m (980 ft) long. Photo: Pall Bjarnason

-11-
Green Initiatives for theCity of Shanghai
In recent years, the City of Shanghai in China has become a greener and more sustainable city. And hosting World Expo 2010—themed “Better City, Better Life”—served to complement and highlight the environmentally conscious initiatives being adopted and implemented by city leaders.
One such initiative is the Digital Greening Project, an ambitious project by the Shanghai Greening and City Appearance Administration, which aims to transform Shanghai through increased planting and better management of vegetation and trees on public land. To accomplish the goals of the Digital Greening Project, the Administration recently embarked on three separate projects, two of which are ongoing.
Project 1: Creating a Benchmark of “Greenness”The Administration’s first project established a benchmark of Shanghai’s “greenness,” which they achieved by mapping all existing trees on public land. The collected data was then analyzed and used to formulate plans for further development. In total, nine million trees were digitized from aerial photographs taken over 2,600 km2 (1004 mi2). Each tree’s location then had to be checked and updated using GPS.
Because of the scale of the mapping project, several different models of GPS handheld devices were tested before administrators committed to purchase the 40 units needed. Eventually, they selected the Trimble GeoXT™ handheld over all other models and brands.
The rugged Trimble GeoXT, with its ability to provide submeter accuracy with real-time corrections, was able to map most of the trees in Shanghai, which are typically 2 to 3 m (6 to 10 ft) apart in urban areas. For seamless integration to an Esri ArcGIS geodatabase in the office, the handhelds ran Esri ArcPad software. In addition, the project team used Trimble GPScorrect® extension for Esri ArcPad software to perform real-time corrections in the field.
The mapping of all trees in Shanghai was completed in 2009—several months ahead of schedule due to the efficiency of the Trimble equipment. And the accurate, up-to-date geodatabase created is now used for daily planning and management of operations. It is maintained monthly with new tree plantings and removals.
Technology&more; 2011-2

-12- Technology&more; 2011-2
Project 2: Recording Tree HealthOnce tree numbers and locations were known, administrators began recording the health of sample sets of trees. To support this ongoing effort, the team uses Trimble Juno® SC handhelds running a custom Windows Mobile field application. Approxi-mately 150 field workers perform regular tree inspection.
During the tree inspection process, the map and data (approximately 100 MB for an area of 2 km2 or 0.8 mi2) for each field worker’s assigned inspection area is downloaded to a handheld in the office. Once out in the field, since each tree’s GPS location has already been mapped, the handhelds are used to navigate to the necessary tree. This information, along with the current GPS position automatically generated by the handheld, is sent to the office every five minutes. With its built-in wireless connection, the Juno SC handheld is an ideal tool for this purpose.
The data is immediately checked for completeness so that if a field worker has missed a field in the form, or more information is required, he or she is alerted.
In addition, when a group of trees needing treatment for pests or disease is identified, jobs are dispatched wirelessly to workers who can treat the trees in a timely manner. Previously, pests and disease issues were recorded using pen and paper, and the data faxed to the office. It was difficult to gather statistics or analyze the data, which resulted in delays in treating trees. Because the data is now sent immediately to the office, trees are protected from pests and disease in time and audit information is always up-to-date.
Project 3: Monitoring WildlifeThe third project of the Digital Greening Project is an ongoing wildlife monitoring effort, where teams record the wildlife
activities and behaviors of birds in coastal areas and large parks around Shanghai. Around 20 highly trained field workers visit these locations on a set schedule to collect information about the number of birds in the area. Their processes are similar to workers on the tree health project—they also use Trimble Juno SC handhelds, sending GPS positions to the office every five minutes for online tracking. The custom office application, de-veloped by the administration, shows the location of each field worker and is used to send and receive jobs, as well as to add the field data to an Esri ArcGIS geodatabase.
If the results are alarming—for example, if large numbers of dead birds are recorded at one location—the application au-tomatically generates an alert for the office supervisor who in turn can forward the alert to authorities for investigation. An outbreak of illness can be serious, so timely data is imperative for managing bird flu cases and minimizing the risk of trans-mission to humans.
“Trying to manage this data with pen and paper was never an option,” says Qian Jie, Director of the Shanghai Landscape Administration Information Center. “We just wouldn’t have had the data fast enough or regularly enough, and so it would have been pointless trying to do this without an electronic solution.”
Better City, Better LifeEmploying Trimble GPS solutions has helped Digital Greening Project administrators dramatically improve the efficiency and effectiveness of their efforts. With up-to-the-minute accurate data at their fingertips, city authorities can now make informed planning decisions and can be confident that their decisions are executed in a timely manner. And, of course, the resulting achievement is a better City of Shanghai and a better life for its inhabitants.

Technology&more; 2011-2-13-
The cost and time associated with manually assembling and processing detailed image data are significant. While integrating three-dimensional
(3D) data such as aerial laser scanning vastly improves the value and accuracy of the information product produced, this data is practically impossible to manually prepare and analyze. Only by using software to automate data handling and analysis is it feasible for organizations to tackle land-use modeling and mapping projects for large areas.
As part of an urban planning initiative from the European Union, the Department of Surveying and Geo Informa-tion (GEOinfo) of the State Government of Lower Austria generated sound-wave propagation models for traffic noise over an area of more than 20,000 km2 (7,700 mi2) in Austria. To successfully perform this project, GEO-info developed an application that detects and quantifies changes in forests, buildings, and bodies of water using aerial laser scanning and orthophotos and Trimble Inpho and eCognition® software. With measured accuracy ratings above 94 percent, the automated approach provides an information product that would be completely unviable and cost-prohibitive to create manually.
In case you were wondering, the State of Lower Austria is not in the southern part of the country. It forms roughly the northeastern quadrant of Austria, entirely surrounding the city-state of Vienna. The largest of the nine states in Austria, it is named Lower Austria because it is located down-stream on the Danube River, which flows through it.
Handling Airborne Geospatial Data In the GEOinfo project, automation of photogrammetric processes and digital terrain model (DTM) generation was essential. Trimble Inpho, a leading photogrammetry and digital terrain modeling software suite, was used to manage and process GEOinfo’s aerial laser scanning data over large areas. The SCOP++ TopDM module was used to manage approximately 30,000 raw data flight strips from which 20,000 DTM and 20,000 digital surface model (DSM) data tiles were derived. Various other SCOP++ modules were applied to these data sets to perform tasks such as point cloud classification using powerful filtering strategies, shade calculation, slope calculation, profile tools and other terrain algebra methods. Available breaklines were used during these processes to increase the quality of the terrain modeling, especially in challenging topographic areas.
Michael Pregesbauer, Deputy Department Head at GEOinfo, was happy with the results: “The Inpho software allowed us to produce robust terrain models with virtually no manual interaction, which enabled us to produce and manage digital terrains in a cost-efficient, standardized and automated manner.” Without automation software like Trimble Inpho, processing laser scanning data of this sort is practically impossible. The output of these processes provides quality input data for the next workflow step: the production of value-added products.
Detecting and Quantifying Changes GEOinfo utilized Trimble eCognition software to detect and quantify changes in forests, buildings, field and water areas from the DSMs, DTMs and orthophotos. Within eCognition, a wide variety of source data can be imported, fused and segmented
Processing Massive Amounts of ImageryData
GeoSpatial Software Makes Austrian Project Feasible

to create meaningful objects using prescribed conditions such as average elevation and normalized differenced vegetation index.
Rather than merely examining individual pixels, eCogni-tion identifies objects and makes contextual inferences. Just like the human mind, it uses the color, shape, texture and size of objects as well as spatial relationships to achieve the same insights as an experienced analyst. These methodologies produce clear, intuitive results that facilitate simpler map construction.
This logic was applied to the data representing 20,000 km2 of Lower Austria. To deal with this volume of data, a tiling and stitching technique was applied, creating 2000 x 2000 pixel tiles each representing 1 km x 1 km (0.6 mi x 0.6 mi) of territory. Within each tile, eCognition automatically classified elevated objects and distinguished buildings, trees, scrubs and sealed areas. Results were then stitched together and border effects removed to create the final information product for import into ArcGIS.
“The eCognition software allowed us to concurrently analyze both the digital imagery and terrain models and reliably extract the land-cover and land-use information we were seeking,” said Pregesbauer. “After testing commercially available software currently on the market, we discovered that only eCognition is able to efficiently accomplish this.”
Project Outcome Analyzing an area of 20,000 km2 requires massive amounts of data to be processed in a timely and cost-efficient manner. Replacing manual analysis routines with an automated, software-assisted approach makes it feasible to develop land-use models for very large areas without a large amount of resources. Where manual analysis of one building might cost 2–4 Euros (2.70–5.45 USD), the automated approach costs only 0.1–0.2 Euro (0.14–0.27 USD).
An accuracy assessment of the resulting shape files showed that built-up and forested areas were correctly classified for 94.3 percent and 96.1 percent of the area, respectively. With these high levels of accuracy achieved at such a low cost, the project was deemed to be highly successful and additional iterations are now planned for each of the next four years.
-14- Technology&more; 2011-2
-15- Technology&more; 2011-2
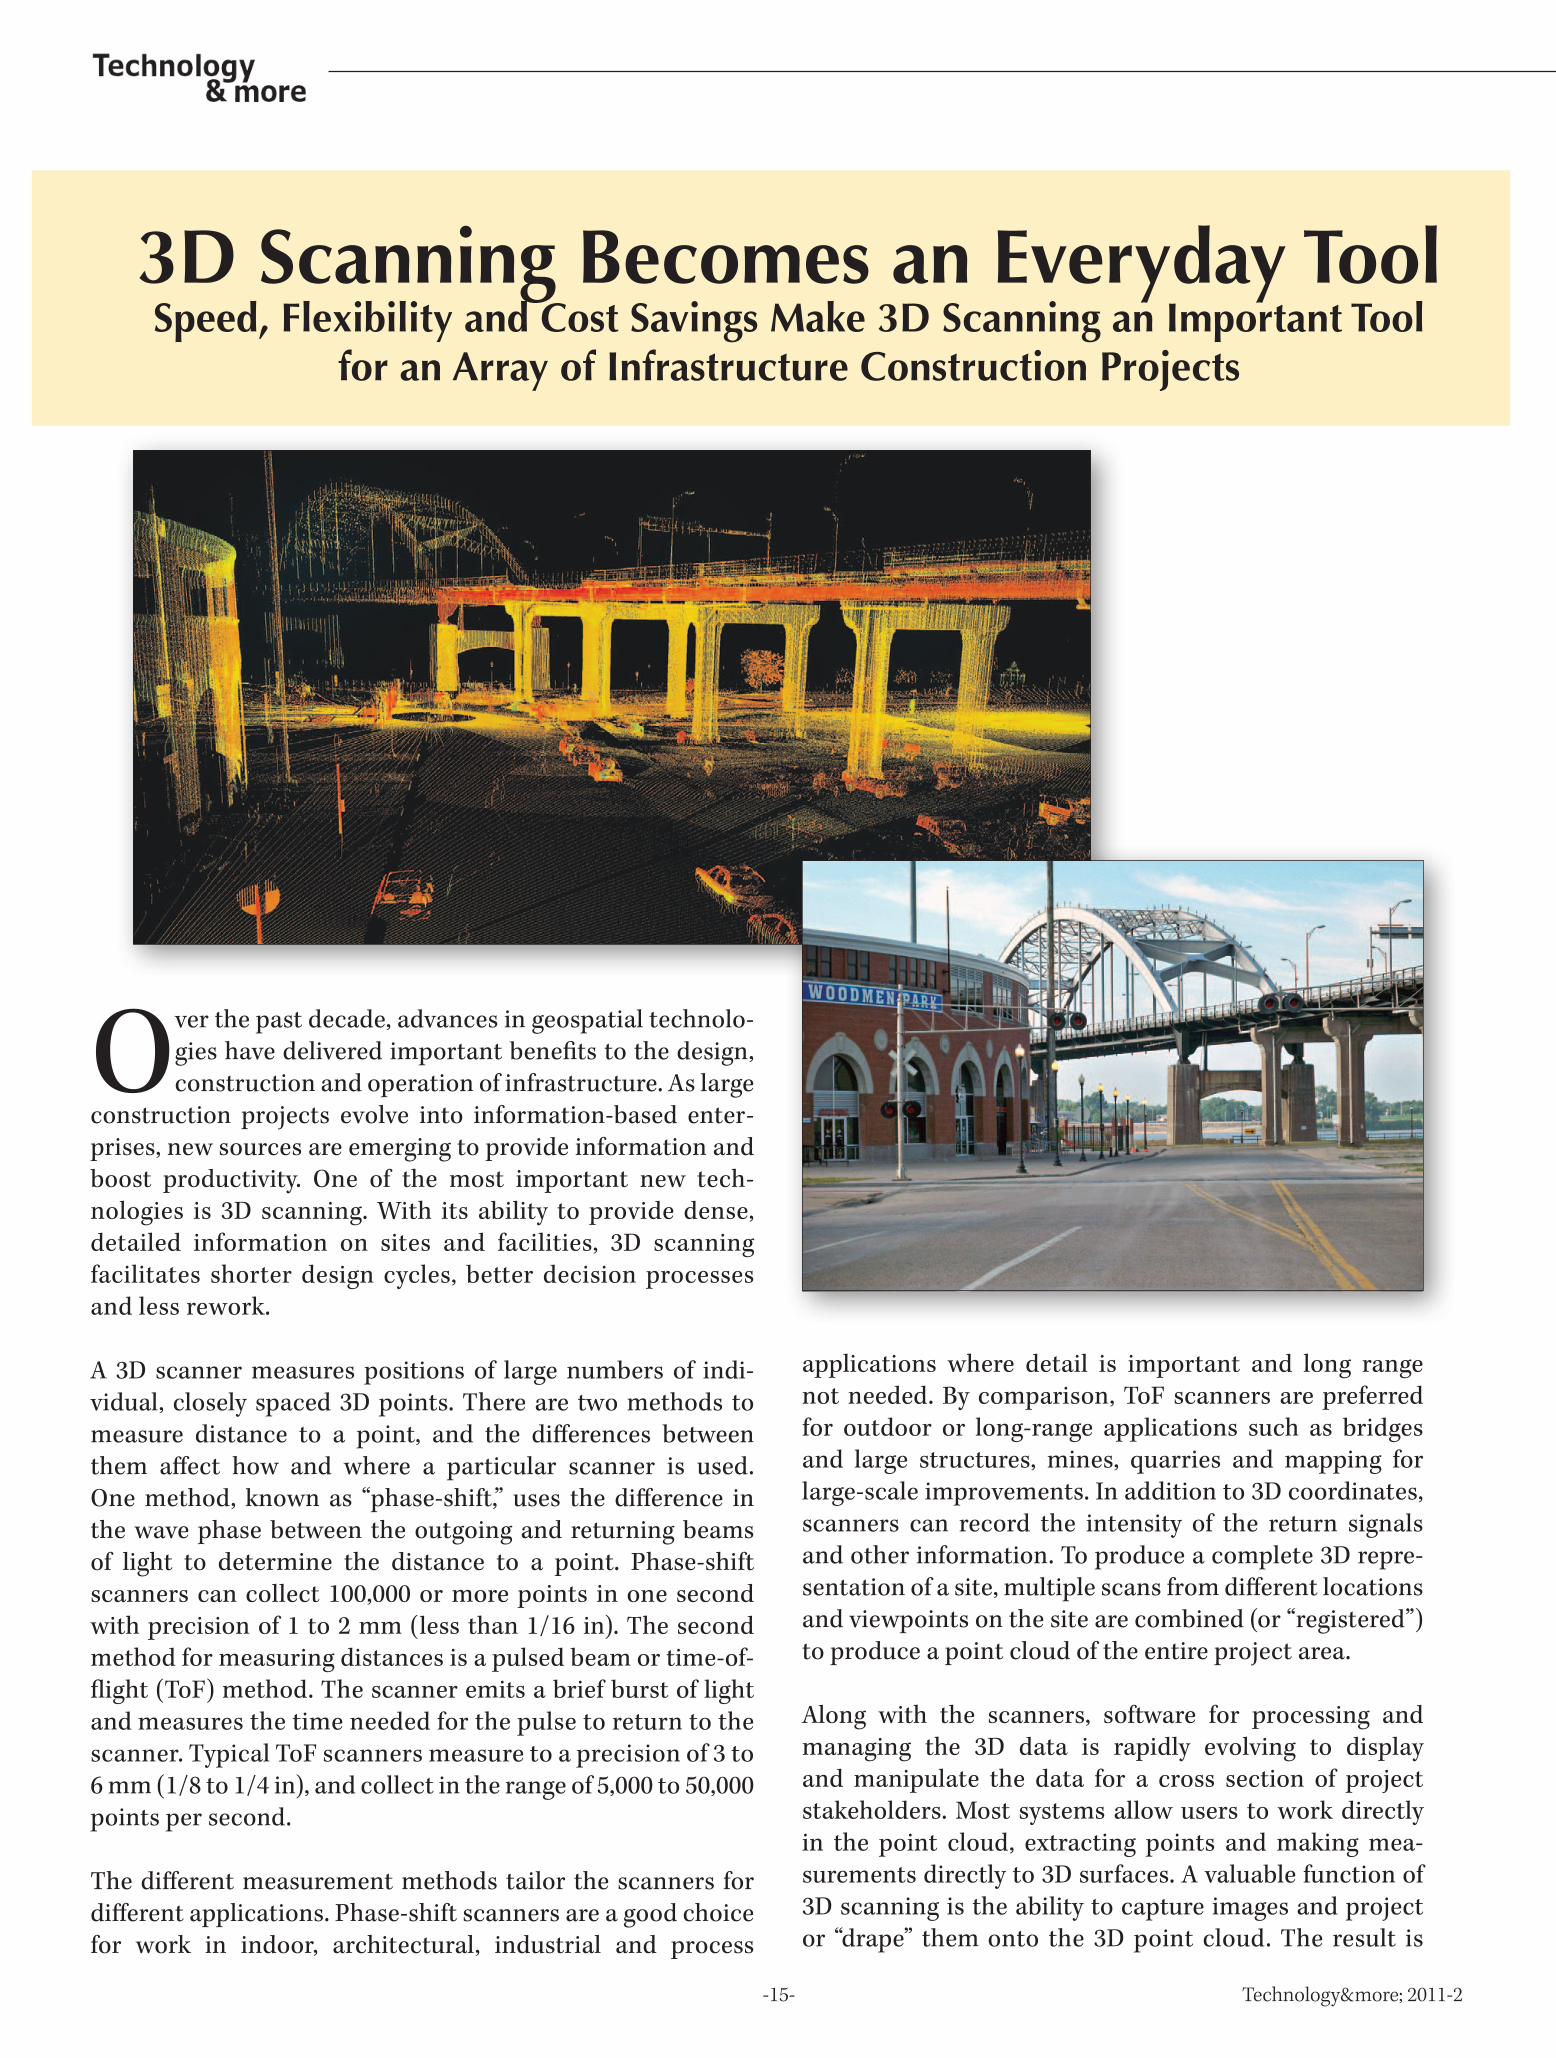
Over the past decade, advances in geospatial technolo-gies have delivered important benefits to the design, construction and operation of infrastructure. As large
construction projects evolve into information-based enter-prises, new sources are emerging to provide information and boost productivity. One of the most important new tech-nologies is 3D scanning. With its ability to provide dense, detailed information on sites and facilities, 3D scanning facilitates shorter design cycles, better decision processes and less rework.
A 3D scanner measures positions of large numbers of indi-vidual, closely spaced 3D points. There are two methods to measure distance to a point, and the differences between them affect how and where a particular scanner is used. One method, known as “phase-shift,” uses the difference in the wave phase between the outgoing and returning beams of light to determine the distance to a point. Phase-shift scanners can collect 100,000 or more points in one second with precision of 1 to 2 mm (less than 1/16 in). The second method for measuring distances is a pulsed beam or time-of-flight (ToF) method. The scanner emits a brief burst of light and measures the time needed for the pulse to return to the scanner. Typical ToF scanners measure to a precision of 3 to 6 mm (1/8 to 1/4 in), and collect in the range of 5,000 to 50,000 points per second.
The different measurement methods tailor the scanners for different applications. Phase-shift scanners are a good choice for work in indoor, architectural, industrial and process
3D Scanning Becomes an Everyday ToolSpeed, Flexibility and Cost Savings Make 3D Scanning an Important Tool
for an Array of Infrastructure Construction Projects
applications where detail is important and long range not needed. By comparison, ToF scanners are preferred for outdoor or long-range applications such as bridges and large structures, mines, quarries and mapping for large-scale improvements. In addition to 3D coordinates, scanners can record the intensity of the return signals and other information. To produce a complete 3D repre-sentation of a site, multiple scans from different locations and viewpoints on the site are combined (or “registered”) to produce a point cloud of the entire project area.
Along with the scanners, software for processing and managing the 3D data is rapidly evolving to display and manipulate the data for a cross section of project stakeholders. Most systems allow users to work directly in the point cloud, extracting points and making mea-surements directly to 3D surfaces. A valuable function of 3D scanning is the ability to capture images and project or “drape” them onto the 3D point cloud. The result is

a photorealistic image in which each pixel has accurately georeferenced 3D coordinates.
Scanning for Infrastructure Projects3D scanning is emerging as a tool for infrastructure engi-neering and construction. Major application areas include preconstruction data collection, as-built surveys, and col-lecting high-resolution data for retrofitting of refineries or industrial plants.
Sandra Doran, a landscape architect for Illinois consulting firm Shive-Hattery, Inc., said scanning has become an integral part of the company’s services for modernizing street inter-sections and other complex infrastructure. The dense data is valuable to engineers, and the 3D visualization tools let de-signers and clients see how the improvements are integrated into the existing conditions. Shive-Hattery used a Trimble GX™ 3D Scanner and Trimble RealWorks Software to create a 3D site model on a project to preserve and restore a public space adjacent to an historic baseball stadium. The stadium is adjacent to Centennial Bridge, which crosses the Mississippi River to connect Davenport, Iowa, with Rock Island, Illinois. Engineers could measure clearances beneath and around the bridge directly in the 3D data. “We could quickly develop dif-ferent views of key areas from different perspectives requested by the client,” Doran said.
3D scanning is used for construction of new infrastructure as well. In Virginia, the Dulles Corridor Metrorail Project will extend the Washington, D.C. Metrorail to Dulles International Airport. Dulles Transit Partners Survey Manager Joe Betit, PLS, said that—in addi-tion to pre-construction scans for design—his teams use scanning as a construction productivity tool. When workers need to drill into newly poured concrete to install embedded fixtures, problems arise when the drill hits a rebar. To solve this, surveyors use a Trimble GX to scan the location of rebar in the forms just before the
-16- Technology&more; 2011-2
concrete is poured. Later, using the scanned data, a survey crew can mark locations so the drillers can avoid the rebar. Betit said that in places where the railway alignment goes beneath existing roadway bridges, the surveyors use 3D scanning to confirm suf-ficient horizontal and vertical clearances for the rail cars.
Among the benefits of 3D data, its capabilities for visualiza-tion stand out. One example is a new power station in South Africa. As the concrete lift shafts serving the plant’s boiler units were constructed, surveyors scanned the vertical walls. Using Trimble RealWorks, they developed a color-coded map showing the differences between the design and as-construct-ed lift shafts to confirm that the structure was within planned tolerances.
The world is moving beyond photogrammetry and simple images to a future of images and positions combined across multiple platforms, and 3D scanning is becoming an everyday tool for infrastructure development, operation and mainte-nance. When used in building information systems, 3D data becomes the geospatial core of an infrastructure project’s entire life cycle. Many surveyors recognize scanning as a survey technique, and clients will begin to request it for their projects. For Doran, the big difference in scanning and visual-ization is its value for the client. “It makes it easy for people to make choices,” she said. “Decisions come faster and are based on more and better information.”
See feature article in CE News special edition, Rebuilding America's Infrastructure: : www.cenews.com

Photo Contest
-17- Technology&more; 2011-2
The ever-popular Technology&more photo contest draws in colorful and interesting images from around the world. First place—and a Trimble 4-in-1 all weather jacket—goes to Mr. Jakob Abermann from the University of Innsbruck, Austria, Institute for Meteorology & Geophysics, for the Alaska Glacier image. You’ll see the photo on page 7 and the
back cover.
This issue’s Honorable Mention winner will receive a limited-edition Trimble watch:
Across the PondEd Henricks, PLS, took this photo during an in-house survey to update the existing storm water management plan (SWMP) on an approximate 800-acre paper mill site. Visible in the photo’s background are the aeration ponds and paper mill of the Weyerhaeuser Company mill located in New Bern, North Carolina. Weyerhaeuser Engineering Services (WES) performed the SWMP field survey using a one-second Trimble S6 Total Station. WES supplies in-house design from initial field measurements through design and installation by its construction man-agement team.
“WES counts on the 1-second accuracy and precision of the Trimble S6 for our field measurements,” said Henricks. “The old saying ‘you are only as accurate as your weakest measurement’ is honored and revered when it comes to industrial surveys. It pays to be careful, close and adjust traverses, perform daily internal instrument check measurements, check range-pole bubbles for level, and have clear commu-nications. Acquiring the S6 increased our productivity by roughly 30 percent on large landfills and surface areas being mapped.”
Future Surveyor in the Making?It’s not often we get a father-daughter photo in the contest, but this one deserves a win. In 2007, Chilean Surveyor Ariel Silva was working for a local contractor in Calama, in northern Chile’s Antofagasta region, setting up a geodetic reference network at the Talabre dam in Chuquicamata. (Known as "Chuqui," Chuquicamata is by digged volume the biggest open pit copper mine in the world.) For the network, Silva set up a Trimble 5700 L1/L2 GPS Receiver as base station on an old geodetic point named “Moctesuma.” Because she was on winter holidays, his then 10-year-old daughter Isabella hiked up the mountain with him. “Even though the Moctesuma point was above 3100 m (10,171 ft), my daughter didn’t have any prob-lems getting there,” says Silva. “Isabel likes nature and traveling to distant places—and learning new things.” Who knows, maybe she’ll be a future surveyor!

Optionally, copy, fill in and fax this form to us. Fax (U.S.) +937 245 5145 Fax (EU) +49 61 42 2100 140 Fax (Asia) +61 7 3216 0088
q Please send more information about the following product:
q Please send more information about the following article:
q Please include me on the mailing list of Technology&more.
q Please call.
q My feedback on Technology&more:
To subscribe to Technology&more for free, go to: www.trimble.com/t&m.You can also send an email to: T&[email protected] can also view Technology&more online at www.trimble.com/t&m.
Company
Name
Street
City
State / Province
Zip Country
Phone
Photo ContestEnter Trimble’s Technology&more Photo Contest!
The winners of the Trimble Photo Contest receive Trimble prizes and the photos are published in Technology&more. This issue's first place winner is Mr. Jakob Abermann from University of Innsbruck, Austria, Institute for Meteorology & Geophysics. Send a photo taken with an 8 megapixel (or greater) digital camera to [email protected]. Please make sure you include your name, title and contact information.