Lineaments Determination of Western Part of Iraqi Western Desert using Aeromagnetic and Gravity Data

Andean Geologywww.andeangeology.cl
Andean Geology 45 (1): 1-34. January, 2018doi: 10.5027/andgeoV45n1-3002
Shallow architecture of Fuegian Andes lineaments based on Electrical Resistivity Tomography (ERT).
Evidences of transverse extensional faulting in the central Beagle Channel area
*Donaldo Mauricio Bran1, Alejandro Tassone1, Marco Menichetti2, María Elena Cerredo1, Jorge Gabriel Lozano1, Emanuele Lodolo3, Juan Francisco Vilas1
1 CONICET-Instituto de Geociencias Básicas, Ambientales y Aplicadas (IGEBA), Departamento de Ciencias Geológicas, Facultad de Ciencias Exactas y Naturales, Universidad de Buenos Aires, Ciudad Universitaria C1428EHA, Buenos Aires, Argentina.
[email protected]; [email protected]; [email protected]; [email protected]; [email protected] Dipartimento di Scienze della Terra, Vita e dell’Ambiente dell’Universita di Urbino Campus Scientifico E. Mattei, 61020 Urbino (FU), Italy. [email protected] Istituto Nazionale di Oceanografia e di Geofisica Sperimentale (OGS), Borgo Grotta Gigante 42/C, Sgonico, Trieste, 34010, Italy.
* Corresponding author: [email protected]
ABSTRACT. The southern foothills of the Fuegian Andes are bounded by the Beagle Channel (BC), a conspicuous E-W longitudinal basin, controlled by a large transcurrent fault system, which extends from the Atlantic to the Pacific Ocean. The northern shore of the Beagle Channel’s central segment is characterized by several E-W oriented valleys, parallel to the main basin, which are interspersed with a series of oblique NW trending lineaments that extend across the mountain belt. A geoelectrical survey was carried out in order to investigate the shallow architecture of such sets of linear morphologies. The principal E-W lineament system was characterized by conspicuous sub-vertical resistivity contrasts, interpreted as fractured zones associated with fault strands of the main strike-slip Beagle Channel system, whereas the oblique NW-SE trending set of lineaments revealed slightly different resistivity patterns, with vertical displacements and less abrupt contrasts. These resistivity patterns, in combination with the widespread occurrence of normal faulting in the area, allowed to infer an extensional control over the oblique depressions. These morphological features were related to oblique transverse faults that segment two sub parallel E-W fault systems. The oblique faults were probably developed along inherited structural anisotropies and can be extended well beyond the BC shoreline to the NW. Both geophysical and field evidence suggest a post-glacial deformation along the area.
Keywords: ERT, Lineaments, Beagle, Transverse Faults, Extension.
RESUMEN. Arquitectura somera de lineamientos en los Andes Fueguinos basada en estudios de Tomografía de Resistividad Eléctrica (TER). Evidencias de fallamiento transverso extensional en el área central del canal de Beagle. La cordillera Fueguina está limitada al sur por el canal de Beagle, una gran fosa longitudinal que se extiende desde el océano Atlántico al este, hasta el Pacífico al oeste y está desarrollada sobre un sistema de fallamiento regional transcurrente. La costa norte del segmento central del Canal está caracterizada por la intersección de valles paralelos a la fosa principal con una serie de lineamientos morfológicos oblicuos de orientación NW-SE, los cuales se extienden a través del sistema montañoso. Se llevó a cabo un relevamiento de Tomografía de Resistividad Eléctrica con el objetivo de investigar la arquitectura somera de los diferentes juegos de lineamientos observados en el sector y dilucidar el control estructural que determina su geometría. Los resultados muestran que el sistema de lineamientos E-W está caracterizado por un patrón de resistividades con marcados contrastes de disposición subvertical interpretadas como

2 Shallow architecture of Fuegian Andes lineaments based on Electrical Resistivity Tomography...
1. Introduction
In densely forested areas with sparse outcrops, heavily weathered or in locations of difficult access, the combination of traditional field geology with geophysical techniques, such as seismic, electrical, magnetometric or gravimetric surveys, constitute a valuable approach to explore the subsurface continuity of geological features observed in the outcrop and the remote sensing images. Among the different geophysical methods, the Electrical Resistivity Tomography (hereafter ERT) is a relatively recent near-surface technique that has been developed in parallel with the implementation of multi-electrode arrays and new inversion algorithms. There is a growing body of literature that recognises the wide amount of advantages that this method offers: it is highly sensitive to the electrical properties of materials, it is of relatively fast acquisition, and it has been largely applied to map a variety of geological problems such as tracing fault zones and fracture systems, estimation of the bedrock depth, investigation of sedimentation and infilling processes and analysis of landslides or glacial landforms among others (Caputo et al., 2003; Comas et al., 2004; Fazzito et al., 2009; Maillet et al., 2005; Storz et al., 2000; Tassone et al., 2010). In the southernmost Andes, several examples of this joint use of geophysics along with structural surveys resulted in valuables approaches to improve the knowledge of major morphostructures along the Tierra del Fuego Island (Fig. 1) (Lodolo et al., 2003, 2007; Tassone et al., 2005).
The surveyed area lies within the Fuegian Andes orogenic belt, an E-W trending fold and thrust belt, which is crosscut to the south and to the north by noticeable longitudinal morphostructures developed along regional fault zones (Fig. 1). To the north, the continental transform fault Magallanes-Fagnano (MFFS) stands as a en-èchelon E-W strike-slip system that concentrates the present day motion between the South America and the Scotia plates (Lodolo et al., 2003;
Pelayo and Wiens, 1989; Smalley et al., 2003), with a main longitudinal pull apart basin, the Fagnano Lake (Esteban et al., 2014). To the south, the Fuegian hills are rimmed by a further E-W regional transcurrent structure, the Beagle Channel Fault System (BCFS) (Cunningham, 1993; Menichetti et al., 2008). In addition, NW trending depressions, highly oblique to the BCFS, are common in the central segment of the Beagle Channel. These features contain plenty of evidence of recent modelling by glacial erosion, but the nearly rectilinear geometries and parallelisms existing among them suggest that a structural control may have played a major role in their development. However, its nature, geological processes and relationship with the strike-slip related deformation has received scant attention in the research literature.
In this contribution we present the results of more than 5 km of subsurface high resolution resistivity data arranged in eight 2D ERT profiles which were carried out in several field sites along the northern shore of Beagle Channel. The different electrical responses of subsurface materials were used to correlate the outcropping rock units or sedimentary deposits and to interpret the geological structures affecting these units. The electrical data was analysed in combination with outcrop data in order to characterise the shallow architecture of several lineaments, focusing principally in the structural control of the oblique NW system.
2. Tectonic Setting
2.1. Tectonic Provinces
The southernmost tip of the Andean Cordillera, known as the Fuegian Andes south of Magallanes Strait (Caminos, 1980), extends along the western and southern margin of Tierra del Fuego Island and it can be subdivided into a number of WNW-ESE tectono-stratigraphic provinces (Fig. 1) (Menichetti et al., 2008).
zonas de fractura asociadas al fallamiento de rumbo del canal de Beagle. Por otro lado, los lineamientos NW poseen un patrón de resistividades distinto, que exhibe contrastes menos marcados además de notorios desplazamientos en la vertical de los dominios resistivos. Considerando conjuntamente los patrones de resistividad con la presencia de fallas normales en el área, se deduce la existencia de un control extensional sobre el juego de lineamientos oblicuo, el cual ha sido interpretado como un sistema de fallas transversas que segmenta dos sistemas de fallas E-W subparalelos. Asimismo, evidencias geofísicas y de campo revelan la ocurrencia de deformación posglacial en el área.
Palabras clave: TER, Beagle, Lineamientos, Fallas Transversas, Extensión.

3Bran et al. / Andean Geology 45 (1): 1-34, 2018
The Late Jurassic-Neogene Fuegian Batholith crops out in the southwestern archipelago of Tierra del Fuego (Hervé et al., 2007; Hervé et al., 1984), related to the subduction of Pacific Ocean f loor beneath the South American Plate which took place at least since the Late Jurassic.
Northeastwards, in the Cordillera Darwin, a high grade metamorphic core is exposed along the mountain belt that lies, on average, 1 km above the surrounding ranges (Dalziel and Brown, 1989; Klepeis et al., 2010; Kohn et al., 1995; Nelson, 1982). To the east a decrease in exhumation levels and in topography occurs along the Fuegian Andes, a fold and thrust belt (FTB) of
northeastern vergence and thick-skinned tectonic style (Menichetti et al., 2008), involving the Jurassic silicic volcanic rocks and the Early Cretaceous clastic rocks of Rocas Verdes marginal basin.
Across the central-northern part of the Tierra del Fuego Island, the Meso-Cenozoic foreland basin rocks are involved in the northeast verging thin-skinned Magallanes FTB, including units of Late Cretaceous to Neogene age (Ghiglione and Ramos, 2005; Torres Carbonell et al., 2008a). Beyond the orogenic front, the most external province is recognized as the Austral foreland basin, which extends offshore into the Atlantic Ocean (Ghiglione et al., 2010).
FIG. 1. Tectonic provinces of Tierra del Fuego region (modified from Menichetti et al., 2008; Sánchez et al., 2010; Torres Carbonell et al., 2014). MFFS: Magallanes-Fagnano Fault System; BCFS: Beagle Channel Fault System. The upper right inset displays the modern plate tectonic frame of South America (Simplified from Baker, 2001); NSR: North Scotia Ridge; SSR: South Scotia Ridge; SFZ: Shackleton Fracture Zone. Red box: study area; FTB: Fault thrust belt.

4 Shallow architecture of Fuegian Andes lineaments based on Electrical Resistivity Tomography...
2.2. Tectonic history
The complex Mesozoic-Cenozoic geodynamic evolution of the Tierra del Fuego Island can be traced back to the Middle Jurassic, when the Gondwana supercontinent breakup resulted in a widespread extensional phase, along its southwestern margin (Dalziel, 1981; Pankhurst et al., 2000), and associated extensive silicic volcanism which spanned between 172-142 Ma based on SHRIMP U-Pb ages (Barbeau et al., 2009; Calderón et al., 2007; Palotti et al., 2012; Pankhurst et al., 2000) and it is represented by the Lemaire Formation, referred to as Tobífera Formation in Chile. Ongoing extension promoted the generation of oceanic crust and the opening of Rocas Verdes marginal basin (Calderón et al., 2013; Dalziel et al., 1974; Dalziel, 1981; Fildani and Hessler, 2005). Remnants of grabens and hemi-grabens of NW-SE trend, that controlled the basin opening, have been recognized in the Atlantic off-shore (Ghiglione et al., 2013; Menichetti et al., 2008). The Rocas Verdes basin was filled up by a clastic-wedge that thickens towards the southeast and includes the deep marine volcaniclastic sequence of Yahgán Formation and the marine-slope deposits of Beauvoir Formation (Olivero and Malumián, 2008).
A change in the regional tectonic configuration took place during the Late Cretaceous, when a compressive regime was established in the area (Cunningham, 1995; Fildani and Hessler, 2005; Klepeis et al., 2010). This event was responsible for the inversion of Rocas Verdes basin (Klepeis et al., 2010), the obduction of the oceanic floor represented by the Tortuga and Sarmiento complexes (Calderón et al., 2012, 2013) and the final collision of the volcanic arc against the continental margin and the ensuing basin closure. Protracted crustal shortening resulted in the development of the Fuegian FTB with northeast-verging thrust sheets involving both the basement and the Mesozoic sedimentary cover. The progressive migration of the orogenic wedge towards the foreland gave rise to the Magallanes FTB, which comprises deformed late Cretaceous to lower Miocene synorogenic deposits that are well exposed in the cliffs along the Atlantic coast and constrain the timing of the wedge propagation (Ghiglione and Ramos, 2005; Menichetti et al., 2008; Olivero and Malumián, 2008; Torres Carbonell et al., 2014).
A subsequent strike-slip deformation stage is widely recognized within the Tierra del Fuego Island
and the southern archipelago, overprinting earlier contractional folds and faults (Betka et al., 2016; Cunningham, 1993; Klepeis and Austin, 1997; Lodolo et al., 2003; Menichetti et al., 2008; Torres Carbonell et al., 2008b), with reported displacements up to several kilometers (Klepeis, 1994; Rossello, 2005; Torres-Carbonell et al., 2008b). However, there is no agreement about the onset timing and the tectonic regime under which the transcurrent deformation took place. It is still in discussion whether the sinistral strike-slip was an active mechanism of orocline bending since the Late Cretaceous to the Paleogene (Cunningham, 1995; Eagles, 2016), or if it was active only after the onset of seafloor spreading in the Scotia Sea and the Drake Passage opening during the Oligocene onwards (Klepeis and Austin, 1997; Lodolo et al., 2003; Menichetti et al., 2008). Nevertheless, most authors agree that this was the dominant phase since the late Oligocene. The transcurrent regime is characterized by E-W to ESE-WNW left-lateral strike-slip faults arranged in several regional fault systems with strong morphostructural expressions such as the BCFZ, the Andorra valley (Menichetti et al., 2008) and the Magallanes-Fagnano Fault System (MFFS), which comprises the inland segment of the transform plate boundary between South American and Scotia Plates (Fig. 1) (Klepeis, 1994; Lodolo et al., 2003). It extends eastwards, into the offshore, along the North Scotia Ridge (Barker, 2001; Eagles, 2016).
The BC, in the southernmost part of the island (Fig. 1), is a conspicuous linear nearly E-W trending fjord that connects the Atlantic and Pacific Oceans. Its transcurrent nature has been already suggested; along the western and central segments of channel a number of associated regional and mesoscale strike-slip faults have been reported (Cunningham, 1993; Menichetti et al., 2008). A significant extensional component associated with the BCFS was identified from kinematic analysis (Menichetti et al., 2008) as it was already pointed out for the MFFS further north (Klepeis and Austin, 1997; Lodolo et al., 2003).
3. Methodology
3.1. ERT acquisition
The geophysical field survey consisted in eight geoelectrical profiles located along the northern coast of the central Beagle Channel. The measurements were performed with a Syscal R1+ Switch resistivity-

5Bran et al. / Andean Geology 45 (1): 1-34, 2018
meter system, which operates automatically once the acquisition and geometrical parameters have been set. In this case a Wenner-Schlumberger array was chosen, a hybrid between Wenner-alpha and Schlumberger arrays, since it provides a good balance between resolution and signal-to-noise ratio (Dahlin and Zhou, 2004). For each section, a total of 48 electrodes were connected to a 480 m long multi-core cable that is divided in 4 sections of 120 m each and has 48 channels. An electrode spacing of 10 m was chosen, reaching a depth of investigation of approximate 80 m. The time of current injection was 1 second and the number of stack per measurement (Q) was set in a minimum of 3 and a maximum of 6. For the profiles that exceeded 470 m in length the Roll Along method was applied, which consists in transferring the first 120 m cable section to the end of the profile and repeat the measurement. This technique can be replayed several times until reaching the sought length.
3.2. Data Inversion
The acquired data was imported from the recorder via the Prosys II software, in the form of a pseudo-section, which represents a two-dimensional distribution of apparent resistivity values corresponding to assigned pseudodepths. This software also allows incorporating the topographyc information obtained from a Differential GPS (DGPS). The measured resistivity is an apparent value, that is the resistivity of a homogenous ground which will have the same resistance value for the given electrode array (Loke, 2004), and the relation between this apparent and the real resistivity is complex and requires an inversion model to be employed. The inverse modelling of the pseudo-section was accomplished through the RES2DInv software of Geotomo Software (Loke, 2004). The software allows estimating the resistivity of the cells by means of the application of a smoothness-constrained least-squares inversion method. This mathematical expression attempts to find an idealized model of the subsurface resistivity distribution that best fits the measured pseudo-section. The discrepancy between the calculated and the measured resistivity data is expressed by the root mean square (RMS). Some modifications can be incorporated into the inversion sub-routine, such as the smoothing of model resistivity or robust inversion among others. In the first one, the formulation applies the smoothness constrain directly on the
model resistivity values, thus the model displays resistivity changes in a smooth manner, whereas in the second option the sum of the absolute values of the discrepancies is reduced offering a model with homogeneous resistivity distribution with sharp boundaries. The acquired profiles were modelled using the three alternatives described above. The presented tomography in each case was selected in terms of the better depiction of features observed in every inverse model and its feasibility in relation with local geology. The topography was incorporated in the inversion routine as a damped distorted mesh for all the profiles but the Lago Roca, where no topography data was included given its f latness.
3.3. Resistivity/lithology relationships
The basis of the resistivity geo-electrical surveys is the outlining of the resistivity distribution in the subsurface, which is the result of the presence of diverse materials with distinct electrical properties. Figure 2 shows the resistivity ranges for diverse types of rocks and sediments similar to those that can be found within the studied area. A close inspection of the table shows that these ranges have differences of several orders of magnitude and there is an overlapping among different rock resistivity responses. However, it can be stated that granitic rocks tend to be more resistive than volcanic, volcaniclastic and metamorphic rocks, within which the schists present the greater variability of resistivity values. Glacial till and glacifluvial deposits, widespread in the surveyed area, are usually resistive to poorly conductive (50-10,000 Ωm) whereas clayed glacilacustrine deposits tend to be conductive (5-100 Ωm) (Fig. 2; Palacky, 1988). Furthermore, the resistivity is strongly influenced by the degree of fracturing or weathering, the position of the water table and the concentration of dissolved salts in their pore waters (Loke, 2004; Palacky, 1988). Therefore, the theoretical table serves as a guide to interpret possible lithologies, along with a proper constrain by nearby outcrops, landforms and results of previous resistivity works.
In this regard, figure 2 shows some resistivity ranges from previous publications that comprise lithologies and deposits which are exposed across the Tierra del Fuego region. The amount of quartz veins and the closed fabric shown by the fine grained schists of Lapataia Formation have led previous authors to assign high resistivity values to this unit (Tassone

6 Shallow architecture of Fuegian Andes lineaments based on Electrical Resistivity Tomography...
et al., 2010). In the case of Lemaire Formation, it was divided into two units of different electrical behaviour in base of outcrop correlation, a lesser resistive siliceous epiclastic to volcaniclastic unit and a relatively higher resistive mafic unit (Tassone et al., 2010). The Yahgán Formation has not been previously characterized by resistivity sections in the area but the slates have a fairly narrow resistivity range (Fig. 2).
3.4. Resistivity/structure relationships
In resistivity sections, brittle structures such as joints and faults are prone to be displayed as resistivity drops, since these highly fractured zones enhance the weathering and water percolation along them, changing the electrical properties in comparison with the rest of the unaltered rock units (Berge, 2014; Caputo et al., 2003; Fazzito et al., 2009; Stěpančíkova et al., 2011; Tassone et al., 2010). Faults might also be imaged in ERTs either as sharp resistivity contrasts
(due to the juxtaposition of materials with distinct electrical responses) or by f lexed patterns in the resistivity fields, produced by the offsets within a unit along the fault plane (Colella et al., 2004; Galli et al., 2013; Suzuki et al., 2000).
The structures interpreted from the ERTs patterns were further constrained by the collected outcrop data. It is important to remark that the resolution of this method is related to the electrode spacing (Nguyen et al., 2007). This means that any feature or anisotropy existing in the subsurface smaller than, in this case, 10 m, will not be properly represented in the ERT.
4. Geology of the central Beagle Channel
Prior to the geophysical description, some field observations should be pointed out in order to better constrain the resistivity data and interpretations. The outcrop data was collected within the study area, between Lapataia and Ushuaia bays (yellow stars
FIG. 2. Electrical resistivity ranges for several rocks, sediments and soils, modified from Palacky (1988). Ranges listed below the dashed line correspond to resistivity values attributed to lithologies and deposits of the Fuegian area in previous contributions (Tassone et al., 2005, 2010).

7Bran et al. / Andean Geology 45 (1): 1-34, 2018
in figure 3). This major area was divided into three smaller zones (red boxes of figure 3) according to the distribution of ERT profiles.
In the western sector, the Lapataia zone (box A, figure 3) fine-grained schists of Lapataia Formation are exposed along the BC’s shoreline. These rocks show a pervasive slaty cleavage (S1) with a prevailing NW-SE strike associated with a centimetric scale F1 folding (Fig. 4). Larger, metric-scale, F2 folds with ESE-WNW striking axial planes are in turn associated with a secondary sub vertical crenulation cleavage (S2).
Three sets of quartz veins (cm-scale) dissect the schists: an older, a few mm. thick, parallel to the slaty cleavage, later involved in F1 and F2 folds (Fig. 4); a second younger system that cross-cuts the slaty cleavage with a north-south strike, nearly
perpendicular to S1 and a third group which shows a northeast-southwest preferential orientation in coincidence with the S2 crenulation cleavage.
Brittle and ductile strike-slip structures, with a prevailing E-W trend, overprint the compressive features, between Lapataia and Ensenada bays (Fig. 3). In addition, several NW-SE oriented normal faults with gentle dip to the SW are evident both in the morphology of Ensenada Bay (Fig. 3), as in the outcrop scale (Fig. 5).
Upper Jurassic acid rocks of Lemaire Formation are exposed eastwards along the coast, in addition with smaller exposures, scarcely found within the forest further north in the Roca Lake (Fig. 3). In the survey area, this unit comprises dominantly phyllites but also acid volcanites and breccia, tuffaceous schists and sandstones. Cleavage is best developed
FIG. 3. Geological map of the study area, in southern Tierra del Fuego. Shaded relief image was generated after SRTM-1 (1 arc-second resolution). The geology and the principal structures were modified from Esteban et al. (2013), Menichetti et al. (2007b), Torres Carbonell et al. (2013), Zanolla et al. (2011) and own data. EB: Ensenada Bay; UP: Ushuaia Peninsula. Red boxes show the location of Lapataia Zone (A) Pipo River Zone (B) and Ushuaia Zone (C). The detailed maps of the subzones are located in figures 7, 12 and 16 respectively. Yellow stars indicate measurement sites. Red stars show the location of outcrop line-drawings of figures 4, 5 and 6. Contour line equidistance: 50 m. Fm: Formation.

8 Shallow architecture of Fuegian Andes lineaments based on Electrical Resistivity Tomography...
in fine-grained units and exhibits a WNW-ESE trend with a dip direction to the southwest. Additionally, restricted outcrops of basaltic rocks are intercalated with the felsic terms.
The central segment of the study area, which includes the Pipo River zone (box B, Fig. 3), is mostly covered by dense forests, peat bogs and some Quaternary deposits. In this location, the Pipo River flows with a NW-SE direction, along the Cañadón El Toro, until the southern tip of Seguí Mount (Fig. 3). At that point the valley shows an abrupt change in its trend to a roughly E-W direction, f lanked by the Susana and Seguí mounts, which are dominated by outcrops of the Lower Cretaceous Yahgán Formation. On the southern slope of Susana mount, the contact between the Lemaire and Yahgán Formations has been interpreted as a west-vergent dècollementlevel (Torres Carbonell et al., 2013), represented by a southeast dipping shear zone with penetrative structural fabric. The slates of Yahgán Fm. outcrop along the BC coast as well as in the mountain slope and locally host some grey-greenish mafic rocks.
Near the Ushuaia zone (box C, Fig. 3), the exposures are scattered and limited to some road cuts and coastal areas. The outcrops mainly comprise black to brownish slaty rocks interbedded with minor silty-sandy facies of the Late Cretaceous Yahgán
formation A limited expression of the Fuegian Batholith is represented by sub-volcanic andesitic rocks that intrude the Yahgán formation in the eastern sector of the Ushuaia Bay (Fig. 3).
The finer facies of Yahgán formation are characterized by a penetrative early S1 slaty cleavage of WNW-ESE orientation; the discontinuous S2 crenulation cleavage is usually associated with shear and faults zones and loses entity laterally from the fault planes. The Yahgán formation is also involved in metric-scale F2 folds with SSW dipping axial planes, often dissected by several north-vergent thrust faults. The compressional structures are overprinted by younger strike-slip faults along with well-developed normal faults (Fig. 6A), especially along the northeast margin of the bay.
The Quaternary is well-represented along the entire area comprising glacial related sediments -tills, glacif luvial and glacilacustrine- and alluvial/colluvial deposits. A set of N-NW-striking fault planes crosscuts a modern sequence of glacif luvial origin in Pipo River valley (Fig. 6B). The main fault plane dips steeply to the west and show normal offsets, whereas some secondary antithetic planes display gentler dips and reverse sense of movement.
A comparison of the preferential orientations of morphostructural lineaments in the study area with the
FIG. 4. Lapataia formation outcrop along the eastern margin of the homonymous bay. The F1 and F2 stereonets display the lower hemisphere equal area plot with Kamb contours of the fold hinges for each structural population. See location in figure 3.

9Bran et al. / Andean Geology 45 (1): 1-34, 2018
FIG. 5. Phyllites of Lapataia formation cross-cut by a set of NW-SE striking normal faults of moderate dips towards the SW. The quartz veins that cut the foliation are also affected by the faults. The stereonet displays the lower hemisphere equal area plot of the measured fault planes and the Kamb contours of their poles. See location in figure 3.

10 Shallow architecture of Fuegian Andes lineaments based on Electrical Resistivity Tomography...
trend of mesoscale brittle structure was accomplished. The mesoscale structures recognized in the outcrop were represented in separate stereograms according to their deformation style (Fig. 7).
The fault planes with reverse kinematics have a dominant trend of E-W to ESE-WNW strike, mainly dipping to the SSW (Fig. 7R), that together with the foliation and folds axis directions (Figs. 3 and 4) are in accordance with the main structural trend of the fold and thrust belt in the area. Two secondary groups also emerge from the data displaying a NE-SW strike, with dipping directions to the NW and SE respectively.
The strike-slip and oblique faults with sinistral sense of movement have an overall E-W trend with
some NW-SE striking planes (Fig. 7S). A minor population shows an orthogonal N-S strike and east dipping directions. Some dextral faults were also recognized but the measured strikes show great dispersion and no main trending direction emerges from the data obtained.
The group of dip-slip normal faults shows great dispersion, however three subgroups can be determined according to their orientation (Fig. 7N). The main one of NW strike with gently to moderate SW dipping planes. A second group displays E-W strike direction with a steep dip to the south whereas the third group is mainly composed by brittle normal faults with a NE strike and conjugate planes dipping to the SE and NW respectively.
FIG. 6. A. Slaty rocks from the Yahgán Formation cross-cut by a set of normal faults. Note the shear bands developed in the fine grained rocks along the fault plane. The stereonet displays the lower hemisphere equal area plot of the measured fault planes and the Kamb contours of their poles; B. Deformed Quaternary deposits near Pipo River. The gravels and sandy layers are affected by normal faults in the central sector, and secondary reverse faults in the western sector. The blue ellipse marks the position of the scale (geologic hammer). See location in figure 3.

11Bran et al. / Andean Geology 45 (1): 1-34, 2018
The morphological lineaments of the study area were digitized from hill shade, slope and curvature maps derived from the SRTM (1 arc-second resolution) digital elevation data. The lineaments were grouped on the basis of their lengths (i.e., longer or shorter than 2 km). The constructed rose diagrams reveals a preferential NW trend in both long (Fig. 7 H) and short (Fig. 7C) lineaments. This trend is present in almost all fault families but it is especially well-developed within the normal fault population. A second group of lineaments is oriented roughly NE-SW, almost perpendicular to the first one. This group is represented in both long and short lineaments, and coincides with the strike of the secondary population of conjugate normal faults (Fig. 7N). The E-W trend is only recognized in the group of long lineaments (Fig. 7H) and corresponds to the major morphostructures of the sinistral transcurrent BCFS.
5. Geophysical Results and Interpretations
5.1. Lapataia zone
Three resistivity profiles were carried out within the westernmost sector of the studied area (Fig. 8).
The Lago Roca (LR) profile is perpendicular to the longitudinal lake basin, whereas the Río Lapataia (RLP) and Los Castores (CA) profiles are located across some of the E-W lineaments recognized in the remote sensing images.
5.1.1. Lago Roca Profile This 470 m long section runs along the southern
shore of the Roca Lake (Fig. 8) from SW to NE, starting next to the headwaters of the Lapataia River, that drains the lake towards the Beagle Channel. A general decrease of resistivity with depth is observed in the inversion model (Fig. 9A), where several horizontal fringes can be defined. The highest resistivity values (600-900 Ωm) are found at the top of the cross-section. This 10 m thick uppermost layer extends horizontally along the entire profile length, only interrupted between 350 m to 400 m, with no significant changes in its thickness. Below the aforementioned, a relatively intermediate resistivity layer (200-300 Ωm) is present, whose upper limit is a remarkably sharp and horizontal resistivity contrast, whereas its lower limit is more gradual and displays inflections of resistivity fields, reaching deeper levels. Between this and the top resistive layer, there is a
FIG. 7. Stereonets displaying the lower hemisphere equal area plots of fault planes measured in the study area and the Kamb contours of their poles. R. Reverse faults; N. Normal faults, S. Sinistral faults; D. Dextral faults. The rose diagrams show the frequency of the direction of long (>2 km; Fig. 7H) and short (<2 km; Fig. 7C) lineaments. The lineaments where derived from hill shade, slope and curvatures map of the study area, calculated from the 1-arcsec resolution SRTM data. N corresponds to the population number.

12 Shallow architecture of Fuegian Andes lineaments based on Electrical Resistivity Tomography...
series of low-resistive (150-200 Ωm) unconnected lent-form levels, particularly in the central part of the cross-section. They seem to be related with the inf lections and the deepening of the intermediate resistivity layer since they are only developed above the offset sectors. In the section’s north-eastern end, a lenticular high resistive feature (600 Ωm) has been modelled, which displays a vertical dislocation and sharp contacts with the surrounding less resistive medium. The deepest portion of the cross-section shows the lowest values of electrical resistivity
(75-200 Ωm) and exhibits a further resistivity decrease from the central part towards both sides.
The interpreted cross-section is presented in figure 9B. The vertical shifts of the resistivity domains and some lateral resistivity variations suggest the existence of a set of conjugated brittle faults. The fault planes could be located along the narrow zones of resistivity drop and appear to have a direct component of displacement and a moderate dip angle, that slightly decrease with depth. The dip and the style of these structure is fairly similar to the system depicted in
FIG. 8. Map of Lapataia Zone showing the location of ERT profiles, Lago Roca (LR), Río Lapataia (RLP) and Los Castores (CA). IS: Salmon Island. Contour line equidistance: 20 m. See location in figure 3, box A.

13Bran et al. / Andean Geology 45 (1): 1-34, 2018
figure 5. At shallower levels, they are truncated by the uppermost resistive layer that does not seem to be displaced by the underlying discontinuities.
The uppermost resistive narrow layer is interpreted as the modern gravels where the electrodes were placed. The underlying disconnected lent-form conductive levels are only present above the displaced zones and have been thus interpreted as a thin sedimentary infill of structural depressions, probably of lacustrine or marine nature given the beach marine-estuarine deposits recognized in this valley (Rabassa et al., 2000). This interpretation is also supported by the low resistivity values that are usually associated with these types of sediments (Fig. 2). The intermediate resistivity horizon (>300 Ωm) was related to the metavolcanic rocks of Lemaire Fm. enclosing a lenticular basaltic body (~600 Ωm). This lithologic assemblage is commonly observed in the exposures of Lemaire formation in the area (Menichetti et al., 2004). The deepest conductive area may correspond
to an aquifer hosted in the volcano-sedimentary rocks due to its lower resistivity and the gradual transition with the overlying sector.
5.1.2. Río Lapataia Profile The nearly N-S and 830 m long RLP profile
(Fig. 8) extends along the eastern margin of the namesake river. The inverse model (Fig. 10A) shows a significant lateral variation in resistivity values. A thin (<10 m), fairly continuous superficial horizon with low to intermediate resistivity (450 Ωm) overlies a high resistive package (>1,500 Ωm). This resistive sector is in turn cut across by several very-high resistive (<3,000 Ωm) vertical belts. The relatively uniform shallow layer of intermediate resistivity is discontinued between 450 m and 630 m in length, where a noteworthy increase in resistivity is observed, with values similar to those found at deeper levels. This later resistive zone coincides with a slight increase in topography.
FIG. 9. A. Lago Roca inverse model; B. Geologic cross-section interpreted from the resistivity model. The interpreted fault planes are associated with sligth resistivity decreases and displacements of resistivity fields located under the uppermost layer. Note that the shallow (10 to 17 m) lent-form low resistive levels are only found overlying the zones that underwent deepening. Drawing patterns are schematic. Dark grey area depicts the faulted block. See location of LR profile in figure 8.

14 Shallow architecture of Fuegian Andes lineaments based on Electrical Resistivity Tomography...
The high resistive sector of the RLP tomography was assigned to Lapataia formation by correlation with exposed lithologies in the area and its characteristic electrical response (Fig. 2). Note that the high resistivity values highly differ from the lower values obtained a few meters north, in the LR profile, which is close to Lemaire formation outcrops. The striking sub vertical pattern of the resistivity drops suggests the occurrence of brittle vertical fractures zones which enhance the water percolation and produce the rock weathering. Several strike-slip faults with prevailing E-W trend were measured in the area (Fig. 7S), the same set is very well represented in the morpho-lineaments (Fig. 7C). Therefore, the fracture pattern revealed by the ERT is associated with the transcurrent structures widely mapped in the area. Thus, the entire subsurface along the Lapataia River is interpreted as a wide vertical fractured zone that affects the high resistive bedrock
(Fig. 10B), likely related to the E-W strike-slip fault system. The fault and fracture structures do not seem to affect the uppermost horizontal fringe of low resistivity.
5.1.3. Los Castores ProfileLos Castores (CA) electrical profile, 470 m long,
was acquired along a SE-NW section of the road to Lapataia Bay (Fig. 8). This ERT has an overall high electrical resistivity distribution; nevertheless, a vertical variation can be observed in the tomography (Fig. 11A), displaying lower resistive zones (1,000- 2,000 Ωm) at shallow levels and higher values at depth (3,000-5,000 Ωm), separated by a sharp horizontal contrast. Moreover, vertical resistivity contrasts can be recognized at distances of 160 m and 300 m along the profile.
The resistivity ranges of the deeper levels and the vertical discontinuities resemble the RLP section.
FIG. 10. A. Río Lapataia electrical resistivity tomography; B. Geologic cross-section interpreted from the resistivity model. The sub-vertical sharp resistivity contrast are evident along the section giving a pattern of alternating low and high resistivities interpreted as vertical fractures zones affeccting the Lapataia Formation basement rocks. The uppermost low resistive level does not seem to be inf luenced by this system. Drawing patterns are schematic. Dark grey areas indicate highly fractured zones. See location of the profile RLP in figure 8.

15Bran et al. / Andean Geology 45 (1): 1-34, 2018
The interpreted cross-section of profile CA display a set of fractured areas represented by the resistivity drops between the high resistive domains (Fig. 11B). Even though the profile is not perpendicular to the major lineaments, the resistivity distribution of RLP might be interpreted as an oblique slice depicting the subsurface continuation of the E-W structure mapped in the opposite margin of Lapataia Bay (Fig. 8). The exposures of Lapataia Formation schists, found a few meters west from the electrical section, and the equivalent electrical response in comparison with RLP profile support the assignment of the deeper resistive levels to that unit. The shallower levels, in turn, could represent the electrical response of the peat bog deposits that surround the section (Fig. 8).
5.2. Pipo River Zone
Three electrical resistivity profiles were carried out along the Pipo River valley. The Parques Nacionales profile (PN) was located in order to investigate the NW oriented lineament of Cañadón El Toro (Fig. 3) whereas the Golf (GO) was settled to characterize the E-W oriented valley. The Trocha profile (TR)
was designed to compare the resistivity values of the valley f loor obtained in the other two ERT’s.
5.2.1. Parques Nacionales ProfileThe 470 m long PN cross-section is oriented
obliquely to the NW-SE trending segment of Cañadón El Toro valley (Fig. 12). It follows a roadside between Susana Mount and an E-W elongated minor hill. This model shows a highly variable distribution of resistivity (Fig. 13A), with both vertical and horizontal sharp resistivity contrasts. The cross-section is subdivided into three east-dipping resistivity zones: a western, a central and an eastern zone. The western zone shows relatively intermediate resistivities (~500 Ωm) with local higher resistive bodies (800-1,000 Ωm). The central zone is characterized by low resistivity fields (<400 Ωm) which show displacements or sharp linear boundaries. The easternmost zone has intermediate resistivity values, with local high resistive zones, especially at the end of the cross-section with marked resistivity increase at depth.
Two striking features emerge from the electrical tomography. Firstly, the resistivity pattern consisting of east dipping domains, suggesting the presence of a
FIG. 11. A. Los Castores (CA) inverse model; B. Geologic cross-section interpreted from the resistivity model. The deepest resistive zone shows vertical resistivity drops associated with fracture zones in the bedrock. The drawing patterns are schematic. Dark grey areas depict highly fractured zones. See location of profile CA in figure 8.

16 Shallow architecture of Fuegian Andes lineaments based on Electrical Resistivity Tomography...
structural fabric related to the regional dècollement, recognized south of the Susana mount (Fig. 12). The second striking feature is the occurrence of notable vertical resistivity contrasts that act as boundaries of several resistivity sectors and also seem to cross-cut the more gently east-dipping contrasts. The orientation of the PN profile in relation to the Cañadón El Toro lineament, the crosscutting relationship and the structural field data supports the interpretation of the vertical resistivity pattern as a set of steeply dipping normal faults (Fig. 13B) likely associated with the NW oriented morphostructure (Fig. 12).
The lithological interpretation of the PN profile was constrained by the scarce outcrops found in the area (Fig. 12), which include rocks of Yahgán formation in addition with small exposures of mafic bodies recognized in the area and mapped by previous authors (González Guillot et al., 2016). This information and the resistivity ranges obtained along this and previous profiles, allows assigning the higher
resistivity domains to the mafic rocks, whereas the less resistive domains to the Yahgán formation slates. The lower resistivity values of the central domain might be due to a more intense deformation, given the larger number of structures, and/or the absence of mafic bodies within the rock package. The deeper eastern end of the ERT, show a remarkably low resistive sector that could correspond to water saturation of a highly fractured bedrock, controlled laterally and vertically by the structures described above.
5.2.2. Trocha ProfileThe Trocha cross-section (TR) runs parallel to
the NW trending segment of Pipo River (Fig. 12), along a dirt road, and has a length of 590 meters. The inverse model (Fig. 14A) shows horizontal layers whose resistivity decrease in depth. The highest resistivity values (1,500-2,500 Ωm) are found at the uppermost part of the tomography, forming a 10 m thick horizontal strip. Below, an intermediate
FIG. 12. Geological map of Pipo River survey area. In green are outlined the tracks of the ERT profiles carried out in this sector: Golf (GO), Parques Nacionales (PN), Trocha (TR). EB: Ensenada Bay. Contour line equidistance: 20 m. See figure 3, box B for location.

17Bran et al. / Andean Geology 45 (1): 1-34, 2018
FIG. 13. A. Parques Nacionales (PN) inverse model; B. Geologic cross-section interpreted from the resistivity model. A series of east dipping resistivity domains indicate superposition of rock packages along thrust faults. The vertical boundaries overprint the previous contrasts suggesting a later deformation stage. The drawing patterns are schematic. Dark grey areas depict the sector with a probably higher deformation level. See location of profile PN in figure 12.
FIG. 14. A. Trocha (TR) inverse model; B. Geologic cross-section interpreted from the resistivity model whithin a sequence of hori-zontal sedimentary sequence. A suspect fault is indicated by the deepening of the high resistive bedrock and the thickening of the interpreted Quaternary. The drawing patterns are schematic. See location of profile TR in figure 12.

18 Shallow architecture of Fuegian Andes lineaments based on Electrical Resistivity Tomography...
resistivity wedge-shaped zone (300-500 Ωm) thickens to the northwest. A thicker (>30 m) low resistivity layer (200-300 Ωm) lies beneath the previous ones. This low resistive domain becomes deeper towards the northwest.
The horizontal resistivity pattern indicates the presence of stratified materials in the subsurface. The uppermost f lat level was interpreted as a former peat bog (Fig. 14B); given the occurrence of several bogs in the vicinities and that these type of deposits are resistant to electrical current (Fig. 2). The wedge-shaped layer with intermediate resistivity could represent f luvial deposits, since they become thicker as the ERT approaches the Pipo River bed towards the NW (Fig. 12). These ranges of resistivities agree with the values attributed to this kind of deposits in other tomographies and with values reported in literature (Fig. 2). The underlying thick low resistivity layer might correspond to glacilacustrine sediments associated with post-glacial paleolake environments, developed in the intermountain valley (Coronato, 1991; Rabassa et al., 2000). In the deepest south-eastern part of the section a high resistivity zone (>500 Ωm), has been interpreted as the bedrock in depth. This resistivity domain does not appear further north,
suggesting the existence of a downthrown bedrock block in the NW, an interpretation also supported by the thickening of the lower resistive domain and the presence of normal faults in the area.
5.2.3. Golf ProfileThe nearly N-S Golf (GO) profile is located
downstream of the PN section (Fig. 12), it is 590 m long and extends across the E-W trending segment of Pipo River valley. The electrical profile crosses the river course between electrodes 30 and 31 (~300 m). The resulting inversion model (Fig. 15A) shows a stratified horizontal pattern with a vertical decrease in electrical resistivity. Two high resistive zones (1,400-2,500 Ωm) are located at the uppermost part of the section, between the 0-200 and 250-480 m. The deepest horizontal sector shows lower resistivity (40-150 Ωm) similar or even lower to those observed in TR cross-section.
The southern high resistive layer corresponds to a landfill made for levelling the ground in the railway station, whereas the northern resistive layer represents the unsaturated gravelly/sandy beds of the Pipo River alluvial plain. These modern f luvial sediments seem to be prograding towards the south
FIG. 15. A. Golf (GO) inverse model; B. Geologic cross-section derived from the resistivity model. Horizontal layered modern sequences were interpreted in this ERT, where no evidences of vertical structures have been determined. See figure 12 for location.

19Bran et al. / Andean Geology 45 (1): 1-34, 2018
over an intermediate resistive domain which could be indicating an older f luvial deposit. The lowest resistive values of the deeper level might correspond to glacilacustrine sediments, dominant environments in Fuegian valleys after glacier retreat. These values are in accordance with the resistivity domains registered in the TR profile (Fig. 14 A and B). In this case, however, there are no evidences of structures affecting the sedimentary sequences, at least for the uppermost 90 m.
5.3. Ushuaia Zone
The third subarea of geoelectrical survey is located just south of Ushuaia city, in the homonymous peninsula (UP, Fig. 3). Two ERT were carried out in this sector (Fig. 16), which are perpendicular to each other: the Peninsula profile (PU) and the Aeropuerto Viejo profile (AV).
5.3.1. Peninsula Ushuaia ProfileThe PU profile is 830 m long and has an E-W
orientation. The modeled ERT (Fig. 17A) shows a resistivity distribution with both vertical and horizontal variations, especially in the eastern segment. In this sector, several high resistive domains (>2,000 Ωm) at depth are separated by a vertical zone characterized by significantly lower resistivity values (~300 Ωm); shifts in the resistivity domains can also be recognized. The western sector displays high resistivity values at depth and lower values at shallower levels but there are neither vertical resistivity drops nor shifts of the resistivity fields.
The eastern low resistive domain and the resistivity vertical shifts located between 130 and 480 m coincide with the trace of a linear sag pond (Fig. 16). This suggest that the pattern observed in the ERT is due to the existence of a fault system in the subsurface, where the shifts in the resistivity domains ref lects its direct component, resulting in a downthrown block in the central part of the Ushuaia Peninsula, and the development of the surficial geomorphic feature. The resistive wedge-shape uppermost layer corresponds to a landfill deposit, located only above the area with resistivity offsets. The deeper high resistive zones might correspond to intrusive rocks of the Fuegian Batholith, which outcrops east of the ERT (Fig. 16), whereas lower resistive sectors were attributed to the meta-sedimentary rocks of Yahgán Formation Given the low resistivity values
of the latter and the proximity of the profile to the BC’s shoreline, we interpret the presence of saline waters invading the meta-sedimentary rocks. Furthermore, the lowest resistivity values are found in the central sector supporting the possibility of a higher fracturing degree of the bedrock, associated with the fault system.
5.3.2. Aeropuerto Viejo ProfileThe Aeropuerto Viejo cross-section has been
carried out along the margin of the former Ushuaia airport, now being the local aero club. The profile is oriented N-S and it is proximal to Beagle Channel shoreline (Fig. 16). In the inverse model (Fig. 18A) a superficial lent-form high resistivity zone (1,000 Ωm) was modeled at the top of the section. This horizontal layer truncates the underlying resistivity domain, which consists of several vertical sharp contacts delimiting a series of relatively conductive zones. Within the overall low resistivity of the deeper levels, a central zone with higher values (150 Ωm) can be distinguished from two less resistive zones (<30 Ωm) at both margins.
The shallow lent-form high resistive level coincides with surface exposures of glacial sediments; therefore this layer depicts the electrical response of poorly-sorted unsaturated till deposits (Fig. 18B). The deeper domain of this ERT shows lateral variability with sharp vertical contrasts which bound several low resistivity zones. The proximity of the ERT to the BC waters suggests that the low resistivity might be due to saline water saturation. Likewise, the vertical bounding contrasts could indicate permeability barriers or discontinuities within the subsurface inf luencing the degree of saturation. One interpretation for this resistivity domain could involve the occurrence of saturated glacilaustrine or glacif luvial deposits, but this would not be consistent with the horizontally layered pattern observed in the TR and GO sections for these types of deposits (Figs. 14 and 15 respectively). Moreover, the overlying lent-form deposit point out that the conductive domains are older than the tills. An alternative would be the existence of a highly invaded bedrock, in which the vertical boundaries ref lect faults and/or fractures zones. On the basis of the coastal outcrops, the resistivity ranges assigned to Yahgán Formation in other ERT, the stratigraphic relation with the tills and the vertical resistivity pattern, the latter interpretation involving a fractured Yahgán bedrock below the tills is favored (Fig. 18B).

20 Shallow architecture of Fuegian Andes lineaments based on Electrical Resistivity Tomography...
FIG. 16. Geological map of the Ushuaia Zone. In green are outlined the tracks of ERT profiles: Aeropuerto Viejo (AV) and Peninsula Ushuaia (PU). Note the peat bog in the central zone of the peninsula which crosscuts obliquely the airstrip of the Ushuaia Airport. Contour line equidistance: 10 m. See figure 3, box C for location.
FIG. 17. A. Peninsula Ushuaia (PU) inverse model; B. Geologic cross-section interpreted from the resistivity model. Several resistivity displacements in the central sector of the ERT have been interpreted as normal faults that cut and offset the bedrock in depth. The shallow resistive level between 100 and 480 m represents the landfill covering the small depression observed in the map. The drawing patterns are schematic. See location in figure 16.

21Bran et al. / Andean Geology 45 (1): 1-34, 2018
This fracture/fault related pattern can be in turn associated with the sub-vertical E-W structures widely recognized from the rock exposures of Yahgán Formation along the area (Fig. 7S).
6. Discussion
6.1. Contractional deformation in ERT
In spite the compressional Andean deformation stage was not the main objective of this work, which is thoroughly addressed in several contributions for the area (see Bruhn, 1979; Menichetti et al., 2007a, 2008; Klepeis et al., 2010; Torres Carbonell and Dimieri, 2013; Torres Carbonell et al., 2013, 2014), some issues can be outlined from the data here presented. The ductile deformation is well-developed in the basement and the Mesozoic rocks within the study area such as axial plane slaty cleavage, crenulation cleavage and folds (Fig. 3). However these structures are small-scale anisotropies, beyond the spatial resolution of the ERT’s configuration used in this survey.
The ERT was useful to discriminate the superposition of electrically different rock packages in the subsurface in the PN profile (Fig. 13A). Although the outcrop data shows a main group of compressive structures with NE vergence, consistent with the main trend of the regional structures of the
FTB, the orientation of the structures interpreted from the PN profile in the Pipo River zone (Fig. 13B) and the secondary population of reverse faults (Fig. 6R) support the existence of local west verging thrust associated with a folded dècollement surface mapped both to the south and north of the valley by Torres-Carbonell and Dimieri (2013).
6.2. Transtension and extension
The overprint of the compressive structures by brittle faults was observed both in the outcrop (Figs. 5 and 6A) and in the geophysical data (Fig. 13), as has been already recognized along the BC (Cunningham, 1993; Menichetti et al., 2004, 2008; Klepeis et al., 2010). The strike-slip structures have a principal E-W trend and a sinistral sense of movement with an extensional component, often associated with overall dip-slip E-W normal faults (Figs. 6S and D). This system is well-expressed in the topography of the area, mainly evidenced in the longitudinal BC basin and other smaller lineaments (Fig. 6H).
The ERT profiles that were carried out almost perpendicular to some E-W inland lineaments revealed quite similar electrical patterns, with sharp contrasts bounding vertical resistivity domains and resistivity drops that were interpreted as fractured zones within the bedrock.
FIG. 18. A. Aeropuerto Viejo inverse model; B. Geologic cross-section interpreted from the resistivity model. Several vertical resitivity contrasts bounding the different resistivity domains have been interpreted as fracture zones and faults within the bedrock, due to well developed transcurrent fault systems. The drawing patterns are schematic. See location in figure 16.

22 Shallow architecture of Fuegian Andes lineaments based on Electrical Resistivity Tomography...
In this sense, in the AV electrical tomography (Fig. 18) a set of vertical fractures and faults were outlined below the till deposits from sharp resistivity boundaries, some of them showing normal displacements. This system affects the south-dipping foliated rocks of Yahgán Formation and can be extrapolated westwards in plain view along the E-W segment of Pipo River linear valley (Fig. 19). Even though the Golf profile does not present evidence of such deformation, E-W oriented vertical fractures and faults were reported in the westernmost part of this valley affecting outcrops of Yahgán Formation and mafic units (Olivero et al., 1997; Tassone et al., 2010). Moreover, the southern segment of the RLP (Fig. 10) and the CA (Fig. 11) profiles, (located to the west), also displayed vertical fracture zones in the subsurface. Therefore, an entire E-W sub-vertical fractured corridor extending between the Ushuaia Bay and Lapataia Bays can also be interpreted from the geophysical view point (Fig. 19). In addition to the kinematic indicators of the vertical E-W structures
measured in the field, geophysics indicates that this corridor represents an inland secondary fault, here named the Pipo fault (Fig. 19), parallel to the major BCFS. This structure controlled the E-W orientation of the linear morphostructural valley.
A further well-developed fault system with prevailing dip-slip normal kinematics and NW strike (Fig. 7N) was recognized in the field affecting the basement rocks (Fig. 5) as well as the Mezosoic cover (Fig. 6A). This NW system has a significant morphological expression, revealed from the lineament frequency direction (Figs. 7H and C).
Resistivity patterns of the ERT’s perpendicular to some of these lineaments support the existence of such extensional structures in the subsurface. In this regard, in the LR profile carried out across the Roca Lake lineament (Fig. 9), the resistivity displacements were related to normal faults that cross-cut and offsets slightly resistive units attributed to the Lemaire Formation. This set of structures is analogous to the system of SW gently to moderate
FIG. 19. Geological map of the surveyed area showing the structures derived from both the field and the electrical profiles (in purple). The E-W corridor (Pipo fault) constitutes a straight fault segment of the BCFS.

23Bran et al. / Andean Geology 45 (1): 1-34, 2018
dipping normal faults recognized in the Ensenada bay to the south-east (Fig. 5).
A smaller linear morphology with a similar NW direction was identified in the Ushuaia Peninsula (Fig. 16). A linear sag pond was characterized in subsurface by resistivity patterns similar to those observed at the LR profile. The vertical displacements of resistivity domains suggest an extensional fault system (Fig. 17B), which offsets the bedrock units and controls the development of the small longitudinal basin observed at surface. Another NW oriented lineament, the Cañadón El Toro valley (Fig. 3), was investigated by the ERT method (Fig. 13). In this case the steeper contrasts are more comparable to those observed in the profiles perpendicularly oriented to the E-W system. Normal offsets were also interpreted from the ERT and can be associated with downthrown blocks observed in the western slope of Susana Mount (Fig. 19).
Therefore, the Roca Lake and Ushuaia bay can be considered as fault related morpho-structures controlled by gently to moderate dip-slip structures that converge obliquely to the main E-W strike-slip BCFS. The Cañadón El Toro is also an oblique structural morphology but in this case related to steeper normal structures.
As it comes out from the data, the NW oriented extensional system is well represented in the area but its relation with the BC system is not clear. From field observations, it could be noted that in some cases the NW normal faults cross-cut the E-W strike-slip faults, while, in others, they seem to be interrelated, controlling the development of morphologies observed at surface.
NW-SE oriented faults and fault systems have been reported elsewhere in Tierra del Fuego. Menichetti et al. (2007b) mapped several low angle normal faults in the eastern shore of Ushuaia bay, affecting the exposures of the igneous intrusive and the Yahgán Formation A parallel regional fault was identified in Moat bay, 100 km eastward of Ushuaia, controlling the development of middle Eocene to Miocene depocenters (Rossello et al., 2004). Even though the authors interpret a transpressional nature for such fault system, no kinematic data has been provided. To the west of the study area, along the WNW oriented northern arm of the BC, Dalziel and Brown (1989) report brittle fracturing and ductile shear zones overprinting the compressional fabric. The low-angle normal displacements have down-to
the-south sense of movement and have been related to a tectonic denudation of the Darwin Cordillera. Within the same area Klepeis et al. (2010) describe normal and oblique faults that cross cut all thrust faults. In their work, most of the mapped transtensional structures have a WNW to NW trend.
A graben-like depression controlled by NW-SE normal fault was reported north of Fagnano Lake (Lodolo et al., 2003). The Río Claro trough forms an angle of 130º with the E-W striking master MFFS fault (Fig. 1). This fault system was considered as a transverse fault which offsets the principal MFFS fault trace segment and separates two sub-basins of the Fagnano Lake. Within an overall strike slip setting, the transverse faults occur at an oblique angle with the principal strike-slip fault system, segmenting the main longitudinal pull-apart basins and often extending beyond its limits (Ben-Avraham and Ten Brink, 1989). A similar scenario to the Río Claro in the northern Fagnano Lake is proposed, in which the oblique transverse fault systems along the Roca Lake and related lineaments, with a prevailing extensional dip-slip movement, partitionate the fault strands of the BCFS system (Fig. 20). These faults developed between the Andorra and Río Pipo faults, in some cases extend beyond the limits of the major E-W faults.
The orientation of the oblique system seems to be inconsistent with the stress deformation model proposed for the BCFS by previous authors. Cunningham (1993) in his structural study of the brittle-ductile structures along the western arms of the BC reported an overall shortening axis oriented N40E for the strike-slip system. A similar conclusion was reached by Menichetti et al. (2008) working with paleo-stress axes. Their data show a combination of strike-slip (σ1 and σ3 horizontal, σ2 vertical) and extensional (σ2 and σ3 horizontal, σ1 vertical) stress regimes, resulting in an overall transtensional regime with a σ1 stress axis in the NE-SW direction (Menichetti et al., 2008, Fig. 13). The sinistral transtensional nature of the BCFS supports the existence of the southwards steeply dipping E-W fault, which would be associated with the development of the main longitudinal BC basin, as it has been shown for the Fagnano Lake further north (Lodolo et al., 2003; Esteban et al., 2014). The NW structures, however, seem to be located along otherwise contractional zones, but the data presented indicates the existence of extension rather

24 Shallow architecture of Fuegian Andes lineaments based on Electrical Resistivity Tomography...
than compression. We alternatively propose that the transverse faults may be controlled by preexisting structural anisotropies, related to the earlier contraction stage. To illustrate this, the principal compressive structures are represented in figure 20A, whereas the major transverse faults proposed are depicted in figure 20B. It can be noted that there exists a spatial correlation between the different structural styles, also evidenced in the mesostructure orientations (Figs. 7R, 7S and 7N). Even though it is still a matter of study, we propose that the highly oblique angle of the transverse faults respect to the BCFS could result from a transtensional reactivation of previous weakness zones. Some examples of transtensional reactivations of former compressive structures have been reported for several structures related to the MFFS (Klepeis and Austin, 1997; Lodolo et al.,
2003; Betka et al., 2016), supporting the hypothesis that the strike-slip system in the southernmost Tierra del Fuego is strongly controlled by the previous structural fabric.
6.3. Implications on deformation timing
The widely recognized crosscutting relationship indicates that compressional deformation predates the strike-slip and extensional structures. Shortening in the southernmost Andes took place at least in two stages (Klepeis et al., 2010), a pre 86 Ma event with obduction of oceanic f loor and high-grade metamorphism and a subsequent stage of hinterland exhumation by contractional uplift, that was constrained as pre middle-Eocene by means of thermochronometry (Gombosi et al., 2009), allowing
FIG. 20. A. Principal compressive structures of the study area, modified from Torres Carbonell et al. (2014); B. Oblique transverse faults developed between two fault strands of the major BCFS (this contribution).The oblique system seems to be governed by inherited structural anistropies that prompt the development of fault corridors along anomalous orientations.

25Bran et al. / Andean Geology 45 (1): 1-34, 2018
to infer that the subsequent strike-slip and extensional deformation stages postdate the middle-Eocene. In this sense, north of the BC area, the transcurrent deformation along the MFFS has been established to be the dominant phase since the Late Oligocene times (Klepeis and Austin, 1997; Lodolo et al., 2003) with a direct relation to the onset of Scotia seaf loor spreading. Some authors however have indicated that sinistral strike-slip deformation along the BC zone might have started prior to the Eocene, in reference to vertical rotations (Cunningham, 1993, 1995; Eagles, 2016) or transtensive emplacement of Late Cretaceous (ca. 70 Ma) igneous bodies (Mukasa and Dalziel, 1996; Peroni et al., 2009).
The geophysical data presented shows that the E-W fault system is truncated by modern deposits (Figs. 10B and 18B), whereas in the LR and PU profiles, across the NW oblique system (Figs. 9B and 17B), the depicted structures seem to control some small depressions filled with modern sediments. The fault related peat bog, developed across the Ushuaia Peninsula, is oblique to the main drainage direction of the area and has remarkably linear margins. Furthermore, even though in the ERT there are not evidences of internal deformation of the Quaternary sediments, the sub-vertical faults observed in figure 6B cross-cut unconsolidated gravels and sandy layers of glacif luvial origin. Hence, the geophysical data together with geomorphic evidence and the recognition of faults in modern sediments support the hypothesis of a post glacial deformation. Contributions regarding neotectonic activity along the Tierra del Fuego Island have been focused mainly in the central and northern sector, mostly devoted to the MFFS system (Bonorino et al., 2012; Menichetti et al., 2008; Perucca et al., 2015), however the data obtained in this study allows to suggest that the activity could be extended to the southern part of the Island.
7. Conclusions
The geophysical and outcrop data collected along the northern shore of the BC made possible the subsurface recognition of several structures covered by Quaternary sedimentation or dense forests.
The geophysical results here presented have supported the existence of west-vergent compressive deformation in the area of the Pipo River related to a highly strained dècollement structure. It was
also mapped the Pipo fault, an inland strand of the Beagle Channel Fault System, that extends parallel to the Channel’s main trend, characterized as steep dipping resistivity zones.
The NW trending lineaments, that have a strong morphological imprint, were characterized in the tomographies by resistivity offsets and moderate dipping resistivity contrasts. These, along with outcrop data, suggests that there exists an extensional control in the structural depressions that are oblique to the BCFS. It was proposed that such structures correspond to transverse faults that link and even segment two secondary faults systems of the BCFS. The results of this research support the idea that the orientation of the oblique faults might be the result of inherited structural corridors reactivated by transtensional deformation. Both geophysical and outcrop data suggest that the area could have undergone post-glacial deformation.
AcknowledgementsWe acknowledge those people who contributed to
the field work in Tierra del Fuego: J.L. Hormaechea, G. Connon, L. Barbero and C. Ferrer of the EARG for their support during the data acquisition in the field; Parques Nacionales of Argentina by providing facilities for the survey in the National Park of Tierra del Fuego. Funds of this study were partly provided by the CONICET PIP Nro. 112201101 00618 and the Agencia Nacional de Promoción Científica, Tecnológica y de Innovación PICT Nro. 2013-2236 and the Universidad de Buenos Aires. We are grateful for the thorough and constructive reviews made by J. Skármeta and K. Klepeis which greatly improved the original manuscript.
References
Barbeau, D.L.; Olivero, E.B.; Swanson-Hysell, N.L.; Zahid, K.M.; Murray, K.E.; Gehrels, G.E. 2009. Detrital-zircon geochronology of the eastern Magallanes foreland basin: Implications for Eocene kinematics of the northern Scotia Arc and Drake Passage. Earth and Planetary Science Letters 284 (3-4): 489-503.
Barker, P.F. 2001. Scotia Sea regional tectonic evolution: implications for mantle flow and palaeocirculation. Earth Sciences, Review 55: 1-39.
Ben-Avraham, Z.; Ten Brink, U. 1989. Transverse faults and segmentation of basins within the Dead Sea Rift. Journal of African Earth Sciences, Middle East 8: 603-616.

26 Shallow architecture of Fuegian Andes lineaments based on Electrical Resistivity Tomography...
Berge, M.A. 2014. Electrical resistivity tomography investigations on a paleoseismological trenching study. Journal of Applied Geophysics 109: 162-174.
Betka, P.; Klepeis, K.; Mosher, S. 2016. Fault kinematics of the Magallanes-Fagnano fault system, southern Chile an example of diffuse strain and sinistral transtension along a continental transform margin. Journal of Structural Geology 85: 130-153.
Bonorino, G.G.; Rinaldi, V.; del Valle Abascal, L.; Alvarado, P.; Bujalesky, G.G.; Güell, A. 2012. Paleoseismicity and seismic hazard in southern Patagonia (Argentina-Chile; 50°-55°S) and the role of the Magallanes- Fagnano transform fault. Natural Hazards 61 (2): 337-349.
Bruhn, R.L. 1979. Rock structures formed during back-arc basin deformation in the Andes of Tierra del Fuego. Geological Society of America Bulletin 90 (11): 998-1012.
Calderón, M.; Fildani, A.; Hervé, F.; Fanning, C.M.M.; Weislogel, A.; Cordani, U. 2007. Late Jurassic bimodal magmatism in the northern sea-floor remnant of the Rocas Verdes basin, southern Patagonian Andes. Journal of the Geological Society 164 (5): 1011-1022.
Calderón, M.; Fosdick, J.C.; Warren, C.; Massonne, H.-J.; Fanning, C.M.; Cury, L.F.; Schwanethal, J.; Fonseca, P.E.; Galaz, G.; Gaytán, D.; Hervé, F. 2012. The low-grade Canal de las Montañas Shear Zone and its role in the tectonic emplacement of the Sarmiento Ophiolitic Complex and Late Cretaceous Patagonian Andes orogeny, Chile. Tectonophysics 524-525: 165-185.
Calderón, M.; Prades, C.F.; Hervé, F.; Avendaño, V.; Fanning, C.M.; Massonne, H.-J.; Theye, T.; Simonetti, A. 2013. Petrological vestiges of the Late Jurassic-Early Cretaceous transition from rift to back-arc basin in southernmost Chile: New age and geochemical data from the Capitán Aracena, Carlos III, and Tortuga ophiolitic complexes. Geochemical Journal 47 (2): 201-217.
Caminos, R. 1980. Cordillera fueguina. In Geología Regional Argentina. Academia Nacional de Ciencias de Córdoba 2: 1463-1501.
Caputo, R.; Piscitelli, S.; Oliveto, A.; Rizzo, E.; Lapenna, V. 2003. The use of electrical resistivity tomographies in active tectonics: Examples from the Tyrnavos Basin, Greece. Journal of Geodynamics 36 (1-2): 19-35.
Colella A.; Lapenna, V.; Rizzo, E. 2004. High-resolution imaging of the High Agri Valley Basin (Southern Italy) with electrical resistivity tomography. Tectonophysics 386 (1-2): 29-40.
Comas, X.; Slater, L.; Reeve, A. 2004. Geophysical evidence for peat basin morphology and stratigraphic controls on vegetation observed in a Northern Peatland. Journal of Hydrology 295 (1-4): 173-184.
Coronato, A.M. 1991. Cuerpos glacilacustres en la deglaciación del Holoceno temprano en valles de los Andes Fueguinos. Biología Acuática 15: 16-17.
Cunningham, W.D. 1993. Strike-slip faults in the southernmost Andes and the development of the Patagonian orocline. Tectonics 12 (1): 169-186.
Cunningham, W.D. 1995. Orogenesis at the southern tip of the Americas: the structural evolution of the Cordillera Darwin metamorphic complex, southernmost Chile. Tectonophysics 244 (4): 197-229.
Dahlin, T.; Zhou, B. 2004. A numerical comparison of 2D resistivity imaging with 10 electrode arrays. Geophysical Prospecting 52 (5): 379-398.
Dalziel, I.W.D. 1981. Back-arc extension in the southern Andes: a review and critical reappraisal. Philosophical Transactions of the Royal Society of London 300: 319-335.
Dalziel, I.W.D.; Brown, R.L. 1989. Tectonic denudation of the Darwin metamorphic core complex in the Andes of Tierra del Fuego, southernmost Chile: Implications for Cordilleran orogenesis. Geology 17 (8): 699-703.
Dalziel, I.W.; de Wit, M.J.; Palmer, K.F. 1974. Fossil marginal basin in the southern Andes. Nature 250: 291-294.
Eagles, G. 2016. Plate kinematics of the Rocas Verdes Basin and Patagonian orocline. Gondwana Research 37: 98-109.
Esteban, F.; Bran, D.; Santomauro, M.G.; Tassone, A.; Menichetti, M.; Lodolo, E.; Lippai, H.; Vilas, J.F. 2013. The structures of the Peninsula Ushuaia in the Beagle Channel. Rendiconti Online Societa Geologica Italiana 29: 43-46.
Esteban, F.D.; Tassone, A.; Lodolo, E.; Menichetti, M.; Lippai, H.; Waldmann, N.; Darbo, A.; Baradello, L.; Vilas, J.F. 2014. Basement geometry and sediment thickness of Lago Fagnano (Tierra del Fuego). Andean geology 41 (2): 293-313. doi: 10.5027/andgeoV41n2-a02.
Fazzito, S.Y.; Rapalini, A.E.; Cortés, J.M.; Terrizzano, C.M. 2009. Characterization of Quaternary faults by electric resistivity tomography in the Andean Precordillera of Western Argentina. Journal of South American Earth Sciences 28 (3): 217-228.
Fildani, A.; Hessler, A.M. 2005. Stratigraphic record across a retroarc basin inversion: Rocas Verdes-Magallanes Basin, Patagonian Andes, Chile. Bulletin

27Bran et al. / Andean Geology 45 (1): 1-34, 2018
of the Geological Society of America 117 (11-12): 1596-1614.
Galli, P.A.C.; Giocoli, A.; Peronace, E.; Piscitelli, S.; Quadrio, B.; Bellanova, J. 2013. Integrated near surface geophysics across the active Mount Marzano Fault System (southern Italy): seismogenic hints. International Journal of Earth Sciences 103 (1): 315-325.
Ghiglione, M.C.; Ramos, V.A. 2005. Progression of deformation and sedimentation in the southernmost Andes. Tectonophysics 405 (1-4): 25-46.
Ghiglione, M.C.; Quinteros, J.; Yagupsky, D.; Bonillo-Martínez, P.; Hlebszevtich, J.; Ramos, V.A.; Vergani, G.; Figueroa, D.; Quesada, S.; Zapata, Y.T. 2010. Structure and tectonic history of the foreland basins of southernmost South America. Journal of South American Earth Sciences 29 (2): 262-277.
Ghiglione, M.C.; Navarrete-Rodríguez, A.T.; González-Guillot, M.; Bujalesky, G. 2013. The opening of the Magellan Strait and its geodynamic implications. Terra Nova 25: 13-20.
Gombosi, D.J.; Barbeau, Jr., D.L.; Garver, J.I. 2009. New thermochronometric constraints on the rapid Palaeogene exhumation of the Cordillera Darwin complex and related thrust sheets in the Fuegian Andes. Terra Nova 21: 507-515.
González-Guillot, M.; Urraza, I.; Acevedo, R.D.; Escayola, M. 2016. Magmatismo básico Jurásico-Cretácico en los Andes Fueguinos y relación con la cuenca marginal Rocas Verdes. Revista de la Asociación Geológica Argentina 73 (1): 1-22.
Hervé, F.; Pankhurst, R.J.; Fanning, C.M.; Calderón, M.; Yaxley, G.M. 2007. The South Patagonian batholith: 150 my of granite magmatism on a plate margin. Lithos 97 (3-4): 373-394.
Hervé, M.; Suárez, M.; Puig, A. 1984. The Patagonian Batholith S of Tierra del Fuego, Chile: timing and tectonic implications. Journal of the Geological Society 141 (5): 909-917.
Klepeis, K. 1994. The Magallanes and Deseado fault zones: Major segments of the South American-Scotia transform plate boundary in southernmost South America, Tierra del Fuego. Journal of Geophysical Research 99 (B11): 22001-22014.
Klepeis, K.; Austin, J.A. 1997. Contrasting styles of superposed deformation in southernmost Andes. Journal of Geophysical Research: Solid Earth 99 (B11): 22001-22014.
Klepeis, K.; Betka, P.; Clarke, G.; Fanning, M.; Hervé, F.; Rojas, L.; Mpodozis, C.; Thomson, S. 2010. Continental underthrusting and obduction during the
Cretaceous closure of the Rocas Verdes rift basin, Cordillera Darwin, Patagonian Andes. Tectonics 29 (3): TC3014. doi: 10.1029/2009TC002610.
Kohn, M.J.; Spear, F.S.; Harrison, T.M.; Dalziel, I.W.D. 1995. 40Ar/39Ar geochronology and P-T-t paths from the Cordillera Darwin metamorphic complex, Tierra del Fuego, Chile. Journal of Metamorphic Geology 13 (2): 251-270.
Lodolo, E.; Menichetti, M.; Bartole, R.; Ben-Avraham, Z.; Tassone, A.; Lippai, H. 2003. Magallanes-Fagnano continental transform fault (Tierra del Fuego, southernmost South America). Tectonics 22 (6): 1076. doi: 10.1029/2003TC001500.
Lodolo, E.; Lippai, H.; Tassone, A.; Zanolla, C.; Menichetti, M.; Hormaechea, J.L. 2007. Gravitiy map of the Isla Grande de Tierra del Fuego, and morphology of Lago Fagnano. Geologica Acta 4: 307-314.
Loke, M.H. 2004. Tutorial: 2-D and 3-D electrical imaging surveys. Geotomo Software.
Maillet, G.M.; Rizzo, E.; Revil, A.; Vella, C. 2005. High resolution Electrical Resistivity Tomography (ERT) in a transition zone environment: Application for detailed internal architecture and infilling processes study of a Rhône River paleo-channel. Marine Geophysical Researches 26 (2-4): 317-328.
Menichetti, M.; Acevedo, R.; Bujalesky, G.; Cenni, M.; Cerredo, M.E.; Coronato, A.M.; Hormachea, J.L.; Lippai, H.; Lodolo, E.; Olivero, E.B.; Rabassa, J.; Russi, M.; Tassone, A. 2004. Geology and Geophysics of Isla Grande de Tierra del Fuego. Geosur Field-Trip Guide 1-39.
Menichetti, M.; Lodolo, E.; Tassone, A.; Hormaechea, J.L.; Lippai, H. 2007a. Geologia dell’area del Lago Fagnano in Terra del Fuoco (Sud America). Rendiconti Online Società Geologica Italiana 4: 251-254.
Menichetti, M.; Tassone, A.; Peroni, J. 2007b. Assetto strutturale, petrografia e geofisica della Bahía Ushuaia-Argentina. Rendiconti della Societá Geologica Italiana 4: 259-262.
Menichetti, M.; Lodolo, E.; Tassone, A. 2008. Structural geology of the Fuegian Andes and Magallanes fold-and-thrust belt-Tierra del Fuego Island. Geologica Acta 6 (1): 19-42.
Mukasa, S.B.; Dalziel, I.W.D. 1996. Southernmost Andes and South Georgia Island, North Scotia Ridge: Zircon U-Pb and muscovite 40Ar/39Ar age constraints on tectonic evolution of Southwestern Gondwanaland. Journal of South American Earth Sciences 9 (5): 349-365.
Nelson, E.P. 1982. Post-tectonic uplift of the Cordillera Darwin orogenic core complex: evidence from fission
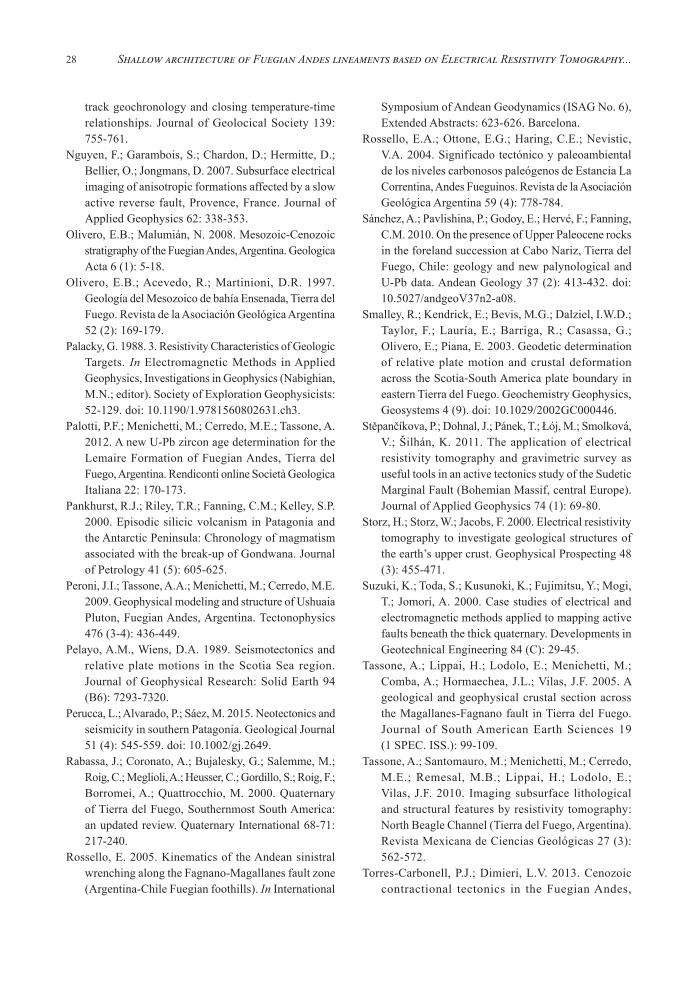
28 Shallow architecture of Fuegian Andes lineaments based on Electrical Resistivity Tomography...
track geochronology and closing temperature-time relationships. Journal of Geolocical Society 139: 755-761.
Nguyen, F.; Garambois, S.; Chardon, D.; Hermitte, D.; Bellier, O.; Jongmans, D. 2007. Subsurface electrical imaging of anisotropic formations affected by a slow active reverse fault, Provence, France. Journal of Applied Geophysics 62: 338-353.
Olivero, E.B.; Malumián, N. 2008. Mesozoic-Cenozoic stratigraphy of the Fuegian Andes, Argentina. Geologica Acta 6 (1): 5-18.
Olivero, E.B.; Acevedo, R.; Martinioni, D.R. 1997. Geología del Mesozoico de bahía Ensenada, Tierra del Fuego. Revista de la Asociación Geológica Argentina 52 (2): 169-179.
Palacky, G. 1988. 3. Resistivity Characteristics of Geologic Targets. In Electromagnetic Methods in Applied Geophysics, Investigations in Geophysics (Nabighian, M.N.; editor). Society of Exploration Geophysicists: 52-129. doi: 10.1190/1.9781560802631.ch3.
Palotti, P.F.; Menichetti, M.; Cerredo, M.E.; Tassone, A. 2012. A new U-Pb zircon age determination for the Lemaire Formation of Fuegian Andes, Tierra del Fuego, Argentina. Rendiconti online Società Geologica Italiana 22: 170-173.
Pankhurst, R.J.; Riley, T.R.; Fanning, C.M.; Kelley, S.P. 2000. Episodic silicic volcanism in Patagonia and the Antarctic Peninsula: Chronology of magmatism associated with the break-up of Gondwana. Journal of Petrology 41 (5): 605-625.
Peroni, J.I.; Tassone, A.A.; Menichetti, M.; Cerredo, M.E. 2009. Geophysical modeling and structure of Ushuaia Pluton, Fuegian Andes, Argentina. Tectonophysics 476 (3-4): 436-449.
Pelayo, A.M., Wiens, D.A. 1989. Seismotectonics and relative plate motions in the Scotia Sea region. Journal of Geophysical Research: Solid Earth 94 (B6): 7293-7320.
Perucca, L.; Alvarado, P.; Sáez, M. 2015. Neotectonics and seismicity in southern Patagonia. Geological Journal 51 (4): 545-559. doi: 10.1002/gj.2649.
Rabassa, J.; Coronato, A.; Bujalesky, G.; Salemme, M.; Roig, C.; Meglioli, A.; Heusser, C.; Gordillo, S.; Roig, F.; Borromei, A.; Quattrocchio, M. 2000. Quaternary of Tierra del Fuego, Southernmost South America: an updated review. Quaternary International 68-71: 217-240.
Rossello, E. 2005. Kinematics of the Andean sinistral wrenching along the Fagnano-Magallanes fault zone (Argentina-Chile Fuegian foothills). In International
Symposium of Andean Geodynamics (ISAG No. 6), Extended Abstracts: 623-626. Barcelona.
Rossello, E.A.; Ottone, E.G.; Haring, C.E.; Nevistic, V.A. 2004. Significado tectónico y paleoambiental de los niveles carbonosos paleógenos de Estancia La Correntina, Andes Fueguinos. Revista de la Asociación Geológica Argentina 59 (4): 778-784.
Sánchez, A.; Pavlishina, P.; Godoy, E.; Hervé, F.; Fanning, C.M. 2010. On the presence of Upper Paleocene rocks in the foreland succession at Cabo Nariz, Tierra del Fuego, Chile: geology and new palynological and U-Pb data. Andean Geology 37 (2): 413-432. doi: 10.5027/andgeoV37n2-a08.
Smalley, R.; Kendrick, E.; Bevis, M.G.; Dalziel, I.W.D.; Taylor, F.; Lauría, E.; Barriga, R.; Casassa, G.; Olivero, E.; Piana, E. 2003. Geodetic determination of relative plate motion and crustal deformation across the Scotia-South America plate boundary in eastern Tierra del Fuego. Geochemistry Geophysics, Geosystems 4 (9). doi: 10.1029/2002GC000446.
Stěpančíkova, P.; Dohnal, J.; Pánek, T.; Łój, M.; Smolková, V.; Šilhán, K. 2011. The application of electrical resistivity tomography and gravimetric survey as useful tools in an active tectonics study of the Sudetic Marginal Fault (Bohemian Massif, central Europe). Journal of Applied Geophysics 74 (1): 69-80.
Storz, H.; Storz, W.; Jacobs, F. 2000. Electrical resistivity tomography to investigate geological structures of the earth’s upper crust. Geophysical Prospecting 48 (3): 455-471.
Suzuki, K.; Toda, S.; Kusunoki, K.; Fujimitsu, Y.; Mogi, T.; Jomori, A. 2000. Case studies of electrical and electromagnetic methods applied to mapping active faults beneath the thick quaternary. Developments in Geotechnical Engineering 84 (C): 29-45.
Tassone, A.; Lippai, H.; Lodolo, E.; Menichetti, M.; Comba, A.; Hormaechea, J.L.; Vilas, J.F. 2005. A geological and geophysical crustal section across the Magallanes-Fagnano fault in Tierra del Fuego. Journal of South American Earth Sciences 19 (1 SPEC. ISS.): 99-109.
Tassone, A.; Santomauro, M.; Menichetti, M.; Cerredo, M.E.; Remesal, M.B.; Lippai, H.; Lodolo, E.; Vilas, J.F. 2010. Imaging subsurface lithological and structural features by resistivity tomography: North Beagle Channel (Tierra del Fuego, Argentina). Revista Mexicana de Ciencias Geológicas 27 (3): 562-572.
Torres-Carbonell, P.J.; Dimieri, L.V. 2013. Cenozoic contractional tectonics in the Fuegian Andes,

29Bran et al. / Andean Geology 45 (1): 1-34, 2018
southernmost South America: a model for the transference of orogenic shortening of the foreland. Gelogica Acta 11 (3): 359-370.
Torres-Carbonell, P.J.; Dimieri, L.V.; Martinioni, D.R. 2013. Early foreland deformation of the Fuegian Andes (Argentina): Constraints from the strain analysis of Upper Cretaceous-Danian sedimentary rocks. Journal of Structural Geology 48: 14-32.
Torres-Carbonell, P.J.; Dimieri, L.V.; Olivero, E.B.; Bohoyo, F.; Galindo-Zaldívar, J. 2014. Structure and tectonic evolution of the Fuegian Andes (southernmost South America) in the framework of the Scotia Arc development. Global and Planetary Change 123: 174-188.
Torres-Carbonell, P.J.; Olivero, E.B.; Dimieri, L.V. 2008a. Structure and evolution of the Fuegian Andes foreland thrust-fold belt, Tierra del Fuego, Argentina: Paleogeographic implications. Journal of South American Earth Sciences 25: 417-439.
Torres-Carbonell, P.J.; Olivero, E.B.; Dimieri, L. V. 2008b. Control en la magnitud de desplazamiento de rumbo del Sistema Transformante Fagnano, Tierra del Fuego, Argentina. Revista Geológica de Chile 35 (1): 63-77. doi: 10.5027/andgeoV35n1-a03.
Zanolla, C.; Lodolo, E.; Lippai, H.; Tassone, A.; Menichetti, M.; Baradello, L.; GrossI, M.; Hormaechea, H.L. 2011. Bathy-metric map of lago fagnano (Tierra del Fuego Island). Bollettino di Geofisica Teorica ed Applicata 52 (1): 1-8.
Manuscript received: October 21, 2016; revised/accepted: July 19, 2017; available online: October 2, 2017.Editorial handling: Jorge Skármeta.

30 Shallow architecture of Fuegian Andes lineaments based on Electrical Resistivity Tomography...
Appendix
Measured Pseudo-sections and Models
A brief description of each surveyed pseudo-section is presented below along with the selected model that best fits the measured values and that better relates with the local geology.
The Lago Roca (LR) profile is 470 m long with a total of 548 quadrupoles of measurement. After the application of the bad data filter, the number of remaining data points was of 534. The measured and calculated pseudo-sections (Fig. 1 appendix A and B) show a good correlation, both displaying a stratified resistivity pattern which decreases in value with depth. The inverse model presented in figure 1C appendix was achieved after 5 iterations by means of the robust constraint inversion, with a resulting RMS value of 3.3%.
The Rio Lapataia (RLP) profile is 830 m long requiring for its acquisition one entire sequence of measurements and 3 roll-along sequences. Both measured and calculated pseudo-sections, presented in figures 2A and 2B appendix, show fairly similar resistivity distributions, with a high resistivity vertical sector between 480 and 640 m and a nearly horizontal stratified distribution at both sides. The figure 2C appendix shows the electrical resistivity tomography obtained from the measured pseudo-section using the robust constraint model, which involved 3 iterations and gave a RMS of 6.34%.
FIG. 1. Resistivity distributions along Lago Roca (LR) profile. A. Measured apparent resistivity pseudo-section; B. Calculated apparent resistivity pseudo-section; C. Inverse model of resistivity distribution. See figure 8 for location.
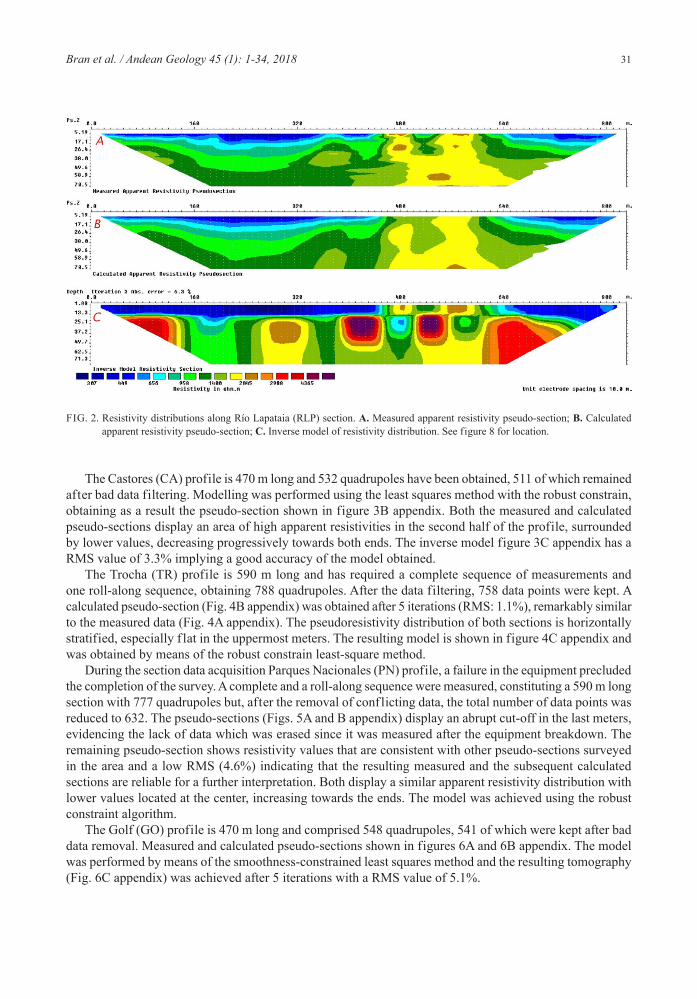
31Bran et al. / Andean Geology 45 (1): 1-34, 2018
The Castores (CA) profile is 470 m long and 532 quadrupoles have been obtained, 511 of which remained after bad data filtering. Modelling was performed using the least squares method with the robust constrain, obtaining as a result the pseudo-section shown in figure 3B appendix. Both the measured and calculated pseudo-sections display an area of high apparent resistivities in the second half of the profile, surrounded by lower values, decreasing progressively towards both ends. The inverse model figure 3C appendix has a RMS value of 3.3% implying a good accuracy of the model obtained.
The Trocha (TR) profile is 590 m long and has required a complete sequence of measurements and one roll-along sequence, obtaining 788 quadrupoles. After the data filtering, 758 data points were kept. A calculated pseudo-section (Fig. 4B appendix) was obtained after 5 iterations (RMS: 1.1%), remarkably similar to the measured data (Fig. 4A appendix). The pseudoresistivity distribution of both sections is horizontally stratified, especially f lat in the uppermost meters. The resulting model is shown in figure 4C appendix and was obtained by means of the robust constrain least-square method.
During the section data acquisition Parques Nacionales (PN) profile, a failure in the equipment precluded the completion of the survey. A complete and a roll-along sequence were measured, constituting a 590 m long section with 777 quadrupoles but, after the removal of conflicting data, the total number of data points was reduced to 632. The pseudo-sections (Figs. 5A and B appendix) display an abrupt cut-off in the last meters, evidencing the lack of data which was erased since it was measured after the equipment breakdown. The remaining pseudo-section shows resistivity values that are consistent with other pseudo-sections surveyed in the area and a low RMS (4.6%) indicating that the resulting measured and the subsequent calculated sections are reliable for a further interpretation. Both display a similar apparent resistivity distribution with lower values located at the center, increasing towards the ends. The model was achieved using the robust constraint algorithm.
The Golf (GO) profile is 470 m long and comprised 548 quadrupoles, 541 of which were kept after bad data removal. Measured and calculated pseudo-sections shown in figures 6A and 6B appendix. The model was performed by means of the smoothness-constrained least squares method and the resulting tomography (Fig. 6C appendix) was achieved after 5 iterations with a RMS value of 5.1%.
FIG. 2. Resistivity distributions along Río Lapataia (RLP) section. A. Measured apparent resistivity pseudo-section; B. Calculated apparent resistivity pseudo-section; C. Inverse model of resistivity distribution. See figure 8 for location.

32 Shallow architecture of Fuegian Andes lineaments based on Electrical Resistivity Tomography...
FIG. 3. Resistivity distributions along Los Castores (CA) profile. A. Measured apparent resistivity pseudo-section; B. Calculated apparent resistivity pseudo-section; C. Inverse model of resistivity distribution. See figure 8 for location.
FIG. 4. Resistivity distributions along Trocha (TR) profile. A. Measured apparent resistivity pseudo-section; B. Calculated apparent resistivity pseudo-section; C. Inverse model of resistivity distribution. See figure 12 for location.

33Bran et al. / Andean Geology 45 (1): 1-34, 2018
The Peninsula Ushuaia (PU) electrical section is 830 m long, involving a complete sequence and 3 roll-along. As a result, 1,267 quadrupoles were measured, 1,206 of which remained after the erroneous data removal. The robust constraint inversion method with 5 iterations resulted in the model presented in figure 7B appendix. The measured and calculated pseudo-sections are remarkably similar and the deviation is low (RMS: 2.5%). The apparent resistivity fields are quite homogeneous in the first half of the section, whereas they are arranged in sub-horizontal stripes in the second half; both higher and lower values are found at the top.
FIG. 5. Resistivity distributions along Parques Nacionales (PN) profile. A. Measured apparent resistivity pseudo-section; B. Calculated apparent resistivity pseudo-section; C. Inverse model of resistivity distribution. See figure 12 for location.
FIG. 6. Resistivity distribution along the Golf (GO) section. A. Measured apparent resistivity pseudo-section; B. Calculated apparent resistivity pseudo-section; C. Inverse model of resistivity distribution. See figure 12 for location.

34 Shallow architecture of Fuegian Andes lineaments based on Electrical Resistivity Tomography...
The last surveyed profile, the Aeropuerto Viejo (AV), is 830 m long, involves 1,680 quadrupoles and has required one complete sequence and five roll-along extensions. After data filtering, 1,573 quadrupoles were kept. The robust constraint inversion method resulted in the calculated pseudo-section and the subsequent electrical resistivity tomography model presented in figures 8B appendix, achieved after 4 iterations (RMS: 2.5%).
FIG. 7. Resistivity distributions along Peninsula Ushuaia profile. A. Measured apparent resistivity pseudo-section; B. Calculated apparent resistivity pseudo-section; C. Inverse model of resistivity distribution. See figure 16 for location.
FIG. 8. Resistivity distributions along Aeropuerto Viejo (AV) profile. A. Measured apparent resistivity pseudo-section; B. Calculated apparent resistivity pseudo-section; C. Inverse model of resistivity distribution. See figure 16 for location.