Shalimar (Malay) PLC - Carson Cumberbatch PLC of the Directors Notes to the Financial Statements7...
84
Shalimar (Malay) PLC Annual Report | 2014/15
Transcript of Shalimar (Malay) PLC - Carson Cumberbatch PLC of the Directors Notes to the Financial Statements7...

Shalimar (Malay) PLCAnnual Report | 2014/15

ContentsChairman’s Statement 1
Review of Industry and Operational Performance 3
Risk Management 5
Profile of the Directors 7
Statement of Directors’ Responsibilities 10
Annual Report of the Board of Directors
on the Affairs of the Company 11
Audit Committee Report 20
Financial Reports
Independent Auditors’ Report 23
Statement of Profit or Loss 24
Statement of Comprehensive Income 25
Statement of Financial Position 26
Statement of Changes in Equity 27
Cash Flow Statement 28
Notes to the Financial Statements 29
Five Year Summary 61
Statement of Value Added 63
US$ Financials 64
Information to Shareholders and Investors 71
Glossary of Financial Terms 74
Notice of Meeting 76
Notes 77
Form of Proxy 79
Corporate Infomation IBC
Financial Calendar
Financial Year End 31st March 2015
Announcement of Results
First Quarter ended 30th June 2014 14th August 2014
Second Quarter ended 30th September 2014 14th November 2014
Third Quarter ended 31st December 2014 13th February 2015
Dividend Declaration
First & Final* 29th May 2015
106th Annual General Meeting 29th May 2015
* Subject to approval from Shareholders

Annual Report 2014/15
1
Chairman’s Statement
Dear Shareholders,
On behalf of the Board of Directors, I am
pleased to present the Annual Report and
Audited Financial Statements of Shalimar
(Malay) PLC for the year ended 31st
March 2015, and welcome you to the One
Hundred and Sixth Annual General Meeting
of the Company.
The year under review turned out to be a
challenging one for companies operating
in the Palm Oil industry. The year started
off on a positive note for the industry,
however prices of Crude Palm Oil (CPO)
started to drop as the year progressed,
reaching a 5 year low, trading below RM
2,000 in September 2014. One of the main
reasons for the downward movement in
Palm Oil prices was the bumper crops
witnessed in competing oils like Soybean
and Sunflower. Further, the drop in crude
oil prices towards the latter part of 2014,
exerted downward pressure on CPO prices
given the impact on the viability of palm
based bio-diesel.
The production of Fresh Fruit Bunches
(FFB) too was affected by biological
factors and weather patterns, reflecting
similar trends witnessed in the vicinity
to our plantations. However, we expect
the cropping pattern to recover in the
coming year as majority of the Company’s
plantations are still within the peak
production period. Further details on the
production and the related initiatives being
undertaken is provided in the Review of
Operations presented together with this
report.
Resultantly, your Company recorded a
profit before tax of Rs. 92.25 mn for the
year ended 31st March 2015, after taking
into consideration other income and gains,
as compared to Rs. 248 mn recorded in the
year to 31st March 2014. The Company did
not receive a dividend income from its long
term investment during the period under
review. Accordingly, the net profit after tax
for the period under review was Rs. 66.20
mn as compared to Rs. 211.35 mn recorded
in the previous financial year.
We expect the Palm Oil prices to trade
at around current levels and stabilise
towards the end of the year, in line with
forecasts made by industry analysts.
We have also been able to manage the
cost of production through stringent
cost management initiatives and through
focus on improving the field management
practices.
I would like to clarify the stand taken by the
Company on “Rules on Minimum Public
Float as a Continuous Listing Requirement”
issued by the Colombo Stock Exchange of
Sri Lanka (CSE), which was explained in my
review last year.
The new listing rules pertaining to
the “Public Float” mandates all listed
companies to ensure a minimum threshold
of 20% to be held by “Public” shareholders
effective from 1st January 2014. However,
on this date if a Company does not fulfil this
requirement, such Company is expected to
be fully compliant by 31st December 2016.

Shalimar (Malay) PLC
2
In that context, I would like to highlight
the objective of the Voluntary Offer to all
shareholders that was carried out by the
Company in March 2011. As was explained
in the detailed documents that were
circulated together with the Voluntary
Offer documents, the objective of the
Offer was to consolidate the ownership of
your Company under the plantation sector
Holding Company, viz, Goodhope Asia
Holdings Ltd.
However, since the Voluntary Offer did
not result in the acquisition of the entirety
of the balance minority shareholding, the
Company continued to remain a listed
entity, with a ‘Public Float’ of less than that
is now required by the above Rule.
As you would appreciate, compliance with
the above CSE Rule would conflict with the
very objective of the aforesaid Voluntary
Offer.
Thus, as was explained in the previous
year’s review taking into consideration
these factors and more importantly the
objective of the Voluntary Offer exercise
carried out in the past, the majority
shareholder does not have any intention of
diluting its holding nor does the Company
intend to issue further shares in order
to conform to the said Rule. This would
therefore entail the initiation of a de-listing
process. When so decided, this would be
done in consultation with the Regulator
and with the required shareholder
approval.
Shalimar (Malay) PLC (Shalimar Estate)
received the “MPOI Award” from the
Malaysian Palm Oil Board (MPOB) for the
year 2013/14 as the best estate (Peninsular
Malaysia) in the category of land extent
between 40.47 Ha to 499 Ha. The award
was presented by the Minister of Plantation
Industries and Commodities.
I would like to take this opportunity
to extend my gratitude to all business
associates, financiers, and the regulatory
authorities in Sri Lanka and Malaysia
for their continued support. I would be
failing in my duties if I don’t extend the
appreciation of the Board of Directors of
the Company to the shareholders for their
continued support and confidence placed
in the Directors. I also wish to thank our
management and staff in Malaysia and
Sri Lanka for all their hard work and
dedication. Last but not least, I would like
to extend my appreciation to my fellow
Board Members for their support and
guidance throughout the year, and to
the members of the Audit Committee,
and Remuneration Committee for their
invaluable efforts.
(Sgd.)
H. SelvanathanChairman
23rd April 2015
Chairman’s Statement

Annual Report 2014/15
3
Palm Oil Industry Scenario
Despite the positive expectations on CPO
price movements for the current Financial
year, CPO prices have been very volatile
during most part of the current Financial
year and have traded below the expected
price ranges. CPO prices fell below RM
2,000 levels, touching a 5 year low in
September 2014, though the prices rallied
thereafter.
One of the main reasons for the prices to be
lower than the expectations at the beginning
of the Financial year was the materialisation
of bumper Soybean crop driving Soy Oil
prices down. Sunflower Oil production
too continued to be strong supported by
favourable weather conditions in producing
countries. The decline in global crude oil
prices too had an impact on the CPO prices,
as the demand for Palm Oil based bio-diesel
is impacted given relatively lower crude oil
price regime.
CPO prices will continue to be affected
by seasonal factors like production and
inventory levels in both Malaysia and
Indonesia. However, current expectation
by Industry Analysts is that CPO prices will
continue to hold at current levels.
Overview of Financial and Operational Performance
The year under review also witnessed
fluctuating weather patterns and resultant
impact on crops due to biological factors,
in most parts of Malaysia except for
East Malaysia. Accordingly, the crop
performance of the plantations of your
Company too was subject to these factors,
the cropping pattern dropping substantially
from the 2nd half of the current financial
year.
Review of Industry and Operational Performance
Crop Production
0
2,000
4,000
6,000
8,000
10,000
12,000
2011 2012 2013 2014 2015
Tonnes
Yield Per Hectare
0
5
10
15
20
25
30
35
40
2011 2012 2013 2014 2015
Tonnes

Shalimar (Malay) PLC
4
As such, the FFB production during the current year recorded a drop of 15% against the FFB production during the previous year. The drop in yield and the resultant crop production was seen across all the fields. However, we have been able to minimise the impact of the crop drop on the cost of production through much more scrutiny on field activities, especially upkeep and maintenance activities. We have also been able to enhance the effectiveness of the field programs and fertiliser application activities through close supervision and adoption of best agronomy management practices.
Another area of focus was on improving the productivity levels of the workforce and harvesting efficiency. We have also improved the general field conditions and drainage management within the plantations. Training was carried out by internal as well as external experts on pest and disease management, another critical area which could impact the long term crop potential of the estate. We have endeavoured to minimise the impact of such threats, through various initiatives and trials carried out at the field level.
Resultantly, your Company recorded a profit after tax of Rs. 66.20 mn during the year under review, as compared to
Rs. 211.35 mn recorded in the previous year. Profit before tax was Rs. 92.25 mn as compared to Rs. 248 mn recorded in the previous year.
As at 31st March 2015, total plantation hectarage was 304.5 ha, and was classified as mature.
As explained in Note 23 (page 56) to the Financial Statements, consequent to the Interim Budget 2015 passed in the Parliament of Sri Lanka and the related Gazette notification issued on 30th March 2015, the Company will become liable for Super Gain Tax (SGT) based on taxable income for the year of assessment 2013/14. SGT on the Company is estimated at approximately Rs. 33.56 mn. However, as of the date of authorising the Financial Statements by the Board of Directors, this bill has not been passed in the Parliament. Only in the event the Bill is enacted as law, the Company will become liable to pay the
estimated SGT.
Agro Harapan Lestari Sdn. Bhd.Managers
23rd April 2015
Review of Industry and Operational Performance

Annual Report 2014/15
5
Risk Management
The Company’s overall risk management
objective is to ensure that it creates
value to its shareholders, whilst
minimising potential adverse effects on
its performance. The established risk
management framework is aligned to that
of its parent company within well-defined
policies and guidelines.
The integrated risk framework ensures
prevention and early detection of risks,
contributing to a sustainable business model.
The risks are continuously reviewed and
managed through the deployment of
effective corrective actions. The following
key risk profile is identified;
Commodity Price Risk
The price of Crude Palm Oil (CPO) which
is derived based on international market
forces. The sale of oil palm Fresh Fruit
Bunches (FFB) is the prime source of cash
inflow for the Company.
Our end product is FFB. FFB prices are
derived from CPO prices. We supply our
produce to palm oil mills within the region,
based on pre-agreed terms.
Environmental Risk
Unfavourable global and local weather
patterns, resulting in adverse weather
conditions, natural and man-made
disasters including fires and haze from
fires, droughts, floods, pestilence and crop
disease could affect the quantity or quality
of FFB we are able to harvest.
The Company adopts in sound fertiliser
application programmes to safeguard the
operational yields that may be impacted due
to adverse weather patterns. Furthermore,
we have taken measures to ensure proper
water management in flood prone areas so
that long term benefits can be realised.
Potential crop production is affected by
diseases such as Ganoderma, leaf eating
insects and Bagworms ultimately impacting
yields. The Company constantly invests
in agronomy and plantation management
practices to mitigate the impact that would
be caused by any sudden up-rise of these
diseases.
Labour Risk
A critical success factor for a labour
intensive industry such as the oil palm
plantation is the attraction and retention
of skilled labour. It is quite challenging to
attract locals for plantation work and the
fact that the Malaysian government has
imposed some restrictions on attracting
labour from foreign regions has aggravated
such vulnerabilities.
Another significant development is the
noticeable shift in employment from
plantations to the manufacturing sector;
creating a void in the labour market. We have
been successful in addressing any short fall
that was encountered during the year.
Wage increases continue to burden the
cost of production as it is not linked to
commensurate productivity increases. This
creates the need to manage costs through
higher productivity and improved field
conditions.

Shalimar (Malay) PLC
6
Risk Management
Operational Risk
The Malaysian plantations do not own
CPO processing mills and thereby have
a significant dependence on third party
millers. The Company continues to
negotiate for better rates and terms whilst
seeking alternative millers to reduce the
bargaining power of existing mill owners.
Currently, the Company has arrangements
in place for supply of FFB to selected Mills
in close proximity on a confirmed basis.
Biological Asset Risk
The Company’s biological assets are
stated at fair value and are assessed
by an independent professional valuer.
The valuation basis and assumptions
are elaborated in the respective
Accounting Policies and Notes to the
Financial Statements. The volatility in the
environmental and industry dynamics such
as market price of CPO, weather patterns,
biological cycles as well as changes in
macro economic and political factors
including inflation rates, government bond
rates and risk profiles can also have a
significant impact on the fair value of the
biological assets.
Financial Risks
Foreign Exchange Risk
The Company’s exposure to foreign
exchange risk is minimal as the Malaysian
and Sri Lankan operations are primarily
domestic and transactions are recorded in
the respective functional currencies, i.e.,
Malaysian Ringgit and Sri Lankan Rupee.
However, a significant element of the risk
is generated through the translation of
results to Sri Lankan Rupee for the purpose
of Financial reporting as the principal
operations are in Malaysia.
Credit Risk
The credit risk is primarily encountered
through trade receivables, which arise
from its operating activities and deposits
with banking institutions. The Company
trades only with recognised and credit
worthy third parties and all customers are
subject to a credit verification process.
In addition, receivable balances are
monitored on an on-going basis with the
result that the Company’s exposure to bad
debts is minimal.
Liquidity Risk
The Company manages liquidity risk
exposures through effective working
capital management. The Company also
has planning guidelines in place to ensure
that the short term and medium term
liquidity is managed at acceptable levels.
Investment Risk
The long term investments held by
the Company are also in the Oil Palm
plantation industry and hence, the
performance of the investee Companies
are subject to a similar risk profile noted
here in which the Company is exposed to.
Agro Harapan Lestari Sdn. Bhd.Managers
23rd April 2015

Annual Report 2014/15
7
Profile of the Directors
Hariharan Selvanathan
Hariharan Selvanathan is the Chairman
of Bukit Darah PLC, Deputy Chairman
of Goodhope Asia Holdings Ltd, Deputy
Chairman of Carson Cumberbatch PLC
and President Commissioner of the palm
oil related companies in Indonesia. He
holds Directorships in several subsidiary
companies within the Carsons Group
and is also a Director of Sri Krishna
Corporation (Private) Ltd. He is also the
Chairman of Express Newspapers (Ceylon)
Ltd. He is also the Chairman of Carsons
Management Services (Private) Limited and
Agro Harapan Lestari (Private) Limited, the
Group’s Management Company. He is a
Past President of the National Chamber of
Commerce and Past Vice Chairman of the
International Chamber of Commerce
(Sri Lanka).
He counts over 20 years experience in
commodity trading in International Markets
and holds a Bachelor of Commerce
Degree.
Manoharan Selvanathan
Manoharan Selvanathan is the Chairman
of Sri Krishna Corporation (Private) Ltd,
Ceylon Finance & Securities (Private)
Ltd and Selinsing PLC. He is a Group
Director of most companies in the
Carson Cumberbatch Group in Sri Lanka,
Indonesia, Malaysia, Singapore and India
and is an active member of its Executive
Management Forums. He is also the
Deputy Chairman of Ceybank Asset
Management Ltd.
He is the Past Chairman of the Indo-Lanka
Chamber of Commerce & Industry and
has served as the Chairman of the Ceylon
Chamber of Commerce and as the President
of the Rotary Club of Colombo North. At
present he is the Honorary Consul of the
Republic of Chile in Sri Lanka.
He was conferred the highest National
Honour in Sri Lanka, the ‘DESAMANYA’
title by H.E. the President of Sri Lanka, in
recognition of the services rendered to the
nation.
In January 2011 he was awarded with the
prestigious ‘PRAVASI BHARATIYA SAMMAN
AWARD’ by the President of India in Delhi.
He holds a Bachelors Degree in Commerce.
He is also the Hon. Consul of the Republic of
Chile in Sri Lanka.
Chandima Gunawardena
Chandima Gunawardena serves as a
Non-Independent, Non-Executive Director
of Carson Cumberbatch PLC and in most of
the Carsons Group Companies in Sri Lanka
and overseas. He is also a Director of Bukit
Darah PLC. Since assuming Non-Executive
status in the Group in 2011, he serves as an
advisor to the Group’s Strategic Planning
and Management forums in Sri Lanka; and
serves on Board Committees including the
Audit Committees of the Group in Sri Lanka
and overseas covering all operating sectors
of the Group.

Shalimar (Malay) PLC
8
Profile of the Directors
He has over four decades of experience in
varied fields of business and commercial
activities and has held senior positions
in the Corporate, Mercantile and State
Institutions. He was appointed to the
Carsons Group Directorate in 1990.
He has served on the Management
Committee of the Ceylon Chamber of
Commerce for over 10 years, and was a
Founder Council Member of the Sri Lanka
Institute of Directors (SLID) and continued
to serve in the council for over 10 years.
He is a Fellow of the Chartered Institute of
Management Accountants, UK.
Israel Paulraj
Israel Paulraj is the Chairman of Ceylon
Guardian Investment Trust PLC, Ceylon
Investment PLC, Guardian Capital Partners
PLC and Rubber Investment Trust
Ltd. He serves as a Director of Carson
Cumberbatch PLC and of several of the
subsidiary companies within the Carsons
Group.
He served as Past Chairman of the
Federation of Exporters’ Associations
of Sri Lanka and the Coconut Products
Traders Association. He was a member
of the Executive Committee of the Ceylon
Chamber of Commerce and the National
Chamber of Commerce of Sri Lanka and
Shippers Council. He served on the Board
of Arbitrators of the Ceylon Chamber
of Commerce. He has served as Hony.
General Secretary of the Central Council
of Social Services, Hony. Treasurer of the
Christian Conference in Asia, President of
the Church of Ceylon Youth Movement and
Hony. Treasurer of the National Christian
Council of Sri Lanka. He has also served as
the Chairman of the Incorporated Trustees
of the Church of Ceylon.
He also served on the Presidential Task
Force on Non-Traditional Export and Import
Competitive Agriculture set up by President
R. Premadasa. He also served as Chairman
of the Ecumenical Loan Fund of Sri Lanka
and on its International Board in Geneva.
He was a member of the Commercial Law
Reform Commission and has served on the
Parliamentary Consultative Committee on
Internal and International Trade.
He holds a Bachelor of Law Degree
and an Executive Diploma in Business
Administration.
Chandana Tissera
Chandana Tissera is a Director of Carson
Cumberbatch PLC and presently serves
as the Chief Executive Officer for the
Plantations, Oil and Fats Sector of the
Carsons Group. He is also a Director of
several other subsidiary companies of
the Group. He has served as the Chief
Executive Officer of the Investment Sector
and as Director Finance of the Carsons
Group.
He has previously served on the Board
of Union Assurance PLC and counts over
30 years of experience in the fields of
manufacturing, Financial services, capital
market operations, overseas plantations,
project development and management
services. He is a Fellow of the Institute of
Management, UK.

Annual Report 2014/15
9
Nalake Fernando
Nalake Fernando is a Director of the
Property Management Companies of
the Carson Cumberbatch Group - Equity
One PLC and Equity Two PLC. He is also a
Director of Carsons Management Services
(Private) Ltd and in some of the Boards of
the Malaysian Plantation Companies of
the Carsons Group. He was the Country
Representative for Sri Lanka with Dalekeller
& Associates Ltd, Designers and Skidmore
Ownings and Merrill Architects. He was
also a Director of SKC Management
Services Ltd.
He counts over 40 years of work
experience and holds a Technician’s
Certificate of the Institute of Work Study
Practitioners, of UK.
Kenneth Sellayah
Kenneth Sellayah is a Director of Good
Hope PLC and Prime Property Management
Services (Pvt) Ltd. He was a former Director
of Shaw Wallace & Hedges Ltd., General
Manager of Ceylon Trading Company Ltd.,
Director of several of its subsidiaries and
Managing Director of Scanships Ltd. He
served as Chairman of the Coconut and
General Products Exporters Association,
and the Exports Section of the Ceylon
Chamber of Commerce.
He is a former Director of CPC (Lanka)
Ltd., CPC Agrifoods Ltd., and a member
of several Committees of the Ceylon
Chamber of Commerce. He is a member
of the Institute of Exports, UK and the
Chartered Management Institute, UK.

Shalimar (Malay) PLC
10
Statement of Directors’ Responsibilities
The responsibilities of the Directors in
relation to the Financial Statements are
detailed in the following paragraphs, while
the responsibilities of the Auditors are set
out in the Report of the Auditors.
According to the Companies Act No. 7
of 2007 and the Sri Lanka Accounting &
Auditing Standards Act No. 15 of 1995,
Directors are required to prepare Financial
Statements for each Financial year,
giving a true and fair view of the Financial
position of the Company as at the end
of the Financial year and of the Financial
performance for the said period.
In preparing these Financial Statements the
Directors are required to ensure that:
• appropriateaccountingpolicies
have been selected and applied
consistently while material
departures, if any, have been
disclosed and explained,
• allapplicableAccountingStandards
have been complied with, and
• reasonableandprudentjudgments
and estimates have been made.
The Directors are responsible for ensuring
that the Company maintains sufficient
accounting records to disclose with
reasonable accuracy, the Financial position
of the Company in order to ensure that
the Financial Statements of the Company
meet with the requirements of the Sri
Lanka Accounting & Auditing Standards
Act No. 15 of 1995 and the Companies Act
No. 7 of 2007. They are also responsible for
taking reasonable measures to safeguard
the assets of the Company and in this
regard to give proper consideration to the
establishment of an appropriate system
of internal controls with a view to prevent,
detect and rectify frauds and other
irregularities.
These Financial Statements have been
prepared on a going concern basis, after
reviewing the Financial position and the
cash flows and the Directors are of the
view that the Company has adequate
resources to continue in operation for the
foreseeable future.
The Directors are also of the view that they
have discharged their responsibilities as
set out in this statement.
By Order of the Board,
(Sgd.)
K. D. de Silva (Mrs.)Director
Carsons Management Services (Pvt) Ltd.Secretaries
23rd April 2015

Annual Report 2014/15
11
Annual Report of the Board of Directors on the Affairs of the Company
For the year ended 31st March 2015 2014
Rs. ‘000 Rs. ‘000
Profit after taxation 66,202 211,345
Profit brought forward from previous year 320,583 343,469
Profit available for appropriation 386,785 554,814
Other comprehensive income (223) 481
Appropriation
Dividend paid (78,978) (234,712)
Unappropriated profits carried forward 307,584 320,583
The details set out herein provide the pertinent information required by the Companies Act No. 7 of 2007, Listing Rules of the Colombo Stock Exchange and recommended best accounting practices. The Annual Report was approved by the Directors at a meeting held on 23rd April 2015.
1. General
The Directors have pleasure in presenting to the shareholders their Report together with the Audited Financial Statements for the year ended 31st March 2015 of Shalimar (Malay) PLC, a quoted public limited liability Company incorporated in Sri Lanka in 1909.
2. The Principal Activities of the Company
There were no significant changes in the nature of the principal activities of the Company during the Financial year under review, where the principal activity of the Company continues to be cultivation of oil palm, Selling of its Fresh Fruit Bunches and the managing and holding of an investment.
3. Review of Operations
The review of the Company’s operations during the year, with comments on Financial results is stated in the Chairman’s Statement on pages 1 and 2 and Review of Industry and Operational Performance on pages 3 and 4. These reports form an integral part of the Annual Report of the Board of Directors on the Affairs of the Company.
4. Financial Results
The Company recorded a net profit after tax of Rs. 66.20 mn for the year. An abridgement of the Company’s performance is presented in the table below.
5. Auditors’ Report
The Auditors’ Report on the Financial Statements is given on page 23 of this Annual Report.
6. Significant Accounting Policies
The Accounting policies adopted in the preparation of the Financial Statements are given on pages 29 to 43 in the Notes to the Financial Statements.

Shalimar (Malay) PLC
12
Annual Report of the Board of Directors on the Affairs of the Company
7. Financial Statements
The Company has prepared its
Financial Statements in compliance
with Sri Lanka Accounting Standards
(SLFRS and LKAS).
The Financial Statements of the
Company comprising the Statement
of profit or loss, Statement of
Comprehensive Income, Statement
of Financial Position, Statement
of Changes in Equity and Cash
Flow Statement together with the
accompanying Notes to the Financial
Statements for the year ended
31st March 2015, are set out in
pages 24 to 60.
8. Statement of Directors’ Responsibilities
The Statement of Directors’
Responsibilities for the Financial
Statements is given on page 10 of
this Annual Report.
9. Interests Register
9.1 Directors’ Interests
The Company maintains an Interests
Register in conformity with the
provisions of the Companies Act No.
7 of 2007.
All Directors have made declarations
as provided for in Section 192(2) of
the Companies Act aforesaid.
The relevant details as required by the
Companies Act No. 7 of 2007 have
been entered in the Interests Register
during the year under review.
The Interests Register is available
for inspection as required under the
Companies Act.
9.2 Remuneration of Directors
The Directors’ remuneration, for the
Financial year ended 31st March
2015 is given in Note 5 and Note 24.2
to the Financial Statements on pages
44 and 59 respectively.
9.3 Directors’ Interests in Contracts
and Shares
Directors’ interests in contracts of
the Company are disclosed in Note
24.3 on page 59 to the Financial
Statements and have been declared
at meetings of the Directors. The
Directors have no direct or indirect
interest in any other contracts or
proposed contracts in relation to the
business of the Company, while they
had the following interests in ordinary
shares of the Company.
No. of shares 31st 1st
March April
2015 2014
Mr. H. Selvanathan - -
Mr. M. Selvanathan 1 1
Mr. I. Paulraj - -
Mr. D.C.R. Gunawardena - -
Mr. A.K. Sellayah - -
Mr. P.C.P. Tissera - -
Mr. K.C.N. Fernando - -

Annual Report 2014/15
13
10. Corporate Donations
There were no donations granted
during the year.
11. Directors
The names of the Directors who
served during the financial year are
given under Corporate Information
provided in the Inner Back Cover of
this Annual Report.
11.1 Directors to Retire by Rotation
In terms of Articles 87 & 88 of
the Articles of Association of the
Company, Mr. M. Selvanathan retires
by rotation and being eligible, offers
himself for re-election.
11.2 Appointment of Directors who are
over seventy years of age
Mr. I. Paulraj and Mr. A.K. Sellayah
who are over seventy years of age
are to be re-appointed as Directors
of the Company for a further period
of one year from the conclusion of
the Annual General Meeting and that
the age limit stipulated in Section
210 of the Companies Act No. 7 of
2007 shall not be applicable to them.
12. Auditors
The Company’s Auditors during
the year under review were
Messrs. Ernst & Young, Chartered
Accountants.
A sum of Rs. 668,000 was paid to
them by the Company as audit fees
for the year ended 31st March 2015
(2014: Rs. 654,000).
The retiring auditors have expressed
their willingness to continue in
office. A resolution to re-appoint
them as Auditors of the Company
and authorising the Directors to fix
their remuneration will be proposed
at the forthcoming Annual General
Meeting.
The Audit Committee reviewed the
appointment of the Auditors, its
effectiveness and its relationship
with the Group, including the level of
audit and non-audit fees paid to the
Auditors.
12.1 Auditors’ Relationship or any
Interest with the Company
The Directors are satisfied that,
based on written representations
made by the Independent Auditors
to the Board, the Auditors did
not have any interest with the
Company that would impair their
independence.
13. Related Party Transactions Exceeding 10% of the Equity or 5% of the Total Assets of the Company
The Company did not have any
transactions that exceeded 10% of
the shareholders equity or 5% of
the total assets of the Company.
The transactions carried out by the
Company with its related parties
during the year ended 31st March
2015 are disclosed in Note 24.1
on page 57 and 58 to the Financial
Statements.

Shalimar (Malay) PLC
14
14. Corporate Governance
The Board has ensured that the
Company has complied with the
Corporate Governance Rules as per
the Listing Rules of the Colombo
Stock Exchange (CSE).
14.1 Board of Directors
The following Directors held office
during the period under review and
their brief profiles are given on pages
7 to 9 of this Annual Report.
Directors Executive/Non- Executive/ Independent
Mr. H. Selvanathan Executive
Mr. M. Selvanathan Executive
Mr. I. Paulraj Non-Executive
Mr. A.K. Sellayah Non-Executive/
Independent*
Mr. D.C.R.
Gunawardena Non-Executive
Mr. P.C.P. Tissera Executive
Mr. K.C.N. Fernando Executive
Each of the Non-Executive Directors
of the Company has submitted a
signed declaration on Independence/
Non-Independence as per Rule
7.10.2.b. of the Listing Rules of
the Colombo Stock Exchange.
The said declarations were tabled
at a Board Meeting held on 23rd
April 2015, in order to enable the
Board of Directors to determine the
Independence/Non-Independence of
the Non-Executive Directors.
*Accordingly, the Board has
determined that Mr. A. K. Sellayah
is an Independent Director in spite
of being on the Board for more than
nine years and being a Director of
Good Hope PLC, in which majority of
the other Directors of the Board are
also Directors, since he is not directly
involved in the management of the
Company.
The Managers of the Company are
Agro Harapan Lestari Sdn. Bhd.
The Board is working towards
meeting the CSE criteria, in respect
of Independent Directors.
14.2 Remuneration Committee
In terms of Rule 7.10.5 (a) of the
Listing Rules of the Colombo Stock
Exchange, the Remuneration
Committee of Carson Cumberbatch
PLC (CCPLC), the parent Company
of Goodhope Asia Holdings
Limited (GAHL), functions as the
Remuneration Committee of the
Company and comprises of the
following members.
Remuneration Committee Members
Executive/Non-Executive/Independent
Mr. I. Paulraj
(Chairman)
Non-Executive
Director of CCPLC
Mr. D.C.R.
Gunawardena
Non-Executive
Director of CCPLC
Mr. R.
Theagarajah
Non-Executive/
Independent
Director of CCPLC
Annual Report of the Board of Directors on the Affairs of the Company

Annual Report 2014/15
15
CCPLC is in the process of re-
formulating the Remuneration
Committee to fall in line with the
requirements set out in the Listing
Rules of the CSE.
Scope and objectives
The primary objective of the Remuneration Committee is to lead and establish a formal and transparent procedure for the development of a remuneration policy and the establishment of a remuneration structure.
A remuneration policy has been formulated based on market and industry factors and individual performance for all group Companies.
Functions and Proceedings
The Remuneration Committee recommends to the Board, the remuneration to be paid to the Non-Executive Directors (Note 24.2 on page 59). Based on the recommendation of the Remuneration Committee, the Board approves remuneration to the respective Directors.
The Chief Executive Officer, Director-in-charge and other members of senior management may be invited to attend meetings to discuss the performance of the Executive Directors and make proposals as necessary. Neither Executive nor Non-Executive Directors are involved in Remuneration Committee meetings when determinations are made in relation to the remuneration of the respective Directors.
The Committee is authorised by the Board to seek appropriate professional advice internally and externally as and when it considers this necessary.
The Remuneration Committee meets at least twice a year.
Aggregated remunerations paid to the Non-Executive Directors are disclosed under Note 5 on page 44 and Note 24.2 on page 59.
Executive Directors are not compensated for their role on the Board.
14.3 Audit Committee
As per the Rule 7.10.6 of the Listing Rules of the Colombo Stock Exchange the Audit Committee of CCPLC, the parent Company of Goodhope Asia Holdings Limited (GAHL), functions as the Audit Committee of the Company and comprises of the following members:
Audit Committee Members
Executive/Non-Executive/Independent
Mr. V.P. Malalasekera (Chairman)
Non-Executive/Independent Director of CCPLC
Mr. D.C.R. Gunawardena
Non-Executive Director of CCPLC
Mr. F. Mohideen Non-Executive/Independent Director of CCPLC
The Audit Committee report is given on pages 20 to 21 of this Annual Report.

Shalimar (Malay) PLC
16
15. Directors’ Meetings
Three Board Meetings were convened during the financial year and the attendance of the Directors was as follows.
Directors Meetings Attended (out of 3)Mr. H. Selvanathan 3Mr. M. Selvanathan 3Mr. I. Paulraj 2Mr. D.C.R. Gunawardena 3Mr. A.K. Sellayah 3Mr. P.C.P. Tissera 3Mr. K.C.N. Fernando 3
16. Dividend Subject to the approval of the
shareholders at the Annual General Meeting, the Board of Directors recommend a first and final dividend of Rs. 3.56 per share for the year ended 31st March 2015. However, in accordance with Sri Lanka Accounting Standard LKAS 10 - Events after the reporting period, this proposed final dividend has not been recognised as a liability as at 31st March 2015. This would result in a total outflow of Rs. 24,706,684.80 mn subject to approval at the forthcoming Annual General Meeting.
17. Solvency Test Taking into account the said distribution,
the Directors are satisfied that the Company would meet the solvency test requirement under Section 56 (2) of the Companies Act No. 7 of 2007 immediately after the distribution. The Company’s Auditors, Messrs. Ernst & Young have issued a Certificate of Solvency confirming the same.
18. Stated Capital The Stated Capital of the Company as at
31st March 2015 was Rs. 69,400,800/- comprising of 6,940,080 ordinary shares,
given in Note 14 on page 52. There was no change in the Stated Capital of the Company during the year.
19. Shareholders’ Funds Total reserves of the Company as at 31st
March 2015 was Rs. 5,413.07 mn (2014: Rs. 5,141.08 mn) comprising of Retained Earnings of Rs. 307.58 mn (2014: Rs. 320.58 mn) and Other reserves of Rs. 5,105.49 mn (2014: Rs. 4,820.5 mn). Total reserves combined with Stated Capital as at 31st March 2015 was Rs. 5,482.47 mn (2014: Rs. 5,210.48 mn).
The movements are shown in the Statement of Changes in Equity given on page 27.
20. Capital Expenditure and Investments
The total expenditure on purchase of property, plant & equipment during the year amounted to Rs. 0.29 mn (2014: Rs. 0.66 mn).
The movements in property, plant & equipment and investments during the year are set out in Notes 10 and 12 on pages 48 and 51 respectively.
21. Value of the Properties Freehold land is revalued by an
independent professional valuer using industry specific and relevant assumptions that market participants would use when valuing the properties on an existing use basis. The valuation basis/techniques and the assumptions used there in have been deliberated and agreed by the Management.
The carrying value of freehold land reflected in the Financial Statements as at 31st March 2015 is Rs. 1,324.70 mn compared to Rs. 1,481.76 mn in 2014. The details of freehold land valuation is given in Note 10 on page 48 to the Financial Statements.
Annual Report of the Board of Directors on the Affairs of the Company

Annual Report 2014/15
17
22. Value of Biological Assets Biological assets of the Company are
stated at fair value less cost to sell. The Company obtains the services of an independent professional valuer at each reporting date to establish the fair value of Biological assets which are performed in accordance with international valuation standards and considering industry specific and relevant methodologies. The valuation basis/techniques and the assumptions used there in have been deliberated and agreed by the Management and are disclosed under Note 11. Accordingly, the fair value of biological assets as at 31st March 2015 was Rs. 198.71 mn (2014: Rs. 219.52 mn) as disclosed under Note 11 on pages 49 and 50 to the Financial Statements.
23. Value of the Investment The value of the unquoted investment
has been derived based on the fair value of the corresponding investment. Accordingly, in arriving at the fair value of SDSB’s investment in PTAI, Property, Plant & Equipment and biological assets have been determined with reference to market based information by an independent professional valuer using industry specific and relevant assumptions that market participants would use when valuing such assets. These valuation techniques, inputs and assumptions have been deliberated and agreed by the Management.
The fair value of the Company’s investment as at 31st March 2015 was Rs. 3,922.35 mn (2014: Rs. 3,458.34 mn). The fair value and the basis of valuation are disclosed under Note 9 and 12 on pages 47 and 50 respectively to the Financial Statements.
24. Statutory Payments The Directors to the best of their
knowledge and belief are satisfied that all statutory payments have been paid up to date or have been provided for in the Financial Statements.
25. Going Concern Having taken into account the financial
position and future prospects, the Directors have a reasonable expectation that the Company has adequate resources to continue to be in operational existence for the foreseeable future. For this reason the Company continues to adopt the going concern basis in preparing the Financial Statements.
26. Events After the Reporting Date Subsequent to the reporting date, no
material circumstances have arisen, which would require adjustments to or disclosure in the Financial Statements other than those disclosed in Note 22 on page 56 to the Financial Statements.
27. Contingent Liabilities As explained in Note 23 (page 56) to
the Financial Statements, consequent to the Interim Budget 2015 passed in the Parliament of Sri Lanka on 07th February 2015 and the related Gazette notification issued on 30th March 2015, a one off 25% Super Gain Tax (SGT) is to be imposed on companies based on either the company level or consolidated level if in a Group profits if same is in excess of Rs. 2,000 mn profit before income tax as per the Audited Financial Statement in the Financial Year 2013/14. The consolidated profit before tax of Carson Cumberbatch PLC, the parent Company of Goodhope Asia Holdings Limited, exceeds this threshold and accordingly the Company too will become liable for SGT which is estimated at approximately Rs. 33.56 mn.

Shalimar (Malay) PLC
18
However, as of the date of authorising the Financial Statements by the Board of Directors, this bill has not been passed in the Parliament. Only in the event the Bill is enacted as law, the Company will become liable to pay the SGT.
28. Share Information
The details relating to earnings, net assets, market value per share and information on share trading is given on pages 71 to 73 of this Annual Report.
29. Annual Report
The Board of Directors on 23rd April 2015, approved the Company’s Financial Statements together with the Reviews
which form part of the Annual Report. The appropriate number of copies of the report would be submitted to the Colombo Stock Exchange, Sri Lanka Accounting and Auditing Standards Monitoring Board and the Registrar General of Companies within the given time frames.
30. Annual General Meeting
The One Hundred and Sixth Annual General Meeting of the Company will be held on the 29th day of May 2015 at 3.00 p.m at the 8th Floor, No. 65C, Dharmapala Mawatha, Colombo 7. The Notice of Annual General Meeting is on page 76 of this Annual Report.
31. Twenty Major Shareholders
As at 31st March 2015 2014
Name of shareholders No. of shares % No. of shares %
Goodhope Asia Holdings Ltd 5,775,573 83.22 5,597,736 80.66
Selinsing PLC 744,984 10.73 744,984 10.73
Good Hope PLC 215,136 3.10 215,136 3.10
Indo-Malay PLC 153,576 2.21 153,576 2.21
Mr. K.C. Vignarajah 26,931 0.39 25,756 0.37
Mrs. S. Vignarajah 4,759 0.07 4,759 0.07
Dr. D. Jayanntha 2,100 0.03 2,100 0.03
Mr. J.A.A. Chandrasiri 1,798 0.03 2,500 0.04
Best Real Invest Co Services (Private) Lmited 1,706 0.02 1,651 0.02
Mr. N.K. Punchihewa 1,500 0.02 2,500 0.04
Mr. M.M.A. Ameen 1,200 0.02 1,200 0.02
Miss. K.R. Vignarajah 800 0.01 800 0.01
Dr. R.D. Kahandawa Arachchi 700 0.01 700 0.01
Mrs. F.H. Ameen 500 0.01 500 0.01
Mr. N.S.C. De Silva 500 0.01 500 0.01
Mr. P.K.D.F. Pitigala 500 0.01 500 0.01
Mr. V.H.D.S.S. Siriwardena 424 0.01 256 0.01
Mr. V. Baskerasundaram 400 0.01 411 0.01
Mrs. N.K.L. Munavir 400 0.01 557 0.01
Miss S. Subramaniam 300 0.01 300 0.01
Annual Report of the Board of Directors on the Affairs of the Company

Annual Report 2014/15
19
32. Internal Control and Risk Management
The Board is responsible for the
establishment of the Company’s
internal controls and its
effectiveness. Internal control is
established so as to safeguard the
assets, prevent and detect frauds
and irregularities and to make
available, accurate and timely
information. However, any system
can provide only reasonable and
not absolute assurance that errors
and irregularities are prevented
or detected within a reasonable
time frame. The Board is of the
view that the system of internal
controls in place is sound and
adequate to provide reasonable
assurance. The Group’s internal
audit division plays an important role
in assessing the effectiveness and
the implementation of the internal
control system. Further, the Audit
Committee receives reports on the
adequacy and effectiveness of the
Company’s internal control. The
Board is also conscious of the risks
and have identified and listed out
the risks profile as given in pages 5 &
6 of this annual report. Action plans
to monitor and manage these risks
are incorporated into the business
plans and reviewed on a continuous
basis.
33. Pending litigation
There are no litigations currently
pending against the Company.
34. Human Resources
The Company has no employees
other than the plantation workers
in its Malaysian operations, since
the business and operation of the
Company are managed by Agro
Harapan Lestari Sdn. Bhd. The
Company has had no material
issues pertaining to employees and
industrial relations during the year
ended 31st March 2015.
Signed for and on behalf of the Board,
(Sgd.) (Sgd.)
H. Selvanathan P.C.P. TisseraChairman Director
(Sgd.)
K.D. de Silva (Mrs.)Director
Carsons Management Services (Pvt) LtdSecretaries
23rd April 2015

Shalimar (Malay) PLC
20
Audit Committee Report
Audit Committee
As provided by the Colombo Stock Exchange Listing Rules, the Audit Committee of Carson Cumberbatch PLC (CCPLC), the Parent Company of Goodhope Asia Holdings Limited (GAHL), functions as the Audit Committee of the Company.
The Audit Committee consists of the following members:
Audit Committee Executive/ Members Non-Executive/ Independent
Mr.V.P. Malalasekera Non-Executive/ Independent (CCPLC)Mr. D.C.R. Gunawardena Non-Executive (CCPLC)Mr. F. Mohideen Non-Executive/ Independent (CCPLC)
Mr.V.P. Malalasekera is a Non-Executive, Independent Director of CCPLC and a former Director of Ceylon Tobacco Company PLC.
Mr.D.C.R. Gunawardena is a Non-Executive Director of CCPLC and in most of its Group Companies. He is a Fellow of the Chartered Institute of Management Accountants, U.K.
Mr.F. Mohideen, a Non-Executive, Independent Director of CCPLC, was the former Deputy Secretary to the Treasury and a former Director of Bank of Ceylon and Securities and Exchange Commission of Sri Lanka.
The audit aspects of Shalimar (Malay) PLC are conducted within the Agenda of CCPLC - Audit Committee.
Meetings of the Audit Committee
CCPLC-Audit Committee held Three (03) Meetings during the Financial year to discuss matters relating to the Company.
The attendance of the Members of the Committee was as follows:
Meetings Attended (out of 3)
Mr. V.P. Malalasekera 3Mr. D.C.R. Gunawardena 3Mr. F. Mohideen 3
The Audit Committee Meetings were attended by the Chief Financial Officer-Plantations and Oils & Fats Sector, Internal Auditors, as well as the Senior Management staff members.
The Committee met the External Auditors, Messrs. Ernst & Young twice during the year to discuss the audit scope and to deliberate the draft Financial Report and Accounts. The Audit Committee also discussed the draft Financial Report and Accounts with the External Auditors, without the management being present.
Purpose of the Audit Committee
To assist the Board of Directors in fulfilling its oversight responsibilities for the financial reporting process, the system of internal control over financial reporting, the audit process and the Company’s process for monitoring compliance with laws and regulations, Company policies and procedures and the code of conduct.

Annual Report 2014/15
21
To ensure that the internal audit activity is well managed, so that it adds value to the organisation by being objective in providing relevant assurance, contributing to the effectiveness and efficiency of governance, risk management and control processes.
Financial Statements
The Interim Financial Statements of Shalimar (Malay) PLC have been reviewed by the Audit Committee Members at Audit Committee Meetings. The draft Financial Statements of Shalimar (Malay) PLC for the year ended 31st March 2015 were also reviewed at a Meeting of the Audit Committee Members, together with the External Auditors, Messrs. Ernst & Young, prior to release of same to the Regulatory Authorities and to the shareholders. The Audit Committee Members were provided with confirmations and declarations as required, by the Managers, Agro Harapan Lestari Sdn Bhd that the said Financial Statements were prepared in accordance with the Sri Lanka Accounting Standards (SLFRS/LKAS) and the information required by the Companies Act No. 7 of 2007 therein and presented a true and fair view of the Company’s state of affairs as at that date and the Company’s activities during the year under review.
Internal Audit
In accordance with the recommendation of the Audit Committee, financial audits are carried out annually, whilst field audits at estate level are planned and implemented every alternate year, which are carried out by the Plantation Sector Internal Audit Team. Accordingly, the Plantation Sector Internal Audit carried out a review as per the approved plan covering the plantation aspects for the current financial year.
External Audit
The Members of the Audit Committee have determined that Messrs. Ernst & Young, Chartered Accountants were independent on the basis that they did not carry out any special assignment on the operations of the Company. The Committee has reviewed the external audit plan, as well as the management letter and followed up on issues raised.
The Members of the Audit Committee have concurred to recommend to the Board of Directors the re-appointment of Messrs. Ernst & Young, Chartered Accountants, as Auditors for the financial year ending 31st March 2016, subject to the approval of the shareholders of Shalimar (Malay) PLC at the Annual General Meeting.
(Sgd.) V.P. MalalasekeraChairman – Audit CommitteeCarson Cumberbatch PLC
23rd April 2015

Shalimar (Malay) PLC
22
Financial Reports
Independent Auditors’ Report 23
Statement of Profit or Loss 24
Statement of Comprehensive Income 25
Statement of Financial Position 26
Statement of Changes in Equity 27
Cash Flow Statement 28
Notes to the Financial Statements 29

Annual Report 2015/14
23
Independent Auditors’ Report
TO THE SHAREHOLDERS OF SHALIMAR (MALAY) PLC
Report on the Financial Statements
We have audited the financial statements of Shalimar (Malay) PLC (“the Company”), which comprise the statement of financial position as at 31 March 2015, and the statement of profit or loss, statement of comprehensive income, statement of changes in equity and cash flow statement for the year then ended, and a summary of significant accounting policies and other explanatory information. (set out on pages 24 to 60)
Board’s Responsibility for the Financial Statements
The Board of Directors (“Board”) is responsible for the preparation of these financial statements that give a true and fair view in accordance with Sri Lanka Accounting Standards, and for such internal control as Board determines is necessary to enable the preparation of financial statements that are free from material misstatement, whether due to fraud or error.
Auditor’s Responsibility
Our responsibility is to express an opinion on these financial statements based on our audit. We conducted our audit in accordance with Sri Lanka Auditing Standards. Those standards require that we comply with ethical requirements and plan and perform the audit to obtain reasonable assurance about whether the financial statements are free from material misstatement.
An audit involves performing procedures to obtain audit evidence about the amounts and disclosures in the financial statements. The procedures selected depend on the auditor’s judgment, including the assessment of the risks of material misstatement of the financial statements, whether due to fraud or error. In making those risk assessments, the auditor considers internal control relevant to the entity’s preparation of the financial
statements that give a true and fair view in order to design audit procedures that are appropriate in the circumstances, but not for the purpose of expressing an opinion on the effectiveness of the entity’s internal control. An audit also includes evaluating the appropriateness of accounting policies used and the reasonableness of accounting estimates made by Board, as well as evaluating the overall presentation of the financial statements.
We believe that the audit evidence we have obtained is sufficient and appropriate to provide a basis for our audit opinion.
Opinion
In our opinion, the financial statements give a true and fair view of the financial position of the Company as at March 31, 2015, and of its profit and cash flows for the year then ended in accordance with Sri Lanka Accounting Standards.
Report on Other Legal and Regulatory Requirements
As required by section 163 (2) of the Companies Act No. 07 of 2007, we state the following:
a) The basis of opinion and scope and limitations of the audit are as stated above.
b) In our opinion:
- We have obtained all the information and explanations that were required for the audit and, as far as appears from our examination, proper accounting records have been kept by the Company.
- The financial statements of the Company, comply with the requirements of section 151 of the Companies Act.
Ernst & YoungChartered Accountants
23rd April, 2015Colombo

Shalimar (Malay) PLC
24
For the year ended 31st March 2015 2014
Note Rs. ‘000 Rs. ‘000
Revenue 3 172,518 319,030
Direct operating costs (55,706) (55,922)
Gross Profit 116,812 263,108
Gain arising from changes in fair
value of biological assets 11 2,994 14,122
Other income and gains 4 527 454
Administrative expenses (28,078) (29,685)
Profit Before Tax 5 92,255 247,999
Income tax expense 6 (26,053) (36,654)
Profit for the Year 66,202 211,345
Earnings Per Share (Rs.) 7 9.54 30.45
Dividend Per Share * (Rs.) 7.1 3.56 30.97
The Accounting Policies and Notes from pages 29 to 60 form an integral part of these Financial Statements.
Figures in brackets indicate deductions.
* Includes first and final dividend proposed for the current year whereas, in the comparative period includes
interim dividend paid and final dividend proposed.
Statement of Profit or Loss

Annual Report 2015/14
25
Statement of Comprehensive Income
For the year ended 31st March 2015 2014
Note Rs. ‘000 Rs. ‘000
Profit for the Year 66,202 211,345
Other Comprehensive Income/(Loss)
Other comprehensive income/(loss) to be reclassified to profit or loss in subsequent periods
Exchange differences on translation (179,020) (42,378)
of financial of foreign operations
Gain/(Loss) on change in fair value of 464,014 (282,924)
available - for -sale financial assets
Net other comprehensive income/(loss) to be reclassified to profit or loss in subsequent periods 284,994 (325,302)
Other comprehensive income/(loss) not to be reclassified to profit or loss in subsequent periods
Actuarial gain/(loss) on defined benefit plan 17 (294) 642
Income tax effect 16.1 71 (161)
Net other comprehensive income/(loss) not to be reclassified to profit or loss in subsequent periods (223) 481
Other Comprehensive Income/(Loss) for the Year, Net of Tax 284,771 (324,821)
Total Comprehensive Income/(Loss) for the Year, Net of Tax 350,973 (113,476)
The Accounting Policies and Notes from pages 29 to 60 form an integral part of these Financial Statements.
Figures in brackets indicate deductions.

Shalimar (Malay) PLC
26
As at 31st March 31st March 2015 2014 Note Rs. ‘000 Rs. ‘000
Assets Non-Current Assets Property, plant and equipment 10 1,346,918 1,508,754Biological assets 11 198,706 219,516 Non-current financial assets 12 3,922,351 3,458,337Total Non-Current Assets 5,467,975 5,186,607
Current Assets Inventories 231 342 Trade and other receivables 13 24,870 19,611Advance and prepayments 577 175Income tax receivable 4,226 - Cash and cash equivalents 43,154 77,864 Total Current Assets 73,058 97,992 Total Assets 5,541,033 5,284,599
Equity and Liabilities Equity Stated capital 14 69,401 69,401 Retained earnings 307,584 320,583 Other reserves 15 5,105,490 4,820,496 Total Shareholders’ Funds 5,482,475 5,210,480
Non-Current Liabilities Deferred tax liability 16 50,217 57,381 Retirement benefit obligations 17 2,674 2,358 Total Non-Current Liabilities 52,891 59,739
Current Liabilities Trade and other payables 18 3,121 10,872 Provision and accrued expenses 2,546 2,660 Taxation payable - 848 Total Current Liabilities 5,667 14,380 Total Equity & Liabilities 5,541,033 5,284,599
Net Assets Per Ordinary Share (Rs.) 789.97 750.78
I certify that these Financial Statements are in compliance with the requirements of the Companies Act No. 7 of 2007.
(Sgd.) C.S. Karunasena Chief Financial Officer
The Board of Directors is responsible for the preparation and presentation of these Financial Statements. The Accounting Policies and Notes from pages 29 to 60 form an integral part of these Financial Statements.
Signed for and on behalf of the Managers, Signed for and on behalf of the Board,
(Sgd.) (Sgd.) (Sgd.) M.R. Jiffrey H. Selvanathan P. C. P. Tissera Director Chairman Director Agro Harapan Lestari Sdn. Bhd.
23rd April, 2015Colombo
Statement of Financial Position

Annual Report 2015/14
27
Statement of Changes in Equity
Cap
ital
C
urre
ncy
Ava
ilabl
e
Tota
l
St
ated
A
ccre
tion
Tr
ansl
atio
n Fo
r - S
ale
Reta
ined
Sh
areh
olde
rs’
N
ote
Cap
ital
Re
serv
e Re
serv
e Re
serv
e Ea
rnin
gs
Fund
s
Rs
. ‘00
0 Rs
. ‘00
0 Rs
. ‘00
0 Rs
. ‘00
0 Rs
. ‘00
0
Rs. ‘
000
Bala
nce
as a
t 1st
Apr
il 20
13
6
9,40
1
1,5
23,8
93
(27,
522)
3
,649
,427
34
3,46
9
5,5
58,6
68
Prof
it fo
r th
e ye
ar
-
-
-
-
2
11,3
45
211
,345
Oth
er c
ompr
ehen
sive
inco
me/
(loss
)
-
-
(4
2,37
8)
(282
,924
) 48
1
(324
,821
)
Tota
l com
preh
ensi
ve in
com
e/(lo
ss)
-
-
(42,
378)
(2
82,9
24)
211
,826
(1
13,4
76)
Fina
l div
iden
d -
2012
/13
7.1
-
-
-
-
(98,
756)
(9
8,75
6)
Inte
rim d
ivid
end
- 20
13/1
4 7.
1 -
-
-
-
(1
35,9
56)
(135
,956
)
Bala
nce
as a
t 31
Mar
ch 2
014
69
,401
1,
523,
893
(6
9,90
0)
3,3
66,5
03
320
,583
5
,210
,480
Bal
ance
as
at 1
st A
pri
l 201
4
69,
401
1
,523
,893
(
69,9
00)
3,
366,
503
3
20,5
83
5,2
10,4
80
Pro
fit
for
the
year
-
-
-
-
66,
202
66,
202
Oth
er c
om
pre
hen
sive
inco
me/
(loss
)
-
-
(
179,
020)
4
64,0
14
(223
) 28
4,77
1To
tal c
om
pre
hen
sive
inco
me/
(loss
)
- -
(17
9,02
0)
464
,014
6
5,97
9
350,
973
Fin
al d
ivid
end
- 2
013/
14
7.1
-
-
-
-
(78
,978
) (7
8,97
8)B
alan
ce a
s at
31
Mar
ch 2
015
6
9,40
1 1
,523
,893
(
248,
920)
3
,830
,517
3
07,5
84
5,4
82,4
75
The
Acc
ount
ing
Polic
ies
and
Not
es fr
om p
ages
29
to 6
0 fo
rm a
n in
tegr
al p
art o
f the
se F
inan
cial
Sta
tem
ents
.N
atur
e of
the
rese
rves
are
des
crib
ed in
Not
e 15
to th
e Fi
nanc
ial S
tate
men
ts.
Figu
res
in b
rack
ets
indi
cate
ded
uctio
ns.

Shalimar (Malay) PLC
28
For the year ended 31st March 2015 2014 Note Rs. ‘000 Rs. ‘000
Cash Flows from Operating Activities Profit Before Taxation 92,255 247,999 Adjustments for: Depreciation on property, plant and equipment 10 1,858 1,313Gain on disposal of property, plant and equipment (477) -Write - off of property, plant and equipment 1,233 -Provision for retirement benefit obligations 17 296 318Interest income 3 (1,861) (4,163)Net gain from change in fair value of biological assets 11 (2,994) (14,122)Exchange differences in currency translation of Malaysian operations (4,789) (2,090)Operating Profit Before Working Capital Changes 85,521 229,255
Decrease/(Increase) in inventories 111 (68)Decrease/(Increase) in trade and other receivables (5,661) (7,565)Increase/(Decrease) in trade payables and accruals (7,815) (2,613)Cash Generated from/(used in) Operations 72,156 219,009 Tax paid (29,888) (36,460)Retirement benefits obligations paid 17 - (375)Net Cash (Outflows)/Inflows from Operating Activities 42,268 182,174 Cash Flows from Investing Activities Proceeds from sale of property, plant and equipment 478 -Purchase of property, plant and equipment 10 (288) (656)Interest income 1,861 4,163Net Cash used in Investing Activities 2,051 3,507 Cash Flow from Financing Activities Dividend paid (79,029) (234,973)Net Cash used in Financing Activities (79,029) (234,973) Net (Decrease)/Increase in Cash & Cash Equivalents (34,710) (49,292)Cash & Cash Equivalents at the Beginning of the Year 77,864 127,156Cash & Cash Equivalents at the End of the Year (Note A) 43,154 77,864 Note A Cash & Cash Equivalents Cash and bank balances 23,731 43,465Short-term deposits 19,423 34,399 43,154 77,864
The Accounting Policies and Notes from pages 29 to 60 form an integral part of these Financial Statements. Figures in brackets indicate deductions.
Cash Flow Statement

Annual Report 2015/14
29
Notes to the Financial Statements
1. CORPORATE INFORMATION
1.1 General
Shalimar (Malay) PLC (“Company”) is
a public quoted company with limited
liability, incorporated and domiciled
in Sri Lanka. The registered office of
the Company is located at No. 61,
Janadhipathi Mawatha, Colombo 01
and the principal place of business is
situated at Ladang Shalimar, 45700,
Bukit Rotan, Selangor Darul Ehsan,
Malaysia.
1.2 Principal Activities and Nature of Operations
During the year, the principal
activities of the Company were
cultivation of oil palm and selling
of its Fresh Fruit Bunches and
the managing and holding of an
investment.
1.3 Parent Entity and Ultimate
Parent Entity
The Company’s parent entity is
Goodhope Asia Holdings Limited
incorporated in Singapore. In
the opinion of the Directors,
the Company’s ultimate parent
undertaking and controlling
party is Bukit Darah PLC which is
incorporated in Sri Lanka.
1.4 Date of Authorisation for Issue
The Financial Statements of Shalimar
(Malay) PLC for the year ended 31
March 2015 was authorised for issue
in accordance with a resolution of the
board of directors on 23rd April 2015.
2. SIGNIFICANT ACCOUNTING POLICIES
2.1 General Accounting Policies
2.1.1 Statement of Compliance
The Financial Statements of
Shalimar (Malay) PLC comprises
the Statement of Financial Position
and the Statement of Profit or
loss, Statement of Comprehensive
Income, Statement of Changes
in Equity and Statement of Cash
Flows, together with the Accounting
Policies and Notes to the Financial
Statements.
These Financial Statements are
prepared in accordance with the
Sri Lanka Accounting Standards laid
down by the Institute of Chartered
Accountants of Sri Lanka, and also
in compliance with the requirements
of the Companies Act No. 7 of 2007.
2.1.2 Basis of Preparation
The Financial Statements of the
Company have been prepared
in accordance with Sri Lanka
Accounting Standards (SLFRS and
LKAS) as issued by Institute of
Chartered Accountants of Sri Lanka.
The Financial Statements have been
prepared on a historical cost basis,
except for the following material
items in the statement of Financial
Position,
• Biologicalassetsaremeasured
at fair value less cost to sell

Shalimar (Malay) PLC
30
• Available-for-salefinancial
assets are measured at fair value
• Landismeasuredatcostat
the time of the acquisition and
subsequently land is revalued
2.1.3 Comparative Information
The accounting policies have been
consistently applied by the Company
and, are consistent with those used
in the previous year. Previous year’s
figures and phrases have been re-
arranged whenever necessary to
conform to current presentation.
2.2 Summary of Significant Accounting Policies
2.2.1 Conversion of Foreign Currencies
(a) Presentation Currency
The Financial Statements are
presented in Sri Lankan Rupees.
(b) Investment Operations in Sri Lanka
The functional currency of the
investment operations in Sri Lanka
is Sri Lankan Rupees. Transactions
in foreign currencies are initially
translated into functional currency
using the exchange rate ruling at the
date of the transaction. Monetary
assets and liabilities denominated
in foreign currencies as at the
reporting date are translated at the
functional currency rate of exchange
ruling at that date. The exchange
differences arising on translation are
taken to Statement of Profit or Loss.
(c) Operations in Malaysia
The functional currency of the
foreign operations in Malaysia
is the Malaysian Ringgit. As at
the reporting date, the assets
and liabilities of the Malaysian
Operations are translated into the
presentation currency (Sri Lankan
Rupees) at the rate of exchange
ruling at the reporting date and the
items in the Statement of Profit or
Loss are translated at the average
exchange rate for the period. The
exchange differences arising on the
translation are recognised in other
comprehensive income
2.2.2 Taxation
(a) Current Income Taxes
The Company’s liability to taxation
is computed in accordance with the
provisions of the Inland Revenue
Act, No. 10 of 2006 and the
subsequent amendments thereto.
Full consideration is given to the tax
laws prevailing in the countries of
incorporation and operation.
Liability to taxation of the Company
is made after claiming relief available
in terms of the Double Taxation
Agreement entered into between
the Governments of Malaysia and Sri
Lanka.
(b) Deferred Taxation
Deferred tax is provided on
temporary differences at the
reporting date between the tax
bases of assets and liabilities and
Notes to the Financial Statements

Annual Report 2015/14
31
their carrying amounts for financial
reporting purposes. Deferred tax
liabilities are recognised for all
temporary differences, except:
• Wherethedeferredtaxliability
arises from an asset or liability in
a transaction that affects neither
the accounting profit nor the
taxable profit.
Deferred tax assets are recognised
for all deductible differences, carry
forward of unused tax credits and
unused tax losses, to the extent that
it is probable that taxable profits
will be available against which the
deductible temporary differences
and the carry forward of unused tax
credits and unused tax losses can be
utilised, except:
• Wherethedeferredtaxassets
relating to deductible temporary
differences arises from the
initial recognition of an asset
or liability in a transaction that
affects neither the accounting
profit nor the taxable profit.
The carrying amount of deferred
tax assets are reviewed at each
reporting date and reduced to the
extent that it is no longer probable
that sufficient taxable profits will be
available to allow the deferred tax
assets to be utilised. Unrecognised
deferred tax assets are re-assessed
at each reporting date and are
recognised to the extent that it has
become probable that future taxable
profits will allow the deferred tax
assets to be recovered.
Deferred tax assets and liabilities
are measured at the tax rates that
are expected to apply in the year
when the assets are realised or the
liabilities are settled, based on tax
rates and tax laws that have been
enacted or substantially enacted at
the reporting date.
Current tax and deferred tax relating
to items recognised directly in
Statement of Other Comprehensive
Income are also recognised in
Statement of Other Comprehensive
Income and not in the Statement of
Profit or Loss.
Deferred tax assets and liabilities are
set off if a legally enforceable right
exists to set off current tax assets
against current tax liabilities and the
deferred taxes relate to the same
taxable entity and the same taxation
authority.

Shalimar (Malay) PLC
32
2.2.3 Events occurring after the
Reporting Period
The materiality of the events occurring after the reporting date is considered and appropriate adjustments or disclosures are made in the Financial Statements in accordance with LKAS 10 - Events after the reporting period.
2.3 Assets And Bases of their Valuation
Assets classified as current assets in the Statement of Financial Position are cash and those which are expected to be realised in cash during the normal operating cycle of the Company’s business or within one year from the reporting date.
Assets other than current assets are those which the Company intends to hold beyond a period of one year from the reporting date.
2.3.1 Property, Plant & Equipment
(1) Valuation
Property, Plant & Equipment are stated at cost or valuation less accumulated depreciation, provided on the basis stated in (3) below.
(2) Cost Cost of Property, Plant & Equipment
is the cost of acquisition or construction together with any expenses incurred in bringing the assets to its working condition for its intended use.
Expenditure incurred for the purpose of acquiring, extending or improving
assets of a permanent nature by means of which to carry on the business or to increase the earning capacity of the business has been treated as capital expenditure.
(3) Depreciation The provision for depreciation is
calculated by using a straight line method on the cost or valuation of all Property, Plant & Equipment other than freehold land, in order to write off such amounts over the estimated useful lives.
The Principal Annual rates used are:
No. of years
Freehold buildings 20
Plant & machinery 10
Furniture, fittings & office
equipment 8-10
Motor vehicles 4
No depreciation is Provided on
freehold land.
Depreciation of an asset begins when it is available for use whereas depreciation of an asset is ceased at the earlier of the date that the asset is classified as held for sale and the date that the asset is derecognised.
The appropriateness of useful lives of the assets and the residual value is assessed annually.
An asset’s carrying amount is written down immediately to its recoverable amount if the asset’s carrying amount is greater than its estimated recoverable amount.
Notes to the Financial Statements

Annual Report 2015/14
33
(4) Plantations
(a) Permanent Land Development
Costs
Land development costs incurred
in respect of developing the land
for cultivation which are permanent
in nature, are capitalised as “land
cost”.
(b) Revaluation of Land Revaluation of the freehold land
in Malaysia is carried out on an
annual basis in order to ensure that
the book value reflects the market
value. Any surplus or deficit arising
therefrom is adjusted through the
Capital Accretion Reserve once in
every three years, unless there is a
significant change in the valuation
in which case it is recognised
immediately.
2.3.2 Biological Assets
Biological assets represent immature
and mature palm oil plantations
and are stated at fair value less
costs to sell. Oil palm trees have an
average life up to 26 years, with the
first 30 to 36 months as immature
and the remaining years as mature.
As market determined prices or
values are not readily available for
plantations in its present condition,
the Company uses the present
value of expected future cash flows
(excluding any future cash flows
for financing the assets, taxation,
or re-establishing plantations after
harvest) from the asset, discounted
at a current market determined pre-
tax rate in determining fair values.
Gains or losses arising on initial
recognition of plantations at fair
values less costs to sell and from the
change in fair values of plantations
at each reporting date are included
in the Statement of Profit or Loss for
the period in which they arise.
2.3.3 Financial Instruments — Initial
Recognition and Subsequent
Measurement
Financial assets within the scope of
LKAS 39 are broadly categorised as
financial assets at fair value through
profit or loss, loans and receivables,
held-to-maturity investments,
available-for-sale financial assets,
or as derivatives designated as
hedging instruments in an effective
hedge, as appropriate. The Company
determines the classification of its
financial assets at initial recognition.
All financial assets are recognised
initially at fair value plus (in the case
of assets not at fair value through
profit or loss) directly attributable
transaction costs.
Purchases or sales of financial
assets that require delivery of assets
within a time frame established
by regulation or convention in the
market place (regular way trades)
are recognised on the trade date,
i.e., the date that the Company
commits to purchase or sell the
asset.

Shalimar (Malay) PLC
34
The Company’s financial assets
include cash and short-term
deposits, trade and other
receivables, quoted and unquoted
financial instruments.
Subsequent Measurement
The subsequent measurement of
financial assets depends on their
classification as follows:
(a) Trade and Other Receivables
Trade and other receivables are non-
derivative financial assets with fixed
or determinable payments. They do
not contain assets that are quoted
in an active market. Trade and other
receivables are initially recognised
at fair value plus any directly
attributable transaction cost. After
initial measurement, such financial
assets are subsequently measured
at amortised cost using the effective
interest rate method (EIR), less
impairment. The losses arising
from impairment are recognised
in the profit or loss as a part of
administration costs.
(b) Available-For-Sale Financial
Investments
Available-for-sale financial
investments include equity
securities. Equity investments
classified as available-for-sale are
those, which are neither classified
as held for trading nor designated at
fair value through profit or loss.
After initial measurement, available-
for-sale financial investments are
subsequently measured at fair value
with unrealised gains or losses
recognised as other comprehensive
income in the available-for-sale
reserve until the investment is
derecognised, at which time the
cumulative gain or loss is recognised
in other operating income, or
determined to be impaired, at
which time the cumulative loss is
reclassified to the Statement of
Profit or Loss in finance costs and
removed from the available-for-sale
reserve.
Fair value of investments in
unquoted ordinary shares are
determined based on the fair
value of consolidated net assets
of such companies and fair value
of investment in quoted shares
is determined by reference to
published price quotation in an
active market.
The Company evaluates its available-
for-sale financial assets to determine
whether the ability and intention
to sell them in the near term is still
appropriate. Reclassification to
loans and receivables is permitted
when the financial assets meet the
definition of loans and receivables
and the Company has the intent and
ability to hold these assets for the
foreseeable future or until maturity.
Notes to the Financial Statements

Annual Report 2015/14
35
Derecognition
A financial asset is derecognised
when:
• Therightstoreceivecashflows
from the asset have expired
• TheCompanyhastransferred
its rights to receive cash flows
from the asset or has assumed
an obligation to pay the received
cash flows in full without material
delay to a third party under a
‘pass-through’ arrangement;
and either (a) the Company
has transferred substantially
all the risks and rewards of the
asset, or (b) the Company has
neither transferred nor retained
substantially all the risks and
rewards of the asset, but has
transferred control of the asset.
When the Company has transferred
its rights to receive cash flows
from an asset or has entered into
a pass-through arrangement, and
has neither transferred nor retained
substantially all of the risks and
rewards of the asset nor transferred
control of it, the asset is recognised
to the extent of the Company’s
continuing involvement in it.
Impairment of Financial Assets
The Company assesses at each
reporting date whether there is any
objective evidence that a financial
asset is impaired. A financial asset
is deemed to be impaired if, and
only if, there is objective evidence
of impairment as a result of one or
more events that has occurred after
the initial recognition of the asset
(an incurred ‘loss event’) and that
loss event has an impact on the
estimated future cash flows of the
financial asset that can be reliably
estimated.
Financial Assets Carried at
Amortised Cost
For financial assets carried at
amortised cost, the Company
first assesses whether objective
evidence of impairment exists
individually for financial assets
that are individually significant, or
collectively for financial assets that
are not individually significant. If
the Company determines that no
objective evidence of impairment
exists for an individually assessed
financial asset, whether significant
or not, it includes the asset in
a group of financial assets with
similar credit risk characteristics
and collectively assesses them
for impairment. Assets that are
individually assessed for impairment
and for which an impairment loss
is, or continues to be, recognised
are not included in a collective
assessment of impairment.
If there is objective evidence that an
impairment loss has been incurred,
the amount of the loss is measured
as the difference between the assets
carrying amount and the present

Shalimar (Malay) PLC
36
value of estimated future cash
flows (excluding future expected
credit losses that have not yet been
incurred). The carrying amount of
the asset is reduced through the use
of an allowance account and the
amount of the loss is recognised in
the Statement of Profit or Loss. If,
in a subsequent year, the amount
of the estimated impairment loss
increases or decreases because
of an event occurring after the
impairment was recognised, the
previously recognised impairment
loss is increased or reduced by
adjusting the allowance account.
(c) Cash & Cash Equivalents
Cash and cash equivalents are
cash in hand, demand deposits and
short-term highly liquid investments,
readily convertible to known
amounts of cash and subject to
insignificant risk of changes in value.
For the purpose of Cash Flow
Statement, cash and cash
equivalents consist of cash in
hand and deposits in banks net
of outstanding bank overdrafts.
Investments in money market
instruments with short maturities i.e.
three months or less from the date
of acquisition are also treated as
cash equivalents.
Financial Liabilities
Initial Recognition and Measurement
Financial liabilities within the
scope of LKAS 39 are broadly
categorised as financial liabilities
at fair value through profit or
loss, loans and borrowings, or as
derivatives designated as hedging
instruments in an effective hedge,
as appropriate. The Company
determines the classification of
its financial liabilities at initial
recognition.
All financial liabilities are recognised
initially at fair value and, in the case
of loans and borrowings, carried at
amortised cost. This includes directly
attributable transaction costs.
The Company’s financial liabilities
include trade and other payables.
Subsequent Measurement
Trade and other payables are
measured at amortised cost.
Derecognition
A financial liability is derecognised
when the obligation under the
liability is discharged or cancelled or
expired.
2.3.4 Inventories
Inventories except for fresh fruit
bunches are stated at cost or net
realisable value whichever is lower,
after making due allowance for
obsolete and slow moving items.
Fresh fruit bunches are stated at
since realised values.
The value of consumables is
determined on a weighted average
cost basis.
Notes to the Financial Statements

Annual Report 2015/14
37
2.3.5 Impairment of Non-Financial Assets
The Company assesses at each
reporting date whether there is
any objective evidence that a
non-financial asset or a group of
non-financial assets is impaired. If
any such indication exists, or when
annual impairment testing for an
asset is required, the Company
makes an estimate of the group of
non-financial asset’s recoverable
amount.
An asset’s recoverable amount is
the higher of an asset’s or cash
generating unit’s fair value less
costs to sell or its value in use and is
determined for an individual asset,
unless the asset does not generate
cash inflows that are largely
independent of those from other
assets or group of non-financial
assets. Where the carrying amount
of an asset exceeds its recoverable
amount, the asset is considered
impaired and is written down to its
recoverable amount.
2.4 Liabilities and Provisions
Liabilities classified as current
liabilities in the Statement of
Financial Position are those
obligations payable on demand or
within one year from the reporting
date. Items classified as non-current
liabilities are those obligations which
become payable beyond a period of
one year from the reporting date.
All known liabilities have been
accounted for in preparing these
Financial Statements. Provisions and
liabilities are recognised when the
Company has a legal or constructive
obligation as a result of past events
and it is probable that an outflow of
economic benefits will be required
to settle the obligation.
2.4.1 Retirement Benefit Obligations
(a) Defined Benefit Plans - Retirement
Gratuity
Gratuity is a defined benefit plan.
The Company is liable to pay gratuity
in terms of relevant statute.
The Company’s operations in
Malaysia are liable to pay Retirement
Gratuity where employees have
served in the Company’s operations
in Malaysia for more than five years
and fulfilling the conditions in the
Malaysian Agricultural Producers
Association and National Union
Plantation Worker’s agreements.
The Company measures the present
value of the promised retirement
benefits of gratuity which is a
defined benefit plan with the advice
of an actuary every year using
“Projected Unit Credit Method”. An
actuarial valuation of the gratuity
liability of the Company as at
31 March 2015 was undertaken
by Actuarial and Management
Consultants (Pvt) Ltd, a firm of
professional actuaries. The result of
such valuation was incorporated in
these Financial Statements.

Shalimar (Malay) PLC
38
The define benefit costs comprise the following:
• Service cost
• Interest cost on the define benefit liability
• Re-measurement of define benefit liability
Service costs which include current service costs, past service costs and gains or losses on non-routine settlements are recognised as expense in profit or loss. Past service costs are recognised when plan amendment or curtailment occurs.
Interest on the defined benefit liability is the change during the period in the defined benefit liability that arises from the passage of time which is determined by applying the discount rate based on the yield on long term government bonds to the defined benefit liability. The interest on the defined benefit liability is recognised as expense or income in profit or loss.
Re-measurements comprising actuarial gains and losses are recognised immediately in other comprehensive income in the period in which they arise. Re-measurements are recognised in retained earnings within equity and are not reclassified to profit or loss in subsequent periods.
Further, this liability is not externally funded.
(b) Defined Contribution Plans - EPF
All employees who are eligible for Defined Provident Fund contributions in Malaysia are covered by relevant contribution funds in line with the relevant statutes.
Employer’s contribution to Defined Provident Fund covering the employees is recognised as an expense in the Statement of Profit or Loss in the period in which it is incurred.
2.4.2 Capital Commitments and Contingencies
All material capital commitments and contingent liabilities which exist as at the reporting date are disclosed in the respective notes to the Financial Statements.
2.5 Statement of Profit or Loss
2.5.1 Revenue
Revenue represents proceeds from sale of fresh fruit bunches from Malaysian Operations and investment income from Sri Lankan operations.
2.5.2 Revenue Recognition
Revenue is recognised to the extent that it is probable that the economic benefits will flow to the Company and the revenue and associated costs incurred or to be incurred can be reliably measured. Revenue is measured at the fair value of the consideration received or receivable net of trade discounts and sales taxes. The following specific criteria are used for the purpose of recognition of revenue:
Sale of fresh fruit bunches - upon delivery and acceptance by customers.
Dividend income - when the shareholders’ right to receive dividend is established.
Interest income - accrued on a time proportionate basis.
Other income - on an accrual basis.
Notes to the Financial Statements

Annual Report 2015/14
39
2.5.3 Expenditure Recognition
The expenses are recognised on an accrual basis. All expenditure incurred in the ordinary course of business and in maintaining the Property, Plant & Equipment in a state of efficiency has been charged to income in arriving at the profit for the year.
For the purpose of presentation of the Statement of Profit or Loss, the Directors are of the opinion that “function of expenses” method presents fairly the elements of the Company’s performance, and hence such presentation method is adopted.
2.6 Segment Reporting
An operating segment is a component of the Company that engages in business activities from which it may earn revenues and incur expenses, including revenues and expenses that relate to transactions with any of the Company’s other components. All operating segments’ operating results are reviewed regularly by the senior management to make decisions about resources to be allocated to the segment and assess its performance, and for which discrete financial information is available.
Segment results that are reported to the senior management and board of directors include items directly attributable to a segment as well as those that can be allocated on a reasonable basis.
Segment capital expenditure is the total cost incurred during the period to acquire property, plant and equipment.
2.7 Related Party Disclosures
Disclosures are made in respect of related party transactions in accordance with LKAS 24.
2.8 Critical Accounting Estimates and Judgments
The preparation of Financial Statements in conformity with Sri Lanka Accounting Standards requires management to make judgments, estimates and assumptions that affect the application of accounting policies and the reported amounts of assets, liabilities, income and expenses.
The estimates and underlying assumptions are based on historical experience and various other factors that are believed to be reasonable under the circumstances, the results of which form the basis of making the judgments about the carrying amount of assets and liabilities that are not readily apparent from other sources. The estimates and underlying assumptions are reviewed on an ongoing basis. Revisions to accounting estimates are recognised in the period in which the estimate is revised if the revision affects only that period or in the period of the revision and future periods if the revision affects both current and future periods.

Shalimar (Malay) PLC
40
Estimates/Judgments made by
management in the application of
Sri Lanka Accounting Standards
that have a significant effect on the
Financial Statements are mentioned
below.
Policy Note
Property,
plant &
equipment
valuation and
depreciation
2.3.1 10
Deferred tax 2.2.2(b) 16
Impairment of
assets
2.3.3
/2.3.6
-
Employee
benefit
liabilities
2.4.1 17
Financial
instrument
2.3.3 9/12/13/18
Biological
assets
valuation
2.3.2 11
2.9. Current Versus Non-Current Classification
The Company presents assets and
liabilities in Statement of Financial
Position based on current/non-
current classification. An asset is
current when it is:
• Expectedtoberealisedor
intended to sold or consumed in
normal operating cycle
• Heldprimarilyforthepurposeof
trading
• Expectedtoberealisedwithin
twelve months after the reporting
period or
• Cashorcashequivalentunless
restricted from being exchanged
or used to settle a liability for at
least twelve months after the
reporting period.
All other assets are classified as
non-current.
A liability is current when:
• Itisexpectedtobesettledin
normal operating cycle
• Itisheldprimarilyforthepurpose
of trading
• Itisduetobesettledwithin
twelve months after the reporting
period or
• Thereisnounconditionalright
to defer the settlement of the
liability for at least twelve months
after the reporting period
The Company classifies all other liabilities as non-current.
Deferred tax assets and liabilities are classified as non-current assets and liabilities.
Notes to the Financial Statements

Annual Report 2015/14
41
2.10. Fair Value Measurement
The Company measures financial
instruments such as investment
in equity instruments, and non-
financial assets such as biological
assets, land, at fair value at each
reporting date. Fair value related
disclosures for financial instruments
and non-financial assets that are
measured at fair value or where
fair values are disclosed are
summarised in the following notes:
Note
Disclosures for
valuation methods,
significant estimates and
assumptions
9/10/11
Quantitative
disclosures of fair value
measurement hierarchy
9
Investment in unquoted
equity shares
9/12.1
Property, plant and
equipment under
revaluation model
10
Financial instruments 12.2
Fair value is the price that would
be received to sell an asset or paid
to transfer a liability in an orderly
transaction between market
participants at the measurement
date. The fair value measurement
is based on the presumption that
the transaction to sell the asset or
transfer the liability takes place either:
• Intheprincipalmarketforthe
asset or liability or
• IntheAbsenceofaprincipal
market, the most advantageous
market for the asset or liability.
• Theprincipalorthemost
advantageous market must be
accessible by the Company.
The fair value of an asset or a liability
is measured using the assumptions
that market participants would use
when pricing the asset or liability,
assuming that market participants
act in their best economic interest.
A fair value measurement of a non-
financial asset takes into account
a market participant’s ability to
generate economic benefits by using
the asset in its highest and best use
or by selling it to another market
participant that would use the asset
in its highest and best use.
The Company uses valuation
techniques that are appropriate in
the circumstances and for which
sufficient data are available to
measure fair value, maximising
the use of relevant observable
inputs and minimising the use of
unobservable inputs.
All assets and liabilities for which
fair value is measured or disclosed
in the Financial Statements are
categorised within the fair value
hierarchy, described as follows,
based on the lowest level input
that is significant to the fair value
measurement as a whole:

Shalimar (Malay) PLC
42
• Level1—Quoted(unadjusted)market prices in active markets for identical assets or liabilities
• Level2—Valuationtechniquesfor which the lowest level input that is significant to the fair value measurement is directly or indirectly observable
• Level3—Valuationtechniquesfor which the lowest level input that is significant to the fair value measurement is unobservable
For assets and liabilities that are recognised in the Financial Statements on a recurring basis, the Company determines whether transfers have occurred between levels in the hierarchy by re-assessing categorisation (based on the lowest level input that is significant to the fair value measurement as a whole) at the end of each reporting period.
External valuers are involved for valuation of significant assets, such as Biological Assets and Freehold Land. Involvement of external valuers is decided upon annually by the Management after discussion with and approval by the Company’s Audit Committee. Selection criteria include market knowledge, reputation, independence and whether professional standards are maintained. The Management decides, after discussions with the
Company’s external valuers, which valuation techniques and inputs to use for each case.
At each reporting date, the Management analyses the movements in the values of assets and liabilities which are required to be remeasured or re-assessed as per the Company’s accounting policies. For this analysis, the Management verifies the major inputs applied in the latest valuation by agreeing the information in the valuation computation to contracts and other relevant documents.
The Management, in conjunction with the Company’s external valuers, also compares the change in the fair value of each asset and liability with relevant external sources to determine whether the change is reasonable.
The Management presents the valuation results to the Audit Committee and the Company’s independent auditors. This includes a discussion of the major assumptions used in the valuations.
For the purpose of fair value disclosures, the Company has determined classes of assets and liabilities on the basis of the nature, characteristics and risks of the asset or liability and the level of the fair value hierarchy as explained above.
Notes to the Financial Statements

Annual Report 2015/14
43
2.11 Standards Issued But Not Yet Effective
The standards and amendments and interpretations that are issued but not yet effective up to the date of issuance of the Company’s Financial Statements are disclosed below. The Company intends to adopt these standards, if applicable, when they become effective.
(a) SLFRS 9 -Financial Instruments: Classification and Measurement
SLFRS 9, as issued, reflects the first phase of work on replacement of LKAS 39 and applies to classification and measurement of financial assets and liabilities.
This standard was originally effective for annual periods commencing on or after 01 January 2015. However, the effective date has been deferred subsequently.
(b) SLFRS 14 - Regulatory Deferral Accounts
The scope of this standard is limited to first-time adopters of SLFRS that already recognise regulatory deferral account balances in their Financial Statements. Consequently, the Financial Statements of rate regulated entities that already apply SLFRS, or that do not otherwise recognise such balances, will not be affected by this standard. This standard is effective for the annual periods beginning on or after 01 January 2016.
(c) SLFRS 15 -Revenue from Contracts with Customers
SLFRS 15 establishes a comprehensive framework for determining whether, how much and when revenue is recognised. It replaces existing revenue recognition guidance, including LKAS 18 Revenue, LKAS 11 Construction Contracts and IFRIC 13 Customer Loyalty Programmes. This standard is effective for the annual periods beginning on or after 01 January 2017.
(d) Amendments to LKAS 16 - Property, Plant and Equipment and LKAS 41-Agriculture
The amendments change the accounting requirements for biological assets that meet the definition of bearer plants. Under the amendments, biological assets that meet the definition of bearer plants will no longer be within the scope of LKAS 41. Instead, LKAS 16 will apply. After initial recognition, bearer plants will be measured under LKAS 16 at accumulated cost (before maturity) and using either the cost model or revaluation model (after maturity). The amendments also require that produce that grows on bearer plants will remain in the scope of LKAS 41 measured at fair value less costs to sell. This amendment is retrospectively effective for annual periods beginning on or after 1 January 2016, with early adoption permitted.
Pending the detailed review on the above standards and interpretations, the extent of the impact has not been determined by the Management.

Shalimar (Malay) PLC
44
For the year ended 31st March 2015 2014 Rs. ‘000 Rs. ‘000
3. REVENUE Oil Palm: Sale of fresh fruit bunches 170,657 215,614 Investment: Dividend income - 99,252 Interest income 1,861 4,164 172,518 319,030 4. OTHER INCOME AND GAINS Other income 527 454 527 454
5. PROFIT BEFORE TAX is stated after charging all expenses including the following:
Depreciation (Note 10) 1,858 1,313 Management fee, performance incentive 20,207 22,940
and sales commission (Note 24.1) Professional fees 2,657 2,901
Auditors’ remuneration 668 654 Directors’ fees (Note 24.2) 900 900 Personnel costs (Note 5.1) 24,149 23,674
5.1 Personnel Costs*
Salaries, wages and other staff related expenses 22,911 22,320 Defined contribution plans - EPF 942 1,036 Retirement benefit obligations (Note 17) 296 318 24,149 23,674
*The Company has no employees other than the plantation workers in its Malaysian operations.
6 TAXATION
6.1 Major Components of Income Tax Expense
The major components of income tax expense for the 12 months period ended 31 March 2015 and 31 March 2014 are:
Statement of Profit or Loss: Current Income Tax
- Current year income tax expense 24,813 33,687
Deferred Tax - Origination/(reversal) of temporary differences (Note 16) 1,240 2,967
Income tax expense reported in the Statement of Profit or Loss 26,053 36,654
Other Comprehensive Income
Deferred tax on actuarial gains and losses (Note 16) (71) 161
Income tax charged directly to other comprehensive income (71) 161
Notes to the Financial Statements

Annual Report 2015/14
45
6.2 Relationship between tax expense and accounting profit
The reconciliation between tax expense and the product of accounting profit multiplied by the applicable corporate tax rate for 12 months period ended 31 March 2015 and 31 March 2014 are as follows:
For the year ended 31st March 2015 2014 Rs. ‘000 Rs. ‘000
Profit before tax 92,255 247,999 Tax at the domestic rates applicable to profits generated in Countries where the Company operates 11,349 30,519 Adjustments: Non-deductible expenses 1,288 979
Income not subject to tax Including biological gains (Note 6.3 (d) & Note 11) (364) (13,642)
Double tax credit for Malaysian Branch (Note 6.3 (c) (11,819) (16,597)Others-Taxation in Malaysian Branch (Note 6.3 (a)) 24,359 32,428
Deferred Tax (Note 16) 1,240 2,967 Income tax expense recognised in profit or loss 26,053 36,654
6.3 Taxation of Profits
(a) The provision for taxation on profits from plantation activities is based on the Company’s liability to income tax in Malaysia. Profits from plantation activities are liable to tax in Malaysia at a rate of 25% (2014 - 25%).
(b) During the year ended 31 March 2015, as provided for under Section 46 of the Inland Revenue Act No. 10 of 2006 amendments and thereto, these profits are liable to tax in Sri Lanka at 12% (2014 - 12%).
(c) In terms of the double tax treaty agreement entered into between Sri Lanka and Malaysia, the Company is entitled to claim credit for tax paid in Malaysia, when calculating the Company’s tax liability in sri Lanka on profits from plantation in Malaysia.
(d) In terms of Section 9 & 10 of the Inland Revenue Act No. 10 of 2006 and amendments thereto, dividend and interest income received from Malaysia is exempt from income tax.
(e) Profits of the Company, other than such referred to in Note 6.3 (b) and (d) are liable to tax at a rate of 28% (2014 - 28%).
6.4 Dividend Tax
Dividend distribution would consist of a distribution of operational profits and a redistribution of dividend income. Redistribution of dividend income received from an already taxed source would not be liable to dividend tax.

Shalimar (Malay) PLC
46
7. EARNINGS PER SHARE The calculation of Earnings per ordinary share of Rs. 9.54 (2014 - Rs. 30.45) is based on the
profit after taxation over the weighted average number of ordinary shares in issue during the year.
Given below is the computation of Earnings Per Share;
For the year ended 31st March 2015 2014
Numerator Profit for the Year (Rs.) 66,201,606 211,345,541 Profit attributable to ordinary shareholders (Rs.) 66,201,606 211,345,541
Denominator Number of ordinary shares (Note 14) 6,940,080 6,940,08 Earnings Per Share (Rs.) 9.54 30.45 For the year ended 31st March 2015 2014 Rs. ‘000 Rs. ‘000
7.1. Dividend Paid or Proposed
Dividends Paid during the year Dividends on ordinary shares: Interim Dividend for 2015: Rs. Nil per share (2014: Rs. 19.59 per share) - 135,956 Final Dividend for 2014: Rs. 11.38 per share (2013: Rs. 14.23 per share) 78,978 98,756
Dividend proposed for approval at AGM (not recognised as a liability as at 31st March) 2015: Rs. 3.56 per share (2014: Rs. 11.38 per share) 24,707 78,978
For the year ended 31st March 2015 2014 Dividend Per Share (Rs.) * 3.56 30.97
*Dividend per share is calculated by considering first and final dividend proposed for the year under review whereas, in the comparative period considering interim dividend paid and final dividend proposed.
8. FOREIGN CURRENCY TRANSLATION
The Accounting Policy of foreign currency translation is shown under 2.2.1 of summary of significant accounting policies. The principal exchange rates used for conversion of foreign currency balances are as follows:
As at 31st March 2015 2014 Rs. Rs.
Malaysian Ringgit 35.80 40.05 US Dollar 133.32 130.73
Notes to the Financial Statements

Annual Report 2015/14
47
09.
FAIR
VA
LUE
MEA
SU
REM
ENT
Th
e fo
llow
ing
tabl
e pr
ovid
es th
e fa
ir va
lue
mea
sure
men
t hie
rarc
hy o
f the
Com
pany
’s a
sset
s w
hich
are
sta
ted
as fa
ir va
lues
.
Fa
ir v
alue
mea
sure
men
t h
iera
rch
y fo
r as
sets
as
at 3
1 M
arch
201
5 an
d 2
014:
Fair
val
ue m
easu
rem
ent
usin
g
Quo
ted
pri
ces
inac
tive
mar
kets
Sign
ifica
nt
obse
rvab
le
inp
uts
Sign
ifica
nt
unob
serv
able
in
put
sD
ate
of
valu
atio
nTo
tal
Rs.
‘000
(Lev
el 1
)R
s. ‘0
00(L
evel
2)
Rs.
‘000
(Lev
el 3
)R
s. ‘0
00A
sset
s m
easu
red
at
fair
val
ue:
As
at 3
1 M
arch
201
5N
on-F
inan
cial
Ass
ets
Land
(Not
e.10
)31
Mar
ch 2
013
1,3
24,7
04
- -
1,3
24,7
04
Biol
ogic
al A
sset
s (N
ote.
11)
31 M
arch
201
5 1
98,7
06
- -
198
,706
Non
-Fin
anci
al A
sset
s as
at
31 M
arch
201
5 1
,523
,410
-
- 1
,523
,410
Ava
ilab
le-f
or-s
ale
(AFS
) fin
anci
al a
sset
sU
nquo
ted
equi
ty s
hare
s
Shal
imar
Dev
elop
men
ts S
dn.B
hd (N
ote.
12.1
)31
Mar
ch 2
015
3,9
22,3
51
- -
3,9
22,3
51
AFS
fin
anci
al a
sset
s as
at
31 M
arch
201
5 3
,922
,351
--
3,9
22,3
51
As
at 3
1 M
arch
201
4N
on-F
inan
cial
Ass
ets
Land
(Not
e.10
)31
Mar
ch 2
013
1,4
81,7
57
- -
1,4
81,7
57
Biol
ogic
al A
sset
s (N
ote.
11)
31 M
arch
201
4 2
19,5
16
- -
219
,516
Non
-Fin
anci
al A
sset
s as
at
31 M
arch
201
4 1
,701
,273
-
- 1
,701
,273
AFS
fin
anci
al a
sset
sU
nquo
ted
equi
ty s
hare
s
Shal
imar
Dev
elop
men
ts S
dn.B
hd (N
ote.
12.1
)31
Mar
ch 2
014
3,4
58,3
37
- -
3,4
58,3
37
AFS
fin
anci
al a
sset
s as
at
31 M
arch
201
4 3
,458
,337
-
- 3
,458
,337
Ke
y as
sum
ptio
ns, m
etho
ds o
f val
uatio
ns a
nd s
igni
fican
t uno
bser
vabl
e in
puts
for
asse
ts c
ateg
oris
ed u
nder
Lev
el 3
of t
he F
air
valu
e m
easu
rem
ent
hier
arch
y ar
e di
sclo
sed
unde
r N
ote
10,1
1 an
d 12
to th
e Fi
nanc
ial S
tate
men
ts.

Shalimar (Malay) PLC
48
Notes to the Financial Statements10
. PR
OPE
RTY,
PLA
NT
& E
QU
IPM
ENT
Pl
ant,
Fu
rnit
ure
Free
hol
d
Free
hol
d
Mac
hin
ery
and
M
otor
To
tal
La
nd
B
uild
ings
&
Eq
uip
men
t Fi
ttin
gs
Veh
icle
s
Rs.
‘000
R
s. ‘0
00
Rs.
‘000
R
s. ‘0
00
Rs.
‘000
R
s. ‘0
00
C
ost/
Val
uati
on
As
at 0
1 A
pri
l 201
4
1,48
1,75
7 35
,364
1,
137
1,36
6 9,
231
1,52
8,85
5
Add
ition
s
- -
- 28
8 -
288
D
ispo
sals
- -
- -
(2,3
85)
(2,3
85)
Writ
e-of
f
- (1
,381
) (3
69)
- -
(1,7
50)
Tran
slat
ion
adju
stm
ent f
or th
e ye
ar
(1
57,0
53)
(3,6
02)
(82)
(1
58)
(979
) (1
61,8
74)
A
s at
31
Mar
ch 2
015
1,
324,
704
30,3
81
686
1,49
6 58
67
1,36
3,13
4
Dep
reci
atio
n
A
s at
01
Apr
il 20
14
-
9,57
4 90
4 10
01
8,62
2 20
,101
Cha
rge
for t
he y
ear
-
1,52
0 54
62
22
2 1,
858
D
ispo
sals
- -
- -
(2,3
85)
(2,3
85)
W
rite-
off
-
(148
) (3
69)
- -
(517
)
Tran
slat
ion
adju
stm
ent f
or th
e ye
ar
-
(1,7
36)
(61)
(1
07)
(937
) (2
,841
)
As
at 3
1 M
arch
201
5
- 9,
210
528
956
5,52
2 16
,216
Net
Boo
k V
alue
As
at 3
1 M
arch
201
5
1,32
4,70
4 21
,171
15
8 54
0 34
5 1,
346,
918
A
s at
31
Mar
ch 2
014
14
81,7
57
25,7
90
233
365
609
1,50
8,75
4
(i)
The
free
hold
land
was
reva
lued
on
31st
Mar
ch 2
013
base
d on
exi
stin
g us
e ba
sis,
by
an in
depe
nden
t val
uer E
ncik
W. M
. Mal
ik, a
mem
ber o
f th
e In
stitu
tion
of S
urve
yors
, Mal
aysi
a, a
par
tner
with
W. M
. Mal
ik &
Kam
aruz
aman
. The
Com
pany
has
obt
aine
d a
confi
rmat
ion
of th
e va
lue
of
free
hold
land
as
at 3
1st M
arch
201
5 fr
om th
e sa
me
valu
er, a
nd th
e ca
rryi
ng v
alue
app
roxi
mat
es it
s fa
ir va
lue.
Val
uati
on t
ech
niq
ue
S
ign
ific
ant
unob
serv
able
val
uati
on in
put
Exis
ting
use
basi
s In
dica
tive
mar
ket v
alue
of c
ompa
rabl
e la
nd
Si
gnifi
cant
incr
ease
s (d
ecre
ases
) in
Indi
cativ
e m
arke
t val
ue p
er h
ecta
re o
f com
para
ble
land
wou
ld re
sult
in a
sig
nific
antly
hig
her (
low
er) f
air v
alue
m
easu
rem
ent.
(ii)
The
carr
ying
val
ue o
f the
free
hold
land
, if t
he a
sset
was
car
ried
at h
isto
rical
cos
t wou
ld b
e Rs
. 22
mn
(201
4 - R
s. 2
2 m
n).
(ii
i)
Prop
erty
, pla
nt &
equ
ipm
ent i
nclu
des
fully
dep
reci
ated
ass
ets
havi
ng a
gro
ss c
arry
ing
amou
nt o
f Rs.
13.9
4 m
n (2
014
- Rs.
14.4
0 m
n.)
(iv)
All
pro
pert
y, p
lant
and
equ
ipm
ent a
re lo
cate
d in
Mal
aysi
a.(v
) D
urin
g th
e fin
anci
al y
ear,
the
Com
pany
acq
uire
d an
d pa
id fo
r pro
pert
y, p
lant
and
equ
ipm
ent t
o th
e ag
greg
ate
valu
e of
Rs.
0.2
9 m
n (2
014:
Rs
.0.6
6 m
n).

Annual Report 2015/14
49
As at 31st March 31st March 2015 2014 Rs. ‘000 Rs. ‘000
11. BIOLOGICAL ASSETS Carrying value at the beginning of the year 219,516 211,105 Gain arising from changes in fair value 2,994 14,122 222,510 225,227 Currency translation differences (23,804) (5,711) Carrying value at the end of the year 198,706 219,516
Biological assets represent mature palm oil plantations in Malaysia. As market determined prices or values are not readily available for plantations in its present condition, the Company uses present value of expected future cash flows from the assets of the plantation, discounted at current market determined pre-tax rate in establishing the fair value.
Gains or losses arising on initial recognition of plantations at fair value less costs to sell and from the changes in fair values of plantations at each reporting date are included in the profit or loss for the respective period. The deferred tax impact on recognition of biological assets has been charged to the Statement of Profit or Loss.
Analysis of biological assets are as follows: 2015 2014
Rs. ‘000 Rs. ‘000 Plantation Values Mature Plantation 198,706 219,516 198,706 219,516 Ha Ha
Plantation Area Mature Plantation 304.50 304.50 304.50 304.50
11.1 The Company obtains the services of an independent professional valuer to establish the fair value of the biological assets. Accordingly, the biological assets of the Company have been valued as at 31st March 2015 and 31st March 2014 by KJPP Rengganis, Hamid & Partners of Indonesia. These valuations are performed in accordance with international valuation standards, using the following key assumptions:
(a) Projected economic production life of palm oil plants is 22 years (2014: 22 years) after maturity.
(b) Malaysian discount rate per annum of 8.58% in 2015 (2014: 8.27%). (c) This valuation is based on market FFB Price. FFB price for the first year is estimated at
RM 466 per MT. FFB price is projected to increase for second year at RM 520 per MT. The third year is estimated at RM 517 per MT. The forth and fifth years are estimated at RM 516 MT. The remaining years are estimated at RM 516 per MT.
(d) Yield per hectare of 16 MT to 29 MT in 2015 (2014: 20 MT to 37 MT). Yield per hectare is based on year of planting, maturity profile and terrain of the plantation.

Shalimar (Malay) PLC
50
11.2 Sensitivity of the key assumptions used
FFB Price Discount Rate Yield
5% Increase 5% Decrease 1% Increase 1% Decrease 5% Increase 5% Decrease Rs. ‘000 Rs. ‘000 Rs. ‘000 Rs. ‘000 Rs. ‘000 Rs. ‘000
Effect on the carrying value of biological assets 6,981 (6,981) (5,835) 5,871 5,871 (5,943)
12. FINANCIAL ASSETS AND FINANCIAL LIABILITIES
12.1. Non-Current Financial Assets
As at 31st March 31st March 2015 2014 Rs. ‘000 Rs. ‘000
Available-for-sale investments Unquoted equity shares (12.1.a) 3,922,351 3,458,337 Total available-for-sale investments 3,922,351 3,458,337 Total financial assets: Non-Current 3,922,351 3,458,337
12.1.a Available-for-sale investment — Unquoted Equity Shares
The Company holds a 13.33% equity investment (2014: 13.33%) in Shalimar
Development Sdn. Bhd (SDSB), an investment holding company incorporated in
Malaysia. The sole equity investment of SDSB is in PT Agro Indomas (PTAI), an oil
palm plantation company based in Indonesia, in which it has a controlling interest.
The Company has designated its investment in SDSB as an available-for-sale
investment.
12.2. Fair Values
Set out below is a comparison by class of the carrying amounts and fair values of the
Company’s financial Instruments that are carried in the Financial Statements.
As at 31st March 31st March 31st March 31st March
2015 2014 2015 2014 Rs. ‘000 Rs. ‘000 Rs. ‘000 Rs. ‘000
Financial assets Carrying amount Fair value
Available for sale investments 3,922,351 3,458,337 3,922,351 3,458,337
Total 3,922,351 3,458,337 3,922,351 3,458,337
Notes to the Financial Statements

Annual Report 2015/14
51
The value of the Company’s unquoted investment in SDSB has been determined
based on the fair value of SDSB’s investment in PTAI. In arriving at fair value of
SDSB’s investment in PTAI, property, plant and equipment and biological assets
have been valued with reference to market based information by an independent
professional valuer as at 31 December 2014.
The Management assessed that the fair value of cash and short term deposits, trade
and other receivable, trade and other payable approximate their carrying amount
largely due to the short terms maturities of these instruments.
12.3. Description of significant unobservable inputs to valuation:
The significant unobservable inputs used in the fair value measurement categorised
within Level 3 of the fair value hierarchy (Note 9) together with a quantitative
sensitivity analysis as at 31 March 2015 are as shown below:
Assets Valuation Significant Range Sensitivity of technique unobservable inputs the input to
fair value
AFS assets in Fair Value of Fair Value of + or - 5% Change in business unquoted Consolidated Consolidated operations of the equity shares- net Assets Net Assets per investee Company
Shalimar Share would result in a Developments change in Sdn. Bhd. net assets value.
5% increase (decrease) in the fair value of consolidated net asset per share would result in an increase (decrease) in fair value by Rs.196 mn
13. TRADE AND OTHER RECEIVABLES
As at 31st March 31st March 2015 2014 Rs. ‘000 Rs. ‘000
Trade debtors 9,284 19,256 Other Debtors - 355 Amounts Due From Related companies − Indo-Malay PLC (Fellow Subsidiary) 15,586 - 24,870 19,611

Shalimar (Malay) PLC
52
Notes to the Financial Statements
As at 31 March, the ageing analysis of trade receivables is as follows:
Neither Past Past due but not impaired Total due nor <30 30 -60 61 - 90 90
impaired days days days days Rs.’000 Rs.’000 Rs. Rs. Rs. Rs.
At 31 March 2015 9,284 9,284 - - - - At 31 March 2014 19,256 19,256 - - - -
14. STATED CAPITAL
As at 31st March 31st March 2015 2014 Rs. ‘000 Rs. ‘000
Issued and Fully Paid-Ordinary 6,940,080 Ordinary Shares 69,401 69,401 69,401 69,401
15. OTHER RESERVES
As at 31st March 31st March 2015 2014 Rs. ‘000 Rs. ‘000
Currency translation reserve (248,920) (69,900) Available-for-sale reserve 3,830,517 3,366,503 Capital accretion reserve 1,523,893 1,523,893 5,105,490 4,820,496
Currency translation reserve
Currency translation reserve represents exchange differences arising from the translation of the Financial Statements of foreign operations whose functional currencies are different from that of the Company’s presentation currency.
Available-for-sale reserve
Available-for-sale reserve represents the excess between the fair value and cost of available-for-sale financial assets.
Capital accretion reserve
Capital accretion reserve includes surplus arising from revaluation of property, plant and equipment.
The movements of the above reserves are given in the Statement of Other Comprehensive Income.

Annual Report 2015/14
53
16. DEFERRED TAX
Statement of financial Statement of position profit or loss 31st March 31st March 2015 2014 2015 2014 Rs. ‘000 Rs. ‘000 Rs. ‘000 Rs. ‘000
Deferred Tax Liability Deferred Tax on Property, Plant & Equipment 3,681 3,633 48 832 Deferred Tax on Biological Assets 55,891 54,879 1,012 2,103 59,572 58,512 1,060 2,935
Deferred Tax Assets Defined Benefit Plans - Through Statement of Profit or Loss (571) (751) 180 31 Defined Benefit Plans - Through Other Comprehensive Income (71) 161 - Provision for Ex-Gratia (11) (11) - 1 (653) (601) 180 32
Effect of Exchange Rate movement (8,702) (530) - - Deferred Tax expense 1,240 2,967 Net Deferred Tax Liability 50,217 57,381
2015 2014 Rs. ‘000 Rs. ‘000
16.1 Reconciliation of Deferred Tax Charge / (Reversal)
Deferred Tax Charge/ (Reversal) reported in the Statement of Profit or Loss 1,240 2,967 Deferred Tax Reversal reported in Other Comprehensive Income (71) 161 1,169 3,128
17. RETIREMENT BENEFIT OBLIGATIONS
As at 31st March 31st March 2015 2014 Rs. ‘000 Rs. ‘000
Retirement Benefits Obligation-Gratuity Beginning of the year 2,358 3,129 Charge for the year (Note 17.1) 296 318 Actuarial gain - Recognised in Other Comprehensive Income 294 (642) Payments made during the year - (375) Exchange Loss (274) (72) End of the year 2,674 2,358

Shalimar (Malay) PLC
54
Notes to the Financial Statements
Messrs. Actuarial & Management Consultants (Pvt) Ltd. Independent Actuaries, carried out an actuarial valuation of the defined benefit plan gratuity on March 31, 2015. Appropriate and compatible assumptions were used in determining the cost of retirement benefits. The principal assumptions used are as follows:
2015 2014
Discount Rate 4% 4% Salary Increase Rate 3% 3% Withdrawal Rate 10% 10%
2015 2014 Rs. ’000 Rs. ’00017.1 Charge for the year Interest Cost 208 122 Current Service Cost 88 196 296 318
17.2 Sensitivity of the principal assumptions used
Expected Future Salaries Discount Rate 0.5% increase 0.5% decrease 1% increase 1% decrease
Rs. ‘000 Rs. ‘000 Rs. ‘000 Rs. ‘000
The Change in Present value of Defined Benefit Obligation 89 (86) (211) 243
17.3 The average future working life of the defined benefit obligation at the end of the reporting period is 8 years.
18. TRADE AND OTHER PAYABLES
As at 31st March 31st March 2015 2014 Rs. ‘000 Rs. ‘000
Trade creditors 2,738 10,438 Unclaimed dividend 383 434 3,121 10,872

Annual Report 2015/14
55
19. SEGMENTAL REPORTING
For Management purpose , the Company is orgainsed into the following two business segments.
(A) Industry
Oil Palm Investments Company 2015 2014 2015 2014 2015 2014 Rs. ‘000 Rs. ‘000 Rs. ‘000 Rs. ‘000 Rs. ‘000 Rs. ‘000 Revenue External revenue 170,657 215,614 1,861 103,416 172,518 319,030 170,657 215,614 1,861 103,416 172,518 319,030 Result
Segment result 93,746 147,439 (1,491) 100,560 92,255 247,999 Taxation (25,760) (35,729) (293) (925) (26,053) (36,654) 67,986 111,710 (1,784) 99,635 66,202 211,345 Other Information
Segment assets 1,598,455 1,790,535 3,942,578 3,494,064 5,541,033 5,284,599 Segment liabilities 56,898 72,514 1,660 1,605 58,558 74,119 Capital expenditure 288 656 - - 288 656 Depreciation 1,858 1,313 - - 1,858 1,313 Retirement benefits charge 296 318 - - 296 318
(B) Geographical
Malaysia Sri Lanka Company 2015 2014 2015 2014 2015 2014 Rs. ‘000 Rs. ‘000 Rs. ‘000 Rs. ‘000 Rs. ‘000 Rs. ‘000
Revenue 170,657 215,614 1,861 103,416 172,518 319,030 Non-Current Assets 1,545,624 1,728,270 3,922,351 3,458,337 5,467,975 5,186,607

Shalimar (Malay) PLC
56
Notes to the Financial Statements
20. CONTRACTS FOR CAPITAL EXPENDITURE
There were no material contracts for capital expenditure as at the reporting date.
21. ASSETS PLEDGED
There were no assets pledged as at the reporting date.
22. EVENTS AFTER THE REPORTING PERIOD
After satisfying the solvency test in accordance with Section 57 of the Companies Act No. 7 of 2007, the Directors recommended the payment of first and final dividend of Rs. 3.56 per share for the year ended 31st March 2015. However, in accordance with Sri Lanka Accounting Standard No. 10 (LKAS-10) Events After the Reporting Period, this proposed first and final dividend has not been recognised as a liability as at 31st March 2015. This would result in a total outflow of Rs. 24.71 mn subject to approval at the forthcoming Annual General Meeting.
There were no circumstances which require adjustment to or disclosures in these Financial Statements other than disclosed above.
23. CONTINGENT LIABILITIES
As per the interim Budget 2015 passed in the Parliament of Sri Lanka on 07th February 2015, the Government proposed a one off 25% Super Gain Tax (SGT) be imposed on companies based on either the company level or consolidated level, if in a Group profits if same is in excess of Rs. 2,000 mn profit before income tax as per the Audited Financial Statement in the Financial Year 2013/14. The Bill in respect of the above budget proposal was issued by the Government of Sri Lanka on 30th March 2015. The consolidated profit before tax of Carson Cumberbatch PLC, the parent Company of Goodhope Asia Holdings Limited, exceeds this threshold.
Accordingly, the Company will become liable for SGT based on taxable income for the year of assessment 2013/14. SGT is to be paid in three instalments commencing from 15th May 2015. The probable impact of SGT on the Company is estimated at approximately Rs. 33.56 mn. However, as of the date of authorising the Financial Statements by the Board of Directors, this bill has not been passed in the Parliament. Only in the event the Bill is enacted as law, the Company will become liable to pay the estimated SGT.
There are no other material contingent liabilities as at the reporting date.

Annual Report 2015/14
57
24.
REL
ATE
D P
AR
TY D
ISC
LOS
UR
ES
24.1
Tr
ansa
ctio
ns
wit
h R
elat
ed C
om
pan
ies
- 20
15
Nam
e of
th
e C
omp
any
Rel
atio
nsh
ipN
atur
e of
Tra
nsa
ctio
nTr
ansa
ctio
n
Val
ueD
urin
g th
e ye
arR
s.’0
00
Am
oun
t O
utst
and
ing
as
at 3
1.03
.201
5 R
s.’0
00
01A
gro
Har
apan
Les
tari
Sdn.
Bhd
. (A
HLS
B)Fe
llow
Sub
sidi
ary
(Man
ager
s)M
anag
emen
t fee
, Pe
rfor
man
ce in
cent
ive
and
Sale
s co
mm
issi
on
(20,
207)
-
02Sh
alim
ar D
evel
opm
ents
Sdn
. Bhd
. (SD
SB)
Fello
w S
ubsi
diar
yD
ivid
end
inco
me
- -
03In
do-M
alay
PLC
Fello
w S
ubsi
diar
yD
ivid
end
paid
(1
,748
) -
Shor
t Ter
m L
endi
ng 1
5,58
6 15
,586
Inte
rest
inco
me*
396
-
04Se
linsi
ng P
LCFe
llow
Sub
sidi
ary
Div
iden
d pa
id(8
,478
)-
05G
oodh
ope
Asi
a H
oldi
ngs
Ltd
Imm
edia
te P
aren
tD
ivid
end
paid
(65,
716)
-
06C
arso
ns M
anag
emen
t Ser
vice
s (P
vt) L
tdG
roup
Com
pany
Secr
etar
ial e
xpen
ses
(488
) -
07A
HL
Busi
ness
Sol
utio
ns (P
vt) L
tdFe
llow
Sub
sidi
ary
Dat
a pr
oces
sing
and
(3,9
67)
-IT
sup
port
fee
-
08G
ood
Hop
e PL
CFe
llow
Sub
sidi
ary
Div
iden
d pa
id (2
,448
) -
TOTA
L am
ount
s du
e to
Rel
ated
Par
ties
-
TOTA
L am
ount
s du
e fr
om R
elat
ed P
artie
s15
,586
The
all r
elat
ed p
arty
tran
sact
ions
hav
e be
en c
ondu
cted
on
an a
gree
d co
mm
erci
al te
rms
with
the
resp
ectiv
e pa
rtie
s.
*Int
eres
t rec
eive
d on
the
tem
pora
ry c
ash
adva
nces
giv
en to
Indo
-Mal
ay P
LC, a
fello
w s
ubsi
diar
y, a
t the
pre
vaili
ng m
arke
t rat
es in
Mal
aysi
a.

Shalimar (Malay) PLC
58
Notes to the Financial Statements
24.
REL
ATE
D P
AR
TY D
ISC
LOS
UR
ES
24.1
Tr
ansa
ctio
ns
wit
h R
elat
ed C
om
pan
ies
- 20
14
Nam
e of
th
e C
omp
any
Rel
atio
nsh
ipN
atur
e of
Tra
nsa
ctio
nTr
ansa
ctio
n
Val
ueD
urin
g th
e ye
arR
s.’0
00
Am
oun
t O
utst
and
ing
as
at 3
1.03
.201
4 R
s.’0
00
01A
gro
Har
apan
Les
tari
Sdn.
Bhd
. (A
HLS
B)Fe
llow
Sub
sidi
ary
(Man
ager
s)M
anag
emen
t fee
, Pe
rfor
man
ce In
cent
ive
and
Sale
s co
mm
issi
on
(22,
940)
-
02Sh
alim
ar D
evel
opm
ents
Sdn
. Bhd
. (SD
SB)
Fello
w S
ubsi
diar
yD
ivid
end
inco
me
99,2
52 -
03In
do-M
alay
PLC
Fello
w S
ubsi
diar
yD
ivid
end
paid
(5,1
94)
-
04Se
linsi
ng P
LCFe
llow
Sub
sidi
ary
Div
iden
d pa
id(2
5,19
5)
05G
oodh
ope
Asi
a H
oldi
ngs
Ltd
Imm
edia
te P
aren
tD
ivid
end
paid
(188
,953
)-
06C
arso
ns M
anag
emen
t Ser
vice
s (P
vt) L
tdG
roup
Com
pany
Secr
etar
ial e
xpen
ses
(408
) -
07A
HL
Busi
ness
Sol
utio
ns (P
vt) L
tdFe
llow
Sub
sidi
ary
Dat
a pr
oces
sing
and
-IT
sup
port
fee
(4,0
07)
-
08G
ood
Hop
e PL
CFe
llow
Sub
sidi
ary
Div
iden
d pa
id(7
,276
)-
09Eq
uity
One
PLC
Gro
up C
ompa
nySe
rvic
e C
harg
es(8
)-
TOTA
L am
ount
s du
e to
Rel
ated
Par
ties
-
TOTA
L am
ount
s du
e fr
om R
elat
ed P
artie
s-
The
all r
elat
ed p
arty
tran
sact
ions
hav
e be
en c
ondu
cted
on
an a
gree
d co
mm
erci
al te
rms
with
the
resp
ectiv
e pa
rtie
s.

Annual Report 2015/14
59
24.2 Compensation to key management personnel
2015 2014 Rs. ‘000 Rs. ‘000
Emoluments/Fees 900 900 Key management personnel of the Company to whom the above fee relates, are non-
executive members of the Board of Directors. Details of the non-executive directors are given in note 14.1 on page 14 under the Annual Report of the Board of Directors on the affairs of the Company. Executive Directors are not compensated for their role on the Board.
24.3 No material transactions have taken place during the year with the parties/entities in which key management personnel or their close family members have control, joint control or significant influence, which require disclosure in these Financial Statements other than those disclosed under 24.1 and 24.2 above.
25. FINANCIAL RISK MANAGEMENT OBJECTIVES AND POLICIES
The Company’s principal financial assets comprise of trade and other receivables and cash and short term deposits derived directly from its operations. The Company also holds available-for-sale investments. The Company’s principal financial liabilities comprise of trade and other payables.
The Company is exposed to the following areas of risks.
(a) Commodity price risk
The Company’s primary source of cash inflows are from the sale of Fresh Fruit Bunches (FFB). As the FFB prices (Net Sales Average-NSA) are determined by international market prices for Crude Palm Oil (CPO), the Company may be adversely affected by unfavourable price fluctuations. Company’s end product is FFB.
As at 31st March 2015, had the NSA (price of FFB) been 5% higher/lower with all other variables remaining constant, profit before tax would have increased/decreased by Rs.8.50 mn (2014: Rs.10.78 mn).
(b) Investment risk
The Company’s listed and unlisted equity securities are susceptible to market price risk arising from uncertainties.
The quoted equity investment value could be impacted due to changes in the prices. These are recognised in the Statement of Comprehensive Income.
The unquoted equity investment value could be impacted due to fluctuations/ volatilities in the performance of the investee Company.
At the reporting date, the exposure to unlisted equity securities at fair value was Rs. 3.93 mn. Sensitivity analysis of these investments have been provided in Note 12.3.

Shalimar (Malay) PLC
60
(c) Foreign exchange risk
The Company’s exposure to foreign exchange transaction risk is minimal as the Malaysian and Sri Lankan operations are primarily domestic and transactions are recorded in the respective functional currencies, i.e, Malaysian Ringgit and Sri Lankan Rupee.
A significant element of exchange risk is generated through the translation of financial results into the Sri Lankan rupee for the purpose of financial reporting as the principal operations are in Malaysia.
Foreign Currency sensitivity
The following table demonstrates the sensitivity to a reasonably possible changes in the Sri Lankan Rupees and Malaysian Ringgit exchange rates, with all other variables held constant. The impact on the Company’s equity is due to changes in the fair value of Available for sale Financial Investment and net investment in Malaysian branch.
Change in MYR Rate 2% increase 2% decrease Rs. ‘000 Rs. ‘000
Effect on equity of the Company 79,665 (79,665)
(d) Credit Risk
The Company is exposed to credit risk primarily from its trade receivables, which arise from its operating activities and its deposits with Banking Institutions. The Company’s objective is to seek continual revenue growth while minimising losses incurred due to increased credit risk exposure.
The Company trades only with recognised and credit worthy third parties and all customers are subject to a credit verification process. In addition, receivable balances are monitored on an ongoing basis with the result that the Company’s exposure to bad debts is minimal.
(e) Liquidity Risk
The Company manages liquidity risk exposures through effective working capital management. The Company also has planning guidelines in place to ensure that the short term and medium term liquidity is managed at acceptable levels.
Notes to the Financial Statements

Annual Report 2015/14
61
Five Year Summary
SLFRS SLASFor the year ended 31st March 2015 2014 2013 2012 2011 Rs.’000 Rs.’000 Rs.’000 Rs.’000 Rs.’000
Operating Results
Revenue 170,518 319,030 292,349 289,960 260,213
Profit Before Taxation 92,255 247,999 223,973 279,133 193,866
Taxation (26,053) (36,654) (45,032) (57,935) (40,846)
Profit for the Year 66,202 211,345 178,941 221,198 153,020
SLFRS SLASAs at 31st March 2015 2014 2013 2012 2011 Rs.’000 Rs.’000 Rs.’000 Rs.’000 Rs.’000
Statement of Financial PositionAssetsNon-Current AssetsProperty, plant and equipment 1,346,918 1,508,754 1,544,088 1,571,396 1,426,456Biological assets 198,706 219,516 211,105 195,598 -Non-current financial assets 3,922,351 3,458,337 3,741,261 3,584,066 91,834 5,467,975 5,186,607 5,496,454 5,351,060 1,518,290Current Assets 73,058 97,992 139,651 283,829 218,412Total Assets 5,541,033 5,284,599 5,636,105 5,634,889 1,736,702
Equity and LiabilitiesStated capital 69,401 69,401 69,401 69,401 69,401Reserves 5,413,074 5,141,079 5,489,267 5,497,588 1,629,683 5,482,475 5,210,480 5,558,668 5,566,989 1,699,084 Non-Current LiabilitiesDeferred tax liability 50,217 57,381 54,281 50,005 17,940Retirement benefit obligations 2,674 2,358 3,129 3,173 2,236 52,891 59,739 57,410 53,178 20,176Current Liabilities 5,667 14,380 20,027 14,721 17,442Total Equity & Liabilities 5,541,033 5,284,599 5,636,105 5,634,889 1,736,702
SLFRS SLASFor the year ended 31st March 2015 2014 2013 2012 2011 Rs.’000 Rs.’000 Rs.’000 Rs.’000 Rs.’000
Cash Flow StatementsNet cash (outflows)/inflows from operating activities 42,268 182,174 171,175 205,121 175,164Net cash (outflows)/inflows from investing activities 2,051 3,507 (7.353) 60,106 (10,793)Net cash used in financing activities (79,029) (234,973) (302,625) (150,007) (69,401)Net (decrease)/increase in cash & cash equivalents (34,710) (49,292) (138,803) 115,220 94,970
Amounts in the above Five Year Summary applicable for 2015,2014,2013,2012 are based on SLFRS whilst 2011 is based on SLAS.
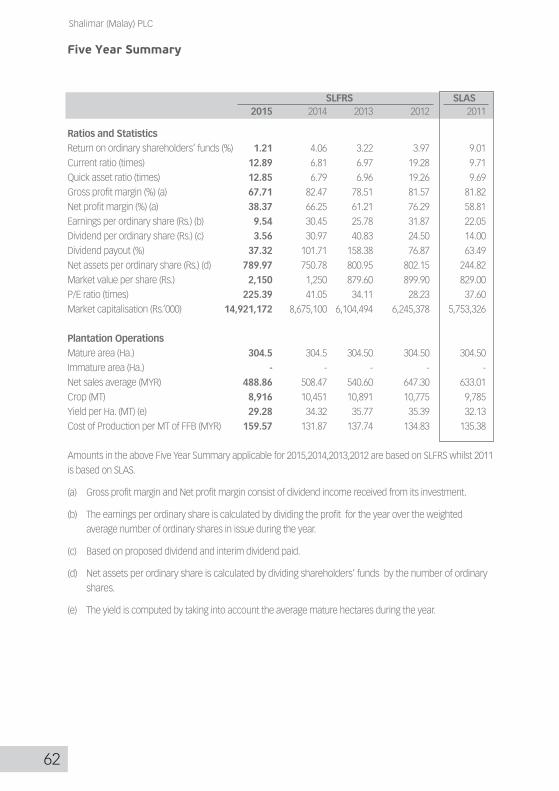
Shalimar (Malay) PLC
62
SLFRS SLAS 2015 2014 2013 2012 2011
Ratios and StatisticsReturn on ordinary shareholders’ funds (%) 1.21 4.06 3.22 3.97 9.01 Current ratio (times) 12.89 6.81 6.97 19.28 9.71 Quick asset ratio (times) 12.85 6.79 6.96 19.26 9.69 Gross profit margin (%) (a) 67.71 82.47 78.51 81.57 81.82Net profit margin (%) (a) 38.37 66.25 61.21 76.29 58.81Earnings per ordinary share (Rs.) (b) 9.54 30.45 25.78 31.87 22.05 Dividend per ordinary share (Rs.) (c) 3.56 30.97 40.83 24.50 14.00 Dividend payout (%) 37.32 101.71 158.38 76.87 63.49 Net assets per ordinary share (Rs.) (d) 789.97 750.78 800.95 802.15 244.82 Market value per share (Rs.) 2,150 1,250 879.60 899.90 829.00 P/E ratio (times) 225.39 41.05 34.11 28.23 37.60 Market capitalisation (Rs.’000) 14,921,172 8,675,100 6,104,494 6,245,378 5,753,326 Plantation Operations Mature area (Ha.) 304.5 304.5 304.50 304.50 304.50 Immature area (Ha.) - - - - - Net sales average (MYR) 488.86 508.47 540.60 647.30 633.01 Crop (MT) 8,916 10,451 10,891 10,775 9,785 Yield per Ha. (MT) (e) 29.28 34.32 35.77 35.39 32.13 Cost of Production per MT of FFB (MYR) 159.57 131.87 137.74 134.83 135.38
Amounts in the above Five Year Summary applicable for 2015,2014,2013,2012 are based on SLFRS whilst 2011 is based on SLAS.
(a) Gross profit margin and Net profit margin consist of dividend income received from its investment.
(b) The earnings per ordinary share is calculated by dividing the profit for the year over the weighted average number of ordinary shares in issue during the year.
(c) Based on proposed dividend and interim dividend paid.
(d) Net assets per ordinary share is calculated by dividing shareholders’ funds by the number of ordinary shares.
(e) The yield is computed by taking into account the average mature hectares during the year.
Five Year Summary

Annual Report 2015/14
63
Statement of Value Added
2015 % 2014 % Rs. ‘000 Rs. ‘000
Revenue 172,518 319,030 Gain arising from changes in fair value of 2,994 14,122 biological assets Other income & gains 527 454 176,039 333,606 Bought in materials and services (58,071) (59,978) 117,968 273,628 Distributed as follows: To Employees as remuneration 24,149 20.47 23,674 8.65To Government as taxation 24,813 21.03 33,687 12.31To Providers of capital as ordinary dividends 78,978 66.95 234,712 85.78Retained in the Business as depreciation 1,858 1.58 1,313 0.48as deferred tax 1,169 0.99 3,128 1.14as retained profits (12,999) (11.02) (22,886) (8.36) 117,968 100 273,628 100
The Statement of Value Added shows the quantum of wealth generated by the activities of the Company and its application.

Shalimar (Malay) PLC
64
US$ FinancialsPreparation of
US Dollar Financials
The Financial Statements of the Company are stated in Sri Lankan Rupees.
The translation of the Sri Lankan Rupee amounts into US Dollars is
included solely for the convenience of Shareholders, Investors,
Bankers and other users of Financial Statements.
US Dollar financials do not form part of the
Audited Financial Statements of the Company.

Annual Report 2015/14
65
Statement of Profit or Loss
For the year ended 31st March 2015 2014 US$ US$
Revenue 1,317,213 2,471,654
Direct operating costs (425,113) (429,408)
Gross Profit 892,100 2,042,246
Gain arising from changes in fair value of biological assets 24,505 108,491
Other income and gains 245 3,450
Administrative expenses (210,446) (228,193)
Profit Before Income Tax 706,404 1,925,994
Income tax expense (198,970) (281,489)
Profit for the Period 507,434 1,644,505
Figures in brackets indicate deductions.

Shalimar (Malay) PLC
66
Statement of Financial Position
As at 31st March 31st March 2015 2014 US$ US$
Assets
Non-Current Assets
Property, plant and equipment 10,102,895 11,540,994
Biological assets 1,490,441 1,679,156
Non-current financial assets 29,420,575 26,454,043
Total Non-Current Assets 41,013,911 39,674,193
Current Assets
Inventories 1,729 2,619
Trade and other receivables 187,346 147,299
Advance and prepayments 4,330 4,050
Taxation recoverable 31,699 -
Cash and cash equivalents 323,686 595,609
Total Current Assets 548,790 749,577
Total Assets 41,562,701 40,423,770
Equity and Liabilities
Equity
Stated capital 868,000 868,000
Retained earnings 4,531,927 4,632,504
Other reserves 35,722,739 34,356,294
Total Shareholders Funds 41,122,666 39,856,798
Non-Current Liabilities
Deferred tax liability 376,669 438,928
Retirement benefit obligations 20,056 18,039
Total Non-Current Liabilities 396,725 456,967
Current Liabilities
Trade and other payables 23,418 83,166
Taxation payable - 6,485
Provision and accrued expenses 19,892 20,354
Total Current Liabilities 43,310 110,005
Total Equity & Liabilities 41,562,701 40,423,770

Annual Report 2015/14
67
Notes to the Financial Statements
1. BASIS OF CONVERSION
The translation of Sri Lankan Rupee amounts into US Dollar amounts is solely for the
convenience of the shareholders, investors, bankers and other users of Financial Statements.
The translation of the Financial Statements into US Dollar was affected based on the following
exchange rates.
2015 2014
Rs. Rs.
Statement of Profit or Loss Average rate 131.20 130.62
Monetary assets and liabilities Closing rate 133.32 130.73
Non-current assets and liabilities Closing rate 133.32 130.73
2. RETAINED EARNINGS
2015 2014 US$ US$
Beginning of the year 4,632,504 4,805,213
Profit for the year 507,434 1,644,505
Other comprehensive income (1,676) 3,687
Ordinary dividend (606,335) (1,820,901)
4,531,927 4,632,504

Shalimar (Malay) PLC
68
Shalimar (Malay) PLC
3.
SEG
MEN
TAL
REPO
RTIN
G
For M
anag
emen
t pur
pose
, the
Com
pany
is o
rgai
nise
d in
to b
usin
ess
units
bas
ed o
n th
eir p
rodu
cts
and
serv
ices
. The
two
repo
rtab
le
segm
ents
hav
e be
en id
entifi
ed a
s in
dica
ted
belo
w;
(A
) IN
DU
STR
Y
Oil
Pal
m
Inve
stm
ents
C
om
pan
y
20
15
2014
20
15
2014
20
15
2014
US
$
US$
U
S$
U
S$
US
$
US$
R
even
ue
Ex
tern
al r
even
ue
1,3
06,0
42
1,65
3,77
4 1
1,17
1
817,
880
1,3
17,2
13
2,47
1,65
4
1
,306
,042
1,
653,
774
11,
171
81
7,88
0 1
,317
,213
2,
471,
654
R
esu
lt
Segm
ent r
esul
t 7
17,7
79
1,13
0,10
5 (
11,3
75)
79
5,88
9 7
06,4
04
1,92
5,99
4
Taxa
tion
(19
6,73
7)
(274
,372
) (
2,23
3)
(7,1
17)
(19
8,97
0)
(281
,489
)
5
21,0
42
855,
733
(13
,608
)
788,
772
507
,434
1,
644,
505
O
ther
Info
rmat
ion
Se
gmen
t ass
ets
11,
990,
417
13
,696
,442
2
9,57
2,28
4
26,7
27,3
28
41,
562,
701
40
,423
,770
Se
gmen
t lia
bilit
ies
427
,584
55
4,69
4 1
2,45
1
12,2
78
440
,035
56
6,97
2
Cap
ital e
xpen
ditu
re
2,1
62
5,00
5 -
- 2,
162
5,
005
D
epre
ciat
ion
14,
171
10
,085
-
- 1
4,17
1
10,0
85
Retir
emen
t ben
efits
cha
rge
2,2
54
2,35
2 -
- 2
,254
2,
352
(B
) G
EOG
RA
PH
ICA
L
Mal
aysi
a S
ri L
anka
C
om
pan
y
20
15
2014
20
15
2014
20
15
2014
US
$
US$
U
S$
U
S$
US
$
US$
Re
venu
e 1
,306
,042
1,
653,
774
11,
171
81
7,88
0 1
,317
,213
2,
471,
654
N
on-c
urre
nt a
sset
s 1
1,59
3,33
6
13,
220,
150
29,
420,
575
2
6,45
4,04
3 4
1,01
3,91
1 39
,674
,193
Notes to the Financial Statements

Annual Report 2015/14
69
Five Year Summary
SLFRS SLASFor the year ended 31st March 2015 2014 2013 2012 2011 US$ US$ US$ US$ US$
Operating resultsRevenue 1,317,213 2,471,654 2,248,995 2,318,960 2,318,960Profit before taxation 706,404 1,925,994 1,720,529 2,469,449 1,726,801Taxation (198,970) (281,489) (346,890) (519,442) (365,109)Profit for the year 507,434 1,644,505 1,373,639 1,950,007 1,361,692
SLFRS SLASAs at 31st March 2015 2014 2013 2012 2011 US$ US$ US$ US$ US$
Statement of Financial PositionAssetsNon-Current AssetsProperty, plant and equipment 10,102,895 11,540,994 12,168,714 12,069,093 12,914,951Biological assets 1,490,441 1,679,156 1,663,685 1,502,287 -Non-current financial assets 29,420,575 26,454,043 29,484,289 27,527,378 843,288 41,013,911 39,674,193 43,316,688 41,098,758 13,758,239Curent assets 548,790 749,577 1,100,540 2,179,950 1,977,291Total Assets 41,562,701 40,423,770 44,417,228 43,278,708 15,735,530
Equity and LiabilitiesStated capital 868,000 868,000 868,000 868,000 868,000Reserves 40,254,666 38,988,798 42,938,973 41,889,208 14,527,124 41,122,666 39,856,798 43,806,973 42,757,208 15,395,124Non-Current LiabilitiesDeferred tax liability 376,669 438,928 427,783 384,072 162,434Retirement benefit obligations 20,056 18,039 24,664 24,376 20,247 396,725 456,967 452,447 408,448 182,681Current Liabilities 43,310 110,005 157,808 113,052 157,725Total Equity & Liabilities 41,562,701 40,423,770 44,417,228 43,278,708 15,735,530
SLFRS SLASFor the year ended 31st March 2015 2014 2013 2012 2011 US$ US$ US$ US$ US$
Cash Flow StatementsNet cash (out flows)/inflows from operating activities 317,042 1,389,351 1,364,897 2,000,675 1,579,548Net cash (out flows)/inflows from investing activities 15,384 27,219 (58,370) (10,852) (97,718)Net cash used in financing activities (592,777) (1,823,054) (2,347,133) (1,311,713) (605,666)Net (decrease)/increase in cash & cash equivalents (260,351) (406,484) (1,040,606) 678,110 876,164
Amounts in the above Five Year Summary applicable for 2015,2014, 2013 and 2012 are based on SLFRS whilst 2011 is based on SLAS.

Shalimar (Malay) PLC
70
Shalimar (Malay) PLC
SLFRS SLAS 2015 2014 2013 2012 2011
Ratios and Statistics
Return on ordinary shareholders’ funds (%) 1.23 4.13 3.14 4.56 8.84
Current ratio (times) 12.67 6.81 6.97 19.28 9.73
Quick asset ratio (times) 12.63 6.79 6.96 19.26 9.70
Gross profit margin (%) (a) 67.73 82.63 78.44 81.64 81.81
Net profit margin (%) (a) 38.52 66.53 61.08 74.98 58.72
Earnings per ordinary share (US$) (b) 0.07 0.24 0.20 0.28 0.20
Dividend per ordinary share (US$) (c) 0.03 0.24 0.32 0.22 0.13
Dividend payout (%) 42.86 100.00 160.00 78.58 65.00
Net assets per ordinary share (US$) (d) 5.93 0.63 6.31 6.16 2.22
Market value per share (US$) 16.13 9.56 6.93 6.91 7.50
P/E ratio (times) 220.56 39.83 35.02 24.59 38.22
Market capitalisation (US$’000) 111,920 66,358 48,109 47,956 52,051
Amounts in the above Five Year Summary applicable for 2015,2014,2013,2012 are based on SLFRS whilst 2011 is based on SLAS.
(a) Gross profit margin and Net profit margin consist of dividend income received from its investment.
(b) The earnings per ordinary share is calculated by dividing the profit for the year over the weighted average number of ordinary shares in issue during the year.
(c) Based on proposed dividend and interim dividend paid.
(d) Net assets per ordinary share is calculated by dividing shareholders’ funds by the number of ordinary shares.
Five Year Summary

Annual Report 2015/14
71
Information to Shareholders and Investors
1. Stock Exchange Listing
Shalimar (Malay) PLC is a Public Quoted Company, the ordinary shares of which are listed
on the main board of the Colombo Stock Exchange of Sri Lanka.
2. Share Valuation
Market value of the Company’s Shares as at 31st March 2015 was Rs. 2,150 per share
(2014: Rs. 1,250 per share).
3. Shareholders
As at 31st March 2015 2014
No. of Ordinary Shareholders 318 302
The number of ordinary shares held by non-residents as at 31st March 2015 was
5,776,373 which amount to 83.23% of the total number of ordinary shares.
Resident/non-resident Shareholders as at 31st March 2015
Residents Non-Residents TotalDistributionof Shares
No. ofMembers
No. ofShares
% No. ofMembers
No. ofShares
% No. ofMembers
No. ofShares
%
1 - 1,000 306 10,017 0.14 1 800 0.01 307 10,817 0.15
1,001 - 10,000 6 13,063 0.19 0 0 0.00 6 13,063 0.19
10,001 - 100,000 1 26,931 0.39 0 0 0.00 1 26,931 0.39
100,001 - 1,000,000 3 1,113,696 16.05 0 0 0.00 3 1,113,696 16.05
Above 1,000,000 0 0 0.00 1 5,775,573 83.22 1 5,775,573 83.22
Grand Total 316 1,163,707 16.77 2 5,776,373 83.23 318 6,940,080 100
Categorisation of Shareholders as at 31st March 2015
No. ofShareholders
No. ofShares
%
Individuals 293 48,647 0.70
Institutions 25 6,891,433 99.30
Public Shareholding
Percentage of ordinary shares held by the public as at 31st March 2015 was 0.73% and
the number of public shareholders were 303.

Shalimar (Malay) PLC
72
4. Market Performance - Ordinary Shares
For the year ended 31st March 2015 2014Highest (Rs.) 2,400 1,250Lowest (Rs.) 1,650 750Volume Traded (Shares) 181,495 14,214No. of Trades 430 236Value of Shares Traded (Rs. ‘000) 273,996 15,280
5. Market Capitalisation
Market capitalisation of the Company, which is the number of ordinary shares multiplied
by the market value of a share, was Rs. 14,921.17 mn as at 31st March 2015 (2014:
Rs. 8,675.10 mn).
6. Proposed first and final dividend
The Directors recommended a first and final dividend of Rs. 3.56 per share for the year
ended 31st March 2015.
7. Record of Scrip Issues
The under mentioned scrip issue had been made by the Company.
Year ended 31st March Issue Basis No. of Ordinary
Shares Capital
Cumulative Ordinary
Shares (Rs.)
1998 - - 270,000 2,700,000
1999 Bonus 10.9:1 2,943,000 32,130,000
2002 April Bonus 1:5 642,600 38,554,000
2003 May Bonus 1:5 771,120 46,263,260
2004 March Bonus 1:2 2,313,360 69,400,800
Total Shares in Issue 6,940,080
8. Malaysian Property
8.1 The gross area of the Oil Palm plantation is 304.5 ha.
8.2 The plantation is situated in the State of Selangor, District Kuala Selangor.
8.3 The carrying value of the property, plant & equipment as at the reporting date was
Rs. 1,346.92 mn (2014: 1,508.75 mn) on an existing use basis.
9. Mature and Immature Plantation Age Analysis
Mature Immature Total
Year 0 - 5 6 - 10 11 - 15 16 - 20 21 - 25
Hectares - 175.96 127.36 1.18 - - 304.50
Shalimar (Malay) PLC
Information to Shareholders and Investors

Annual Report 2015/14
73
10. Indonesian Property
PT Agro Indomas (PTAI), the Company’s investment made through Shalimar Developments
Sdn. Bhd. (Investment vehicle in Malaysia) is located 75 km from Sampit, in close proximity
to Terawan and Lampasa villages, in the District of Danua Sembuluh, in the regency of
Seruyan in Central Kalimanthan province, Indonesia. The total land area of PT Agro Indomas is
approximately 26,861 Ha.
2015 2014 2013 2012 2011Crop Production (MT) 458,711 454,110 540,691 480,869 498,012CPO (MT) 118,247 100,462 125,875 117,514 124,421PK (MT) 27,977 23,118 29,150 26,384 28,723CPO Ex Mill Price (US$) 677 704 706 840 790 FFB Yeild (MT per Hectare) 22.90 22.91 27.28 25.18 26.84 CPO / Ha (MT) 5.90 4.89 5.59 5.84 6.11 Milling Capacity (MT per Hour) 225 225 180 180 180Value of biological assets and property, plant and equipment. (US$ mn)
193.70 195.08 190.36 179.72 162.54
Plantation Age Analysis of the company
6 - 10 years 58%
11 - 15 years 42%
16 - 20 years0%
Plantation Age Analysis of PTAI
9-10 Years 18%Above12 Years
62%
4-6 Years 6%
0-3 Years (immature)1%
7-8 Years 11%
11-12 Years 2%

Shalimar (Malay) PLC
74
Shalimar (Malay) PLC
Glossary of Financial Terms
Capital Reserves
Reserves identified for specific purposes
and considered not available for
distribution.
Cash Equivalents
Liquid investments with original maturities
of six months or less.
Contingent Liabilities
Conditions or situations at the Balance
Sheet date, the Financial effects of which
are to be determined by future events
which may or may not occur.
Current Ratio
Current assets divided by current liabilities.
Quick Ratio
Current assets less inventories divided by
current liabilities.
Gross Profit Margin
Gross profit divided by revenue.
Net Profit Margin
Net profit divided by revenue.
Dividend Per Share
Dividend paid interim and proposed,
divided by the number of shares in issue
which ranked for those dividends.
Dividend Payout
Total interim and proposed dividends
divided by profit after tax.
Earnings Per Ordinary Share
Profits attributable to ordinary
shareholders before extraordinary items
and after preference dividend divided by
the weighted average number of ordinary
shares in issue, ranking for dividend.
Equity
Shareholders’ funds.
Events Occurring after Reporting Date
Significant events that occur between the
Reporting date and the date on which
Financial Statements are authorised for
issue.
Market Capitalisation
The market value of a Company at a given
date obtained by multiplying the share
price by the number of shares in issue.
Net Assets Per Share
Total assets less total liabilities divided by
the number of ordinary shares in issue.
Net Current Assets
Current assets less current liabilities.
Measures the capital required to Finance
day-to-day operations.

Annual Report 2015/14
75
Price Earnings Ratio (P/E)
Market price of a share divided by earnings
per share.
Rate of Ordinary Dividend
The Rupee amount of the dividend per
share as a percentage of the nominal value
of the shares.
Reserves
The total of capital and revenue reserves.
Related Parties
Parties who could control or significantly
influence the Financial and operating
policies/decisions of the business.
Return on Shareholders’ Funds
Profit attributable to ordinary shareholders
divided by shareholders’ funds (total of
ordinary share capital and reserves).
Revenue Reserves
Reserves considered as being available for
distribution.
Segment
Constituent business units grouped
in terms of nature and similarity of
operations.
Value Addition
The quantum of wealth generated by the
activities of the Company.
Others
CPO - Crude Palm Oil
PK - Palm Kernel
FFB - Fresh Fruit Bunches
Ha - Hectare
MYR - Malaysian Ringgit
MPC - Malaysian Plantation Companies
AFS - Available-for-Sale
MT - Metric Tonnes

Shalimar (Malay) PLC
76
Shalimar (Malay) PLC
Notice of Meeting
NOTICE IS HEREBY GIVEN that the ONE HUNDRED AND SIXTH ANNUAL GENERAL MEETING of SHALIMAR (MALAY) PLC will be held on Friday the 29th day of May 2015, at 3.00 p.m. at the 8th Floor, No.65C, Dharmapala Mawatha, Colombo 07, for the following purposes:
1. To receive and adopt the Annual Report of the Board of Directors and the Financial Statements for the year ended 31st March 2015, together with the Report of the Auditors thereon.
2. To declare a dividend as recommended by the Directors.
3. To re-elect Mr. M. Selvanathan who retires by rotation in terms of Articles 87 & 88 of the Articles of Association of the Company.
4. To re-appoint Mr. I. Paulraj as a Director of the Company who is over seventy years of age and to consider and if deemed fit to pass the following resolution :
“IT IS HEREBY RESOLVED that the age limit stipulated in Section 210 of the Companies Act No. 7 of 2007 shall not be applicable to Mr. I. Paulraj who is seventy eight years of age and that he be re-appointed a Director of the Company from the conclusion of the Annual General Meeting for a further period of one year”.
5. To re-appoint Mr. A.K. Sellayah as a Director of the Company who is over seventy years of age and to consider and if deemed fit to pass the following resolution :
“IT IS HEREBY RESOLVED that the age limit stipulated in Section 210 of the Companies Act No. 7 of 2007 shall not be applicable to Mr. A.K. Sellayah who is seventy three years of age and that he be re-appointed a Director of the Company from the conclusion of the
Annual General Meeting for a further period of one year”.
6. To re-appoint Messrs. Ernst & Young, Chartered Accountants as Auditors of the Company as set out in Section 154 (1) of the Companies Act No. 7 of 2007 and to authorise the Directors to determine their remuneration.
By Order of the Board
(Sgd.)K.D.De Silva (Mrs.)DirectorCarsons Management Services (Pvt) Ltd.SecretariesColombo
23rd April 2015
Notes
1. A member is entitled to appoint a proxy to attend and vote instead of him/her. A proxy need not be a member of the Company. A Form of Proxy accompanies this notice.
2. The completed Form of Proxy must be deposited at the Registered Office, No.61, Janadhipathi Mawatha, Colombo 1, not later than 3.00 p.m. on 27th May 2015.
3. A person representing a Corporation is required to carry a certified copy of the resolution authorising him/her to act as the representative of the Corporation. A representative need not be a member.
4. The transfer books of the Company will remain open.
5. Security Check
We shall be obliged if the Shareholders/proxies attending the Annual General Meeting, produce their National Identity Card to the security personnel stationed at the entrance.

Annual Report 2015/14
77
Notes

Shalimar (Malay) PLC
78
Notes

Annual Report 2015/14
79
Form of Proxy
*I/We…………………………………………………………………………………..........……………… of………………………………………………………....………………………...........……...… being *a Member/Members of SHALIMAR (MALAY) PLC, hereby appoint ....…………......................................... ……………………………………………………………………………………………............................…… of…..……………………………………………………………………………………………….……..............bearing NIC No./Passport No…………………………………. or failing him/her.
Hariharan Selvanathan or failing him,Manoharan Selvanathan or failing him,Israel Paulraj or failing him,Allen Kenneth Sellayah or failing him,Don Chandima Rajakaruna Gunawardena or failing him,Palehenalage Chandana Priyankara Tissera or failing him,Kurukulasuriya Calisanctus Nalaka Fernando
As *my/our proxy to attend at the Annual General Meeting of the Company to be held on Thursday the 29th day of May 2015 at 3.00 p.m. at the 8th Floor, No. 65 C, Dharmapala Mawatha, Colombo 07 and any adjournment thereof and at every poll which may be taken in consequence thereof.
For Against 1. To adopt the Annual Report of the Board of Directors and the Financial
Statements for the year ended 31st March 2015, together with the Report of the Auditors thereon.
2. To declare Rs. 3.56 per share as a first and final dividend for the Financial year ended 31st March 2015 as recommended by the Directors.
3. To re-elect Mr. M. Selvanathan who retires by rotation in terms of Articles 87 & 88 of the Articles of Association of the Company.
4. To re-appoint Mr. I. Paulraj who is over seventy years of age as a Director of the Company.
5. To re-appoint Mr. A.K. Sellayah who is over seventy years of age as a Director of the Company.
6. To re-appoint Messrs. Ernst & Young, Chartered Accountants as Auditors of the Company as set out in Section 154 (1) of the Companies Act No. 7 of 2007 and to authorise the Directors to determine their remuneration.
Signed this ......... day of ……………………………….Two Thousand and Fifteen.
Signature/s
Notes1. * Please delete the inappropriate words.
2. A shareholder entitled to attend and vote at a General Meeting of the Company, is entitled to appoint a proxy to attend and vote instead of him/her and the proxy need not be a shareholder of the Company. A proxy so appointed shall have the right to vote on a show of hands or on a poll and to speak at the General Meeting of the shareholders
3. A shareholder is not entitled to appoint more than one proxy on the same occasion.
4. Instructions are noted on the reverse hereof.

Shalimar (Malay) PLC
80
Instructions as to Completion
1. Kindly perfect the form of proxy after filling in legibly your full name and address, by signing in the space provided. Please fill in the date of signature.
2. If you wish to appoint a person other than the Directors as your proxy, please insert the relevant details in the space provided overleaf.
3. In terms of Article 69 of the Articles of Association of the Company: The instrument appointing a proxy shall be in writing and -
(i) in the case of an individual shall be signed by the Appointor or by his Attorney; and
(ii) in the case of a Corporation shall be either under its common seal or signed by its Attorney
or by an officer on behalf of the Corporation.
The Company may, but shall not be bound to, require evidence of the authority of any such Attorney or officer.
A proxy need not be a member of the Company.
4. In terms of Article 65 of the Articles of Association of the Company;
In the case of joint-holders of a share, the senior who tenders a vote, whether in person or by proxy or by Attorney or by representative, shall be accepted to the exclusion of the votes of the other joint- holders and for this purpose seniority shall be determined by the order in which the names stands in the Register of Members in respect of the joint holding.
5. To be valid the completed Form of Proxy should be deposited at the Registered Office of the Company situated at No. 61, Janadhipathi Mawatha, Colombo 1 not later than 3.00 p.m. on 27th May 2015.
Please fill in the following details
Name : …………………………………………………………………………
…………………………………………………………………………
Address : …………………………………………………………………………
…………………………………………………………………………
…………………………………………………………………………
Jointly with : …………………………………………………………………………
Share Folio No. : …………………………………………………………………………
Form of Proxy

NAME OF THE COMPANYShalimar (Malay) PLC
COMPANY REGISTRATION NO.PQ 51
LEGAL FORMA Public Quoted Company with Limited Liability incorporated in Sri Lanka in 1909
DIRECTORSHariharan Selvanathan (Chairman)Manoharan Selvanathan Israel PaulrajD. Chandima R. GunawardenaAllen Kenneth SellayahP. Chandana P. TisseraK.C.Nalaka Fernando
BANKERSStandard Chartered BankCommercial Bank of Ceylon PLCDeutsche BankHSBC Bank Malaysia Bhd.
AUDITORS IN SRI LANKAMessrs. Ernst & YoungChartered Accountants201, De Saram Place,Colombo 10, Sri Lanka.Tel: + 94 11 2463500Fax: +94 11 2697369
AUDITORS IN MALAYSIAMessrs. Ernst & YoungAF : 0039Level 23A, Menara MileniumJalan Damanlela, Pusat Bandar Damansara50490, Kuala Lumpur, MalaysiaTel: + 603 7495 8000Fax: + 603 2095 9076 / 78
MANAGERSAgro Harapan Lestari Sdn. Bhd.Suite 6.08, Level 6, Wisma UOA Damansara IINo.6 Changkat SemantanDamansara Heights50490, Kuala Lumpur, MalaysiaTel: + 603 2082 6200Fax: + 603 2093 5660
SECRETARIESCarsons Management Services (Pvt) Ltd61, Janadhipathi MawathaColombo 01, Sri LankaTel: + 94 11 2039200Fax: + 94 11 2039300
REGISTERED OFFICE61, Janadhipathi Mawatha,Colombo 01, Sri LankaTel: + 94 11 2039200Fax: + 94 11 2039300
PRINCIPAL PLACE OF BUSINESSLadang ShalimarNo 27, Jalan Bukit Rotan45700 Kuala SelangorSelangor Darul EhsanMalaysia
CORPORATE WEBSITEwww.goodhopeholdings.com
HOLDING COMPANYGoodhope Asia Holdings Ltd.
ULTIMATE PARENT AND
CONTROLLING ENTITYBukit Darah PLC
Corporate Information
Designed & produced by
Printed by Printage (Pvt) Ltd


![Malay Culture Project - Malay Food & Etiquette [Autosaved]](https://static.fdocuments.us/doc/165x107/577cdeaf1a28ab9e78af9948/malay-culture-project-malay-food-etiquette-autosaved.jpg)