
Shale gas - Global experience and key learning - United · PDF fileShale gas - Global...
12
Shale gas Global experience and key learnings
Transcript of Shale gas - Global experience and key learning - United · PDF fileShale gas - Global...
Shale gasGlobal experience and key learnings

2 | Shale gas - Global experience and key learnings
1Shale gas - Global experience and key learnings |
Contents
Shale gas: global potential and enablers ........................... 3
Benefits of shale gas development ................................... 3
Global shale gas potential ................................................ 5
Enablers for shale gas development ................................. 6
Regulatory landscape ............................................... 6
Favorable pricing regime ........................................... 7
Technological capabilities .......................................... 7
Natural gas pipeline infrastructure ............................. 7
Shale gas in India ............................................................ 8
Key learning for India ...................................................... 9
2 | Shale gas - Global experience and key learnings
3Shale gas - Global experience and key learnings |
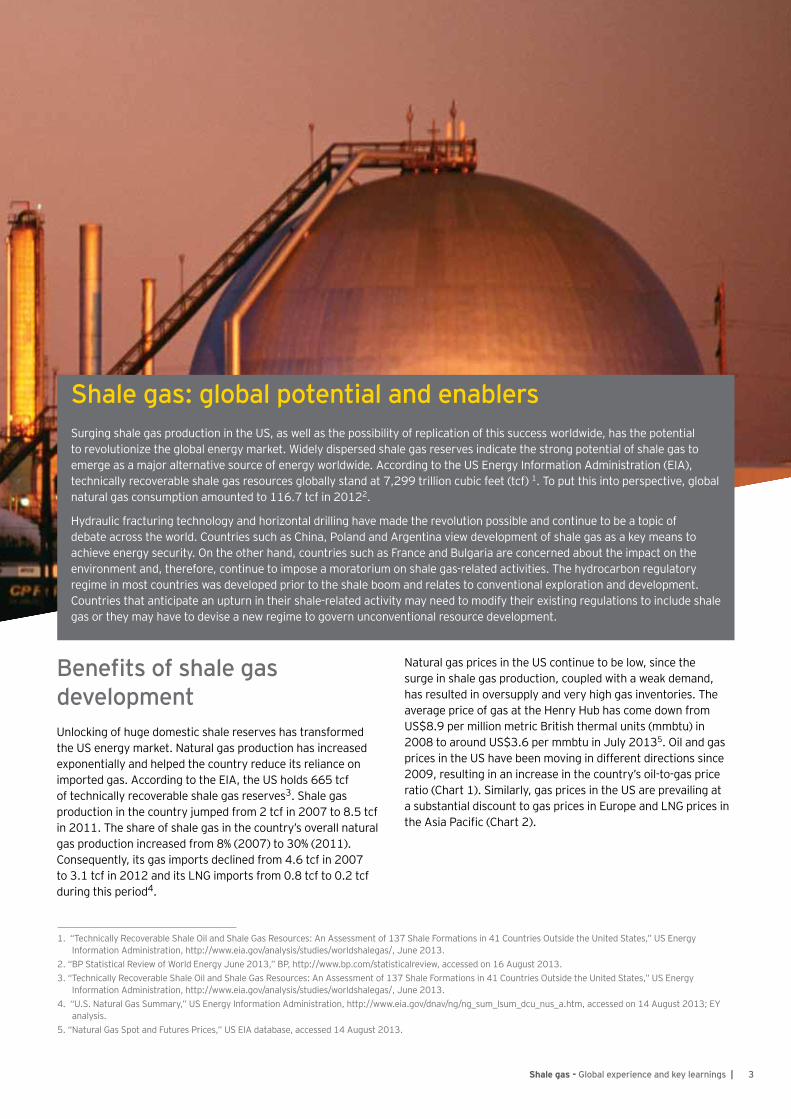
Shale gas: global potential and enablersSurging shale gas production in the US, as well as the possibility of replication of this success worldwide, has the potential to revolutionize the global energy market. Widely dispersed shale gas reserves indicate the strong potential of shale gas to emerge as a major alternative source of energy worldwide. According to the US Energy Information Administration (EIA), technically recoverable shale gas resources globally stand at 7,299 trillion cubic feet (tcf) 1. To put this into perspective, global natural gas consumption amounted to 116.7 tcf in 20122.
Hydraulic fracturing technology and horizontal drilling have made the revolution possible and continue to be a topic of debate across the world. Countries such as China, Poland and Argentina view development of shale gas as a key means to achieve energy security. On the other hand, countries such as France and Bulgaria are concerned about the impact on the environment and, therefore, continue to impose a moratorium on shale gas-related activities. The hydrocarbon regulatory regime in most countries was developed prior to the shale boom and relates to conventional exploration and development. Countries that anticipate an upturn in their shale-related activity may need to modify their existing regulations to include shale gas or they may have to devise a new regime to govern unconventional resource development.
1. “Technically Recoverable Shale Oil and Shale Gas Resources: An Assessment of 137 Shale Formations in 41 Countries Outside the United States,” US Energy Information Administration, http://www.eia.gov/analysis/studies/worldshalegas/, June 2013.
2. “BP Statistical Review of World Energy June 2013,” BP, http://www.bp.com/statisticalreview, accessed on 16 August 2013.3. “Technically Recoverable Shale Oil and Shale Gas Resources: An Assessment of 137 Shale Formations in 41 Countries Outside the United States,” US Energy
Information Administration, http://www.eia.gov/analysis/studies/worldshalegas/, June 2013.4. “U.S. Natural Gas Summary,” US Energy Information Administration, http://www.eia.gov/dnav/ng/ng_sum_lsum_dcu_nus_a.htm, accessed on 14 August 2013; EY
analysis.5. “Natural Gas Spot and Futures Prices,” US EIA database, accessed 14 August 2013.
Benefits of shale gas developmentUnlocking of huge domestic shale reserves has transformed the US energy market. Natural gas production has increased exponentially and helped the country reduce its reliance on imported gas. According to the EIA, the US holds 665 tcf of technically recoverable shale gas reserves3. Shale gas production in the country jumped from 2 tcf in 2007 to 8.5 tcf in 2011. The share of shale gas in the country’s overall natural gas production increased from 8% (2007) to 30% (2011). Consequently, its gas imports declined from 4.6 tcf in 2007 to 3.1 tcf in 2012 and its LNG imports from 0.8 tcf to 0.2 tcf during this period4.
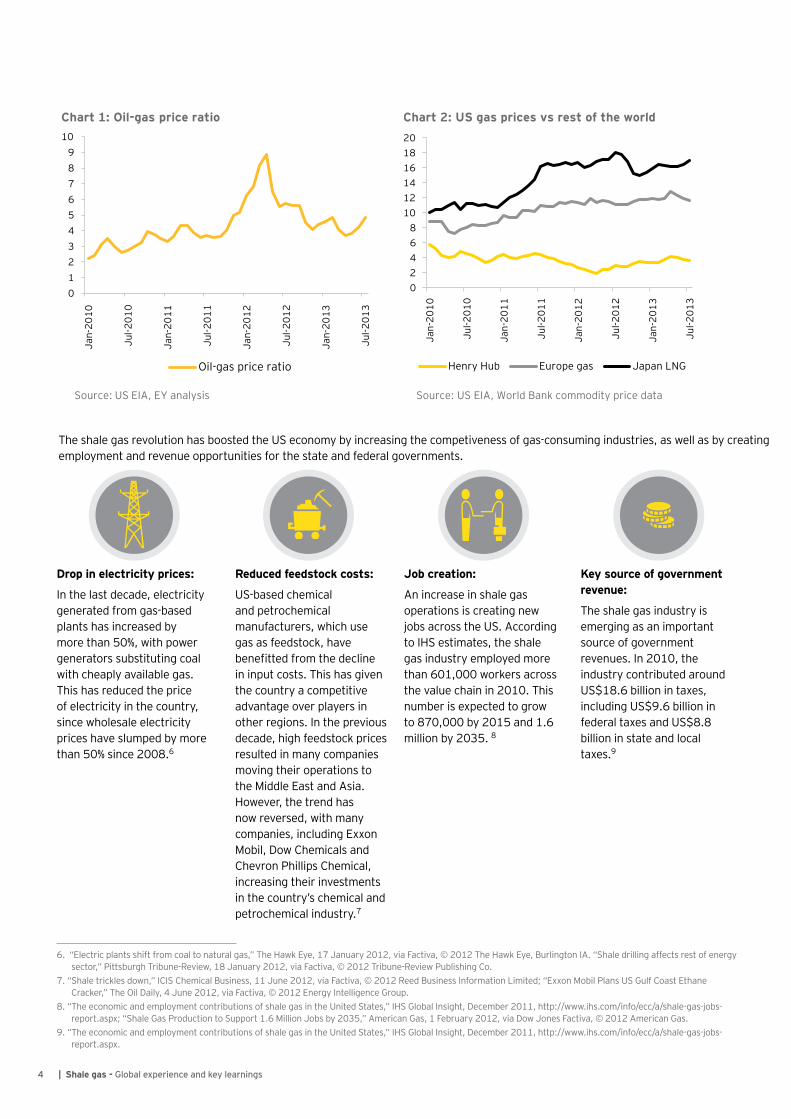
Natural gas prices in the US continue to be low, since the surge in shale gas production, coupled with a weak demand, has resulted in oversupply and very high gas inventories. The average price of gas at the Henry Hub has come down from US$8.9 per million metric British thermal units (mmbtu) in 2008 to around US$3.6 per mmbtu in July 20135. Oil and gas prices in the US have been moving in different directions since 2009, resulting in an increase in the country’s oil-to-gas price ratio (Chart 1). Similarly, gas prices in the US are prevailing at a substantial discount to gas prices in Europe and LNG prices in the Asia Pacific (Chart 2).
4 | Shale gas - Global experience and key learnings
Chart 1: Oil-gas price ratio
Source: US EIA, EY analysis
0123456789
10
Jan-
2010
Jul-2
010
Jan-
2011
Jul-2
011
Jan-
2012
Jul-2
012
Jan-
2013
Jul-2
013
Oil-gas price ratio
Chart 2: US gas prices vs rest of the world
Source: US EIA, World Bank commodity price data
02468
101214161820
Jan-
2010
Jul-2
010
Jan-
2011
Jul-2
011
Jan-
2012
Jul-2
012
Jan-
2013
Jul-2
013
Henry Hub Europe gas Japan LNG
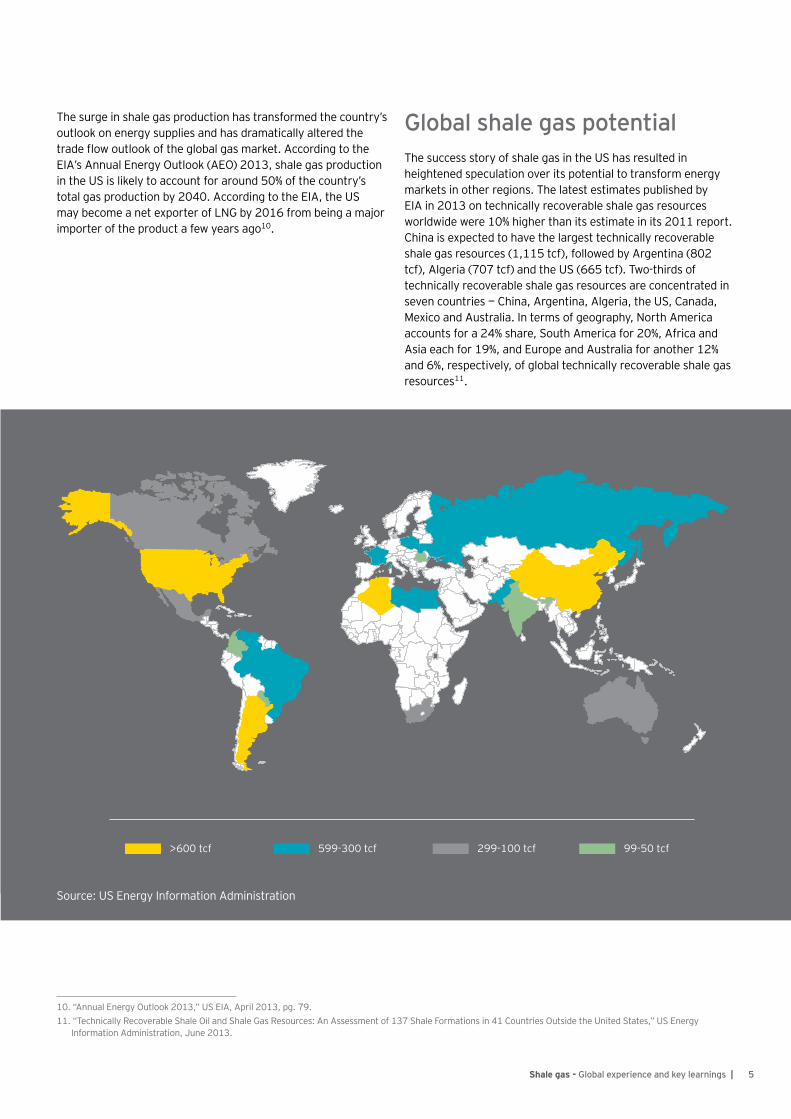
The shale gas revolution has boosted the US economy by increasing the competiveness of gas-consuming industries, as well as by creating employment and revenue opportunities for the state and federal governments.
Drop in electricity prices:
In the last decade, electricity generated from gas-based plants has increased by more than 50%, with power generators substituting coal with cheaply available gas. This has reduced the price of electricity in the country, since wholesale electricity prices have slumped by more than 50% since 2008.6
Job creation:
An increase in shale gas operations is creating new jobs across the US. According to IHS estimates, the shale gas industry employed more than 601,000 workers across the value chain in 2010. This number is expected to grow to 870,000 by 2015 and 1.6 million by 2035. 8
Key source of government revenue:
The shale gas industry is emerging as an important source of government revenues. In 2010, the industry contributed around US$18.6 billion in taxes, including US$9.6 billion in federal taxes and US$8.8 billion in state and local taxes.9
Reduced feedstock costs:
US-based chemical and petrochemical manufacturers, which use gas as feedstock, have benefitted from the decline in input costs. This has given the country a competitive advantage over players in other regions. In the previous decade, high feedstock prices resulted in many companies moving their operations to the Middle East and Asia. However, the trend has now reversed, with many companies, including Exxon Mobil, Dow Chemicals and Chevron Phillips Chemical, increasing their investments in the country’s chemical and petrochemical industry.7
6. “Electric plants shift from coal to natural gas,” The Hawk Eye, 17 January 2012, via Factiva, © 2012 The Hawk Eye, Burlington IA. “Shale drilling affects rest of energy sector,” Pittsburgh Tribune-Review, 18 January 2012, via Factiva, © 2012 Tribune-Review Publishing Co.
7. “Shale trickles down,” ICIS Chemical Business, 11 June 2012, via Factiva, © 2012 Reed Business Information Limited; “Exxon Mobil Plans US Gulf Coast Ethane Cracker,” The Oil Daily, 4 June 2012, via Factiva, © 2012 Energy Intelligence Group.
8. “The economic and employment contributions of shale gas in the United States,” IHS Global Insight, December 2011, http://www.ihs.com/info/ecc/a/shale-gas-jobs-report.aspx; “Shale Gas Production to Support 1.6 Million Jobs by 2035,” American Gas, 1 February 2012, via Dow Jones Factiva, © 2012 American Gas.
9. “The economic and employment contributions of shale gas in the United States,” IHS Global Insight, December 2011, http://www.ihs.com/info/ecc/a/shale-gas-jobs-report.aspx.
5Shale gas - Global experience and key learnings |
The surge in shale gas production has transformed the country’s outlook on energy supplies and has dramatically altered the trade flow outlook of the global gas market. According to the EIA’s Annual Energy Outlook (AEO) 2013, shale gas production in the US is likely to account for around 50% of the country’s total gas production by 2040. According to the EIA, the US may become a net exporter of LNG by 2016 from being a major importer of the product a few years ago10.
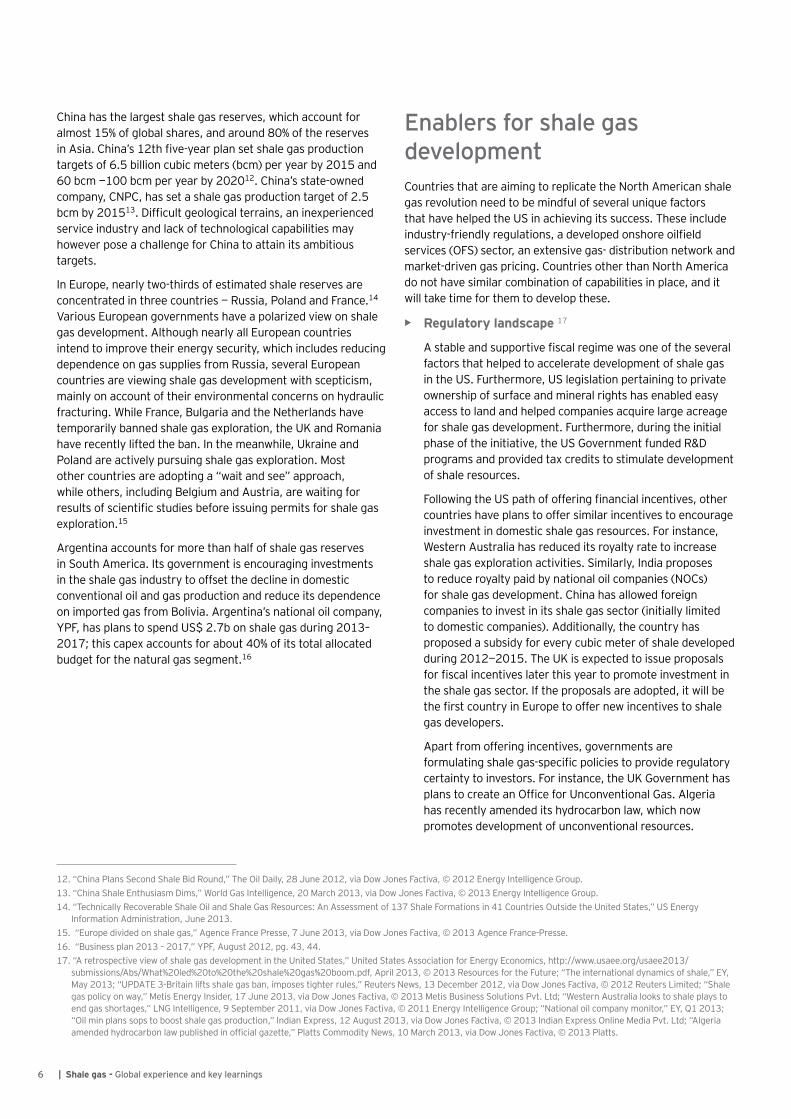
Global shale gas potentialThe success story of shale gas in the US has resulted in heightened speculation over its potential to transform energy markets in other regions. The latest estimates published by EIA in 2013 on technically recoverable shale gas resources worldwide were 10% higher than its estimate in its 2011 report. China is expected to have the largest technically recoverable shale gas resources (1,115 tcf), followed by Argentina (802 tcf), Algeria (707 tcf) and the US (665 tcf). Two-thirds of technically recoverable shale gas resources are concentrated in seven countries — China, Argentina, Algeria, the US, Canada, Mexico and Australia. In terms of geography, North America accounts for a 24% share, South America for 20%, Africa and Asia each for 19%, and Europe and Australia for another 12% and 6%, respectively, of global technically recoverable shale gas resources11.
>600 tcf 599-300 tcf 299-100 tcf 99-50 tcf
Source: US Energy Information Administration
10. “Annual Energy Outlook 2013,” US EIA, April 2013, pg. 79.11. “Technically Recoverable Shale Oil and Shale Gas Resources: An Assessment of 137 Shale Formations in 41 Countries Outside the United States,” US Energy
Information Administration, June 2013.
6 | Shale gas - Global experience and key learnings
China has the largest shale gas reserves, which account for almost 15% of global shares, and around 80% of the reserves in Asia. China’s 12th five-year plan set shale gas production targets of 6.5 billion cubic meters (bcm) per year by 2015 and 60 bcm —100 bcm per year by 202012. China’s state-owned company, CNPC, has set a shale gas production target of 2.5 bcm by 201513. Difficult geological terrains, an inexperienced service industry and lack of technological capabilities may however pose a challenge for China to attain its ambitious targets.
In Europe, nearly two-thirds of estimated shale reserves are concentrated in three countries — Russia, Poland and France.14 Various European governments have a polarized view on shale gas development. Although nearly all European countries intend to improve their energy security, which includes reducing dependence on gas supplies from Russia, several European countries are viewing shale gas development with scepticism, mainly on account of their environmental concerns on hydraulic fracturing. While France, Bulgaria and the Netherlands have temporarily banned shale gas exploration, the UK and Romania have recently lifted the ban. In the meanwhile, Ukraine and Poland are actively pursuing shale gas exploration. Most other countries are adopting a “wait and see” approach, while others, including Belgium and Austria, are waiting for results of scientific studies before issuing permits for shale gas exploration.15
Argentina accounts for more than half of shale gas reserves in South America. Its government is encouraging investments in the shale gas industry to offset the decline in domestic conventional oil and gas production and reduce its dependence on imported gas from Bolivia. Argentina’s national oil company, YPF, has plans to spend US$ 2.7b on shale gas during 2013–2017; this capex accounts for about 40% of its total allocated budget for the natural gas segment.16
Enablers for shale gas developmentCountries that are aiming to replicate the North American shale gas revolution need to be mindful of several unique factors that have helped the US in achieving its success. These include industry-friendly regulations, a developed onshore oilfield services (OFS) sector, an extensive gas- distribution network and market-driven gas pricing. Countries other than North America do not have similar combination of capabilities in place, and it will take time for them to develop these.
• Regulatory landscape 17
A stable and supportive fiscal regime was one of the several factors that helped to accelerate development of shale gas in the US. Furthermore, US legislation pertaining to private ownership of surface and mineral rights has enabled easy access to land and helped companies acquire large acreage for shale gas development. Furthermore, during the initial phase of the initiative, the US Government funded R&D programs and provided tax credits to stimulate development of shale resources.
Following the US path of offering financial incentives, other countries have plans to offer similar incentives to encourage investment in domestic shale gas resources. For instance, Western Australia has reduced its royalty rate to increase shale gas exploration activities. Similarly, India proposes to reduce royalty paid by national oil companies (NOCs) for shale gas development. China has allowed foreign companies to invest in its shale gas sector (initially limited to domestic companies). Additionally, the country has proposed a subsidy for every cubic meter of shale developed during 2012—2015. The UK is expected to issue proposals for fiscal incentives later this year to promote investment in the shale gas sector. If the proposals are adopted, it will be the first country in Europe to offer new incentives to shale gas developers.
Apart from offering incentives, governments are formulating shale gas-specific policies to provide regulatory certainty to investors. For instance, the UK Government has plans to create an Office for Unconventional Gas. Algeria has recently amended its hydrocarbon law, which now promotes development of unconventional resources.
12. “China Plans Second Shale Bid Round,” The Oil Daily, 28 June 2012, via Dow Jones Factiva, © 2012 Energy Intelligence Group.13. “China Shale Enthusiasm Dims,” World Gas Intelligence, 20 March 2013, via Dow Jones Factiva, © 2013 Energy Intelligence Group.14. “Technically Recoverable Shale Oil and Shale Gas Resources: An Assessment of 137 Shale Formations in 41 Countries Outside the United States,” US Energy
Information Administration, June 2013.15. “Europe divided on shale gas,” Agence France Presse, 7 June 2013, via Dow Jones Factiva, © 2013 Agence France-Presse.16. “Business plan 2013 – 2017,” YPF, August 2012, pg. 43, 44.17. “A retrospective view of shale gas development in the United States,” United States Association for Energy Economics, http://www.usaee.org/usaee2013/
submissions/Abs/What%20led%20to%20the%20shale%20gas%20boom.pdf, April 2013, © 2013 Resources for the Future; “The international dynamics of shale,” EY, May 2013; “UPDATE 3-Britain lifts shale gas ban, imposes tighter rules,” Reuters News, 13 December 2012, via Dow Jones Factiva, © 2012 Reuters Limited; “Shale gas policy on way,” Metis Energy Insider, 17 June 2013, via Dow Jones Factiva, © 2013 Metis Business Solutions Pvt. Ltd; “Western Australia looks to shale plays to end gas shortages,” LNG Intelligence, 9 September 2011, via Dow Jones Factiva, © 2011 Energy Intelligence Group; “National oil company monitor,” EY, Q1 2013; “Oil min plans sops to boost shale gas production,” Indian Express, 12 August 2013, via Dow Jones Factiva, © 2013 Indian Express Online Media Pvt. Ltd; “Algeria amended hydrocarbon law published in official gazette,” Platts Commodity News, 10 March 2013, via Dow Jones Factiva, © 2013 Platts.
7Shale gas - Global experience and key learnings |
• Favorable pricing regime 18
Faced by gas shortage during the 1970s, the US Government began deregulating wellhead gas prices starting 1979, with complete deregulation coming into force from 1993 onward. This gradual deregulation led wellhead prices to better reflect supply/demand balances and provided the necessary stimulus to production of natural gas.
Over the past one year, China, India and Argentina have raised their natural gas prices amid a widening gap between natural gas production and consumption in these countries. According to the new pricing formula to be adopted by India, wellhead gas prices are expected to double from US$4.4/mmbtu currently to US$8.4/mmbtu (at current crude prices) by April 2014. China has increased city gate gas prices for the non-residential sector by 15% (on an average) across the country. In 2012, Argentina has announced that oil and gas companies will be able to secure a wellhead price of US$7.5/mmbtu for new gas production in the country. Its government has already signed deals with YPF and Pan American Energy, allowing them to charge an increased price. It is expected to sign similar agreements with other companies in coming years. These initiatives aim to provide incentives to oil and gas producers to explore and develop shale gas blocks. In addition, China is offering shale gas blocks, India has plans to conduct an auction for shale gas in the near future and Argentina has intensified its efforts to tap its Vaca Muerta shale plays.
• Technological capabilities 19
In the US, the shale gas revolution was led by small and mid-size independent oil and gas companies that pioneered technologies to extract shale gas. Additionally, the US had large and experienced OFS companies, including Schlumberger, Halliburton and Baker Hughes, which have played a pivotal role in supporting the country’s shale industry.
Government-owned companies are forging partnerships with oil and gas companies operating in the US to leverage the latter’s experience and technological capabilities.
For instance, the Chinese (through CNPC) and Ukrainian governments have signed their first production-sharing agreement for upstream shale activities with Shell, taking an important step toward full-scale commercial development of the gas. Similarly, YPF has entered two separate deals with Bridas International and Chevron for exploration of Vaca Muerta shale plays. India-based ONGC has signed an agreement with ConocoPhillips for cooperation in exploration and development of domestic shale gas resources.
Acquisition of stakes in foreign shale assets is another strategy being adopted by oil and gas companies to fill their technology and experience gaps. In 2012, Sinopec signed a wide-ranging US$2.5b joint venture agreement with Devon Energy for the latter’s 33% stake acreage, which is spread across five US onshore shale plays. During the same year, Indian state-owned companies, OIL and IOCL, jointly acquired a 30% stake in Carrizo’s liquid-rich shale assets in the Niobrara basin in the US.
The absence of a relatively experienced service industry is pushing countries to enter partnerships with foreign OFS companies. For example, in 2010, the Weir Group and Shengli Oilfield Highland Petroleum Equipment Co formed a JV to provide equipment to China’s shale gas industry. In 2012, China-based Anton Oilfield Services offered Schlumberger a 20% stake — the two companies plan to cooperate on shale gas development in China.
• Natural gas pipeline infrastructure 20
Another factor that contributed to the shale gas revolution in the US was the existence of its extensive network of pipelines to transport natural gas. Additionally, the country had a policy of open access to interstate natural gas pipelines, which helped it create a competitive wholesale natural gas market.
Countries such as Poland, with lucrative shale deposits, lack such an extensive, country-wide pipeline infrastructure. Shale gas fields in some, such as China, are fairly isolated from the country’s existing pipeline infrastructure. Additionally, countries including China impose restrictions on third-party access to pipeline infrastructure. Global output of shale gas on a scale, similar to that of the US, will depend on the ability of countries to overcome the challenges mentioned above.
18. “Gas Pricing and Regulation: China’s Challenges and IEA Experience,” International Energy Agency, April 2013, pg. 44, 45; “China, India Gas Price Reforms Open Door to More LNG Imports,” RIA Oreanda-News, 16 July 2013, via Dow Jones Factiva, © 2013 RIA OREANDA; “Pan American Energy to Invest $3.4B in Argentina From 2013-17,” Dow Jones Top Energy Stories, 29 December 2012, via Dow Jones Factiva, © 2012 Dow Jones & Company, Inc; “Argentine president agrees to higher prices for gas producers,” IHS Global Insight Daily Analysis, 30 November 2012, via Dow Jones Factiva, © 2012 IHS Global Insight Limited.
19. Andrew Neff, “Ukrainian government approves shale gas PSA with Shell,” IHS Global Insight Daily Analysis, 24 January 2013, via Dow Jones Factiva, © 2013 IHS Global Insight Limited; The international dynamics of shale, EY, May 2013; “UPDATE 3-Argentine YPF, Bridas in shale investment deal,” Reuters News, 29 December 2012, via Dow Jones Factiva, © 2012 Reuters Limited; “Chevron, YPF agree Argentina shale drilling program,” The Oil Daily, 20 December 2012, © 2012 Energy Intelligence Group; “National oil company monitor,” EY, Q1 2012; “National oil company monitor,” EY, Q4 2012; “The Weir Group and Shengli Oilfield Highland Petroleum Equipment Form JV,” Manufacturing Close-Up, 2 December 2010, via Dow Jones Factiva, © 2010 Close-Up Media, Inc; “Schlumberger Purchases Stake in Chinese Oilfield Services Company,” RIA Oreanda-News, 27 July 2012, via Dow Jones Factiva, © 2012 RIA OREANDA.
20.“A retrospective view of shale gas development in the United States,” United States Association for Energy Economics, http://www.usaee.org/usaee2013/submissions/Abs/What%20led%20to%20the%20shale%20gas%20boom.pdf, April 2013, © 2013 Resources for the Future; “China commences construction of first shale gas pipeline,” IHS Global Insight Daily Analysis, 20 June 2013, via Dow Jones Factiva, © 2013 IHS Global Insight Limited.
8 | Shale gas - Global experience and key learnings
21.“Twelfth five year plan,” Planning Commission, Government of India, 2013, Pg. 176; “Monthly production,” Ministry Of Petroleum & Natural Gas, March 2013.22.“Technically Recoverable Shale Oil and Shale Gas Resources: An Assessment of 137 Shale Formations in 41 Countries Outside the United States,” US Energy
Information Administration, June 2013; “World Shale Gas Resources: An Initial Assessment of 14 Regions Outside the United States,” US Energy Information Administration, April 2011.
23.“Industry News - Shale Regulation Limits Short-Term Unconventional Outlook,” Business Monitor International, 15 August 2013.
Shale gas in IndiaIndia’s natural gas market continues to see a deficit, with demand far exceeding supply. In FY13, natural gas consumption in India is expected amount to 104.4 bcm, as compared to its production of 40.7 bcm.21 Consequently, the country’s dependence on LNG imports has increased considerably. The Indian Government has been taking measures on an ongoing basis to bridge this supply-demand deficit. These include its initiatives to increase wellhead gas prices, effective April 2014, which is likely to incentivize companies to increase their gas production and also benefit the India’s shale gas industry.
The EIA has revised its estimates upwards for technically recoverable shale gas resources in India, which now stand at 96 tcf, up from its previous estimate of 63 tcf.22 The revision will help the Government attract investors to its first shale gas bidding round (slated toward the end of 2013).
The Government has prepared a draft policy for exploration and production of shale oil and gas in the country, and has invited comments and suggestions from various stakeholders. According to the proposal submitted by the Petroleum Ministry to the Cabinet Committee on Economic Affairs, initial permission for exploration of shale resources on existing acreage will be restricted to NOCs. The policy also proposes several financial incentives for NOCs, including Income tax and customs exemptions, along with reduced royalty to be paid on shale gas. The Ministry plans to formulate a separate policy for private and foreign companies at a later date. 23
9Shale gas - Global experience and key learnings |
Key learning for IndiaIn order to replicate the shale gas boom in the US, the Indian Government will need to build strong service and infrastructure capabilities, along with a favorable regulatory regime, which not only promotes shale gas exploration and production (E&P) activities, but also addresses environmental and social concerns. Taking a cue from the US, the Government could look at building a liberal fiscal regime, since the shale industry is at its infancy stage of development in the country, and the cost of such initiatives will be higher than those of conventional oil and gas operations.
Lack of technological know-how and inadequate OFS sector capacity and suitable equipment are some of the bottlenecks impeding the development of India’s unconventional resource potential. Domestic state-owned and private companies have partnered with foreign companies and also acquired stakes in foreign shale assets to gain the required technical expertise. They will have to continue to foster such partnerships to be able to apply their expertise in developing shale gas reserves in
India. Additionally, many OFS companies are looking to export the techniques they have used successfully in North America to international markets. The Indian Government could tap this opportunity and encourage the participation of such companies in the country.
India will also need to expand its natural gas pipeline infrastructure. Presently, around 11,500 km is covered by natural gas pipelines across the country, with another 12,650 km of pipeline infrastructure being under various stages of implementation.24 Timely execution of these projects will be critical for developing shale resources. Furthermore, the Government will have to create a favorable policy that addresses the concerns of both landowners, and oil and gas companies, with land acquisition expected to be a vital issue in India.
In the US, shale gas revolution has been led by mid-sized independent E&P and technology companies. Similarly, the Government of India should ensure that adequate incentives and a level playing field are made available to domestic private and foreign companies to encourage investments in this important hydrocarbon resource.
24. “12,650 K.M. Cross Country Pipeline Network being laid for transporting natural gas throughout the Country : Petroleum Minister,” Metis Energy Insider, 18 March 2013, via Dow Jones Factiva, © 2013 Metis Business Solutions Pvt. Ltd.
DK
Ernst & Young LLP
EY | Assurance | Tax | Transactions | AdvisoryAbout EYEY is a global leader in assurance, tax, transaction and advisory services. The insights and quality services we deliver help build trust and confidence in the capital markets and in economies the world over. We develop outstanding leaders who team to deliver on our promises to all of our stakeholders. In so doing, we play a critical role in building a better working world for our people, for our clients and for our communities.
EY refers to the global organization, and may refer to one or more, of the member firms of Ernst & Young Global Limited, each of which is a separate legal entity. Ernst & Young Global Limited, a UK company limited by guarantee, does not provide services to clients. For more information about our organization, please visit ey.com.
Ernst & Young LLP is one of the Indian client serving member firms of EYGM Limited. For more information about our organization, please visit www.ey.com/in.
Ernst & Young LLP is a Limited Liability Partnership, registered under the Limited Liability Partnership Act, 2008 in India, having its registered office at 22 Camac Street, 3rd Floor, Block C, Kolkata - 700016
© 2013 Ernst & Young LLP. Published in India. All Rights Reserved.
EYIN1308-060 ED None
Our offices in IndiaKochi 9th Floor “ABAD Nucleus” NH-49, Maradu PO Kochi - 682 304 Tel: +91 484 304 4000 Fax: +91 484 270 5393
Kolkata 22, Camac Street 3rd Floor, Block C” Kolkata-700 016 Tel: +91 33 6615 3400 Fax: +91 33 2281 7750
Mumbai 14th Floor, The Ruby 29 Senapati Bapat Marg Dadar (west) Mumbai-400 028, India Tel: +91 22 6192 0000 Fax: +91 22 6192 1000
5th Floor Block B-2 Nirlon Knowledge Park Off. Western Express Highway Goregaon (E) Mumbai-400 063, India Tel: +91 22 6192 0000 Fax: +91 22 6192 3000
NCR Golf View Corporate Tower – B Near DLF Golf Course Sector 42 Gurgaon–122 002 Tel: +91 124 464 4000 Fax: +91 124 464 4050
6th floor, HT House 18-20 Kasturba Gandhi Marg New Delhi-110 001 Tel: +91 11 4363 3000 Fax: +91 11 4363 3200
4th & 5th Floor, Plot No 2B Tower 2, Sector 126 NOIDA-201 304 Gautam Budh Nagar, U.P. India Tel: +91 120 671 7000 Fax: +91 120 671 7171
Pune C—401, 4th floor Panchshil Tech Park Yerwada (Near Don Bosco School) Pune-411 006 Tel: +91 20 6603 6000 Fax: +91 20 6601 5900
Ahmedabad 2nd floor, Shivalik Ishaan Near. C.N Vidhyalaya, Ambawadi Ahmedabad-380015 Tel: +91 79 6608 3800 Fax: +91 79 6608 3900
Bengaluru 12th & 13th floor “U B City” Canberra Block No.24, Vittal Mallya Road Bengaluru-560 001 Tel: +91 80 4027 5000 +91 80 6727 5000 Fax: +91 80 2210 6000 (12th floor) Fax: +91 80 2224 0695 (13th floor)
1st Floor, Prestige Emerald No.4, Madras Bank Road Lavelle Road Junction Bengaluru-560 001 India Tel: +91 80 6727 5000 Fax: +91 80 2222 4112
Chandigarh 1st Floor, SCO: 166-167 Sector 9-C, Madhya Marg Chandigarh-160 009 Tel: +91 172 671 7800 Fax: +91 172 671 7888
Chennai Tidel Park, 6th & 7th Floor A Block (Module 601,701-702) No.4, Rajiv Gandhi Salai Taramani Chennai-600113 Tel: +91 44 6654 8100 Fax: +91 44 2254 0120
Hyderabad Oval Office 18, iLabs Centre Hitech City, Madhapur Hyderabad - 500081 Tel: +91 40 6736 2000 Fax: +91 40 6736 2200
This publication contains information in summary form and is therefore intended for general guidance only. It is not intended to be a substitute for detailed research or the exercise of professional judgment. Neither Ernst & Young LLP nor any other member of the global Ernst & Young organization can accept any responsibility for loss occasioned to any person acting or refraining from action as a result of any material in this publication. On any specific matter, reference should be made to the appropriate advisor.
Cerebral Business Research provides Intelligent Online Business Information Knowledgebase, Newsletter and Thought Leadership services in Oil & Gas (including Upstream), Power & Renewable and Infrastructure (Roads & Highways) verticals. Working extensively our subject matter experts have developed this comprehensive knowledgebase which caters to all Business & Technical aspects of Energy and Infra sector. Our vast experience in the intelligent business information and thought leadership domain enables us to offer you the most relevant, reliable and well-designed online Business Information in order to enhance productivity & growth of your organization and offer insights in the competitors landscape. We also undertake Research On Demand market driven assignments as per client’s requirement and scope of work.
Please visit www.cerebralbusiness.com/knowledgebase for more details
Contact Person Vineet Sharma Director (Information Services Business)
[email protected] Mob - +91 9971498843