shadow economy in the netherland antilles dec-06 · 7 permit and/or work permit. The number of...
33
1 BNA/WP/07/01 The shadow economy in the Netherlands Antilles January 2007
Transcript of shadow economy in the netherland antilles dec-06 · 7 permit and/or work permit. The number of...

1
BNA/WP/07/01
The shadow economy in the Netherlands Antilles
January 2007

2
The shadow economy in the Netherlands Antilles
By Miriela G.L. Carolina and Lennie Pau1
January 2007
Abstract
The last decade provides strong indications of an expansion in shadow economic activities in the Netherlands Antilles, the result of the high tax burden and high unemployment. This paper attempts to measure the size of the shadow economy of the Netherlands Antilles using two distinct estimation methods: direct and indirect approaches. Both methods produced similar results-a shadow economy of the Netherlands Antilles equal to be approximately 11% of GDP. JEL Classification Numbers: E26, H26, I3, J21, and O54 Keywords: Informal economy, shadow economy, tax burden.
1 The authors are currently working at the Research Department of the Central Bank of the Netherlands Antilles. (e-mails: [email protected] and [email protected])
The views expressed in this paper are those of the authors and do not necessarily represent those of the Bank van de Nederlandse Antillen.

3
Introduction
The existence of a shadow economy in the Netherlands Antilles is unquestionable. The familiar view of street vendors and car washers, among others, earning their day-to-day living by offering goods and services are simple illustrations of this worldwide phenomenon. Our first attempt to measure the size of the shadow economy2 of the Netherlands Antilles was in 2002. This working paper is an updated version of our first publication, “175 years of Central Banking in the Netherlands Antilles, the shadow economy in the Netherlands Antilles,” (October 2002). There are strong indications that the shadow economy is growing. The increasing unemployment related to the recession in the late nineties induced the labor force to be creative by starting up small scale, low overhead cost enterprises in the shadow economy. In the early 2000s, the foreign demand for drugs and the high value added created by this sector made the flourishing illegal shadow economy3 more visible. The objective of this paper is to calculate the size of the shadow economy of the Netherlands Antilles using applicable estimation methods. The results must be considered as preliminary. It is important to have an estimate of the size of the shadow economy for the following reasons:
(1) Forecasting without the shadow economy data underestimates the macroeconomic key variables.
(2) Simulation of shocks will create distorted information leading to incorrect policy implementation.
This paper is organized as follows: Section 1 provides an overview of the economy of the Netherlands Antilles. Section 2 defines the shadow economy, describes the shadow economy in the Netherlands Antilles, and presents the different estimation methods. In section 3, the size and the economic structure of the shadow economy in the Netherlands Antilles is estimated using both indirect and direct approaches. Section 4 concludes the paper with a summary and some recommendations.
1. The Netherlands Antilles: An overview
Monetary policy The official tender in the Netherlands Antilles is the Netherlands Antillean guilder (NAf.). The primary objective of the Central Bank is to maintain the external value of the Antillean guilder. To achieve this goal, the monetary policy of the Central Bank is aimed towards maintaining a fixed peg with the US$. Since December 23, 1971 the parity between the two currencies has been 1 US$ = 1.79 NAf. The peg is fixed towards the US$ because one of our main trading partners is the United States. To guarantee the fixed peg between the NAf. and the US$, the Central Bank has to maintain a level of official reserves (excluding gold) that covers at least three months of merchandise imports. Monetary policy instruments in use by
2 The shadow economy represents economic activities that take place outside the formal norms of economic transactions. In this paper, informal sector and the shadow economy are the same concept. 3 See additional definitions in section 2.

4
the Central Bank are aimed mainly at influencing the liquidity position of the commercial banks. The instruments used in the implementation of the Bank's monetary policy are the reserve requirement, money market instruments, and the policy on foreign positions. Fiscal policy During the seventies, the government budget expanded, due to the tax revenues collected from international financial companies, mainly from the United States. From 1980 -1990, the government budget was severely affected by two main events: (1) the repeal of the withholding tax in the United States, which affected the international financial sector; and (2) the departure of the multinational ‘Shell’ oil company. Since 1986, the Venezuelan oil company, `PDVSA,’ has been leasing the refinery. The refinery is exempted from profit tax and import duties. These events forced the government in 1986 to initiate a restructuring program to reduce the fiscal deficit. This program was followed by consecutive programs related to budget reduction. Fiscal policy shifted from an expansionary policy to a budget reduction policy. During this period, arrears accrued in nearly all sectors related to the government. The pension fund and the health sector, among others, were severely affected by the huge arrears. Government investment was postponed, which hampered government services. Merging, privatization, reduction of subsidies, termination of government services, and raising the taxes and social security premiums were the main points of policy action. The economic structure The economy of the five islands of the Netherlands Antilles is largely dependent on service- related activities. Trade, international financial services, transportation, and tourism sectors are well developed foreign exchange-and employment-generating sectors. Moreover, the oil refining industry and ship repair sector have contributed substantially to the economic diversification. The structure of the economy has changed over the last decades. The decline in government revenues due to the elimination of the withholding tax in the United States forced the government to restructure. The government lowered its share in production from 18.5% in 1979 to 13.6% in 2004 (Table 1). In the private sector, the share of GDP of the transportation, storage and communication sector shrank considerably from 20.8% in 1979 to 9.5% in 2004. In contrast, the financial and business services sectors expanded substantially from 15.5% of GDP in 1979 to 29.2% of GDP in 2004. The economy of the Netherlands Antilles is open and relatively small in scale, thus very susceptible to global developments and external shocks. The imports to Gross Domestic Product (GDP) ratio averaged 81% in the period 1996 – 2004. The exports to GDP ratio averaged 75% in the period 1996 – 2004.

5
Table 1: Gross Domestic Product by sector: 1979 -2004 Gross Domestic Product by sector (%) 1979 1987 1997 2004
Agriculture, fishing, and mining 0.6 0.7 0.6 0.6Manufacturing 7.9 5.8 6.2 5.5Public utilities 2.0 4.0 4.2 4.7Construction 9.1 7.1 5.9 5.1Wholesale and retail sale 17.2 21.1 13.2 12.0Restaurants and hotels 4.3 6.4 3.8 3.9Transportation, storage, and communication 20.8 10.8 9.8 9.5Finance, insurance, real estate, and business services 15.5 19.9 26.5 29.2Community, social, and personal services 6.9 10.6 7.5 8.4 Value added private sector 84.3 86.4 77.7 78.9- Imputed service charge 2.8 3.6 2.4 2.2Taxes less subsidies N/A N/A 7.7 9.7Value added government 18.5 17.2 17.0 13.6Gross Domestic Product 100.0 100.0 100.0 100.0Source: National Accounts, Central Bureau of Statistics
2. Shadow economy: Definitions, comparisons, and approaches
The literature contains a large range of different terminologies commonly used for the unmeasured economy: informal sector, underground economy, shadow economy, hidden economy, parallel economy, subterranean economy, cash economy, and black market. Because no common understanding exists about the definitions of these terms, wide interpretations have resulted as each author has his/her own. The shadow economy is defined as economic activities taking place outside the formal norms of economic transactions established by the state and formal business practices. These activities are generally small scale or micro-businesses run by individuals or families. Activities in the shadow economy can be both legal and illegal:
• Illegal activities involve the production of goods and services prohibited by law or unlawful when carried out by unauthorized producers (e.g., drug trafficking, money laundering, briberies, and illegal prostitution practices).
• Legal activities are intentionally hidden from the authorities to avoid paying taxes or complying with regulations (e.g., lack of proper business permits, violation of zoning codes, labor regulations governing contracts and work conditions, and/or the lack of legal guarantees in relations with suppliers and clients).
Table 2 gives an overview of the shadow economy for both the production of legal and illegal goods and services and for both monetary and barter (nonmonetary) transactions.

6
Table 2: Types of underground economic activities Type of activity Monetary transactions Nonmonetary transactions Illegal activities
Trade with stolen goods; drug dealing and manufacturing; prostitution; gambling; smuggling; fraud; etc.
Barter of drugs, stolen goods, smuggling, etc. Produce or grow drugs for own use. Theft for own use.
Tax evasion Tax avoidance Tax evasion Tax avoidance Legal activities
Unreported income from self-employment; wages, salaries and assets from unreported work related to legal services and goods.
Employee discounts, fringe benefits.
Barter of legal services and goods.
All do-it-yourself work and neighbor help.
Source: Lippert and Walker (1997)
The size of the shadow economy in the region
Estimates obtained for the shadow economy in the region, using the Tanzi currency demand approach, shows that the size varies significantly between countries. For example, the estimated size of the shadow economy in Guyana was about 40% of GDP4 (2000), in Trinidad & Tobago 10% of GDP5 (1999), and in Barbados 0.03% of GDP6 (2000).
2.1. The shadow economy in the Netherlands Antilles
The informal or shadow economy has also undergone structural changes in the Netherlands Antilles, as various regulations regarding this sector have been introduced and enforced over the last decades. However, a government policy towards legalizing the informal sector has not been explicitly stated. The following summarizes some government policies implemented to regulate the informal sector. In 1986, the government legalized the sale of the lotteries, a rapidly expanding shadow economic activity. Since 1993, several laws on money laundering have been implemented. In 1997, suppliers of small credit for consumer goods purchases came under supervision of the Central Bank. In 2000, the government reinforced the regulation of ‘snack bars,’ as they were expanding and operating without a business license. With these regulations in place, the abovementioned activities switched from the shadow economy to the official economy. In the early 2000s, the illegal activities related to drug trafficking from South America via Curaçao to Europe became more transparent. In 2001, the Minister of Justice of the Netherlands Antilles and the airlines agreed to take measures to interdict drug smugglers on the transatlantic flights. The increasing number of illegal immigrants active in the labor market was officially registered in 2001. The Island Government of Curaçao granted a grace period in 2001 to illegal immigrants who had entered the country before August 2001 to apply for a residence
4 Faal, E. (2003) 5 Maurin, Alain, Sookram, S, and Watson, P.K. (2003) 6 Mayers, Stuart, Downes, Darrin, and Greenidge, Kevin (2002)

7
permit and/or work permit. The number of illegal immigrants in Curaçao was approximately 6,000 during that period. 7 In Appendix A the most common activities by sector in the shadow economy in the Netherlands Antilles are presented.
2.2. Causes and consequences of the shadow economy in the Netherlands Antilles
In this section, we discuss in more detail the causes and consequences of the shadow economy in the Netherlands Antilles. In many other countries, the shadow economy has the same roots and to a great extent similar disadvantages as in the Netherlands Antilles. The following factors may increase the size of the shadow economy. Recession, poverty, and a structural mismatch in the labor market Recessions, poverty, and the mismatch in the labor market can lead to a growth in the shadow economy. For years, the Netherlands Antilles has been suffering from structural unemployment, as the skills of the job seekers do not match the requirements of the job vacancies. Employers and investors complain about a lack of qualified people to employ. A paradoxical situation exists in the labor market, as the high unemployment often coexists with vacancies in the low-skilled labor-intensive occupations. Additionally, the demand for jobs is reduced by the economic slowdown. Some of the unemployed migrate to the Netherlands, and others become discouraged and give up looking for work. A number of these unemployed are forced by survival strategies to perform informal activities, frequently in the trade and community & social services sectors, while others get involved in illegal activities. It has become quite common for disadvantaged individuals to serve as “drug mules” to smuggle drugs to Europe. Besides the economic slowdown, the high unemployment rate in the Netherlands Antilles has been blamed partly on the social benefits: the poverty trap. The unemployed, with no source of income, can apply for welfare payments (the so called ‘onderstand’), obtain free health care and medication, subsidies for housing, electricity, and clothing for their children. Although most of these benefits are not received as income, their aggregated value can outweigh the income earned when employed and earning a minimum wage without these social benefits.8 As a result, a large number of people who are collecting social benefits are also employed in the informal sector. High tax and social security burden The high tax and social security burden induces people to evade the current system and avoid paying taxes and social security premiums. The shadow economy is providing both employees as well as employers the appropriate environment for matching demand and supply of services, resulting in a lower than the “official” market price. In the Netherlands
7 NAVAS system of the Office of Immigration of Curaçao 8 For more details, see the study “Introductie plaatsing bevorderingsinstrument ‘Rumbi pa trabou.”

8
Antilles, this burden has enticed people to shift from the official economy to the shadow economy. In addition, the tax system in the Netherlands Antilles is rather complex, which induces people to find ways to avoid paying taxes. Over the years, the tax and social security system has changed in the Netherlands Antilles. Figure 1 presents the development of the tax and social security burden including and excluding profit tax from international financial services. The tax and social security burden including this profit tax was on average 39% during the period 1979-2004. After the repeal of the US withholding tax, the decline in the profit tax of international financial services sector led to a drop in the tax and social security burden after 1987. The tax and social security burden excluding the profit tax on international financial services was on average 33% during the same period. To analyze the domestic tax burden, we exclude the profit tax on the international financial services. Since 1991, the tax and social security burden has been showing an increasing trend. Figure 1
Tax & social security burden/GDP ratio
0.0
5.0
10.0
15.0
20.0
25.0
30.0
35.0
40.0
45.0
50.0
55.0
79 80 81 82 83 84 85 86 87 88 89 90 91 92 93 94 95 96 97 98 99 00 01 02 03 04
(%)
Tax incl. profit tax on int'l fin. serv. & soc.security burden/GDP ratio Tax excl. profit tax on int'l fin. serv. & soc.security burden/GDP ratio
The rising trend in the tax and social security burden was the result of various changes in the system, in both the direct and indirect taxes, as well as in the social premium system. See Box 1 for detailed information on these changes.

9
Box 1: Background information on the developments in the tax and social premium systems during the period 1994-2005 In the direct tax system the following occurred:
• In 1994, the income tax law was modified, allowing married couples to file their income tax separately. Interest, dividend, and other capital gains are added to the highest income earner.
• In 1997, the pay-as-you-file self-assessment system for the profit tax was introduced. • In December 1999, the Parliament approved a new fiscal regime (NFR) legislation
eliminating the distinction between onshore and international financial sector profit taxes. The profit tax rate was changed from a tax bracket system (39%-45%) to a flat rate system (34.5% including the island surcharge). The NFR law became effective in January 2001.
• In 2001, deductions to income and profit taxes were eliminated or restricted, raising the tax burden.
Amendments in the indirect tax and social premiums were as follows:
• Prior to the implementation of a structural adjustment program (SAP), a 6% sales tax (ABB) was introduced on the Leeward Islands on July 1, 1996.
• A 3% turnover tax (BBO) was introduced on the Windward Islands on January 1, 1997.
• On January 1, 1999, the 6% sales tax (ABB) was eliminated on the Leeward Islands. Simultaneously, the turnover tax (BBO) on the Windward Islands was reduced from 3% to 2%.
• The sales tax was replaced by a 2% turnover tax (NAOB) on the Leeward Islands during March-May 1999, which was subsequently raised to 5% in October 1999.
• On May 1, 2000, the turnover tax (BBO) on the Windward Islands was raised from 2% to 3%.
• In 2001-2005, the economic levies on imported goods were phased out. • In 1997, a health insurance scheme was introduced for chronically ill patients (AVBZ).
Intensity of government regulations, e.g. labor market regulations The rise in intensity of regulations is usually determined by the number of laws and the way the regulations are enforced. Labor market regulations, e.g., license requirements, can cause higher labor costs in the official economy and lead to a growth in the shadow economy. To avoid the complex labor law regulations and to lower labor costs, employers have the tendency to hire workers informally. According to Johnson, Kaufmann, and Zoido-Lobatón (1998a, b), countries that have a smaller shadow economy also have a relatively low tax and regulatory burden and seem to collect more tax revenues. Moreover, these countries have less corruption and a good rule of law. In 2000, the government of Curaçao initiated a

10
process to make the labor market more flexible. However, some of the measures that were introduced were retracted in 2003. According to a survey by the Caribbean Rim Investment Initiative in 2003, many investors claimed that the Netherlands Antillean labor market regulations were too rigid. To avoid the complex labor law regulations (red tape) and to lower the labor costs (e.g., minimum wage and severance pay), employers are more inclined to use workers willing to work informally. Being unemployed and needing to survive encourages individuals to work in the shadow economy. Many immigrants from South America and the Caribbean, e.g., Colombia, Venezuela, the Dominican Republic, Jamaica, and Haiti, seek refuge and employment in the Netherlands Antilles. Most of these immigrants lack the proper paperwork, because they enter the country with a tourist visa and overstay the stated period. Some employers prefer to hire illegal migrants because they can evade the payment of social security and other taxes. These workers often are paid less than formal workers for similar tasks, are concentrated in low-paid or unskilled and semi-skilled labor-intensive activities, and are usually employed on a temporary basis. Thus, both the employer and employee have a shadow economy position. In the long run, a growing shadow economy in the Netherlands Antilles has the following repercussions:
• The official statistics become unreliable. Policies and programs based on unreliable data are often flawed. For example, programs aimed at reducing unemployment will not be effective because a large number of these lower-skilled or semi-skilled people are already employed in the informal sector. Moreover, some of these people are not willing to work in the official economy because they do not want to lose their social benefits.
• Tax revenue and social security income are lower, due to a lack of compliance. The people working informally do not comply with the tax payments and social security premiums, but they do benefit from the public services, e.g., health care and education.
• Unfair competition, due to tax evasion means that informal firms offering cheaper prices can force honest businesses out of the market or underground; for example, businesses offering cheaper prices for goods and services when paid in cash instead of checks or credit cards.
2.3. Different approaches for estimating the size of the shadow economy
Two approaches can be used to measure the size of the shadow economy: (1) direct approaches (based on surveys and tax auditing); and (2) indirect approaches (model approach based on macroeconomic indicators) Direct approaches frequently use both surveys and samples based on voluntary responses, or tax auditing and other compliance schemes. However, these survey methods have their weaknesses because both accuracy and results rely heavily upon the interviewees’ willingness to collaborate and their incentive to provide correct responses.

11
The indirect approaches are based mainly on macroeconomic indicators, which “leave a trail” of the existence of a shadow economy. Presently, five indicators/methods leave some “traces” of the shadow economy:
1. The discrepancy between national expenditures and income statistics, 2. The discrepancy between the official and the actual labor force, 3. Monetary methods (transaction approach and currency demand approach), 4. The physical input method (electricity consumption), and 5. The model approach.
In our paper, we use both direct and indirect approaches to estimate the size of the shadow economy. Our direct approach is based on the sample data from the Labor Force Sample Surveys (LFSS) gathered by the Central Bureau of Statistics. Two indirect approaches were used, the currency demand approach and the electricity method.
3. The size of the shadow economy in the Netherlands Antilles According to the international literature, a close relationship exists between people employed in the official labor market and those in the shadow economy; people employed in the official economy can also be employed in the shadow economy. The shadow labor market in the Netherlands Antilles takes the following forms: (1) people who prefer to work underground for numerous reasons; these people are classified as unemployed in the official labor force; (2) people with a second job after (or even during) regular working hours; (3) work of individuals, e.g., retirees, receiving pensions, who are not part of the official labor market; and (4) employment of illegal immigrants, who do not have a permit to work in the official economy.
3.1. Direct approach: labor market The direct approach we used to estimate the size of the shadow economy is based on the information from CBS’s Labor Force Sample Surveys (LFSS) of 2004 and 2005. This survey measures the number of persons informally employed in the formal9 and informal sectors. Informal workers are usually not subject to standard labor legislation, i.e., taxation and social protection. In short, the results of the LFSS show that the share of informally employed in relation to the total employed in the Netherlands Antilles are about 24% and that more women than men are employed in the informal sector. Approximately 68% of these individuals have a secondary education.10 For further details on the LFSS study see Appendix B. The LFSS has its limitations. It may underestimate the actual total number of persons working informally in the Netherlands Antilles for the following reasons.
9 Companies registered at the Chamber of Commerce (KvK) 10 MAVO/LBO/VSBO

12
• It does not take into account people involved in illegal shadow economic activities, such as drug trafficking and prostitution.
• Individuals working less than 4 hours per week are regarded as unemployed, and therefore, are excluded from the employed working population. However, individuals working less than 4 hours per week are more likely to be working underground.
• It does not measure individuals with more than one job. According to the international literature, most people employed in the shadow economy usually have a second job.
Next, we present the methodology used to estimate the size of the shadow economy of the Netherlands Antilles based on the LFSS data. Methodology The data set we have used to estimate the size of the shadow economy is drawn from the LFSS. The concept of value added is used, defined as the sum of the total wages, profits, and rents.
(1) To assess the annual wages, the number of employed in the shadow economy in each sector was multiplied by the estimated average wage rates. The assumption is that the average wage rates of the informal workers are about 20% less than those paid to the formal workers. It is obvious that persons working informally earn comparatively less income per month than those in the formal economy. Therefore, the minimum wage of NAf.1,000 per month was used as the benchmark for the informal wage rate. However, in some sectors, such as financial & business services, public administration & education, and health & social work, we assumed that informal workers earn on average more than the minimum wage. The people in these sectors are usually skilled workers. We have taken into account that most of the informal workers are employed 40 hours per week. According to the LFSS, about 50% of the individuals employed in the informal sector work 40 hours per week. Furthermore, about 34% of these informally employed work 33 hours per week.
(2) To arrive at the total value added in the shadow economy, we raised the total annual
wages of each sector by multiplying them by a factor. This factor represents the missing information about individuals who are working less than 4 hours, involved in illegal shadow economic activities, and ‘moonlighting’. This factor also includes the value of the profits and rents. According to the National Accounts, the share of the value added of profits & rents is relatively similar to that of wages & salaries. In the shadow economy, we assume that on average the share of the value added of profits and rents is twice as that of the official economy. Therefore, we used a factor of two as a benchmark throughout to raise the total annual wages in the shadow economy. Except for the wholesale & retail trade sector, the factor is assumed to be four-fold, compared to the official economy because illegal activities, such as drug trafficking and drug smuggling, generate high profits.

13
The estimated size of the shadow economy in the Netherlands Antilles is approximately 11% of GDP in 2005. Wholesale & retail (3.4% of GDP) make up the largest share of the shadow economy, followed by financial & business services (1.8% of GDP), public administration/education (1.3% of GDP), and construction (0.9% of GDP). Table 3 illustrates the size of the shadow economy by sector. Table 3: Shadow economy by sector in the Netherlands Antilles (2005) Sector % by sector of
GDP Manufacturing/Electricity 0.5 Construction 0.9 Wholesale & retail trade 3.4 Hotels & restaurants 0.7 Transport, storage and communication 0.7 Financial/business services 1.8 Public administration/education 1.3 Health & social work 0.5 Community & social services 0.6 Private households 0.5 Other/unknown 0.1 Total 11 Source: Estimate by the BNA
3.2. Indirect approaches
Monetary methods
In general, shadow economic activities deal in cash to avoid leaving too many traces behind. It is assumed that shadow economic activities are expanding when the demand for cash increases above the ‘normal’ relative or absolute value. Two different approaches to determine the size of the shadow economy and its progress over time using monetary statistics: transactions and currency demand approach. In the case of the Netherlands Antilles, we used the currency demand approach. The currency demand approach This method was developed by Cagan (1958), based on a correlation between the currency demand and the tax pressure (as one of the causes of the shadow economy) for the United States during the period 1919-1955. Gutmann (1977) used the same approach to study the ratio between currency and demand deposits. The work of Cagan was further developed by Tanzi (1980, 1983), who econometrically estimated the currency demand function for the United States for the period 1929-1980. He assumed that shadow transactions are conducted in cash payments, to leave no observable traces for the authorities. An increase in the size of the shadow economy will increase the demand for currency.

14
Tanzi (1983) proposed the following regression equation for the currency demand: ln (C/M2 )t = β0 + β1 ln (1 + TW)t + β2 ln (WS/NI)t + β3 ln Rt + β4 ln (Y/N)t + ut (1) C/M2 : the ratio of cash holding to current and deposit accounts, TW : a weighted average tax rate (to proxy changes in the size of the shadow
economy), WS/NI : the proportion of wages and salaries in national income (to capture changing payments and money holding patterns), R : the interest paid on savings deposits (to capture the opportunity cost of holding cash), Y/N : the per capita real income. As the level of taxation rises, individuals are encouraged to engage in tax-evading activities facilitated by the use of currency, since this practice leaves no traces, raising the use of currency (β1 > 0). Especially daily workers are mostly paid in cash, compared to other types of income (interest, dividends) that are paid mostly in checks or electronic transfers. Therefore, an increase of wages in total income will require more currency (β2 > 0 ). Meanwhile, an increase of real income per capita, as a proxy of economic growth, is assumed to lead to the replacement of currency by checks, thus leading to a fall in the ratio C/ M2 (β4 < 0). Similarly, an increase in the interest rate increases the opportunity cost of holding currency; thus the ratio C/ M2 is expected to decline (β3 < 0 ). In this approach, the shadow economy is nonexistent when taxes are zero. The difference between the estimated currency (with taxes) and the estimated currency (under the assumption of zero taxes) produces an estimation of currency in the shadow economy. Tanzi assumes that the velocity of money in the shadow economy is the same as in the official economy. The estimate of the size of the shadow economy is obtained by multiplying the currency in the shadow economy by the velocity of money. The method and assumptions of this approach have been criticized.
• Not all transactions in the shadow economy use cash as a means of exchange; therefore, the size of the shadow economy (including barter) may be underestimated.
• Besides tax burden, other factors, such as regulation and tax morality, might have an impact on the shadow economy.
• In the case of the United States, the rise in the ratio currency/demand deposits was due mainly to a slowdown in demand deposits rather than to a rise in currency caused by activities in the shadow economy.
• The United States dollar is used as an international currency. As argued by Blades (1982) and Feige (1986, 1997), Tanzi should have considered (and controlled for) the United States dollars, which are used as international currency and held as cash reserves abroad.
• A similar velocity of money in the shadow and official economies is debatable.

15
• A base year in the official economy with a nonexistent shadow economy. Relaxing this assumption would lead to an upward adjustment of the size in the shadow economy.
• Some activities e.g., illegal activities, are not the result of a high tax burden.
3.2.1. Currency demand approach for the Netherlands Antilles The currency ratio relates the magnitude of the currency to M2. Transactions in currency are anonymous, while those involving checks or bank transfers leave an identifiable trace. To hide the source of income from tax or other authorities, participants in the shadow economy are more likely to use cash. In this sense, a rise in the currency ratio, ceteris paribus, could indicate an increase in the shadow economy. Figure 2
Currency/M2 ratio of the Netherlands Antilles
0
1
2
3
4
5
6
7
8
9
1995
-19
95-
1996
-19
96-
1997
-19
97-
1998
-19
98-
1999
-19
99-
2000
-20
00-
2001
-20
01-
2002
-20
02-
2003
-20
03-
2004
-20
04-
2005
-20
05-
2006
-
Monthly Data
(%)
In the case of the Netherlands Antilles, the monthly data clearly shows a declining trend in the currency ratio. Using these data will imply a declining trend in the shadow economy in the period under review. However, we know that these data needed to be adjusted based on certain well-known facts. Thus, the data were modified to include the information not accounted for in the currency data published by the Central Bank:
• The stock of currency does not include foreign currency holdings. These holdings in the hands of the public are excluded from the currency stock by definition. However, in the Netherlands Antilles, largely Curaçao and St. Maarten, the use of the US dollar as a means of exchange is quite substantial.
• In 2000, transatlantic drug trafficking to the Netherlands became more transparent. Especially, Curaçao served as a transit country for drugs from South America to the

16
Netherlands. We used the individual/family transfer data from our balance of payments as an indicator for these illegal transactions (see Appendix C).
To modify the currency data, only the second factor has been taken into consideration. Annual data have been used to estimate the equation because the frequency of the explanatory variables, such as tax rate and real income, are available only on an annual basis. The empirical method used is the Error Correction Model (ECM) framework.11 We estimated two equations. The first equation is based on Tanzi’s approach. We used the variable self employed (W_self ) as a proxy for the variable, proportion of wages and salaries in national income variable (WS/NI). A general form of the first equation is the following: ∆ ln (C/M2 )t = β0* ∆ ln (T-tot)t +γ0*∆ ln Rt + δ0* ∆ln (Y/P)t + λ0* ∆ln(W_self)t + α *(ln (C/M2)t-1 - β1/ α *ln (T-tot)t-1 - γ1 / α* ln Rt-1 - δ1/ α *ln (Y/P) t-1 - λ1/α*ln(W_self)t-1- c/a ) +ut (2) Where C/M2 : the ratio of cash holdings to M2, T-tot : direct and indirect tax rate as (% GDP), R : the interest paid on savings deposits (to capture the opportunity
cost of holding cash), Y/P : the real income, and W_self : the number of self-employed persons. The expected signs are β0, β1/ α > 0, γ0 , γ1 / α < 0, δ0 , δ1/ α < 0, and λ0 , λ1/α > 0. A general form of the second equation is: ∆ ln (C/M2 )t = β0* ∆ ln (T-ind)t +γ0*∆ ln Rt + θ0* ∆ln(U_no)t + λ0* ∆ln(W_self)t + α *(ln (C/M2)t-1 - β1/ α *ln (T-ind)t-1 - γ1 / α* ln Rt-1 - θ1 / α *ln(U_no)t-1 - λ1/α*ln(W_self)t-1- c/a ) +ut (3) Where T-ind : indirect tax rate (as % GDP), and U_no : the number of unemployed persons, The expected signs are β0, β1/ α > 0, γ0 , γ1 / α < 0, θ0 , θ1 / α > 0, and λ0 , λ1/α > 0. The second equation is an adjusted version of Tanzi’s approach. In this equation, unemployed persons are included as an explanatory variable. The Netherlands Antillean economy has been growing in nominal terms during the last two decades. In contrast, the unemployment (rate) has remained high, in double-digits. Clearly, the economic growth has not been strong enough to create sufficient jobs to curb the unemployment. The unemployment (rate) is a strong indicator of a growing shadow economy. Real income has not been included in the equations because this variable is insignificant in our case. 11 The ECM is described in more detail in Appendix D.

17
Data We used the annual data of the Netherlands Antilles for the period 1988-2004. The currency ratio and the interest rate on savings are from the Central Bank of the Netherlands Antilles. The number of unemployed and the number of self employed are from the data base of the Central Bank. Data on taxes, GDP, and the consumer price index of the Netherlands Antilles are from the Central Bureau of Statistics. Besides the currency, the GDP has been adjusted to obtain a consistent data set. More detailed information on the adjusted currency data can be found in Appendix C. Results of estimation To measure the size of the shadow economy, equations (2) and (3) are used. Equation (2) uses the following explanatory variables: total taxes, interest rate, self-employed, and real income. Equation (3) uses the explanatory variables: unemployed, indirect tax, interest rate, and self-employed. The results must be interpreted with caution because of the small sample size of the data. The asymptotic properties and model adequacy are summarized in Appendix D. Tables 4 and 5 give an overview of the estimated results of each equation. Table 4 represents the results of the ECM using equation (2). According to Tanzi, an economy without shadow economic transactions is obtained under the assumption that total taxes are zero. To estimate the shadow currency (Table 4, first column), this estimated currency (without tax) is subtracted from the estimated currency (with tax). Lastly, the shadow economy (Table 4, third column) is measured by multiplying the shadow currency by the velocity of money in the official economy. The last column shows the shadow economy as a percentage of GDP. Table 5 represents the ECM with unemployed, indirect tax, interest rate, and self-employed as explanatory variables, as listed in equation (3). In this case, the indirect taxes are assumed to be zero. To obtain the shadow currency (Table 5, first column), the estimated currency (without tax), is subtracted from the estimated currency (with tax). The methodology to obtain the third and the last column of Table 5 is similar to Table 4. Both equations give approximately the same results. The tables show that in the period 1988 – 2000, the shadow economy was about 6% of GDP, and it rose to approximately 11% of GDP during the period 2001-2003.

18
Table 4: Netherlands Antilles: Estimates of the shadow economy; Currency approach (equation 2) Shadow Money
(in millions NAf.)
Income velocity of
money
Shadow economy (in
millions NAf.)
Shadow economy as % of
GDP 1988 103.8 1.9 197.1 7 1989 96.5 2.1 201.1 6 1990 111.9 2.0 225.4 6 1991 120.9 2.0 241.6 6 1992 139.3 1.9 262.3 7 1993 143.6 1.9 266.5 6 1994 146.6 1.8 270.6 6 1995 170.4 1.8 306.2 7 1996 138.1 1.9 267.0 5 1997 176.4 1.9 335.3 7 1998 191.2 1.9 356.5 7 1999 178.8 1.7 309.5 6 2000 211.7 1.7 368.4 7 2001 341.2 1.6 531.7 10 2002 438.2 1.4 616.0 12 2003 450.8 1.3 606.0 11
Table 5: Netherlands Antilles: Estimates of the shadow economy; Currency approach (equation 3)
Shadow Money (in millions
NAf.)
Income velocity of
money
Shadow economy (in
millions NAf.)
Shadow economy as % of
GDP 1988 100.6 1.9 191.0 7 1989 96.4 2.1 200.8 6 1990 103.3 2.0 208.1 6 1991 117.4 2.0 234.7 6 1992 131.8 1.9 248.2 6 1993 146.7 1.9 272.2 6 1994 142.0 1.8 262.1 6 1995 152.3 1.8 273.5 6 1996 129.8 1.9 251.0 5 1997 172.6 1.9 328.1 7 1998 193.9 1.9 361.5 7 1999 183.1 1.7 317.0 6 2000 226.4 1.7 394.1 8 2001 355.7 1.6 554.2 11 2002 434.6 1.4 610.8 12 2003 450.4 1.3 605.4 11

19
3.2.2. Kaufman-Kaliberda Method The physical input (electricity consumption) method In general, the electricity/GDP elasticity has been observed to be close to one. According to the Kaufman-Kaliberda method, the shadow economy is the difference between the rate of the electricity consumption (indicator of the official and unofficial economy) and the rate of registered (official) GDP. This is a simple method because information is readily available and easy to use. However, this method has been criticized for the reasons listed:
• Not all shadow economy activities require electricity, because other energy sources can be used. Therefore, the shadow economy will be underestimated.
• Over time, technological changes have made the production and the use of electricity more efficient.
• The changes in the electricity/GDP elasticity may differ considerably over time and across countries.
We have tried to measure the growth of the shadow economy of the Netherlands Antilles with the Kaufman-Kaliberda method. Figure 3 shows that the shadow economy has been fluctuating over the last two decades. During the period 2000-2003, there were strong indications of a growing shadow economy, as opposed to the results obtained from this method. Therefore, in our view, this is an inappropriate method to measure the shadow economy. Figure 3
Growth rate of shadow economy
-10
-8
-6
-4
-2
0
2
4
6
81 82 83 84 85 86 87 88 89 90 91 92 93 94 95 96 97 98 99 00 01 02 03 04
(%)
%∆ electricity-%∆ GDP

20
4. Conclusion and recommendations The literature on the shadow economy is expanding, as this subject has increased in importance worldwide. The causes and the consequences of the growing shadow economy are numerous. A growing shadow economy distorts the official data, providing policymakers with unreliable indicators, which can lead to wrong decisions. In this paper, we attempted to measure the size of the shadow economy in the Netherlands Antilles. Assessing the size and the development of the shadow economy is difficult due to a lack of information because the people involved in shadow economic activities prefer to remain unknown. Three methods were used to calculate the size of the shadow economy in the Netherlands Antilles: the labor survey method, the currency demand approach, and the electricity consumption approach. Our first approach was based on the data set of the Labor Force Sample Survey (LFSS) by the Central Bureau of Statistics. These data include individuals working informally in the informal and formal sectors in the Netherlands Antilles. This approach may underestimate the size of the shadow economy, as the LFSS has its limitations: it does not take into account individuals involved in illegal activities, people working less than 4 hours a week, and those who are moonlighting. Therefore, the actual total number of persons working informally in the Netherlands Antilles could be underestimated. The result from this approach indicated that the size of the shadow economy was about 11% of GDP in 2005. The currency demand approach (Tanzi’s approach) uses the stock of currency as a measure for the shadow economy. According to the theory, a higher stock of currency is an indication of an increasing shadow economy, as the players in this sector prefer to use cash to avoid any traces of their transactions. For this approach, we modified the stock of currency of the Netherlands Antilles. Because foreign exchange cash is not included in the statistics of cash money, the latter was adjusted to include the euro currency for the period 2000-2003. The euro currency was included because of the substantial transatlantic drug trafficking transactions in this currency during this period. The result from the currency approach showed that the shadow economy was on average 6% of GDP in 1988 – 2000, and rose to an average of 11% of GDP during the period 2001-2003. Tanzi’s approach is based on a zero tax rate to measure an economy without shadow economic transactions. Thus, when there are no taxes, there is no incentive to go underground. However, in our view, reducing the shadow economy does not require a zero level of taxation. Moreover, the level of taxation that minimizes the size of the shadow economy can differ by country. To reduce the shadow economy, an optimal tax rate should be considered. Therefore, we propose a slight adjustment to Tanzi’s assumption:
(1) Estimate an optimal tax rate for each country that will minimize the shadow economy. For example, in our case, a 50% reduction in the tax rates would reduce the informal economic activities considerably.
(2) A decline in the number of unemployed would reduce the shadow economy.

21
We also used the electricity consumption method, which uses electricity consumption as an indicator of the official and shadow economies. General information for the period under review suggests that this is an inappropriate method to measure the shadow economy in the Netherlands Antilles. Some recommendations with respect to the shadow economy are: (1) reduce the tax rate, which will reduce shadow economy activities; (2) reduce the number of unemployed (with the elimination of poverty traps), resulting in a smaller shadow economy; and (3) include shadow economy activities in the National Accounts data. This paper has provided some preliminary findings on the shadow economy in the Netherlands Antilles. Each method produced relatively similar results. Some questions still need to be addressed: How is the shadow economy affecting the official economy and vice versa? How different is the business cycle of the shadow economy compared to that of the official economy? These questions may encourage future research on this topic. The proposal to integrate shadow economic activities (legal and illegal) into the National Accounts will provide researchers with the appropriate data to further refine the assumptions, facilitating a more in-depth analysis of the shadow economy.

22
Appendix A Activities by sector in the shadow economy in Curacao On the micro level, the existence of the shadow economy is visible in almost all sectors. The shadow economic activities in Curacao, legal as well as illegal12, by sector are listed below. A. Agriculture &fishing • Gardeners and horticulturists • Market vendors of fish and other agricultural products
B. Construction Building, repairing, and renovating, e.g., welding, carpentry, bricklaying, and painting
C. Wholesale & trade and hotels & restaurants
C1. Wholesale & trade
• Clothing stores: undocumented or nonregistered sales persons • Selling food working from home; catering services • Market and street vending (newspapers, food, manufactured, and counterfeit goods) • Repairing electronic appliances • Contraband (*). Stolen property exchanged/sold cross border or domestically in
barter/money transactions • Drug trafficking/smuggling and (*)
C2. Hotels & restaurants • Hotels, restaurants, and snack bars: undocumented or nonregistered workers • Dance bars (exotic dance clubs) (*) • Illegal gambling (*) D. Transportation • Transportation of garbage and construction-related activities • Automobile maintenance and car repairs (car washing & mechanical services)
E. Financial/business activities, education, culture, & sports • Private tuition and coaching • Private jobs in the professional services, e.g., bookkeeping, administration, computer
programming, etc. 12 Illegal activities are denoted with a (*)

23
• Cultural events, e.g., carnival activities, selling, sewing, etc.
F. Community, social, & other services • Domestic work, e.g., senior caretakers, servants, childcare workers, and daycare
providers • Subcontractors hired by security services • Hairdressers/beauticians • Nightclub dancers • Prostitution (*)

24
Appendix B Table B shows some of the LFSS results. For more detailed information, see the paper “National Employment Report, Netherlands Antilles.” Wholesale & retail is the largest employer of informally employed workers, followed by financial/business services, and construction. The people employed in private households are automatically incorporated in the total informal sector. Table B: Informally employed by sector in the Netherlands Antilles (2005) Sector
InformalTotal
employed Informal/total employed (%)
Manufacturing/Electricity 1,096 5,300 1.5 Construction 1,882 5,702 2.5 Wholesale & retail trade 3,463 14,391 4.7 Hotels & restaurants 1,413 7,496 1.9 Transport, storage & communication 1,343 4,750 1.8 Financial/business services 1,972 11,378 2.7 Public administration/education 1,742 8,108 2.4 Health & social work 1,293 5,413 1.7 Community & social services 1,781 7,810 2.4 Private households 1,554 2,834 2.1 Other/unknown 452 893 0.6 Total 17,991 74,075 24.3 Source: National Employment Report, Netherlands Antilles; Ministry of Labor & Economic affairs, Central Bureau of Statistics, and Sociaal Kenniscentrum

25
Appendix C Adjusted currency data for the currency demand approach Foreign currency is not included in the statistics of the currency held by the public. Cash transactions in US$ are common in Curaçao and especially in St. Maarten. St. Maarten’s economy is partially dollarized. Since the introduction of the euro, a large amount of this currency has been circulating in the Netherlands Antilles. In Curaçao, euro money transactions related to drug trafficking became transparent during the period 2000-2005. Curaçao served as a transit country for drugs from South America to Europe. As an indicator for these illegal transactions, we used the individual/family transfer data from our balance of payments. For our currency approach, we modified the currency data by including the euro transactions. As a result, the adjusted currency data reveal a trend relatively similar to the inflows of the individual/family transfers during the period 2001-2003. Table C gives an overview of the inflows and outflows of these transfers from and to the Netherlands. Table C: Family transfers between the Netherlands and the Netherlands Antilles
(%) 2000 2001 2002 2003 2004 2005
Share Netherlands/total family transfers (inflow)
32.1 45.1 55.1 58.8 47.1 33.1
Share Netherlands family transfers (inflow)/GDP
0.9 1.6 4.1 4.9 2.9 1.6
Share Netherlands/family transfers (outflow)
22.6 22.7 23.1 22.2 16.3 16.5
Share Netherlands family transfers (outflow)/GDP
0.7 0.7 0.9 0.8 0.6 0.6
Source: Bank van de Nederlandse Antillen Results on money (M2) Any change in the currency stock should change the stock of money. Therefore, the adjusted currency should also be reflected in the stock of money. However, in our case, we do not have to modify the money stock, because it has already been taken into account through the increase in the demand deposits after the cash is spent domestically. Next, we have a comprehensive explanation of the results on money (M2). The euro currency is spent either domestically or externally. The external spending of the currency has no influence on M2. The euro currency spent in the Netherlands Antilles is not included in the money holdings (M2). As mentioned, in the period under review, these euro currencies (not M2) were substituted by demand deposits (M2), resulting in a higher M2.

26
Appendix D The currency demand approach To estimate the equation, annual data were used because the frequency of the explanatory variables, such as the tax rate and the real income, are only available on an annual basis. The empirical methods used are the Error Correction Model (ECM, equations 2 & 3) framework and the autoregressive distributed lag model (equations 2a & 3a). Equations 2 & 2a are based on Tanzi’s approach. Equations 3 & 3a are a modified version of Tanzi’s approach. The ECM representation equation (Tanzi approach) is: ∆ ln (C/M2 )t = β0* ∆ ln (T-tot)t +γ0*∆ ln Rt + δ0* ∆ln (Y/P)t + λ0* ∆ln(W_self)t + α *(ln (C/M2)t-1 - β1/ α *ln (T-tot)t-1 - γ1 / α* ln Rt-1 - δ1/ α *ln (Y/P) t-1 - λ1/α*ln(W_self)t-1- c/a ) +ut (2) And a general form of the first equation: ∆ ln (C/M2 )t = c + β0* ∆ ln (T-tot)t +γ0*∆ ln Rt + δ0* ∆ln (Y/P)t + λ0* ∆ln(W_self)t + α *ln (C/M2)t-1 +β1*ln (Ttot)t-1 + γ1* ln Rt-1 + δ1 *ln (Y/P)t-1 + λ1 *ln(W_self)t-1 +ut (2a) Where C/M2 : the ratio of cash holdings to M2, T-tot : direct and indirect tax rate as (% GDP), R : the interest paid on savings deposits (to capture the opportunity
cost of holding cash), Y/P : the real income, and W_self : the number of self-employed persons. The expected signs are β0, β1 > 0, γ0 , γ1 < 0, δ0 , δ1 < 0, and λ0 , λ1 > 0. The ECM representation of the second equation (adjusted Tanzi approach) is: ∆ ln (C/M2 )t = β0* ∆ ln (T-ind)t +γ0*∆ ln Rt + θ0* ∆ln(U_no)t + λ0* ∆ln(W_self)t + α *(ln (C/M2)t-1 - β1/ α *ln (T-ind)t-1 - γ1 / α* ln Rt-1 - θ1 / α *ln(U_no)t-1 - λ1/α*ln(W_self)t-1- c/a ) +ut The expected signs are βi/α > 0, γi /α < 0, θi /α > 0, λi/α > 0, for iI = 0, 1. (3) The more general form of the equation is as follows: ∆ ln (C/M2 )t = c + β0* ∆ ln (T-ind)t +γ0*∆ ln Rt + θ0* ∆ln(U_no)t + λ0* ∆ln(W_self)t + α *ln (C/M2)t-1 +β1*ln (T-ind)t-1 + γ1* ln Rt-1

27
+ θ1 *ln(U_no)t-1+ λ1 *ln(W_self)t-1 +ut (3a) Where T-ind : indirect tax rate (as % GDP), and U_no : the number of unemployed persons, The expected signs are β0, β1 > 0, γ0 , γ1 < 0, θ0 , θ1 > 0, and λ0 , λ1 > 0. Results To use ECM, the order of the variables must be determined using the Augmented Dickey-Fuller test (Table D1). All variables are I (1), with the exception of the number of self- employed, which is stationary. In Tables D2 and D3, four equations are presented. The equations were estimated first by an autoregressive distributed lag model (equations 2a & 3a) and second by an ECM (equations 2 & 3). Table D1: Augmented Dickey-Fuller tests
Levels First differences
Constant Constant and trend
Constant Constant and trend
Ln(C/M2) -1.516 -0.993 -4.696 -4.956 Ln(T-tot) -1.825 -2.172 -4.659 -4.535 Ln (R) -1.238 -2.694 -5.139 -5.096 Ln(Y/P) -0.330 -1.911 -3.660 -3.563 Ln(T-ind) -0.555 -3.457 -5.219 -3.992 Ln(U_no) -1.972 -2.470 -4.331 -4.257 Ln(W_self) -3.829 -3.699 The critical values at 5% significance level are -2.98 (with constant) and constant and trend is -3.603. The critical values at 10% significance level are -2.63 (with constant) and constant and trend is -3.23. The equations were estimated by Least Squares (LS). The asymptotic properties of the unconstrained LS estimator are stated in proposition 11.3 in Lütkepohl, 1993. The LS estimator and its covariance matrix are consistent estimators. The LS estimator has a normal distribution. As already mentioned, our small sample size poses problems for the parameter estimates and the (distribution) of t-values (Lütkepohl, 1993). In general, it can be stated that the asymptotic distributions can be used only as a rough approximation in the case of a small sample. The autoregressive distributed lag equations (2a and 3a) can be used to estimate the shadow economy, as the diagnostic tests on serial correlation (Breusch-Godfrey), the normality tests of Jacque-Bera, stability tests (Ramsey), and Arch tests performed adequately. All variables have the correct signs. However, the Error Correction equations (2 & 3) are preferred, because of the long-term relationship between the variables.

28
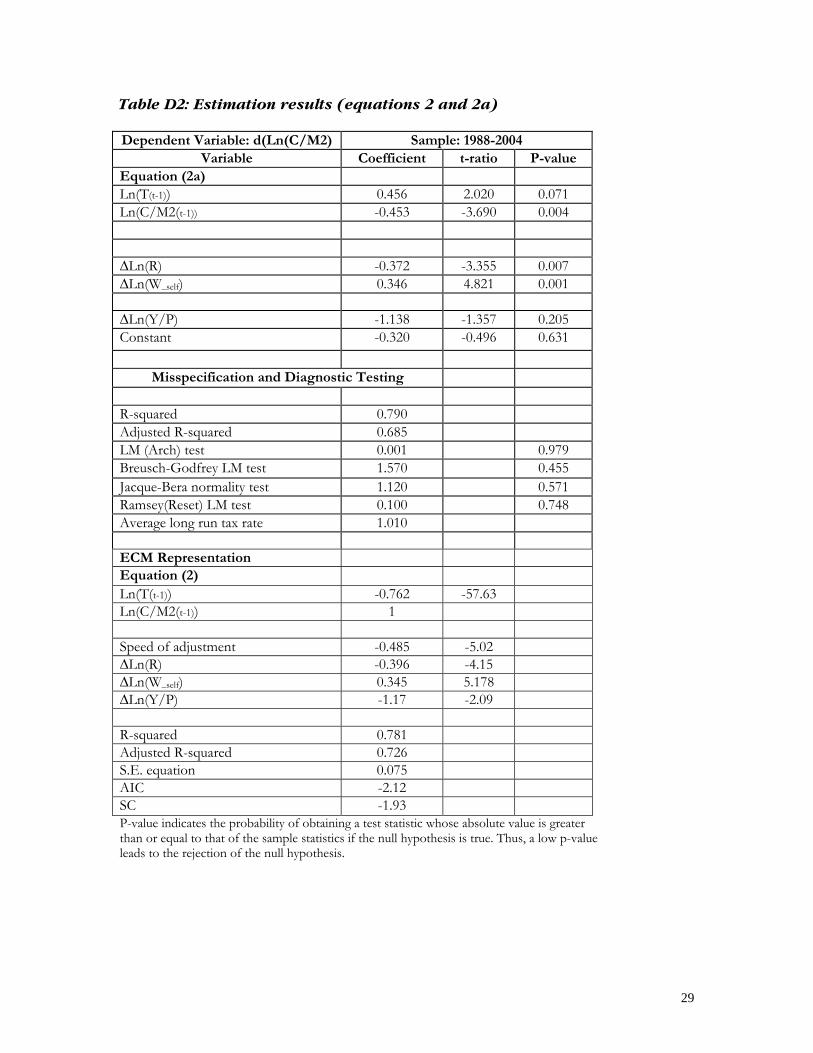
The total taxes have a co-integrated relationship with the currency ratio (see Table D2, equations (2)). The change in the number of self-employed has a positive effect on the currency money ratio, while the changes in the interest rate and the real income have a negative effect on the ratio, which is consistent with the theory. The long-run elasticity on the total tax rate is 0.76.
The indirect tax rate and the number of unemployed have a co-integrated relation with the currency ratio (see Table D3, equations (3)). The changes in the number of self-employed and the indirect tax rate have a positive effect on the currency money ratio, which is consistent with the theory. In contrast, the change in the interest rate has a negative effect on the ratio. The long-run elasticities on the indirect tax rate and the number of unemployed are, respectively, 1.076 and 0.211. The interpretation of the long-run elasticities are as follows: a 1% increase in the indirect tax rate will raise the currency ratio by 1.076%, and a 1% growth in the number of unemployed raises the currency ratio by 0.21%.
29
Table D2: Estimation results (equations 2 and 2a) Dependent Variable: d(Ln(C/M2) Sample: 1988-2004
Variable Coefficient t-ratio P-value Equation (2a) Ln(T(t-1)) 0.456 2.020 0.071 Ln(C/M2(t-1)) -0.453 -3.690 0.004 ∆Ln(R) -0.372 -3.355 0.007 ∆Ln(W_self) 0.346 4.821 0.001 ∆Ln(Y/P) -1.138 -1.357 0.205 Constant -0.320 -0.496 0.631
Misspecification and Diagnostic Testing R-squared 0.790 Adjusted R-squared 0.685 LM (Arch) test 0.001 0.979 Breusch-Godfrey LM test 1.570 0.455 Jacque-Bera normality test 1.120 0.571 Ramsey(Reset) LM test 0.100 0.748 Average long run tax rate 1.010 ECM Representation Equation (2) Ln(T(t-1)) -0.762 -57.63 Ln(C/M2(t-1)) 1 Speed of adjustment -0.485 -5.02 ∆Ln(R) -0.396 -4.15 ∆Ln(W_self) 0.345 5.178 ∆Ln(Y/P) -1.17 -2.09 R-squared 0.781 Adjusted R-squared 0.726 S.E. equation 0.075 AIC -2.12 SC -1.93 P-value indicates the probability of obtaining a test statistic whose absolute value is greater than or equal to that of the sample statistics if the null hypothesis is true. Thus, a low p-value leads to the rejection of the null hypothesis.

30
Table D3: Estimation results (equation 3 and 3a) Dependent Variable: d(Ln(C/M2) Sample: 1988-2004
Variable Coefficient t-ratio P-value Equation (3a) Ln(T-ind (t-1)) 0.624 4.095 0.003 Ln(U_no (t-1)) 0.157 1.420 0.190 Ln(C/M2(t-1)) -0.583 -4.298 0.002 ∆Ln(R) -0.329 -3.158 0.012 ∆Ln(W_self) 0.303 4.770 0.001 ∆Ln(T-ind) 0.346 1.230 0.252 Constant -1.513 -1.266 0.237
Misspecification and Diagnostic Testing R-squared 0.847 Adjusted R-squared 0.744 LM (Arch) test 0.463 0.49 Breusch-Godfrey LM test 0.962 0.68 Jacque-Bera normality test 0.972 0.615 Ramsey(Reset) LM test 0.066 0.797 Average long run tax rate 1.060 ECM Representation Equation (3) Ln(T-ind (t-1)) -1.076 -5.495 Ln(U_no (t-1)) -0.211 -1.3 Ln(C/M2(t-1)) 1 Constant -2.06 1.18 Speed of adjustment -0.585 -5.73 ∆Ln(R) -0.328 -4.11 ∆Ln(W_self) 0.3 5.54 ∆Ln(T-ind) 0.343 1.55 R-squared 0.847 Adjusted R-squared 0.806 S.E. equation 0.06 AIC -2.468 SC -2.275 P-value indicates the probability of obtaining a test statistic whose absolute value is greater than or equal to that of the sample statistics if the null hypothesis is true. Thus, a low p-value leads to the rejection of the null hypothesis.

31
References Blades, Derek (1982). “The hidden economy and the National Accounts,” OECD (Occasional
Studies), Paris, pp. 28-44. Cagan, Phillip (1958). “The demand for currency relative to the total money supply,” Journal
of Political Economy, 66:3, pp. 302-328. Central Bureau of Statistics (March 2005), Modus. Central Bureau of Statistics (2003). “Statistical Yearbook Netherlands Antilles.” Cross, John C. (1998). “Encyclopedia of Political Economy, the Informal Sector,” London
& New York. Faal, E. (2003). “Currency demand, the underground economy, a tax evasion: The case of
Guyana,” IMF Working Papers, WP/03/7. Feige, E. (1986c). “A re-examination of the ‘underground economy” in the United States: A
Comment on Tanzi”, Staff Papers, International Monetary Fund 33(4): pp. 768-81. Feige, E. (1989) (ed.). “The underground economies: Tax evasion and information
distortion,” Cambridge, New York, Melbourne; Cambridge University Press. Feige, E. (1997). “Revised estimates of the underground economy: Implications of US
currency held abroad”. In Lippert and Walker (eds.). The Underground Economy, pp. 151-208. Giles, David, E.A. (1999a). “Measuring the hidden economy: Implications for econometric
modeling,” The Economic Journal, 109/456, pp. 370-380. Giles, David, Lindsay Tedds, and Gugsa Werkneh (1999). “The Canadian underground and
measured economies,” Working paper, Department of Economics, University of Victoria, Canada.
Grosse, Robert (1994). “Jamaica’s foreign exchange black Market,” The Journal of Development
Studies, 31; 1, pp. 17- 43.
Gupta, Manash Ranjan (1997). “Informal sector and informal capital market in a small open less-developed economy,” Journal of Development Economics, 52 (1997), pp. 409-428.
Gutmann, Pierre M. (1977). “The subterranean economy,” Financial Analysts Journal, 34:1, pp.
24-27.
Handbook for measurement of the non-observed economy, second draft (04/07/01) Johnson, Simon, Daniel Kaufmann, and Pablo Zoido-Lobatón (1998a). “Regulatory
discretion and the unofficial economy,” The American Economic Review, 88:2, pp. 387-392.

32
Johnson, Simon, Daniel Kaufmann, and Pablo Zoido-Lobatón (1998b). “Corruption, public finances and the unofficial economy.” Washington, D.C.: The World Bank, discussion paper.
Leonard, Madeleine (1998). “Invisible work, invisible workers: The informal economy in
Europe and the United States, Women and the informal economy,” New York, St. Martin’s Press.
Lütkepol, Helmut (1993). “Introduction to multiple time series analysis,” Berlin, Springer-
Verlag, 2nd edition. Maurin, Alain, S. Sookram, and P.K. Watson (2003). “Problems and Issues in Measuring the
Size of the Hidden Economy in the Caribbean,” Published on www.ccmsuwi.org/ConferencesandSeminars/MonetaryStudiesConferences/2003.html.
Mayers, Stuart, Darrin Downes, and Kevin Greenidge (2002). “Estimating the size of the
hidden economy in Barbados,” Working Papers - Bridgetown : Central Bank of Barbados, 2003. pp. 31 – 44.
National Employment Report Netherlands Antilles. Ministery of Labor and Economic
Affairs, Central Bureau of Statistics, Sociaal Kenniscentrum. Curaçao, September 2006. http://www.diraz.an/rapporten/Nat%20empl%20rep.pdf.
OECD Investment Policy Reviews: Caribbean Rim-Netherlands Antilles, July 22, 2005.
http://www.oecd.org/searchResult/0,2665,en_2649_201185_1_1_1_1_1,00.html. Porter, Richard D. and Gretchen C. Weinbach (1999). “Currency ratios and United States
underground economic activity,” Economic Letters 63; pp. 355 - 361. Quirk, Peter J. (1996). “Macroeconomic implications of money laundering,” IMF working
paper, wp/96/66. Report Introductie Plaating Bevordelingsinstrument ‘Rumbo pa trabou’ Commissie
Introductie Plaating Bevorderingsinstrument, Juni 2005, Dienst Economische Zaken. Schneider, Friedrich and Dominik Enste (February 2000). “Shadow economies around the
world: Size, Causes, and Consequences,” IMF working paper, wp/00/26. Schneider, Friedrich and Dominik Enste (2002). The Shadow Economy. Cambridge: Cambridge
University. Schneider, Friedrich and Robert Klinglmair (March 2004). “Shadow economies around the
world: What do we know?” The Institute for the Study of Labor (IZA); Bonn, Germany. Tanzi, Vito (1980). “The underground economy in the United States: Estimates and
implications,” Banca Nazionale del Lavoro, 135:4, pp. 427-453.

33
Tanzi, Vito (1983). “The underground economy in the United States: Annual estimates 1930–80,” Staff Papers, International Monetary Fund (Washington), Vol. 30 (June 1983), pp. 283-305. Tanzi, Vito (1986). “The underground economy in the United States,” Reply to comments
by Feige, Thomas, and Zilberfarb, IMF Staff Papers, 33/4, pp. 799-811. Tanzi, Vito (1999). “Uses and abuses of estimates of the underground economy,” the
Economic Journal, 109, June f338-f347. Oxford, United Kingdom. The amounts and the effects of money laundering. Report for the Ministry of Finance, February
16, 2006. http://www.minfin.nl/binaries/minfin/assets/pdf/actueel/bijlage-nieuwsberichten/2006/02/06-011a.pdf