Shade tree diversity and aboveground carbon stocks in Theobroma ...
13
Dawoe et al. Carbon Balance Manage (2016) 11:17 DOI 10.1186/s13021-016-0061-x RESEARCH Shade tree diversity and aboveground carbon stocks in Theobroma cacao agroforestry systems: implications for REDD+ implementation in a West African cacao landscape Evans Dawoe 1* , Winston Asante 1,2 , Emmanuel Acheampong 1 and Paul Bosu 3 Abstract Background: The promotion of cacao agroforestry is one of the ways of diversifying farmer income and creat- ing incentives through their inclusion in REDD+ interventions. We estimated the aboveground carbon stocks in cacao and shade trees, determined the floristic diversity of shade trees and explored the possibility of implementing REDD+ interventions in cacao landscapes. Using replicated multi-site transect approach, data were collected from nine 1-ha plots established on 5 km long transects in ten cacao growing districts in Ghana West Africa. Biomass of cacao and shade trees was determined using allometric equations. Results: One thousand four hundred and one (1401) shade trees comprising 109 species from 33 families were recorded. Total number of species ranged from 34 to 49. Newbouldia laevis (Bignoniacea) was the most frequently occurring specie and constituted 43.2 % of all shade trees. The most predominant families were Sterculiaceae and Moraceae (10 species each), followed by Meliaceae and Mimosaceae (8 species each) and Caesalpiniacaea (6 spe- cies). Shannon diversity indices (H’, H max and J’) and species richness were low compared to other similar studies. Shade tree densities ranged from 16.2 ± 3.0 to 22.8 ± 1.7 stems ha −1 and differed significantly between sites. Carbon stocks of shade trees differed between sites but were similar in cacao trees. The average C stock in cacao trees was 7.45 ± 0.41 Mg C ha −1 compared with 8.32 ± 1.15 Mg C ha −1 in the shade trees. Conclusions: Cacao landscapes in Ghana have the potential of contributing to forest carbon stocks enhancement by increasing the stocking density of shade trees to recommended levels. Keywords: Shade trees, Theobroma cacao, Species richness, Diversity indices, Carbon stocks, REDD+ © 2016 The Author(s). This article is distributed under the terms of the Creative Commons Attribution 4.0 International License (http://creativecommons.org/licenses/by/4.0/), which permits unrestricted use, distribution, and reproduction in any medium, provided you give appropriate credit to the original author(s) and the source, provide a link to the Creative Commons license, and indicate if changes were made. Background e cacao sector in Ghana plays a significant role in the fight against poverty and the development of the econ- omy of Ghana as a whole. Globally, Ghana is the world’s third largest producer (after Cote d’Ivoire and Indone- sia) and has maintained its position as the second largest exporter of cacao beans after Cote d’Ivoire for the period 2005–2011 [1]. Cacao is Ghana’s leading cash crop and the highest export crop earner accounting for 8.2 % of the country’s gross domestic product (GDP) and 30 percent of total export earnings in 2010 [2]. In terms of employ- ment, the livelihood of about six million people (25–30 % of the population) depends on the cacao sector [3]. Ghana’s cacao production is characterized by small- scale farming with an average productive cacao area per household of approximately 2–3 ha [1, 4]. Approximately 800,000 families grow cacao on 1.6 million hectares of Open Access *Correspondence: [email protected]; [email protected] 1 Faculty of Renewable Natural Resources (FRNR), Kwame Nkrumah University of Science and Technology (KNUST), Kumasi, Ghana Full list of author information is available at the end of the article
Transcript of Shade tree diversity and aboveground carbon stocks in Theobroma ...

Dawoe et al. Carbon Balance Manage (2016) 11:17 DOI 10.1186/s13021-016-0061-x
RESEARCH
Shade tree diversity and aboveground carbon stocks in Theobroma cacao agroforestry systems: implications for REDD+ implementation in a West African cacao landscapeEvans Dawoe1*, Winston Asante1,2, Emmanuel Acheampong1 and Paul Bosu3
Abstract
Background: The promotion of cacao agroforestry is one of the ways of diversifying farmer income and creat-ing incentives through their inclusion in REDD+ interventions. We estimated the aboveground carbon stocks in cacao and shade trees, determined the floristic diversity of shade trees and explored the possibility of implementing REDD+ interventions in cacao landscapes. Using replicated multi-site transect approach, data were collected from nine 1-ha plots established on 5 km long transects in ten cacao growing districts in Ghana West Africa. Biomass of cacao and shade trees was determined using allometric equations.
Results: One thousand four hundred and one (1401) shade trees comprising 109 species from 33 families were recorded. Total number of species ranged from 34 to 49. Newbouldia laevis (Bignoniacea) was the most frequently occurring specie and constituted 43.2 % of all shade trees. The most predominant families were Sterculiaceae and Moraceae (10 species each), followed by Meliaceae and Mimosaceae (8 species each) and Caesalpiniacaea (6 spe-cies). Shannon diversity indices (H’, Hmax and J’) and species richness were low compared to other similar studies. Shade tree densities ranged from 16.2 ± 3.0 to 22.8 ± 1.7 stems ha−1 and differed significantly between sites. Carbon stocks of shade trees differed between sites but were similar in cacao trees. The average C stock in cacao trees was 7.45 ± 0.41 Mg C ha−1 compared with 8.32 ± 1.15 Mg C ha−1 in the shade trees.
Conclusions: Cacao landscapes in Ghana have the potential of contributing to forest carbon stocks enhancement by increasing the stocking density of shade trees to recommended levels.
Keywords: Shade trees, Theobroma cacao, Species richness, Diversity indices, Carbon stocks, REDD+
© 2016 The Author(s). This article is distributed under the terms of the Creative Commons Attribution 4.0 International License (http://creativecommons.org/licenses/by/4.0/), which permits unrestricted use, distribution, and reproduction in any medium, provided you give appropriate credit to the original author(s) and the source, provide a link to the Creative Commons license, and indicate if changes were made.
BackgroundThe cacao sector in Ghana plays a significant role in the fight against poverty and the development of the econ-omy of Ghana as a whole. Globally, Ghana is the world’s third largest producer (after Cote d’Ivoire and Indone-sia) and has maintained its position as the second largest
exporter of cacao beans after Cote d’Ivoire for the period 2005–2011 [1]. Cacao is Ghana’s leading cash crop and the highest export crop earner accounting for 8.2 % of the country’s gross domestic product (GDP) and 30 percent of total export earnings in 2010 [2]. In terms of employ-ment, the livelihood of about six million people (25–30 % of the population) depends on the cacao sector [3].
Ghana’s cacao production is characterized by small-scale farming with an average productive cacao area per household of approximately 2–3 ha [1, 4]. Approximately 800,000 families grow cacao on 1.6 million hectares of
Open Access
*Correspondence: [email protected]; [email protected] 1 Faculty of Renewable Natural Resources (FRNR), Kwame Nkrumah University of Science and Technology (KNUST), Kumasi, GhanaFull list of author information is available at the end of the article

Page 2 of 13Dawoe et al. Carbon Balance Manage (2016) 11:17
land with the Western region having the highest produc-tion value (over 50 % of total production), followed by the Ashanti region (accounting for about 16 % of total pro-duction). The Eastern and Brong-Ahafo regions together account for about 19 % of total production [1].
There is a general belief that cultivation of cacao, as tra-ditionally practiced in Africa, has the potential to restore carbon stocks to levels comparable to that in the native forest which they replaced. Cacao is an understory spe-cies and so cultivation is traditionally done under tree canopy. It is therefore intuitive that carbon stocks in cacao farms with dense tree canopy cover will be much similar to that in the original native forest than in farms with lower or no canopy shade. Indeed, several stud-ies have revealed that a larger proportion of the carbon stocks in most cacao agroforests are contributed by the shade trees [5–8]. The question is whether carbon stocks in these emerging cacao plantations will be within rea-sonable proportion of the original native forests they have replaced. Understanding carbon accumulation dynamics in cacao agro-ecosystems is important to the long-term management of cacao farms that inure to climate change mitigation and the associated socioeconomic effects.
Although multi-strata shaded-cacao systems still occur in Ghana, there has been an increasing move towards intensification of cacao management with shade tree removal and monoculture practices [9, 10]. In the West-ern Region of Ghana, the majority of cacao farms are now predominantly being managed with low shade or no shade [11, 12]. The need to introduce approaches that combine supporting local cacao livelihoods for pov-erty alleviation and reducing ecosystem degradation in cacao production systems in Ghana is imperative. This is expected to be achieved through actions that improve business development skills of farmers, increase cacao productivity, enhance natural resources management, conserve biodiversity, and reduce emissions associated with smallholder cacao farming systems. It is expected that through this initiative, smallholder cacao farmers in Ghana can qualify and earn additional income through the REDD+ (Reduced Emissions from Deforestation and Forest Degradation) mechanism and related incentive packages associated with carbon mitigation programmes. Thus, information relating to carbon stocks especially from shade trees, is vital to the design of any mitigation intervention. However, though some research efforts have focused on carbon stocks and tree diversity within cacao farms, most of these data sets show results of selected farms [13, 14], with no clear indication of landscape level play out. There is also no information on the potential role of the cacao systems at the landscape level in future climate change mitigation mechanisms based on the pre-vailing site level conditions in the cacao systems, though
these future mitigation mechanisms are being conceived at the landscape level for implementation.
The overall objective of this study was to quantify the baseline carbon stocks, tree diversity and shade tree crown cover variation associated with smallholder cacao agroforestry systems in the cacao landscape of Ghana. Specifically, we estimated the baseline aboveground carbon stocks in shade and cacao trees, explored the relationships between tree parameters and carbon stor-age and determined floristic diversity of shade trees. We hypothesized that cacao landscapes in Ghana have the potential of contributing positively to the country’s REDD+ efforts.
MethodsStudy areaThe study was conducted in the mid-western cacao growing areas of Ghana covering three of the five cacao-growing regions namely, Western, Ashanti, Brong-Ahafo and regions, located between longitude 01° 30′ and 30 5′ W and latitude 06° 0′ and 07° 0′ N (Fig. 1). The area lies within the dry and moist semi-deciduous forest zones, characterized by the wet semi-equatorial climatic condi-tions with a double maxima rainfall (April–July and Sep-tember–November) ranging between 1700 and 1850 mm per annum. The main dry season lasts from December to mid-March Average ambient temperatures are uni-formly high throughout the year and average 26.0 °C. The predominant vegetation in the study districts is the semi-deciduous forest type, which is characterized by predominantly Celtis-Triplochiton association as described by [15], with some of the trees in the upper and middle layers shedding their leaves in the dry season. The cacao agroforestry systems in the study districts (politi-cal/administrative area where the sites are located) are mostly mixed stands of cacao and with variable propor-tions of naturally generated upper canopy shade trees such as Terminalia superba Engl. & Diels, Triplochiton scleroxylon K. Schum., Alstonia boonei de Wild and Ceiba pentandra (L.) Gaertn. Fruit trees such as orange (Citrus sinensis L.) Osbeck, Avocado (Persea americana) and mango (Mangifera indica L.), for shade, food and other purposes may be planted. The soils of the study area are from weathered phyllites and dominated by ochrosols (to the north) and ochrosol-oxisol intergrade (Rhodic Fer-ralsol) to the south [16]. They are generally deep, mod-erately well drained and brashy with a silty-loam humus texture in the 0–15 cm soil layer, which gives it a high moisture retention capacity [17].
Land tenure arrangements in the study area can be classified into farmers who own their land, family lands, rented lands and lands under sharecropping arrange-ments. Nearly half of all cacao farmers in the area own

Page 3 of 13Dawoe et al. Carbon Balance Manage (2016) 11:17
the cacao farmlands themselves with about 22 % being family lands and 33 % managed under sharecropping arrangements [18].
Study site selectionSelection of study sites (the location/situate of transects) was based on the biophysical and socioeconomic diver-sity of the landscape. Ten (10) cacao growing districts were selected, three each in the Ashanti and Brong-Ahafo Regions, and four in the Western Region after an initial reconnaissance of the study area. In each district, one of several communities (nearest town/village within whose immediate environs the transects were laid) with contiguous cacao plantations was randomly selected as a focal or reference community (Fig. 1).
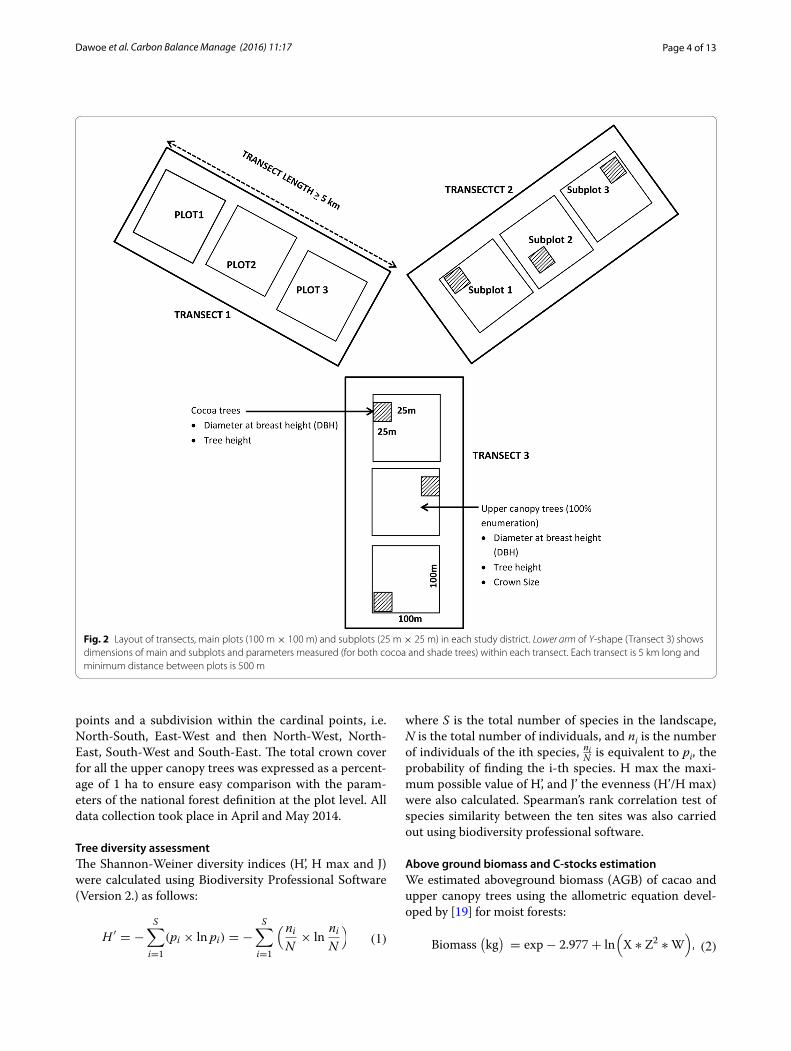
Plot installation and data collectionIn each study community, three transects (laid out in a Y-shaped fashion and roughly aligned at 120° from each other) were established in a contiguous cacao landscape (Fig. 2). Each transect was at least 5 km long. Three plots, each measuring 100 m × 100 m, were established along
each transect at intervals of at least 500 m. There were nine plots per site giving a total of ninety plots across all sites. In cases where the recording plot fell within a shade land use, the transect continued till the next cacao establishment. Within each 100 m × 100 m plot, subplots measuring 25 m × 25 m were demarcated. The subplots were placed at alternate points along the main transect line (Fig. 2). Plot level assessments included measure-ments of cacao (on 25 m × 25 m subplots) and shade canopy trees (100 m × 100 m main plots). All shade trees with diameter at breast height (DBH = 1.3 m) of 5 cm and above were identified (scientific and local names) by an experienced botanist. Subsequently tree botani-cal composition, population and spatial structure in the study districts were compared. Tree DBH was meas-ured by calipers while heights were measured using a laser hypsometer (Nikon Laser Hypsometer). To obtain an estimate of the shade provided by the shade trees to cacao and their contribution to canopy cover, crown area of each shade tree within the 1 ha sample plot of cacao farms was estimated by measuring the diameter of the crown in eight different directions, following the cardinal
Fig. 1 Locations of study communities and their administrative regions
Page 4 of 13Dawoe et al. Carbon Balance Manage (2016) 11:17
points and a subdivision within the cardinal points, i.e. North-South, East-West and then North-West, North-East, South-West and South-East. The total crown cover for all the upper canopy trees was expressed as a percent-age of 1 ha to ensure easy comparison with the param-eters of the national forest definition at the plot level. All data collection took place in April and May 2014.
Tree diversity assessmentThe Shannon-Weiner diversity indices (H’, H max and J) were calculated using Biodiversity Professional Software (Version 2.) as follows:
(1)H ′= −
S∑
i=1
(pi × ln pi) = −
S∑
i=1
(ni
N× ln
ni
N
)
where S is the total number of species in the landscape, N is the total number of individuals, and ni is the number of individuals of the ith species, ni
N is equivalent to pi, the
probability of finding the i-th species. H max the maxi-mum possible value of H’, and J’ the evenness (H’/H max) were also calculated. Spearman’s rank correlation test of species similarity between the ten sites was also carried out using biodiversity professional software.
Above ground biomass and C‑stocks estimationWe estimated aboveground biomass (AGB) of cacao and upper canopy trees using the allometric equation devel-oped by [19] for moist forests:
(2)Biomass(
kg)
= exp− 2.977+ ln(
X ∗ Z2∗W
)
,
Fig. 2 Layout of transects, main plots (100 m × 100 m) and subplots (25 m × 25 m) in each study district. Lower arm of Y-shape (Transect 3) shows dimensions of main and subplots and parameters measured (for both cocoa and shade trees) within each transect. Each transect is 5 km long and minimum distance between plots is 500 m

Page 5 of 13Dawoe et al. Carbon Balance Manage (2016) 11:17
where X = species specific density; Z = diameter at breast height (DBH); and W = height. Species-specific wood densities were obtained from the World Agroforestry Centre’s Wood Density Database [20]. If a species was not listed, we computed the average wood density of the plot and assigned it to the unknown species. To calculate car-bon stocks in shade or cacao trees, we applied the general conversion factor of 0.5 to ABG tree biomass [21].
Statistical analysisPercentage crown cover and carbon stocks were com-pared using the pooled data at the transect level as repli-cates for each site. For each variable (crown cover, cacao carbon, shade tree carbon and stem diameter) normal distribution was tested using the Shapiro-Wilks W-test for homogeneity of variances. Variables that conformed to normal distribution were analyzed using one-way anal-ysis of variance (ANOVA) while those that did not meet the assumptions for an ANOVA even when transformed were analyzed using Kruskal–Wallis parametric ANOVA on the mean ranks using the software package Statistix 8.0 for windows [22]. Separation of means was done at 5 % probability level using Tukey’s HSD test. Regression and correlations analyses were also employed as tools for statistical tests and to establish trends and relationships between crown cover and carbon stocks, and shade tree diameter and carbon stocks and Shannon-Weiner Diver-sity Indices H’ H max and J.
ResultsAbundance and composition of shade species and families in the cacao landscapeA total of 1401 individual trees (shade) were recorded across all the 10 study sites (Table 1). These comprised
109 different species from 33 families on 90 ha (average 15 trees per hectare) surveyed. Out of the 109 species, the total number of species encountered in the districts ranged from 34 at Sewfi Wiawso to 49 at Goaso. New-bouldia laevis (family Bignoniacea) was the most fre-quently occurring species and constituted 43.2 % of all shade trees in the districts but was most dominant in four districts. The most predominant families across the land-scape were Sterculiaceae and Moraceae (10 species each), followed by Meliaceae and Mimosaceae (eight species each) and Caesalpiniacaea (six species). Anacardiaceae, Euphorbiaceae and Palpilioniaceae were each repre-sented by five species. Ten families were represented by two or three species. Table 2 shows the most dominant shade tree species in each district.
The average stand density of the shade trees varied and ranged from 9.33 ± 1.22 stems ha−1 for Akontom-bra to 22.8 ± 1.71 stems ha−1 for Offinso with an aver-age of 15.6 ± 1.34 stems ha−1 across districts. The total number of species was highest in Goaso, where the Shannon-Weiner indices (Shannon H’ = 1.52, Shannon H max = 1.69 and Shannon J’ = 0.90) were higher than all the other locations. Wiawso had the lowest indices (Shannon H’ = 0.99, and Shannon J’ = 0.65). The Spear-man’s rank correlation test of species similarity between the ten sites are shown in Table 3. The highest similarity index was 0.7 and the lowest 0.4.
Relative abundance of timber and non‑timber 1 species in the cacao landscapeAll shade trees identified in the plots were grouped into timber and non-timber species. Generally, the relative abundance of non-timber species in all the districts was higher than timber species, except Asempaneye where
Table 1 Overview of shade tree species diversity and selected dendrometric parameters in the different study districts
a Total number of stems enumerated on a total plot size of 9 ha. These comprise all timber and non-timber tree speciesb Number of different individual tree species recorded on a total plot size of 9 ha
Tree abundancea
Species richnessb
Shade tree stem density (ha−1)
Mean tree height (m)
Mean stem diameter (cm)
Shannon H’ Shannon H max
Shannon J’
Adabokrom 97 35 10.8 ± 1.27 15.1 ± 0.74 51.6 ± 3.67 1.42 1.54 0.92
Akontombra 84 27 9.33 ± 1.22 11.9 ± 1.05 31.2 ± 4.71 1.22 1.43 0.85
Asempaneye 128 45 14.2 ± 1.11 19.1 ± 1.41 47.7 ± 3.91 1.51 1.65 0.92
Asumura 147 37 16.3 ± 2.58 13.8 ± 1.19 35.0 ± 3.97 1.04 1.57 0.66
Goaso 146 49 16.2 ± 3.00 15.3 ± 1.24 43.0 ± 3.55 1.52 1.69 0.90
New Edubiase 184 43 20.6 ± 3.25 18.2 ± 0.99 44.9 ± 2.85 1.34 1.63 0.82
Nkawie 136 40 15.1 ± 2.47 12.8 ± 0.64 36.6 ± 3.31 1.40 1.60 0.88
Offinso 204 46 22.8 ± 1.71 13.5 ± 0.82 40.2 ± 3.68 1.29 1.66 0.77
Sankore 108 35 12.0 ± 2.71 18.2 ± 1.58 49.6 ± 3.64 1.39 1.54 0.90
Wiawso 165 34 18.3 ± 3.57 13.7 ± 1.42 33.1 ± 3.72 0.99 1.53 0.65
Page 6 of 13Dawoe et al. Carbon Balance Manage (2016) 11:17
the abundance of timber and non-timber species were equal (Table 4). In addition to being important as shade trees for cacao, the most important uses of shade trees in cacao systems were for their productive values e.g. fruit, timber, firewood, fodder and medicines (Additional file 1: Appendix 1). Apart from the fruit trees, (Persea ameri-cana, citrus spp. and the oil palm Elieas guineensis) which were planted by farmers, most of the shade trees were selectively left on farmlands during land preparation and nurtured by farmers during cacao establishment. A list of current and potential uses of all identified non-timber trees is given in Additional file 1: Appendix 1.
Carbon stocks in cacao and shade trees in the cacao landscapeCarbon stocks in shade trees ranged from 2.91 ± 0.95 Mg C ha−1 at Akontombra to 15.6 ± 2.89 Mg C ha−1 at New Edubiase and differed significantly (F = 4.51; p = 0.0001) between districts (Table 5). Carbon stocks in cacao trees on the other hand were similar (F = 1.73; p = 0.095) and
averaged 7.45 ± 0.41 Mg C ha−1 (range 5.84–10.2 Mg C ha−1). Total carbon (shade + cacao trees) significantly differed (F = 3.82; p = 0.0005) between sites with New Edubiase having the highest (23.4 ± 3.23 Mg C ha−1) and Sefwi Wiawso the lowest (10.9 ± 1.56 Mg C ha−1), repre-senting 85.9 and 40.0 Mg CO2-eq. ha−1 respectively. Car-bon distribution between cacao and shade trees averaged of 48 and 52 % respectively and mean stocks across all study districts stood at 15.5 ± 1.19 Mg C ha−1.
Relationships between crown cover, diversity indices and carbon stocksWe analyzed the relationships and determined correla-tions between various shade tree parameters, diversity indices and total aboveground tree carbon to understand how these parameters affected carbon accumulation in shaded-cacao systems. Significant linear relationships were found to exist between crown cover % and total car-bon C stocks (R2 = 0.7785; p = 0.0072), and shade tree diameter and total carbon (R2 = 0.3574, p = 0.04912)
Table 2 Dominant shade tree species recorded in each study district (percentages are proportions of total individuals recorded in each district)
a Total number of stems enumerated on a total plot size of 9 ha
Community Most dominant species Tree abundancea
Proportion of total individual shade trees (%)
Adabokrom Ficus exasperata 97 10
Akontombra Persea americana 84 16.7
Asempaneye Triplochiton scleroxylon 128 10.2
Asumura Newbouldia laevis 147 47.6
Goaso Milicia excelsa 146 9.5
New Edubiase Newbouldia laevis 185 24.3
Nkawie Morinda lucida 136 13.2
Offinso Citrus sinensis 205 24.0
Sankore Newbouldia laevis 108 11.1
Wiawso Newbouldia laevis 165 47.3
Table 3 The Spearman’s rank correlation test of species similarity between study districts in Ghana
Communities Adabokrom Akontombra Asempaneye Asumura Goaso New Edubiase Nkawie Offinso Sankore Wiawso
Adabokrom 1 * * * * *
Akontombra 0.6 1 * * * * * * * *
Asempaneye 0.6 0.4 1 * * * * * * *
Asumura 0.6 0.6 0.5 1 * * * * * *
Goaso 0.7 0.5 0.5 0.7 1 * * * * *
New Edubiase 0.7 0.6 0.5 0.6 0.7 1 * * * *
Nkawie 0.6 0.5 0.5 0.6 0.6 0.6 1 * * *
Offinso 0.5 0.5 0.4 0.5 0.5 0.5 0.5 1 * *
Sankore 0.6 0.6 0.5 0.6 0.6 0.6 0.5 0.6 1 *
Wiawso 0.5 0.7 0.4 0.5 0.5 0.5 0.5 0.5 0.5 1

Page 7 of 13Dawoe et al. Carbon Balance Manage (2016) 11:17
(Fig. 2). The relationships between total carbon and Shannon-Weiner Diversity Indices H’, H max and J’ were not significant, p values being 0.2224, 0.1486 and 0.3539 respectively (Fig. 3). Apart from the equation relat-ing crown cover % and total carbon stocks which had a moderately high predictive ability (R2 = 0.7785), all the other regressions equations explained up to a maximum of 35 % of the variations in the relationships. Crown cover (%) was highly significantly (p < 0.01) correlated to shade tree C and total C (Table 6). Whereas Shannon H max correlated significantly (p < 0.05) positively with shade tree C and number of shade trees, it was non-sig-nificantly correlated with total C. Number of shade trees correlated positively but non-significantly (p > 0.05) with total C shade tree C and Crown %.
Carbon stocks distribution and associated shade tree parametersShade tree characteristics (mean number of stems ha−1, average height (m), average stem diameter (cm) and associated total C stocks (Mg C ha−1) grouped according to districts with similar crown cover (%) are given in Table 7. Three groups of districts are discern-ible. Group 1 districts having crown cover <8 %, Group 2 districts 8.1–14.9 % and Group 3 districts have crown cover >15 %. Group 3 districts, i.e. New Edubi-ase and Asempanaye with the highest number of stems ha−1 and stem diameter recorded the highest mean carbon stocks of 21.0 ± 2.45 Mg C ha−1 because the biggest trees were found on these landscapes. Group 1 districts with fewer and smaller trees recorded the lowest total carbon storage of 12.1 ± 0.52 Mg C ha−1. Progressively also, total tree carbon increased with increasing crown cover. Group 3 districts with crown cover equal to or more than the 15 % (the defined national threshold for forests in Ghana) compared to the other sites translated to high total tree carbon stocks.
DiscussionsAbundance and composition of upper canopy tree species and families in the cacao landscapeSeveral workers (e.g., [24–26]) have emphasized that agro-biodiversity is an important feature of agro-ecological sys-tems in terms of climate change adaptation. Shaded-cacao agroforestry may be considered promising in this context. Shade tree diversity in cacao farms offers farmers an array of agronomic, economic, cultural, and ecological benefits [9]. A diversified farm also enables farmers to exploit the different components as well as their interactions in the
Table 4 Relative abundance of timber and non-timber species within smallholder cacao systems in ten cocoa growing districts in the high forest zone, Ghana
a Timber + Non-timber species = Tree abundance, i.e. the number of stems enumerated on a total plot size of 9 ha
District Timber speciesa
Relative abundance (%)
Non timber speciesa
Relative abundance (%)
Adabokrom 45 45.0 55 55.0
Akontombra 19 22.6 65 77.4
Asempanaye 64 50.0 64 50.0
Asumura 39 26.6 108 73.5
Goaso 67 45.9 79 54.1
New Edubiase 85 45.9 100 54.1
Nkawie 48 35.3 88 64.7
Offinso 44 21.6 160 78.4
Sankore 31 28.7 77 71.3
Sefwi Wiawso 44 26.7 121 73.3
Table 5 Mean values ± SEM of shade tree carbon, cacao tree carbon, total carbon and their CO2 equivalents in ten cacao growing districts in the Ashanti, Brong-Ahafo and Western regions of Ghana (numbers in parenthesis are standard errors of the means)
Figures in the same column followed by similar alphabets do not differ significantly (p ≤ 0.05) based on the Kruskal–Wallis parametric ANOVA applied to mean ranks. Total carbon stock was converted to tons of CO2 equivalent by multiplying by 44/12 or 3.67 [23]
District Shade trees C (Mg C ha−1)
Cacao tree C (Mg C ha−1)
Total C (Mg C ha−1)
CO2 equiv. of total C (Mg CO2‑eq. ha−1)
Sefwi Wiawso 5.05 ± 1.40ab 5.84 ± 0.91a 10.9 ± 1.56b 40.0
Asempanaye 11.8 ± 1.99a 6.77 ± 0.68a 18.5 ± 2.12ab 67.9
Akontombra 2.91 ± 0.95b 10.2 ± 1.31a 13.2 ± 2.07ab 48.4
Adabokrom 7.70 ± 1.29ab 8.02 ± 0.87a 15.7 ± 0.87ab 57.6
Sankore 8.60 ± 1.92ab 7.00 ± 0.87a 15.6 ± 2.40ab 57.2
Goaso 9.17 ± 2.33ab 7.79 ± 0.74a 15.4 ± 2.58ab 56.5
Asumura 5.04 ± 1.35ab 7.58 ± 0.47a 12.6 ± 1.68ab 46.2
New Edubiase 15.6 ± 2.89a 6.28 ± 0.82a 23.4 ± 3.23a 85.9
Offinso 9.29 ± 1.41a 8.65 ± 0.70a 17.9 ± 1.45ab 65.7
Nkawie 8.02 ± 0.65ab 6.40 ± 0.61a 11.5 ± 1.19b 42.2

Page 8 of 13Dawoe et al. Carbon Balance Manage (2016) 11:17
system to meet subsistence needs, maximize incomes, and reduce risks against fluctuations in world market prices of cacao beans [27–29]. The 109 species (DBH ≥ 15 cm) with Shannon-Weiner diversity index H’ ranging from 0.99 to 1.54 recorded from 90 ha of shaded-cacao systems in this study are relatively lower compared to values recorded in similar systems elsewhere. For instance, [30] found 293 tree species (DBH ≥10 cm) with Shannon-Weiner diversity
indices ranging from 3.31 to 4.22 on 15 ha of five traditional cacao growing (cabruca) farms in Southern Bahia, Brazil, while in the dense and complex agroforestry systems of Southeast Cameroon. [31] sampled trees and pseudo-trees (e.g., banana) with DBH >2.5 cm and found 206 species in 60 cacao farms, with Shannon diversity indices ranging between 3.1 and 4.2 in each of the agroforestry systems studied. At two sites in the Atwima District of the Ashanti
Fig. 3 Relationships between selected shade tree dendrometric and diversity parameters and total aboveground (shade + cacao trees) carbon

Page 9 of 13Dawoe et al. Carbon Balance Manage (2016) 11:17
Region of Ghana, [13] recorded a Shannon index of 4.69 for matured shaded-cacao farms. [13] study area falls within the same district as the study site for this study, which recorded a significantly lower tree diversity index of 0.88. It is likely that there has been an increased removal of shade trees in the district within the intervening 3-year period prior to this study as a result illegal chainsaw operations and the continuous giving out of these off-reserve areas to timber concessionaires [18]. Our species number is how-ever comparable to that of [32] who recorded 105 species in cabrucas of the Espirito Santo state, Brazil, by sampling trees with DBH >10 cm in 4.8 ha of 20 farms studied.
Relative abundance of timber and non‑timber species in the cacao landscapeMost of the sites recorded wide disparities in the abun-dance of timber and non-timber tree species, a strong
indication that farmers are shifting the composition of species in cacao agroforestry systems in favor of non-timber species. This disparity could also be a manifesta-tion of logging impact or exploitation of timber species within the cacao landscape. It is obvious from the data that there is a shift in the species composition of the off-reserve landscape in the high forest zone, with a general decline in species diversity. The dominance of fruit trees (citrus and avocadoes) and Newbouldia laevis strongly indicates a deliberate transformation of the landscape by farmers from the naturally occurring pioneer species such as Terminalia spp. and other timber species that have been traditionally grown in tandem with cacao, and provide timber benefits, to non-timber species such as fruits, Gliricidia sepium and N. laevis. A prime factor that drove the transformation of the species composi-tion of the landscape was logging [18]. However, general
Table 6 Pearson correlation coefficients among diversity indices, number of shade trees and C content of trees in ten cacao growing districts in Ghana
ns not significant
Asterisks denote statistical significance of correlations: * p < 0.05; ** p < 0.01
Crown % Shannon H’ Shannon H max Shannon J Shade trees C Total C
Shannon H’ 0.7107* –
Shannon H max 0.6788* 0.4994 ns –
Shannon J 0.5269 ns 0.9333** 0.1556 ns –
Shade trees C 0.8952** 0.5791 ns 0.7078* 0.3692 ns –
Total C 0.8823** 0.4716 ns 0.4920 ns 0.3286 ns 0.8807**
No. of shade trees 0.2988 ns −0.2202 ns 0.6467* −0.5190 ns 0.4560 ns 0.3595 ns
Table 7 Shade tree dendrometric parameters and associated carbon stocks in the study districts with similar crown cover
Group District Crown cover % Mean shade trees stem number (ha−1)
Mean shade tree height (m)
Mean stem diameter (cm)
Shade and cacao trees C‑stocks (Mg C ha−1)
1 Asumura 5.80 16.3 13.9 35.0 12.6
Sefwi Wiawso 5.95 18.3 13.7 33.1 10.9
Akontombra 6.31 9.3 11.9 31.2 13.2
Nkawie 7.97 15.1 12.8 36.6 11.5
Mean ± SE 6.51 ± 0.49 14.7 ± 1.93 13.1 ± 0.46 34.0 ± 1.17 12.1 ± 0.52
Range 5.80–8.0 9.3–18.3 11.9–13.9 31.2–36.6 10.9–13.2
2 Adabokrom 10.3 10.8 15.1 51.6 15.7
Sankore 11.2 12.0 18.2 49.6 15.6
Goaso 11.6 16.2 15.3 43.0 15.4
Offinso 13.1 22.8 13.5 40.2 17.9
Mean ± SE 11.6 ± 0.58 15.4 ± 2.7 15.5 ± 0.98 46.1 ± 2.69 16.2 ± 0.587
Range 8.1–14.9 10.8–22.8 13.5–18.2 40.2–51.6 15.4–17.9
3 New Edubiase 15.0 20.6 18.2 44.9 18.5
Asempanaye 16.3 14.2 19.1 47.7 23.4
Mean ± SE 15.5 17.4 ± 3.20 18.7 ± 0.45 46.3 ± 1.40 21.0 ± 2.45
Range ≥15.0 14.2–20.6 18.2–19.1 44.9–47.7 18.5–23.5

Page 10 of 13Dawoe et al. Carbon Balance Manage (2016) 11:17
governance issues such as tree tenure and ownership and inconsistent understanding and weak implementation of forest policy and legal regime have also contributed to a strong negative perception about tree incorporation in the cacao systems.
Farmers consistently complained about the indis-criminate logging on their farms and continued award of concessions in the cacao landscape as well as the lack of proper compensation for cacao trees destroyed [18]. For a long time, the governance issues associated with off-reserve trees have bedeviled efforts at improving cacao agroforestry systems involving the incorporation of tim-ber trees that could have multiple benefits for farmers in Ghana. The minimal occurrence and low dominance of the indigenous timber species such as Terminalia spp., Melicia excelsa, etc. within the cacao landscape have seri-ous implications for the implementation of climate-smart cacao models and REDD+ strategies. Most of these mod-els are posited on indigenous timber species that pre-sent better opportunities to contribute to climate change mitigation projects in cacao systems and also serve as preferred species in terms of shade and moderation of climatic parameters for optimal cacao productivity. In order to reverse the current trend in terms of dominant species within the landscape, it is important to overcome the governance issues associated with off-reserve tim-ber trees exploitation at all levels, from the national to the community level. Once farmers’ confidence has been gained, then mechanisms can be rolled out to introduce tree diversification strategies. It is also possible that the dominance of fruit trees is an indication that farmers want to diversify the sources of income as was indicated by respondents at Offinso, who incorporated citrus and pear to ensure that they could generate revenue in the off season period of cacao harvesting.
Carbon stocks in cacao and shade treesAgroforestry ecosystems are generally known to stock higher carbon than other cropping systems thereby con-tributing to climate change mitigation [33–35]. Closed forests in the study area are generally reported to hold about 155 Mg C ha−1 with stocks in open forests ranging in the region between 85 and 96 Mg C ha−1, while agricul-tural lands including no-shade cocoa systems stock on the average 15 Mg C ha−1 [14, 36, 37]. Thus, the conversion of agricultural lands to cacao agroforests could be a man-agement strategy for storing large quantities of carbon. As the largest component of total biomass, shade trees are crucial to carbon stocks in the cacao cultivation systems. Our findings of higher stocks in some districts compared to others reflects emerging or existing trends in the man-agement of upper canopy trees and how this holds impli-cations for landscape level carbon build-up or loss.
Our results for total tree carbon stocks in cocoa agro-forests are similar to and fall within the range reported by [14] in the high forest cacao zone in the Western Region in Ghana, which is also similar to that of [38] in Central Sulawesi and [39] in Central Cameroon. [14] recorded aboveground carbon stocks of 16.8 and 15.9 Mg C ha−1 respectively in 15 and 25-year-old shaded-cacao stands. Results of this study however fall in the lower range compared to studies by [40] in Bolivia, [7, 11, 39, 41] all in Cameroon, [36] in Ghana and [42] in Sulawesi, Indonesia. In these studies, stocks of tree carbon ranged from 34.4 to 135.5 Mg C ha−1. Explana-tions for the lower carbon stocks found in this study include the relatively young age of most of the plots (40.7 % of all farms were 10 years or below) as well as the non-planting and removal of shade trees due to the perception that, shade trees are a major cause of pests, diseases and low yields. It also needs to be pointed out that, aboveground carbon depends on a number of fac-tors including the canopy species, tree density, environ-ment and the approach used in estimating total carbon. [7] have pointed out that using equations like [43] which do not incorporate wood density would overestimate the biomass and thus carbon stocks of a low wood density species such as cacao. Using allometric equations that integrate wood densities of separate species, as done in the current study, or developing location and species-specific allometric equations is likely to lead to a more accurate assessment of biomass and thus carbon stocks. This study used the equation developed by [19]. Hence, comparison of the carbon stocks figures generated in this study should also be placed in the context of the allometric equations used in the estimation of biomass. But most obviously, the fact that this study adopted a transect approach, also means that, all variations of cacao maturity stages and establishment were encoun-tered. Given that biomass build-up directly relates to age, further comparisons of our results, should be placed within the context of random transect sampling.
Relationships between shade tree dendrometric parameters and carbon stocksAssociated shade tree parameters (crown cover and shade tree stem diameter) significantly influenced above-ground C stocks in the cacao agroforestry systems. The predictive ability of the equation relating crown cover and c-stocks is moderately high while that between shade tree stem diameter and shade tree carbon and total tree carbon were generally low, the equations nevertheless demonstrate the relationship between the size of the shade tree and the amount of carbon stored. Progres-sively, total tree carbon increased with increasing crown cover. This is to be expected as increasing tree size (tree
Page 11 of 13Dawoe et al. Carbon Balance Manage (2016) 11:17
height and diameter) is generally associated with increas-ing crown cover. The bigger the stem diameter, the more the amount of carbon stored. It has been widely recog-nized that, shade trees in cacao systems account for the differences in carbon stocks in cacao systems. Though they are often assumed to negatively affect growth and yield of cacao plants through competitive water [44] and resource use, shade trees play a significant role on C sequestration. Empirical studies have also shown the positive effects of plant species-specific, complementary resource use in agroforestry systems [45]. Several authors (e.g. [6, 44]) have emphasized that the main drivers of C storage in cacao systems are shade trees, which usu-ally has the highest amount of carbon. Studies by [6, 7] for instance all recorded shade trees storing up to 65 % of total tree carbon in cacao systems studied in Nigeria and Cameroon respectively.
The near-even distribution of carbon between cacao (48 %) and shade trees (52 %) in this study is possibly a reflection of the extent to which shade trees have been and continue to be progressively removed from farms. This could be the result of the widely held perception by farmers in some districts that presence of shade trees on farms is a major cause of disease incidence and low yields. There are also governance issues particularly that which relates tenure over naturally growing economic trees in cacao and other cash crop plantations. Exist-ing tree tenure system where farmers have no owner-ship right over naturally growing economic trees in their cacao farms, has served as a disincentive for farmers to nurture and keep economic trees in cacao farms. When combined with a preference for full-sun cacao over shade production systems, as a result of relatively high yields obtained in the initial years of cultivation [10], there appears to be a strong incentive to remove shade trees from cacao farms in these and several other cacao grow-ing districts [18]. However, since the government intro-duced the timber resources management (Amendment) Act of 2002, the right of tenure has now been assigned to the one who planted the tree, though this law appears to be more inclined towards plantation establishment and has largely not been tested in farming systems. This pro-vides hope for REDD+ implementation in cacao farms, as this could motivate farmers to integrate trees into their farms through planting, if appropriate sensitization efforts are made, including enforcement of existing laws that that require that farmers consent is sought before trees are logged.
Possibility of implementing REDD+ interventions in studied cacao landscapesResults of this study also reveal that, contrary to existing assumptions, unshaded cacao systems meet the height
requirements to qualify as forest per Ghana’s forest defi-nition for climate change mitigation projects. Coupled with the finding that only two of the studied districts have shade cover equal to or more than the 15 % thresh-old, significant opportunity exists to develop cacao-carbon and REDD+ projects in Ghana. This is certainly useful information and has diverse implications for the design of Ghana’s REDD+ strategy. However, the extent to which cacao landscapes would contribute to the reali-zation of REDD+ objectives hinges very much on Gha-na’s definition of forest. In line with requirements under the REDD+ readiness efforts, Ghana defined its forests as being a minimum of 1 ha, having at least 15 % canopy cover and containing trees that are 5 meters tall. The shade trees in the cacao system, however, could consti-tute a forest if they offer enough canopy cover beyond the 15 % and are taller than 5 m. Thus, the forest defi-nition and type of cacao system (monoculture vs. shade) have serious implications for the type of REDD+ that is viable. Two out of the ten study districts, New Edubi-ase and Asempaneye, had crown cover of 15 and 16.3 % respectively and technically qualify to be defined as for-ests and inclusion for REDD+ intervention activities. By judiciously selecting shade trees and integrating them into cacao systems in a manner designed to offer opti-mal ecological, economic nutritional and financial ben-efits, cacao landscapes in the other study districts have the potential of contributing positively to the country’s REDD+ efforts. Full-sun plantations with cacao trees up to the defined 5-m height would constitute a forest and therefore would qualify for REDD+ .
Conclusions and recommendationsThere were significant relationships between crown cover (%) and shade tree carbon stocks, shade tree stem diameter and shade tree carbon, and shade tree diameter (cm) and total aboveground carbon stocks. Progressively also, total tree carbon stocks increased with increas-ing mean stem numbers per hectare and stem diameter. Above ground carbon stocks in shaded-cacao systems in the studied landscape varied between 10.9 ± 1.56 and 23.4 ± 3.23 Mg C ha−1 and is a reflection of the differ-ences in tree density, tree diversity and management practices between farms. Additionally, only 20 % of cacao in the sampled districts is grown under shade regimes of 15 % crown cover and above, while 80 % of cacao is grown under shade regimes ranging from 5.8 to 14.9 %. In the light of these findings, significant opportunity exists to develop cacao carbon projects in Ghana. While different groups are making efforts to map out farms in the cacao landscape, comprehensive data and informa-tion such as those suggested above is needed to develop a well-planned national REDD+ strategy. By judiciously

Page 12 of 13Dawoe et al. Carbon Balance Manage (2016) 11:17
selecting preferred shade trees and integrating them into cacao systems in a manner designed to offer optimal eco-logical and socio-economic benefits, cacao landscapes in Ghana have the potential of contributing positively to the country’s REDD+ efforts. There is also the need to educate farmers on the potential of monetary benefits from REDD+ activities. Broad stakeholder participa-tion and access to credit and information are essential for the equitable and sustainable implementation of REDD+ policies. Increased participation is particu-larly important in terms of maximizing local knowledge and capacity to support the implementation of REDD+. However, the extent to which cacao landscapes would contribute to the realization of REDD+ objectives hinges very much on Ghana’s definition of forest.
Authors’ contributionsThe study was carried out by ED, WA, EA and PB. All the authors participated in the design of the study, plot/field layouts and collection of field data. ED drafted the manuscript, performed the statistical analysis and its interpreta-tion, drew all the graphs and constructed the tables. WA conceived the study and facilitated the acquisition of funds for its implementation, contributed to the interpretation of data, and made significant contribution in critically reviewing the manuscript. EA was team leader, coordinated all the study activities and read through the manuscript. PB contributed in reviewing the draft manuscript for its content. All authors read and approved the final manuscript.
Author details1 Faculty of Renewable Natural Resources (FRNR), Kwame Nkrumah University of Science and Technology (KNUST), Kumasi, Ghana. 2 SNV Netherlands Devel-opment Organization, Accra, Ghana. 3 Forestry Research Institute of Ghana (FORIG), Council for Scientific and Industrial Research (CSIR), Kumasi, Ghana.
AcknowledgementsThis research was financed by SNV Netherlands Development Organisation, Ghana under its Cacao Eco Project. We are grateful to Messrs Seth Kankam, Elvis Nkrumah, Yaw Apau, Nana Prempeh Bandoh and Emmanuel Sey, who assisted in the fieldwork identifying tree species and compiling data. The oop-eration of the survey participants and local community leaders in the research sites is also gratefully acknowledged. We acknowledge the contribution of Ernest Adzim, Arend, Richard McNally and Quirin Laumans for their insightful comments at various stages of the research. We would also like to thank the anonymous reviewers for their time and comments.
Competing interestsThe authors declare that they have no competing interests.
Received: 1 April 2016 Accepted: 17 August 2016
Additional file
Additional file 1: Appendix 1. Shade tree species found in Theobroma cacao agroforestry systems in ten districts in the Ashanti, Brong-Ahafo and Western Regions of Ghana and reasons for their preference. (Uses: 1. Timber, 2. Food & beverages, 3. Fodder, 4. Fuelwood/Charcoal, 5. Soil fertil-ity/Green manure, 6. Nitrogen-fixation, 7. Dyes/Colors, 8. Spices, 9. Honey production/Apiculture 10. Essential Oils, 11. Medicinal, and 12. Other uses).
References 1. Asante-Poku A., Angelucci F. Analysis of incentives and disincentives for
cacao in Ghana. Technical notes series, Monitoring African Food and Agricultural Policies (MAFAP), FAO, Rome; 2013. 38 pp.
2. Ashitey E. Global agricultural information network (GAIN) Cacao Annual Report. No. 1202. Accra; 2012. p. 7.
3. Anthonio DC, Aikins ED. Reforming Ghana ́s cacao sector—an evaluation of private participation in marketing. Luleå University of Technology, Master Thesis, continuation courses marketing and e-commerce. Depart-ment of Business Administration and Social Sciences Division of Industrial marketing and e-commerce; 2009. pp. 114.
4. Anim-Kwapong G J, Frimpong EB. vulnerability and adaptation assess-ment under the Netherlands climate change studies assistance pro-gramme phase 2 (NCCSAP 2). Cocoa Research Institute of Ghana; 2005. pp. 44.
5. Sonwa DJ, Weise SF, Nkongmeneck BA, Tchatat M, Janssens MJJ. Carbon stock in smallholder chocolate forest in southern Cameroon and potential role in climate change mitigation. Earth Environ Sci 2009; 6. doi:10.1088/1755-1307/6/5/252008.
6. Oke D, Olatiilu A. Carbon storage in agroecosystems: a case study of the cocoa based agroforestry in Ogbese forest reserve, Ekiti State, Nigeria. J Environ Prot. 2011;2(8):1069–75.
7. Norgrove L, Hauser S. Carbon stocks in shaded Theobroma cacao farms and adjacent secondary forests of similar age in Cameroon. Trop Ecol. 2013;54(1):15–22.
8. Somarriba E, Cerda R, Orozco L, Cifuentes M, Dávila H, Espin T, Mavisoy H, Ávila G, Alvarado E, Poveda V, Astorga C, Say E, Deheuvels O. Carbon stocks and cacao yields in agroforestry systems of Central America. Agri Ecosyst Environ. 2013;173:46–57.
9. Gockowski J, Weise S, Sonwa D, Tchatat M, Ngobo M. Conservation because it pays: shaded cacao agroforests in West Africa. National Acad-emy of Sciences in Washington DC on Feb 10 2004. (http://www.icraf.com/treesandmarkets/inaforesta/documents/shaded_cacao agroforests in_w_africa.pdf ) Accessed 24 Aug 2014.
10. Ruf OF. The Myth of complex cacao agroforests: the case of Ghana’. Human Ecol. 2011;39:373–88.
11. Gockowski J, Sonwa D. Cacao intensification scenarios and their predicted impact on CO2 emissions, biodiversity conservation, and rural livelihoods in the Guinea rain forest of West Africa. Environ Manag. 2011;48(2):307–21.
12. Sonwa DJ, Weise SF, Schroth G, Janssens MJJ, Shapiro HY. Plant diversity management in cacao agroforestry systems in west and central Africa – effects of markets and household needs. Agrofor Syst. 2014. doi:10.1007/s10457-014-9714-5.
13. Anglaaere LCN, Cobbina J, Sinclair FL, McDonald MA. The effect of land use systems on tree diversity: farmer preference and species composition of cacao-based agroecosystems in Ghana. Agrofor Syst. 2011;81:249–65.
14. Isaac ME, Gordon AM, Thevathasan N, Oppong SK, Quashie-Sam J. Temporal changes in soil carbon and nitrogen in West African multistrata agroforestry systems: a chronosequence of pools and fluxes. Agrofor Syst. 2005;65:23–31.
15. Taylor CJ. Synecology and silviculture in Ghana. Edinburgh: Thomas Nelson and Sons Ltd.; 1960. p. 418.
16. FAO/UNESCO soil map of the world. Revised Legend. FAO: Rome; 1990. 17. Ministry of Food and Agriculture, National Soil Fertility Management
Action Plan, Directorate of crop services, MoFA, Accra, Ghana; 1998. 18. Acheampong E, Dawoe E, Bosu P, Asante W. Moving forward with
REDD+ in Ghana: shade systems, crown cover, carbon stocks and socio-economic dynamics of smallholder Cacao, SNV Netherland Dev. Organization REAP Publication; 2014. pp. 81.
19. Chave J, Andalo C, Brown S, Cairns MA, Chambers JQ, Eamus D, Fölster H, Fromard F, Higuchi N, Kira T, Lescure JP, Nelson BW, Ogawa H, Puig H, Riera B, Yamakura T. Tree allometry and improved estimation of carbon stocks and balance in tropical forests. Oecologia. 2005;145:87–99.
20. Zanne AE, Lopez-Gonzalez G, Coomes DA, Ilic J, Jansen S, Lewis, SL, Miller RB, Swenson NG, Wiemann MC, Chave J. Global wood density database. 2009. Dryad. Identifier: http://hdl.handle.net/10255/dryad. 235. Assessed 15 June 2014.
Page 13 of 13Dawoe et al. Carbon Balance Manage (2016) 11:17
21. IPCC. 2006 IPCC Guidelines for National Greenhouse Gas Inventories, Forestry. The Institute for Global Environmental Strategies (IGES), Japan. 2006.
22. Statistix 8.0 for Windows. Analytical software. Tallahassee; 2008. 23. Pearson T, Walker S, Brown S. Source book for land use change and
forestry projects. Winrock international and biocarbon fund. 2007. 24. Ifejika CS. Resilient adaptation to climate change in African agriculture.
DIE (Deutsches Institut für Entwicklungspolitik Studies 54) Bonn. 2010; 311.
25. Henry M, Tittonnell P, Manley RJ, Bermoux M, Albretch A, Vanlauwe W. Biodiversity, carbon stocks and sequestration potential in aboveground biomass in smallholder farming systems in western Kenya. Agric Ecosyst Environ. 2009;129:238–52.
26. Niggli U, Schmid H, Fliessbach A. Organic farming and climate change. Briefing prepared by Research Institute of Organic Agriculture FiBL, Frick, Switzerland for International Trade Centre ITC, Geneva; 2007. p. 30.
27. Rice RA, Greenberg R. Cacao cultivation and the conservation of biologi-cal diversity. Ambio. 2000;29:167–73.
28. Duguma B, Gockowski J, Bakala J. Smallholder cacao (Theobroma cacao Linn.) cultivation in agroforestry systems of West and Central Africa: chal-lenges and opportunities. Agrofor Syst. 2001;51(3):177–88.
29. DiFalco S, Perrings C. Crop genetic diversity, productivity and stability of agroecosystems. A theoretical and empirical investigation. Scott J Polit Econ. 2003;50:207–16.
30. Sambuichi RHR, Widal DB, Piasentin FB, Jardim JG, Viana TG, Menezes AA, Mello DL, Ahnert D, Baligar VC. Caburca agroforests in southern Bahia, Brazil: tree component, management practices and tree species conser-vation. Biodivers Conserv. 2012;21(4):1055–77.
31. Sonwa DJ, Nkongmeneck BA, Weise SF, Tchatat M, Adesina A, Janssens MJJ. Diversity of plants in cacao agroforests in the humid forest zone of southern Cameroon. Biodivers Conserv. 2007;16(8):2385–400.
32. Rolim SG, Chiarello AG. Slow death of Atlantic forest trees in cacao agro-forestry in southeastern Brazil. Biodivers Conserv. 2004;13:2679–94.
33. Paustian K, Six J, Elliot ET, Hunt HW. Management options for reducing CO2 emissions from agricultural soils. Biogeochemistry. 2000;48:147–63.
34. Albrecht A, Kandji ST. Carbon sequestration in tropical agroforestry systems. Agric Ecosyst Environ. 2003;99:15–27.
35. Montagnini F, Nair PKR. Carbon sequestration: an under-exploited envi-ronmental benefit of agroforestry systems. Agrofor Syst. 2004;61:281–95.
36. Dawoe E. Conversion of natural forest to cacao Agroforest in lowland humid Ghana: impact on plant biomass production, organic carbon and nutrient dynamics. Ph.D. thesis, Faculty of Renewable Natural Resources Kwame Nkrumah University of Science and Technology, Kumasi; 2011. pp. 260.
37. Asare RA, Kwakye Y, Quartey ET. Reducing deforestation in Ghana using a climate smart cocoa production strategy: the case for a cocoa forest REDD+ program. A paper presented at the 1st National Forestry Confer-ence, Kumasi, Ghana, Sept. 16; 2014.
38. Leuschner C, Moser and G, Hertel D, Erasmi S, Leitner D, Culmsee H, Schuldt B, Schwendenmann L. Conversion of tropical moist forest into cacao agroforest: consequences for carbon pools and annual C seques-tration. Agrofor Syst. 2013;87:1173–87.
39. Saj S, Jagoret P, Ngogue HT. Carbon storage and density dynamics of associated trees in contrasting Theobroma cacao agroforests of Central Cameroon. Agrofor Syst. 2013;87(6):1309–20.
40. Jacobi J, Andres C, Schneider M, Pillco M, Calizaya P, Rist S. Carbon stocks, tree diversity, and the role of organic certification in different cacao production systems in Alto Beni, Bolivia. Agrofor Syst. 2013. doi:10.1007/s10457-013-9643-8.
41. Kotto-Same J, Woomer PL, Appolinaire M, Louis Z. Carbon dynamics in slash-and-burn agriculture and land use alternatives of the humid forest zone in Cameroon. Agri Ecosyst Environ. 1997;65:245–56.
42. Smiley GL, Kroschel J. Temporal change in carbon stocks of cacao–gliricidia agroforests in Central Sulawesi. Indones Agrofor Syst. 2008;73(219):231.
43. Brown S, Gillespie AJR, Lugo AE. Biomass estimation methods for tropical forests with applications to forest inventory data. For Sci. 1989;35:881–902.
44. Tscharntke T, Clough Y, Bhagwat SA, Buchori D, Faust H, Hertel D, Hölscher D, Juhrbandt J, Kessler M, Perfecto I, Scherber C, Schroth G, Veldkamp E, Wanger TC. Multifunctional shade-tree management in tropical agrofor-estry landscapes—a review. J Appl Ecol. 2011;48(3):619–29.
45. Ong CK, Kho RM. Radersma S. In: van Noordwijk M, Cadisch G, Ong CK, editors. Ecological interactions in multispecies agroecosystems: concepts and rules. Belowground interactions in tropical agroecosystems. con-cepts and models with multiple plant components. Wallingford: CABI Publishing; 2004. p. 1–15.