SGLT2 inhibitors to take centre stage in 2017? - What we do · SGLT2 inhibitors to take centre...
8
PHARMAFORENSIC – TURNING DATA INTO INFORMATION pg. 1 SGLT2 inhibitors to take centre stage in 2017? Introduction There are few primary care categories as dynamic as diabetes (Type 1 and 2); not only is the category forecast to grow at 6.8% globally through to 2022 as more patients are diagnosed but it is likely to become the second largest category after oncology 1 . More intriguing is that the players in this therapeutic area are relatively few in number and yet their competitive position in key geographies belies their marketing strength in other markets or treatment categories. This is particularly true in the UK oral anti-diabetes market. While early market entry and strong clinical data would be the expected drivers of market share there are many examples in the dynamic Type 2 sub-categories of DPP4 and SGLT2 inhibitors where UK market shares differ markedly from those in the US, raising serious questions about marketing strategies and capabilities. The rest of this paper will explore some of these issues and provide some suggestions as to how companies may alter course if they are to maximise the commercial opportunities available to them. FIGURE 1: RELATIVELY FEW PLAYERS IN DIABETES MARKETS Source: EvaluatePharma August 2016, www.evaluategroup.com There are seven key players within the global Type 2 oral market that sell DPP4 and SGLT2 inhibitors. (see Figure 1). For clarity NovoNordisk, Sanofi and Bayer have been removed from Figure 1 since they are mainly involved in other categories of Type 2 drug. Figure 1 shows that private company Boehringer Ingelheim is forecast to grow the fastest and have a Type 2 diabetes franchise in 2022 second only to Merck & Co in scale, surpassing AstraZeneca, Janssen (J&J’s Pharma Division), Novartis, Takeda and even Lilly when the latter’s insulin sales are stripped out. These seven players will be the subject of the rest of this paper, in particular with respect to their positions within the DPP4 and SGLT2 inhibitor market. Competitors’ performance in the UK belie their traditional strength The SGLT2 inhibitors for Type 2 diabetes create additional options for patients, doctors and pharmaceutical companies. As a sub-category that began commercial life in 2011 it took off in 2015 when three competitor products achieved aggregate sales of $2bn. The sales forecast for this sub-category in 2022 is around $9bn. With clinical data, backed up by a label claim, suggesting that empagliflozin (Jardiance) reduces cardiovascular risk, with similar data for dapagliflozin (Forxiga) and canagliflozin (Invokana) still to come, 1 Evaluate Pharma – World Preview 2016, Outlook to 2022 Merck & Co Eli Lilly AstraZeneca Johnson & Johnson Novartis Boehringer Ingelheim Takeda -10.0% -5.0% 0.0% 5.0% 10.0% 15.0% 20.0% 25.0% 30.0% 35.0% 0.00 0.20 0.40 0.60 0.80 1.00 1.20 % Sales Growth (2015-2022) Relative Global Market Share (LLY=1) Relative Global Market Share & Sales Growth of DPP4 and SGLT2 Inhibitors (2015-2022)
Transcript of SGLT2 inhibitors to take centre stage in 2017? - What we do · SGLT2 inhibitors to take centre...
PHARMAFORENSIC – TURNING DATA INTO INFORMATION
pg. 1
SGLT2 inhibitors to take centre stage in 2017?
Introduction There are few primary care categories as dynamic as diabetes (Type 1 and 2); not only is the category
forecast to grow at 6.8% globally through to 2022 as more patients are diagnosed but it is likely to become
the second largest category after oncology1. More intriguing is that the players in this therapeutic area are
relatively few in number and yet their competitive position in key geographies belies their marketing
strength in other markets or treatment categories. This is particularly true in the UK oral anti-diabetes
market. While early market entry and strong clinical data would be the expected drivers of market share
there are many examples in the dynamic Type 2 sub-categories of DPP4 and SGLT2 inhibitors where UK
market shares differ markedly from those in the US, raising serious questions about marketing strategies and
capabilities. The rest of this paper will explore some of these issues and provide some suggestions as to how
companies may alter course if they are to maximise the commercial opportunities available to them.
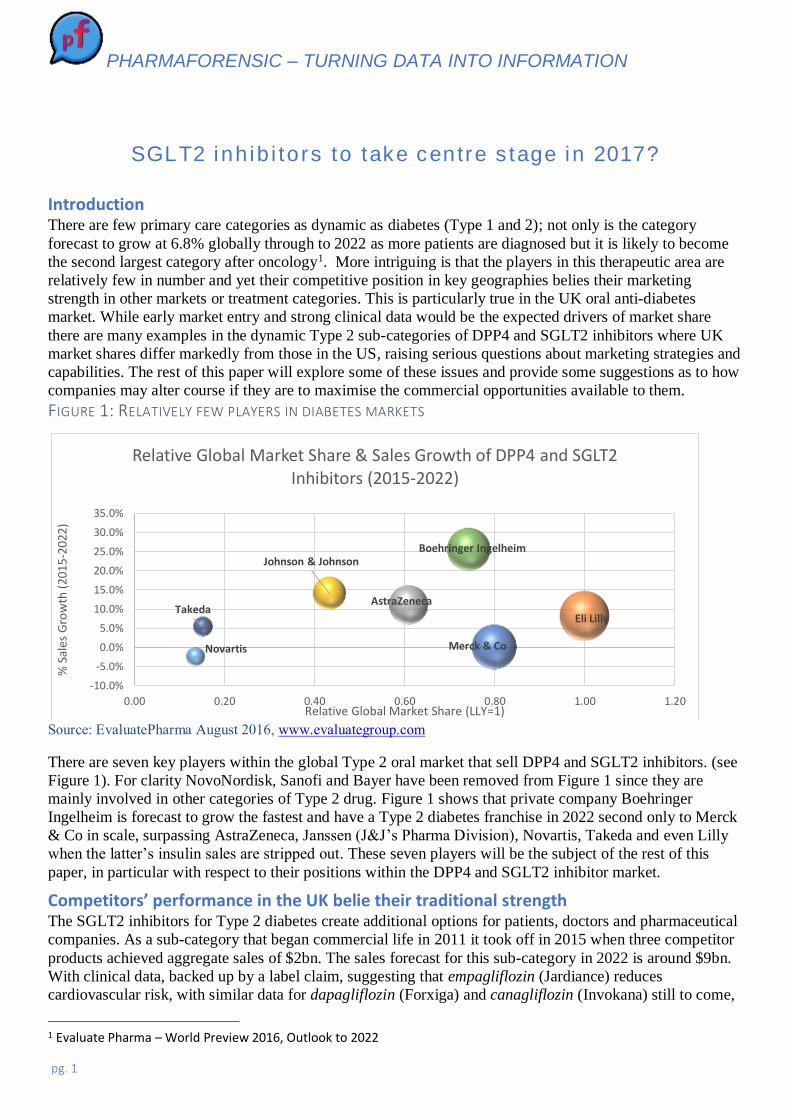
FIGURE 1: RELATIVELY FEW PLAYERS IN DIABETES MARKETS
Source: EvaluatePharma August 2016, www.evaluategroup.com
There are seven key players within the global Type 2 oral market that sell DPP4 and SGLT2 inhibitors. (see
Figure 1). For clarity NovoNordisk, Sanofi and Bayer have been removed from Figure 1 since they are
mainly involved in other categories of Type 2 drug. Figure 1 shows that private company Boehringer
Ingelheim is forecast to grow the fastest and have a Type 2 diabetes franchise in 2022 second only to Merck
& Co in scale, surpassing AstraZeneca, Janssen (J&J’s Pharma Division), Novartis, Takeda and even Lilly
when the latter’s insulin sales are stripped out. These seven players will be the subject of the rest of this
paper, in particular with respect to their positions within the DPP4 and SGLT2 inhibitor market.
Competitors’ performance in the UK belie their traditional strength The SGLT2 inhibitors for Type 2 diabetes create additional options for patients, doctors and pharmaceutical
companies. As a sub-category that began commercial life in 2011 it took off in 2015 when three competitor
products achieved aggregate sales of $2bn. The sales forecast for this sub-category in 2022 is around $9bn.
With clinical data, backed up by a label claim, suggesting that empagliflozin (Jardiance) reduces
cardiovascular risk, with similar data for dapagliflozin (Forxiga) and canagliflozin (Invokana) still to come,
1 Evaluate Pharma – World Preview 2016, Outlook to 2022
Merck & Co
Eli Lilly
AstraZeneca
Johnson & Johnson
Novartis
Boehringer Ingelheim
Takeda
-10.0%
-5.0%
0.0%
5.0%
10.0%
15.0%
20.0%
25.0%
30.0%
35.0%
0.00 0.20 0.40 0.60 0.80 1.00 1.20
% S
ales
Gro
wth
(20
15-2
022)
Relative Global Market Share (LLY=1)
Relative Global Market Share & Sales Growth of DPP4 and SGLT2 Inhibitors (2015-2022)

PHARMAFORENSIC – TURNING DATA INTO INFORMATION
pg. 2
these sales forecasts may not be unrealistic. However, forecasting the allocation of future sales between each
of the competitors, Janssen (Johnson & Johnson), Astra Zeneca and Lilly/Boehringer Ingelheim (the last two
are co-promoters of empagliflozin and linagliptin) may not be as straightforward as the forecasts suggest.
One complication is the competitive strength of the earlier class of Type 2 anti-diabetics, the DPP-4
inhibitors, dominated by Merck’s sitagliptin (Januvia) franchise. Furthermore, the Type 2 area is dogged by
access and discounting concerns in the US. While AZN’s dapagliflozin sales are fairly evenly split between
US and ex-US, Janssen’s canagliflozin is massively skewed to the US. AZN claims global SGLT2 volume
leadership with a 42% share but can muster just 26% of total value2. Within the DPP-4 class AZN, Merck
and the Lilly/BI partnership all have decent sales globally but AZN’s saxagliptin (Onglyza) has struggled to
gain share in the US, being overtaken by Lilly/Boehringer’s linagliptin (Trajenta) despite saxagliptin’s
earlier launch. FIGURE 2: COMPARISON OF US AND UK VALUE MARKET SHARES FOR DPP4 AND SGLT2 INHIBITORS
Source: Annual Reports and Evaluate Pharma – World Preview 2016, Outlook to 2022; PCA data from
http://www.nhsbsa.nhs.uk/PrescriptionServices/3494.asp
The UK Type 2 Market in more detail It is easy to pass off these phenomena as simply reflecting differential geographic marketing (and market
access) strengths. However, there is little likelihood that the companies involved had forecast such skewed
2 AZN Q3 2016 Results Presentation

PHARMAFORENSIC – TURNING DATA INTO INFORMATION
pg. 3
sales performances between markets so shareholders and management alike are entitled to ask why these
deficiencies have not been addressed. Why has Janssen’s canagliflozin failed to take a reasonable share ex-
US; why has AZN’s dapagliflozin not made greater inroads in the US; why is AZN’s saxagliptin a distant
third in the UK DPP-4 market and why is Takeda’s alogliptin set to overtake AZN’s saxagliptin in the
latter’s home market, despite a much later launch? These questions remain largely unanswered and suggest
that future forecasts, including up to $150bn of cumulative sales to 2022, remain in doubt as to their
company attribution.
In an attempt to unravel some of these questions we have started with the UK market and analysed
publically available Prescription Cost Analysis (PCA) data to demonstrate how competitive advantage could
be achieved. The UK may be small in relation to the US or German pharmaceutical markets but the same
statistical principles apply to all. If one believes that freedom to influence demand is one of the inherent
principles underpinning the success of the pharmaceutical industry as an important stakeholder in the
healthcare ecosystem, then there should be no excuse for failing to implement accurate and robust data
analysis in order to eliminate promotional waste and to deliver the clinical message.
FIGURE 3: UK MARKET POSITION OF DPP4 AND SGLT2 INHIBITORS MAY-AUGUST 2016
Source: PCA data from http://www.nhsbsa.nhs.uk/PrescriptionServices/3494.asp
Figure 3 plots the relative value market share (with MSD’s sitagliptin having a relative market share of 1.0)
against growth rates of the DPP4 and SGLT2 inhibitors in the UK, using NIC data from publically available
PCA from the NHS Business Services Authority. The time period examined is the “Tertial”, i.e. 4 month
PHARMAFORENSIC – TURNING DATA INTO INFORMATION
pg. 4
period, from May to August 2016 compared with the same period the previous year. The size of the bubble
for each product is an indication of total sales in the Tertial (see Figure 5 below).
The underperformers identified As a general rule the first in class and best in class usually have a strong market position when the market
has fully developed. MSD’s sitagliptin was first to market and is the market leader. More interesting is why
AstraZeneca’s saxagliptin has been overtaken by Lilly’s linagliptin despite a two year launch advantage and
is likely to be overtaken by Takeda’s alogliptin that has only been on the UK market for two years. It may
be argued that positioning two oral drugs for Type 2 diabetes has confounded a clear marketing strategy;
AstraZeneca have both saxagliptin and dapagliflozin. However, not only was there a three year gap between
the launch of saxagliptin and dapaglifozin, allowing plenty of time for market positioning but
Lilly/Boehringer Ingelheim have had no difficulty positioning linagliptin and empagliflozin, garnering
strong market positions with both drugs.
A more compelling argument explaining AstraZeneca’s poor showing is the outcome of the SAVOR study
that showed an increase in hospitalisation for heart failure when comparing saxagliptin with the placebo
group. This was published in late 2013. However, Takeda’s alogliptin study, EXAMINE, also published in
late 2013 showed a similar tendency. Indeed both alogliptin and saxagliptin have had FDA label changes as
a result of these trials. Despite this Takeda continues to perform really well in the UK as a “tainted”
latecomer. Takeda has launched alogliptin at a 16-20% discount to the other drugs in the class and this may
override any safety concerns for price-sensitive customers. Nevertheless, there are serious questions to
answer amongst the industry’s diabetes marketing teams.
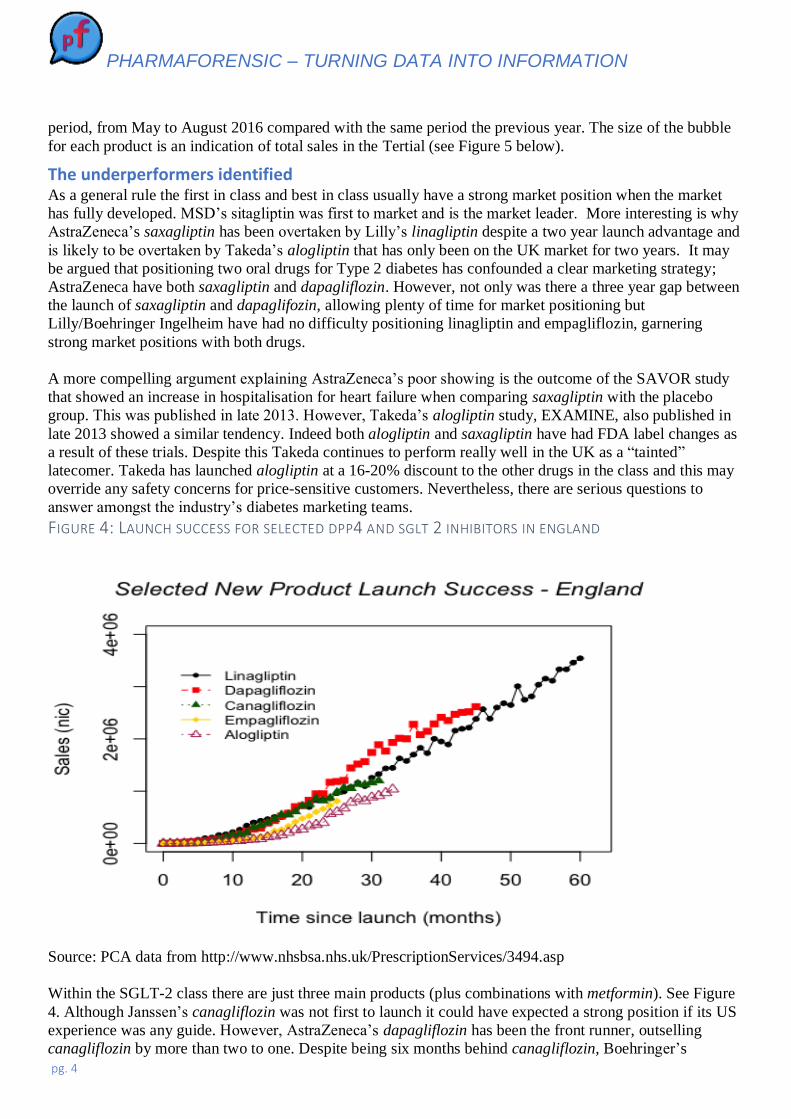
FIGURE 4: LAUNCH SUCCESS FOR SELECTED DPP4 AND SGLT 2 INHIBITORS IN ENGLAND
Source: PCA data from http://www.nhsbsa.nhs.uk/PrescriptionServices/3494.asp
Within the SGLT-2 class there are just three main products (plus combinations with metformin). See Figure
4. Although Janssen’s canagliflozin was not first to launch it could have expected a strong position if its US
experience was any guide. However, AstraZeneca’s dapagliflozin has been the front runner, outselling
canagliflozin by more than two to one. Despite being six months behind canagliflozin, Boehringer’s

PHARMAFORENSIC – TURNING DATA INTO INFORMATION
pg. 5
empagliflozin has come out of the blocks quickly and has Janssen’s canagliflozin in its sights. The
cardiovascular benefits have undoubtedly helped tell a good story but these benefits are still under
consultation by NICE and are not scheduled for a scoping workshop until January 2017, despite being
accepted by the European AdComm. It would be churlish to suggest that Janssen’s canagliflozin is a ‘loser”
in this category and yet its UK market position contrasts strongly with that in the US and is also reaching a
plateau with respect to penetration of GP practices (see Figure 7), an early warning sign perhaps of the
slowdown to come.
FIGURE 5: ENGLAND SALES (BASED ON NIC) FOR KEY DPP4 AND SGLT2 INHIBITORS
Source: PCA data from http://www.nhsbsa.nhs.uk/PrescriptionServices/3494.asp
From the outsider’s perspective there are two clear product outliers in terms of performance relative to
expectation, given the scale of the commercial organisations behind them and the resources available;
AstraZeneca’s saxagliptin and Janssen’s canagliflozin.
1/ Why is AstraZeneca’s saxagliptin now in decline and being out-sold three to one by Boehringer’s
linagliptin and about to be overtaken by Takeda’s latecomer, alogliptin, in AZ’s home market?
2/ Why has Janssen’s canagliflozin, which is the clear market leader in the US, been outsold two to one by
AstraZeneca’s dapagliflozin and likely to be overtaken by Boehringer’s empagliflozin in 2017?
Some suggested further analysis As a first pass it is useful to see just where prescriptions of the Type 2 products are being generated and how
they differ from GP practice to practice. A useful starting point is the sales split by SHA (Strategic Health
Authority). The box plot in Figure 6 shows the variation in sales (as measured by Net Ingredient Cost)
across GP practices by SHA. Key questions here are: Why is the variation in sales across SHAs so high? Is
this simply reflecting population size, levels of diagnosis, levels of disease, KOL influence, brand vs.
generic prescribing, formulary recommendation or other influences? It would also be helpful to know how
-200%
0%
200%
400%
600%
800%
1000%
1200%
0.00
10.00
20.00
30.00
40.00
50.00
60.00
70.00
Sale
s £m
(M
ay -
Au
g )
DPP4 and SGLT2 Products
DPP4/SGLT2 Inhibitor Sales and Growth Rates in England (May-Aug 2016 v Prior Year)
NIC May-Aug 2015 £m NIC May -Aug 2016 £m % change

PHARMAFORENSIC – TURNING DATA INTO INFORMATION
pg. 6
are Key Account teams doing in the various SHAs? What does success look like? Can it be explained by
certain strategies or behaviours? Answering these questions would go a long way to understanding the
healthcare ecosystem in which Type 2 diabetes products are prescribed and how field forces are faring.
FIGURE 6: SALES VARIATION OF DPP4 AND SGLT2 INHIBITORS ACROSS GP PRACTICES, SPLIT BY STRATEGIC
HEALTH AUTHORITY
Source: PCA data from http://www.nhsbsa.nhs.uk/PrescriptionServices/3494.aspx
The next level of analysis could cut the prescribing data according to GP practice, allowing one to raise a
series of additional questions. What are the characteristics of practices with high levels of DPP4/SGLT2
usage? Do they prescribe more innovative products generally, are they younger doctors, older, have greater
levels of intra-practice prescribing agreement, or even are more heterogeneous in their prescribing habits?
Where does a particular product do well and where badly? Does my product lose out in price-sensitive
practices, gain in dispensing practices, or vice versa? What are the characteristics of practices where a
particular product does well, or badly? Finally, what are the sales reps doing in territories where GP
practices have high levels of prescribing of a particular product? How does their strategy differ from those in
less successful territories? How responsive are customers to different marketing channels? Do they respond
well to digital contact, prefer face to face, need KOL endorsement, want the latest clinical data, like to talk
to medical liaison, attend clinical conferences, like group events or prefer the personal touch? What is the
optimal call rate?
An additional graph (Figure 7) shows the number of GP practices using each product. (the first three DPP4
inhibitors have been excluded, mostly since they were launched before the NIC data became publically
available. In any case they are less relevant to this debate.) What seems clear is that the sales success of
dapagliflozin and linagliptin to date has been based on penetrating a high proportion of all GP practices. The
success of empagliflozin, despite being the most recently launched product, seems to reflect an increasing
level of practice penetration, almost matching the penetration of Janssen’s canagliflozin. Indeed, the

PHARMAFORENSIC – TURNING DATA INTO INFORMATION
pg. 7
apparent stalling of canagliflozin with respect to the number of GP practices actually prescribing the product
is somewhat worrying and may indicate that a new approach is required if the drug is not to peak much
earlier and at a lower sales level than it should.
FIGURE 7: SALES OF SELECTED DPP4 AND SGLT2 INHIBITORS IN ENGLAND ACCORDING TO TIME SINCE
LAUNCH
Conclusion The key to effective marketing is clear innovative positioning and creative segmentation – two processes
made especially potent by superior analysis and insight of marketing data. Alas in many cases CRM systems
tend to “dumb down data” to the average, while practices like outsourcing to a data warehouse hand your
most valuable competitive asset to an external party.

PHARMAFORENSIC – TURNING DATA INTO INFORMATION
pg. 8
The questions in the previous section highlight some of the opportunities open to the discerning and
innovative marketer who seeks to ambush the future and set the rules of engagement rather than follow the
worn out old seam of traditional marketing with declining returns.
All these questions can be answered using a combination of publically available data and data from the
company’s CRM system. If you would like to find out more just email [email protected]
Stewart Adkins and Dr Graham Leask
Stewart Adkins was a Pharmaceutical Analyst at Lehman Brothers for 23 years as well as being involved
with the PharmaFutures projects www.pharmafutures.org but is now writing independently. Stewart Adkins
also “carried the bag” for Dista Products (Lilly Industries )in the early 1980s. Currently, Stewart Adkins is
a Director of Pharmaforensic Limited www.pharmaforensic.co.uk and runs his own consultancy Stewart
Adkins Advisors Limited.
Graham worked in the pharmaceutical industry for 20+ years (Lederle, Roche, Astra), his last industry role
being Strategic Planning Director at Astra. Since then he has worked as an academic at Aston University,
researching and developing the data analysis and statistical methodologies that he now applies to the
pharmaceutical industry. He has published in the top ranked Strategic Management Journal and won the
Pharmaceutical industry award for Commercial Analysis for work with Merck Sharpe and Dohme.
Graham’s main research interests centre on the economic performance of sales forces and accurate
measurement of promotion. Recently Graham stepped down from teaching at Aston University, but is still
actively involved with Warwick Business School. He remains a consultant, writer and researcher on strategy
in the pharmaceutical and healthcare industries, and is a Director of Pharmaforensic Limited.