SFS Sfs Investor Presentation March 2016
25
0 Investor Presentation March 2016
-
Upload
ala-baster -
Category
Documents
-
view
232 -
download
0
description
SFS Sfs Investor Presentation March 2016 slide deck ppt pdf
Transcript of SFS Sfs Investor Presentation March 2016

0
Investor PresentationMarch 2016
Disclaimer
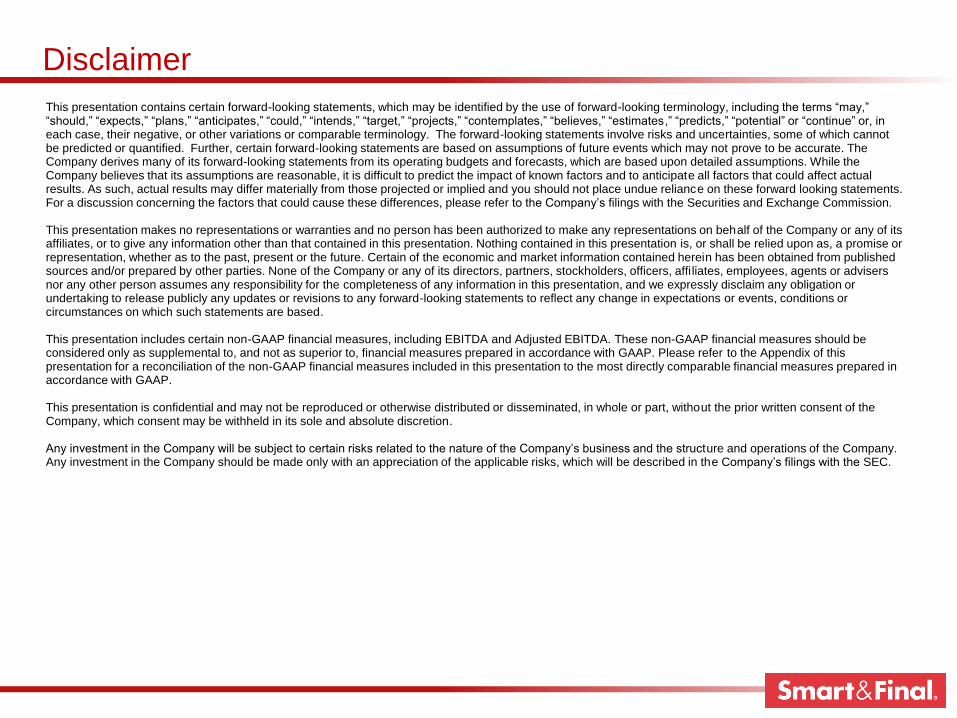
This presentation contains certain forward-looking statements, which may be identified by the use of forward-looking terminology, including the terms “may,” “should,” “expects,” “plans,” “anticipates,” “could,” “intends,” “target,” “projects,” “contemplates,” “believes,” “estimates,” “predicts,” “potential” or “continue” or, in each case, their negative, or other variations or comparable terminology. The forward-looking statements involve risks and uncertainties, some of which cannot be predicted or quantified. Further, certain forward-looking statements are based on assumptions of future events which may not prove to be accurate. The Company derives many of its forward-looking statements from its operating budgets and forecasts, which are based upon detailed assumptions. While the Company believes that its assumptions are reasonable, it is difficult to predict the impact of known factors and to anticipate all factors that could affect actual results. As such, actual results may differ materially from those projected or implied and you should not place undue reliance on these forward looking statements. For a discussion concerning the factors that could cause these differences, please refer to the Company’s filings with the Securities and Exchange Commission.
This presentation makes no representations or warranties and no person has been authorized to make any representations on behalf of the Company or any of its affiliates, or to give any information other than that contained in this presentation. Nothing contained in this presentation is, or shall be relied upon as, a promise or representation, whether as to the past, present or the future. Certain of the economic and market information contained herein has been obtained from published sources and/or prepared by other parties. None of the Company or any of its directors, partners, stockholders, officers, affi liates, employees, agents or advisers nor any other person assumes any responsibility for the completeness of any information in this presentation, and we expressly disclaim any obligation or undertaking to release publicly any updates or revisions to any forward-looking statements to reflect any change in expectations or events, conditions or circumstances on which such statements are based.
This presentation includes certain non-GAAP financial measures, including EBITDA and Adjusted EBITDA. These non-GAAP financial measures should be considered only as supplemental to, and not as superior to, financial measures prepared in accordance with GAAP. Please refer to the Appendix of this presentation for a reconciliation of the non-GAAP financial measures included in this presentation to the most directly comparable financial measures prepared in accordance with GAAP.
This presentation is confidential and may not be reproduced or otherwise distributed or disseminated, in whole or part, without the prior written consent of the Company, which consent may be withheld in its sole and absolute discretion.
Any investment in the Company will be subject to certain risks related to the nature of the Company’s business and the structure and operations of the Company. Any investment in the Company should be made only with an appreciation of the applicable risks, which will be described in the Company’s filings with the SEC.
Smart & Final Overview
2
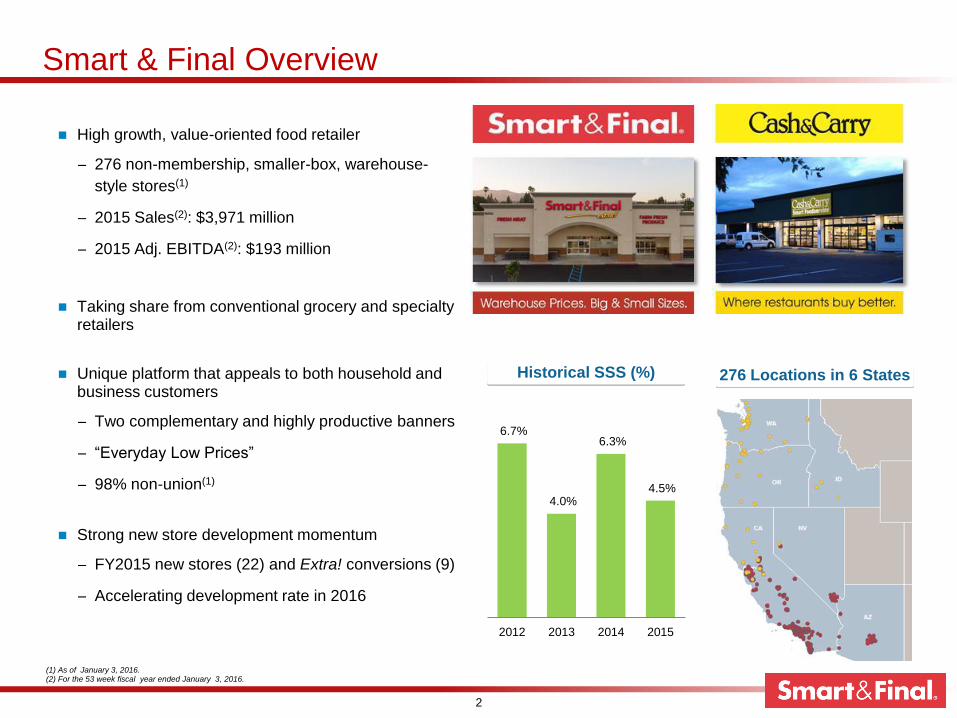
High growth, value-oriented food retailer
− 276 non-membership, smaller-box, warehouse-
style stores(1)
− 2015 Sales(2): $3,971 million
− 2015 Adj. EBITDA(2): $193 million
Taking share from conventional grocery and specialty retailers
Unique platform that appeals to both household and business customers
− Two complementary and highly productive banners
− “Everyday Low Prices”
− 98% non-union(1)
Strong new store development momentum
− FY2015 new stores (22) and Extra! conversions (9)
− Accelerating development rate in 2016
(1) As of January 3, 2016. (2) For the 53 week fiscal year ended January 3, 2016.
6.7%
4.0%
6.3%
4.5%
2012 2013 2014 2015
Historical SSS (%) 276 Locations in 6 States
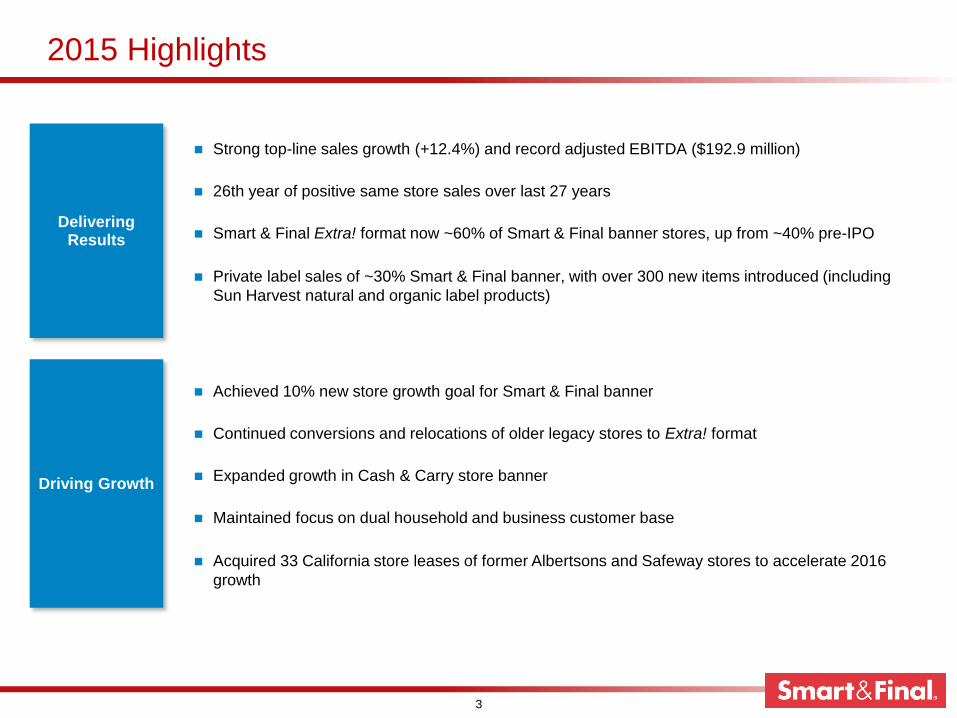
2015 Highlights
Strong top-line sales growth (+12.4%) and record adjusted EBITDA ($192.9 million)
26th year of positive same store sales over last 27 years
Smart & Final Extra! format now ~60% of Smart & Final banner stores, up from ~40% pre-IPO
Private label sales of ~30% Smart & Final banner, with over 300 new items introduced (including
Sun Harvest natural and organic label products)
3
Delivering Results
Driving Growth
Achieved 10% new store growth goal for Smart & Final banner
Continued conversions and relocations of older legacy stores to Extra! format
Expanded growth in Cash & Carry store banner
Maintained focus on dual household and business customer base
Acquired 33 California store leases of former Albertsons and Safeway stores to accelerate 2016
growth
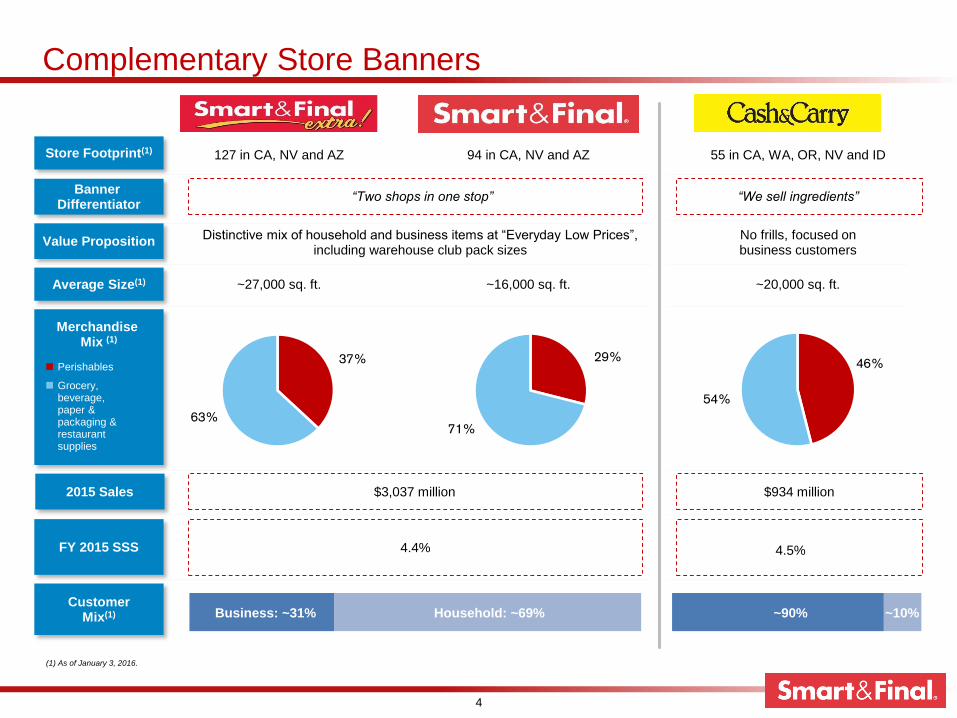
Complementary Store Banners
4
2015 Sales $3,037 million $934 million
4.4%FY 2015 SSS
Customer Mix(1)
37%
63%
29%
71%
46%
54%
Store Footprint(1) 55 in CA, WA, OR, NV and ID127 in CA, NV and AZ 94 in CA, NV and AZ
Banner Differentiator
~16,000 sq. ft.~27,000 sq. ft. ~20,000 sq. ft.
Merchandise Mix (1)
Perishables
Grocery, beverage, paper & packaging & restaurant supplies
Average Size(1)
“Two shops in one stop” “We sell ingredients”
Value PropositionDistinctive mix of household and business items at “Everyday Low Prices”,
including warehouse club pack sizesNo frills, focused on business customers
Business: ~31% Household: ~69% ~90% ~10%
(1) As of January 3, 2016.
4.5%
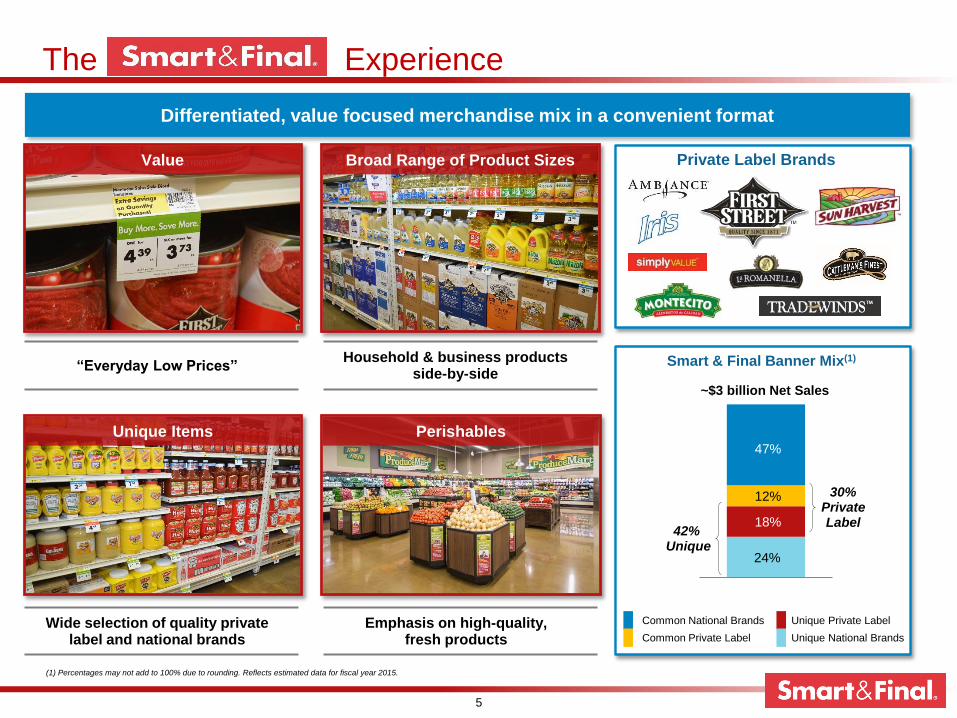
The Experience
5
Smart & Final Banner Mix(1)
(1) Percentages may not add to 100% due to rounding. Reflects estimated data for fiscal year 2015.
Common National Brands
Common Private Label
Unique Private Label
Unique National Brands
Broad Range of Product Sizes
Unique Items
Wide selection of quality private label and national brands
Household & business products side-by-side
“Everyday Low Prices”
Perishables
Emphasis on high-quality, fresh products
Private Label Brands
Differentiated, value focused merchandise mix in a convenient format
Value
24%
18%
12%
47%
42% Unique
30% Private Label
~$3 billion Net Sales
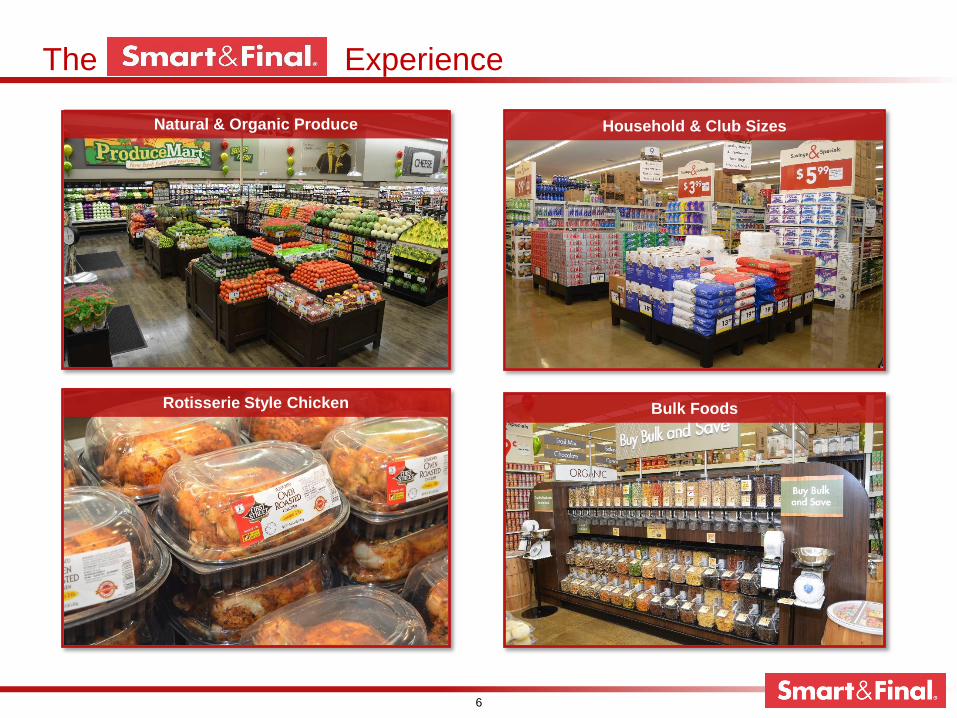
The Experience
6
Natural & Organic Produce Household & Club Sizes
Bulk FoodsRotisserie Style Chicken
The Experience
7
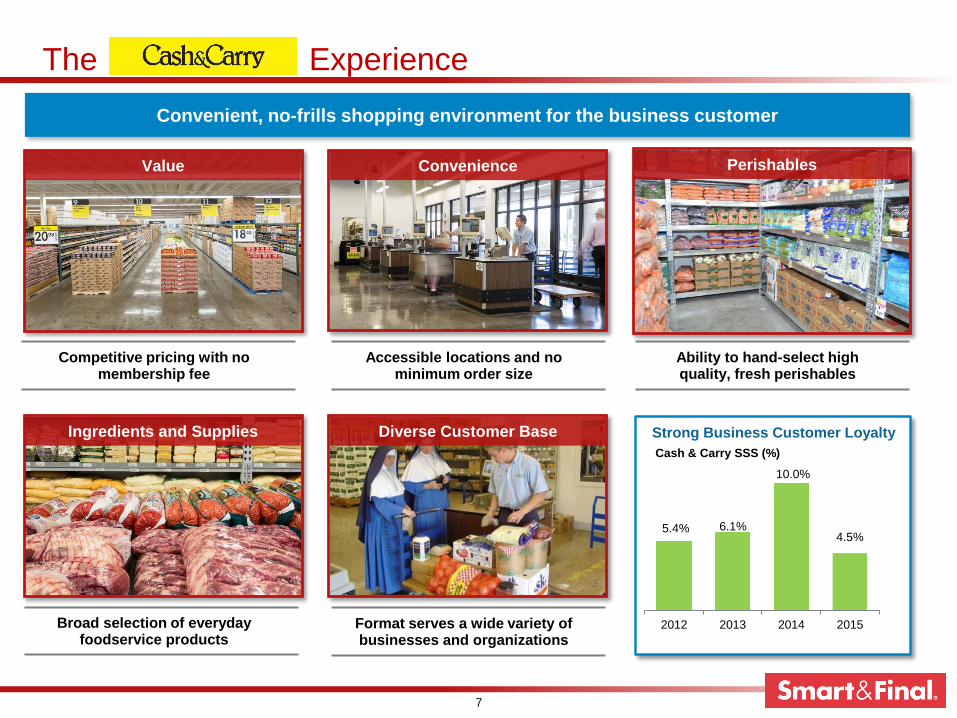
Convenience
Ingredients and Supplies
Broad selection of everyday foodservice products
Accessible locations and no minimum order size
Competitive pricing with no membership fee
Ability to hand-select high quality, fresh perishables
Convenient, no-frills shopping environment for the business customer
Value
5.4% 6.1%
10.0%
4.5%
2012 2013 2014 2015
Cash & Carry SSS (%)
Strong Business Customer LoyaltyDiverse Customer Base
Format serves a wide variety of businesses and organizations
Perishables
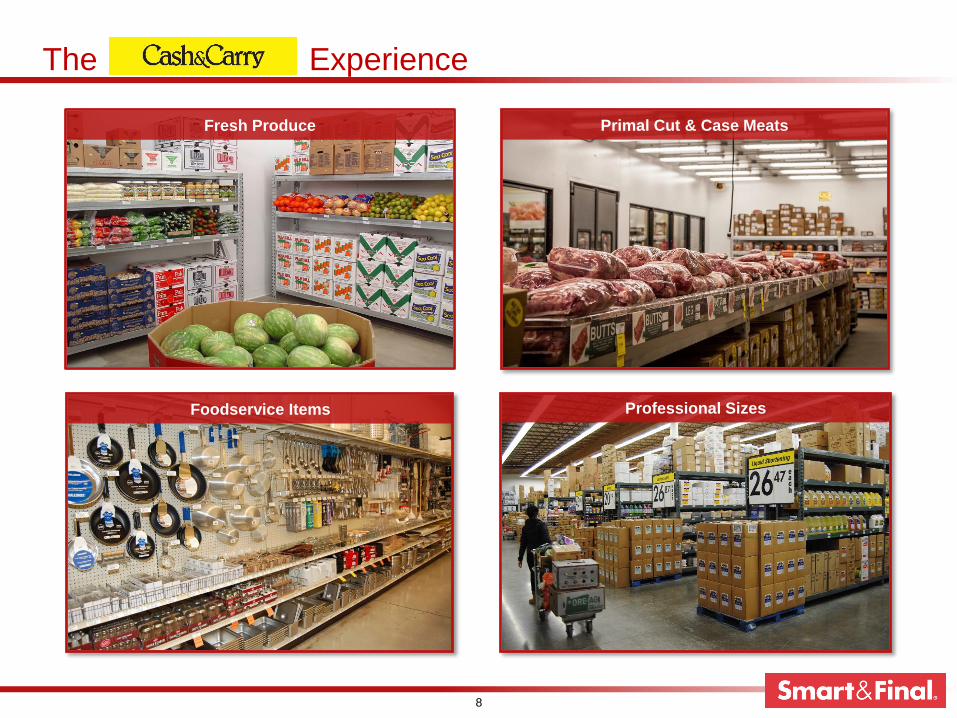
The Experience
8
Primal Cut & Case Meats
Foodservice Items Professional Sizes
Fresh Produce
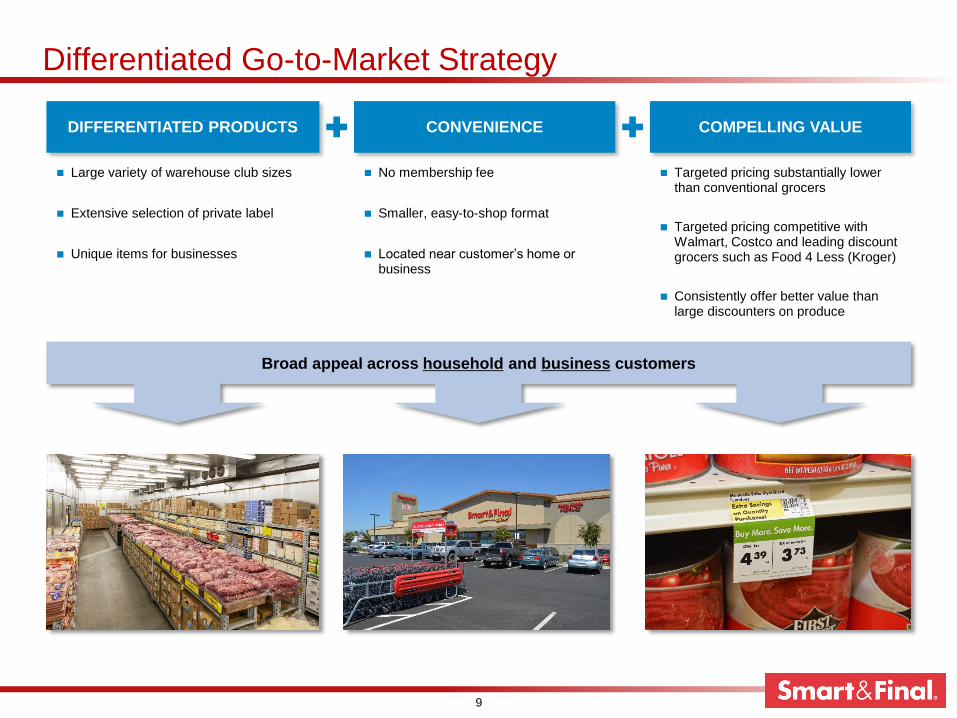
Differentiated Go-to-Market Strategy
9
COMPELLING VALUEDIFFERENTIATED PRODUCTS CONVENIENCE
Targeted pricing substantially lower than conventional grocers
Targeted pricing competitive with Walmart, Costco and leading discount grocers such as Food 4 Less (Kroger)
Consistently offer better value than large discounters on produce
No membership fee
Smaller, easy-to-shop format
Located near customer’s home or business
Large variety of warehouse club sizes
Extensive selection of private label
Unique items for businesses
Broad appeal across household and business customers
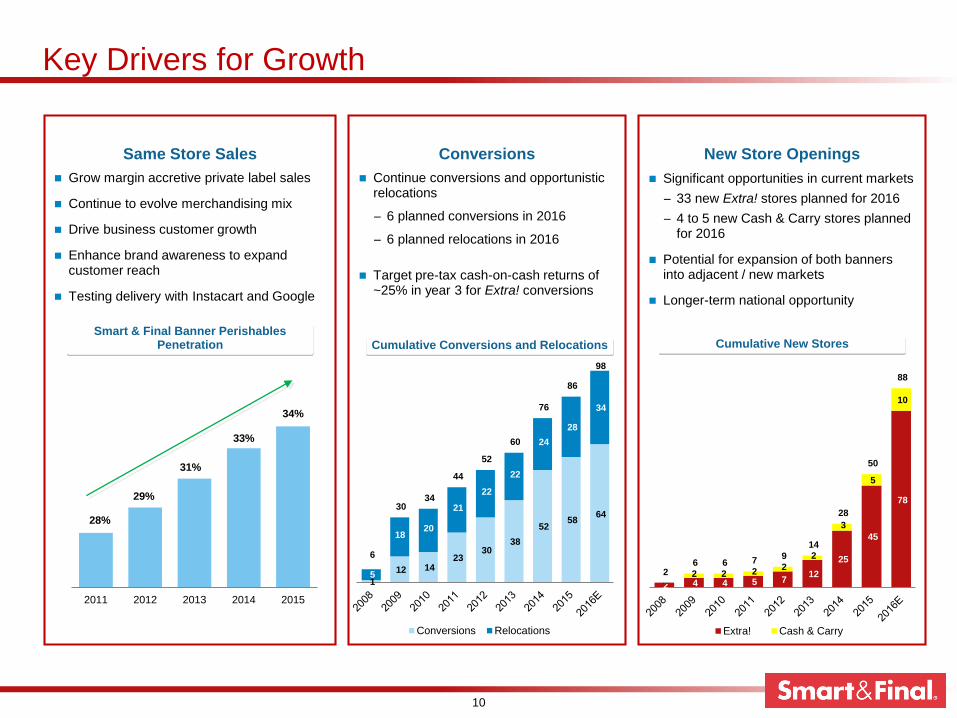
Key Drivers for Growth
10
Conversions New Store OpeningsSame Store Sales
Cumulative Conversions and Relocations Cumulative New Stores
Significant opportunities in current markets
− 33 new Extra! stores planned for 2016
− 4 to 5 new Cash & Carry stores planned for 2016
Potential for expansion of both banners into adjacent / new markets
Longer-term national opportunity
Continue conversions and opportunistic relocations
− 6 planned conversions in 2016
− 6 planned relocations in 2016
Target pre-tax cash-on-cash returns of ~25% in year 3 for Extra! conversions
Grow margin accretive private label sales
Continue to evolve merchandising mix
Drive business customer growth
Enhance brand awareness to expand customer reach
Testing delivery with Instacart and Google
28%
29%
31%
33%
34%
2011 2012 2013 2014 2015
Smart & Final Banner Perishables Penetration
2 4 4 5 7 12
25
45
78
–2 2 2
2
2
3
5
10
2 6 6 7
9
14
28
50
88
Extra! Cash & Carry
1
12 14 23
30 38
52 58
64
5
18 20
21
22
22
24
28
34
6
30 34
44
52
60
76
86
98
Conversions Relocations
Key Drivers for Growth: New Store Openings
11
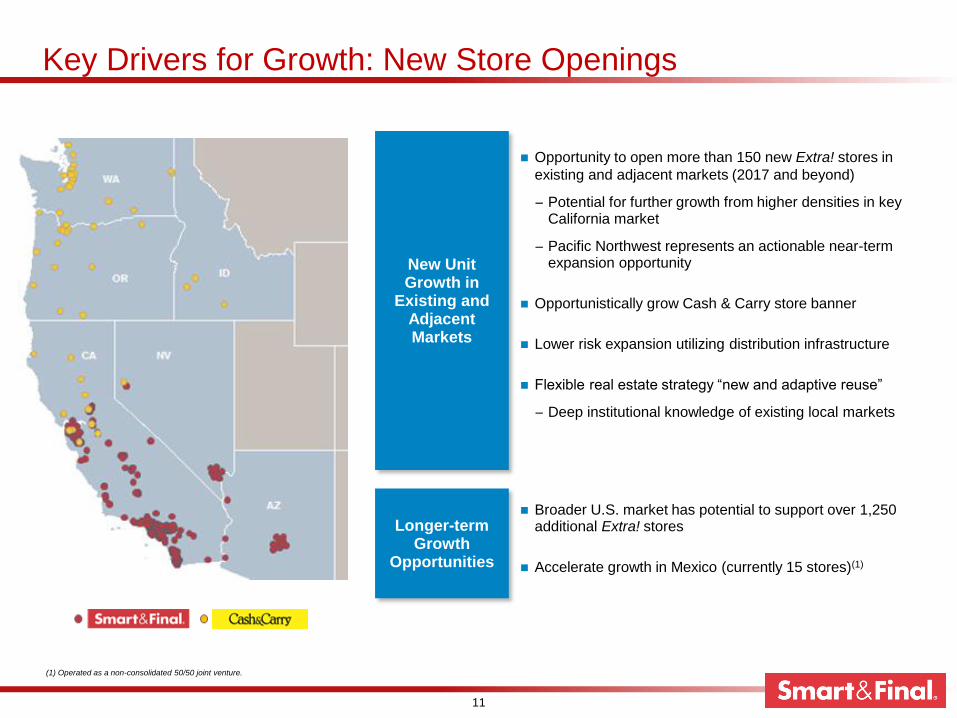
New Unit Growth in
Existing and Adjacent Markets
Longer-term Growth
Opportunities
Broader U.S. market has potential to support over 1,250 additional Extra! stores
Accelerate growth in Mexico (currently 15 stores)(1)
Opportunity to open more than 150 new Extra! stores in
existing and adjacent markets (2017 and beyond)
− Potential for further growth from higher densities in key California market
− Pacific Northwest represents an actionable near-term expansion opportunity
Opportunistically grow Cash & Carry store banner
Lower risk expansion utilizing distribution infrastructure
Flexible real estate strategy “new and adaptive reuse”
− Deep institutional knowledge of existing local markets
(1) Operated as a non-consolidated 50/50 joint venture.
Attractive New Store Economics
12
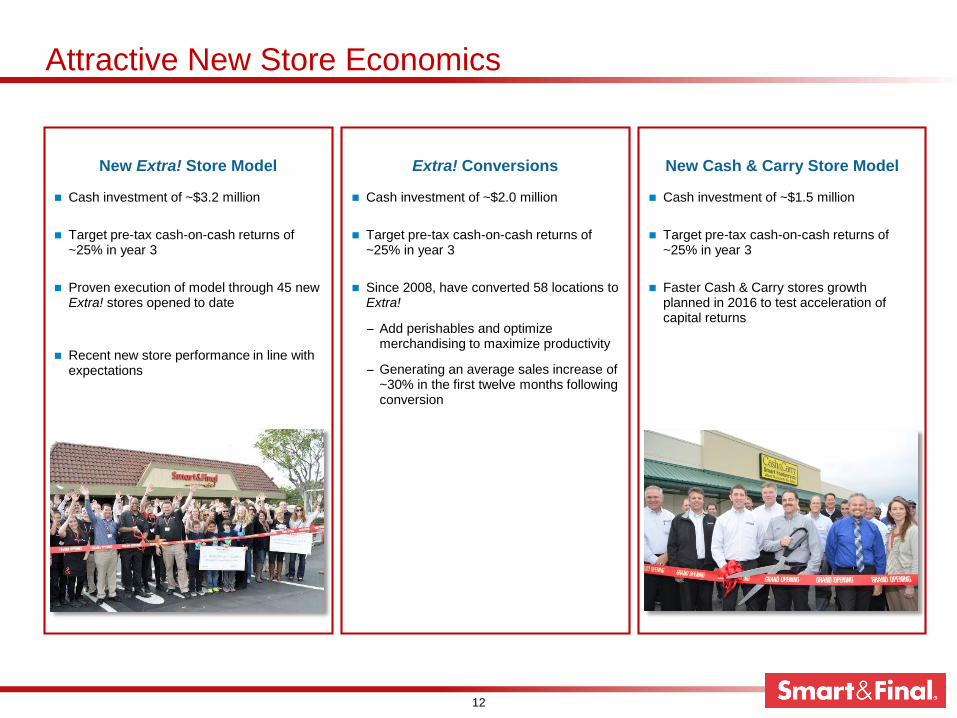
Extra! Conversions New Cash & Carry Store ModelNew Extra! Store Model
Cash investment of ~$1.5 million
Target pre-tax cash-on-cash returns of ~25% in year 3
Faster Cash & Carry stores growth planned in 2016 to test acceleration of capital returns
Cash investment of ~$2.0 million
Target pre-tax cash-on-cash returns of ~25% in year 3
Since 2008, have converted 58 locations to Extra!
− Add perishables and optimize merchandising to maximize productivity
− Generating an average sales increase of ~30% in the first twelve months following conversion
Cash investment of ~$3.2 million
Target pre-tax cash-on-cash returns of ~25% in year 3
Proven execution of model through 45 new Extra! stores opened to date
Recent new store performance in line with expectations
Accelerating Growth in 2016: Overview of Haggen Transaction
13
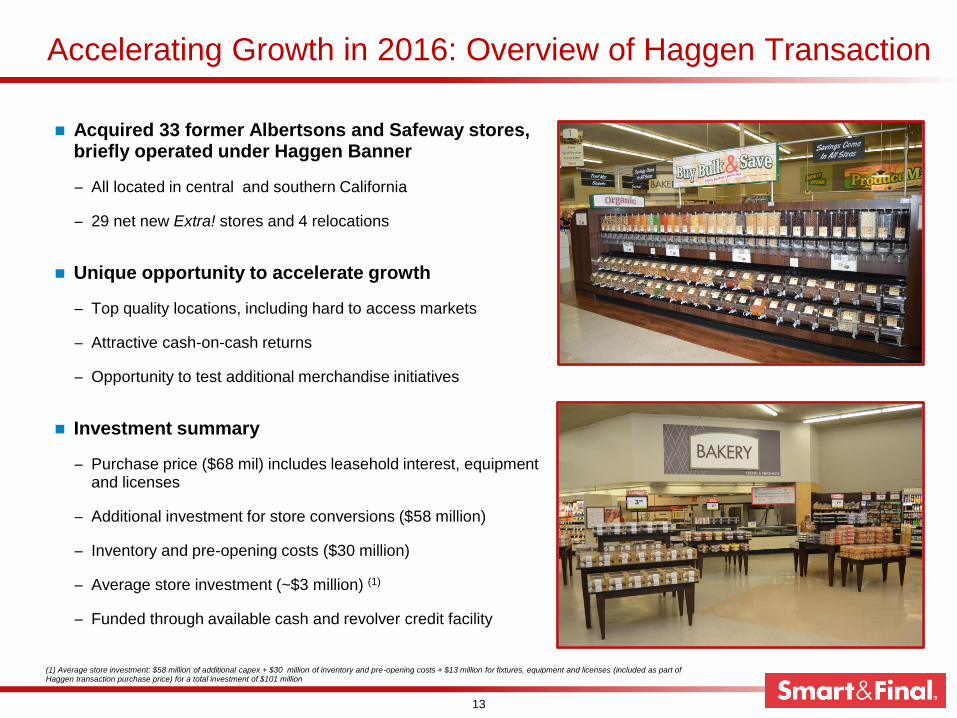
Acquired 33 former Albertsons and Safeway stores, briefly operated under Haggen Banner
− All located in central and southern California
− 29 net new Extra! stores and 4 relocations
Unique opportunity to accelerate growth
− Top quality locations, including hard to access markets
− Attractive cash-on-cash returns
− Opportunity to test additional merchandise initiatives
Investment summary
− Purchase price ($68 mil) includes leasehold interest, equipment and licenses
− Additional investment for store conversions ($58 million)
− Inventory and pre-opening costs ($30 million)
− Average store investment (~$3 million) (1)
− Funded through available cash and revolver credit facility
(1) Average store investment: $58 million of additional capex + $30 million of inventory and pre-opening costs + $13 million for fixtures, equipment and licenses (included as part of Haggen transaction purchase price) for a total investment of $101 million
Efficient and Scalable Distribution Network
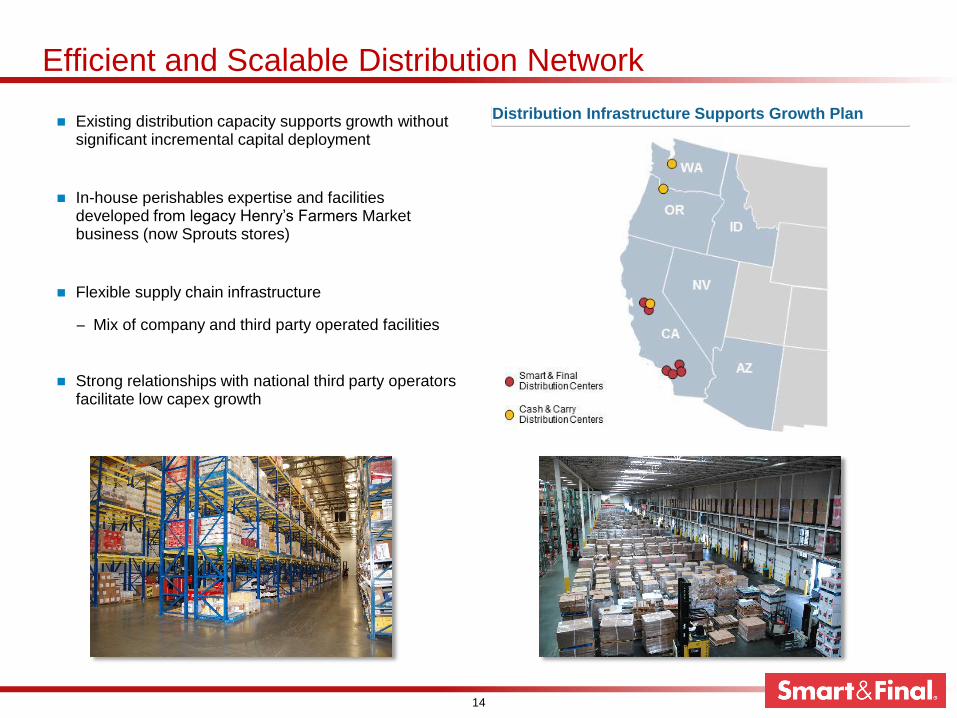
Existing distribution capacity supports growth without significant incremental capital deployment
In-house perishables expertise and facilities developed from legacy Henry’s Farmers Market business (now Sprouts stores)
Flexible supply chain infrastructure
− Mix of company and third party operated facilities
Strong relationships with national third party operators facilitate low capex growth
14
Distribution Infrastructure Supports Growth Plan
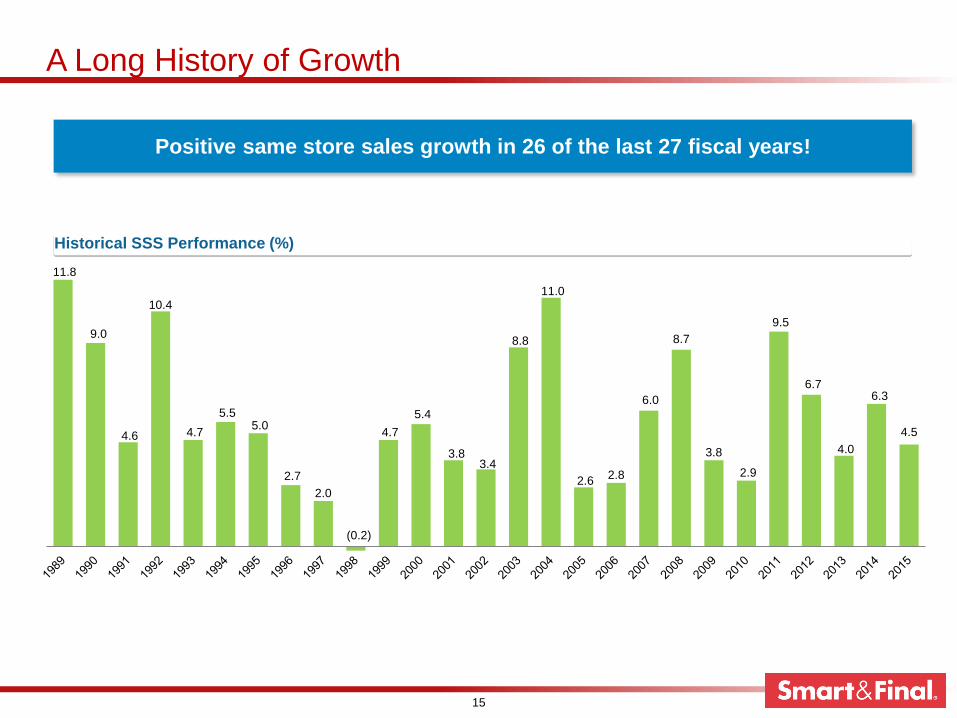
11.8
9.0
4.6
10.4
4.7
5.5 5.0
2.7
2.0
(0.2)
4.7
5.4
3.8 3.4
8.8
11.0
2.6 2.8
6.0
8.7
3.8
2.9
9.5
6.7
4.0
6.3
4.5
A Long History of Growth
Historical SSS Performance (%)
Positive same store sales growth in 26 of the last 27 fiscal years!
15
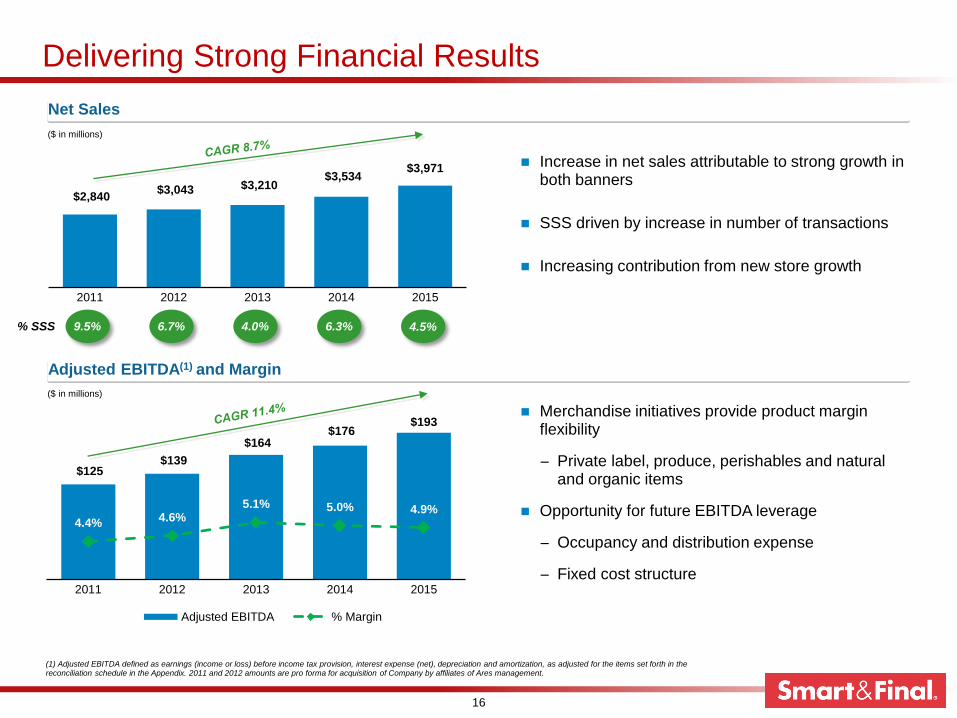
Delivering Strong Financial Results
16
(1) Adjusted EBITDA defined as earnings (income or loss) before income tax provision, interest expense (net), depreciation and amortization, as adjusted for the items set forth in the reconciliation schedule in the Appendix. 2011 and 2012 amounts are pro forma for acquisition of Company by affiliates of Ares management.
$125 $139
$164 $176
$193
4.4% 4.6% 5.1% 5.0% 4.9%
2011 2012 2013 2014 2015
Adjusted EBITDA % Margin
Net Sales
$2,840 $3,043 $3,210
$3,534 $3,971
2011 2012 2013 2014 2015
($ in millions)
Adjusted EBITDA(1) and Margin
% SSS 9.5% 6.7% 4.0%
($ in millions)
Increase in net sales attributable to strong growth in both banners
SSS driven by increase in number of transactions
Increasing contribution from new store growth
Merchandise initiatives provide product margin flexibility
− Private label, produce, perishables and natural and organic items
Opportunity for future EBITDA leverage
− Occupancy and distribution expense
− Fixed cost structure
6.3% 4.5%
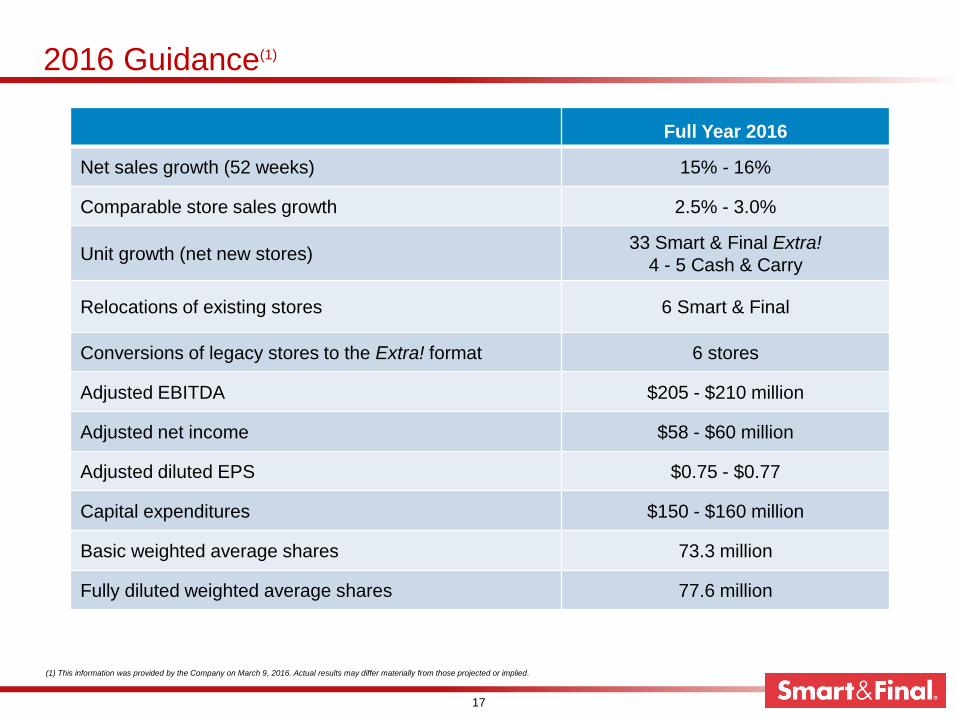
2016 Guidance(1)
17
(1) This information was provided by the Company on March 9, 2016. Actual results may differ materially from those projected or implied.
Full Year 2016
Net sales growth (52 weeks) 15% - 16%
Comparable store sales growth 2.5% - 3.0%
Unit growth (net new stores)33 Smart & Final Extra!
4 - 5 Cash & Carry
Relocations of existing stores 6 Smart & Final
Conversions of legacy stores to the Extra! format 6 stores
Adjusted EBITDA $205 - $210 million
Adjusted net income $58 - $60 million
Adjusted diluted EPS $0.75 - $0.77
Capital expenditures $150 - $160 million
Basic weighted average shares 73.3 million
Fully diluted weighted average shares 77.6 million
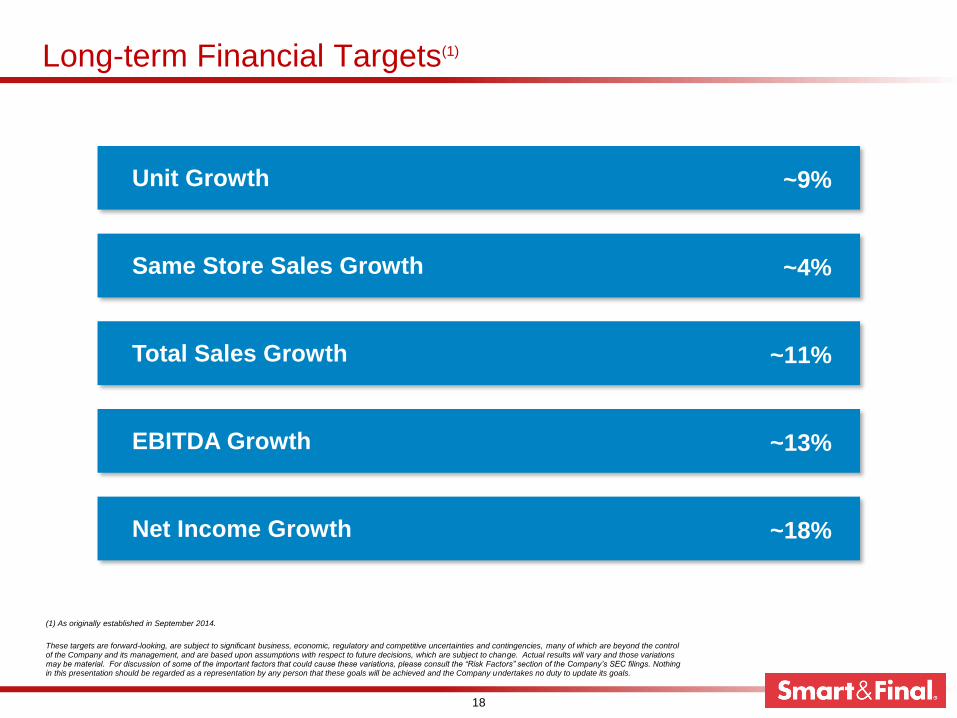
Long-term Financial Targets(1)
Unit Growth ~9%
Same Store Sales Growth ~4%
Total Sales Growth ~11%
EBITDA Growth ~13%
Net Income Growth ~18%
18
These targets are forward-looking, are subject to significant business, economic, regulatory and competitive uncertainties and contingencies, many of which are beyond the control of the Company and its management, and are based upon assumptions with respect to future decisions, which are subject to change. Actual results will vary and those variations may be material. For discussion of some of the important factors that could cause these variations, please consult the “Risk Factors” section of the Company’s SEC filings. Nothing in this presentation should be regarded as a representation by any person that these goals will be achieved and the Company undertakes no duty to update its goals.
(1) As originally established in September 2014.
What Makes Us Different?
19
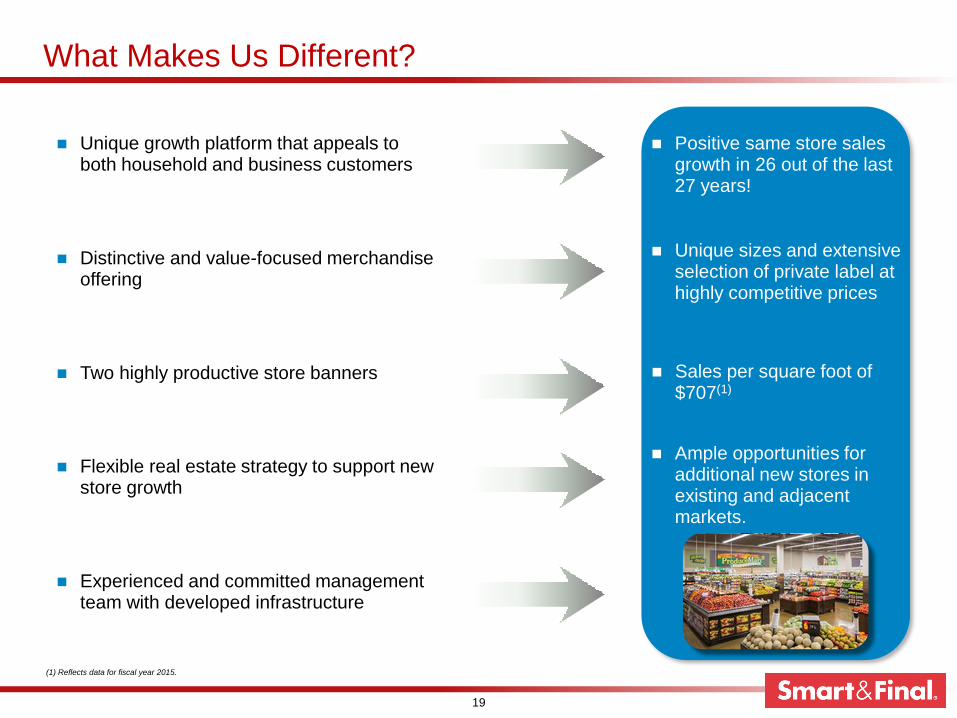
Unique growth platform that appeals to both household and business customers
Distinctive and value-focused merchandise offering
Flexible real estate strategy to support new store growth
Experienced and committed management team with developed infrastructure
Two highly productive store banners
Positive same store sales growth in 26 out of the last 27 years!
Unique sizes and extensive selection of private label at highly competitive prices
Ample opportunities for additional new stores in existing and adjacent markets.
Sales per square foot of $707(1)
(1) Reflects data for fiscal year 2015.
Appendix
20
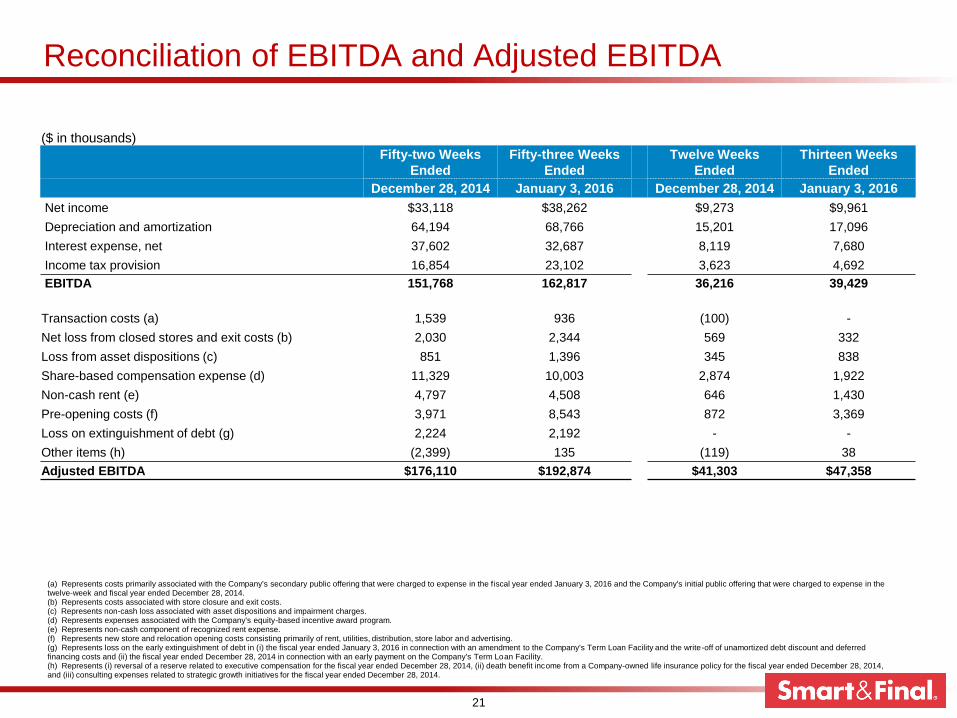
Reconciliation of EBITDA and Adjusted EBITDA
(a) Represents costs primarily associated with the Company's secondary public offering that were charged to expense in the f iscal year ended January 3, 2016 and the Company's initial public offering that were charged to expense in the twelve-week and fiscal year ended December 28, 2014.(b) Represents costs associated with store closure and exit costs.(c) Represents non-cash loss associated with asset dispositions and impairment charges.(d) Represents expenses associated with the Company's equity-based incentive award program.(e) Represents non-cash component of recognized rent expense.(f) Represents new store and relocation opening costs consisting primarily of rent, utilities, distribution, store labor and advertising.(g) Represents loss on the early extinguishment of debt in (i) the fiscal year ended January 3, 2016 in connection with an amendment to the Company's Term Loan Facility and the write-off of unamortized debt discount and deferred financing costs and (ii) the fiscal year ended December 28, 2014 in connection with an early payment on the Company's Term Loan Facility.(h) Represents (i) reversal of a reserve related to executive compensation for the fiscal year ended December 28, 2014, (ii) death benefit income from a Company-owned life insurance policy for the fiscal year ended December 28, 2014, and (iii) consulting expenses related to strategic growth initiatives for the fiscal year ended December 28, 2014.
($ in thousands)
Fifty-two Weeks
Ended
Fifty-three Weeks
Ended
Twelve Weeks
Ended
Thirteen Weeks
Ended
December 28, 2014 January 3, 2016 December 28, 2014 January 3, 2016
Net income $33,118 $38,262 $9,273 $9,961
Depreciation and amortization 64,194 68,766 15,201 17,096
Interest expense, net 37,602 32,687 8,119 7,680
Income tax provision 16,854 23,102 3,623 4,692
EBITDA 151,768 162,817 36,216 39,429
Transaction costs (a) 1,539 936 (100) -
Net loss from closed stores and exit costs (b) 2,030 2,344 569 332
Loss from asset dispositions (c) 851 1,396 345 838
Share-based compensation expense (d) 11,329 10,003 2,874 1,922
Non-cash rent (e) 4,797 4,508 646 1,430
Pre-opening costs (f) 3,971 8,543 872 3,369
Loss on extinguishment of debt (g) 2,224 2,192 - -
Other items (h) (2,399) 135 (119) 38
Adjusted EBITDA $176,110 $192,874 $41,303 $47,358
21
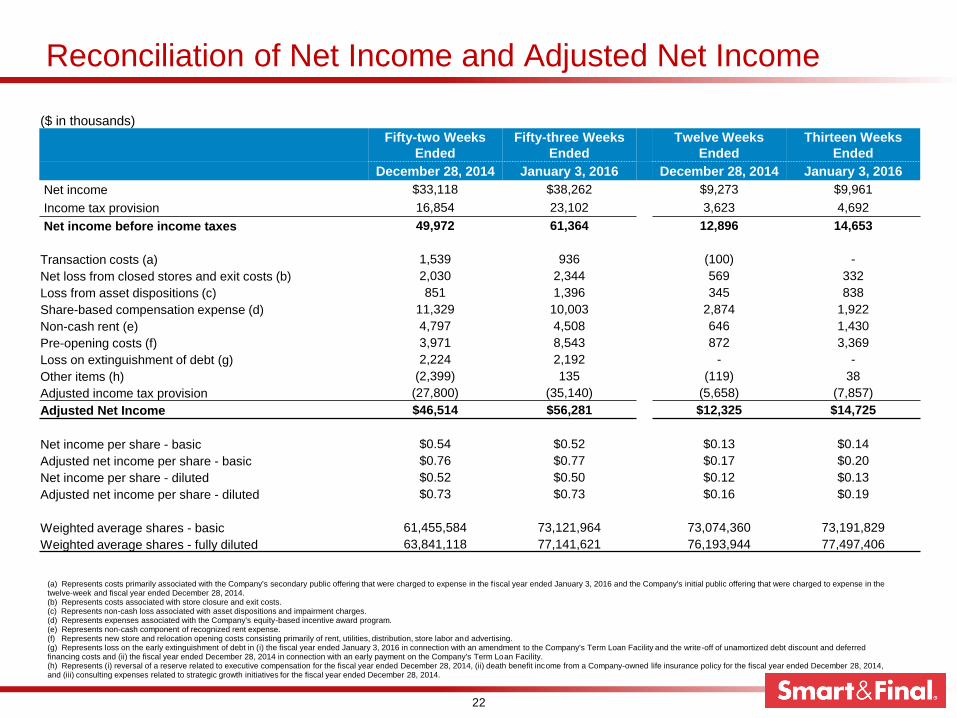
Reconciliation of Net Income and Adjusted Net Income
($ in thousands)
Fifty-two Weeks
Ended
Fifty-three Weeks
Ended
Twelve Weeks
Ended
Thirteen Weeks
Ended
December 28, 2014 January 3, 2016 December 28, 2014 January 3, 2016
Net income $33,118 $38,262 $9,273 $9,961
Income tax provision 16,854 23,102 3,623 4,692
Net income before income taxes 49,972 61,364 12,896 14,653
Transaction costs (a) 1,539 936 (100) -
Net loss from closed stores and exit costs (b) 2,030 2,344 569 332
Loss from asset dispositions (c) 851 1,396 345 838
Share-based compensation expense (d) 11,329 10,003 2,874 1,922
Non-cash rent (e) 4,797 4,508 646 1,430
Pre-opening costs (f) 3,971 8,543 872 3,369
Loss on extinguishment of debt (g) 2,224 2,192 - -
Other items (h) (2,399) 135 (119) 38
Adjusted income tax provision (27,800) (35,140) (5,658) (7,857)
Adjusted Net Income $46,514 $56,281 $12,325 $14,725
Net income per share - basic $0.54 $0.52 $0.13 $0.14
Adjusted net income per share - basic $0.76 $0.77 $0.17 $0.20
Net income per share - diluted $0.52 $0.50 $0.12 $0.13
Adjusted net income per share - diluted $0.73 $0.73 $0.16 $0.19
Weighted average shares - basic 61,455,584 73,121,964 73,074,360 73,191,829
Weighted average shares - fully diluted 63,841,118 77,141,621 76,193,944 77,497,406
22
(a) Represents costs primarily associated with the Company's secondary public offering that were charged to expense in the f iscal year ended January 3, 2016 and the Company's initial public offering that were charged to expense in the twelve-week and fiscal year ended December 28, 2014.(b) Represents costs associated with store closure and exit costs.(c) Represents non-cash loss associated with asset dispositions and impairment charges.(d) Represents expenses associated with the Company's equity-based incentive award program.(e) Represents non-cash component of recognized rent expense.(f) Represents new store and relocation opening costs consisting primarily of rent, utilities, distribution, store labor and advertising.(g) Represents loss on the early extinguishment of debt in (i) the fiscal year ended January 3, 2016 in connection with an amendment to the Company's Term Loan Facility and the write-off of unamortized debt discount and deferred financing costs and (ii) the fiscal year ended December 28, 2014 in connection with an early payment on the Company's Term Loan Facility.(h) Represents (i) reversal of a reserve related to executive compensation for the fiscal year ended December 28, 2014, (ii) death benefit income from a Company-owned life insurance policy for the fiscal year ended December 28, 2014, and (iii) consulting expenses related to strategic growth initiatives for the fiscal year ended December 28, 2014.
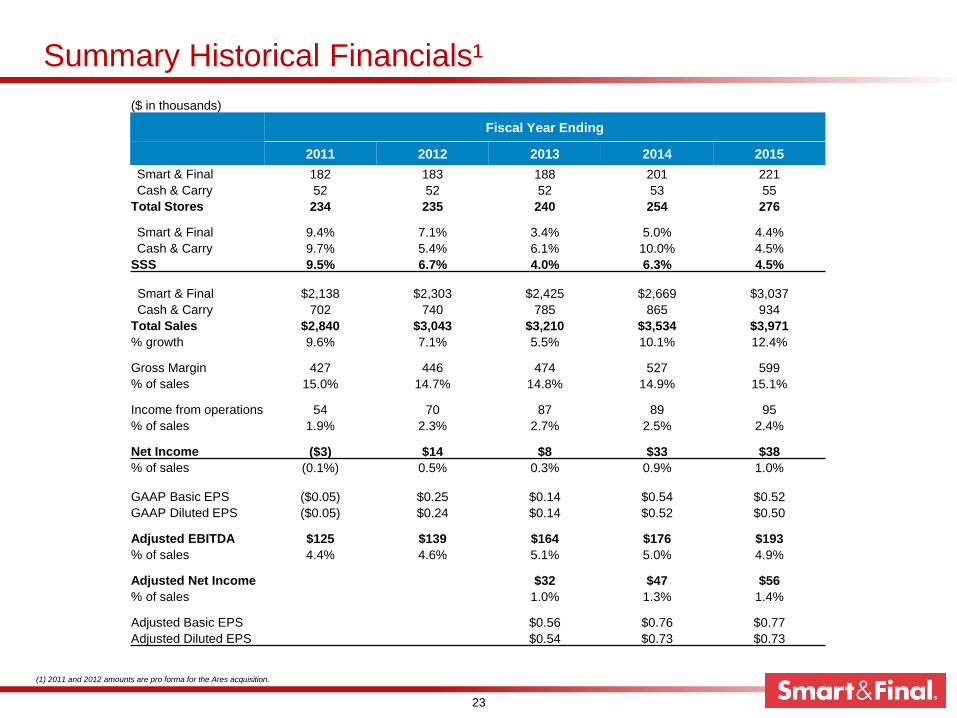
Summary Historical Financials¹
($ in thousands)
Fiscal Year Ending
2011 2012 2013 2014 2015
Smart & Final 182 183 188 201 221
Cash & Carry 52 52 52 53 55
Total Stores 234 235 240 254 276
Smart & Final 9.4% 7.1% 3.4% 5.0% 4.4%
Cash & Carry 9.7% 5.4% 6.1% 10.0% 4.5%
SSS 9.5% 6.7% 4.0% 6.3% 4.5%
Smart & Final $2,138 $2,303 $2,425 $2,669 $3,037
Cash & Carry 702 740 785 865 934
Total Sales $2,840 $3,043 $3,210 $3,534 $3,971
% growth 9.6% 7.1% 5.5% 10.1% 12.4%
Gross Margin 427 446 474 527 599
% of sales 15.0% 14.7% 14.8% 14.9% 15.1%
Income from operations 54 70 87 89 95
% of sales 1.9% 2.3% 2.7% 2.5% 2.4%
Net Income ($3) $14 $8 $33 $38
% of sales (0.1%) 0.5% 0.3% 0.9% 1.0%
GAAP Basic EPS ($0.05) $0.25 $0.14 $0.54 $0.52
GAAP Diluted EPS ($0.05) $0.24 $0.14 $0.52 $0.50
Adjusted EBITDA $125 $139 $164 $176 $193
% of sales 4.4% 4.6% 5.1% 5.0% 4.9%
Adjusted Net Income $32 $47 $56
% of sales 1.0% 1.3% 1.4%
Adjusted Basic EPS $0.56 $0.76 $0.77
Adjusted Diluted EPS $0.54 $0.73 $0.73
(1) 2011 and 2012 amounts are pro forma for the Ares acquisition.
23
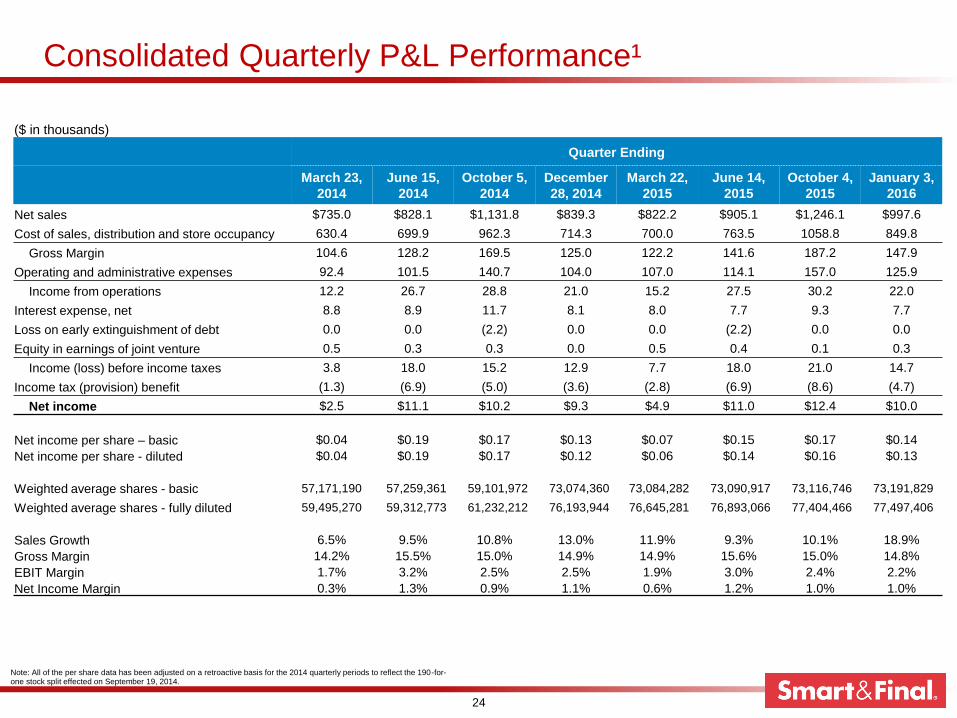
Consolidated Quarterly P&L Performance¹
Note: All of the per share data has been adjusted on a retroactive basis for the 2014 quarterly periods to reflect the 190-for-one stock split effected on September 19, 2014.
($ in thousands)
Quarter Ending
March 23,
2014
June 15,
2014
October 5,
2014
December
28, 2014
March 22,
2015
June 14,
2015
October 4,
2015
January 3,
2016
Net sales $735.0 $828.1 $1,131.8 $839.3 $822.2 $905.1 $1,246.1 $997.6
Cost of sales, distribution and store occupancy 630.4 699.9 962.3 714.3 700.0 763.5 1058.8 849.8
Gross Margin 104.6 128.2 169.5 125.0 122.2 141.6 187.2 147.9
Operating and administrative expenses 92.4 101.5 140.7 104.0 107.0 114.1 157.0 125.9
Income from operations 12.2 26.7 28.8 21.0 15.2 27.5 30.2 22.0
Interest expense, net 8.8 8.9 11.7 8.1 8.0 7.7 9.3 7.7
Loss on early extinguishment of debt 0.0 0.0 (2.2) 0.0 0.0 (2.2) 0.0 0.0
Equity in earnings of joint venture 0.5 0.3 0.3 0.0 0.5 0.4 0.1 0.3
Income (loss) before income taxes 3.8 18.0 15.2 12.9 7.7 18.0 21.0 14.7
Income tax (provision) benefit (1.3) (6.9) (5.0) (3.6) (2.8) (6.9) (8.6) (4.7)
Net income $2.5 $11.1 $10.2 $9.3 $4.9 $11.0 $12.4 $10.0
Net income per share – basic $0.04 $0.19 $0.17 $0.13 $0.07 $0.15 $0.17 $0.14
Net income per share - diluted $0.04 $0.19 $0.17 $0.12 $0.06 $0.14 $0.16 $0.13
Weighted average shares - basic 57,171,190 57,259,361 59,101,972 73,074,360 73,084,282 73,090,917 73,116,746 73,191,829
Weighted average shares - fully diluted 59,495,270 59,312,773 61,232,212 76,193,944 76,645,281 76,893,066 77,404,466 77,497,406
Sales Growth 6.5% 9.5% 10.8% 13.0% 11.9% 9.3% 10.1% 18.9%
Gross Margin 14.2% 15.5% 15.0% 14.9% 14.9% 15.6% 15.0% 14.8%
EBIT Margin 1.7% 3.2% 2.5% 2.5% 1.9% 3.0% 2.4% 2.2%
Net Income Margin 0.3% 1.3% 0.9% 1.1% 0.6% 1.2% 1.0% 1.0%
24