SFMTA SHORT RANGE TRANSIT PLAN · In addition, Communications & Marketing, Government Affairs, and...
158
DRAFT SFMTA Short Range Transit Plan 1 SFMTA SHORT RANGE TRANSIT PLAN Fiscal Year 2017 – Fiscal Year 2030 Draft for MTC Review, July 29, 2016 Federal transportation statutes require that the Metropolitan Transportation Commission (MTC), in partnership with state and local agencies, develop and periodically update a long-range Regional Transportation Plan (RTP), and a Transportation Improvement Program (TIP) which implements the RTP by programming federal funds to transportation projects contained in the RTP. In order to effectively execute these planning and programming responsibilities, MTC requires that each transit operator in its region which receives federal funding through the TIP, prepare, adopt and submit to MTC a Short Range Transit Plan (SRTP). The preparation of this report has been funded in part by a grant from the U.S. Department of Transportation (DOT) through section 5303 of the Federal Transit Act. The contents of this SRTP reflect the views of the San Francisco Municipal Transportation Agency, and not necessarily those of the Federal Transit Administration (FTA) or MTC. San Francisco Municipal Transportation Agency is solely responsible for the accuracy of the information presented in this SRTP. Anticipated approval by the SFMTA Board of Directors: Late 2016
Transcript of SFMTA SHORT RANGE TRANSIT PLAN · In addition, Communications & Marketing, Government Affairs, and...

DRAFT SFMTA Short Range Transit Plan 1
SFMTA SHORT RANGE TRANSIT PLAN
Fiscal Year 2017 – Fiscal Year 2030 Draft for MTC Review, July 29, 2016
Federal transportation statutes require that the Metropolitan Transportation Commission
(MTC), in partnership with state and local agencies, develop and periodically update a
long-range Regional Transportation Plan (RTP), and a Transportation Improvement
Program (TIP) which implements the RTP by programming federal funds to
transportation projects contained in the RTP. In order to effectively execute these
planning and programming responsibilities, MTC requires that each transit operator in
its region which receives federal funding through the TIP, prepare, adopt and submit to
MTC a Short Range Transit Plan (SRTP).
The preparation of this report has been funded in part by a grant from the U.S.
Department of Transportation (DOT) through section 5303 of the Federal Transit Act.
The contents of this SRTP reflect the views of the San Francisco Municipal
Transportation Agency, and not necessarily those of the Federal Transit Administration
(FTA) or MTC. San Francisco Municipal Transportation Agency is solely responsible for
the accuracy of the information presented in this SRTP.
Anticipated approval by the SFMTA Board of Directors: Late 2016

DRAFT SFMTA Short Range Transit Plan 2
TABLE OF CONTENTS
OVERVIEW OF THE SFMTA TRANSIT SYSTEM
Brief History ..................................................................................................................... 4
Governance ..................................................................................................................... 6
Transit Services ............................................................................................................ 15
Overview of the Revenue Fleet ..................................................................................... 26
Existing Facilities ........................................................................................................... 28
SFMTA GOALS, OBJECTIVES & STANDARDS
The SFMTA Strategic Plan ............................................................................................ 49
FY 2013 – FY 2018 Strategic Plan Elements ................................................................ 51
SERVICE & SYSTEM EVALUATION
SFMTA Performance Measures .................................................................................... 53
Current Systemwide Performance ................................................................................ 64
Muni Transit Service Structure ...................................................................................... 72
Muni Service Equity Policy ............................................................................................ 74
Equipment & Facilities ................................................................................................... 76
MTC Community-Based Transportation Planning Program .......................................... 77
Paratransit Services ...................................................................................................... 78
Title VI Analysis & Report .............................................................................................. 80
FTA Triennial Review .................................................................................................... 80
OPERATIONS PLAN & BUDGET
Operations Plan ............................................................................................................ 85
Operations Budget ........................................................................................................ 89
CAPITAL FINANCIAL PLAN
SFMTA Capital Planning Goals, Policies & Processes ................................................. 96
SFMTA Capital Financial Plan, FY 2017 – FY 2026 ..................................................... 97

DRAFT SFMTA Short Range Transit Plan 3
Transit Capital Programs ............................................................................................. 101
Other SFMTA Capital Programs ................................................................................. 136
MAJOR EXPANSION PROJECTS
Central Subway ........................................................................................................... 144
Van Ness Bus Rapid Transit Project ........................................................................... 152
DRAFT SFMTA Short Range Transit Plan 4
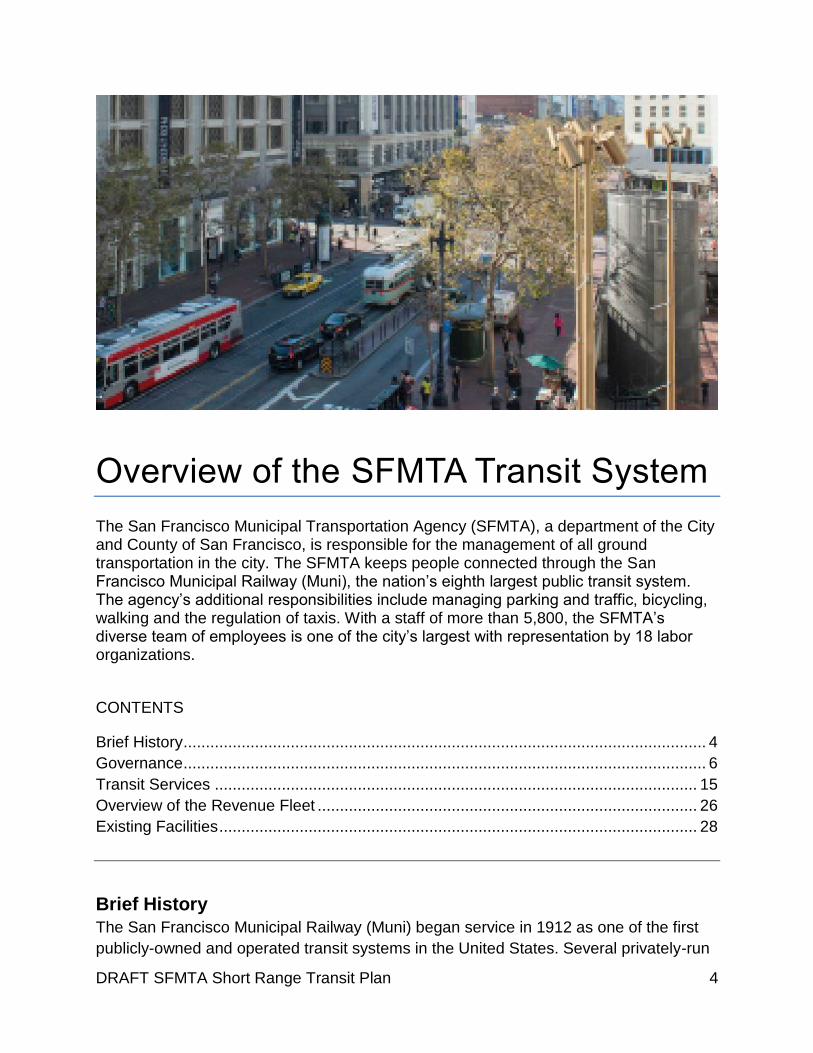
Overview of the SFMTA Transit System
The San Francisco Municipal Transportation Agency (SFMTA), a department of the City and County of San Francisco, is responsible for the management of all ground transportation in the city. The SFMTA keeps people connected through the San Francisco Municipal Railway (Muni), the nation’s eighth largest public transit system. The agency’s additional responsibilities include managing parking and traffic, bicycling, walking and the regulation of taxis. With a staff of more than 5,800, the SFMTA’s diverse team of employees is one of the city’s largest with representation by 18 labor organizations.
CONTENTS
Brief History ..................................................................................................................... 4
Governance ..................................................................................................................... 6
Transit Services ............................................................................................................ 15
Overview of the Revenue Fleet ..................................................................................... 26
Existing Facilities ........................................................................................................... 28
Brief History
The San Francisco Municipal Railway (Muni) began service in 1912 as one of the first
publicly-owned and operated transit systems in the United States. Several privately-run

DRAFT SFMTA Short Range Transit Plan 5
transit systems had operated in San Francisco following the Civil War and were still in
operation in San Francisco at the time. In 1944, Muni merged with the Market Street
Railway Company to triple the size of its system, and the 1952 acquisition of the
California Street Cable Railroad resulted in municipal ownership of all transit service in
San Francisco.
In 1999, San Francisco voters approved Proposition E, which amended the City Charter
to merge Muni with the city’s Department of Parking and Traffic (DPT). Integration of the
two organizations into the SFMTA took place in 2002, creating a multimodal
transportation agency to operate transit service, manage city streets, and advance the
city’s Transit First Policy (Section 8A.115). Since then, the SFMTA has continued to
evolve by merging with the Taxi Commission in March 2009.
While some of the facilities like the Presidio Division have been in use since the early
days of Muni, the fleet and facilities have changed and expanded over the years to
serve the growing city. The SFMTA currently runs transit service 24 hours a day, seven
days a week, providing over 700,000 transit trips each weekday on its fleet of cable
cars, historic streetcars, motor coaches, trolley coaches, and light rail vehicles.

DRAFT SFMTA Short Range Transit Plan 6
Governance
The SFMTA is a department of the City and County of San Francisco. As established in
Proposition E in 1999, it is governed by a seven-member Board of Directors that
provides policy oversight for the agency, including approval of its budget, contracts, and
proposed changes of fares, fees and fines. The SFMTA Board also has the authority to
appoint the Director of Transportation and serves as ex-officio members of the San
Francisco Parking Authority.
The SFMTA Board of Directors is appointed by the mayor and confirmed by the San
Francisco Board of Supervisors after a public hearing. Directors serve up to three four-
year, fixed, staggered terms, and continue to serve until they resign, are replaced, or
when the term expires. At least four of the Directors must be regular riders of public
transit and must continue to be regular riders during their terms. The directors must
possess significant knowledge of, or professional experience in, one or more of the
fields of government, finance, or labor relations. At least two of the directors must
possess significant knowledge of, or professional experience in, the field of public
transportation. During their terms, all directors are required to ride the system on the
average of once a week. At the first regular meeting of the SFMTA Board after the 15th
day of January each year, the members of the board elect from among their number a
chairman and vice-chairman.
Tom Nolan, Chairman of the Board, Appointed to the Board in 2006; Elected Chairman in
2009.
Cheryl Brinkman, Vice-Chairman of the Board, Appointed to the Board in 2010; Elected
Vice-Chairman in 2012.
Gwyneth Borden, Member of the Board, Appointed to the Board in 2014.

DRAFT SFMTA Short Range Transit Plan 7
Malcolm A. Heinicke, Member of the Board, Appointed to the Board in 2008.
Lee Hsu, Member of the Board, Appointed to the Board in 2016.
Joél Ramos, Member of the Board, Appointed to the Board in 2011.
Cristina Rubke, Member of the Board, Appointed to the Board in 2012.

DRAFT SFMTA Short Range Transit Plan 8
SFMTA Citizens’ Advisory Council
The SFMTA Citizens’ Advisory Council (CAC) is an advisory body to the SFMTA and
was created by Proposition E. The CAC meets monthly to provide recommendations to
staff and the Board of Directors with respect to any matter within the jurisdiction of the
agency. It is composed of fifteen members appointed by the Mayor and the Board of
Supervisors. There are three CAC subcommittees: Engineering, Maintenance & Safety,
Finance & Administration, and Operations & Customer Service.
FIGURE 2: SFMTA ORGANIZATION CHART, AS OF JANUARY 2016
PLACEHOLDER ORG CHART BELOW. TO BE REVISED

DRAFT SFMTA Short Range Transit Plan 9
Organizational Structure
In addition to the organizational change that occurred with the merger of Muni and DPT,
the SFMTA underwent further reorganization in 2012 to improve delivery of transit,
street design, planning, parking and traffic services. The SFMTA currently consists of
seven main divisions: Capital Programs & Construction, Finance & Information
Technology, Human Resources, Sustainable Streets, System Safety, Taxis &
Accessible Services, and Transit. In addition, Communications & Marketing,
Government Affairs, and the Central Subway Program also report directly to the Director
of Transportation.
Capital Programs & Construction Division (CP&C). The CP&C Division improves the
city’s transportation infrastructure by designing and delivering large-scale engineering
and construction projects.
Finance & Information Technology Division (FIT).The FIT Division is responsible for
managing the agency’s finances, collecting fare revenues, leveraging information
technology and effectively utilizing resources to maximize the financial, technological,
and physical ability and capacity of the SFMTA.
Human Resources Division (HR). SFMTA HR enables the agency to accomplish its goals
by supplying necessary support services that include: recruitment, hiring, employment
and labor relations, payroll, organizational development and training, employee
wellness, equal employment opportunity, and workers’ compensation.
Sustainable Streets Division (SSD). The Sustainable Streets Division provides multimodal
transportation planning and engineering to improve San Francisco’s transportation
system and support sustainable community and economic development. SSD also
manages 38 parking facilities, enforces San Francisco’s parking regulations, and
enforces compliance of transit fare payment. The Division also oversees the dedicated
services provided by the San Francisco Police Department Traffic Division.
System Safety Division. This division is responsible for providing a safe environment for
riders, employees, and the citizens of the City and County of San Francisco. It
maintains a safety program that attains an optimum level of safety and environmental
compliance, including: maintaining records for all collision, incidents and hazards;
conducting internal safety audits and vehicle safety reviews; developing corrective
action plans; and performing inspections and mandated safety certifications.
Taxis & Accessible Services (TAS). TAS represents a combination of two distinct
functions of the SFMTA that substantially overlap in the regulation of the taxi mode of
transportation.

DRAFT SFMTA Short Range Transit Plan 10
Taxi Services is charged with licensing and regulating the private taxi industry to ensure
the safety of the riding public, drivers, and vehicles. TAS also ensures that taxi service
is universally accessible regardless of trip origin or destination, without illegal
discrimination, at prices that are transparent, uniform and accessible to low- and fixed-
income customers, and that there is an adequate supply of taxicabs to meet
transportation demand.
Accessible Services is charged with ensuring Americans with Disabilities Act (ADA)
compliance for the entire agency and providing technical assistance on accessibility to
all areas of the agency’s work, e.g. fixed route transit, capital projects, parking, bicycle,
and pedestrian projects. Accessible Services also operates San Francisco’s Regional
Transit Connection Discount Card (RTC) office and oversees the provision of
Paratransit services. All taxis in San Francisco are required to participate in the SF
Paratransit Program.
Transit Division (Muni). The Transit Division (Muni) provides safe, reliable, clean,
accessible, and convenient public transit service throughout San Francisco. In addition
to the planning, scheduling, and delivery of transit operations and services, this division
also maintains the fleet, facilities, and infrastructure needed to deliver Muni services.
Table 1 provides a breakdown of the number of employees in each SFMTA Division,
including grant-funded positions, budgeted for FY 2014 – FY 2018. The largest groups
of employees at SFMTA are in the Transit and Sustainable Streets Divisions, as they
include the transit operators and enforcement personnel, respectively.
Table 1. Budgeted Positions by Division
SFMTA DIVISION FY 2014 FY 2015 FY 2016 FY 2017 FY 2018
Board of Directors 6 4 4 4 4
Capital Programs & Construction 169 156 159 200 214
Communications 18 23 26 43 44
Executive Director 5 7 7 5 5
Finance & Information Technology 335 358 367 396 398
Government Affairs 3 5 5 5 6
Human Resources 135 76 155 168 169
System Safety 22 111 14 19 20
Sustainable Streets 773 687 689 708 700

DRAFT SFMTA Short Range Transit Plan 11
SFMTA DIVISION FY 2014 FY 2015 FY 2016 FY 2017 FY 2018
Transit 3,363 3,554 3,801 4,091 4,109
Taxis & Accessible Services 25 27 29 31 31
GRAND TOTAL* 4,854 5,008 5,256 5,670 5,700
* NOTE: Excludes unfunded positions FY 2015 49 FTEs and FY 2016 53 FTEs

DRAFT SFMTA Short Range Transit Plan 12
Contracted Transportation Services
The SFMTA Transit Division operates all fixed route Muni transit service in San
Francisco. The SFMTA also currently provides SF Paratransit Services through a
contract with Transdev, formerly called Veolia Transportation, and subcontractors
(Baymed Express, Centro Latino, Self Help for the Elderly, and Kimochi) to operate the
following paratransit services through the end of 2015:
SF Access – Americans with Disabilities Act (ADA)-mandated, door-to-door,
shared ride van service where riders must schedule trips one to seven days in
advance.
Group Van – Specialized van service that picks up and drops off groups of
individuals who will be going to the same agency/center. Trips are scheduled
with the agency/center and riders must be ADA eligible.
Shop-a-Round – A grocery shopping shuttle service that transports seniors and
persons with disabilities to grocery stores.
Van Gogh – a shuttle service for seniors and persons with disabilities to social
and cultural events in San Francisco. This service aims to reduce social isolation
of seniors and persons with disabilities.
In addition to these contracted services, all taxi companies in San Francisco are
required to participate in the SF Paratransit program by City ordinance. A user-side
subsidy is provided to Paratransit clients, who are issued a debit card to pay for their
paratransit taxi trips.

DRAFT SFMTA Short Range Transit Plan 13
Labor Unions
The SFMTA Employee & Labor Relations team works with the Labor Unions to
negotiate the agreements that determine the work rules and compensation packages for
approximately 5,000 employees. There are eight SFMTA Service-Critical and 10
Citywide labor agreements for 18 bargaining units within the SFMTA. All collective
bargaining agreements and memorandums of understanding for these labor unions are
available online: http://www.sfmta.com/about-sfmta/labor-relations/mouscbas
Table 2. SFMTA Collective Bargaining Agreements and Memorandums of
Understanding
LOCAL BRANCH LABOR UNION LENGTH OF CONTRACT
SFMTA Service-Critical Collective Bargaining Agreements/Memorandums of Understanding
Local 250-A (Transit Operators 9163)
Transport Workers’ Union (TWU)
July 1, 2014 - June 30, 2017
Local 250-A (Transit Fare Inspectors 9132)
July 1, 2014 - June 30, 2017
Local 250-A (Automotive Service Workers 7410)
July 1, 2015 - June 30, 2017
Local 200 July 1, 2016 - June 30, 2017
Local 6 International Brotherhood of Electrical Workers (IBEW)
July 1, 2014 - June 30, 2017
Local 1414 International Association of Machinists (IAM)
July 1, 2014 - June 30, 2017
Local 1021 Service Employees International Union (SEIU)
July 1, 2014 - June 30, 2017
Municipal Executives Association (MEA)
Municipal Executives Association (MEA)
July 1, 2014 - June 30, 2017
Citywide Collective Bargaining Agreements/Memorandums of Understanding applicable to SFMTA

DRAFT SFMTA Short Range Transit Plan 14
LOCAL BRANCH LABOR UNION LENGTH OF CONTRACT
The Northern California Carpenters Regional Council, Local 22 Glaziers, Architectural Metal and Glass Workers, Local 718 Sheet Metal Workers International Union, Local 104 Teamsters, Local 853
Consolidated Crafts July 1, 2014 – June 30, 2017
Local 21 International Federation of Professional & Technical Engineers (IFPTE)
July 1, 2014 – June 30, 2017
Local 261 Laborers International Union July 1, 2014 – June 30, 2017
Local 3 Operating Engineers July 1, 2014 – June 30, 2017
San Francisco City Workers United Painters July 1, 2014 – June 30, 2017
Local 1021 Service Employees International Union (SEIU)
July 1, 2014 – June 30, 2017
Local 39 Stationary Engineers July 1, 2014 – June 30, 2017
Local 856 Multi-Unit Teamsters July 1, 2014 – June 30, 2017
Local 38 United Association of Plumbers and Pipefitters
July 1, 2014 – June 30, 2017
NOTE: For those employees in job classifications not represented by a labor union or
employee organization, Section A8.409-1 of the City Charter has established working
schedules, conditions of employment, and methods of payment, effective July 1, 2013.

DRAFT SFMTA Short Range Transit Plan 15
Transit Services
As part of its mission, the SFMTA strives to provide excellent travel choices through a
convenient, reliable, accessible and safe transportation system that meets the needs of
people within the City and County of San Francisco. Based on the 2015 Travel Decision
Survey, 24% of all trips to, from and within San Francisco were by transit, including
those on regional transit systems.
The SFMTA operates Muni, the oldest and largest transit system in the San Francisco
Bay Area, providing over 40 percent of all transit trips in the region. In addition, it is the
eighth largest transit system in the nation based on boardings, carrying more than 225
million passengers annually. The Agency’s transit fleet is among the most diverse in the
world, featuring:
Clean Diesel and hybrid electric motor coaches
Electric trolley coaches
Modern light rail vehicles
A historic collection of streetcars from the U.S. and around the world
The nation’s only operating cable cars, listed as a U.S. National Historic
Landmark
A fleet of paratransit vehicles.
FIGURE 3. 2015 San Francisco Mode Split

DRAFT SFMTA Short Range Transit Plan 16
Muni Forward
Muni Forward aims to make getting around San Francisco safer and more reliable.
Informed by the Transit Effectiveness Project, SFMTA Strategic Plan Goals 2 & 3, and
extensive community input, Muni Forward’s route changes, service improvements, and
transit priority projects will help reallocate limited resources where they are needed
most to provide excellent transit service:
The Implementation of a Rapid & Transit Priority Network of core routes serving
nearly 70 percent of all riders are providing more reliable trips.
Updating Muni’s transit fleet and making important safety and accessibility
projects across the city, combined with the WalkFirst projects, are helping the
agency better accommodate the needs of families, seniors, and the people with
disabilities, and enhance comfort and safety for all our customers.
Using technology more effectively by improving the integration of our transit
system with traffic signals and bringing more real-time information to our
customers are making our transit system smarter, and more reliable.
In addition to capital improvements, Muni Forward also incorporates service changes
that better reflect current travel patterns. Muni offers end-to-end coverage of the city
that puts a Muni stop within a quarter mile of every San Francisco resident. This access
to bus and rail service allows customers to combine trips on routes and lines to get
anywhere in the city, mostly within reach of a short walk or minimal number of transfers.
To make it easier to navigate the transit system and more efficient to travel on our most
heavily used routes, the SFMTA has recently updated the service framework to define
the six types of Muni transit service. Muni will continue to provide specialized services
including express service, late evening “Owl” service, and special event trips to serve
sporting events, large festivals and other San Francisco activities.
Muni Forward Service Framework
In addition to identifying Rapid routes, the Muni service framework organizes all the
Muni transit routes into six principle types of transit service in the city:
Muni Metro & Rapid Bus (10 minutes or less & skip stop service): These heavily
used bus and rail lines form the backbone of the Muni system. With vehicles
arriving frequently and transit priority enhancements along the routes, the Rapid
network delivers speed and reliability whether customers are heading across
town, or simply traveling a few blocks.
Frequent Local (10 minutes or less service): These routes combined with Muni
Metro and Rapid Bus create the Rapid network. They provide high-quality,
frequent service but with more frequent stops along the route.

DRAFT SFMTA Short Range Transit Plan 17
Grid (12 - 30 minutes service): These citywide routes combine with the Rapid
Network to form an expansive core system that lets customers get to their
destinations with no more than a short walk, or a seamless transfer. Depending
on demand, they typically operate less frequently than the Rapid Network routes.
Connector (Over 30 minutes service): These bus routes predominantly circulate
through San Francisco’s hillside residential neighborhoods, filling in gaps in
coverage and connecting customers to major transit hubs.
Historic: Historic Streetcars and Cable Cars.
Specialized: These routes augment existing service during specific times of day
to serve a specific need, or serve travel demand related to special events. They
include AM and PM commute service, owl service, weekend-only service, and
special event trips to serve sporting events, large festivals, and other San
Francisco activities.
All residential neighborhoods in San Francisco are within a quarter of a
mile of a Muni bus or rail line stop.

DRAFT SFMTA Short Range Transit Plan 18
In conjunction with this modernization of transit service, the SFMTA updated the transit
service map to help customers navigate the network and identify the transit lines that
work best for them.
Although the Muni routes have been categorized by frequency and type of service, the
cost to ride remains consistent across all types of service, with the few exceptions of the
cable car and special event fares. Table 3 details the routes, types of services, areas
served, and the overall fare structure for all Muni service. Route-by-route maps, stops,
descriptions, and related projects available on www.sfmta.com.
Table 3. Muni Transit Service Type and Areas Served, as of May 2016.
TYPE OF TRANSIT SERVICE
MUNI ROUTES & AREAS SERVED
Fixed Route Service Transit Service
Muni Metro & Rapid Bus J Church, KT Ingleside/Third Street, L Taraval, M Ocean View, N Judah, 5R Fulton Rapid, 7R Haight/Noriega Rapid, 9R San Bruno Rapid, 14R Mission Rapid, 28R 19th Avenue Rapid, 38R Geary Rapid
Frequent Local 1 California, 7 Haight/Noriega, 8 Bayshore, 9 San Bruno, 14 Mission, 22 Fillmore, 28 19th Avenue, 30 Stockton, 38 Geary, 47 Van Ness, 49 Van Ness-Mission

DRAFT SFMTA Short Range Transit Plan 19
TYPE OF TRANSIT SERVICE
MUNI ROUTES & AREAS SERVED
Grid 2 Clement, 3 Jackson, 5 Fulton, 6 Haight/Parnassus, 9 San Bruno, 10 Townsend, 12 Folsom-Pacific, 18 46th Avenue, 19 Polk, 21 Hayes, 23 Monterey, 24 Divisadero, 27 Bryant, 29 Sunset, 31 Balboa, 33 Ashbury-18th St, 43 Masonic, 44 O’Shaughnessy, 45 Union/Stockton, 48 Quintara-24th St, 54 Felton, 55 Mission Bay Shuttle
Connector 11 Downtown Connector, 25 Treasure Island, 35 Eureka, 36 Teresita, 37 Corbett, 39 Coit, 52 Excelsior, 56 Rutland, 57 Park Merced, 66 Quintara, 67 Bernal Heights
Historic California Cable Car, Powell/Hyde Cable Car, Powell/Mason Cable Car, F Market & Wharves
Specialized (commuter express, shuttles & special events)
NX Judah Express, 1AX California A Express, 1BX California B Express, 7X Noriega Express, 8AX Bayshore A Express, 8BX Bayshore B Express, 14X Mission Express, 30X Marina Express, 31AX Balboa A Express, 31BX Balboa B Express, 38AX Geary A Express, 38BX Geary B Express, 41 Union, 76X Marin Headlands Express, 81X Caltrain Express, 82X Levi Plaza Express, 83X Mid-Market Express, 88 BART Shuttle
Supplemental Service Supplemental Muni service to middle and high schools in the City and County of San Francisco. Buses start at schools and continue on regularly scheduled routes.
Owl Service (late night transit service)
L Owl, N Owl, 5 Fulton, 14 Mission, 22 Fillmore, 24 Divisadero, 38 Geary, 44 O'Shaughnessy, 48 Quintara-24th Street, 90 San Bruno Owl, 9A Owl, 25 Treasure island
Accommodation of bicycles All hybrid, motor, and trolley coaches that run on the Rapid Frequent, Circulator, Commuter Express, Specialized, and Owl service routes are equipped with external bicycle racks on the front of the vehicle. Non-folding bikes are not allowed inside any Muni bus, streetcar, or other transit vehicle at any time. However, as of May 24, 2011, folding bicycles are allowed inside all Muni vehicles except cable cars. There is no extra charge for bicycles on transit vehicles

DRAFT SFMTA Short Range Transit Plan 20
TYPE OF TRANSIT SERVICE
MUNI ROUTES & AREAS SERVED
Demand Responsive Transit Service
Seniors and for persons with
disabilities, including service
required under the Americans
with Disabilities Act (ADA)
San Francisco Paratransit is a contracted van and taxi service provided 24 hours a day, 7 days a week, 365 days a year citywide for people unable to independently use or access public transit because of a disability or disabling health condition. Service is provided within San Francisco, to Treasure Island, to the northernmost part of Daly City in San Mateo County, and to Marin Headlands on weekends mirroring the Muni 76X-Marin Headlands line. ADA-certified persons who are visiting from outside San Francisco will be served by San Francisco Paratransit.
In addition to operating fixed route and demand responsive transit services in San
Francisco, the SFMTA coordinates with other transit service operators in the Bay Area
to provide connections to regional destinations. All connecting services use the Clipper
Card, and in some cases provide a discounted transfer to their system.
Table 4a. Regional Transit Service Type, Areas, and Fares
TRANSIT PROVIDER
AREAS SERVED TRANSFER STRUCTURE (as of January 1, 2016)
$0.50 discount off Adult Muni single ride fares paid on a Clipper Card are available to all connecting services provided by our partners.
Alameda Contra-Costa Transit District (AC Transit)
AC Transit operates accessible bus service between the Transbay Terminal in San Francisco and the East Bay.
Customers transferring from AC Transit receive a $0.50 discount on adult single ride Muni fare when paid using Clipper.

DRAFT SFMTA Short Range Transit Plan 21
TRANSIT PROVIDER
AREAS SERVED TRANSFER STRUCTURE (as of January 1, 2016)
Bay Area Rapid Transit (BART)
BART provides regional transit service in Alameda, Contra Costa, San Mateo, and San Francisco, including direct service to San Francisco International Airport.
1) Transferring from the Daly City BART station to Muni using Clipper Customers transferring from the BART Daly City station to Muni lines are eligible for two free rides on Muni routes 14R, 28, 28R and 54 within 24 hours of existing the BART station. .
2) Muni+BART Monthly “A” Pass ($83): Provides unlimited rides on all Muni service, including cable cars, and travel between BART stations within San Francisco..
3) Inter-Agency Transfer: Customers transferring from BART receive a $0.50 discount on adult single ride Muni fare when paid using Clipper.
Caltrain Caltrain provides local, limited and Baby Bullet train service between San Francisco and San Jose, with weekday commute-hour service to Gilroy.
Customers transferring from BART receive a $0.50 discount on adult single ride Muni fare when paid using Clipper.
Golden Gate Ferry and Transit
Golden Gate Transit bus lines run from San Francisco over the Golden Gate Bridge to a variety of destinations in Marin and Sonoma Counties. Golden Gate Transit ferries operate from the Ferry Building at the foot of Market Street to Sausalito and Larkspur.
Customers transferring from Golden Gate Transit receive a $0.50 discount on adult single ride Muni fare when paid using Clipper. Golden Gate Transit also provides a reciprocal $0.50 single ride discount for Muni customers transferring to their service.

DRAFT SFMTA Short Range Transit Plan 22
TRANSIT PROVIDER
AREAS SERVED TRANSFER STRUCTURE (as of January 1, 2016)
San Francisco Bay Ferry
The San Francisco Bay Ferry provides weekday, weekend, holiday, and seasonal services to various terminal locations around the bay.
Customers transferring from Golden Gate Transit receive a $0.50 discount on adult single ride Muni fare when paid using Clipper. San Francisco Bay Ferry also provides a reciprocal $0.50 single ride discount for Muni customers transferring to their service.
Vallejo/Baylink Ferry
The Vallejo/Baylink ferry operates daily service between Pier 41 (limited departures/arrivals) and the Ferry Building in San Francisco and the Vallejo Ferry Terminal.
Customers transferring from Golden Gate Transit receive a $0.50 discount on adult single ride Muni fare when paid using Clipper
SamTrans SamTrans in San Mateo County operates some peak-hour service from San Francisco to San Mateo County.
Customers transferring from SamTrans receive a $0.50 discount on adult single ride Muni fare when paid using Clipper
Fare Changes
Muni fare increases are based on a formula set in 2009 by the SFMTA Board of
Directors to create a more predictable and transparent mechanism for setting charges.
The formula is based on a combination of the Bay Area Consumer Price Index for all
urban consumers (CPI-U) and labor costs.
More information on the Automatic Indexing Implementation Plan can be found at:
http://www.sfmta.com/protected/automaticindexingplan.pdf . The SFMTA Board may

DRAFT SFMTA Short Range Transit Plan 23
make changes in addition to the indexing plan based on policy or fiscal changes. See
below a list of fares approved by the SFMTA Board for the FY 2017 and FY 2018.
Table 4b. Muni Fare Changes
Fare Type FY 2016
Current
Fares
Effective
9/1/16
Effective
1/1/17
Effective
7/1/17
Effective
1/1/18
Adult Single Ride Fare (Clipper®
and Mobile Ticketing)
$2.25 $2.25 $2.25 $2.50 $2.50
Adult Single Ride Fare (Cash and
Limited Use Card)
$2.25 $2.25 $2.50 $2.75 $2.75
Discount Single Ride Fare (Youth
to 17* years, Seniors and People
with Disabilities) (Clipper® and
Mobile Ticketing)
$1.00 $1.00 $1.00 $1.25 $1.25
Discount Single Ride Fare (Youth
to 17* years, Seniors and People
with Disabilities) (Cash and
Limited Use Card)
$1.00 $1.00 $1.25 $1.35 $1.35
Tokens for Non Profits serving
Needy Populations
$2.25 $2.25 $1.25 $1.35 $1.35
Free Muni Program –
Low/Moderate Income Youth,
Seniors, People with Disabilities
(SF Residents - Enrollment
Required)
$0.00 $0.00 $0.00 $0.00 $0.00
Adult “A” Monthly Pass (Includes
BART within SF)
$83 $86 $91 $94 $94
Adult “M” Monthly Pass (Muni
Only)
$70 $73 $73 $75 $75
Adult “M” Monthly Pass for Non
Profits serving Needy Populations
$70 $73 $36 $38 $38
DRAFT SFMTA Short Range Transit Plan 24
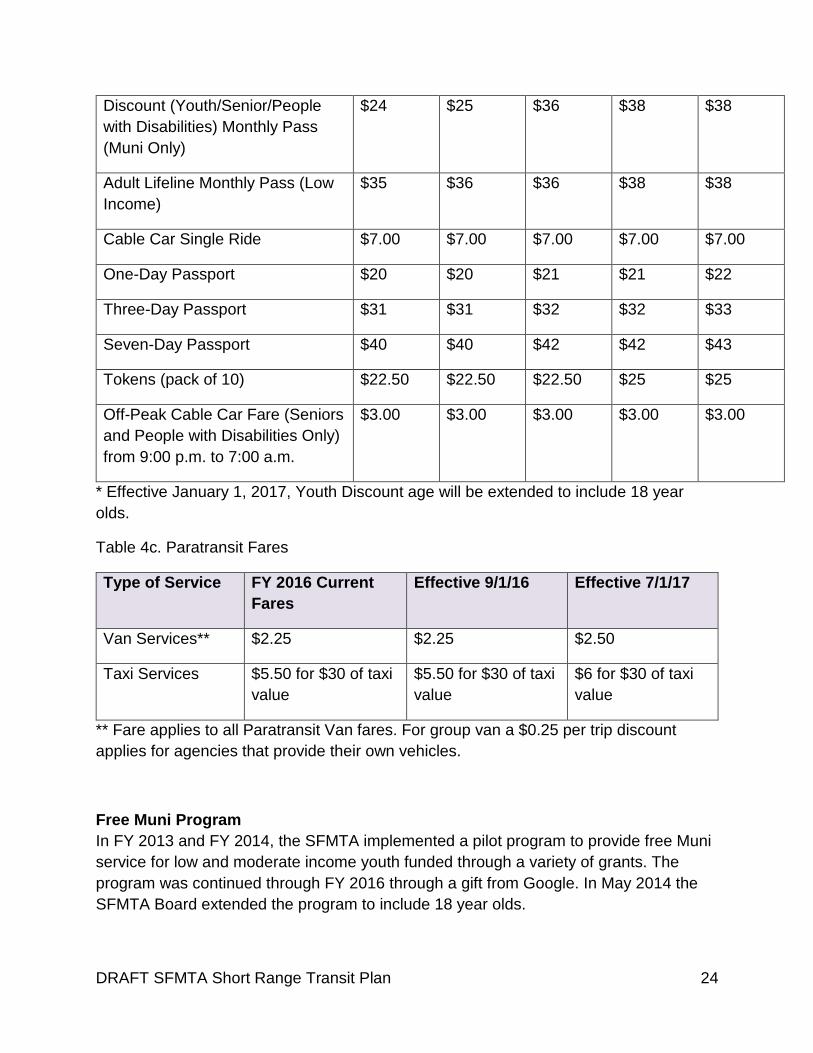
Discount (Youth/Senior/People
with Disabilities) Monthly Pass
(Muni Only)
$24 $25 $36 $38 $38
Adult Lifeline Monthly Pass (Low
Income)
$35 $36 $36 $38 $38
Cable Car Single Ride $7.00 $7.00 $7.00 $7.00 $7.00
One-Day Passport $20 $20 $21 $21 $22
Three-Day Passport $31 $31 $32 $32 $33
Seven-Day Passport $40 $40 $42 $42 $43
Tokens (pack of 10) $22.50 $22.50 $22.50 $25 $25
Off-Peak Cable Car Fare (Seniors
and People with Disabilities Only)
from 9:00 p.m. to 7:00 a.m.
$3.00 $3.00 $3.00 $3.00 $3.00
* Effective January 1, 2017, Youth Discount age will be extended to include 18 year
olds.
Table 4c. Paratransit Fares
Type of Service FY 2016 Current
Fares
Effective 9/1/16 Effective 7/1/17
Van Services** $2.25 $2.25 $2.50
Taxi Services $5.50 for $30 of taxi
value
$5.50 for $30 of taxi
value
$6 for $30 of taxi
value
** Fare applies to all Paratransit Van fares. For group van a $0.25 per trip discount
applies for agencies that provide their own vehicles.
Free Muni Program
In FY 2013 and FY 2014, the SFMTA implemented a pilot program to provide free Muni
service for low and moderate income youth funded through a variety of grants. The
program was continued through FY 2016 through a gift from Google. In May 2014 the
SFMTA Board extended the program to include 18 year olds.

DRAFT SFMTA Short Range Transit Plan 25
In January 2015, the SFMTA Board voted to expand this program. The SFMTA now
provides free Muni for more than 60,000 low and moderate income youth (ages 5-18),
19 - 22-year-olds enrolled in San Francisco Unified School District programs, seniors
(ages 65+), and people with disabilities who use a Clipper® card. More information and
applications for this program can be found at www.sfmta.com/freemuni.

DRAFT SFMTA Short Range Transit Plan 26
Overview of the Revenue Fleet
Comprised of cable cars, historic streetcars, electric trolley coaches, renewable diesel
and hybrid buses, light rail vehicles, and paratransit vans, Muni has one of the most
diverse vehicle fleets in the world. The information below shows a vehicle count as of
June 2016. Over the next four years the SFMTA will be replacing its entire rubber tire
fleet to improve transit service, improve the overall customer experience, and bring
clean, new vehicles that use state-of-the-art hybrid and renewable diesel technologies
to make Muni’s fleet, already one of the greenest in the nation, even cleaner. The light
rail vehicles replacement and expansion program spans multiple years, starting with
expansion and transitioning to replacement around the end of the decade.
Invented in San Francisco in 1873 and still in operation on three lines, San Francisco’s
cable cars are an icon of the city. Cable cars currently provide service for about three
percent of system riders. Vehicle count: 40 cable cars; Type of Service: Historic
The all-electric light rail trains run both above and below ground. The six light rail lines
serve about 20 percent of system riders. Vehicle count: 149 vehicles; Type of Service:
Rapid
The SFMTA operates the second-largest trolley coach fleet in North America. These
zero-emission vehicles carry about 30 percent of system riders. Vehicle count: 239 40-
foot and 60 60-foot trolley coaches (33 more will be in production); Type of Service: Rapid,
Frequent Local, Owl

DRAFT SFMTA Short Range Transit Plan 27
Restored historic streetcars from around the world travel from the Castro to Fisherman’s
Wharf and Fisherman’s Wharf to Caltrain at 4th & King. The one-of-kind vehicles carry
about 21,000 passengers a day. Vehicle count: 43 vehicles operational, as of June 2016,
including Presidents’ Conference Committee (PCC), Milan, and other unique and work
vehicles. Type of Service: Historic
The SFMTA’s 30-foot, 40-foot, and 60-foot renewable diesel and renewable diesel-
hybrid buses help connect people throughout San Francisco – to work, school, home
and other trips. The motor coach sub-fleet is the backbone of Muni service and carries
over 40 percent of the system’s riders. Vehicle count: 597 vehicles from various
manufacturers; Type of Service: Rapid, Frequent, Grid, Circulator, Express, Specialized
The SFMTA provides paratransit service to seniors and persons with disabilities who
are unable to independently ride the Muni fixed route system. In FY 2015, SFMTA-
owned wheelchair accessible vehicles completed approximately 775,000 trips for more
than 13,000 active riders. Vehicle count: 122 22-foot vans, 5 25-foot vans, and 5
wheelchair accessible minivans; Type of Service: demand-responsive paratransit service

DRAFT SFMTA Short Range Transit Plan 28
Existing Facilities
The SFMTA owns and leases a wide variety of buildings, grounds, and infrastructure
that enables the operation, maintenance, planning, engineering, enforcement, and
administration of the complex transportation system in San Francisco. The majority of
the 29 facilities are dedicated to the maintenance, fueling, storage, and staging of the
transit and traffic enforcement vehicles. Also under SFMTA control are 19 public parking
garages and 19 metered parking lots.

DRAFT SFMTA Short Range Transit Plan 29
Figure 5. San Francisco Municipal Transportation Agency Facilities Map

DRAFT SFMTA Short Range Transit Plan 30
Table 5. SFMTA Administrative, Operations, Maintenance, Fueling, Vehicle Storage and
Staging Facilities
FACILITY NAME LOCATION YEAR OPEN
SITE OWNERSHIP
FACILITY FUNCTION/ VEHICLE CAPACITY
AGENCYWIDE
SFMTA Headquarters
1 South Van Ness Avenue, Floors 3, 6, 7, and 8
2003 CCSF Owned
Office of the Director of Transportation, Capital Programs & Construction, Communications & Marketing, Finance & Information Technology, Human Resources, Sustainable Streets Planning and Engineering offices, System Safety, Taxis & Accessible Services, Transit Administration and Operations Planning & Schedules offices
Transportation Management Center (TMC)
1455 Market Street
2015 Leased by CCSF on behalf of SFMTA
Transit Operations & Traffic Signal Operations Control Centers
Central Control
131 Lenox Way, West Portal Station
1982
CCSF owned, under jurisdiction of SFMTA
Current Transit Operations Control Center

DRAFT SFMTA Short Range Transit Plan 31
FACILITY NAME LOCATION YEAR OPEN
SITE OWNERSHIP
FACILITY FUNCTION/ VEHICLE CAPACITY
Power Control Center
Bryant Street & Alameda
1977
CCSF owned, under jurisdiction of SFMTA
Central facility to monitor electrical system for all SFMTA operations
LIGHT RAIL & HISTORIC
Cable Car Barn Mason Street & Washington Street
1887; rebuilt and reopened 1984
CCSF owned, under jurisdiction of SFMTA
40 cable cars
Beach-Geneva Yard
Geneva Avenue, San Jose Avenue, and I-280
1907
CCSF owned, under jurisdiction of SFMTA
36 75-ft LRVs; 55 50-ft historic streetcars; and 24 historic streetcars under canopy
Green Division, Green Annex & Upper Yard
Geneva Avenue, San Jose Avenue, and I-280
1977 & 1987
CCSF owned, under jurisdiction of SFMTA
76 75-ft LRVs
Muni Metro East Division
Cesar Chavez/25th Street and Illinois Street
2008
CCSF owned, under jurisdiction of SFMTA
125 75-ft LRVs
MOTOR COACH
Flynn Division 15th Street & Harrison Street
1989
CCSF owned, under jurisdiction of SFMTA
102 60-ft Articulated Motor Coaches; currently over capacity at 125 60-ft Articulated Motor Coaches

DRAFT SFMTA Short Range Transit Plan 32
FACILITY NAME LOCATION YEAR OPEN
SITE OWNERSHIP
FACILITY FUNCTION/ VEHICLE CAPACITY
Islais Creek Division
Cesar Chavez Street & Indiana Street
Phase 1 2012 Phase 2 Under Construction
CCSF owned, under jurisdiction of SFMTA
160 40-ft Motor Coaches (when completed)
Kirkland Division
North Point Street and Powell Street
1950
CCSF owned, under jurisdiction of SFMTA
127 40-ft Motor Coaches; currently over capacity at 135 40-ft Motor Coaches
Woods Division 22nd Street and Indiana Street
1974
CCSF owned, under jurisdiction of SFMTA
30 30-ft Motor Coaches; and 160 40-ft Motor Coaches
TROLLEY COACH
Potrero Division
Bryant Street, Mariposa Street, and 17th Street
1914
CCSF owned, under jurisdiction of SFMTA
75 40-ft Trolley Coaches; 73 60-ft Trolley Coaches
Presidio Division Geary Street and Presidio Avenue
1912
CCSF owned, under jurisdiction of SFMTA
142 40-ft Trolley Coaches
PARTS STORAGE & SUPPORT SHOPS
Marin Yard
1399 Marin Street
1990
CCSF owned, under jurisdiction of the Port of San Francisco; MOU with SFMTA
Storage

DRAFT SFMTA Short Range Transit Plan 33
FACILITY NAME LOCATION YEAR OPEN
SITE OWNERSHIP
FACILITY FUNCTION/ VEHICLE CAPACITY
700 Penn 700 Pennsylvania Ave
1947
CCSF owned, under jurisdiction of SFMTA
Technical and Professional Maintenance Shops, Storage, and Administration
Scott Non-Revenue Vehicle Yard
15th Street & Division Street
1990
CCSF owned, under jurisdiction of SFMTA
Storage and Maintenance of Non-Revenue Vehicle Fleet
Burke Warehouse
1570-1580 Burke Avenue
1969; occupied by SFMTA in 2005
CCSF owned, under jurisdiction of SFMTA
Maintenance Parts Storage and Future Site of Overhead Lines Group
Duboce Non-revenue Track
Duboce, between Market & Church
n/a
CCSF owned, under jurisdiction of DPW, SFMTA Occupied
Temporary storage of Light Rail Vehicles and Historic Streetcars; light maintenance
NON-VEHICLE MAINTENANCE
Overhead Lines 1419 Bryant Street
1893; acquired by Muni in 1944
CCSF owned, under jurisdiction of SFMTA
Storage of Parts and Service Vehicles dedicated to Overhead Lines
Sign, Meter, & Temporary Sign Shops
1508 Bancroft Street
2012
CCSF owned, under jurisdiction of SFMTA
Professional and Technical Shops
Paint & Meter Parking Shops
1538 Yosemite Street
2012 Leased by CCSF on behalf of SFMTA
Paint Shops and SSD Shops’ Trucks
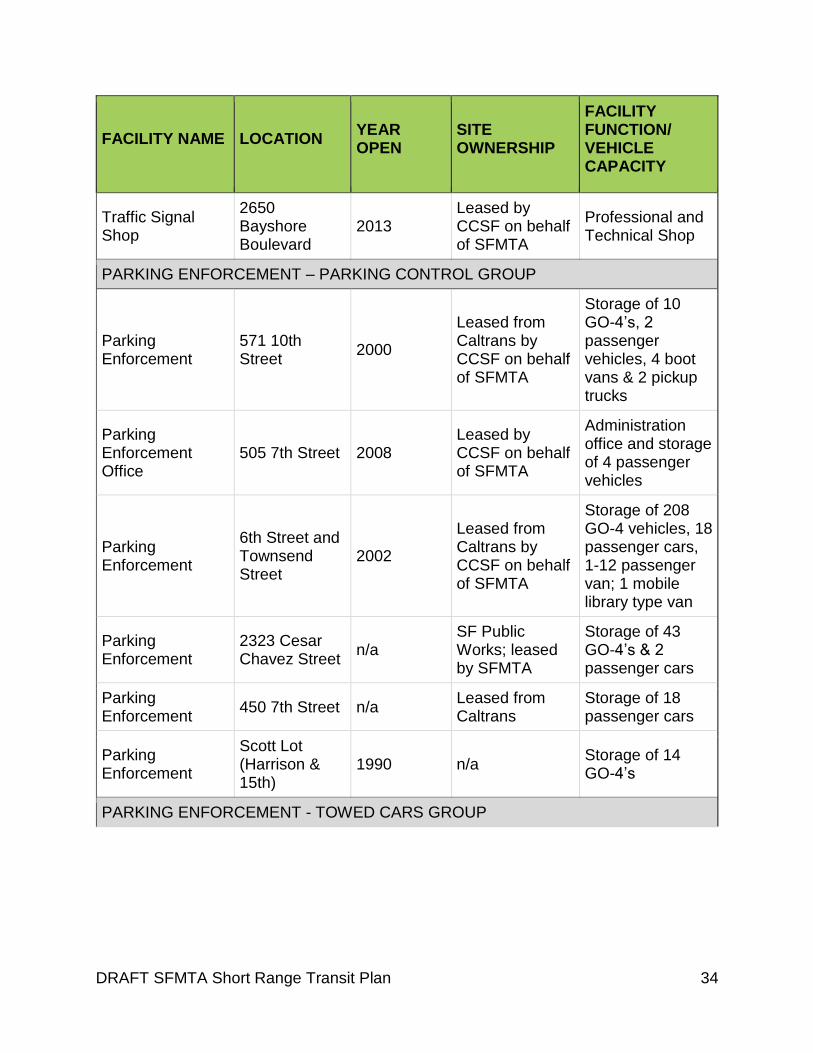
DRAFT SFMTA Short Range Transit Plan 34
FACILITY NAME LOCATION YEAR OPEN
SITE OWNERSHIP
FACILITY FUNCTION/ VEHICLE CAPACITY
Traffic Signal Shop
2650 Bayshore Boulevard
2013 Leased by CCSF on behalf of SFMTA
Professional and Technical Shop
PARKING ENFORCEMENT – PARKING CONTROL GROUP
Parking Enforcement
571 10th Street
2000
Leased from Caltrans by CCSF on behalf of SFMTA
Storage of 10 GO-4’s, 2 passenger vehicles, 4 boot vans & 2 pickup trucks
Parking Enforcement Office
505 7th Street 2008 Leased by CCSF on behalf of SFMTA
Administration office and storage of 4 passenger vehicles
Parking Enforcement
6th Street and Townsend Street
2002
Leased from Caltrans by CCSF on behalf of SFMTA
Storage of 208 GO-4 vehicles, 18 passenger cars, 1-12 passenger van; 1 mobile library type van
Parking Enforcement
2323 Cesar Chavez Street
n/a SF Public Works; leased by SFMTA
Storage of 43 GO-4’s & 2 passenger cars
Parking Enforcement
450 7th Street n/a Leased from Caltrans
Storage of 18 passenger cars
Parking Enforcement
Scott Lot (Harrison & 15th)
1990 n/a Storage of 14 GO-4’s
PARKING ENFORCEMENT - TOWED CARS GROUP

DRAFT SFMTA Short Range Transit Plan 35
FACILITY NAME LOCATION YEAR OPEN
SITE OWNERSHIP
FACILITY FUNCTION/ VEHICLE CAPACITY
Towed Cars (short term)
450 7th Street n/a Caltrans; leased by SFMTA
Primary Storage of towed abandoned and illegally parked vehicles averaging 300 vehicles during peak times.
Towed Cars (long term)
2650 Bayshore Blvd., Daly City
2012 Leased by CCSF on behalf of SFMTA
Required to have at least 300 spaces for police tows, 100 of which must be indoors
PARKING GARAGES
16th & Hoff Garage
42 Hoff Street 1986
CCSF owned, under jurisdiction of SFMTA
98 parking spaces
Civic Center Garage
355 McAllister Street
1958
CCSF owned, under jurisdiction of SFMTA
843 parking spaces
Ellis-O’Farrell Garage
123 O’Farrell Street
1964
CCSF owned, under jurisdiction of SFMTA
950 parking spaces
5th&Mission/Yerba Buena Garage
833 Mission Street
1957
CCSF owned, under jurisdiction of SFMTA
2585 parking spaces
Golden Gateway Garage
250 Clay Street
1965
CCSF owned, under jurisdiction of SFMTA
1095 parking spaces

DRAFT SFMTA Short Range Transit Plan 36
FACILITY NAME LOCATION YEAR OPEN
SITE OWNERSHIP
FACILITY FUNCTION/ VEHICLE CAPACITY
Japan Center Garage
1610 Geary Boulevard
1965
CCSF owned, under jurisdiction of SFMTA
920 parking spaces
Lombard Garage 2055 Lombard Street
1987
CCSF owned, under jurisdiction of SFMTA
205 parking spaces
Mission-Bartlett Garage
3255 21st Street
1983
CCSF owned, under jurisdiction of SFMTA
350 parking spaces
Moscone Center Garage
255 3rd Street 1984
CCSF owned, under jurisdiction of SFMTA
732 parking spaces
North Beach Garage
735 Vallejo Street
1997
CCSF owned, under jurisdiction of SFMTA
203 parking spaces
Performing Arts Garage
360 Grove Street
1983
CCSF owned, under jurisdiction of SFMTA
598 parking spaces
Pierce Street Garage
3252 Pierce Street
1970
CCSF owned, under jurisdiction of SFMTA
116 parking spaces
Polk-Bush Garage
1399 Bush Street
1990
CCSF owned, under jurisdiction of SFMTA
129 parking spaces
Portsmouth Square Garage
733 Kearny Street
1960
CCSF owned, under jurisdiction of SFMTA
504 parking spaces

DRAFT SFMTA Short Range Transit Plan 37
FACILITY NAME LOCATION YEAR OPEN
SITE OWNERSHIP
FACILITY FUNCTION/ VEHICLE CAPACITY
San Francisco General Hospital Medical Center Garage
2500 24th Street
1996
CCSF owned, under jurisdiction of SFMTA
1657 parking spaces
St. Mary’s Square Garage
433 Kearny Street
1952
CCSF owned, under jurisdiction of SFMTA
414 parking spaces
Sutter-Stockton Garage
444 Stockton Street
1959
CCSF owned, under jurisdiction of SFMTA
1865 parking spaces
Union Square Garage
333 Post Street
1941
CCSF owned, under jurisdiction of SFMTA
985 parking spaces
Vallejo Street Garage
766 Vallejo Street
1969
CCSF owned, under jurisdiction of SFMTA
163 parking spaces
PARKING LOTS
18th Ave./Geary Lot
421 18th Avenue
n/a
CCSF owned, under jurisdiction of SFMTA
34 metered spaces
18th St./Collingwood Lot
4116 18th Street
n/a
CCSF owned, under jurisdiction of SFMTA
28 metered spaces
19th Ave./Ocean Lot
3000 19th Avenue
n/a
CCSF owned, under jurisdiction of SFMTA
20 metered spaces

DRAFT SFMTA Short Range Transit Plan 38
FACILITY NAME LOCATION YEAR OPEN
SITE OWNERSHIP
FACILITY FUNCTION/ VEHICLE CAPACITY
20th Ave./Irving Lot
1275 20th Avenue
n/a
CCSF owned, under jurisdiction of SFMTA
24 metered spaces
24th St./Noe Lot 4061 24th Street
n/a
CCSF owned, under jurisdiction of SFMTA
16 metered spaces
7th Ave./Irving Lot
1340 7th Avenue
n/a
CCSF owned, under jurisdiction of SFMTA
36 metered spaces
7th St./Harrison Lot
415 7th Street n/a
CCSF owned, under jurisdiction of SFMTA
205 metered spaces
8th Ave./Clement Lot
324 8th Avenue
n/a
CCSF owned, under jurisdiction of SFMTA
26 metered spaces
9th Ave./Clement Lot
1325 9th Avenue
n/a
CCSF owned, under jurisdiction of SFMTA
21 metered spaces
9th Ave./Irving Lot
1325 9th Avenue
n/a
CCSF owned, under jurisdiction of SFMTA
41 metered spaces
California/Steiner Lot
2450 California Street
n/a
CCSF owned, under jurisdiction of SFMTA
48 metered spaces
Castro/18th St. Lot
457 Castro Street
n/a
CCSF owned, under jurisdiction of SFMTA
20 metered spaces

DRAFT SFMTA Short Range Transit Plan 39
FACILITY NAME LOCATION YEAR OPEN
SITE OWNERSHIP
FACILITY FUNCTION/ VEHICLE CAPACITY
Felton/San Bruno Lot
25 Felton Street
n/a
CCSF owned, under jurisdiction of SFMTA
10 metered spaces
Geary/21st Ave. Lot
5732 Geary Boulevard
n/a
CCSF owned, under jurisdiction of SFMTA
21 metered spaces
Lilac/24th St. Lot 1 Lilac Street n/a
CCSF owned, under jurisdiction of SFMTA
18 metered spaces
Norton/Mission Lot
20 Norton Street
n/a
CCSF owned, under jurisdiction of SFMTA
28 metered spaces
Ocean/Junipero Serra Lot
2500 Ocean Avenue
n/a
CCSF owned, under jurisdiction of SFMTA
20 metered spaces
Ulloa/Claremont Lot
807 Ulloa Street
n/a
CCSF owned, under jurisdiction of SFMTA
23 metered spaces
West Portal/14th Ave. Lot
174 West Portal Avenue
n/a
CCSF owned, under jurisdiction of SFMTA
19 metered spaces

DRAFT SFMTA Short Range Transit Plan 40
Stations & Stops
In addition to the facilities needed to operate transit service, the SFMTA maintains
approximately 3,500 transit stops in San Francisco. In April 2015, the SFMTA adopted a
new policy for the Rapid Network transit stops. Over the course of the next several
years, the SFMTA and its partners will install: additional signage and transit service
branding at Rapid and Metro shelters to make finding and navigating the Muni network
easier; transit poles outfitted with solar powered lanterns visible day or night;
redesigned flag signs to better identify route information, intersection names and real-
time arrival details; and bright red chevron-style decals to identify it as a Rapid stop.
New bicycle racks at Rapid stops will allow for the convenience of Park & Ride and help
distribute waiting riders more evenly between the front and rear doors.
Table 6. SFMTA Stations and Stops
TYPE LOCATIONS YEAR IN USE BASIC AMENITIES
Muni Metro & Rapid Bus
Surface Rapid Bus Stops
At most surface transit locations in San Francisco in residential, commercial and industrial areas.
2015 SFMTA red “wave” shelter; transit poles outfitted with solar powered lanterns; flag signs for route information, intersection names and real-time arrival details; bright red chevron-style decals to signal a Rapid stop; new bicycle racks

DRAFT SFMTA Short Range Transit Plan 41
TYPE LOCATIONS YEAR IN USE BASIC AMENITIES
Muni Metro Stations
The Muni Metro stations from West Portal to The Embarcadero are underground. The downtown subway stations (between Civic Center and The Embarcadero) are shared by Muni and the Bay Area Rapid Transit District (BART). These stations are multi-level, with a concourse level, a Muni boarding platform at mid-level and a BART platform at the lowest level. With the exception of Forest Hill, all Muni Metro stations were constructed in conjunction with BART and are BART-owned.
1980 (all except Forest Hill); 1918 (Forest Hill)
In the underground stations (Embarcadero, Montgomery, Powell, Civic Center, Van Ness, Church, Castro, Forest Hill and West Portal), a digital voice announcement system announces the route designation and arrival time of approaching and arriving trains. All underground stations are accessible by elevator. Stairs and/or an escalator are located at each end of every downtown station. Digital signs that provide real-time arrival information are available at Metro stations.
T Third Surface Stations
Surface stops along the T Third line on The Embarcadero, King Street, Third Street, and Bayshore Boulevard
1998 (The Embarcadero and King Street stations); 2007 (Third Street and Bayshore Blvd. stations)
All stations were designed in line with the distinctive T Third branding. They are all accessible and equipped with transit shelters with digital signs that provide real-time arrival information.
Other Surface Light Rail Stops
Outside of the Market Street Subway, Twin Peaks Tunnel and Sunset Tunnel, the light rail vehicles operate on the surface.
Varied In addition to the standard Rapid Network Stop amenities listed above, key surface light rail stops provide ramps to facilitate wheelchair access. On the M Ocean View line, the accessible stop at San Jose and Geneva avenues has a mechanical wayside lift that elevates customers to the level of the train floor for boarding and exiting.

DRAFT SFMTA Short Range Transit Plan 42
TYPE LOCATIONS YEAR IN USE BASIC AMENITIES
Frequent Local, Grid, Connector, Specialized
Transit Stops
At most surface transit locations in San Francisco in residential, commercial and industrial areas.
Varied Stops with 125 daily boardings have a shelter within environmental constraints. Many shelters are equipped with digital signs that provide real-time arrival information. Many of these shelters also have “push-to-talk” buttons that, when pressed, provide a voice announcement of the arrival times displayed on the digital sign. In 2015, the SFMTA and its partners have also started the installation of transit poles outfitted with solar powered lanterns and flag signs for route information.
Flag Stops
In residential areas and other low traffic locations where Muni will stop in the street rather than pull to the curb
Varied The bus stop is marked with yellow paint on a nearby pole and in the street where the bus will stop. In 2015, the SFMTA and its partners have also started the installation of transit poles outfitted with solar powered lanterns and flag signs for route information.
Historic

DRAFT SFMTA Short Range Transit Plan 43
TYPE LOCATIONS YEAR IN USE BASIC AMENITIES
F Market Historic Street Car Stops
Stops along The Embarcadero and on Market Street between Steuart Street and Castro Street.
1995 (Market Street), 2000 (The Embarcadero)
All include an accessible wayside boarding platform. Between Van Ness Avenue and Steuart Street accessible stops are located at key locations along lower Market Street: wayside platforms at 7th, 3rd and Main streets and Don Chee Way (inbound); wayside platforms are at Don Chee Way, Drumm, Kearny and Hyde streets and Van Ness Avenue (outbound). Accessible lifts are located at inbound stops at Market and Church streets, Market and 5th streets and Market and 1st streets, and at the outbound stop adjacent to Hallidie Plaza.
Cable Car Stops
Placed along the three cable car lines
Varied Riders can board at any cable car turntable (the beginning/end of each route) or anywhere a cable car sign is posted.
Muni Metro Fixed Guideway Infrastructure
With an average weekday ridership of more than 150,000 boardings on fixed route
transit in FY 2015, Muni Metro is the United States’ third-busiest light rail system after
Boston and Los Angeles, operating a fleet of 149 light rail vehicles (LRV). The Muni
Metro system consists of 71.5 miles (115.1 km) of standard gauge track, six light rail
lines, three tunnels, nine subway stations, twenty-four surface stations and eighty-seven
surface stops.
In addition to the light rail track way, the SFMTA is in the planning and design phases
for several bus rapid transit way projects (including Van Ness Avenue, Geary
Boulevard, and 22 Fillmore on 16th Street) and has identified approximately 40
additional miles of transit priority streets in San Francisco.

DRAFT SFMTA Short Range Transit Plan 44
Figure 6. San Francisco Municipal Railway Service Map
DRAFT SFMTA Short Range Transit Plan 45
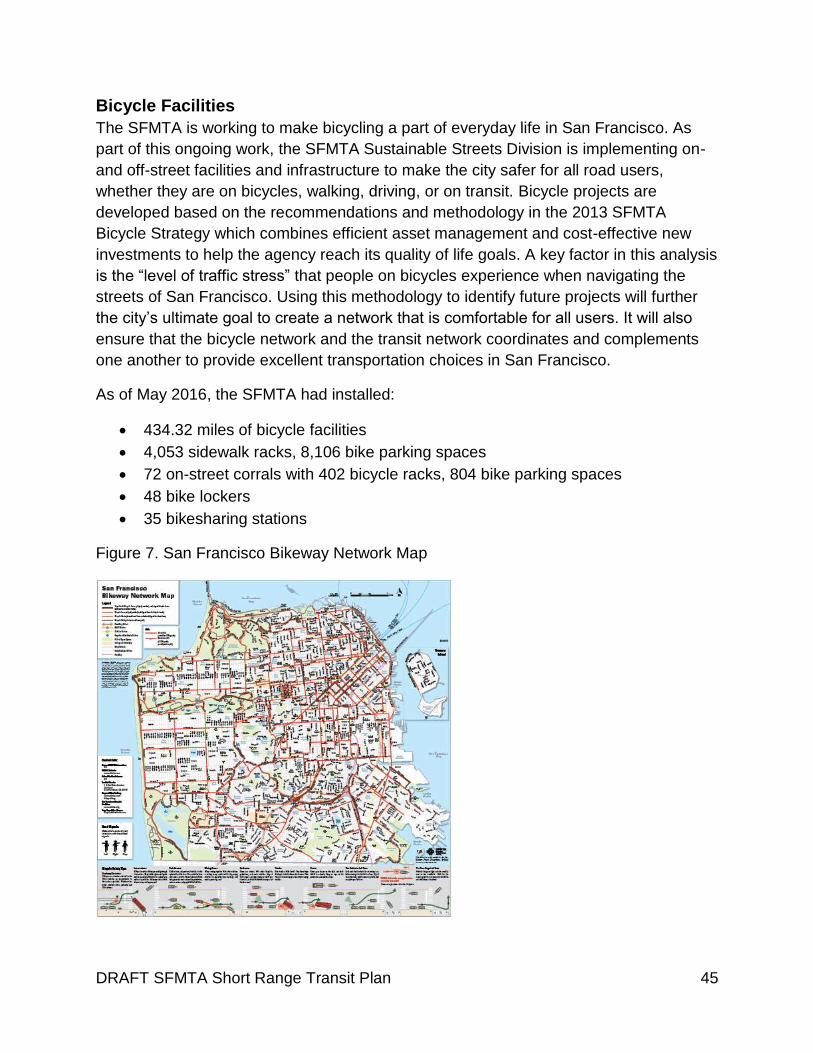
Bicycle Facilities
The SFMTA is working to make bicycling a part of everyday life in San Francisco. As
part of this ongoing work, the SFMTA Sustainable Streets Division is implementing on-
and off-street facilities and infrastructure to make the city safer for all road users,
whether they are on bicycles, walking, driving, or on transit. Bicycle projects are
developed based on the recommendations and methodology in the 2013 SFMTA
Bicycle Strategy which combines efficient asset management and cost-effective new
investments to help the agency reach its quality of life goals. A key factor in this analysis
is the “level of traffic stress” that people on bicycles experience when navigating the
streets of San Francisco. Using this methodology to identify future projects will further
the city’s ultimate goal to create a network that is comfortable for all users. It will also
ensure that the bicycle network and the transit network coordinates and complements
one another to provide excellent transportation choices in San Francisco.
As of May 2016, the SFMTA had installed:
434.32 miles of bicycle facilities
4,053 sidewalk racks, 8,106 bike parking spaces
72 on-street corrals with 402 bicycle racks, 804 bike parking spaces
48 bike lockers
35 bikesharing stations
Figure 7. San Francisco Bikeway Network Map

DRAFT SFMTA Short Range Transit Plan 46
The 2013 SFMTA Bicycle Strategy can be found on the SFMTA website at:
http://sfmta.com/sites/default/files/BicycleStrategyFinal_0.pdf
Bicycles on Transit Vehicles and at Transit Stops
The SFMTA is a multimodal agency and integrates transit, walking, and bicycling
infrastructure to provide travel choices for the residents, workers, and visitors to San
Francisco. The bicycle network supports access to transit and provides an alternative
to transit in corridors that are at or near capacity. In addition to multimodal street
enhancements, all Muni buses in regular service have external bike racks able to hold
two bikes each. Historic streetcars, cable cars, and Muni Metro light rail vehicles do not
have bike racks and full-size bicycles are not currently permitted on those vehicles. Only
folding bicycles are allowed inside all Muni vehicles (with the exception of cable cars).
They must be folded and kept with their owner, and must not be placed on or block
seats, interfere with customer movement, or block wheelchair access and movement.
Bike racks on motor and trolley coaches are available during all hours of operation, on a
first come, first served basis, with a limit of two bikes per rack. No service charge or
permit is needed.
In 2013, Bay Area Bike Share, a multi-agency public-private partnership, launched a
pilot regional bike share system in the dense, transit-rich Downtown and SoMa areas of
San Francisco and along the Caltrain corridor in four other Peninsula and South Bay
cities. Pending a title sponsor, the operator of Bay Area Bike Share plans to extend
service to the East Bay and expand the program in San Francisco and San Jose
beginning in late 2016 or early 2017. In San Francisco, the expanded system should
ultimately cover approximately 16 square miles with at least 320 stations and 4,500
bikes.

DRAFT SFMTA Short Range Transit Plan 47
The SFMTA administers and maintains 48 bicycle lockers in six city-owned garages and
parking lots, mainly downtown. As of 2016, all of the SFMTA-operated bike lockers are
on-demand e-lockers that serve up to ten times more people than traditional keyed
lockers.
Often requested by area merchants and residents, bicycle corrals provide bike parking
on-street in the general parking and loading lane. Over the past several years, as transit
service has been updated, the SFMTA has installed several corrals in discontinued bus
zones.
The Rapid Network will include new signage and transit service branding to help convey
to customers where different types of transit service is accessible. Just outside the
transit shelter at Rapid stops, new bicycle racks allow for the convenience of Park &
Ride and serve as anti-cluster anchors – helping to distribute waiting riders more evenly
between the front and rear doors.

DRAFT SFMTA Short Range Transit Plan 48
SFMTA Goals, Objectives & Standards
In 2011-2012, the SFMTA updated the agency’s Strategic Plan and developed a new
vision for San Francisco’s transportation system. This updated plan better integrates the
key elements and performance metrics defined in the long-range transportation plans
required by the United States Department of Transportation (USDOT) and the
Metropolitan Transportation Commission (MTC), clarifying objectives and aiding in the
prioritization and programming of state and federal funding.
CONTENTS
The SFMTA Strategic Plan ............................................................................................ 49
FY 2013 – FY 2018 Strategic Plan Elements ................................................................ 51
SFMTA Performance Measures .................................................................................... 53
As California cities move forward in partnership with the State to implement the policy
objectives embodied in Assembly Bill 32, the California Global Warming Solutions Act of
2006, and Senate Bill 375, the Sustainable Communities and Climate Protection Act of

DRAFT SFMTA Short Range Transit Plan 49
2008, San Francisco stands at the forefront of innovation in seeking to bring these
transformative policy commitments to reality.
San Francisco’s transit system, Muni, currently carries approximately 220 million
customers a year. In the next 25 years, San Francisco’s population is expected to swell
to over one million people while growth in both jobs and housing is projected at 35
percent. To prepare for and respond to this growth along with the projected growth in
the region, the SFMTA has established a six-year Strategic Plan to guide investment in
the transportation network to improve travel choices, reduce congestion, maintain
affordability, and keep our infrastructure in good condition.
The SFMTA Strategic Plan
Within the framework of regional and state policies, the six-year SFMTA Strategic Plan
defines a course for the agency to meet its mid- and long-term goals for service delivery
and financial sustainability. As every two-year budget is approved, each division uses
the Strategic Plan to prioritize work products, set milestones, and define performance
measures for each employee through a performance evaluation plan in order to ensure
consistency and accountability. Each Division Director also leads the implementation of
at least one strategic objective, creating a continuous link from the plan’s broader
policies to the day-to-day work for SFMTA staff.
The Strategic Planning Process
The FY 2013 – FY 2018 strategic goals were developed through a process led by the
SFMTA Executive Team, with input from SFMTA staff and external stakeholders to
determine the most important areas to focus the agency’s future efforts. Derived from
initial surveys with the general public and a focused strengths, weakness, opportunities,
and threats (SWOT) analysis, five key themes consistently emerged as the highest
priorities: 1. Customer service for all modes; 2. Internal and external communications; 3.
Transportation network improvements for all modes; 4. Operating and capital financial
sustainability; and 5. Organizational development. These key themes evolved into the
four overarching goals of the Strategic Plan that shapes how the SFMTA focuses its
attention, resources, and staff.
Staff Engagement
Using the information gathered from the workshops with internal and external
stakeholders, the SFMTA Executive Team participated in a series of workshops of their
own to brainstorm and draft a new vision, mission statement, and the four over-arching
goals with their related objectives. After every SFMTA Executive workshop, the
directors presented the proposed plan elements to the SFMTA Stakeholder Group so
that each of the plan elements were considered and discussed in depth by more than
60 SFMTA staff members from every part of the agency. The Executive Team then

DRAFT SFMTA Short Range Transit Plan 50
revised the element under discussion and moved to the next, achieving consensus on
each. This cyclical approach to development and vetting allowed the SFMTA to develop
the plan and get buy-in on each element from a large group in a very short timeframe.
Additional outreach presentations, workshops and surveys were held at SFMTA
facilities around the city to give all SFMTA staff, stakeholders, and partner agencies the
opportunity to participate in the development process as well.
Monitoring & Evaluation
The Strategic Plan serves as the foundation on which the agency will develop specific
policies, programs, and projects over the course of six years. Every two years, the
SFMTA will develop a list of actions, policies, and processes that would help the agency
achieve its strategic goals and objectives, updating this list each budget cycle to take
into account the progress made towards meeting each objective listed in the Strategic
Plan. These initiatives and actions will inform the divisional and individual work plans for
each section of the agency. This closed loop process will lead to full accountability at all
levels and the achievement of our goals.
In addition to developing staff work plans to implement the Strategic Plan, SFMTA staff
will also assess each decision brought to the SFMTA Board for conformance with the
Strategic Plan. The summaries of the issue or project proposed to the SFMTA Board
are required to include a description of how the project, policy, or contract directly
advances the goals of the Strategic Plan and outline the impact of the proposed actions
in meeting the Strategic Plan’s targets.
Development of the Next Strategic Plan
The current Strategic Plan sunsets at the end of FY 2018 and the SFMTA is beginning
to lay the groundwork to build upon the current plan and establish the agency’s priorities
for the next plan. Similar to the current Strategic Plan, the next one will weave together
the guiding principles and policies of the local, regional, state, and federal agencies into
one strategic direction for the agency. The next Strategic Plan will also continue to
support the major safety and reliability initiatives already underway in addition to
responding to the major changes in the transportation sector that have occurred in the
last five years. Ultimately, the next Strategic Plan will be developed in-house by SFMTA
leadership and staff, and it will be a concise and impactful document that will align the
agency’s people, resources, and processes to meet its strategic goals.
For a complete discussion of the FY 2013 – FY 2018 SFMTA Strategic Plan, visit:
http://www.sfmta.com/about-sfmta/sfmta-strategic-plan.

DRAFT SFMTA Short Range Transit Plan 51
FY 2013 – FY 2018 Strategic Plan Elements
Although the general intent of the FY 2013 – FY 2018 SFMTA Strategic Plan remains
consistent with the previous plan, all elements of the plan were updated to better
address its broadened responsibilities, opportunities, and challenges since the
development of the last plan in 2008.
The framework for the FY 2013 – FY 2018 SFMTA Strategic Plan focuses on a new
vision and mission for the Agency and the goals and objectives needed to achieve this
vision. The development of strong strategic goals and objectives with specific targets
and timeframes guides SFMTA divisions to develop initiatives and actions as part of the
two-year budget.
SFMTA Vision & Mission Statement
The vision for the SFMTA identifies what the SFMTA wants to do as an agency and
provide for the city by the end of FY 2018. Developed by the SFMTA Executive Team,
the vision and mission statement are intended to be powerful statements to guide the
Agency. The vision statement conveys the agency’s commitment to enable a range of

DRAFT SFMTA Short Range Transit Plan 52
choices in how to get around the city while the concise mission statement details what
the SFMTA does and how the agency will realize the vision.
SFMTA Vision: San Francisco: great city, excellent transportation choices.
SFMTA Mission Statement: We work together to plan, build, operate, regulate, and
maintain the transportation network, with our partners, to connect communities.
Strategic Plan Goals & Objectives
As a result of the strategic planning process, the SFMTA stakeholders identified four
key areas on which to focus agency efforts. Supporting these four strategic goals are 16
objectives that are the specific ways the agency will accomplish the goals. These goals
and objectives are summarized below:
Goal 1: Create a safer transportation experience for everyone
The safety of the transportation system, its users and SFMTA employees are of the
utmost importance to the agency. Creating a safer transportation experience for
everyone means a secure and comfortable system for users of all transportation modes
and SFMTA programs, as well as safe facilities and vehicles in which to work.
Objective 1.1: Improve security for transportation system users
Objective 1.2: Improve workplace safety and security
Objective 1.3: Improve the safety of the transportation system
Goal 2: Make transit, walking, bicycling, taxi, ridesharing and carsharing the most
attractive and preferred means of travel
As the city looks towards the future and estimates the growth of the city and the Bay
Area region, the agency acknowledges the need for increased mobility for residents,
workers and visitors without relying on private automobiles. The SFMTA is committed to
making non-private auto modes of transportation not just a viable option, but the
preferred means of travel in San Francisco.
Objective 2.1: Improve customer service & communications
Objective 2.2: Improve transit performance
Objective 2.3: Increase use of all non-private auto modes
Objective 2.4: Improve parking utilization and manage parking demand
Goal 3: Improve the environment and quality of life in San Francisco
One of the keys to a good quality of life is access to a green, clean, efficient, affordable
and cost-effective transportation system. With the inclusion of this goal in the Strategic
Plan, the SFMTA is committed to understanding the needs of those that use the system.
The agency is also committed to allocating resources more effectively and reducing the

DRAFT SFMTA Short Range Transit Plan 53
structural deficit while maintaining a system that will reliably provide connectivity for
people and businesses.
Objective 3.1: Reduce the Agency’s and the transportation system’s resource
consumption, emissions, waste, and noise
Objective 3.2: Increase the transportation system’s positive impact to the
economy
Objective 3.3: Allocate capital resources effectively
Objective 3.4: Deliver services efficiently
Objective 3.5: Reduce capital and operating structural deficits
Goal 4: Create a collaborative environment to support delivery of outstanding
service
The combination of the Municipal Railway, the Department of Parking and Traffic, and
the Taxi Commission into one transportation agency has challenged the SFMTA to
come together as one agency to support a range of transportation choices for San
Francisco. In order to deliver outstanding services, the SFMTA must create a
collaborative and engaging work environment that trains, encourages and supports its
staff at all levels, while holding each other and the Agency accountable.
Objective 4.1: Improve internal communications
Objective 4.2: Create a collaborative and innovative work environment
Objective 4.3: Improve employee accountability
Objective 4.4: Improve relationships and partnerships with our stakeholders
SFMTA Performance Measures
Under the City and County of San Francisco Charter, Sec. 8A.103, Service Standards
and Accountability, the SFMTA is required to meet the following minimum standards for
transit service:
On-time performance: at least 85 percent of vehicles must run on-time, where a
vehicle is considered on-time if it is no more than one minute early or four
minutes late as measured against a published schedule that includes time points;
and
Service delivery: 98.5 percent of scheduled service hours must be delivered, and
at least 98.5 percent of scheduled vehicles must begin service at the scheduled
time.
The City Charter also stipulates that the SFMTA Board of Directors adopt standards for
system reliability, system performance, staffing performance, customer service, and
sustainability. The SFMTA has developed a comprehensive list of performance

DRAFT SFMTA Short Range Transit Plan 54
measures including: the City Charter mandates, the Strategic Plan Key Performance
Indicators (KPIs) that relate directly to the achievement of each Strategic Plan objective,
and those stipulated through the regional Transit Sustainability Project.
Strategic Plan Key Performance Indicators
After the update to the Strategic Plan elements in 2012, the SFMTA Leadership Team
and the SFMTA Performance Metrics Team revised the performance metrics for the
agency. Specific targets for the key performance indicators (KPIs) for each budget cycle
were included in the Strategic Plan to underscore the importance of implementation,
accountability, and reporting for the agency.
A key method in regularly evaluating the progress in meeting these targets is the regular
monitoring and reporting on the KPIs to the SFMTA Board’s Policy and Governance
Committee (PAG). These monthly meetings give agency staff, the PAG members and
the general public the chance to review and discuss the KPIs and other performance
metrics that the agency tracks. In addition to monthly reports to PAG, the SFMTA
reports on these indicators and ongoing projects and initiatives in the agency’s Annual
Report.
The City Charter also requires that an independent auditor perform the review of
performance data every two years to ensure that it is being accurately collected and
reported, and to make recommendations for improved reporting. Based in part on
recommendations from the audit, the SFMTA will periodically make proposed revisions
to performance metrics and their targets for the consideration of the PAG.
For more information and monthly data reports on all agency performance measures,
visit the SFMTA’s performance webpage: http://www.sfmta.com/performance
The SFMTA 2015 Annual Report is available online:
http://www.sfmta.com/annualreport.

DRAFT SFMTA Short Range Transit Plan 55
Table 7. Strategic Plan Key Performance Indicators
[NOTE: CHANGES ANTICIPATED BY FALL 2016]
KEY PERFORMANCE INDICATORS FY 2014 TARGETS
FY 2016 TARGETS
FY 2018 TARGETS
Goal 1: Create a safer transportation experience for everyone
1.1: # of SFPD-reported transit system related crimes (i.e. assaults, thefts, etc.)/100,000 miles
Achieve 10% reduction in incidents each budget cycle
1.2: # of workplace injuries/200,000 hours (100 FTEs)
Achieve 10% reduction in incidents each budget cycle
1.3: # of Muni collisions/100,000 miles Achieve 10% reduction in incidents each budget cycle
Goal 2: Make transit, walking, bicycling, taxi, ridesharing and carsharing the most attractive and preferred means of travel
2.1: Customer rating: Overall customer satisfaction; Scale of 1 (low) to 5 (high)
Establish baseline and improve satisfaction rating by 0.5 point each budget cycle1
2.2: Percent of transit trips that have less than a 2-minute spacing between vehicles by line and route on the Rapid Network(“bunches”) Percent of transit trips where gaps in service exceed scheduled headway by more than 5 minutes by line and route on the Rapid Network (“gaps”)
Reduce gaps by 25%
Reduce gaps by 45%
Reduce gaps by 65%
2.3: Mode Share FY 2018 mode split goal - private auto: 50%; non-private auto modes: 50%
2.4: % of metered hours with no rate change in SFpark pilot areas
Achieve 65% of metered hours with no rate change2
Goal 3: Improve the environment and quality of life in San Francisco
3.1: SFMTA carbon footprint (metric tons C02e)
25% below 1990 levels by 2017 for the system2

DRAFT SFMTA Short Range Transit Plan 56
KEY PERFORMANCE INDICATORS FY 2014 TARGETS
FY 2016 TARGETS
FY 2018 TARGETS
3.2: Estimated economic impact of Muni service delays (Monthly $M) 2
Make progress towards reducing the economic impact of Muni service delays2
3.3: % of projects delivered on-time and on-budget by phase
Establish baseline and reach 10% improvement over baseline each budget cycle
3.4: Average annual transit cost per revenue hour
5% reduction in fully allocated cost of transit service per budget cycle
3.5: Operating and capital structural deficit
Make progress towards closing operating and mission critical capital structural deficit
Close operating and mission critical capital structural deficit by at least 50%
Close operating structural deficit and mission critical capital deficit
Goal 4: Create a collaborative environment to support delivery of outstanding service
4.1: Employee rating: Do you feel you have the information you need to do your job? Do you feel informed about agency issues, challenges and current events? Scale of 1 (low) to 5 (high)
Establish baseline and improve satisfaction rating by 0.5 point each budget cycle1
4.2: Employee rating: Overall employee satisfaction. Scale of 1 (low) to 5 (high)
Establish baseline and improve satisfaction rating by 0.5 point each budget cycle1
4.3: % of employees with performance plans prepared by the start of fiscal year % of employees with annual appraisals based on their performance plans
100% of employees with performance plans at the start of the fiscal year; 100% of employees with annual performance appraisals completed and submitted to Human Resources by completion of the fiscal year
4.4: Stakeholder rating: Satisfaction with SFMTA decision-making process and communications. Scale of 1 (low) to 5 (high)
Establish baseline and improve satisfaction rating by 0.5 point each budget cycle1
1 A recommended target of 0.2 improvement per budget cycle has been recommended; change anticipated
during summer 2016
2 Change anticipated for this metric during summer 2016

DRAFT SFMTA Short Range Transit Plan 57
Transit Sustainability Project
Established by the Metropolitan Transportation Commission’s (MTC) Resolution 4060 in
2012, the Transit Sustainability Project (TSP) was developed to focus on the financial
health, service performance, and institutional frameworks of the San Francisco Bay
Area’s transit operators. Given the significant projected capital and operating budget
shortfalls, the need to improve transit performance, and interest in attracting new riders
to the system, the MTC formed a steering committee to guide the TSP processes and
recommendations. Made up of representatives from transit agencies, government
bodies, labor organizations, businesses, and environmental and equity stakeholders,
this group developed performance measures and investment recommendations for the
Bay Area’s transit operators.
Within the framework of the Transit Sustainability Project, the seven largest transit
agencies in the Bay Area must achieve a 5 percent real reduction in at least one of the
following performance measures by Fiscal Year (FY) 2017, with no growth beyond that
of the Consumer Price Index (CPI) thereafter:
Cost Per Service Hour
Cost Per Passenger
Cost Per Passenger Mile
For these measures, the baseline year is set at the highest cost year between FY 2008
and FY 2011. The MTC also has developed the following structured annual monitoring
process for the seven largest transit operators in the Bay Area. The SFMTA regularly
reports on its good-faith efforts to meet one or more of the TSP Cost Reduction Metrics
as the Productivity Improvement Project (PIP) for SFMTA as required under State law.
The report also describes the major initiatives that the agency is taking to increase
ridership and/or contain operating costs, including Muni Forward, identifying new
revenue sources to implement transportation improvements throughout the city and
through labor negotiations.

DRAFT SFMTA Short Range Transit Plan 58
Table 8. Transit Sustainability Project Annual Monitoring Process
YEAR ACTION
FY 2013
Transit agencies are to adopt a strategic plan to meet one or more of the targets and submit to MTC.
FY 2014
Starting this year, the transit agencies submit performance measure data on all three targets to MTC on an annual basis
FY 2015
MTC analyzes agency progress in meeting targets
FY 2016
MTC links existing and new operating and capital funds administered by MTC to progress towards achieving the performance target
Monitoring & Achieving Transit Sustainability Project Targets
In order to achieve the TSP targets, the SFMTA must lower inflation-adjusted costs in
relation to revenue vehicle hours, passenger miles, and/or unlinked trips. Costs can still
increase but not as quickly as the increase in vehicle hours, passenger miles or
unlinked trips. In order to meet an inflation-adjusted 5 percent cost reduction target, the
SFMTA would have to limit the cost per vehicle hour to $199.02 in current FY 2016
dollars, the cost per passenger mile to $1.37 in FY 2016 dollars, and/or the cost per
unlinked trip passenger to $2.89 in FY 2016 dollars.
Since MTC’s adoption of the TSP targets, there have been two significant changes to
the methodology used to calculate these performance metrics. As a result, comparing
agency performance to baseline years requires adjustments in order to assess trends
accurately:
In FY 2014 at the request of the FTA, the SFMTA modified its methodology for
calculating Revenue Hours by excluding undelivered service resulting from
service interruptions as reported by the agency’s Central Control log and
Automatic Train Control System. For Fiscal Year 2015, this change resulted in a
4.8 percent reduction of Revenue Hours.

DRAFT SFMTA Short Range Transit Plan 59
In FY 2016, the SFMTA began installing new Automatic Passenger Counters
(APCs) on all newly-procured rubber tire and light rail vehicles beginning with
articulated New Flyer electric trolley coaches and motor coaches. Once
SFMTA’s new radio communications system becomes functional in FY 2017,
these APCs will begin reporting ridership for these vehicles. The SFMTA
expects ridership counting accuracy to improve, which may impact future
calculations of Cost per Passenger Mile and Cost per Unlinked Trip.
For FY 2015, SFMTA’s inflation-adjusted Operating Cost per Revenue Hour was
$218.56. Using SFMTA’s previous methodology to calculate Revenue Hours, which did
not exclude any undelivered service resulting from service interruptions, the inflation-
adjusted operating cost would be $208.04 – a 4.5 percent increase over the baseline
year of FY 2011.
For Fiscal Year 2015, the inflation-adjusted Operating Cost per Passenger Mile and
Operating Cost per Unlinked Trip were $1.47 and $3.12, respectively. This represents
an inflation-adjusted cost increase of 2.1 percent and 2.6 percent, respectively, over the
baseline year of FY 2010.
While the SFMTA has not yet achieved a real reduction in unit operating costs, the
agency has kept inflation-adjusted increases in Operating Costs per Passenger Mile
and per Unlinked Trip relatively stable (0.5 percent or less annually) considering that the
agency has implemented a significant 10 percent service increase and bolstered system
maintenance.
Over the long term, the SFMTA does not anticipate that inflation-adjusted unit operating
costs will decrease. As San Francisco’s population and employment grow, the demand
for public transportation will increase which may require higher funding investments.
The SFMTA plans to address these challenges, increase ridership, and contain
operating costs through the implementation of the Muni Forward transit infrastructure
projects, the support of the Transportation 2030 initiatives, balanced and fair labor
contract negotiations, and motor coach, trolley coach, and light rail vehicle procurement.
Large State of Good Repair needs – As a system with over a century of service, San
Francisco’s transit system has significant needs to restore its assets to ensure safe and
reliable service. This translates into higher operating costs due to older equipment and
facilities. With a backlog estimated at $2.2 billion, the SFMTA requires an investment of
$510 million per year to eliminate the backlog within 20 years. Though the SFMTA and
the City and County of San Francisco are pursuing new funding options, many
improvements and their beneficial impacts on the operating budget will not be realized
before FY 2017.

DRAFT SFMTA Short Range Transit Plan 60
ACTION: As part of the Full-Funding Grant Agreement for the Central Subway project,
the SFMTA has committed to investing an average of $250 million annually on State of
Good Repair projects. These funds are primarily directed towards “Transit Service
Critical” investments and are also distributed between upcoming SGR needs and the
SGR backlog of $2.5 billion. In 2014, the SFMTA issued an update to the State of Good
Repair Report that provides a comprehensive analysis of the agency’s rehabilitation and
replacement needs and investments. Through December 2015, SFMTA’s expenditures
made towards a state of good repair are trending upward and are on pace to exceed the
$250M annual expenditure target by the end of the fiscal year (June 30, 2016). Looking
into the near future, there are a number of major contracts that are currently in place
that put the agency on pace to have annual average state of good repair expenditures
to rise above the $250 million level by the end of FY 2018.
Fleet – The SFMTA is currently in the process of modernizing its entire rubber tire and
light rail vehicle fleet. In the meantime, it continues operating older vehicles, which
impacts maintenance and operating costs.
ACTION: By 2018 the SFMTA will replace the entire rubber tire fleet and begin to put
new LRVs will into service. This investment in the transit fleet will improve transit
reliability and reduce unit maintenance and operating costs.
Limited System and Vehicle Capacity – Increasing ridership can lower unit costs if
there is sufficient capacity on vehicles to absorb new customers. However, the Muni rail
system is already at capacity at certain times of the day and Muni buses are some of
the most crowded in the nation. To reduce crowding, the SFMTA has been adding
service. From a performance accounting perspective, crowding reduction results in
lower customer loads per vehicle, which increases Operating Costs per Passenger Mile
or per Unlinked Trip – but has a significant benefit to customer comfort and ultimately
provides the capacity for long-term ridership growth. Increasing ridership in the future
will necessitate increased service and costs.
ACTION: Through the Muni Forward portfolio of projects, the SFMTA is changing
service to increase frequency and ease crowding on popular routes.
Increasing maintenance needs – In order to reduce mechanical breakdowns and
improve system reliability, the SFMTA is focusing on increased bus maintenance, rail
maintenance and maintenance-of-way activities. Investing in maintenance support
increases unit operating costs but is necessary to improve reliability beyond the five-
year TSP timeframe.
ACTION: Performing recommended maintenance in a timely manner will help keep the
fleet on the road and reduce the likelihood of costly breakdowns. Also, the planned

DRAFT SFMTA Short Range Transit Plan 61
capital investment in replacing the Muni fleet should lead to an overall reduction in unit
operating costs as maintenance needs are reduced.
Funding Sources – Voters may have an opportunity to approve increased
transportation funding on the November 2016 ballot.
ACTION: New funding will depend on voter approval which reflects the economic and
political climate of the city.
Labor Contract Negotiations – Employee wages and benefits are a major factor in
determining operating costs. Changes to labor contracts will have a significant impact
on the extent to which the SFMTA will be able to achieve these targets.
ACTION: The SFMTA will continue to negotiate and enter into labor contracts that are
fair to all parties involved.
Several of the actions listed here require substantial investment in the transit system
and may lead to increases in operating costs in the short term. However, they are
critical to the agency’s long-term success in meeting the intent of the MTC’s Transit
Sustainability Project.
The State of Good Repair Report provides a comprehensive analysis of the agency’s
rehabilitation and replacement needs and investments: http://www.sfmta.com/about-
sfmta/reports/state-good-repair-report-february-2015
The SFMTA FY 2015 – FY 2019 Capital Improvement Program has more information
on the planned infrastructure upgrades, fleet procurement, and other capital
investments that will help the agency meet its Transit Sustainability Project’s (TSP)
goals: https://www.sfmta.com/about-sfmta/reports/fy-2015-2019-capital-improvement-
program

DRAFT SFMTA Short Range Transit Plan 62

DRAFT SFMTA Short Range Transit Plan 63
SERVICE & SYSTEM EVALUATION
San Francisco is a transit-rich, multimodal city where more and more San Franciscans
are choosing to leave their cars behind and use the transit, taxi, bicycle, and pedestrian
routes to get around the city. This shift towards more sustainable transportation helps all
San Francisco residents and visitors by reducing greenhouse gas emissions and
improving air quality, reducing congestion, and activating the streets through increased
pedestrian activities.
In order to meet the needs of the city’s current and future system users, the SFMTA has
updated its transit service planning processes – the agency brings together technology,
technical expertise, and deep community insight to better understand and resolve the
challenges that impact Muni.
CONTENTS
Current Systemwide Performance ................................................................................ 64
Muni Transit Service Structure ...................................................................................... 72
Muni Service Equity Policy ............................................................................................ 74
Equipment & Facilities ................................................................................................... 76
MTC Community-Based Transportation Planning Program .......................................... 77
Paratransit Services ...................................................................................................... 78
Title VI Analysis & Report .............................................................................................. 80
FTA Triennial Review .................................................................................................... 80

DRAFT SFMTA Short Range Transit Plan 64
Current Systemwide Performance
In 2014, the SFMTA concluded an extensive evaluation of its system under the Transit
Effectiveness Project (TEP).
The TEP was an in-depth planning process that brought together technology, technical
expertise, and deep community insight to better understand and thus better solve the
problems affecting San Francisco’s transit network, and represented the first major
evaluation of the Muni system in 30 years. In March 2014, the SFMTA Board of
Directors approved the majority of recommendations that emerged from this planning
process, including an overall 12 percent service increase (10 percent of which was
funded in the two year budget cycle).
The changes—some major, some minor—are distributed across an extensive system of
over 75 bus, trolley, rail, cable car, and streetcar lines, together weaving their way
across a 49 square-mile service area, and serving 700,000 trips a day. Behind these
system-wide statistics are real people—our customers—and SFMTA is now taking
additional steps to preserve and enhance the quality, consistency, and seamlessness of
our customers’ experience with its launch of the Muni Forward program, which is
implementing projects informed by the TEP.
The Muni Forward Program
Route changes, service improvements, and comfort and safety enhancements that will
improve the transit system, enable the agency to meet its service standards and goals,
and reallocate limited resources where they are needed most is the purpose of the Muni
Forward program.
As such, the program is actively working on multiple fronts to create a safer and more
reliable experience both on and off transit. Muni Forward brings together in one place
the long list of projects and planning efforts underway to achieve this vision.
Informed by the Transit Effectiveness Project, route changes and service
improvements are being implemented to reallocate limited resources where they are
needed most. Implementation and expansion of a Rapid Network of core routes serving
nearly 70% of all riders is providing a whole new level of more frequent and reliable
service. Updating our transit fleet and making important safety and accessibility
improvements across the city, combined with the WalkFirst projects, is helping us to
better accommodate the needs of families, seniors, and the disabled, and enhance
comfort and safety for all our customers while aligning with the City’s Vision Zero goals.
Using technology more effectively by improving the integration of our transit system with
traffic signals and bringing more real-time information to our customers is making our
transit system smarter, safer, and more reliable.

DRAFT SFMTA Short Range Transit Plan 65
To date, Muni Forward has implemented a number of transit service improvements and
legislated miles of safety and transit priority capital projects including:
Increasing service four times in 16 months
We added over 330,000 additional annualized service hours (or 10% more service) on Muni lines of all shapes and sizes, spanning the entire city
We launched four brand new routes (E Embarcadero, 55 16th Street, 44 Owl and 48 Owl), rolled out all day Rapid service on the 28R 19th Ave, expanded service hours on our busy Express routes, and boosted frequency on all Muni Metro lines
We also made several route tweaks to provide new and improved connections on several lines, including new connections to BART on the 35, 28R, 57, and 29
Advancing key infrastructure upgrades to improve transit reliability
The SFMTA Board has legislated over 36 miles of transit-priority projects, which includes treatments like transit-only lanes, transit bulbs and stop consolidation to improve travel time and reliability
o Over 7 miles of transit-only lanes have been installed along congested transit corridors
SFMTA has prepared a detailed workbook that discusses implementation plans:
http://www.sfmta.com/projects-planning/projects/muni-forward-implementation-plan.
Systemwide Transit Performance Indicators
The National Transit Database (NTD) is the nation’s primary source for information and
statistics on the transit systems operating in the United States. The SFMTA submits
data to the NTD on an annual basis for the assessment of the agency and its service

DRAFT SFMTA Short Range Transit Plan 66
planning practices. The data submitted to the NTD also informs the apportionment of
the Federal Transportation Agency’s funding in urbanized areas.
From FY 2012 – FY 2015, the revenue service hours and the number of unlinked trips
have fluctuated, while the revenue service miles have gradually declined. Meanwhile,
the Muni rail system is already at capacity at certain times of the day and Muni buses
are already the most crowded in the nation. As San Francisco continues to grow, in both
population and employment, the SFMTA will track these metrics closely in order to
maintain and improve service delivery.
Table 9. Transit Performance Indicators – National Transit Database audited annual data, FY 2012 – FY 2015.
METRIC FY 2012 FY 2013 FY 2014 FY 2015
Revenue Service Hours 3,182,574 3,205,867 3,091,554 3,169,547
Revenue Service Miles 24,304,903 24,247,011 23,440,702 21,573,769
Unlinked Passenger Trips 222,125,944 222,991,006 227,977,367 219,326,138
NOTE: A new federally-mandated counting methodology used for FY 2014 and beyond has
resulted in lower reported revenue service hours and miles.
Additional Transit Performance Indicators
As discussed in the Goals, Objectives, and Standards section of this document, the
SFMTA adopted several new metrics to track the efficiency and effectiveness of the
transit system. These metrics include the Strategic Plan’s Key Performance Indicators
and other significant data points that would inform future decision-making purposes.
The agency uses these metrics to assess its performance on a monthly basis giving
SFMTA staff the opportunity to address any issues with transit service early and
effectively.
The SFMTA has developed interactive public dashboards detailing its performance on
agency goals and objectives, found online at http://sfmta.com/performance. Additionally,
reports on the SFMTA’s Key Performance Indicators (including those metrics listed in
Table 10) are issued monthly and discussed in depth at the SFMTA Board of Directors’
Policy & Governance Committee. These reports are also available online:
http://sfmta.com/about-sfmta/reports/strategic-plan-progress-reports.
The tables and charts on the following pages provide a snapshot of key metrics tracking
Muni effectiveness and efficiency in Fiscal Year 2016.
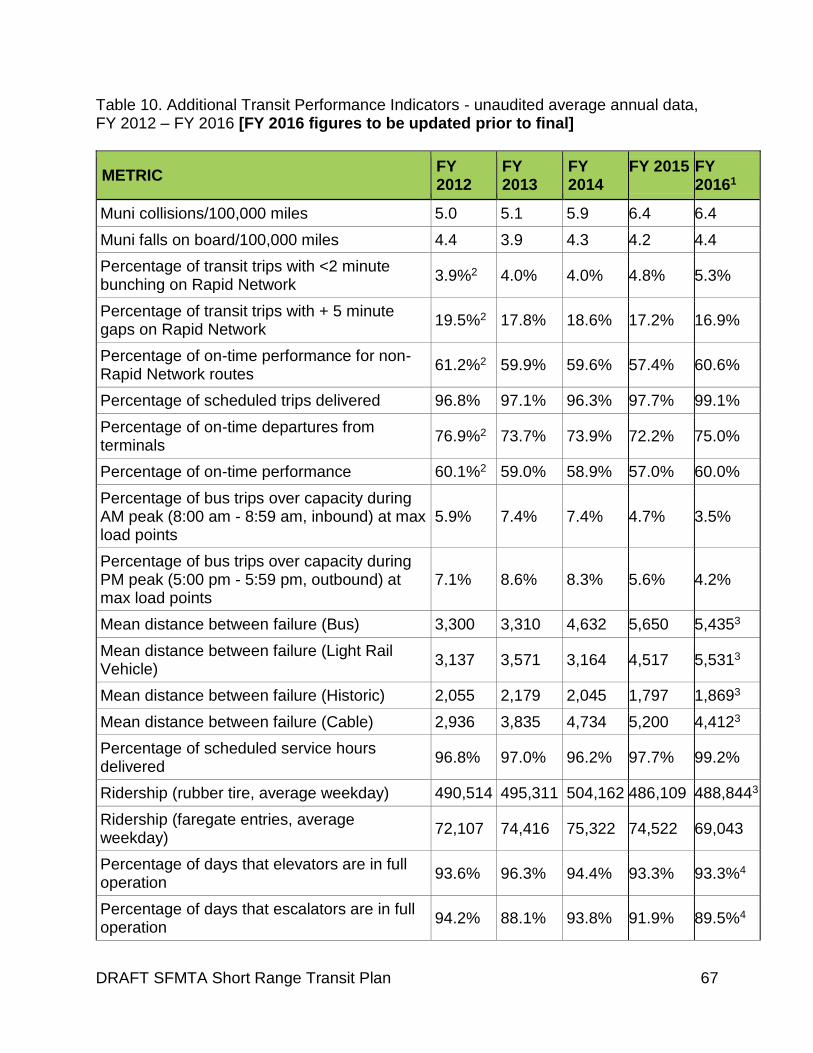
DRAFT SFMTA Short Range Transit Plan 67
Table 10. Additional Transit Performance Indicators - unaudited average annual data, FY 2012 – FY 2016 [FY 2016 figures to be updated prior to final]
METRIC FY 2012
FY 2013
FY 2014
FY 2015 FY 20161
Muni collisions/100,000 miles 5.0 5.1 5.9 6.4 6.4
Muni falls on board/100,000 miles 4.4 3.9 4.3 4.2 4.4
Percentage of transit trips with <2 minute bunching on Rapid Network
3.9%2 4.0% 4.0% 4.8% 5.3%
Percentage of transit trips with + 5 minute gaps on Rapid Network
19.5%2 17.8% 18.6% 17.2% 16.9%
Percentage of on-time performance for non-Rapid Network routes
61.2%2 59.9% 59.6% 57.4% 60.6%
Percentage of scheduled trips delivered 96.8% 97.1% 96.3% 97.7% 99.1%
Percentage of on-time departures from terminals
76.9%2 73.7% 73.9% 72.2% 75.0%
Percentage of on-time performance 60.1%2 59.0% 58.9% 57.0% 60.0%
Percentage of bus trips over capacity during AM peak (8:00 am - 8:59 am, inbound) at max load points
5.9% 7.4% 7.4% 4.7% 3.5%
Percentage of bus trips over capacity during PM peak (5:00 pm - 5:59 pm, outbound) at max load points
7.1% 8.6% 8.3% 5.6% 4.2%
Mean distance between failure (Bus) 3,300 3,310 4,632 5,650 5,4353
Mean distance between failure (Light Rail Vehicle)
3,137 3,571 3,164 4,517 5,5313
Mean distance between failure (Historic) 2,055 2,179 2,045 1,797 1,8693
Mean distance between failure (Cable) 2,936 3,835 4,734 5,200 4,4123
Percentage of scheduled service hours delivered
96.8% 97.0% 96.2% 97.7% 99.2%
Ridership (rubber tire, average weekday) 490,514 495,311 504,162 486,109 488,8443
Ridership (faregate entries, average weekday)
72,107 74,416 75,322 74,522 69,043
Percentage of days that elevators are in full operation
93.6% 96.3% 94.4% 93.3% 93.3%4
Percentage of days that escalators are in full operation
94.2% 88.1% 93.8% 91.9% 89.5%4
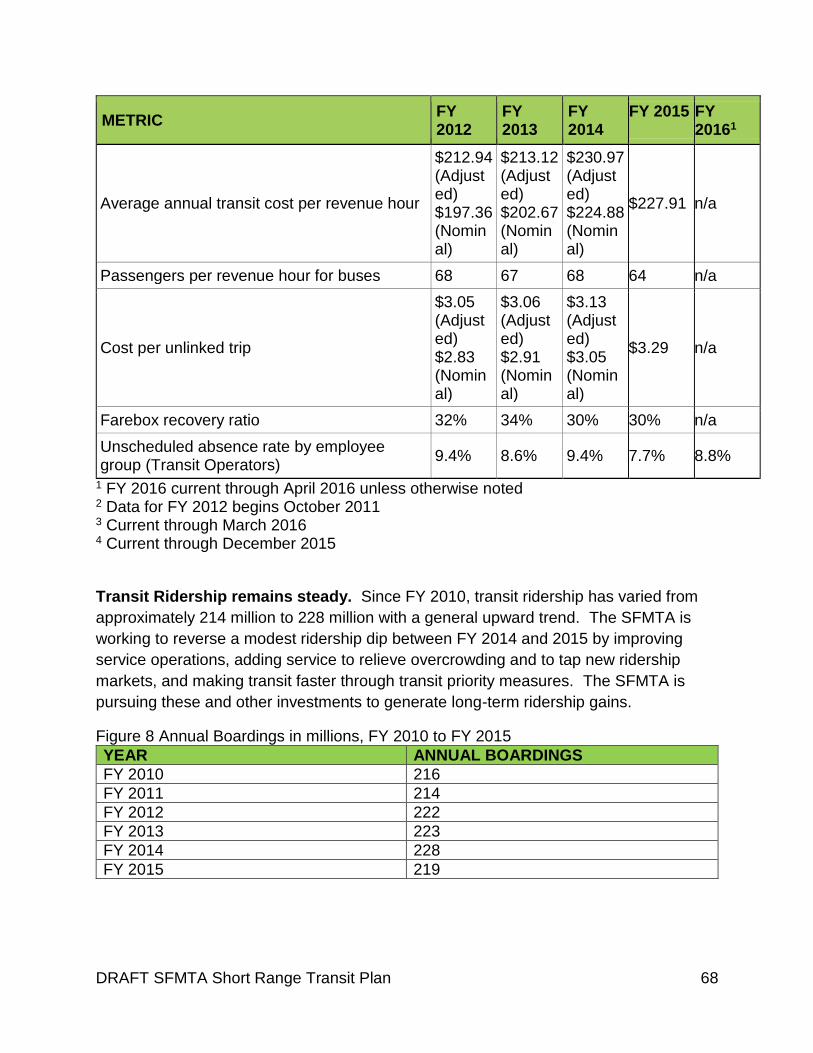
DRAFT SFMTA Short Range Transit Plan 68
METRIC FY 2012
FY 2013
FY 2014
FY 2015 FY 20161
Average annual transit cost per revenue hour
$212.94 (Adjusted) $197.36 (Nominal)
$213.12 (Adjusted) $202.67 (Nominal)
$230.97 (Adjusted) $224.88 (Nominal)
$227.91 n/a
Passengers per revenue hour for buses 68 67 68 64 n/a
Cost per unlinked trip
$3.05 (Adjusted) $2.83 (Nominal)
$3.06 (Adjusted) $2.91 (Nominal)
$3.13 (Adjusted) $3.05 (Nominal)
$3.29 n/a
Farebox recovery ratio 32% 34% 30% 30% n/a
Unscheduled absence rate by employee group (Transit Operators)
9.4% 8.6% 9.4% 7.7% 8.8%
1 FY 2016 current through April 2016 unless otherwise noted 2 Data for FY 2012 begins October 2011 3 Current through March 2016 4 Current through December 2015
Transit Ridership remains steady. Since FY 2010, transit ridership has varied from
approximately 214 million to 228 million with a general upward trend. The SFMTA is
working to reverse a modest ridership dip between FY 2014 and 2015 by improving
service operations, adding service to relieve overcrowding and to tap new ridership
markets, and making transit faster through transit priority measures. The SFMTA is
pursuing these and other investments to generate long-term ridership gains.
Figure 8 Annual Boardings in millions, FY 2010 to FY 2015
YEAR ANNUAL BOARDINGS
FY 2010 216
FY 2011 214
FY 2012 222
FY 2013 223
FY 2014 228
FY 2015 219

DRAFT SFMTA Short Range Transit Plan 69
Scheduled service delivered has improved and remains high. Between FY 2012
and FY 2016, scheduled service delivery improved from around 97 percent to 99
percent. By delivering over 99 percent of scheduled service, SFMTA is currently
exceeding its target as it has expanded service and hired new operators. Fewer missed
runs have improved service reliability for customers.
Figure 9. Percent of scheduled trips delivered, FY 2012 - FY 2016
YEAR’S AVERAGE PERCENTAGE
FY 2012 96.8%
FY 2013 97.1%
FY 2014 96.3%
FY 2015 97.7%
FY 2016 99.1%
Mean distance between vehicle failures is improving. Vehicle maintenance and
reliability has improved significantly since FY 2012. For light rail vehicles, the mean
distance between failures has lengthened by about 75 percent even though the existing
Breda vehicles are four years older. For the rubber tire fleet (both motor and trolley
coaches), the mean distance between failures has lengthened by about 67 percent due
to increased maintenance and the beginning of the replacement of older transit
vehicles.
Figure 10. Mean distance between failures, FY 2012 - 2016
VEHICLE TYPE Light Rail Vehicles Rubber Tire Fleet
FY 2012 3,137 3,300
FY 2013 3,571 3,310
FY 2014 3,164 4,632
FY 2015 4,517 5,650
FY 2016 5,494 5,388
Working to improve on-time performance. Between 2012 and 2015, San Francisco’s
population increased by over 35,000 (4.5 percent) while employment mushroomed by
over 86,000 (14.8 percent). Even with this rapid growth and stress on the transportation
network, the SFMTA has maintained an on-time performance rate of approximately 60
percent. The SFMTA is working to improve on-time performance by reassessing
schedules and supervision deployment, implementing red lanes reserved for transit and
taxis and implementing a new radio communications system to improve real-time
responsiveness to traffic and service delays.

DRAFT SFMTA Short Range Transit Plan 70
Figure 11. Percent On-Time Performance, FY 2012 - FY 2016
YEAR AVERAGE PERCENTAGE
FY 2012 60.1%
FY 2013 59.0%
FY 2014 58.9%
FY 2015 57.0%
FY 2016 59.9%
Table 11. FY 2015 Muni Fixed Route Weekday Boardings by Line (rounded to nearest 100)
ROUTE TYPE VEHICLE TYPE MUNI LINE FY15 WEEKDAY BOARDINGS
Rapid Light Rail Vehicle J 16,300
Rapid Light Rail Vehicle KT 37,100
Rapid Light Rail Vehicle L 30,600
Rapid Light Rail Vehicle M 27,900
Rapid Light Rail Vehicle N 46,100
Rapid Trolley Coach 5R 11,800
Rapid Motor Coach 7R 2,100
Rapid Motor Coach 9R 7,100
Rapid Motor Coach 14R 16,200
Rapid Motor Coach 28R 2,200
Rapid Motor Coach 38R 24,800
Frequent Trolley Coach 49 22,300
Frequent Motor Coach 47 11,600
Frequent Motor Coach 38 22,900
Frequent Trolley Coach 30 23,900
Frequent Motor Coach 28 12,200
Frequent Trolley Coach 22 15,800
Frequent Trolley Coach 14 26,200
Frequent Motor Coach 9 12,500
Frequent Motor Coach 8 22,100
Frequent Motor Coach 7 10,000
Frequent Trolley Coach 1 23,800
Grid Motor Coach 55 1,600
Grid Motor Coach 54 7,600
Grid Motor Coach 48 8,100
Grid Trolley Coach 45 11,300
Grid Motor Coach 44 16,400
Grid Motor Coach 43 12,400
Grid Trolley Coach 33 6,200
Grid Trolley Coach 31 9,200
Grid Motor Coach 29 19,200
Grid Motor Coach 27 6,800
Grid Trolley Coach 24 10,700

DRAFT SFMTA Short Range Transit Plan 71
ROUTE TYPE VEHICLE TYPE MUNI LINE FY15 WEEKDAY BOARDINGS
Grid Motor Coach 23 4,000
Grid Trolley Coach 21 7,300
Grid Motor Coach 19 7,800
Grid Motor Coach 18 4,100
Grid Motor Coach 12 5,300
Grid Motor Coach 10 5,700
Grid Trolley Coach 6 7,400
Grid Motor Coach 5 9,900
Grid Trolley Coach 3 3,700
Grid Motor Coach 2 4,900
Connector Motor Coach 67 1,600
Connector Motor Coach 66 800
Connector Motor Coach 57 1,100
Connector Motor Coach 56 400
Connector Motor Coach 52 2,100
Connector Motor Coach 39 600
Connector Motor Coach 37 2,300
Connector Motor Coach 36 1,600
Connector Motor Coach 35 800
Connector Motor Coach 25 3,200
Historic Street Car F 21,100
Historic Cable Car 61 4,500
Historic Cable Car 60 8,000
Historic Cable Car 59 6,600
Specialized Motor Coach 83X 500
Specialized Motor Coach 82X 600
Specialized Motor Coach 81X 100
Specialized Motor Coach 38BX 1,000
Specialized Motor Coach 38AX 900
Specialized Motor Coach 31BX 800
Specialized Motor Coach 31AX 900
Specialized Motor Coach 30X 2,500
Specialized Motor Coach 14X 2,700
Specialized Motor Coach 08BX 5,700
Specialized Motor Coach 08AX 4,500
Specialized Motor Coach 07X 1,400
Specialized Motor Coach 01BX 1,500
Specialized Motor Coach 01AX 1,000
Specialized Motor Coach NX 1,400
Specialized Motor Coach 88 500
Specialized Trolley Coach 41 3,200
Owl Motor Coach 91 800
Owl Motor Coach 90 300

DRAFT SFMTA Short Range Transit Plan 72
Source: National Transit Database (NTD), FY 2015.
Muni Transit Service Structure
The SFMTA operates Muni transit service based on a set of design standards
developed by SFMTA staff in response to development patterns, customer needs,
system performance, and mandates listed in Proposition E. These standards define
policies for: service coverage, vehicle assignment, on-time performance, service span,
headways for each route type, transit shelter placement, stop spacing, and planned
capacity and passenger loads.
Coverage: All residential neighborhoods in San Francisco should be within a quarter of
a mile of a Muni bus stop or rail line stop.
Vehicle Assignment: The SFMTA assigns vehicles in a manner that prevents
discrimination to minority and low-income communities and considers technical criteria
including peak load factors, route type, physical route characteristics such as street
widths and grades, required headways, vehicle availability and transit operator
availability.
On-Time Performance: On-time performance (OTP) is a service standard mandated
by the San Francisco voters in Proposition E when the SFMTA was formed. It measures
Muni service delivery according to the schedule, rather than informing the fleet planning
and service routes.
Table 12. On-time performance definition.
ROUTE TYPE DEFINITION OTP STANDARD
Rapid & Local Frequent
% of trips with a service gap of five minutes above the scheduled headway
Less than 14% of trips with a service gap
Grid
% of time points served within one minute early to four minutes late of the scheduled time
85% on-time (schedule adherence)
Circulator
Specialized
Owl
Service Span: Muni service is planned to operate service for the minimum number of
hours by route type as listed below.
Table 13. Muni service pan standard, by route type.

DRAFT SFMTA Short Range Transit Plan 73
ROUTE TYPE SERVICE SPAN STANDARD
Rapid & Local Frequent
18 hours
Grid 18 hours
Circulator Based on demand
Specialized Based on demand
Owl Late night service, generally between 1:00 am – 5:00 am (minimum 30 minute headways)
Policy Headways: The following are the minimum weekday headways for transit
service established by Muni route type. However, frequencies of individual routes may
be higher based on demand.
Table 14. Muni policy headways, by route type.
ROUTE TYPE DAY EVENING LATE NIGHT
Weekday
Rapid & Local Frequent
10 15 20*
Grid 20 20 30
Circulator 30 30 --
Specialized based on demand
Weekend
Rapid 12 15 20
Local Frequent 20 20 30
Circulator 30 30 --
* Rapid routes run as a local service during late night transit service.
Transit Shelter Installation: Transit shelters are installed at transit stops (both bus and
rail) with a minimum of 125 daily boardings within environmental constraints. Additional
shelters may be installed as needed.
Stop Spacing: The following guidelines were developed so that they can be
meaningfully applied to the diverse street grids and grades in San Francisco. The
placement of transit stops will continue to be influenced by many factors, including the

DRAFT SFMTA Short Range Transit Plan 74
location of traffic controls to help people walking cross major streets, key transit transfer
points, land uses, topography and major trip generators.
Table 15. Muni stop spacing standards, by vehicle type.
VEHICLE TYPE STOP SPACING STANDARD
Bus Approximately 800 to 1,360 feet on grades less than or equal to 10%; stops may be as close as 500 feet on grades over 10% Rapid and Specialized stops to be spaced on a case-by-case basis
Surface Rail* Approximately 900 to 1,500 feet
* Rail technology limits operation to grades under 10 percent. Not applicable to Cable Car.
Passenger Loads: Muni service should be planned to operate service such that the
peak hour, peak direction load factor does not exceed 85 percent of the combined
seating and standing capacity (established by vehicle type).
Table 16. Muni passenger load standards, by vehicle type.
VEHICLE TYPE PLANNING CAPACITY 85% LOAD STANDARD
30' Motor Coach 45 38
40' Motor Coach 63 54
60' Motor Coach 94 80
40' Trolley Coach 63 54
60' Trolley Coach 94 80
Light Rail Vehicle 119 101
Streetcar 60 51
Cable Car 63 54
*Crush load is approximately 125% of planning capacity
Muni Service Equity Policy
SFMTA is committed to continually improving Muni service quality across San Francisco
and ensuring that service performs equally across all neighborhoods. Working with
social justice advocates and the disability community, the SFMTA adopted an equity
policy in FY 2014 to improve Muni service in the areas of San Francisco most in need.
This policy calls for the SFMTA to create an Equity Strategy every two years to inform
the SFMTA’s biennial budget approval process.

DRAFT SFMTA Short Range Transit Plan 75
In April 2016, the SFMTA Board approved the first Equity Strategy, which assesses
Muni service performance in select low income and minority neighborhoods through
data analysis, identifies major Muni transit-related challenges impacting selected
neighborhoods through community stakeholder outreach, and develops strategies to
address the major challenges. The strategy’s recommendations are included in the
SFMTA’s FY 2017 – FY 2018 budget.
Further outreach on findings and recommendations from the adopted strategy is
planned for the fall of 2016, and we will report back to the SFMTA Board on service
performance and implementation of strategies.

DRAFT SFMTA Short Range Transit Plan 76
Equipment & Facilities
In 2013, the SFMTA Board of Directors accepted the findings and recommendations of
the SFMTA Real Estate and Facilities Vision for the 21st Century Report (Vision
Report). An addendum was presented the SFMTA Board of Directors in July 2014 that
provided further refinements, incorporating the latest jobs and housing projections from
the Association of Bay Area Governments (ABAG) and the Planning Department as well
as updated transit fleet needs to 2020. The Vision Report provided a roadmap to find
ways to reconfigure, consolidate, or expand existing facilities to best meet operational
needs, while identifying cost savings and revenue-generating opportunities. In regard to
facilities, the report identified the following major issues:
Relocation needs due to leases expiring
Facilities operating at or beyond capacity
Facilities at or near the end of their useful life
Inefficient location of functions
Inadequate outfitting of facilities with necessary equipment
In 2015, based on the recommendations in the Vision Report, the SFMTA formed a
Facilities Task Force, which generated recommendations to address the issues
identified in the Vision Report. This included the development of a Facilities Capital
Program, a specific program of projects to address immediate transit fleet growth needs
and a Facilities Condition Assessment, to identify the state of good repair needs to the
SFMTA’s existing facilities campus. The SFMTA is now pursuing the development of a
Facilities Framework, which looks at fleet and facility needs through 2040, and provides
the SFMTA various different scenarios to pursue based on market conditions for TOD,
and fleet storage and transit operational and maintenance needs.
The Real Estate Vision is available online:
http://archives.sfmta.com/cms/cmta/documents/1-29-13VisionReport.pdf
The Addendum to the Real Estate Vision is available online:
http://www.sfmta.com/sites/default/files/Real%20Estate%20Vision%20Report%20Adde
ndum%20-%20Vision%20Refinement%20for%20Coach%20Facilities.pdf.

DRAFT SFMTA Short Range Transit Plan 77
MTC Community-Based Transportation Planning Program
Involvement in the Metropolitan Transportation Commission’s (MTC’s) Community-
based Transportation Planning Program (CBTP) for the City and County of San
Francisco has traditionally been led by the San Francisco Country Transportation
Authority (SFCTA). With funding from Proposition K, SFCTA planned and completed
CBTPs in the following communities: Mission-Geneva (April 2007), Bayview Hunters
Point (June 2010), Western South of Market (March 2012), and Broadway-Chinatown
(October 2014).
In late 2014, the SFMTA began leading the CBTP effort in Western Addition
neighborhood. The existing conditions study revealed that the Western Addition
continues to be defined as a Community of Concern (COC) with a high concentration of
low-income housing and large population of minority residents struggling with city’s high
cost of living. The neighborhood is also challenged with high vehicle speeds, cut
through traffic, and has been identified by the City’s Vision Zero policy and WalkFirst
program as a high-injury area. With this knowledge, SFMTA initiated the planning
process with a focus on neighborhood-level transportation safety improvements with an
emphasis on enhancing the community’s walking, biking, and transit experience. After
initial outreach, the project team refined the project to not only focus on transportation
safety, but also crime prevention through environmental design (CPTED).
During the preliminary planning phase and throughout the project, the SFMTA has
worked closely with District 5 Supervisor Breed, the San Francisco County
Transportation Authority (SFCTA), the project’s Technical Advisory Committee (TAC)
and contracted community based organization, Mo'MAGIC. Throughout the outreach
process Supervisor Breed and Mo’MAGIC have served as integral partners in targeting
and reaching the Western Addition community. In August 2015, the three-phased
community outreach process began and was completed in May 2016 with three to four
outreach events per phase, totaling 11 events. Events were held at local schools, senior
centers, public events and community centers. The initial outreach phase consisted of a
path of travel exercise and survey to understand the community’s mode split, travel
patterns and transportation priorities. A design game and toolkit was introduced in
phase two to determine transportation issues at community-identified priority
intersections and corridors. Based on community feedback in phases one and two, the
project team presented street design options in phase three, where the community
assessed designs using a scorecard exercise. After analyzing the community’s
feedback on these designs the project team will continue to refine street designs and
then finalize the conceptual plan. The entire project is scheduled to be completed at the
end of 2016 with the completion of a conceptual plan and implementation/funding
strategy.

DRAFT SFMTA Short Range Transit Plan 78
Paratransit Services
San Francisco Paratransit is a van and taxi program for people unable to independently
use or access public transit because of a disability or disabling health condition. Since
1990, the Americans with Disabilities Act (ADA) has required all public transit agencies
to provide paratransit services to eligible disabled people. Muni has provided paratransit
services since 1978.
SFMTA owns 112 vehicles in the paratransit fleet and contracts with a third party
contractor for paratransit brokerage services, including management of the overall SF
Paratransit program, and a portion of the demand-responsive transportation services. In
its role as the paratransit broker, the third party contractor also subcontracts with van
and taxi companies for the remaining demand-responsive transportation services.
The SFMTA provides paratransit service within San Francisco, to Treasure Island, to
the northernmost part of Daly City in San Mateo County, and to Marin Headlands on
weekends mirroring the Muni 76X-Marin Headlands line. In FY 2017 and FY 2018, the
SFMTA will procure approximately 63 Paratransit vehicles to replace existing vehicles
(approximately 47 in FY 2017 and approximately 16 in FY 2018). More information on
the vehicle procurement can be found in the description of the SFMTA transit fleet in the
Capital Improvement Program section of this document.
San Francisco Paratransit provides three types of service:
SF Access Van Service - SF Access provides pre-scheduled, door-to-door ADA
van services. SF Access is a shared-ride service. SF Access customers must
make a reservation from one to seven days before the day of the trip, and service
is provided within one hour of the requested pick-up time.
Taxi Services - Paratransit taxi is the same curb-to-curb taxi service that is
available to the general public. This is not an ADA mandated service, but many
customers find that it better meets their transportation needs.
Group Van Service - Group Van is a pre-scheduled van service providing door-
to-door transportation to groups of ADA-eligible customers attending specific
agency programs such as Adult Day Health Care, senior centers, or work sites.
In addition, SFMTA provides specialized paratransit service through the “Shop-a-
Round” program which uses vans and taxis to transport seniors and people with
disabilities to and from the grocery stores. The “Shop-a-Round” Shuttle is a van service
that takes groups of up to seven passengers to and from preselected stores on a
weekly basis. Taxi-based shopping services provide passengers with a designated
allotment of taxi debit card value for use in going to and from the grocery store.

DRAFT SFMTA Short Range Transit Plan 79
SFMTA expanded the network of paratransit services to include Van Gogh shuttle
service to social and cultural events for seniors and persons with disabilities in an effort
to reduce social isolation.
SFMTA has a long history of community involvement with paratransit services. The
Paratransit Coordinating Council (PCC) is an advisory body for customers, service
providers, social service agency representatives, and others to provide input on the
paratransit program. The Executive Committee of the PCC meets regularly to discuss and
provide input to the SFMTA on paratransit services. Also, the Multimodal Accessibility
Advisory Committee (MAAC) is a group of seniors and customers with disabilities who
regularly use SFMTA services and provide input on accessibility-related projects. MAAC
is dedicated to maintaining, improving, and expanding the accessibility of San Francisco’s
streets and public transportation system.
More information on paratransit services can be found on the SF Paratransit website:
http://www.sfparatransit.com/ .

DRAFT SFMTA Short Range Transit Plan 80
Title VI Analysis & Report
Pursuant to Circular 4702.1B, SFMTA submitted the agency’s 2013 Title VI Program
Update to the FTA on December 1, 2013. The 2013 document provides an update to
the SFMTA’s 2010 Title VI Program Update, which was submitted to the FTA on
December 1, 2010. In addition to the 2013 Update, SFMTA provided results of the
monitoring program which compares system-wide transit service standards to the
performance of minority and non-minority routes. The update and monitoring report
were approved by the SFMTA Board of Directors in January 2014. The next Title VI
Program Update is due to the FTA on December 1, 2016.
FTA Triennial Review
The most recent FTA Triennial Review of the SFMTA was conducted in May 2016.
Information from this review will be available when the final report is issued later in the
summer of 2016. The previous Triennial Review took place December 16-18, 2013.
Deficiencies were identified in the following six review areas: Technical Capacity;
Satisfactory Continuing Control; Maintenance; Procurement; Disadvantaged Business
Enterprise (DBE); and Equal Employment Opportunity (EEO). A schedule for corrective
actions was created in order to address these deficiencies and included in the final
report completed on January 13, 2014. As of August 2014, the SFMTA had submitted
all necessary information and the FTA had closed the action items (copies of the
Review are available upon request).
Table 17. 2013 FTA Triennial Review, Summary of Findings and Corrective Action Status
CORRECTIVE ACTION RESPONSE DATE
STATUS
Review Area 3. Technical Capacity; Finding: D
03-Progress reports lack required information
Submit updated and completed progress reports with all required information in TEAM-Web. SFMTA is to provide a listing of corrected progress reports to the regional office. Those progress reports that have not been corrected with all required information must be updated by April 30 as stated below.
January 30, 2014
Information submitted. Closed by FTA.

DRAFT SFMTA Short Range Transit Plan 81
CORRECTIVE ACTION RESPONSE DATE
STATUS
Submit to the regional office procedures for ensuring that all required information is included in future reports, including missing completion dates.
March 28, 2014
Information submitted. Closed by FTA.
Submit all remaining reports that have been fully updated and completed with all required information in TEAM-Web. SFMTA is to provide a listing of corrected progress reports to the regional office.
April 30, 2014
Information submitted. Closed by FTA.
05-Excessive delays in project implementation
Submit a cash flow schedule (for federal fiscal quarters two and three) detailing each grant listed in Table 1, (indicating the obligated amount, amount disbursed, last disbursement date, percentage of total federal funds expended, original closeout date and estimated completion date), by activity line item (ALI), and the projected draw down of funds to meet the forecasted close out dates. FTA will monitor adherence to this cash flow schedule quarterly for federal fiscal year 2014.
April 30, 2014 then quarterly through September 30, 2014
Pending.
Submit a milestone schedule (for federal fiscal quarters two and three) of all federally funded projects aligned with the 39 open grants (indicating the obligated amount, amount disbursed, last disbursement date, percentage of total federal funds expended, original closeout date and estimated completion date). FTA will monitor adherence to this schedule quarterly for federal fiscal year 2014.
April 30, 2014 then quarterly through September 30, 2014
Pending.
16 Incorrect FFR reporting
Correct all quarterly FFR reports in TEAM-Web
January 30, 2014
Information submitted. Closed by FTA.
Submit to the regional office procedures for correctly identifying and including federal cash on hand at the end of period (as defined by FTA) in the quarterly FFRs.
March 28, 2014
Information submitted. Closed by FTA.

DRAFT SFMTA Short Range Transit Plan 82
CORRECTIVE ACTION RESPONSE DATE
STATUS
Review Area 4. Satisfactory Continuing Control; Finding: D
08 Excessive fixed route bus spare ratio
Submit to the regional office an updated fleet management plan that includes a specific schedule for reducing the motor coach spare ratio to 20 percent.
April 18, 2014
Information submitted. Closed by FTA.
Review Area 5. Maintenance
04-Late vehicle preventive maintenance
Submit to the regional office a monitoring plan for ensuring that fixed route bus PMs are performed timely.
January 30, 2014
Information submitted. Closed by FTA.
Submit to the regional office a summary report on fixed-route bus PM inspection results that has been signed by the Director of Transportation or delegated authority. The report must indicate that the Director of Transportation or delegated authority has reviewed the PM inspections on a monthly basis until the data demonstrates SFMTA has conducted at least 80 percent of its PMs on time for three consecutive months starting February 1, 2014 (for January 2014 data). For each bus that received a PM inspection during the month, include with the submittal a report that lists the bus number, date of the inspection, mileage of the current inspection, mileage of the previous inspection, and the mileage interval between the two inspections.
Beginning April 18, 2014 then monthly through September 30, 2014
Information submitted. Closed by FTA.
Submit to the regional office documentation of corrective actions implemented for instances where PM inspections were not performed timely.
Beginning April 18, 2014 then monthly through September 30, 2014
n/a
Review Area 6. Procurement; Finding: D
35-Responsibility determination deficiencies

DRAFT SFMTA Short Range Transit Plan 83
CORRECTIVE ACTION RESPONSE DATE
STATUS
Submit to the regional office a process(es) to ensure that the procurement policies and procedures are followed for making and documenting adequate responsibility determinations prior to award of a contract.
April 18, 2014
Information submitted. Closed by FTA.
C-Pre-award and/or post-delivery certifications lacking
Submit to the regional office a process(es) to ensure that the procurement policies and procedures are followed for completing the applicable pre-award and post-delivery audits certifications for future revenue rolling stock procurements.
April 18, 2014
Information submitted. Closed by FTA.
Submit to the regional office documentation that the procurement of buses complied with the Buy America provisions by completing the after the fact post-delivery Buy America certifications.
April 18, 2014
Information submitted. Closed by FTA.
H-No verification excluded parties are not participating
Submit to the regional office a process(es) to ensure that the procurement policies and procedures are followed for searching the SAM before entering into applicable transactions and documenting the results of the search.
April 18, 2014
Information submitted. Closed by FTA.
Submit documentation to regional office that the SAM search was conducted for the Neoplan coach rehabilitation contractor. SFMTA is to ensure that this contractor is not listed as suspended or debarred from participating in covered transactions. Immediately notify the regional office, if SFMTA needs to implement corrective measures, based upon the results of the SAM search.
April 18, 2014
Information submitted. Closed by FTA.
Submit to the regional office a process(es) to ensure that the procurement policies and procedures are followed for compliance with all FTA required procurement elements.
April 18, 2014
Information submitted. Closed by FTA.

DRAFT SFMTA Short Range Transit Plan 84
CORRECTIVE ACTION RESPONSE DATE
STATUS
Submit to the regional office evidence of the implementation of the above process(es).
Beginning April 30, 2014 then quarterly through September 30, 2014
To be implemented. Completed and approved Master Checklists will be forwarded to FTA for all FTA-funded contracts awarded between April 30th and September 30th.
Review Area 7. Disadvantaged Business Enterprise (DBE); Finding: D
20-Uniform reports do not include required information
Develop and submit to the FTA Region IX RCRO procedures for reporting the FTA funded share of awards and commitments in the DBE Uniform Report. The procedures must include how SFMTA will report payments on projects completed during the reporting period.
April 18, 2014
Information submitted. Closed by FTA.
Review Area 18. Equal Employment Opportunity (EEO); Finding: D
01-Inadequate designation of EEO Officer
Submit to the FTA RCRO evidence of corrective actions taken to properly designate EEO responsibilities. This could consist of designating an EEO Officer that is independent of the Human Resources Officer
April 18, 2014
Information submitted. Closed by FTA.

DRAFT SFMTA Short Range Transit Plan 85
OPERATIONS PLAN & BUDGET
The Operations Plan and Budget included in the Short Range Transit Plan outlines the
projected revenues and expenses for Muni transit service as well as other transportation
services provided by SFMTA. It provides a 15-year look ahead for the fixed and
demand-responsive services, including the service enhancements that are a significant
part of the Muni Forward initiative to make transit faster and more reliable for Muni
customers. It also includes other efforts under the purview of SFMTA that are supportive
of the entire transportation system in San Francisco.
CONTENTS Operations Plan ............................................................................................................ 85
Operations Budget ........................................................................................................ 89
Operations Plan
The SFMTA is responsible for all surface transportation in the city, and the operations
plan and supporting budget includes delivery across all modes – transit, walking,
bicycling, ridesharing, and automobile movement. Through the implementation of Muni
Forward, Vision Zero, and the Strategic Plan, the SFMTA has started several

DRAFT SFMTA Short Range Transit Plan 86
agencywide initiatives to improve the safety, reliability, and effectiveness of the city’s
multimodal transportation system.
Muni Service Operations Framework
Under Muni Forward, the SFMTA will continue to deliver the fixed route service as
discussed in previous sections of the document. This service framework enables the
SFMTA to focus investment where demand is high, discontinue low-ridership segments
in order to add connections between neighborhoods and to regional transit, and expand
capacity on heavy-ridership routes.
Muni Metro & Rapid Bus: These heavily used bus and rail lines form the
backbone of the Muni system. With vehicles arriving frequently and transit priority
enhancements along the routes, the Rapid network delivers speed and reliability
whether customers are heading across town, or simply traveling a few blocks.
Frequent Local: These routes combined with Muni Metro and Rapid Bus create
the Rapid network. They provide high-quality, frequent service but with more
stops along the route.
Grid: These citywide routes combine with the Rapid network to form an
expansive core system that lets customers get to their destinations with no more
than a short walk, or a seamless transfer. Depending on demand, they typically
operate less frequently than the Rapid network routes.
Connector: These bus routes predominantly circulate through San Francisco’s
hillside residential neighborhoods, filling in gaps in coverage and connecting
customers to major transit hubs.
Historic: Historic Streetcars and Cable Cars.
Specialized: These routes augment existing service during specific times of day
to serve a specific need, or serve travel demand related to special events. They
include AM and PM commute service, owl service, weekend-only service, and
special event trips to serve sporting events, large festivals and other San
Francisco activities.
This Service Policy Framework serves multiple purposes. First, it provides a clear
understanding of the different roles that transit routes play in the city and sets guidance
for the transit planning process. Second, it guides future transit evaluation and
investments.
The SFMTA evaluates the performance of its routes on a routine basis. Rather than
comparing routes across the system, routes will be compared to similar routes in their
service category. For example, if a route is performing better than its category average,
it would be evaluated for improvements – such as potential service increases – in close
coordination with customers and other key stakeholders.

DRAFT SFMTA Short Range Transit Plan 87
For more information and recent updates on the implementation of Muni Forward,
please check http://muniforward.com/
Muni Forward Service Improvements
The Muni Forward operations plan is the path forward for the agency to achieve its
objectives to improve customer service, communications, and transit performance on its
fixed route service. The extensive planning, environmental assessment, and community
engagement involved in the development these projects and operations plan will ensure
that the Muni Forward initiatives stay within the city’s, region’s, and state’s legal and
regulatory requirements and the agency’s financial constraints.
After the SFMTA’s determination of fiscal health in January 2015, the Board of Directors
approved a three percent increase in transit service in FY 2015 and a seven percent
increase in FY 2016. An additional two percent service increase is proposed for the next
budget cycle. To date, the approved 10 percent service increase has been implemented
resulting in major improvements to transit in San Francisco by:
Increasing frequency of transit service along heavily used corridors.
Creating new routes.
Changing existing route alignments.
Eliminating underutilized routes or route segments.
Introducing larger buses on crowded routes.
Changing the mix of Rapid, Frequent Local, Grid, Connector, and Specialized
services.
Expanding Rapid services.
Though many of these system updates were delivered without physical infrastructure
changes, some of the service changes require capital investments, such as overhead
wire and terminal expansions. A brief description of these capital investments can be
found in the Capital Improvement Program section of this document.
In addition to the Muni Forward portfolio of projects and service upgrades, the SFMTA
will implement a three percent increase in transit service when the Central Subway
revenue service starts. As noted below, T Third service in the Central Subway is
scheduled to start in FY 2020.
Historic Streetcar Transit Service
The historic streetcar transit routes were analyzed as part of the Transit Effectiveness
Project and enhancements to these lines will be implemented in conjunction with the
Muni Forward Service Improvements.
E Embarcadero: A new historic streetcar line has been established to connect the
northeast waterfront to AT&T Park and the Caltrain Station. Launched in the summer of
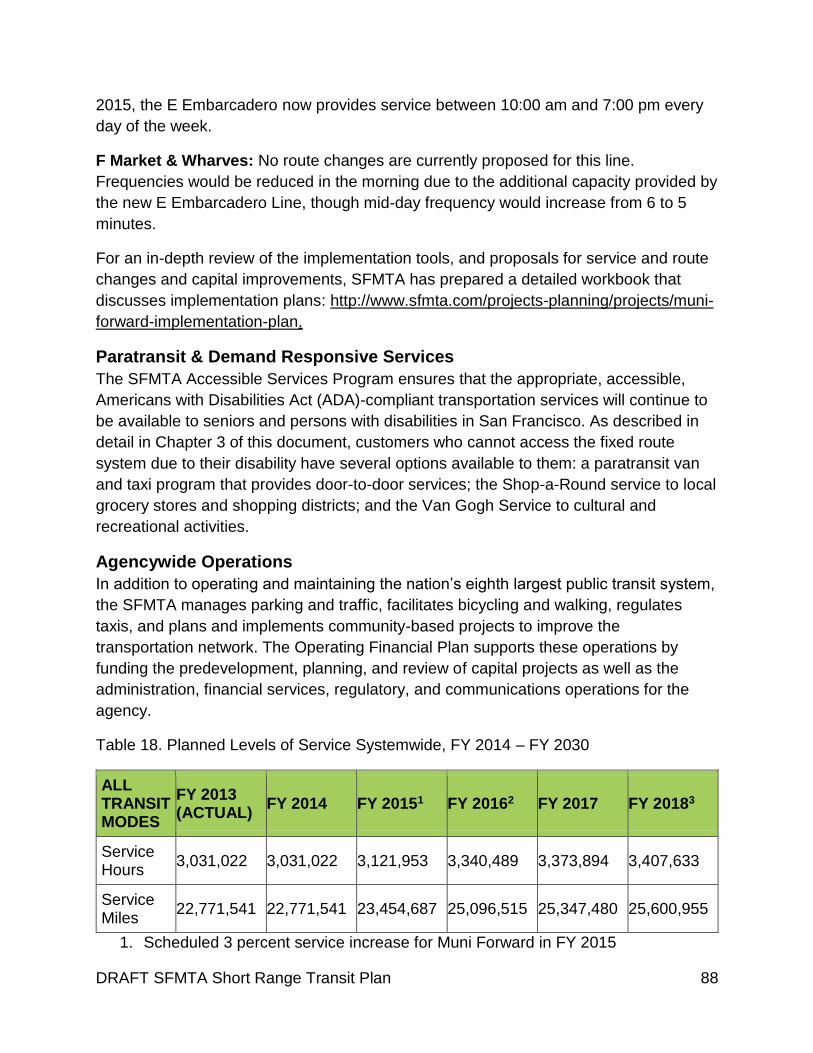
DRAFT SFMTA Short Range Transit Plan 88
2015, the E Embarcadero now provides service between 10:00 am and 7:00 pm every
day of the week.
F Market & Wharves: No route changes are currently proposed for this line.
Frequencies would be reduced in the morning due to the additional capacity provided by
the new E Embarcadero Line, though mid-day frequency would increase from 6 to 5
minutes.
For an in-depth review of the implementation tools, and proposals for service and route
changes and capital improvements, SFMTA has prepared a detailed workbook that
discusses implementation plans: http://www.sfmta.com/projects-planning/projects/muni-
forward-implementation-plan.
Paratransit & Demand Responsive Services
The SFMTA Accessible Services Program ensures that the appropriate, accessible,
Americans with Disabilities Act (ADA)-compliant transportation services will continue to
be available to seniors and persons with disabilities in San Francisco. As described in
detail in Chapter 3 of this document, customers who cannot access the fixed route
system due to their disability have several options available to them: a paratransit van
and taxi program that provides door-to-door services; the Shop-a-Round service to local
grocery stores and shopping districts; and the Van Gogh Service to cultural and
recreational activities.
Agencywide Operations
In addition to operating and maintaining the nation’s eighth largest public transit system,
the SFMTA manages parking and traffic, facilitates bicycling and walking, regulates
taxis, and plans and implements community-based projects to improve the
transportation network. The Operating Financial Plan supports these operations by
funding the predevelopment, planning, and review of capital projects as well as the
administration, financial services, regulatory, and communications operations for the
agency.
Table 18. Planned Levels of Service Systemwide, FY 2014 – FY 2030
ALL TRANSIT MODES
FY 2013 (ACTUAL)
FY 2014 FY 20151 FY 20162 FY 2017 FY 20183
Service Hours
3,031,022 3,031,022 3,121,953 3,340,489 3,373,894 3,407,633
Service Miles
22,771,541 22,771,541 23,454,687 25,096,515 25,347,480 25,600,955
1. Scheduled 3 percent service increase for Muni Forward in FY 2015

DRAFT SFMTA Short Range Transit Plan 89
2. Scheduled 7 percent service increase for Muni Forward in FY 2016
3. Scheduled 2 percent service increase for Muni Forward in FY 2017 – FY2018
Table 18 (continued). Planned Levels of Service Systemwide, FY 2014 – FY 2030
ALL TRANSIT MODES
FY 2019 FY 20204 FY 2021 FY 2022 FY 2023 FY 2024
Service Hours
3,407,633 3,509,862 3,509,862 3,509,862 3,509,862 3,509,862
Service Miles
25,600,955 26,368,984 26,368,984 26,368,984 26,368,984 26,368,984
4. Scheduled 3 percent service increase for Central Subway service in FY2020
Table 18 (continued). Planned Levels of Service Systemwide, FY 2014 – FY 2030
ALL TRANSIT MODES
FY 2025 FY 2026 FY 2027 FY 2028 FY 2029 FY 2030
Service Hours
3,509,862 3,509,862 3,509,862 3,509,862 3,509,862 3,509,862
Service Miles
26,368,984 26,368,984 26,368,984 26,368,984 26,368,984 26,368,984
Operations Budget
The San Francisco City Charter requires the SFMTA to submit a balanced, agencywide
two-year budget. The SFMTA Operating Budget is based on revenue projections from
the following sources: passenger fares (both fixed route & paratransit); fines, fees, and
permits; revenues from parking meters and garages; operating grants; and the transfer
from the City and County of San Francisco General Fund.
As part of the development of the two-year budget, the public is engaged to provide
input throughout the budget process. Outreach includes Town Hall meetings, public
hearings before the Board, presentations to the Board of Supervisors, and collection of
public comment via other means such as mail and email. The Citizens’ Advisory Council
also holds several meetings to consider the budget.
The City Charter requires that SFMTA submit a two-fiscal year budget in even-
numbered years, and it may submit budget amendments for the second fiscal year in
odd-numbered years if the second year requires amending. The budget is approved by
the SFMTA Board of Directors and is submitted to the Mayor and Board of Supervisors
by May 1. The Mayor and the Board of Supervisors do not have line item authority over
the SFMTA Budget. The Board of Supervisors may allow the SFMTA’s entire budget to

DRAFT SFMTA Short Range Transit Plan 90
take effect without any action on its part or may reject the budget in its entirety by
seventh-eleventh vote.
Table 19. Summary of Revenues for FY 2016 Amended Budget and the FY 2017 and
FY 2018 Proposed Budget
BUDGET CATEGORY (in millions)
FY 2016 BUDGET
FY 2017 PROPOSED BUDGET
FY 2018 PROPOSED BUDGET
Transit Fares $201.0 $205.9 $207.9
Operating Grants $132.0 $145.7 $148.5
Parking and Traffic Fees and Fines
$292.1 $324.5 $337.9
Other (Advertising, Interest, Taxi, and Service Fees)
$58.2 $83.8 $83.1
General Fund Transfer (Based on City Charter)
$272.0 $291.5 $299.3
Use of Available Fund Balance $20.0 $45.0 $47.0
Subtotal Operating Budget $975.3 $1,096.4 $1,123.7
Capital Projects Funded by Operating Revenues
$42.6 $85.1 $130.2
TOTAL $1,017.9 $1,181.5 $1,253.9
Table 20. Summary of Expenditures for FY 2016 Amended Budget and the FY 2017
and FY 2018 Proposed Budget
BUDGET CATEGORY (in millions)
FY 2016 BUDGET
FY 2017 PROPOSED BUDGET
FY 2018 PROPOSED BUDGET
Salaries & Benefits $598.5 $643.7 $675.4
Contracts & Other Services $115.4 $151.3 $154.7
Materials & Supplies $80.3 $76.3 $78.4
Equipment & Maintenance $14.5 $16.1 $27.6
Rent & Building $6.8 $11.8 $12.8

DRAFT SFMTA Short Range Transit Plan 91
BUDGET CATEGORY (in millions)
FY 2016 BUDGET
FY 2017 PROPOSED BUDGET
FY 2018 PROPOSED BUDGET
Insurance, Claims & Payments to Other Agencies
$62.5 $67.0 $67.5
Rainy Day Reserve $6.9 $0.5 $0.5
Services from City Departments
$62.0 $67.1 $68.7
Transfers to Current Capital Projects
$15.4 $62.6 $38.1
Subtotal Operating Budget $962.3 $1,096.4 $1,123.7
Capital Projects Funded by Operating Revenues
$55.6 $85.1 $130.2
TOTAL $1,017.9 $1,181.5 $1,253.9
Long-Term Projected Operations Revenues and Expenses
The Operating Financial Plan goes beyond the projections for the two-year balanced
budget. This financial plan is based on historical information, long term trends, and
estimates of projected revenues and expenses for the agency. These projections are
not designed to be an accurate forecast for any specific year, but instead help the
agency and its stakeholders understand the projected financial picture. Therefore, the
Operating Financial Plan reflects a balanced Operating Budget through FY 2016, as
approved by the current Board of Directors, and a projection of future operating needs
and expected operating revenues.
Specifically, the following assumptions were made:
The SFMTA 5-Year Operating Plan (FY 2016 – FY 2020) assumes a 3 percent
annual increase in operating expenses between FY 2017 and FY 2020. These
projections are based on the FY 2016 approved operating budget as the starting
base and includes certain costs above the base year, including but not limited to,
transit service increase, Central Subway service, known negotiated labor
increases, and additional lease payments for new facilities. A 10 percent
approved increase in transit service is part of the FY 2016 the base year.
The SFMTA 5-Year Operating Plan also assumes a 3 percent annual increase in
operating revenues between FY 2017 and FY 2020. These projections are
based on the FY 2016 approved operating budget as the starting base and

DRAFT SFMTA Short Range Transit Plan 92
includes certain expected adjustments including a decline in Taxi medallion
sales, assumption of a 2 percent annual increase for operating grants (instead of
3 percent) except Bridge Tolls which are assumed to be flat amount for all future
years based on feedback from MTC, and additional revenue from development
fee, cap and trade revenues for operations and fare revenues for additional
service increases highlighted above.
Between FY 2021 through FY 2040, operating expenses are projected to
increase by 3-4 percent annually and revenue by 3-4 percent except for Bridge
Tolls which are assumed to be flat amount for all future years based on feedback
from MTC.
Funding SFMTA Operations & Changes in Transit Service
On March 28, 2014, the Board approved up to a 12 percent Muni Forward transit
service increase. Ten percent of this overall increase is to be implemented in the FY
2016 two-year budget cycle – a 3 percent service increase in FY 2015 and a 7 percent
service increase in FY 2016.
These approved Muni Forward service increases as well as those associated with the
Central Subway project are included in the Operating Expenses section (both labor and
non-labor) in the Operating Financial Plan. These expenditures include the annual
operating and maintenance (O&M) costs for this service, as calculated by the SFMTA
O&M model: staff wages and benefits, fuel (electricity, diesel, and biodiesel), materials
and supplies, professional services, etc.
The last line of the Operating Financial Plan shows the projected funding gap for FY
2017 through FY 2030. During each budget cycle, the SFMTA works with policy makers
to close that gap through a combination of revenue measures and expenditure
reductions.
Projected Changes in Fare Revenues
Muni fare increases are based on a formula set in 2009 by the SFMTA Board of
Directors to create a more predictable and transparent mechanism for setting charges.
The formula is based on a combination of the Bay Area Consumer Price Index for all
urban consumers (CPI-U) and labor costs. The projected increases in fare revenue are
included as a consistent increase in the Operating Financial Plan.
Free Muni Program
In FY 2013 and FY 2014, the SFMTA implemented a pilot program to provide free Muni
service for low and moderate income youth funded through a variety of grants. The
program was continued through FY 2016 through a gift from Google. In May 2014 the
SFMTA Board extended the program to include 18 year olds. In January 2015, the
SFMTA Board voted to expand this program. The SFMTA now provides free Muni for

DRAFT SFMTA Short Range Transit Plan 93
more than 60,000 low and moderate income youth (ages 5-18), 19 - 22-year-olds
enrolled in San Francisco Unified School District programs, seniors (ages 65+), and
people with disabilities who use a Clipper® card. More information and applications for
this program can be found at www.sfmta.com/freemuni.
Labor and Contract Expenses
The current labor agreements, negotiated in 2014-5, will end in fiscal year 2017 at
which point expenses due to a labor and service contracts may change. Increased labor
and contract expenses are included as an annual increase shown in the Operating
Financial Plan.
Paratransit Funding Sources
Paratransit Services, both Americans with Disabilities Act (ADA) service and non-ADA
demand-responsive services are funded through the mix of federal and local funding
sources listed Operating Financial Plan.

DRAFT SFMTA Short Range Transit Plan 94
Recent History of Operating Expenses & Revenues
Figure 13. Operating Expenses, FY 2011 - FY 2016 (in millions)
OPERATING EXPENSES
FY2012 FY2013 FY2014 FY2015 FY2016 projected
Salaries $339.3 $339.0 $347.0 $374.5 $403.5
Benefits $171.1 $171.2 $182.6 $196.9 $199.4
Fuel, Lubricants, materials and supplies
$71.3 $74.7 $94.5 $90.1 $98.2
Professional Services and/or work orders
$102.2 $120.8 $131.8 $138.0 $160.9
Other $125.4 $165.8 $129.1 $177.4 $137.2
TOTAL $809.3 $871.5 $885.0 $976.9 $999.2
Figure 14. Operating Revenues, FY 2011 - FY 2016 (in millions)
OPERATING REVENUES
FY2012 FY2013 FY2014 FY2015 FY2016 projected
Passenger Fares
$202.3 $220.1 $212.9 $214.7 $204.6
General Fund Transfer
$212.6 $222.4 $243.9 $272.3 $277.1
Parking Meters & Garages
$152.5 $175.7 $195.2 $195.5 $203.2
Fines, Fees, & Permits
$121.2 $127.8 $155.2 $128.4 $120.6
Operating Grants
$115.3 $144.0 $139.2 $146.6 $135.1
Other $22.7 $25.3 $28.3 $53.0 $62.7
TOTAL $826.6 $915.3 $974.7 $1,010.5 $1,003.3
NOTE: FY2016 projection does not include encumbrance and carry forward

DRAFT SFMTA Short Range Transit Plan 95
Table 21. SFMTA Operating Financial Plan (in $ 1,000s), 2015-2032
[Table available upon request as a separate document – SEE ATTACHED]
DRAFT SFMTA Short Range Transit Plan 96
CAPITAL FINANCIAL PLAN
The San Francisco Municipal Transportation Agency’s (SFMTA) Capital Improvement
Program (CIP) matches projected funding to the infrastructure investments, fleet
procurements, and initiatives prioritized in the 20-year Capital Plan to improve the
safety, reliability and efficiency of the transportation system.
CONTENTS SFMTA Capital Planning Goals, Policies & Processes ................................................. 96
SFMTA Capital Financial Plan, FY 2017 – FY 2026 ..................................................... 97
Transit Capital Programs ............................................................................................. 101
Other SFMTA Capital Programs ................................................................................. 136
SFMTA Capital Planning Goals, Policies & Processes
The SFMTA develops multimodal and mode-specific strategies to determine the city’s
transportation capital needs and allocate resources effectively to meet its goals. The 20-
year Capital Plan brings the elements of these strategies together and provides an
unconstrained list of capital needs. These capital needs are prioritized based on
DRAFT SFMTA Short Range Transit Plan 97
performance criteria informed by the SFMTA Strategic Plan and determined by the
SFMTA Executive Team.
The five-year Capital Improvement Program (CIP) takes the prioritized projects, plans,
strategies, and initiatives from the 20-year Capital Plan and matches them with
projected funding availability. This matching process results in a financially-constrained
five-year program of projects for the transportation system in San Francisco. The CIP
also develops a Strategic Investment/Value Analysis for project prioritization and
funding, and strives to prevent funding accessibility from being a barrier to project
delivery.
The CIP also serves as an implementation tool for the SFMTA Strategic Plan and other
plans and strategies, ensuring that the actions and recommendations from that planning
work are assigned funding and initiated on a predefined schedule. Significant
community input is an integral part of development of the five-year CIP and public
engagement will continue to serve an essential role in further defining and improving the
projects in the CIP prior to their implementation.
SFMTA Capital Financial Plan, FY 2017 – FY 2026
The Capital Financial Plan is a combination of the SFMTA’s Capital Plan and Capital
Improvement Program (CIP) covering FY 2017 through FY 2026. The first five years of
the Capital Financial Plan is the FY 2017-FY 2021 CIP. FY 2022 through FY 2026 are
based on forecasts made from the Capital Plan on the needs side and the CIP on the
revenue side.
In July 2016, the SFMTA Board is anticipated to approve the FY 2017 - FY 2021 Capital
Improvement Program (CIP) that includes funding for the following:
State of Good Repair at an average of $345 million per year, including full
replacement of the Muni bus fleet, an on-going transit fleet overhaul program,
and increased funding for traffic signals and facilities;
Street-related improvements, including significant funding for implementation of
the Vision Zero (Bicycle and Pedestrian Strategies); and
Muni Forward projects, along with an increase in the light rail vehicle and
articulated (60-foot) bus fleets.
Capital Funding Sources
In an effort to show local support for transportation, SFMTA and the City and County of
San Francisco have undertaken a number of strategies to address transportation
funding. The 2013 Mayor’s Transportation Task Force recommended issuing two $500

DRAFT SFMTA Short Range Transit Plan 98
million general obligation bonds, restoring the state vehicle license fee to 2 percent, and
implementing a half-cent sales tax dedicated to transportation.
The first of the two general obligation bonds was approved by voters in 2014, and has
been programed in the Capital Financial Plan. The next bond, anticipated for 2024, is
not yet programmed and will be included as a separate line item in the Capital
Improvement Program if and when approved by San Francisco voters. Additionally, the
Transportation Sustainability Fee, which replaces and enhances the existing Transit
Impact Development Fee (TIDF) for new developments, was approved and went into
effect on December 26, 2015. The TIDF only applied to non-residential development,
while the TSF applies to most new development and changes of use citywide, including
large, market-rate residential projects. Affordable housing, small businesses and
residential developments with 20 or fewer units are exempt. The fee amounts are
assessed in proportion to the size and use of the proposed development. The fee is
estimated to generate about $14 million more per year than the former TIDF revenues.
SFMTA Capital Programs
For budgeting and capital planning purposes, SFMTA’s capital projects are sorted into
capital programs that generally reflect the type of investment. However, due to the
multimodal nature of most SFMTA projects, the line-by-line amount for each program
does not reflect the total investment in that type of transportation infrastructure or
program. For example, many transit enhancement projects also have elements that will
improve accessibility and infrastructure for people walking and bicycling.
The FY 2017 – FY 2021 Capital Improvement Program (CIP) matches projects funding
sources to specific projects for the first half of this 10-year look ahead. It is a living
document and technical adjustments to the CIP are made on an ongoing basis. Recent
updates and detailed expenditure projections are online at:
https://www.sfmta.com/about-sfmta/reports/fy-2015-2019-capital-improvement-program.

DRAFT SFMTA Short Range Transit Plan 99
Figure 15. Capital Improvement Program Map, as of June 2016

DRAFT SFMTA Short Range Transit Plan 100
Table 22. FY 2017 – FY 2021 Summary of Expected Capital Revenue by Source, as of
June 2016
FUNDING SOURCE
FY 2017 FY 2018 FY 2019 FY 2020 FY 2021
Federal $504,684,013 $401,729,671 $170,788,220 $165,404,719 $86,652,903
State $108,390,513 $3,593,948 $1,325,000 $6,325,000 $12,509,000
Local Subtotal
$489,049,556 $355,005,293 $553,536,634 $266,464,998 $229,359,934
General Obligation Bond*
$91,995,439 $78,099,669 $91,072,640 $87,356,386 $13,526,473
Revenue Bond $157,500,000 $ - $73,334,000 $1,666,000 $75,000,000
Other $239,554,117 $276,905,624 $389,129,994 $177,442,612 $140,833,461
TOTAL $1,102,124,082 $850,328,911 $725,649,855 $438,194,717 $328,521,837
Table 23. FY 2017 – FY 2021 Capital Improvement Program Summary, as of June 2016
CAPITAL PROGRAMS
FY 2017 FY 2018 FY 2019 FY 2020 FY 2021
Central Subway $154,000,000 $150,000,000 $98,520,516 $ - $ -
Facility $93,679,430 $52,392,781 $36,424,650 $10,500,000 $50,500,000
Fleet $504,587,106 $352,244,684 $158,885,870 $101,279,436 $73,221,129
Transit Fixed Guideway $48,318,938 $40,648,918 $63,644,097 $34,947,798 $35,476,917
Transit Optimization & Expansion $224,225,939 $158,361,857 $259,096,562 $229,206,396 $107,134,634
TOTAL TRANSIT $1,024,811,412 $753,648,240 $616,571,695 $375,933,630 $266,332,680
Communications/ IT Infrastructure $8,772,000 $350,000 $700,000 $700,000 $700,000
Parking $1,200,000 $5,000,000 $10,000,000 $ - $ -
Security $5,598,567 $10,070,567 $3,000,000 $3,000,000 $3,000,000
Streets $26,079,388 $56,158,059 $79,071,910 $49,389,817 $46,049,000
Taxi $400,000 $400,000 $400,000 $400,000 $400,000

DRAFT SFMTA Short Range Transit Plan 101
CAPITAL PROGRAMS
FY 2017 FY 2018 FY 2019 FY 2020 FY 2021
Traffic & Signals $31,562,715 $20,052,045 $15,206,250 $7,995,270 $11,840,157
Other $3,700,000 $4,650,000 $700,000 $776,000 $200,000
TOTAL OTHER $77,312,670 $96,680,671 $109,078,160 $62,261,087 $62,189,157
TOTAL CIP $1,102,124,082 $850,328,911 $725,649,855 $438,194,717 $328,521,837
Transit Capital Programs
Transit Optimization & Expansion
SFMTA is currently embarking on an ambitious plan to modernize and expand Muni,
collectively called Muni Forward. These initiatives will make Muni more efficient,
reliable, safe and comfortable for its existing 700,000 daily passengers – and will help
prepare the system for future growth. Many of the Muni Forward projects in the Transit
Optimization & Expansion CIP were planned through the Transit Effectiveness Project’s
(TEP) years of data collection, intensive planning and public outreach efforts. The
SFMTA is also implementing a combination of policies, programs, information, services,
and tools that help optimize transportation infrastructure and operations, and support
the use of sustainable modes for all trips. The Major Expansion Projects section of this
document has a more detailed update on two other ongoing major infrastructure
projects, the Central Subway and the Van Ness Bus Rapid Transit Project.

DRAFT SFMTA Short Range Transit Plan 102
Figure 16. Muni Forward Transit Priority Project
DRAFT SFMTA Short Range Transit Plan 103
Muni Forward Capital Improvements
Muni Forward includes engineering improvements—also known as Transit Priority
Projects (TPPs)—designed to address transit delay, improve reliability, and increase the
safety and comfort of customers along the most heavily used Rapid routes. The TPPs
include a variety of standard roadway and traffic engineering features that specifically
address the root causes of delay and passenger frustration, including traffic congestion,
transit stops that are spaced too close together, narrow travel lanes, and slow boarding
times. These elements are referred to as the Transit Priority Features (TPF) and include
lane modifications, traffic signal and stop sign changes, transit stop changes, parking
and turn restrictions, pedestrian improvements, and many others.
Detailed proposals have been developed for eleven corridors and conceptual proposals
were developed for an additional six. As the TPPs affect the allocation of scarce
roadway space among different users by utilizing space for elements that prioritize
transit, more than one alternative was typically proposed at locations with limited
roadway space, each balancing different trade-offs. The precise components of each
Muni Forward Transit Priority Project to be implemented will be decided by the SFMTA
Board of Directors, who will consider the details of the project proposals as well as the
results of the environmental impact analysis, following public outreach for each
individual Muni route.
Muni Forward Transit Priority Projects will be implemented based on funding and
resources available. As of May 2016, more than ten projects (40 miles of investment)
are in the preliminary planning and engineering stages and have funding strategies
identified for construction. Of these projects 21 miles have been approved and are
either under construction or will be in the near future. To minimize customer disruption
and optimize financing, projects will be implemented in segments.
The City and County of San Francisco’s 2014 Capital Plan and the San Francisco 2030
Transportation Task Force (T2030) have both recommended General Obligation Bond
(GO Bond) funding for design and construction of many Muni Forward projects. On
November 4, 2014, San Francisco voters approved Proposition A which includes $150
million in funding proposed to design and build Muni Froward projects. Future funding is
expected from other sources for a combined total funding of $230 million. Vision Zero
improvements, including bicycle, pedestrian, and accessibility capital improvements will
be built in coordination with Muni Forward Transit Priority Projects to improve safe and
easy access to transit.
Project Area: The Rapid & Transit Priority Network of core routes serves nearly 70
percent of all riders all over the city. These projects are geographically diverse and
improve the network as a whole, thereby improving transit service for all customers.

DRAFT SFMTA Short Range Transit Plan 104
Estimated Project Cost: The following is only a partial list of the Transit Optimization
projects that the SFMTA will implement in the near term. More information on specific
project costs and funding sources is available in the SFMTA FY 2015 – FY 2019 Capital
Improvement Program document and the periodic Status Reports to the General
Obligation Bond Oversight Committee.
Construction Timeline: The Muni Forward Rapid Network Capital Improvements were
environmentally cleared through the TEP planning effort in March 2014. Construction is
underway on many projects.
More detail on line-by-line enhancements can be found on the individual route pages in
the Muni Forward Implementation Workbook posted on: http://www.sfmta.com/projects-
planning/projects/muni-forward-implementation-plan
Table 24. Ongoing and Future Muni Forward Projects*
RAPID & TRANSIT PRIORITY NETWORK CAPITAL IMPROVEMENTS
ESTIMATED PROJECT COST
Surface Signaling on Embarcadero and Third Street $11,348,000
Turnback Pocket Track at Harrison $10,120,000
West Portal Transit Safety and Reliability Project $1,629,000
14 Mission - 11th St to Randall (Inner) Rapid Project $287,000
14 Mission - Randall to Terminal (Outer) Rapid Project $8,550,000
14 Mission - Spear to 11th St (Downtown) Rapid Project $8,307,000
14 Mission Overhead Contact System (OCS) Improvements on Mission Street between 30th and Cortland
$1,500,000
22 Fillmore - 16th Street Transit Priority Project $67,065,000
22 Fillmore - OCS on Church/Duboce Transit Priority Project $2,000,000

DRAFT SFMTA Short Range Transit Plan 105
RAPID & TRANSIT PRIORITY NETWORK CAPITAL IMPROVEMENTS
ESTIMATED PROJECT COST
27 Bryant Tenderloin Transit Reliability Project $6,890,000
28 19th Ave - South of Golden Gate Park Rapid Project $22,965,000
30 Stockton - Chestnut Transit Priority Project $6,510,000
30 Stockton - North Point & Polk (coordinated with Polk Streetscape) Transit Priority Project
$372,000
30 Stockton - North Point, Columbus, and Northern Stockton to Broadway Transit Priority Project
$6,400,000
30 Stockton - OCS Marina Terminal Upgrades $4,307,000
30 Stockton - Stockton (Broadway to Tunnel) Transit Priority Project
$8,705,000
30 Stockton - Van Ness & Bay (coordinated with Van Ness BRT) Transit Priority Project
$404,000
31 Balboa Transit Priority and Pedestrian Accessibility Improvements
$1,440,000
7 Haight-Noriega - Stanyan to Masonic + Signals Transit Priority Project
$14,171,000
8 Bayshore - Geneva & Visitacion Valley Transit Priority Project $20,698,000
8 Bayshore - San Bruno Ave $4,076,000
Better Market Street $160,122,000
California Cable Car Safety Improvements $3,000,000
Central Subway Phase 3 Planning and Outreach $1,250,000
E/F - Pier 39 Platform Relocation $946,000
Geary BRT Phase 1: Design and Construction of Near-Term Improvements
$32,780,000
Geary BRT Phase 2 : CER & Preliminary Detail Design $21,100,000
Geneva Harney Bus Rapid Transit Project $31,304,000
L Taraval - Surface Route Rapid Project $63,589,000
M Line / 19th Avenue Subway $22,800,000
N Judah - Carl and Cole Transit and Streetscape Enhancements $450,000
* Data from Draft 2017-2021 Capital Improvement Program

DRAFT SFMTA Short Range Transit Plan 106
Better Market Street
This project will deliver improvements on Market Street, with the goal to revitalize
Market Street from Octavia Boulevard to The Embarcadero and reestablish the street as
the premier cultural, civic and economic boulevard. This project will create a sense of
place, optimize mobility, and foster economic development by:
Supporting the City of San Francisco’s planned growth and economic
development.
Providing faster and more reliable transit service for all users.
Improving safety, comfort and mobility for pedestrians and bicyclists.
Creating thriving public spaces that attract a diversity of people and uses.
There are currently three design options that will be included in the environmental
review documents. The specific design varies, but each of the alternatives have
elements that will enhance the sidewalks and pedestrian safety, improve the bicycle
facilities, and make transit safer, faster, and more reliable.
The Better Market Street project is an interagency effort led by the Department of Public
Works with substantial input from the design team consisting of staff from: the Planning
Department (urban design lead), the SFMTA (transportation lead), the Public Utilities
Commission, the Office of Economic and Workforce Development, and the County
Transportation Authority.
Project Area: The project encompasses Market and Mission Streets between Octavia
Boulevard and The Embarcadero
Estimated Project Cost: Better Market Street has many coordinating projects within its
scope. In 2014, the SFMTA’s Transit Optimization & Expansion CIP initially
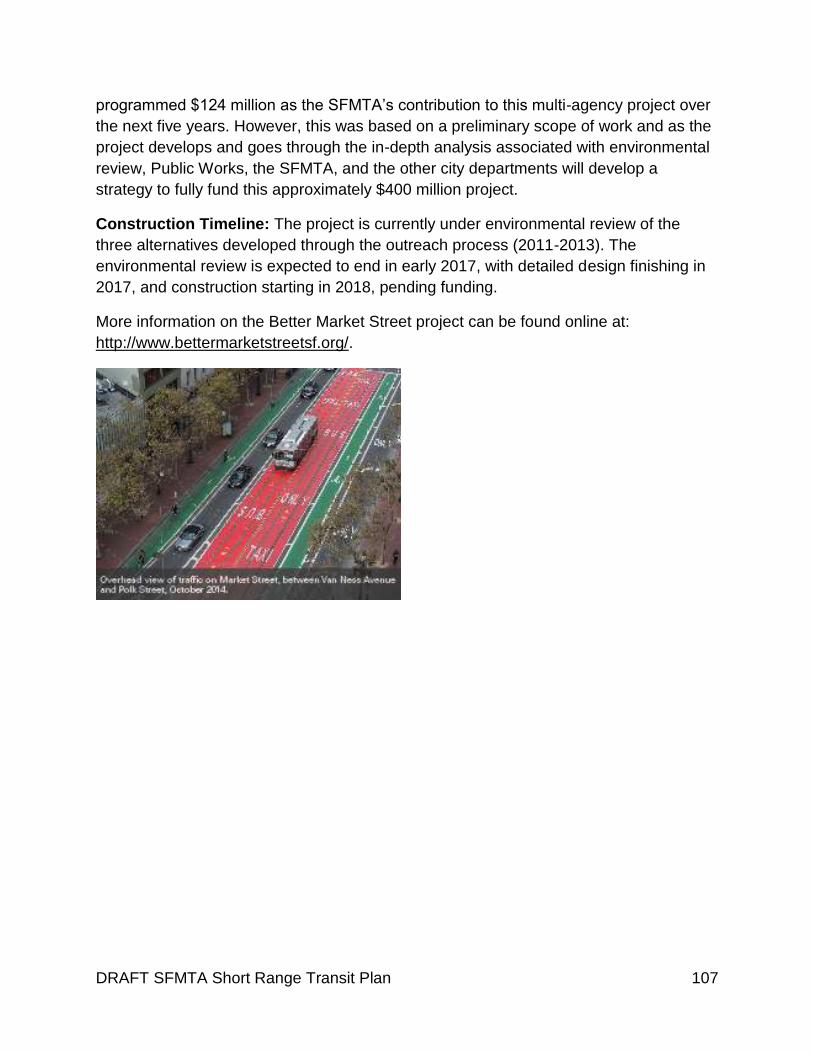
DRAFT SFMTA Short Range Transit Plan 107
programmed $124 million as the SFMTA’s contribution to this multi-agency project over
the next five years. However, this was based on a preliminary scope of work and as the
project develops and goes through the in-depth analysis associated with environmental
review, Public Works, the SFMTA, and the other city departments will develop a
strategy to fully fund this approximately $400 million project.
Construction Timeline: The project is currently under environmental review of the
three alternatives developed through the outreach process (2011-2013). The
environmental review is expected to end in early 2017, with detailed design finishing in
2017, and construction starting in 2018, pending funding.
More information on the Better Market Street project can be found online at:
http://www.bettermarketstreetsf.org/.

DRAFT SFMTA Short Range Transit Plan 108
Geary Bus Rapid Transit Project
Geary is one of the most heavily used surface transit corridors in the western United
States with over 50,000 daily riders. The Geary corridor is also part of the city’s Vision
Zero high-injury network and has a collision rate eight times the citywide average. The
goals of the Geary Bus Rapid Transit (BRT) Project are to offer more efficient and
reliable transit service, manage increasing traffic congestion, improve safety conditions,
and update the existing infrastructure and streetscape to provide a more complete
street.
The proposed project elements include: dedicated bus lanes, stop optimization and
consolidation, signal improvements and advanced Transit Signal Priority (TSP)
infrastructure, high-quality bus shelters, and new surface crossings and intersection
treatments such as bulb outs.
Project Area: The Geary BRT project area covers the Geary corridor from Market
Street to 34th Avenue, including Geary Boulevard, Geary and O’Farrell streets.
Estimated Project Cost: The cost estimate for the full BRT project, including both
near-term and full implementation phases, is approximately $300 million. The SFMTA’s
Transit Optimization & Expansion CIP has programmed approximately $40 million for
initial project phases over the next five years. Pending certification and selection of a
locally preferred alternative (LPA), the project is competing for an FTA small starts grant
of up to $100 million. As the project is further defined after the environmental review
process, this cost will be refined as needed.
Construction Timeline: The environmental review phase is approaching completion
pending the selection of an LPA by the San Francisco County Transportation Authority
and SFMTA boards in October 2016. The SFMTA has developed a phased construction

DRAFT SFMTA Short Range Transit Plan 109
approach to offer near-term transit and safety benefits in advance of construction of the
full BRT project. Pending project approval, Phase 1 construction between Market and
Stanyan streets would begin as early as November 2016 with stop changes and the
painting of the red transit-only lanes west of Gough Street. Concrete curb construction
and traffic signal work are scheduled to begin in Winter 2017. Phase 1 is estimated to
be complete in 2020 at which point Phase 2 construction would convene.
More information on Geary Bus Rapid Transit can be found online at:
http://www.sfcta.org/geary-corridor-bus-rapid-transit-home

DRAFT SFMTA Short Range Transit Plan 110
Geneva-Harney Bus Rapid Transit Project
The Geneva-Harney BRT project closes a critical east-west gap in San Francisco’s
rapid transit network. The seven mile project will provide exclusive bus lanes, transit
signal priority, high-quality stations, low floor buses and pedestrian and bicycle
amenities between Balboa Park and Hunters Point Shipyard. High capacity, high
frequency bus service will be provided to the communities of Outer Mission, Crocker-
Amazon, Visitacion Valley, Executive Park and newly developed areas of Candlestick
Point and The Shipyard at Hunters Point. The project will also provide BRT service to
the Bayshore neighborhood of Daly City.
SFMTA is currently undertaking a pre-environmental analysis of the first phase of this
two-phase project:
g the community using existing right of way, and
performing planning and environmental review work on the US 101 interchange and
Geneva extension projects.
US 101 interchange and Geneva extension projects and
operate BRT service on the newly constructed infrastructure.
Project Area: The Geneva-Harney BRT project area consists of Geneva Avenue from
San Jose Avenue to Bayshore Boulevard and Bayshore Boulevard to Arleta Way /
Blanken Avenue. From Blanken Avenue east to Thomas Melon Circle, several potential
alignment routes are currently under review. From Thomas Melon Circle, the BRT route
will travel on a mix of an exclusive transit guideway and mixed-flow operations through
the Candlestick Point and Hunters Point Shipyard developments, ending at the future
Hunters Point Transit Center.
Estimated Project Cost: The SFMTA’s Transit Optimization & Expansion CIP has
programmed just over $28 million for initial project phases over the next five years. As

DRAFT SFMTA Short Range Transit Plan 111
the project is further defined after the environmental review process, this cost will be
refined as needed.
Construction Timeline: This project is currently in a pre-environmental review phase. It
is projected that the environmental review of the alternatives will begin in 2017 and
completed by 2019 with construction of the full project starting in 2021 following design
and a full funding plan.

DRAFT SFMTA Short Range Transit Plan 112
Central Subway
The Central Subway Project will construct a modern, efficient light rail line that will
improve public transportation in San Francisco. This new 1.7-mile extension of Muni’s T
Third Line will provide direct connections to major retail, sporting and cultural venues
while efficiently transporting people to jobs, educational opportunities and other
amenities throughout the city. With stops in South of Market (SoMa), Yerba Buena,
Union Square and Chinatown, the Central Subway will vastly improve transit options for
the residents of one of the most densely populated neighborhoods in the country,
provide a rapid transit link to a burgeoning technology and digital-media hub, and
improve access to a premier commercial district and tourist attraction.
The Central Subway Project is the second phase of the San Francisco Municipal
Transportation Agency’s (SFMTA) Third Street Light Rail Transit Project. Phase 1 of the
project, which was completed in April 2007, constructed a 5.4-mile light-rail line along the
densely populated 3rd Street corridor. Phase 2, the Central Subway, will extend the T Third
Line from the 4th Street Caltrain Station to Chinatown. Due to the large budget and scope
of the project, Central Subway was designated as a separate program in this five-year CIP.
More information on the Central Subway project can be found in the Expansion Projects
section of this document.

DRAFT SFMTA Short Range Transit Plan 113
Transit Fixed Guideway
Muni’s Transit Fixed Guideway light rail, streetcar and historic cable car services are a
crucial component of transportation in San Francisco. With over 70 miles of track and
189,000 daily customers, vehicles on Muni’s Fixed Guideway rights-of-way carry nearly
30 percent of daily Muni ridership.
Muni’s Fixed Guideway CIP covers a broad spectrum of capital projects to maintain,
replace, and enhance these services. Projects are supported by a combination of local,
regional, statewide and federal sources and can span everything from rail grinding to
station improvements, including: investing in new train control technology; track
replacement; maintenance facility upgrades; and maintaining Muni’s over 150 miles of
overhead wires.
This capital program is also very closely related to the Communications & Information
Technology Infrastructure capital program and the implementation of the projects are
coordinated as much as possible to avoid additional disruptions to service. For example,
the replacement of the blue light phone system is scheduled during the shutdowns for
the Twin Peaks Tunnels rail replacement so that all infrastructure upgrades may be
constructed at the same time.
Muni Fixed Guideway projects planned for the near term include investments in new
track switching systems at up to 38 critical locations throughout the city; track repairs on
the L Taraval Line, the F Market/Wharves line, and the M Oceanview Line at 19th Ave
and Rossmoor; phase I of rail grinding from Castro to Embarcadero stations, Van Ness
Station and Muni Metro Turnback subway replacement wiring; and phase II of the
overhead wire replacement on the 33 Stanyan route. Additionally, there are major near-
term fixed guideway upgrades that will improve operations and maintain the Agency’s
infrastructure at the Twin Peaks Tunnel Rail Replacement, and the Mission Bay Loop.
The SFMTA recently completed the Rail Capacity Strategy, a strategic planning effort in
assessing the capacity needs of the light rail system. The SFMTA has developed the
Rail Capacity Strategy to identify where rail capacity is needed, and which
improvements to infrastructure or transit service will help meet those needs.
Recommended strategies include alleviating bottlenecks, improving the vehicle fleet,
expanding or extending the light rail system, and building system resiliency. The
strategy also informs the Metropolitan Transportation Commission (MTC) led Transbay
Core Capacity Study as well as the next Regional Transportation Plan.

DRAFT SFMTA Short Range Transit Plan 114
Sunset Tunnel Rail Replacement
The Sunset Tunnel Trackway Improvement Project aims to improve the safety and
reliability of the N Judah Line by replacing track and other infrastructure inside the
Sunset Tunnel. The project will bring the following improvements to the tunnel and the N
Judah Metro Line:
Rail replacement: New track for a smoother, faster ride on Muni
Overhead Contact System (OCS) replacement: An improved overhead wire
system to enhance safety and reliability of the N Judah Line
Fire safety system upgrades: Refurbishing fire water valves
Seismic upgrades: Structural retrofit of the Sunset Tunnel portal retaining walls
and their foundations
Transit signal upgrades: Addition of transit signal priority for rail cars at nine
intersections
Accessible platforms: Construction of two accessible platforms at 28th Avenue to
provide safe boardings for all customers
Project Area: The Sunset Tunnel Trackway Improvement Project will improve the tunnel
infrastructure located between Cole Valley and Duboce Triangle, upgrade the traffic and
transit signals at the Irving Street/Sunset Boulevard intersection and along the N Judah
corridor from 19th Avenue to Stanyan Street. The new accessible platforms will be
constructed at 28th Avenue.
Estimated Project Cost: The Sunset Tunnel Rail Replacement project is expected to cost
$29.5 million.
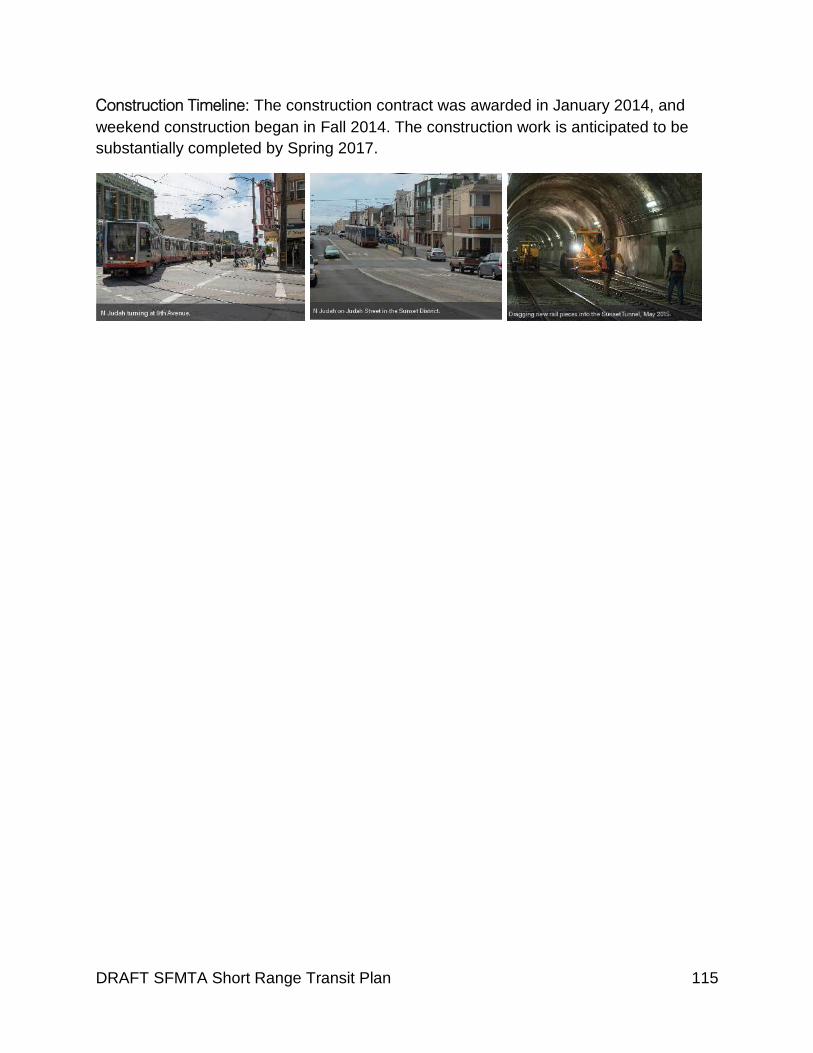
DRAFT SFMTA Short Range Transit Plan 115
Construction Timeline: The construction contract was awarded in January 2014, and
weekend construction began in Fall 2014. The construction work is anticipated to be
substantially completed by Spring 2017.

DRAFT SFMTA Short Range Transit Plan 116
Twin Peaks Tunnel Rail Replacement
The rail upgrades to the Twin Peaks Tunnel will bring the tunnel into a state of good
repair, thereby improving the safety and reliability of the Muni Metro system. This
project includes:
Replacing the existing light rail tracks and track fittings
Replacing the machines which operate the track switching mechanisms
Seismic upgrades to an existing abandoned station (Eureka Valley Station)
Improving structure support between West Portal and Forest Hill stations
Installing fire alarm system at West Portal Station
Repairing areas on concrete walls and reinforcements
Inspecting and cleaning tunnel’s drainage systems
Project Area: The Twin Peaks Tunnel Rail Replacement will improve the tunnel
infrastructure located between West Portal and the Castro Stations, the geographic
center of the city.
Estimated Project Cost: The Twin Peaks Rail Replacement project is expected to cost
$62 million.
Construction Timeline: The Blue Light Emergency Telephone Project and the Radio
Replacement Project have been integrated with the rail replacement to minimize
impacts to Muni customers and neighboring communities. Construction of these
projects is underway with the Twin Peaks Tunnel work starting directly after and
finishing in late summer 2017.

DRAFT SFMTA Short Range Transit Plan 117

DRAFT SFMTA Short Range Transit Plan 118
Mission Bay Loop
The proposed Mission Bay Loop was designed in 1998 as part of the Third Street Light
Rail Project that opened for service in 2007. The Loop will provide turn-around
capabilities for the T Third and is required to operate additional service when the
Central Subway opens in 2019. The Mission Bay Loop will also enable the removal of
disabled trains, and provide a means to turn trains for special events and service
increases.
However, due to budget constraints, construction of the Mission Bay Loop was deferred
until 2013 when Central Subway construction was significantly underway and the
federal TIGER Grant funding was secured.
Project Area: The proposed Loop would be constructed in the Central Waterfront area of
the City and County of San Francisco, on city roads and rights-of-way on the blocks of
18th, Illinois, and 19th Streets. The existing trackway on 18th and 19th Streets between
Third and Illinois Streets would be extended to Illinois Street to complete the Loop.
Traffic, pedestrian, and train signals would be installed at the intersections of 18th and
Illinois Streets and 19th and Illinois Streets.
Estimated Project Cost: The Mission Bay Loop is expected to cost $6.8 million over the
next year.
Construction Timeline: The environmental review has been completed and construction
was scheduled to start in 2015. Construction was delayed by a lawsuit questioning the
projects CEQA clearance. Construction will start back up in June 2016 and is expected
to take approximately one year, and will be complete in 2017.

DRAFT SFMTA Short Range Transit Plan 119

DRAFT SFMTA Short Range Transit Plan 120
Muni Subway Expansion Project
The Muni Subway Expansion Project proposes to build a new 2 mile subway tunnel
from West Portal to Parkmerced in order to locate the entire M-Line underground. This
project is intended to improve Muni Metro speed and reliability, increase subway
capacity, reduce crowding, and improve safety on 19th Avenue. The project would
introduce routing changes to improve Muni Metro performance throughout the entire
system. New subway stations would be built to accommodate four-car light rail trains,
doubling the line’s current capacity.
The project would also completely re-design 19th Avenue from Eucalyptus Drive to
Junipero Serra Boulevard providing safer access to transit as well as improving safety
and attractiveness of the street for all users.
Project Area: The proposed project would construct a subway tunnel from West Portal
Station to south of the intersection of 19th Avenue and Junipero Serra Boulevard, with a
spur extension to Parkmerced. The subway tunnel would be built under the existing light
rail tracks used by the M-Line. The proposed project would also re-design the surface of
19th Avenue from Eucalyptus Drive to Junipero Serra Boulevard.
Estimated Project Cost: The Muni Subway Expansion Project planning-level cost
estimate is $2.5 to $3 billion in 2016 dollars.

DRAFT SFMTA Short Range Transit Plan 121
Construction Timeline: This project is still in the early planning stages and will need to be
confirmed as a priority as a part of San Francisco’s Long Range Transportation
Planning Program (Connect SF) before commencing environmental review, potentially
in 2018. A project schedule for design and construction would be established at a later
date after a funding strategy has been confirmed.

DRAFT SFMTA Short Range Transit Plan 122
Fleet
The Fleet Capital Improvement Program ensures that Muni’s over 1,000 service
vehicles across 75 transit lines are safe, comfortable, clean, and reliable for San
Francisco passengers. In recent years, the SFMTA has prioritized renovating or
replacing vehicles as they near the end of their useful life to avoid service interruptions
caused by vehicle failures and costly repairs. The SFMTA also has prioritized adding
more vehicles to the fleet to alleviate overcrowding on busy routes and enable the
transit system to carry more passengers as the city grows. These initiatives all
contribute to SFMTA’s long-term goals of increasing Muni service on key routes to meet
growing demand and eliminating delays caused by outdated vehicles and infrastructure.
Current SFMTA Revenue Vehicle Fleet Inventory
The SFMTA operates the oldest and largest transit system in the San Francisco Bay
Area, accounting for close to 43 percent of all transit trips in the region each day. In
addition, it is one of the top ten transit systems in the nation based on boardings,
carrying more than 225 million passengers annually. The Agency’s transit fleet is among
the most diverse in the world and features the landmarked cable cars, historic
streetcars, modern light rail vehicles, diesel-hybrid motor coaches, diesel motor
coaches, and electric trolley coaches. Table 25 and 26 on the following pages inventory
the Muni transit fleet, as of May 2015.
Table 25. SFMTA Transit Fleet Inventory.
Table 26. SFMTA Historic Streetcar Fleet Inventory.
SFMTA Revenue Fleet Planning for Replacement and Expansion
The 2014 SFMTA Transit Fleet Management Plan (TFMP) maps out a systematic
approach to planning for the replacement and expansion of the SFMTA’s fleet of transit
vehicles through 2040. The San Francisco County Transportation Authority‘s (SFCTA)
travel demand forecast estimates that the SFMTA will need to carry over one million
daily transit boardings by 2040, an increase of more than 40 percent than the
approximately 700,000 carried today. Much of this growth in ridership occurs along
planned routes serving major developments and in the eastern portion of the city.
Although many of these projects were included in the previous Transit Fleet
TABLE PENDING FIGURES COMING OUT IN FALL
TABLE PENDING FIGURES COMING OUT IN FALL
DRAFT SFMTA Short Range Transit Plan 123
Management Plan to varying degrees, the magnitude and timing of these changes in
land use, population, and employment have been further refined. The TFMP translates
this increase in transit ridership into a service plan and associated vehicle demand
projection.
In addition to the ridership projections, the TFMP also outlines the changes to the fleet
and additional vehicles needed to operate the expected service increases for the Muni
Forward programs in early 2015 and the opening of Central Subway in 2019. Identifying
and scheduling the procurement of these vehicles has allowed the SFMTA to spread
procurements more evenly to ensure major maintenance investments are not needed all
at the same time. Additionally, the detailed fleet planning in the TFMP has made the
procurement process more efficient by allowing the agency to partner with agencies on
procurements where possible to reduce unit costs and create a shared demand for
future parts. Lastly, the long range review of fleet needs has informed the long-term
storage and maintenance facility’s needs and positioned the agency to develop a
detailed five-year CIP to jump-start the implementation of the fleet and facilities
programs.
Per MTC policy, the SFMTA plans procurements on a calendar year cycle. Funding for
the replacement and expansion vehicles detailed on the following pages are
programmed by the SFMTA during their standard fiscal year.
Near-term Vehicle Replacement
As Muni service vehicles reach the end of their useful life and are retired, the SFMTA
will need to replace these vehicles in order to adequately provide transit service to the
city.
Replacement of the 30-ft, 40-ft, and 60-ft Motor Coaches: Over the next five years, the
motor coach fleet will be replaced to phase out SFMTA’s fleet of diesel motor coaches
that will have reached retirement age. The SFMTA will utilize a multi-year contract to
replace 124 60’ motor coaches and 261 40’ motor coaches. SFMTA’s current fleet of
motor coaches will have reached the end of their Federal Transit Administration (FTA)
lifespan and will be eligible for retirement over the next five years, making this
replacement critical to the continuation of transit operations.
Replacement of the 40-ft and 60-ft Trolley Coaches: As part of a multi-year joint
procurement contract with King County Metro, the SFMTA will replace 93 60’ trolley
coaches and 175 40’ trolley coaches in its fleet. These coaches will have reached the
end of their Federal Transit Administration (FTA) lifespan and will be eligible for
replacement. The contract will also allow for purchase of at least 12 expansion 60’
coaches, which will be offset by decreasing the number of 40’ coaches.

DRAFT SFMTA Short Range Transit Plan 124
Near-term Vehicle Expansion
The light rail and motor coach fleets are also projected to expand to provide the service
increases proposed under the Muni Forward initiative to meet growing demand.
Expansion of the Light Rail Fleet: The SFMTA will expand its light rail fleet by 64 vehicles
in order to serve the future Central Subway route and growing demand on existing rail
lines. The new 1.7-mile extension of Muni’s T Third Line will provide direct connections
to major retail, sporting and cultural venues while efficiently transporting people to jobs,
educational opportunities and other amenities throughout the city.
Expansion of the 60-ft Motor Coach Fleet: The SFMTA will also purchase 65 new 60’
articulated buses over the next five years. Articulated 60’ buses are a cost-effective and
efficient method of meeting ridership demands, as they have 1.5 times the capacity of
standard 40’ buses while still only needing one driver and one vehicle. The up-front
investment in new 60’ motor coaches also carries a long-term benefit of making SFMTA
eligible for a greater allotment of federal funding to replace buses in the future.
Revenue Vehicle Rehabilitation
In addition to the projected need for replacement and expansion vehicles based on the
accepted lifecycle of the revenue vehicles, the SFMTA has also established a program
by which its fleet will undergo extensive rehabilitation/retrofits in order to improve their
performance. All types of vehicles will be rehabilitated on a rolling basis, with those
vehicles in a worse state of repair prioritized.
Establishment of Vehicle Overhaul Program: This project will conduct mid-life overhauls
on SFMTA’s transit vehicles as vital part of keeping the transit fleet in a state of good
repair. Traditionally SFMTA has not had funds for mid-life overhauls despite high
ridership, challenging terrain, and long duty cycles, resulting in more frequent
breakdowns, costly vehicle repairs and disruption of transit service. In the FY 2015 – FY
2019 CIP, however, the SFMTA has set aside a funding reserve of $11.5 million for mid-
life overhauls for all vehicle types will help SFMTA to improve service reliability.
Light Rail Vehicle (LRV) Overhauls: The SFMTA operates a fleet of 149 light rail vehicles
(LRVs), each of which is equipped with three trucks--two motor trucks and one trailer
truck--that serve as suspension systems that support vehicle loads and provide a
comfortable ride for passengers. Maintenance data show that rehabilitation of the light
rail vehicle trucks will significantly improve vehicle reliability, help to eliminate
breakdowns, and prevent service interruptions and costly repairs.
Cable Car Renovation: The SFMTA plans to fund the phased rehabilitation of Muni’s
cable car fleet, enhancing cable car vehicles and the system’s reliability and

DRAFT SFMTA Short Range Transit Plan 125
productivity. It is estimated that the life of a cable car is approximately 60-70 years; a
major rehab will extend the life of a cable car by about 30-35 years.
Rehabilitate Historic Streetcars: The historic streetcars used on the F Market/Wharves
route are electric rail vehicles from the U.S. and around the world. Due to its historic
nature, the streetcar fleet is not replaced on a regular schedule, making a program of
regular rehabilitation critical to the long-term operation of the fleet. Over the next five
years, the SFMTA will continue to rehabilitate the historic fleet to like-new condition,
including upgrading electrical and mechanical systems, performing body work, and
ensuring systems meet CPUC and ADA requirements. On average, about four cars per
year are overhauled.
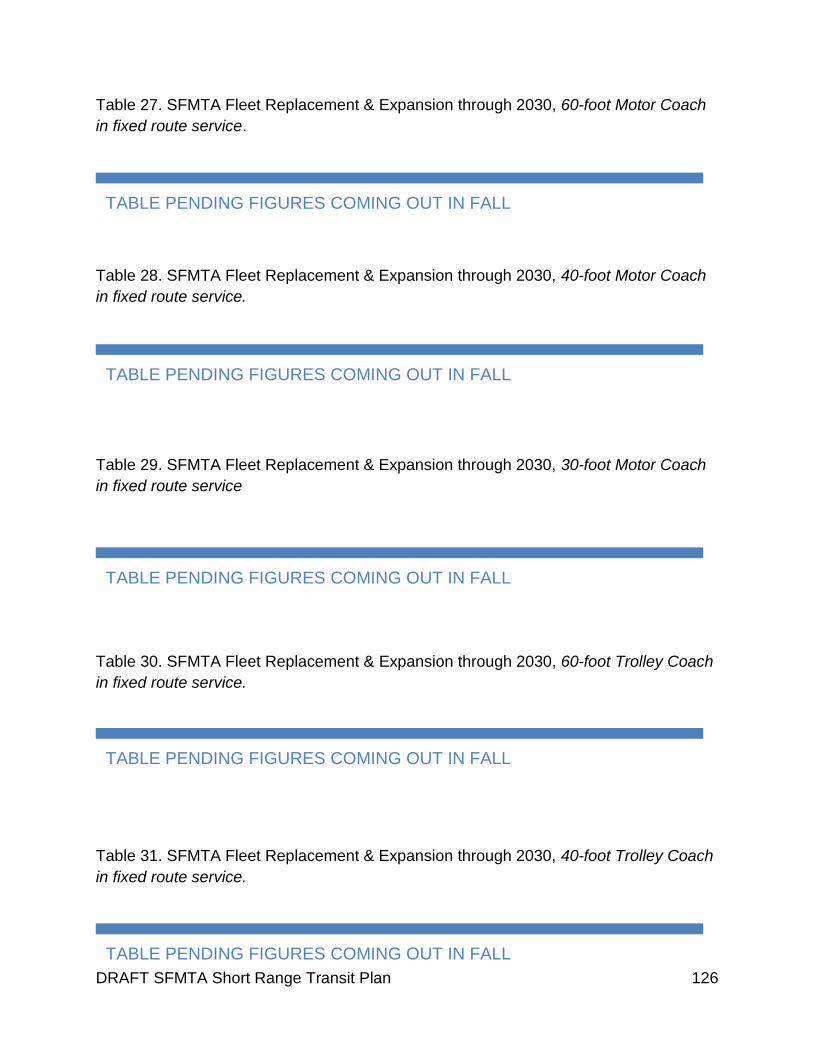
DRAFT SFMTA Short Range Transit Plan 126
Table 27. SFMTA Fleet Replacement & Expansion through 2030, 60-foot Motor Coach
in fixed route service.
Table 28. SFMTA Fleet Replacement & Expansion through 2030, 40-foot Motor Coach
in fixed route service.
Table 29. SFMTA Fleet Replacement & Expansion through 2030, 30-foot Motor Coach
in fixed route service
Table 30. SFMTA Fleet Replacement & Expansion through 2030, 60-foot Trolley Coach
in fixed route service.
Table 31. SFMTA Fleet Replacement & Expansion through 2030, 40-foot Trolley Coach
in fixed route service.
TABLE PENDING FIGURES COMING OUT IN FALL
TABLE PENDING FIGURES COMING OUT IN FALL
TABLE PENDING FIGURES COMING OUT IN FALL
TABLE PENDING FIGURES COMING OUT IN FALL
TABLE PENDING FIGURES COMING OUT IN FALL

DRAFT SFMTA Short Range Transit Plan 127
Table 32. SFMTA Fleet Replacement & Expansion through 2030, Light Rail Vehicles in
fixed route service.
Table 33. Motor Coaches Scheduled for Rehabilitation.
COACH NO.
MANU-FACTURER
LENGTH OF VEHICLE
YEAR IN SERVICE
MODE OF POWER
YEAR OF PLANNED REHAB-ILITATION
ESTIMATED COST
8401 - 8456
Orion 40 ft. 2006 Hybrid Diesel
2012 $382,000/bus (in 2014 dollars)
8501 - 8530
Orion 30 ft. 2007 Hybrid Diesel
2013 $382,000/bus (in 2014 dollars)
8601 - 8662
New Flyer 40 ft. 2013 Hybrid Diesel
2019
$456,000/bus (using 3% escalation per year)
8701 - 8750
New Flyer 40 ft. 2014 Hybrid Diesel
2020 $470,000 per bus
Revenue Fleet Vehicle Replacement and Expansion Funding
The SFMTA regularly forecasts funding that can be reasonably anticipated in the near
term as part of the Capital Improvement Program. These sources have met the regional
needs for vehicle replacement and allow the SFMTA to assume all vehicle
replacements will be funded through these sources in the future:
Regionally-programmed funds: MTC policies prioritize vehicle replacement as the
highest priority for a number of federal funding sources it allocates, placing a lower
priority on vehicle expansion. The SFMTA assumes additional funding sources will need
to be identified for vehicle expansion.
Local funding: Proposition K sales tax revenues administered by the SFCTA have
traditionally provided the primary source of local match to federal funds.
TABLE PENDING FIGURES COMING OUT IN FALL

DRAFT SFMTA Short Range Transit Plan 128
Potential New Sources of Funding: Given the extent of the needs identified in the
TFMP, the SFMTA is working with its partners to find new funding for fleet replacement
and expansion. The Mayor’s Transportation Task Force identified approximately $270
million of potential funding for vehicle investments through general obligation bonds,
sales taxes, and vehicle license fees. Also, San Francisco voters passed Proposition B
in November 2014 that requires the City to adjust funding for transportation each year
based on population growth. With these funds, the City will purchase Muni vehicles and
complete street safety and paving projects. In the future, additional new revenue
sources will be pursued to ensure a stable, long-term commitment to improving and
maintaining the Muni fleet and city’s transportation network.
The MTC Core Capacity Challenge Grant Program has also identified approximately
$400 million of potential funding for vehicle investments through sources such as FTA
formula funds, FTA New Starts Core Capacity funds, and Cap and Trade Revenues.
The SFMTA is using some of these sources to procure expansion light rail vehicles.
Additionally, The SFMTA will continue to investigate funding opportunities for vehicle
expansion and adjust vehicle procurement plans as more information becomes
available.
Demand-Responsive Paratransit Vehicle Fleet Planning
The SFMTA plans to replace 27 Class B paratransit vans that will have reached the end
of their useful life in 2017. A Class B or Type II vehicle is a 22’ cutaway van that holds a
minimum of 12 passengers and two wheelchair positions. These vehicles provide critical
service for customers with limited mobility. The agency will also replace five Class D
paratransit minivans that will have reached the end of their useful life in 2018. A Class D
vehicle is a low-floor minivan that holds two passengers and one wheelchair user.
These vehicles provide critical service for customers with limited mobility. The agency
will replace another 35 Class B vehicles in 2019.
In addition to replacing paratransit vehicles at the end of their useful lives, SFMTA will
purchase an additional 45 Class B vehicles and an additional 10 Class D minivans over
the next few years. These expansion vehicles will allow the agency to retire vehicles
that have been kept in service beyond their FTA-defined useful lives in order to meet
service demand.
All of the vehicles listed in the table below are in service. The SFMTA currently does not
have any spares in the paratransit fleet. As the new vehicles are delivered, the SFMTA
plans to shift all those vehicles that are retired into the reserve fleet for the short term.
The paratransit fleet vehicles will then be removed from service entirely on a rolling
basis, as the maintenance team determines which vehicles can be kept in reserve and
which should not be used for service at all.

DRAFT SFMTA Short Range Transit Plan 129
Table 34. Paratransit Vehicle Fleet Inventory
MANUFACTURER/ VENDER
NO. OF VEHICLES
PERSON CAPACITY
WHEELCHAIR CAPACITY
MODE OF POWER
CLASS B
El Dorado (2006) 20 12 2 Gasoline
Bus West (2008) 35 12 2 Diesel
El Dorado (2012) 1 12 2 Gas/ Hybrid
Elkhart (2012) 26 12 2 Gasoline
Glaval (2014) 35 12 2 Gasoline
CLASS D
Braun (2014) 5 2 1 Gasoline
Non-Revenue Vehicle Fleet Planning
The SFMTA owns and maintains just under 900 transit service critical and SFMTA
operations support vehicles. The largest subfleets support the work of the Sustainable
Streets Division’s Enforcement units, including vehicles for the parking control officers
and the security response teams, and Transit Operations that requires light- and heavy-
duty vehicles to respond to incidents and transport equipment around the city. Other
vehicles are used to transport materials between operating divisions and assist the
planning, engineering, and construction of SFMTA projects around the city.
Per city policy, all city departments must retire vehicles older than 12 years old. The
SFMTA is currently developing a strategy that will improve the management of the non-
revenue fleet to accommodate its needs while meeting the city’s reduction and
retirement goals.
San Francisco Healthy Air and Clean Transportation Ordinance
In 2010, San Francisco voters added the Healthy Air and Clean Transportation
Ordinance (HACTO) to the city’s Environment Code. It is intended to assist the City in
achieving its air pollution and greenhouse gas reduction goals by mandating that all City
employees and departments use sustainable transportation modes for trips made for
work (such as public transit, walking, ridesharing, or biking) to minimize single-
occupancy vehicle transportation as much as possible and, when it is not, to use green
vehicles. To implement this ordinance, each city department is required to develop a
Transit First plan outlining how it will implement the various sustainable options to
reduce vehicle usage and a Transit First report on implementation. Additionally, for

DRAFT SFMTA Short Range Transit Plan 130
departments that manage their own fleet of vehicles like the SFMTA, the light duty (non-
revenue and non-service critical vehicles) fleet size must be reduced by 20 percent from
the 2010 baseline by the end of FY 2015.
The SFMTA manages 559 vehicles that are subject to HACTO guidelines. In
compliance with HACTO, the SFMTA submitted waivers for 422 of these vehicles, as
they are critical for performing job-critical tasks within the agency. As of FY 2013, 34
vehicles were retired from the fleet since 2010 and the SFMTA plans to permanently
remove at least 21 additional vehicles from service by the end of FY 2014-2015 for full
HACTO compliance.
In FY 2015, the SFMTA installed Global Positioning System (GPS) devices in all non-
revenue vehicles which allows the SFMTA be track and monitor vehicle usage for
safety, efficiency and enhanced maintenance. The Board of Supervisors passed
legislation in FY 2016 that would require GPS in non-revenue vehicles. The Board of
Supervisors also amended the HACTO legislation which transferred oversight the City’s
Administrators Office to implement vehicle reduction requirements that are based usage
through GPS data.
Non-Revenue Vehicle Fleet Funding Sources
The SFMTA non-revenue fleet, both the light-duty and heavy-duty vehicles, are funded
through the pooled locally-generated operating funds that come from a variety of
sources, including the SF General Fund, fares/fees/fines, parking meters, etc.
Table 35. Non-Revenue Vehicle Fleet Inventory, as of June 2016.
DIVISION SUBFLEET NO. OF VEHICLES
MODEL YEAR RANGE
VEHICLE TYPE(S) MODE OF POWER
Agency Administrative Functions (Communications, Information Technology, Human Resources, etc.)
29 1988-2016 Car, Minivan, Cargo Van, Pick-up
Hybrid, Gasoline
Building and Grounds Vehicles
5 1986-2010 SUV, Van, Pick-up, Cargo Van, Super-Duty Truck
Hybrid, Gasoline
Capital Projects & Construction Division Vehicles
15 1999-2015 Van, Car, Pick-ups, Cargo Van, Super-Duty Truck
Hybrid, Gasoline

DRAFT SFMTA Short Range Transit Plan 131
DIVISION SUBFLEET NO. OF VEHICLES
MODEL YEAR RANGE
VEHICLE TYPE(S) MODE OF POWER
Custodial Vehicles 11 1987-2010 Van, Pick-up Gasoline
Parking Control Officer Vehicles
271 1996-2013 Cart Gasoline, CNG
Revenue & Collections Vehicles
17 1986-2013 Pick-up, Minivan, Cargo Van
Hybrid, Gasoline
Security, Investigations, Enforcement, and Proof-of-Payment Vehicles
67 1987-2016 Car, SUV, Pick-up, Van
Hybrid, Gasoline
SFMTA SFPD K-9 Unit Vehicles
6 1996-2016 Car, SUV Gasoline
Sustainable Streets Division Pool Vehicles
14 1998-2010 Car, Cargo Van Gasoline
Sustainable Streets Shops Vehicles
133 1987-2014 SUV, Van, Pick-up, Super-Duty Truck
Hybrid, Gasoline
System Safety Vehicles 7 2000-2012 Car, SUV, Cargo Van Hybrid, Gasoline
Taxi Services Investigations Vehicles
2 2000-2007 Car Gasoline
Transit Operations Pool Light-Duty Vehicles
68 1982-2010 Car, SUV, Van, Minivan, Pick-up
Hybrid, Gasoline
Transit Operations Division Overhead Lines & Track Maintenance Vehicles
67 1981-2015 Super-Duty Truck, Freight
Gasoline, Biodiesel
Transit Operations Heavy-Duty Facilities and Maintenance Vehicles
127 1981-2013 Sweeper, Cargo Van, Super-Duty Truck, Tanker Truck, Freight
Gasoline, Biodiesel
Transit Street Operations Vehicles
38 1992-2013 Car, SUV, Pick-up, Super-Duty Track
Gasoline, Biodiesel
TOTAL 877

DRAFT SFMTA Short Range Transit Plan 132
Facilities
Efficient and well-functioning maintenance, fueling, storage, and staging facilities are
vital to ensuring reliable transit service and that SFMTA’s fleet is in a state of good
repair. Informed by the Real Estate and Facilities Vision for the 21st Century (Vision
Report) and recently conducted Facilities Condition Assessment, the Facilities Capital
Improvement Program (CIP) supports the modernization and expansion of outdated
facilities to make them safe, efficient, and able to service modern vehicles. The CIP also
assigned projected funding to acquire new facilities to accommodate fleet growth.
Where possible, however, existing facilities will be reconfigured, consolidated, or
expanded to best meet operational needs, identify cost savings, and to make our
facilities as environmentally friendly as possible.
Funding Facilities Improvements
The cost estimates in the CIP include the soft costs (e.g., planning, design, construction
management, surveying, and testing) and hard (construction) costs. The cost estimates
are based on industry standards and are applied on a unit or square-foot basis where
possible, with an appropriate contingency to account for San Francisco conditions. As
the planning and preliminary engineering phases for the individual projects for each
facility are initiated, the estimates will be updated as additional information becomes
available.
In 2015, the SFMTA using the Vision Report as a base, developed a Facilities Capital
Program to identify individual projects and programs of projects to meet both immediate
facility needs projected maintenance and operational needs to 2040. Although the SFMTA
has programmed a significant amount of projected funding in the near term to start the
planning, preliminary engineering, design and construction of the following facilities and
equipment projects, a substantial amount of funding is still needed to complete the
construction of the projects recommended by the Facilities Capital Program. The SFMTA is
working closely with its regional, state, and federal partners to develop a funding strategy for
this critical capital improvement program.
Future Major New and Expanded Facilities
The projects summarized in this section were recommended in the long range Vision
Report and prioritized for near term implementation. These projects will help
accommodate the projected expansion in the revenue fleet and take the first steps in
the major reconfiguration, consolidation, and expansion of the SFMTA facilities. More
information on the implementation schedule and funding plan for each of these projects
is available in the SFMTA FY 2017 - FY 2021 CIP.
Additional Bus Storage and Maintenance Yard (Estimated initial investment: $430
million): Due to vehicle acquisition and fleet expansion projections from the most recent

DRAFT SFMTA Short Range Transit Plan 133
Transit Fleet Management Plan numbers, additional bus storage will be required to
adequately store and maintain the expansion fleet.
Burke Warehouse (Estimated initial investment: $30 million): The renovation of the
Burke Warehouse may include: renovation and reconfiguration of existing storage
space to expand storage capacity and moving the Transit Division Overhead Lines
Maintenance Unit to this facility.
Islais Creek (Estimated initial investment: $130 million): The new 65,000 square foot
motor coach maintenance and operations building including light and heavy
maintenance bays, warehouse space, operations and maintenance offices, showers,
gilley room, locker rooms and training space.
Muni Metro East (MME) Division – Storage Tracks (Estimated initial investment: $44
million): This project will construct storage tracks to accommodate the growing Light
Rail Fleet for the opening of the Central Subway and planned rail service growth to
2040.
Woods Division Lifts & Structural Improvements (Estimated initial investment: $69
million): This project will relocate the Parts Storeroom, increasing the repair capacity of
the facility from 24 bays to 40 bays. It will also install lifts, new bus washers, and other
infrastructure improvements.
Yosemite Warehouse Purchase (Estimated Order of Magnitude investment range:
$10 to $25 million, dependent upon partial or full investment): The SFMTA Sustainable
Streets’ Paint and Meter Shops are currently occupying this leased facility. The lease
agreement included a purchase option for the SFMTA to acquire the property and the
agency must exercise its purchase option within 3 years of the recording of the
subdivision map on the site.
Short-Term and General Maintenance Facilities Projects
The SFMTA has identified the following list of smaller facilities upgrades that will
improve maintenance and operations of the facilities and the transit system as a whole.
More information on the implementation schedule and funding plan for each of these
projects is available in the SFMTA FY 2015 - FY 2019 CIP.
Operator Convenience Facilities Phases I-III: $6 million estimated initial
investment
Life & Fire Safety Systems at Flynn, Kirkland, Scott, Metro Green, and Potrero:
$5 million estimated initial investment
Lift Upgrades at Flynn, Potrero, and Presidio: $12 million estimated initial
investment

DRAFT SFMTA Short Range Transit Plan 134
Kirkland Division Underground Storage Tank Replacement: $6 million estimated
initial investment
SFMTA Tow Facility Vehicle Stackers: $2 million estimated initial investment
Wash Racks at Flynn, Potrero, Presidio, Kirkland, Beach, and Green: $3 million
estimated initial investment
Tools & Equipment Purchases
In addition to the structural changes and reconfiguration of the SFMTA facilities, the
following smaller equipment purchases and renovation projects have been included in
the five-year Capital Improvement Program. More information on the funding plan for
each of these purchases is available in the SFMTA FY 2015 - FY 2019 CIP.
Alternator testers (Estimated Cost: $0.5 million): Each SFMTA motor coach yard
(Woods, Flynn, Kirkland and Islais Creek) will get a tester.
Electric Diagnostic Station (Estimated Cost: $6 million): The following yards will
get a tester: Flynn, Kirkland, Islais Creek, Woods, Potrero and Presidio.
Floor Sweepers & Scrubbers (Estimated Cost: $0.7 million): Each of the six
transit yards will get one to two sweepers and scrubbers to clean work stalls,
floors, and aprons.
Fluid Dispensing Reels, Hoses, and Plumbing (Estimated Cost: $0.5 million):
Each of the six shops and yards will get new reels for the fuel islands and shop
stalls.
Parts Cleaners (Estimated Cost: $1.2 million): All six division motor or trolley
coach yards will get a unit or two based on the shop.
Pressure Washers (Estimated Cost: $0.1 million): Each of the six bus
maintenance yards will get a pressure washer.
Shop Pusher Tugs (Estimated Cost: $0.4 million): Each of the six transit yards
will get one tug.
Vehicle Vacuum Systems (Estimated Cost: $0.8 million): This project will fund the
replacement of the vehicle vacuum systems at Woods, Flynn, Kirkland and
Potrero Divisions
Paratransit Vehicle Facilities
The SFMTA is working to find a paratransit operating facility, which would
accommodate the 87 SFMTA-owned paratransit vans. Ideally this location would
accommodate growth of the fleet to 125 vehicles. The vans are currently parked and
maintained at various contractors’ sites in San Francisco and Brisbane, as the van
heights are too high to fit into any of the off-street parking garages currently owned and
operated by the SFMTA. Office space for administration and dispatching is also needed.
To date, this is still an open issue for the SFMTA and the Paratransit contractors.

DRAFT SFMTA Short Range Transit Plan 135

DRAFT SFMTA Short Range Transit Plan 136
Other SFMTA Capital Programs
Accessibility
SFMTA strives to make public transportation accessible to every person in San
Francisco. This requires planning, designing, and constructing capital projects to
enhance the accessibility of the transportation system, such as installing elevators at
transit stations or constructing boarding islands and platforms. These improvements
benefit a broad spectrum of San Francisco residents and visitors. Families traveling with
small children in strollers, for example, can more easily board transit vehicles and
stations and those who may be temporarily disabled from an injury will enjoy easier
access. Additionally, people with disabilities and those who rely on a wheelchair or other
mobility aid require consistent access to the transportation network.
The Accessibility Program is dedicated to projects that go above and beyond Americans
with Disabilities Act (ADA) requirements to make most modes and aspects of the
transportation system accessible - from buses to streetcars to transit stops. Accessibility
improvements are at the core of the SFMTA’s Capital Improvement Program and are
not limited to the projects listed in this program, but are incorporated into the design of
many projects in the other Capital Programs. For example, all the projects in the Transit
Optimization and Expansion program have elements that enhance access to the transit
system like sidewalk extensions at transit stops and busy intersections. Likewise, the
projects in the Transit Fixed Guideway Program like the Sunset Tunnel Rail
Replacement include the construction of key stops and ramps to facilitate easier
boarding for those of limited mobility. Additionally, many of the projects in the Traffic &
Signals program have incorporated the installation of pedestrian countdown and
accessible pedestrian signals in the scope of work. In this way, improving transit access
for all users is a key element of all SFMTA work.
Bicycle
The Bicycle Program is designed to create a cohesive, city-wide network of safe bicycle
routes. The agency’s overall goal is to more than double the current number of trips
taken by bicycles on our city streets by 2018. Bicycle Program funds are used for the
planning, design and construction of capital projects to enhance the safety and comfort
of San Francisco’s bicycle infrastructure, including: new bicycle lanes and separated
cycletracks, safety and spot improvements, and secure bicycle parking. The SFMTA
Bicycle Strategy identified key corridors that have a high rate of bicycle travel, high
population density, and frequent collisions with cars. Concentrating infrastructure
improvements in these corridors helps to eliminate the most dangerous bicycling
conditions and improve the safety of San Francisco for bicyclists citywide.
The Bicycle Program in the CIP also supports events such as Bike to Work Day and
bicycle education and safety programs in local elementary schools.

DRAFT SFMTA Short Range Transit Plan 137
Communications and IT Infrastructure
The Communications and Information Technology (IT) Program supports the design
and implementation of IT infrastructure to improve the efficiency and ease of use of the
transportation system. This includes maintaining the fiber network that provides the
internal communication backbone of the Metro system. SFMTA is currently replacing
the remaining non-fiber SFMTA facilities with a link to the SFMTA core fiber network.
These upgrades will reduce costs, improve bandwidth, and make our communication
tools faster and more usable for the public.
The Communications and IT Program also supports investments in new technology to
improve the Muni customer experience. Key transit communications projects include:
Blue Light Emergency Telephone Replacement: The existing emergency phone
will be upgraded and new phones added throughout the Muni subway. These
phones are crucial for contacting emergency services in a crisis, such as a
natural disaster or medical emergency.
Radio Replacement and CAD/AVL Upgrade: As part of a system-wide upgrade to
Muni communications, SFMTA is upgrading its outdated radio system and
introducing a new Computer Aided Dispatch/Automatic Vehicle Location
(CAD/AVL) system. The new radio system will improve communications between
Muni operators and the Transportation Management Center (TMC), improve how
Muni responds to unexpected service disruptions, track vehicles in real time and
interface with other on-board systems that depend upon knowledge of vehicle
locations.
Farebox System: In FY 2017, the SFMTA will replace 25-year old farebox
equipment with a new system which will consist of new fareboxes on all transit
vehicles (except cable cars), a secure revenue collection system to transfer cash
and coins from fareboxes to SFMTA’s Counting Room, a data collection and
reporting system and integration with the CAD/AVL system to link farebox
transactions with routes and locations. The new farebox system will replace
current pre-printed paper tear-off transfers/fare receipts with on-demand real-
time printing of transfers/fare receipts.
Automatic Passenger Counters: The SFMTA is installing state-of-the-art
Automatic Passenger Counters (APCs) on all new buses, trolley coaches and
light rail vehicles in order to track ridership by stop. In addition to improving the
accuracy of current ridership counts for service planning purposes, these new
APCs will allow the Transportation Management Center (TMC) to identify
overcrowding in real time and develop service strategies to improve operations
Real-Time Vehicle Arrival Predictions System/Customer Information System:
SFMTA’s new Real-Time Vehicle Arrival Predictions System/Customer
Information System will provide more accurate expected waiting times in a

DRAFT SFMTA Short Range Transit Plan 138
variety of formats to help customers better plan their travel and make use of their
time. The SFMTA is exploring the latest technologies to provide additional
information on-board vehicles, such as real-time service updates and connecting
route arrivals, as well as informational kiosks at stations and other locations.
Other key near term projects include additional safety upgrades and new Clipper Card
readers on Muni vehicles. In coordination with the transit and streets projects, these
initiatives all help to make riding Muni easier and more efficient, and help customers to
better integrate the transit system into their day-to-day lives.
Asset Management
Funding for the development and implementation of an Enterprise Asset Management
System (EAMS) is also in the Communications and IT Capital Program. The EAMS will
support the SFMTA’s Transportation Asset Management (TAM) Program that defines
the agency’s approach to maintain the approximately $13.2 billion of assets in a state of
good repair. These assets go beyond the Muni-related transit assets and include
walking, bicycling, traffic management and parking infrastructure in San Francisco.
Once fully deployed, the EAMS will integrate the currently disparate asset tracking
systems within the agency while providing full visibility of the current and historical state
of all active SFMTA assets. This will help better assess the condition of the agency’s
assets and enable more accurate financial forecasting and planning. The agency’s TAM
Program will use data from the EAMS to prioritize investments based on asset condition
and meet state of good repair targets. Together, the TAM Program and EAMS will help
the agency comply with the asset management policy and associated requirements
under the 2012 Moving Ahead for Progress in the 21st Century Act (MAP-21) as well as
enable data-driven decisions on managing and reinvesting in the City’s transportation
network.
The development of the EAMS and the associated software tools started in late 2012
with the development of the conceptual engineering report for the system. In 2014, the
SFMTA hired dedicated staff to implement the EAMS and issued a request for proposal
for professional services to assist with deploying and configuring the EAMS. The
SFMTA has planned for a three year deployment across approximately 45 business
units in the agency. Deploying at each business unit will include replacing legacy
systems and processes that involve managing assets, work orders, and materials. The
table below shows the projected timeline for development and implementation of the
EAMS.
Table 36. Projected Development and Implementation Timeline for the SFMTA
Enterprise Asset Management System

DRAFT SFMTA Short Range Transit Plan 139
PROJECT PHASE
IMPLEMENTATION DATES
ASSETS AFFECTED
Phase 1 2015 to early 2016
Maintenance of Way/Transit Fixed Guideway assets: overhead lines, motive power, track maintenance, cable car machinery; Purchasing; and Materials Management. Completed Units: Buildings and Grounds, Custodial, Underground Storage Tanks
Phase 2 2016 to early 2017
Sustainable Streets assets associated with the Livable Streets subdivision and the Sustainable Streets shops, e.g. parking meters, traffic signs and signals, street striping and paint, SFgo signal timing, etc.
Phase 3 Late 2016 through 2017
Other Transit assets, revenue vehicle fleet for all modes, and vehicle maintenance; SFMTA Real Estate and Facilities; Transportation Management Center, and Information Technology assets.

DRAFT SFMTA Short Range Transit Plan 140
Parking
SFMTA is responsible for maintaining public parking facilities, including both on- and
off-street, that serve San Francisco residents, visitors, and businesses. The Parking
Program supports the planning, design, rehabilitation, and construction of public parking
garages, as well as street infrastructure and facilities related to public parking. This
includes ensuring that parking garages are structurally sound, well-ventilated, and can
withstand harsh weather and earthquake activity. SFMTA also ensures that parking
structures are accessible and meet the requirements of the Americans with Disabilities
Act (ADA).
Some of the near term parking projects include the rehabilitation and equipment
upgrades of key parking structures: Civic Center Plaza, Golden Gateway, Japan Center,
Moscone Center, Performing Arts Center, Union Square, and neighborhood garages in
North Beach and the Mission.
More information on SFMTA parking policies and projects is available on the on the
SFMTA website: http://www.sfmta.com/getting-around/parking.

DRAFT SFMTA Short Range Transit Plan 141
Pedestrian
Making the city’s streets safe, vibrant and enjoyable places to walk is integral to
SFMTA’s goal of a Transit First city. Whether people are walking to a bus stop, a car, or
all the way to their destination, almost every trip is in part a pedestrian trip – and 25
percent of all trips in San Francisco are made by walking alone (Source: 2015 Travel
Decision Survey). The Pedestrian Program covers planning, design, and
implementation of capital projects such as refuge islands, speed tables, and corner
bulb-outs. Such projects help protect people walking from car traffic, turning
neighborhood roads into Complete Streets and making busy intersections more people-
friendly.
SFMTA is a key partner in city-wide task forces such as WalkFirst, Vision Zero, the
Pedestrian Safety Advisory Committee, and the Mayor’s Pedestrian Safety Task Force
to conduct rigorous, data-driven studies and community outreach. Only 12 percent of
San Francisco streets account for 70 percent of severe or fatal pedestrian injuries. By
focusing on these high-injury corridors and intersections, capital projects can vastly
improve the safety of San Francisco as a whole.
More information on Vision Zero, WalkFirst and other pedestrian-focused planning and
projects is available on the on the SFMTA website: www.visionzerosf.org.
School
Providing San Francisco children with safe and direct routes to school is a critical
objective of the SFMTA. The School Program provides funding for capital projects and
programs that help to make active modes of transportation safer and more accessible
for children, including those with disabilities. Funded projects include street redesigns,
bicycle infrastructure, removal of pedestrian barriers, and programs such as Walk to
School Day and pedestrian safety classes in elementary schools.
Many of the projects in the School CIP are supported by federal grants from the Safe
Routes to Schools program. SFMTA is currently working in conjunction with other city
agencies to develop several Safe Routes to Schools projects, including routes to Cesar
Chavez, ER Taylor, John Yehall Chin, Longfellow, and Tenderloin elementary schools.

DRAFT SFMTA Short Range Transit Plan 142
Security
Developing state-of-the-art emergency security systems is crucial to providing San
Francisco with a safe and reliable transportation system. The Security Program funds
are used to plan, design, and implement security initiatives in case of a natural disaster,
terrorist attack, or other emergency situations. SFMTA also applies for competitive
grants to fund this program, such as the federal Transit Security Grant Program which
provides funding for projects that protect vital transportation infrastructure against
potential terrorist and security threats.
Some of the near term security projects include investments in site-hardening of the
Muni subway systems and the installation of threats and vulnerabilities
countermeasures to improve the security of the traveling public and the Muni transit
operators. The Security Program also covers security and emergency preparedness
training for staff and transit operators.
Taxi
The Taxi Program strives to make comfortable, efficient, and environmentally friendly
taxis available throughout the city. Program funds are used to plan, design, and
implement improvements to the taxi system and to provide a better customer
experience for all taxi users. The Taxi Program includes initiatives to reduce the
environmental impact of taxi use, such as a taxi Clean Air Energy Rebate which is given
to companies and medallion holders that purchase new alternative fuel vehicles. It also
includes programs to expand the taxi network through the installation of taxi stands and
programs to encourage the innovative use of technology. Additionally, this program
funds initiatives to improve driver safety and the customer experience through annual
driver training programs that emphasize customer service and best safety practices.
More information on taxi projects is available on the on the SFMTA website:
http://www.sfmta.com/services/taxi-industry.
Traffic Calming
The Traffic Calming Program helps to make San Francisco streets welcoming
environments for all users by slowing car traffic and increasing the safety and visibility of
people walking, bicycling, and using transit. Program funds are used to plan, design,
engineer, and construct capital projects such as ‘road diets’ (e.g. narrowing roads

DRAFT SFMTA Short Range Transit Plan 143
and/or widening sidewalks to reduce car speeds), speed humps, pedestrian median
islands, traffic circles, and lane shifting. Since a pedestrian struck by a car moving at 30
mph is six times more likely to die than a pedestrian being struck by a car moving at 20
mph, slowing car traffic is paramount to reducing pedestrian and bicyclist deaths –
especially in the city’s residential neighborhoods.
Traffic calming projects fall into three categories (local, arterial, or school) depending on
the type of street being treated. These projects are often combined with streetscape
enhancements, pedestrian projects and bicycle infrastructure to create vibrant and
livable Complete Streets.
More information on traffic calming is available on the on the SFMTA website:
http://www.sfmta.com/node/77946
Traffic & Signals
Traffic signals are integral to the smooth functioning of the transportation system. The
Traffic & Signals Program provides funding for upgrading, renovating and replacing
traffic signals and signal infrastructure.
Some of San Francisco’s traffic signals and supporting infrastructure is over half a
century old. Modernizing these systems to better manage traffic flow will result in
substantial savings of both time and money for people across every mode of
transportation. For example, through the innovative SFgo program, SFMTA is replacing
outdated signals with Intelligent Transportation Systems (ITS) tools to enhance traffic
analysis, provide transit signal priority, and expedite maintenance procedures. The ITS
tools include advanced traffic signal controllers, traffic cameras, video detection,
variable message signs, a communications network, the Transportation Management
Center (TMC) and remote workstations.
This program also funds the design and construction of new and upgraded traffic
signals to improve safety. Upgrading and replacing signals and signal infrastructure will
decrease travel time, improve mobility, and increase the safety of the roadways.

DRAFT SFMTA Short Range Transit Plan 144
MAJOR EXPANSION PROJECTS
Under MTC Resolution No. 3434, the Regional Transit Expansion Program, The
Metropolitan Transportation Commission (MTC) identified specific bus, rail and ferry
projects as priority for transit expansion in the Bay Area. The following sections provide
information on the two SFMTA expansion projects included in MTC Resolution No.
3434: 1) Central Subway; 2) Van Ness Bus Rapid Transit Project.
CONTENTS
Central Subway ........................................................................................................... 144
Van Ness Bus Rapid Transit Project ........................................................................... 152
Central Subway
The Central Subway Project is the second phase of the SFMTA’s Third Street Light Rail
Transit Project. Phase 1 of the project constructed a 5.4-mile light-rail line along the
densely populated Third Street corridor. This first segment of the T Third Line opened to
customers in April 2007, restoring light-rail service to a high transit-ridership corridor of
San Francisco for the first time in 50 years.

DRAFT SFMTA Short Range Transit Plan 145
Phase 2, the Central Subway Project, will extend the T Third Line from the 4th Street
Caltrain Station to Chinatown, providing a direct, rapid transit link from the Bayshore
and Mission Bay areas to South of Market (SoMa), Union Square and Chinatown. Four
new stations will be built along the 1.7-mile Central Subway Project alignment:
4th and Brannan Station at 4th and Brannan streets (surface station)
Yerba Buena/Moscone Station at 4th and Folsom streets (subway station)
Union Square/Market Street Station on Stockton Street at Union Square
(subway station)
Chinatown Station at Stockton and Washington streets (subway station)
The Central Subway Project will contribute greatly to San Francisco’s economic
competitiveness and help secure the city’s status as a regional, national and global hub.
It will provide frequent, clean, pollution-free transit service and increase transit capacity
on the entire T Third line, from Chinatown to Sunnydale. The Central Subway will
provide reliable transportation for residents of one of the most densely populated
neighborhoods in the country, provide a rapid transit link to a burgeoning technology
and digital-media hub, and improve access to a premier commercial district and tourist
attraction. Additionally, this project will help reduce the environmental impact of
transportation in our city, save natural resources, reduce traffic congestion and improve
transportation options for an underserved area of San Francisco. The project map
displays the continuous alignment of both phases of the Third Street Light Rail Program,
when completed.

DRAFT SFMTA Short Range Transit Plan 146
Project Capital Costs
The Central Subway’s capital budget is $1.6 billion.
The Federal Transit Administration (FTA) sponsored a year-long formal Central Subway
Risk Assessment as part of the FTA New Starts Program to complete the preliminary
engineering of the project, achieve FTA Final Design entry approval, and to identify the
total project FTA eligible capital costs. From May 2008 through May 2009, a series of
four Risk Assessment Workshops performed a detailed risk analysis of the project
costs, constructability, and schedule. At the conclusion of these workshops, the FTA
recommended a capital budget of $1.6 billion and a construction completion date of
December 2018.
Table 37. Central Subway Capital Costs, as of May 2016
PROJECT CAPITAL ELEMENTS (Applicable line items only)
YOE Dollars TOTAL ($ millions)
10 Guideway & Track Elements (1.7 miles) $286
20 Stations, Stops, Terminals, Intermodal (4) $574
40 Sitework & Special Conditions $206
50 Systems $95
CONSTRUCTION SUBTOTAL (10 - 50) $1,161
60 ROW, Land, Existing Improvements $37
70 Vehicles (4) $26
80 Professional Services (Applies To Cats. 10-50) $329
SUBTOTAL (10 - 80) $1,553
90 Unallocated Contingency $25
Total Project Cost (10 - 100) $1,578

DRAFT SFMTA Short Range Transit Plan 147
Table 38. Central Subway Funding Sources, Expenditures, and Cash on Hand, as of
May 2016 [TABLE PENDING UPDATES IN SUMMER 2016]
FUNDING SOURCES
COMMITTED FUNDING
TOTAL AWARDED FUNDS TO DATE
ENCUMBRANCES TO DATE
EXPENDITURES BILLED TO DATE
CASH ON HAND; available for billing budgeted expenses
CASH ON HAND; % awarded funds allocated
CASH ON HAND; available for 2014
FEDERAL
Sect. 5309-NS
$ 942,200 $ 619,196 $ 304,111 $ 259,345 $ 44,765 95 % $ 15,071
CMAQ $ 41,025 $ 41,025 $ 41,025 $ 41,025 $ 0 100 % $ 0
Federal Subtotal
$ 983,225 $660,221 $ 345,136 $ 300,371 $ 44,765 96% $ 15,071
STATE
TCRP $ 14,000 $ 14,000 $ 14,000 $ 14,000 $ 0 100 % $ 0
State RIP
$ 88,000 $ 12,498 $ 0 $ 0 $ 0 0 % $ 0
Prop 1B (I-Bond) PTIMSE
$ 307,792 $ 307,792 $ 145,142 $ 145,142 $ 77,557 99 % $ 3,213
Prop 1A (HSR-Bond)
$61,308 $ 61,308 $ 61,308 $ 61,308 $ 0 100 % $ 0
State Subtotal
$471,100 $ 395,598 $ 220,450 $ 220,450 $ 77,557 98.93 % $ 3,213
LOCAL
Prop K $ 123,975 $ 123,975 $ 123,975 $ 113,254 $ 10,721 100 % $ 0
Local Subtotal
$ 123,975 $ 123,975 $ 123,975 $ 113,254 $ 10,721 100 % $ 0
TOTAL $ 1,578,300 $
1,179,794 $ 767,118 $ 634,075 $ 133,043 98 % $ 18,284
Capital Funding Sources
The Third Street Light Rail Transit Project is the most significant capital investment in
public transit in San Francisco in generations. About $648 million was invested in Phase
1 of the project, and nearly $1.6 billion is budgeted for Phase 2.

DRAFT SFMTA Short Range Transit Plan 148
The Central Subway Project is funded by a mixture of federal, state and local sources,
as shown in the table below. The majority of funding for the Central Subway Project will
be provided by the FTA’s New Starts program, with a total approved commitment of
$942.2 million. An additional $41 million in federal funds is designated to the project as
part of the U.S. Department of Transportation’s Congestion Mitigation and Air Quality
Improvement Program, which supports environmental efforts for surface transportation
and related projects.
The baseline budget for the Central Subway Project remains at $1.6 billion. There has
been no increase in the local funding commitment since original voter approval in 2003
of $126 million in Proposition B/K sales tax funds. The table on the previous page
presents Central Subway funding allocations, use of funds and amounts to date by
source, and is organized by funding sources, reports the grant funds received and
expended and the cash balance remaining by source.
There are no significant changes in secured or anticipated funding from that listed in
MTC Resolution No. 3434. The SFMTA has $100M in commercial capacity that is
available for use by the Central Subway project in the event that grant receipts are
delayed. On April 26, 2011, SFMTA obtained a commitment from the Metropolitan
Transportation Commission (MTC) for $150 million of (State) Regional Improvement
Program funds to the project to be accessed in the event project costs increase above
$1.6 billion.
As of May 2016, the total net incurred costs for the project are $941.3 million. This
incurred amount equals 60% of the total project budget of $1.6 billion. The Total Project
Contingency is $79.7 million, which is $19.7 million more than the FTA recommended
minimum contingency level of $60 million.
Project Schedule
The Central Subway Project has been in the planning, design, and construction phases
for just over a decade. In that time, the major project milestones include:
2005: The supplemental environmental review process for the Central Subway
Project began. More than 200 public meetings were held before the project
received environmental clearance from the FTA in November 2008.
2010: Work to relocate utility lines began at the future site of the Yerba
Buena/Moscone Station. Similar work began in 2011 to prepare the site where
the Union Square/Market Street Station will be built. In 2012, construction to
prepare for the Central Subway tunnel commenced in SoMa, Union Square and
North Beach.
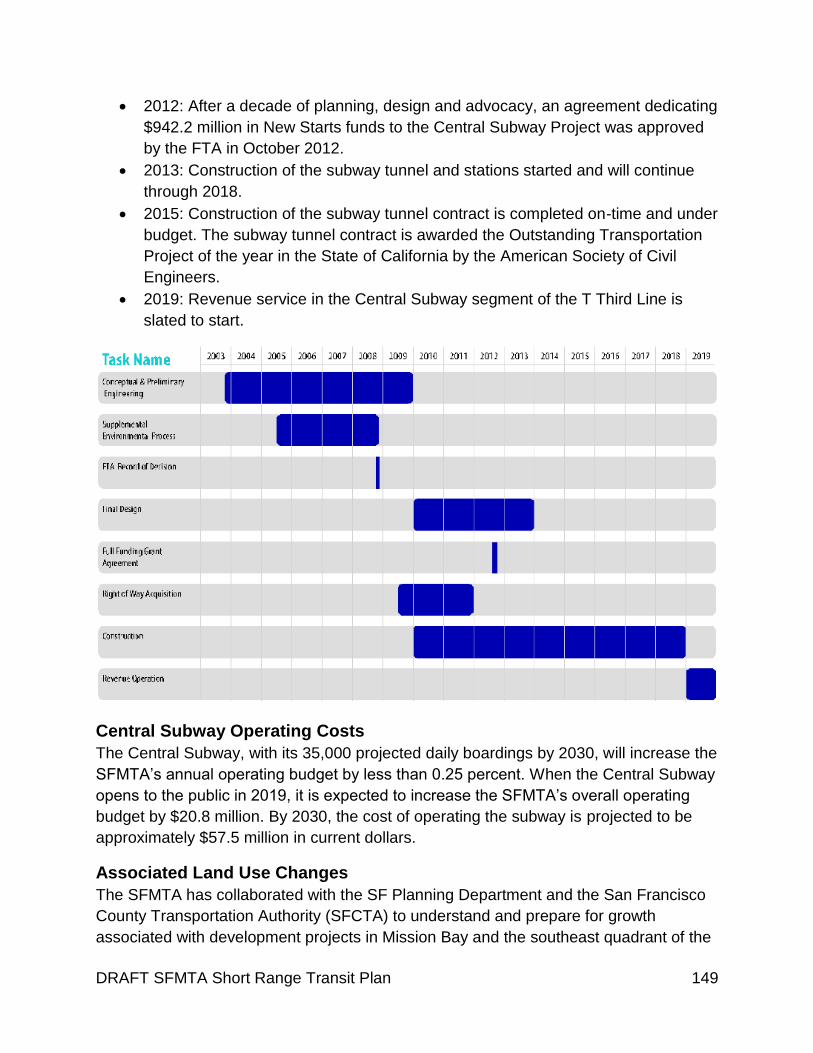
DRAFT SFMTA Short Range Transit Plan 149
2012: After a decade of planning, design and advocacy, an agreement dedicating
$942.2 million in New Starts funds to the Central Subway Project was approved
by the FTA in October 2012.
2013: Construction of the subway tunnel and stations started and will continue
through 2018.
2015: Construction of the subway tunnel contract is completed on-time and under
budget. The subway tunnel contract is awarded the Outstanding Transportation
Project of the year in the State of California by the American Society of Civil
Engineers.
2019: Revenue service in the Central Subway segment of the T Third Line is
slated to start.
Central Subway Operating Costs
The Central Subway, with its 35,000 projected daily boardings by 2030, will increase the
SFMTA’s annual operating budget by less than 0.25 percent. When the Central Subway
opens to the public in 2019, it is expected to increase the SFMTA’s overall operating
budget by $20.8 million. By 2030, the cost of operating the subway is projected to be
approximately $57.5 million in current dollars.
Associated Land Use Changes
The SFMTA has collaborated with the SF Planning Department and the San Francisco
County Transportation Authority (SFCTA) to understand and prepare for growth
associated with development projects in Mission Bay and the southeast quadrant of the

DRAFT SFMTA Short Range Transit Plan 150
City. This collaboration has resulted in a better understanding of the future travel plans
of customers along the alignment and improved operating-cost projections.
Bayview/Hunters Point and Mission Bay
The T Third Line was designed with population growth in mind and will be able to
accommodate new ridership without overcrowding as the Visitacion Valley,
Bayview/Hunters Point, and Mission Bay areas continue to develop. Currently 68
percent of residents along the Central Subway alignment do not own vehicles and rely
heavily on public transportation.
With the influx of 10,000 new housing units planned for Hunters Point and the Schlage
Lock redevelopment site and the dramatic growth in businesses and residential units in
Mission Bay, an estimated 24,000 additional people will depend on the T Third Line to
connect to Caltrain, AT&T Park, the proposed Warriors Arena, Yerba Buena/Moscone
Convention Center, Market Street, Union Square, and Chinatown.
Central SoMa
In 2011, the San Francisco Planning Department began the process to develop an
integrated community vision for the southern portion of the Central Subway rail corridor,
generally bounded by 2nd and 6th Streets between Townsend and Market streets (see
Figure 24). The development of the Draft Plan was largely funded by a Transportation
Planning Grant from Caltrans. The Central SoMa Plan provides the vision and the
strategies to support positive change along and around the Fourth Street transit spine,
while maintaining SoMa’s diverse social and economic mix. The plan presents a
comprehensive strategy that addresses such issues as land use, building size and
heights, transportation to support the city’s Vision Zero and Transit First policies, the
public realm (including sidewalks and open space), preservation of historic buildings
and environmental sustainability. The Central SoMa Plan also aims to ensure SoMa
serves a local neighborhood by increasing access to jobs and to housing, making safer
streets and more public spaces, strengthening the neighborhood’s character, supporting
economic vitality, and improving 24-hour livability. This plan is currently in
environmental review which is expected to conclude late 2016. After its certification, the
San Francisco Planning Department will begin presentations of the plan at the Planning
Commission, en route to Plan adoption.
Figure 24. Central SoMa Project Area

DRAFT SFMTA Short Range Transit Plan 151
Land Acquisition
In preparation for the extensive construction process for the Central Subway, the
SFMTA has acquired many properties adjacent to the line and stations in order to
provide land for the construction of the stations. Specifically, the Agency has gained
lands adjacent to the Moscone/Yerba Buena, Union Square and Chinatown stations,
and acquired easement rights with private property owners in order to accommodate the
machinery and equipment needed for construction. The land adjacent to the
Moscone/Yerba Buena Station will be used for an affordable housing development, and
the site of the Chinatown station will accommodate, in addition to the station entrance
itself, a public plaza and a small retail component.
Policy, Planning, Funding or Operating Issues
There are no current or anticipated policy, planning, funding or operating issues
associated with the project.

DRAFT SFMTA Short Range Transit Plan 152
Van Ness Bus Rapid Transit Project
The Van Ness Bus Rapid Transit (BRT) project will apply bus rapid transit principles
including transit-only lanes, transit signal priority, high-quality stations and streetscape
elements to Van Ness Avenue between Mission Street and Lombard Street. Transit on
this section of the corridor is currently provided by Muni routes 47, 49 and 90, and
Golden Gate Transit service. As one of the busiest north-south corridors in San
Francisco, the combined service has an average ridership of 16,000 passengers per
day, and ridership is expected to grow to 25,000-30,000 passengers per day along this
corridor by 2035.
When completed, this project will bring faster and more reliable transit service to this
important corridor. Implementation of BRT service and infrastructure changes are
expected to cut transit travel times by 32 percent.
Project Capital Costs & Funding Sources
The cost estimate for the Van Ness BRT Project is approximately $189.5 million
(including bus procurement), as of Summer 2016. Funding for the Van Ness BRT
project comes from a variety of sources including FTA Small Starts, San Francisco Prop
K funds, and developer contributions. Projects associated with the Van Ness BRT
project include repaving Van Ness Avenue, new traffic signal hardware and software,
new transit vehicles, and streetlights/poles replacement. These projects are funded by
FTA Formula Funds, San Francisco Prop K funds, regional, and statewide sources.
Of the approximately $189.5 million total project cost, local, regional, and state
programs account for $72.5 million of this amount, $75 million is secured by 5309 FTA
Small Starts Funds, and $38 million from Proposition K, San Francisco’s half-cent sales

DRAFT SFMTA Short Range Transit Plan 153
tax increase. As of June 2016, there are no changes in secured or anticipated funding
for the project.
Table 39. Van Ness Bus Rapid Transit Project Capital Costs, as of June 2016
PROJECT CAPITAL ELEMENTS (Applicable line items only)
YOE Dollars TOTAL ($ millions)
10 Guideway & Track Elements (2 miles) $6.175
20 Stations, Stops, Terminals, Intermodal (9) $4.640
30 Support Facilities: Yards, Shops, Administrative Buildings
$0
40 Sitework & Special Conditions $96.233
50 Systems $10.365
Construction Subtotal (10 - 50) $117.413
60 ROW, Land, Existing Improvements $0
70 Vehicles (4) $4
80 Professional Services (Applies To Categories 10-50) $51.702
Subtotal (10 - 80) $169.115
90 Unallocated Contingency $16.405
Subtotal (10 - 90) $189.5
100 Finance Charges $0
Total Project Cost (10 - 100) $189.5
Project Schedule
The Van Ness BRT Project completed the environmental review phase in December
2013 and is finalizing the detailed design of the project. Construction is projected to
begin in summer of 2016, and revenue service along the corridor is anticipated to begin
in 2019.
Table 40. Van Ness Bus Rapid Transit Project Schedule
DATE MILESTONE
September 2013 Local CEQA Approval

DRAFT SFMTA Short Range Transit Plan 154
DATE MILESTONE
December 2013 Final EIR/EIS – Record of Decision (ROD)
December 2013 Draft 30% Design
April 2014 30% Design complete
October 2014 Submit Draft Small Starts Grant Agreement to FTA
November 2014 65% Design complete
April 2015 Small Starts Grant Agreement Execution
July 2015 100% Design complete
2017 - 2018 Arrival of new transit vehicles
2016 – Late 2018
Construction period
2019 Revenue Service
Van Ness Bus Rapid Transit Operating Costs
The table below shows the projected annual costs for SFMTA to run vehicles and
provide revenue service for the No Build Alternative and initial build alternatives
included in the environmental review documentation. The locally-preferred alternative
(LPA) is a combination of Alternatives 3 and 4, and therefore the costs associated with
the LPA would be similar to these options. The build alternatives would allow SFMTA to
provide the same amount of service to passengers for a 16- to 32-percent lower
operating cost, as shown in the table. The LPA operating cost would be similar to that of
Build Alternatives 3B and 4B, with 32 percent lower operating cost compared to the No
Build Alternative. This savings is due to the faster speed and shorter running times,
which means maintaining the same frequency of service would require fewer vehicles
operating on the corridor at any one time. These operating savings could be reinvested
in the corridor and used to increase the frequency of the BRT service, or they could be
invested in other parts of the Muni system.
Each of build alternatives and the LPA would have a modest incremental maintenance
cost over and above the no-build scenario. Increased maintenance costs include repairs
to potholes and patches to the runningway; maintenance of the red transit-only lanes;
additional landscaping costs to prune trees under Build Alternatives 3 and 4 due to their
proximity to the overhead wire system; additional platform cleaning and repair; and
maintenance of additional ticket vending machines required to support platform proof of
payment. The LPA maintenance costs would be similar to those of Build Alternative 3B
in the table below and the major component of runningway maintenance costs, tree
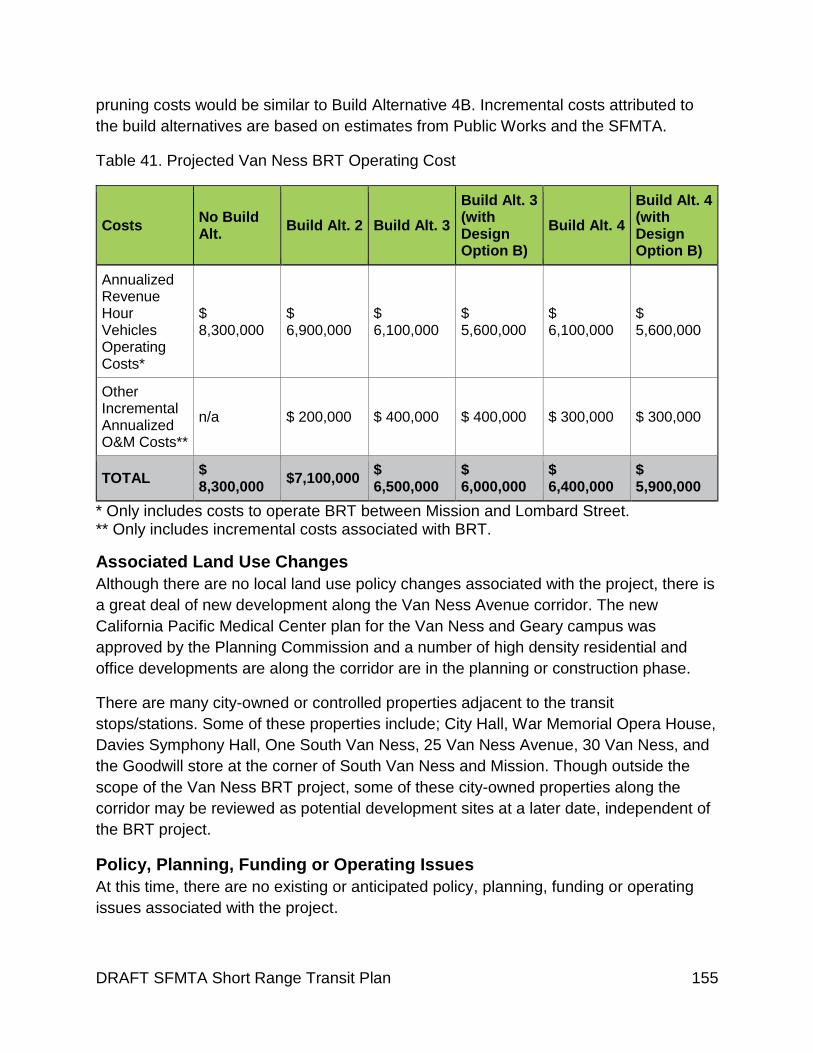
DRAFT SFMTA Short Range Transit Plan 155
pruning costs would be similar to Build Alternative 4B. Incremental costs attributed to
the build alternatives are based on estimates from Public Works and the SFMTA.
Table 41. Projected Van Ness BRT Operating Cost
Costs No Build Alt.
Build Alt. 2 Build Alt. 3
Build Alt. 3 (with Design Option B)
Build Alt. 4
Build Alt. 4 (with Design Option B)
Annualized Revenue Hour Vehicles Operating Costs*
$ 8,300,000
$ 6,900,000
$ 6,100,000
$ 5,600,000
$ 6,100,000
$ 5,600,000
Other Incremental Annualized O&M Costs**
n/a $ 200,000 $ 400,000 $ 400,000 $ 300,000 $ 300,000
TOTAL $ 8,300,000
$7,100,000 $ 6,500,000
$ 6,000,000
$ 6,400,000
$ 5,900,000
* Only includes costs to operate BRT between Mission and Lombard Street. ** Only includes incremental costs associated with BRT.
Associated Land Use Changes
Although there are no local land use policy changes associated with the project, there is
a great deal of new development along the Van Ness Avenue corridor. The new
California Pacific Medical Center plan for the Van Ness and Geary campus was
approved by the Planning Commission and a number of high density residential and
office developments are along the corridor are in the planning or construction phase.
There are many city-owned or controlled properties adjacent to the transit
stops/stations. Some of these properties include; City Hall, War Memorial Opera House,
Davies Symphony Hall, One South Van Ness, 25 Van Ness Avenue, 30 Van Ness, and
the Goodwill store at the corner of South Van Ness and Mission. Though outside the
scope of the Van Ness BRT project, some of these city-owned properties along the
corridor may be reviewed as potential development sites at a later date, independent of
the BRT project.
Policy, Planning, Funding or Operating Issues
At this time, there are no existing or anticipated policy, planning, funding or operating
issues associated with the project.
DRAFT SFMTA Short Range Transit Plan 156
ACKNOWLEDGEMENTS
SFMTA Board Members
Tom Nolan, Chair Cheryl Brinkman, Vice-Chair Gwyneth Borden Malcolm Heinicke Lee Hsu Joél Ramos Cristina Rubke
SFMTA Executive Team
Edward D. Reiskin, Director of Transportation Sonali Bose, Director of Finance & Information Technology Kate Breen, Director of Government Affairs Susan Cleveland-Knowles, General Counsel Donald Ellison, Director of Human Resources

DRAFT SFMTA Short Range Transit Plan 157
John Funghi, Director of Central Subway Program John Haley, Director of Transit Melvyn Henry, Director of System Safety Tom Maguire, Director of Sustainable Streets Candace Sue, Director of Communications Kate Toran, Director of Taxis & Accessible Services
SRTP Development Team
Keith Tanner Darton Ito
Development of this Short Range Transit Plan has involved a large number of individuals associated with the San Francisco
Municipal Transportation Agency. We would like to thank everyone who was involved for contributing their time and expertise
to this planning effort.
Photography & Figures
All images and figures by the San Francisco Municipal Transportation Agency unless
noted. http://sfmta.photoshelter.com/

DRAFT SFMTA Short Range Transit Plan 158
Back cover. SFMTA Fiscal Year 2017 - Fiscal Year 2030 Short Range Transit Plan San Francisco Municipal Transportation Agency 1 South Van Ness Avenue San Francisco, CA 94103 www.sfmta.com