SFAS 142 and Overbidding in Mergers and Acquisitions · We use a novel overbidding measure derived...
61
SFAS 142 and Overbidding in Mergers and Acquisitions Eli Bartov Stern School of Business New York University C.S. Agnes Cheng School of Accounting and Finance Hong Kong Polytechnic University Hong Wu School of Accounting and Finance Hong Kong Polytechnic University October 27, 2016 Abstract SFAS 141 requires using the purchase method in merger and acquisition and SFAS 142 replaces periodic amortization of goodwill with an annual impairment test. As firm’s future income will not be affected by goodwill amortization and managers can time the impairment, we propose that empire-building managers are more likely to overbid and allocate the excess purchase price to goodwill in the post-SFAS 142 period. We use a novel overbidding measure derived from the first-order-condition of bidder's value maximization problem at the transaction level, and find that SFAS 142 increases overbidding. In addition, we control for synergy and show that higher goodwill is significantly associated with the overbidding, as well as with lower post-announcement returns. Our results highlight one important yet unintended consequence of SFAS 142: it aggravates agency conflicts that decrease shareholder wealth by granting more discretion in the measurement of goodwill. JEL: M41 Keywords: Goodwill accounting, SFAS 142, Overbidding, Mergers and Acquisitions
Transcript of SFAS 142 and Overbidding in Mergers and Acquisitions · We use a novel overbidding measure derived...

SFAS 142 and Overbidding in Mergers and Acquisitions
Eli Bartov
Stern School of Business
New York University
C.S. Agnes Cheng
School of Accounting and Finance
Hong Kong Polytechnic University
Hong Wu
School of Accounting and Finance
Hong Kong Polytechnic University
October 27, 2016
Abstract
SFAS 141 requires using the purchase method in merger and acquisition and SFAS 142 replaces periodic
amortization of goodwill with an annual impairment test. As firm’s future income will not be affected by
goodwill amortization and managers can time the impairment, we propose that empire-building managers
are more likely to overbid and allocate the excess purchase price to goodwill in the post-SFAS 142
period. We use a novel overbidding measure derived from the first-order-condition of bidder's value
maximization problem at the transaction level, and find that SFAS 142 increases overbidding. In
addition, we control for synergy and show that higher goodwill is significantly associated with the
overbidding, as well as with lower post-announcement returns. Our results highlight one important yet
unintended consequence of SFAS 142: it aggravates agency conflicts that decrease shareholder wealth by
granting more discretion in the measurement of goodwill.
JEL: M41
Keywords: Goodwill accounting, SFAS 142, Overbidding, Mergers and Acquisitions

2
1. Introduction
Mergers and acquisition (M&A) transactions are significant corporate events that affect shareholder wealth.
FASB issued the Statement of Financial Accounting Standards No. 141, Business Combinations (hereafter “SFAS
141”) and No. 142, Goodwill and Other Intangible Assets (hereafter “SFAS 142”) on June 1st, 2001 (effective
date, fiscal years beginning after December 15, 2001) that changed the accounting for M&A transactions in
important ways. Prior to SFAS 141, firms could choose between pooling-of-interests and purchase methods.
SFAS 141 changed this by requiring that M&A transactions be accounted for by a single method—the purchase
method. In addition, it requires acquirers to disclose the primary reasons for the acquisition and the allocation of
the purchase price paid to the assets acquired and liabilities assumed by major balance sheet caption. When the
amounts of goodwill and intangible assets acquired are significant in relation to the purchase price paid,
disclosure of other information about those assets is required, such as the amount of goodwill by reportable
segment and the amount of the purchase price assigned to each major intangible asset class. SFAS 142 changed
the accounting treatment for goodwill. While pre-SFAS 142 goodwill was amortized over a period not to exceed
40 years, SFAS 142 disallows periodic amortization of goodwill. Instead, firms must conduct, at least once a year,
a fair value based test for goodwill impairment. The process used to identify potential goodwill impairment and
measure the amount of a goodwill impairment loss consists of two steps. The first, which aims at identifying
potential impairment, compares the fair value of a reporting unit with its carrying amount, including goodwill. If
the fair value of a reporting unit exceeds its carrying amount, the goodwill of the reporting unit is not impaired,
and the process is aborted. Conversely, if the carrying amount of a reporting unit exceeds its fair value, the
second step of the goodwill impairment test is preformed to measure the amount of impairment loss. This step
compares the implied fair value of the reporting unit goodwill with the carrying amount of that goodwill. If the
carrying amount of reporting unit goodwill exceeds the implied fair value of that goodwill, an impairment loss is
recognized in an amount equal to that excess.
With the change from periodic amortization to annual impairment test of goodwill, SFAS 142 introduces
substantial managerial discretion in timing impairment losses, causing relatively fewer goodwill impairments

3
(Roychowdhury and Watts, 2007). This follows because the impairment test concerns highly subjective and hard-
to-verify projections of the fair value of the reporting unit(s) as a whole, and of the unit(s)’ assets and liabilities
excluding goodwill. Even more managerial discretion regarding goodwill impairment was introduced by FASB
Accounting Standards Update of July 2012 that relaxes the requirement for the annual impairment test in
situations where the entity determines after assessing qualitative factors that it is not more likely than not that
goodwill is impaired.
Given the additional subjectivity introduced by SFAS 142 and the Accounting Standards Update, we would
expect greater presence of agency conflicts, as managers have more discretion in managing the incidence and
timing of goodwill impairment loss recognition. More specifically, for M&A transactions that adopted the
purchase method before SFAS 142, the overbidding will have a ‘mandatory’ adverse impact on future periodic
earnings from the amortization of the over-allocated goodwill. SFAS 142 and the Financial Standards Update
allow the management to have more discretion in recognizing the goodwill impairment loss, hence, less adverse
effect on periodic earnings. Consequently, managers of acquiring firms will be more likely to pay more to secure
the transaction and pursue private benefits after 2002 and perhaps even more so after 2012, at the cost of
shareholder wealth. Such private benefits for acquirer CEOs include bonuses related to completing the
acquisitions or empire-building goals. Hence, we hypothesize that one important real effect of SFAS 142 and the
Financial Standards Update on M&A transactions is a greater level of overbidding by the acquirer management to
maximize the likelihood of securing the transaction. Second, since goodwill is the difference between the
purchase price and the target’s fair value of net identifiable assets, and since post-SFAS 142 goodwill is no longer
amortized, we hypothesize that overbidding likely leads to higher goodwill recognition at the acquisition date
(overbidding-driven goodwill hypothesis). Finally, our third hypothesis concerns post-M&A announcement
returns. If investors are not fully aware that goodwill (partially) represents overbidding at the time the M&A
transaction is announced, a negative drift in stock returns will be observed.
Overbidding has been widely discussed in the M&A literature and attributed to various reasons. It is rooted
either in bidder irrationality (Roll, 1986; Malmendier and Tate, 2008; Hayward and Hambrick, 1997) or the

4
classic agency conflict (Berle and Means, 1932).1 However, empirical measures of overbidding, most notably
negative acquirer announcement CARs, fail to take into account the correlation between the bidder’s profit and
the probability of success in the bidding process. This endogeneity concern opens up the possibility that measures
used in the past literature as proxies for overbidding do not fully characterize investors reaction to overbidding at
the M&A announcement.
In this paper, in testing our first hypothesis, the one that relates to the effect of SFAS 142 and the Financial
Standards Update on overbidding, we use a novel direct measure of transaction-level overbidding, derived from
the first-order condition of bidder’s profit maximization problem (De Bodt et al., 2016). This measure explicitly
takes into account the correlation between the bidder’s profit and probability of success, and thus is not subject to
endogeneity concerns. Moreover, in testing our second hypothesis, the one on the relation between overbidding
and goodwill, we control for synergy and other potential factors affecting the bidding to eliminate potential
alternative explanations for our findings.
We follow the method suggested by De Bodt et al. (2016) to construct our measure of overbidding. We first
estimate the probability of success using both 3,736 completed and 1,142 withdrawn transactions (see Table 1),
and then estimate the first-order condition of the bidder’s maximization problem using seemingly unrelated
regressions to obtain our measure of overbidding. We then focus on the completed transactions and analyze
whether post-SFAS 142 transactions have significantly higher overbidding than pre-SFAS 142’s. We find that
overbidding has significantly increased post-SFAS 142. This result is robust to controlling for time series trends
such as market sentiment and M&A waves. Moreover, as expected the increase is less pronounced in high
leverage acquiring firms (as they are vulnerable to potential financial constraints), horizontal transactions (as
these transactions have lower information asymmetry between bidders and targets), and relatively large targets (as
relatively bigger targets have less information asymmetry and are more costly to acquire).
1 See De Bodt et al. (2016): Moeller et al. (2004) and Boone and Mulherin (2008) report evidence failing to support the
winners’ curse predictions. But other studies report results compatible with, or even supporting, the hubris hypothesis
(Berkovitch and Narayanan, 1993; Hietala et al., 2003, in the Paramount takeover case; Mueller and Sirower, 2003; Eckbo
and Thorburn, 2009).

5
Second, we hand-collect a sample of 1,151 post-SFAS 142 transactions with goodwill information analyze the
relationship between goodwill and overbidding. We find that goodwill is significantly and positively associated
with overbidding, controlling for synergy. Specifically, a 10% decrease in the bid’s marginal profit caused by
overbidding leads to an increase of about 399 thousands of goodwill allocated per million total transaction value.
This finding supports our “overbidding-driven goodwill” hypothesis that SFAS 142 affects shareholder wealth
through the effect of goodwill recognition due to overbidding. Finally, we examine the post-announcement
market reactions to overbidding transactions. We find that starting from 180 days after the transaction
announcement; the post-announcement returns are significantly lower when recognized goodwill is higher.
Overall, a 10% increase in the goodwill relative to the transaction value is associated with about 12% decrease in
the 360-day post-announcement returns.
Our contribution to the literature is twofold. First, we provide direct evidence of the negative yet unintended
shareholder wealth and accounting quality consequences of SFAS No. 142. Based on firm-level as opposed to
transaction-level goodwill recognition, previous literature has focused on the determinants of goodwill
recognition and write-offs (e.g. Shalev et al., 2013; Gu and Lev, 2012; Cedergren et al., 2016). In contrast, we
focus on potential unintended economic consequences of SFAS 142 by using a direct transaction-level
overbidding measure that explicitly models the correlation and tradeoffs between bidder’s profit and the
probability of success, and a hand-collected sample of goodwill allocations in mergers and acquisitions. This
allows us to be the first to directly test whether SFAS 142 makes overbidding more likely, as well as to shed light
on the important question of whether goodwill represents synergy, as intended by FSAB, or alternatively is driven
by overbidding, thereby masking the economic reality underling M&A transactions. Our findings are the first to
demonstrate that SFAS 142 intensifies agency conflicts between shareholders and management due to more
managerial discretion over goodwill recognition, which results in lower accounting quality and more overbidding.
Second, we also contribute to the literature on overbidding. While the M&A literature has attributed
overbidding to bidder past performance, CEO variable compensation and entrenchment (De Bodt et al., 2016), we
explore the role of accounting treatment of goodwill, in driving overbidding, as a new channel that fosters agency

6
conflicts. Different from the above mentioned factors that exacerbate overbidding, the accounting treatment of
goodwill has a specific mechanism in affecting overbidding: the discretion granted in managing the goodwill
impairment and write-offs upon the completion of the acquisition motivates the managers to overbid in the private
negotiation process. Our findings shed light on the role of accounting in shaping and affecting agency conflicts,
and ultimately shareholder wealth, in significant corporate activities.
The rest of the paper is organized as follows. Section 2 provides an overview of the relevant literature.
Section 3 discusses our three set of main hypotheses. Section 4 summarizes the sample construction procedures.
Section 5 analyzes results on the effect of SFAS 142 on overbidding after SFAS 142. Section 6 analyzes results
on the relationship between goodwill and overbidding v.s. synergy. Section 7 concludes.
2. Literature Review
Our paper is related to two main streams of literature: accounting literature on goodwill and M&A literature
on overbidding.
Accounting research on goodwill is mainly focused on three areas: 1) determination of goodwill, i.e. the
recognition and valuation of goodwill in the context of the purchase price allocation; 2) value relevance of
goodwill such as how goodwill balances have predictive value for companies’ future earnings and cash flows; 3)
the determinants and the market reactions to goodwill impairment. Our paper is closely related to 1) and 2) and
also shed light on 3).
As SFAS 141 and SFAS 142 mandates, goodwill arises in the course of the purchase price allocation
following a business combination when the cost of the acquisition exceeds the fair value of the target company’s
net assets. After goodwill has been recognized, companies cannot amortize the goodwill and must conduct
impairment test of the goodwill. In the first place, several studies document that in business combinations a high
proportion of the cost of the acquisition is allocated to goodwill, despite the US GAAP rules for the recognition of
acquired intangible assets. For example, Shalev et al. (2013) examine a sample of 184 acquisitions undertaken by
US companies between July 2001 and April 2007 and find that the mean proportion allocated to goodwill is
7
55.4%. Ott and Guenther (2010) report a mean ratio of goodwill to cost of acquisitions of 61.2% for 1,437
business combinations undertaken by US companies between 2001 and 2008.
Under the impairment-only approach, managers have an incentive to allocate high proportions of the cost of
the acquisition to goodwill rather than to other, depreciable or amortizable assets. Shalev et al. (2013) find that the
allocation of the costs of the acquisitions to goodwill increases with the importance of bonuses in CEOs’ pay
packages. Zhang and Zhang (2015) finds that the allocation of purchase price to goodwill and identifiable
intangible assets is related to the economic determinants of the valuation but also significantly affected by
managerial incentives arising from treatments of goodwill under SFAS 142. Lys et al. (2012) classify acquisitions
as those resulted in "economic profits" and those resulted in "economic losses" based on acquiring firms’ stock-
market returns between the announcements and the completions of the acquisitions. They find that acquirers with
economic losses allocate significantly higher proportions of the total purchase consideration to goodwill than
acquirers with economic profits. They also find that goodwill in transactions with economic profits is positively
correlated with economic profit, suggesting the role of synergies in goodwill. For transactions with economic
losses, goodwill is negatively correlated with the losses, suggesting the role of overbidding in goodwill. Our paper
contributes to this literature by examining the effect of SFAS 142 on overbidding and the relationship between
goodwill and overbidding. Our paper is also related to a recent paper by Cedergren et al. (2016). In their paper,
they examine the relationship between accounting conservatism and acquisition profitability using SFAS 142 as
an exogenous positive shock to conditional conservatism. They find a decrease in acquisition profitability and risk
post-SFAS 142. Our results are consistent with theirs as an increase in overbidding after SFAS 142 is likely to
lead to lower profitability.
Our paper contributes to the overbidding literature. In the first place, our paper follows De Bodt et al. (2016)’s
paper and estimates overbidding on the transaction level. The irrational bidding behavior itself is discussed in
three streams of literature as well. In the behavioral corporate finance literature, Roll (1986) introduced the
possibility that irrational behavior could lead to poor corporate performances. For its’ applications in M&A,
Hayward and Hambrick (1997), Chatterjee and Hambrick (2007), Malmendier and Tate (2008), Aktas et al. (2014)

8
study respectively the role of hubris, narcissism and overconfidence. Overbidding directly affects the sharing of
values between parties, whether it originates from irrationality or agency conflicts. While previous literature (e.g.
De Bodt et al., 2016) has attributed overbidding to various factors such as bidder past performance, CEO variable
compensation, our paper shows one specific mechanism that affects overbidding: accounting treatment of
goodwill.
3. Hypothesis Development
Our three sets of hypotheses are as follows. In the first place, we would answer the question: does SFAS 142
affect overbidding? Before the SFAS 142 is in place, an acquisition has to be financed substantially all in stock
(more than 90%) in order to qualify for the pooling-of-interest method, where the balance sheet of the combined
firm reflects assets, liabilities, and owners’ equity at the sum of these accounts as recorded by the separate
companies immediately before the combination was completed. Any transaction that is financed with all cash or a
mix of cash and stock (percent of stock less than 90%) then qualifies for the purchase method. When the purchase
method is used, assets and liabilities from the target are first recorded on the acquirer’s books at individual market
values. Then any positive difference between acquisition price and market value of net assets (assets minus
liabilities) is recorded as an asset called goodwill. Once recorded, goodwill is amortized for a period not to exceed
40 years (FASB 1992, pp. 227–28). After the SFAS 142 is in place, all business combinations must use the
purchase method. Goodwill is no longer amortized but need to be tested for impairment annually. As Hayn and
Hughes (2005) suggests, the impairment test has introduced additional managerial discretion by requiring the
projection of the fair value of the reporting unit(s) as a whole and of the unit(s)’ assets and liabilities excluding
goodwill.
The intuition for the effect of SFAS 142 and the Accounting Standards Update on overbidding is as follows.
Before SFAS 142, for pooling transactions, overbidding has little cost for acquirer CEOs as these transactions do
not generate any goodwill that reduce future earnings through amortization. For purchase transactions, the cost of
9
overbidding is hence the amortized goodwill that reduces future earnings. For purchase transactions after SFAS
142, the adverse effect of overbidding on future earnings is mitigated as the goodwill is no longer amortized and
acquirer CEOs have discretion in manipulating the recognition of goodwill impairment. Hence, for purchase
transactions, we should expect overbidding to be greater after SFAS 142. Alternatively, if the regulation
effectively constrains such managerial discretion, we should expect no change in overbidding after SFAS 142.
Our first set of hypothesis then is:
H1a: SFAS 142 increases overbidding for purchase transactions.
H1b: SFAS 142 has no effect on overbidding for purchase transactions.
Consistent with two alternative possibilities, allocated goodwill after SFAS 142 can be driven by two
competing forces. If SFAS 142 increases overbidding, then we should expect goodwill to be explained largely by
overbidding; alternatively we should expect goodwill to be explained by transaction synergy, as SFAS 142’s
original intention was. Our second set of hypotheses is:
H2a: Goodwill is significantly associated with and explained by overbidding.
H2b: Goodwill is significantly associated with and explained by synergy.
Finally, after the transaction announcement, investors will also respond to the goodwill allocation in a fashion
consistent the two alternative stories:
H3a: Post-announcement returns are negatively associated with goodwill if goodwill is driven by
overbidding.
H3b: Post-announcement returns are positively associated with goodwill if goodwill is driven by
synergy.
4. Data and Sample Construction

10
We construct two main samples for our analyses and Table 1 illustrates the procedures of construction.
The first sample is used for the estimation of the overbidding measure and constructed from Step 1 and 4.
From Thomson Reuters SDC, we extract 5,300 majority acquisitions announced from 1992-2014, including
both completed and withdrawn transactions. For completed acquisitions, we require that the percent of shares
owned after the acquisition is equal to 100%, the percent of shares held by the acquirer six months prior to the
M&A announcement is less than 50%, the target is a public U.S. company, and the transaction value is greater
than $1 million. For withdrawn transactions, we require the percent of shares seeking to own is equal to
100%, the percent of shares held by the acquirer six months prior to announcement is less than 50%, the
target is a public U.S. company, and the transaction value is greater than $1 million. We also require target
and acquirer financial characteristics to be available in COMPUSTAT and EVENTUS. We end up with 4,878
transactions for our estimation of probability of success. In Step 3, we estimate our overbidding measure Deal
FOC for completed transactions in our sample, using relevant model specifications and are able to have 2,975
transactions with Deal FOC. To analyze the effect of SFAS 142 on overbidding, we require relevant control
variables to be available and end up with 2,336 transactions.
Our second sample is constructed to estimate the relationship between goodwill and overbidding. We
collect goodwill information for completed transactions from acquirers’ 10-K statements filed as the fiscal
year end of the transaction closing date and are able to record goodwill for 1,151 transactions. We estimate
our overbidding measure again using the goodwill sample and require relevant control variables to be
available. To mitigate endogeneity, we further require sales method information in the private takeover
process to be available. We then estimate Deal FOC using 1,027 transactions (Step 6). Finally, requiring
relevant control variables to be available, we use 1,014 transactions to estimate goodwill (Step 7).
5. Does SFAS 142 increase overbidding?
5.1 Overbidding Measure

11
Suppose CEOs are rational and their goals are to maximize shareholders’ interests, the CEO will choose an
equilibrium bidding strategy to acquire the target subject to the following maximization problem:
𝑚𝑎𝑥𝑏𝑖𝑑E(𝐵𝑖𝑑𝑑𝑒𝑟′𝑠 𝑃𝑟𝑜𝑓𝑖𝑡) = (Pr (Success) × E(Synergies − Bid|Success)) (1)
where 𝐸( ) stands for expectation, Pr ( ) for probability, 𝐸( | ) for conditional expectation. The bidder’s profit is
the transaction specific value creation or any net economic benefits accruing to the acquirer (bidder). Success
indicates that the transaction will be completed. Synergies are values created in the acquisition and economic
benefits for the acquirer; Bid is bid premium, defined as the offer price premium to target shareholders given
success. The corresponding first order condition is:
𝜕 𝐸(𝐵𝑖𝑑𝑑𝑒𝑟′𝑠 𝑃𝑟𝑜𝑓𝑖𝑡)
𝜕𝐵𝑖𝑑=
𝜕 Pr(𝑆𝑢𝑐𝑐𝑒𝑠𝑠)
𝜕𝐵𝑖𝑑× (E(Synergies − Bid|Success)) +
𝜕𝐸(Synergies − Bid |Success)
𝜕𝐵𝑖𝑑× Pr(𝑆𝑢𝑐𝑐𝑒𝑠𝑠) = 0 (2)
Equation (2) is a necessary condition for shareholders’ value maximizing bidding behavior. Violation of Equation
(2), depending on the sign of 𝜕 𝐸(𝐵𝑖𝑑𝑑𝑒𝑟′𝑠𝑃𝑟𝑜𝑓𝑖𝑡)
𝜕𝐵𝑖𝑑 , indicates either overbidding (negative) or underbidding
(positive). The test rests on 𝜕 Pr (𝑆𝑢𝑐𝑐𝑒𝑠𝑠)
𝜕𝐵𝑖𝑑 and
𝜕𝐸(Synergies−Bid |Success)
𝜕𝐵𝑖𝑑, respectively, the partial derivative of the
probability of success with respect to the bid and the partial derivative of the bidder’s profit conditional on
successful acquisition, also with respect to the bid. These two partial derivatives need to be estimated. Deviations
from Equation (2) may follow from either irrational bidding—originating from the failure to take into account the
winner’s curse, which, in turn, affects the bid and therefore the probability of success—or from agency related
motives. Following De Bodt et al. (2016), the test of Equation (2) is based on the following two equations system
estimation:
𝐵𝑖𝑑𝑑𝑒𝑟′𝑠 𝑃𝑟𝑜𝑓𝑖𝑡 = 𝑎0 + 𝑎1 × 𝐵𝑖𝑑 + 𝐶𝑜𝑛𝑡𝑟𝑜𝑙 𝑉𝑎𝑟𝑖𝑎𝑏𝑙𝑒𝑠 + 𝜀1 (3)
Pr(𝑆𝑢𝑐𝑐𝑒𝑠𝑠) = 𝛽0 + 𝛽1 × 𝐵𝑖𝑑 + 𝐶𝑜𝑛𝑡𝑟𝑜𝑙 𝑉𝑎𝑟𝑖𝑎𝑏𝑙𝑒𝑠 + 𝜀2 (4)

12
Where, 𝜀1 and 𝜀2 are regression errors. 𝜀1 and 𝜀2 are correlated because the 𝐵𝑖𝑑 determines the residuals from
both the equations of bidder’s profit and the probability of success. We estimate the Equations (3) and (4) using
seemingly unrelated regressions (SUR). In the baseline specification, we include the same set of control variables
in Equation (3) and (4), which leads to a symmetric SUR specification. Point estimates in symmetric SUR
specification are identical to ordinary least square ones, but standard-errors account for the correlation between
errors (Greene, 2011). 𝛼1̂ is the estimate of 𝜕𝐸(Synergies−Bid |Success)
𝜕𝐵𝑖𝑑 and 𝛽1̂ is our estimate of
𝜕 Pr (𝑆𝑢𝑐𝑐𝑒𝑠𝑠)
𝜕𝐵𝑖𝑑.
Based on auction theory, we should expect, 𝛼1̂ < 0, as the higher the bid is, the greater the cost of bidding, and
hence less the bidder’s profit. We also expect, 𝛽1̂ > 0, as the higher the bid, the more likely the bidder is to
complete the transaction (less likely there will be contesters). For transaction level overbidding, the following
cross-equation measure Transaction FOC is estimated:
𝑇𝑟𝑎𝑛𝑠𝑎𝑐𝑡𝑖𝑜𝑛 𝐹𝑂𝐶 = 𝛽1̂ × 𝐵𝑖𝑑𝑑𝑒𝑟′𝑠 𝑃𝑟𝑜𝑓𝑖𝑡 + 𝛼1̂ × Pr (𝑆𝑢𝑐𝑐𝑒𝑠𝑠) (5)
Transaction FOC is the marginal bidder’s profit, as illustrated in Equation (2) and measures the decrease in the
bidder’s profit given one unit increase in the bid. Note that here the bidder’s profit is ex post, conditional on
success. Hence the smaller the Transaction FOC is (more negative), the more overbidding there is. This
represents a significant improvement with respect to existing tests of overbidding because (i) the correlation
between the Bidder’s Profit and the Pr (Success) is taken into account and (ii) the trade-off between these two
components of the expected bidder’s profit maximization program is explicitly modelled. In our empirical
estimation, we use Bidder’s Scaled CAR to proxy for Bidder’s Profit and 8-week Premium to proxy for Bid.
Bidder’s Scaled CAR is bidder’s three-day announcement returns, scaled by the probability of transaction success.
8-week Premium is the bidder’s offer price relative to the target stock price eight weeks prior to the transaction
announcement. Pr (Success) is estimated using a sample of completed and withdrawn transactions.
5.2 Estimating Overbidding
We construct a sample of 4,878 completed and withdrawn transactions, as described in Section 4, to estimate
overbidding. Table 2 shows the summary statistics for the variables we use in the estimating the probability of
13
success for each transaction and the comparisons of the means of these variables between withdrawn and
completed transactions.
The sample is composed of 73.5% completed transactions, 35.0% of targets listed on the NYSE or AMEX,
1.5% of targets with poison pills, 8.2% of transactions toeholds, 74.0% of listed bidders, 57.3% of horizontal
transactions, 13.6% of tender offers, 38.1% of pure cash transactions and 29.3% of pure stock transactions and 3.7%
of transactions classified as hostile in the SDC database. The sample is comparable to other large samples of U.S.
transactions with public targets in the existing literature (Betton et al., 2008). The average 8-week Premium is
44.2%, also consistent with figures reported in such samples. The ratio of the price 42 days before announcement
to the 52-week maximum is 0.726, an indication consistent with bidder market timing behavior (Baker et al.,
2012). In the sub-sample of completed transactions, the proportions of targets listed on the Nyse or Amex,
protected by a poison pill and in which the bidder has a toehold are smaller. All cash transactions are also less
frequent, as hostile transactions. The sub-sample of completed transactions includes higher proportions of
transactions by listed bidders and of horizontal transactions. Completed transactions display also higher eight-
week bid premium and less depressed target share price with respect to the 52-week high. Finally that tender
offers and all stock transactions are more frequent in the completed transactions sub-sample. These results are
consistent with previous results reported in the literature (e.g., Betton et al., 2008; Betton et al., 2014).
Table 3 reports the estimation results of the transaction success probability. The 8-week Premium has a
positive and significant coefficient, consistently with Betton et al. (2014). The signs on other variables are
consistent with the univariate comparisons in Table 2, except All Cash variable. We use estimated coefficients
from Table 3 to build the probit based proxy for the probability of success.
Table 4 summarizes descriptive statistics about the set of variables used to estimate the system of two
equations defined by Equations (3) and (4), the Transaction FOC measure in Equation (5) and variables used to
estimate the relation between goodwill and overbidding. p-values are only reported when the null hypothesis of
zero mean makes sense.

14
Table 4 starts by reporting statistics on CAR. Both Bidder CAR (-1.1%) and Bidder Scaled CAR (-1.3%) are
significantly negative, as expected for large transactions between listed firms (Betton et al., 2008). The average 8-
Week Premium is 44.3%, close to number classically reported for these kind of samples (Betton et al., 2008). The
average estimated Probability of Success is 86.4%, which is comparable to ex-post observed success rate (see
Table 2).
Next are our controls. Target Run-up is positive (8.7%). Target CAR are largely positive (26.1%) and these
transactions are, on average, synergistic with an average Transaction CAR of 2.5% (with a corresponding average
Transaction Scaled CAR of 2.8%). The average log of target to bidder Relative Size is -2.319, which indicates the
relative size is about 10.6%, consistent with the existing literature (e.g. Boone and Mulherin, 2008). 69.3% of
transaction attempts are Horizontal, 35.1% are paid in All Cash and 25.2% in All Stock, 1.9% of the bidders hold a
Toehold , 0.5% are classified as Hostile and 4.1% of the transactions have multiple bidders. Following De Bodt et
al. (2016), we include Bidder Private R2, measured as relative variation of the value of 1‐R², obtained from the
estimation of the market model, between the pre (day minus 61 to day minus 42) and the post announcement
period (day plus 42 to day plus 61), to proxy for the magnitude of bidder private information in the private
takeover process prior to the transaction announcement. We also include Bidder Private Amihud, measured as the
relative variation of the bidder Amihud (2002) illiquidity ratio between the pre (day minus 61 to day minus 42)
and the post announcement period (day plus 42 to day plus 61) to capture bidder firm’s liquidity in the private
takeover process.
Table 5 reports the SUR estimation results of the system of two equations, defined by Equation (3) and (4).
From these equations, Pr (Success) is as estimated above; Bidder’s Profit is proxied by Bidder’s Scaled CAR,
defined as Bidder CAR over the three days event windows centered on the announcement date, estimated with a
market model and with an estimation windows day minus 250 to day minus 10, scaled by the probability of
success, as reported in Table 4; Bid is proxied by 8-week Premium, defined as offer price divided by market price
of the target eight weeks before the announcement. For controls, following De Bodt et al. (2016), we include
transaction characteristics such as Toehold, Horizontal, Stock, Hostile, Bidder Size, Relative Size, etc. We also

15
include Run-up, Transaction CAR Rescaled, Bidder Private Amihud, Bidder Private R2, and Liquidity Index.
Consistent with De Bodt et al. (2016), the estimated coefficient of the 8-week Premium is negative and highly
significant in the Bidder Scaled CAR regression (-0.038 with p-value 0.00) and positive in the Probability of
Success regression (0.031 with p-value 0.00). The bidder’s trade-off in the bidding process is clearly captured
here: bidding more increases the probability of completing the transaction at the cost of decreasing value in case
of transaction completion. These results take into account the correlation between Bidder Scaled CAR and the
Probability of Success, a key feature of the SUR estimation method.
The coefficients on the control variables also show similar patterns to De Bodt et al. (2016) and previous
literature. Transaction Scaled CAR coefficient is positive and significant in the Bidder Scaled CAR regression,
which indicates that part of the value creation from the transaction is shared by the bidder. The Relative Size
coefficient is negative and highly significant. Horizontal has a negative sign, like in Boone and Mulherin (2008),
but not statistically significant. Finally, Hostile coefficient is negative and therefore less value creation for bidder,
as fighting against management is costly. In the Probability of Success regression, the Target Run-up variable
coefficient is positive, an indication that more anticipated transactions are more likely to conclude. The
Horizontal dummy variable coefficient is positive and highly significant, a result consistent with Betton et al.
(2014). The coefficient on Toehold is negative and significant, a result consistent with Betton et al. (2009), as
taking a toehold is a sign of aggression. Hostility decreases the probability of success, a result consistent with the
univariate evidence.
After estimating the SUR equations, we then generate Transaction FOC, the overbidding measure, for each
transaction using the coefficients on 8-week Premium in the two SUR equations, Probability of Success and
Transaction Scaled CAR, according to Equation (5).
5.3 Overbidding before and after SFAS 142
After we estimate overbidding for each transaction, we then analyze how SFAS 142 and the Financial
Standards Update affects overbidding in purchase transactions. First, we separately identify pre-SFAS 142
transactions in which pooling-of-interests accounting was used. Prior to the elimination of pooling-of-interests

16
accounting for acquisitions under FAS 141, APB 17 required an acquisition to be made substantially all in equity
in order to qualify for pooling-of-interests accounting and thus avoid recording goodwill and revaluing acquired
assets and liabilities. We analyze overbidding for transactions prior to SFAS 142, controlling for the form of the
acquisition. Second, we focus on the purchase transactions before and after SFAS 142. Specifically, we analyze
overbidding for all cash transactions and all purchase transactions-transactions that are financed with either all
cash or a mix of cash and stock, with percent of stock lower than 90%. Here we exclude “as-if pooling”
transactions after SFAS 142, as they would have qualified for pooling ones before SFAS 142. Third, we compare
overbidding for pooling transactions before SFAS 142 and “as-if pooling” transactions after SFAS 142. Finally,
we analyze overbidding for all transactions before and after SFAS 142.
Panel A in Table 6 reports the number of acquisitions annually, by the form of the acquisition, i.e. pooling v.s.
purchase. After SFAS 142 takes effect on June 30, 2001, there is no acquisition that uses the purchase method.
Panel B reports the number of acquisitions before and after SFAS 142. Post-142 pooling transactions are “as-if”
pooling as they would have qualified for pooling-of-interests transactions before SFAS 142.
When estimating overbidding, we use a similar set of control variables to De Bodt et al. (2016), including and
transaction characteristics and bidder firm characteristics, and have ended up with a sample of 2,336 transactions,
as shown in Table 1. Transaction characteristics include Synergy, Relative Size, Tender, Multiple Bidder, Related,
and Hostile. Firm characteristics include Bidder Past Performance, Bidder Size, Bidder Free Cash Flow, Bidder
Market-to-Book and Bidder Leverage. Table 7 reports the summary statistics of these variables. The average of
Transaction FOC is -0.032 and the median is -0.033. The interpretation is that the more negative Transaction
FOC is, the greater overbidding there is. The standard deviation of Transaction FOC is about 0.004. The
interpretation hence is that bidder’s profit (CAR) decreases by about 3.52% when bid premium increases by 10%.
The t-test shows that it is significantly negative with a p-value of 0.000. This shows the evidence of average
overbidding and is consistent with the finding of De Bodt et al. (2016).
Table 8 reports the estimating of overbidding before and after SFAS 142. In the first model, we focus on the
subsample of pre-SFAS 142 transactions. The coefficient on Pooling Method is negative and significant (t=-5.40),

17
suggesting that the amortization of goodwill imposes substantial costs on overbidding when using the purchase
method prior to SFAS 142. In our main model, model (2), we focus on the full sample of transactions before and
after SFAS 142. The coefficient on Post SFAS 142 is negative (-0.002) and significant (t=-3.06), consistent with
our hypothesis H1a. A few control variables deserve explanations. Cash decreases overbidding and Stock
increases overbidding (at the 1% level), and are consistent with the idea that firms use overvalued stock to
overpay (Gu and Lev, 2012). Bidder Past Performance increases overbidding: Rau and Vermaelen (1998) show
that good past performers (glamour firms) underperform in the long run, hence better past performance leads to
greater overbidding (t=-6.95). Bidder Free Cash Flow increases overbidding, consistent with the idea that agency
conflicts partially drive overbidding. Hostile decreases overbidding; Bidder Size increases overbidding; Relative
Size increases overbidding; Tender increases overbidding, and are consistent with our results for the estimation of
the deal success probability. In model (3), we focus on a sample of purchase transactions before and after SFAS
142 (N=1,478). These transactions are transactions financed with less than 90% stock, hence transactions after
SFAS 142 are essentially “as-if” purchase transactions. The coefficient on Post SFAS 142 is negative and
significant (t=-3.43). In model (4), we focus on a sample of pure-cash transactions (N=690) and the coefficient
Post SFAS 142 is negative and significant (-t=-2.26). In model (5), we focus a sample of pooling transactions
before and after SFAS 142 (N=858), where the percent of stock is greater than 90%. Transactions after SFAS 142
are hence “as-if” pooling. Here SFAS 142 has no significant effect on overbidding. Overall, our results suggest
SFAS 142 significantly increases overbidding, especially for purchase transactions.
To mitigate the effect of the passing of time on our results, we further control for two variables that capture
the market upturns and downturns: merger waves and market sentiment. Following Harford (2005), we start from
all M&A transactions during our sample period and split the sample into 1992-2003 and 2004-2014. For each
two-digit sic industry, we calculate the highest 24-month concentration of merger bids involving firms in that
industry in each subsample. This 24-month period is identified as a potential wave. Taking the total number of
bids over the entire subsample period for a given industry, we simulate 1000 distributions of that number of
occurrences of industry member involvement in a bid over a 144-month (132-month) period by randomly

18
assigning each occurrence to a month where the probability of assignment is 1/144 (1/132) for each month. we
then calculate the highest 24-month concentration of activity from each of the 1000 draws. Finally, I compare the
actual concentration of activity from the potential wave to the empirical distribution of 1000 peak 24-month
concentrations. If the actual peak concentration exceeds the 95th percentile from that empirical distribution, that
period is coded as a wave. Finally, we are able to identify 147 industry merger waves for 82 industries. For
market sentiment, we use the monthly sentiment index from Baker and Wurgler (2006). The summary statistics of
relevant variables are reported in Table 7.
Table 9 reports our additional analyses of the results in model (2) Table 8. Column (1) reports overbidding
estimations that control for Merger Wave, a dummy that equals one when the announcement of the transaction is
during one of the merger waves in acquirer’s industry. The coefficient of Post SFAS 142 is still negative and
significant (t=-3.12). In Column (2), we in addition control for the interaction term Post SFAS 142 × Merger
Wave and the results have not changed. In Column (3), we instead control for High Sentiment, a dummy that
equals one when the sentiment of the month of the transaction announcement is above the sample median. The
coefficient of Post SFAS 142 is negative and significant (-2.47). In Column (4), we further control for the
interaction term Post SFAS 142 × High Sentiment and the results have not changed. In Column (5), we estimate
our model (2) in Table 8 again by adding the interaction term Post SFAS 142 × Bidder Leverage. The coefficient
on the interaction term is positive and significant (t=1.76), suggesting that acquirers with high leverage tend to
overbid less. This is consistent with Jensen and Meckling (1976): leverage is an external control mechanism to
resolve agency conflicts. In Column (6), we add Post SFAS 142 × Horizontal. The coefficient on the interaction
term is positive and significant, suggesting that acquirers in horizontal deals are faced with less information
asymmetry and hence overbid less. Overall, our main results are robust to various controls of market upturns and
downturns.

19
In summary, SFAS 142 and the Accounting Standards Update significantly increase overbidding and hence
reduces acquirer shareholder wealth, confirming our H1a2. In the next section, we directly test the relationship
between the allocated goodwill in each transaction and overbidding.
6. Goodwill and Overbidding
6.1 Main result
In this section, we focus on transactions with goodwill information after SFAS 142 and estimate the
relationship between goodwill and overbidding. Because goodwill is available after SFAS 142, we further require
that the announcement date of the transaction is after June 30, 2001, the effective date of the SFAS 141 regulatory
change that mandates purchase price allocation for all business combinations. Next, for each transaction, we
collect the goodwill amount in the finalized purchase price allocation from the most recent 10-K filing that is filed
after the effective date of the transaction, retrieved from SDC. Finally, we are able to collect goodwill information
for 1,151 transactions.
We estimate SUR equations again using this subsample of transactions and include two additional variables
that capture the private sales process to mitigate endogeneity concerns: Auction and Target. Auction is a dummy
variable that equals one when there are more than one bidder that signed the confidentiality agreement in the sales
process. Target is a dummy variable that equals one if the transaction is initiated by the target firm. We are left
with 1,027 transactions. Table 10 estimates the SUR equations based on the goodwill sample, that include Target
and Auction. These two variables are manually collected from “Background of the Merger” section of DEFM14A,
S-4 as well as SC TO-T filings. Notably, Auction is significantly negative in the Probability of Success equation.
Coefficients on other control variables are the same as in Table 5 of Section 3.1. Now we turn to the estimation of
goodwill.
Because there is no previous paper that examines the determinants of the amount of goodwill, we choose
control variables based on economic intuition derived from both the goodwill and overbidding literature. Bugeja
2 We have not tested the impact of the 2012 Accounting Standard Update on overbidding as we have much smaller post-2012
sample of transactions.

20
and Loyeung (2015) uses Australian data to examine the determinants of goodwill recognition and includes target
market-to-book ratio and bidder leverage in their determinants. The intuition is that target market-to-book ratio
reflects the difference between the market and book value of the target firm’s net assets. It is likely that due to the
complexity of valuing and identifying target firm assets that some components of the target assets are incorrectly
recognized as goodwill. On the other hand, bidders with higher leverage prefer to recognize less goodwill, as
more indebted firms allocate a lower amount to goodwill because debt contracts often exclude goodwill and
intangible assets from the definition of leverage in debt covenants (Leftwich 1983 and Mather and Peirson
2006).We include these two variables in our model and further, consistent with previous literature, we include
transaction characteristics as they will likely affect overbidding. We include Transaction Size, Target Size,
Relative Size, Horizontal, Cash, Toehold, Hostile and Multiple Bidder as our controls. Bidders in horizontal
transactions might have more information about the target and hence are able to value the target more accurately
and allocate less to the goodwill. Bugeja and Loyeung (2015) find that acquiring firms that offer equity are less
likely to record goodwill. Bidders with a toehold in targets before the announcement of the transaction are likely
to have access to target firm’s financial information prior to the takeover and hence will be able to more
accurately identify and value the target assets. As we find in the estimation of overbidding, hostility of the
transaction increases the likelihood of completing the transaction but decreases the profit of the transaction and
hence affects overbidding. Finally, Multiple Bidder captures that greater competition increases the likelihood of
overpayment. In addition to the controls mentioned above, we also include 52-week High (42 days), defined as
target stock price 42 days before the transaction announcement relative to the 52-week high, as a control for
valuation uncertainty. Using this control is consistent with the intuition that valuation uncertainty might affect
goodwill allocation. Moeller (2010) uses this 52-week High measure as a proxy for target valuation uncertainty:
the more the target stock price declines from its’ prior 52-week high, the more difficult it is for bidders to
correctly value the target. They find that it is associated with higher acquirer announcement returns. Here, we
should expect a negative sign on this variable: greater valuation uncertainty (smaller 52-week High) should lead to
higher goodwill as it increases the difficulty of accurately valuing the target.

21
Table 11 reports the summary statistics of variables in our goodwill estimation that are in addition to the
variables summarized in Table 2 and 4. We in particular note that the mean goodwill is 0.828, or 83% of the
transaction value and the median goodwill is 0.535, or 50% of the transaction value.
Table 12 reports the results of our goodwill estimation (N=1,014). We note that all the variables in our model
that potentially affect goodwill might be jointly determined with goodwill by firm, industry and year omitted
variables and thus are subject to endogeneity bias. For this purpose, we control for industry, year and firm fixed
effects. Standard errors are clustered at industry level.
In model (1), we do not include target and bidder financials but only include transaction characteristics and
the target 52-week High. We find that the coefficient on Transaction FOC is negative and significant with a p-
value at 1% level (t=-2.81). This confirms our primary conjecture: the greater loss in marginal bidder’s profit
caused by more overbidding, the more goodwill is allocated from the transaction. The coefficient on 52-week
High is negative and significant at 10% level. This indirectly confirms our overbidding hypothesis again: the
further away target stock prices declines from its’ 52-week High (and hence, the more goodwill is allocated from
the transaction. We also find that hostility of the transaction is also significantly positively related to the goodwill,
suggesting that bidders in hostile transactions will tend to be more aggressive and hence allocate more to the
goodwill. In model (2), our main model, we in addition include bidder and target leverage and market-to-book
ratios. Transaction FOC is still negative and significant at 1% level (t-stat=-2.87). The coefficient is -13.850 and
the economic interpretation is: a 10% decrease in the bid’s marginal value caused by overbidding leads to an
increase of about 399 thousands of goodwill allocated per million total transaction value.
In model (3) and (4), we try to disentangle our two explanations for goodwill: synergy v.s. overbidding. In
model (3), we find that Transaction Scaled CAR, measured as the weighted average CAR of bidder and target, is
insignificant. In model (4), we include both Transaction FOC and Transaction Scaled CAR in our estimation and
find that Transaction FOC is still negative and significant (at 1% level, t-stat=-3.13). This supports our H2a that
goodwill is driven by overbidding and not by synergy.

22
6.2 Robustness Check
Our robustness check comprises three parts. In the first part, we test the robustness of our results under the
alternative definition of 52-week high and bid premium. In the second part, we test the robustness of the SUR
specification in estimating overbidding. We analyze our results under non-linear SUR model specifications. In the
third part, we test the robustness of our results under different samples for our estimation of probability of success
and overbidding. For brevity, we only report our goodwill estimation results. In summary, our main results hold
under these six different tests.
Table 13 reports results of our first two parts of robustness checks. In model (1), we use the alternative 52-
week High variable, measured by the price 30 days prior to the announcement relative to the 52-week High.
Transaction FOC is still negatively related to Goodwill, at the 5% level and the coefficient is slightly smaller. For
controls in this model, only Hostile is significantly positive. In model (2), we use the bid premium defined using
the 4-week Premium and re-estimate the Probability of Success and Transaction FOC. Transaction FOC is still
negatively related to Goodwill, at the 1% level and the coefficient is similar to that in our main model. In model
(3), we use the non-linear version of SUR to generate Transaction FOC. Here for both equations of SUR, we add
quadratic terms of bid premium. Our results still hold at the 1% level and the coefficient is slightly larger than that
in our main model. In model (4), we retain variables that are significant in the SUR equations and re-estimate the
asymmetric SUR equations. The coefficient on Transaction FOC is significantly negative at the 1% level and
smaller than that in our main model. For controls in model (2)-(4), they show similar signs to those in our main
model.
Table 14 shows our results when Transaction FOC is estimated using different sample periods. We conduct
such robust tests because our sample period for estimating the probability of success is from 1992 to 2014;
however our Transaction FOC is estimated for the goodwill sample that starts from 2001. Different sample
periods in these two steps might cause the time series bias in the probit estimates of the probability of success as it
includes the 1990s period of merger waves; the time series bias in the estimate of the Transaction FOC as it does
not include the merger wave period. For model (1) of Table 9, we estimate the probability of success for all

23
completed and withdrawn transactions from 2001 to 2014 and use it for the Transaction FOC estimation. The
coefficient on Transaction FOC is still negative and significant (at 5% level; t-stat=-2.49), similar in magnitude to
our main model. For model (2), we estimate the SUR equations using the full 1992-2014 sample. The coefficient
on Transaction FOC is still negative and significant (at 5% level; t-stat=-2.38), smaller than that in our main
model.
6.3 Post-announcement returns
Our main finding is that at the transaction level goodwill is significantly associated with and explained by
overbidding. If this is the case, we should expect market reactions to high goodwill to be negative because they
are associated with bidders’ overbidding in the transaction. We examine the effect of acquired goodwill and
overbidding on post-announcement returns for acquirer firms. We examine post-announcement returns that start
from one day after the merger announcement and end from 150 to 360 days after the merger announcement, as the
average days from deal announcement till deal completion, in our goodwill sample is 135 days. Panel A of Table
15 reports the results. In model (1), returns in [+1, +150] are negative to acquired goodwill, yet not significantly
(t=-1.48). In model (2), returns in [+1, +180] are significantly negative to acquired goodwill at 5% level (t=-2.55).
The coefficient is also larger than that in model (1). Returns in [+1, +210] (model 3) are significantly negative to
acquired goodwill at 10% level (t-stat=-2.78). The coefficient is larger to that in model (2): 10% increase in the
goodwill relative to the transaction value is associated with a reduction of 7.5% decrease in the post-
announcement returns in 7 months after the merger announcement. Returns in [+1, +240] (model 4) are
significantly negative to acquired goodwill at 1% level (t-stat=-3.75) and larger coefficient about -0.124 relative
to model 3. Returns in [+1, +270] and [+1, +360] (model 5 and 6) are significantly negative to acquired goodwill
at 1% level and the coefficient is about -0.012. This indicates that within 360 calendar days after the transaction
announcement, 10% increase in the goodwill relative to the transaction value is associated with about more than
10% decrease in the post-announcement returns. Such substantial negative wealth effects associated with higher
acquired goodwill supports our hypothesis H2a and further corroborates our evidence of overbidding-driven
goodwill. Panel B of Table 15 reports results from the same regression specifications except that goodwill is

24
replaced with Transaction FOC. The coefficients on Transaction FOC are in general significantly positive,
suggesting that more overbidding (more negative Transaction FOC) is associated with lower post-announcement
returns.
7. Conclusion
In this paper, we examine the effect of SFAS 142 and the Accounting Standards Update on overbidding and
the relationship between allocated goodwill and overbidding. Because SFAS 142 eliminates periodic amortization
of goodwill and instead requires annual impairment test of goodwill, the regulatory change reduces the cost of
overbidding by mitigating the adverse effects of overbidding on future earnings through goodwill and hence
increases overbidding and has a negative shareholder wealth effect. This should also imply that goodwill is
significantly positively associated with overbidding, yet not synergy. Consistent with our conjecture, we find
SFAS 142 and the Accounting Standards Update significantly increase overbidding among all and purchase
transactions and allocated goodwill is significantly positively associated with overbidding and hence lower
acquirer shareholder wealth. The results are robust to different specifications of estimating overbidding. Moreover,
we find higher goodwill is associated with lower post-announcement returns, suggesting that the over-allocation
of goodwill represents a potential agency problem, where the managers opportunistically camouflage overbidding
in the goodwill. Overall, our findings suggest an unintended yet important negative shareholder wealth effect of
SFAS 142 and the Accounting Standards Update: the aggravation of agency problems caused by undue
subjectivity in the impairment tests. One potential caveat is that we use a novel and direct measure of overbidding
and our results are essentially joint tests of our research questions and the validity of the measure. Our results on
the other hand also lend support to the validity of the overbidding measure. Future policies might need to consider
such inefficiency and strengthen the incentive alignment between the management and shareholders in financial
reporting practices.

25

26
References
1. Aktas, N., Bollaert, H., Roll, R., 2014. CEO Narcissism and the Takeover Process: From Private Initiation
to Transaction Completion, Journal of Financial and Quantitative Analysis, 51(01), 113-137.
2. Akdogu, E., 2011. Value-maximizing managers, value-increasing mergers and overbidding, Journal of
Financial and Quantitative Analysis, 46, 83–110.
3. Amihud, Y, 2002. Illiquidity and stock returns: cross-section and time-series effects, Journal of Financial
Markets, 5, 31-56.
4. Ayers, B., Lefanowicz, C., and J. Robinson, (2002) Do firms purchase the pooling method? Review of
Accounting Studies, Vol. 7, No. 1 (March), pp. 5-32
5. Baker, M., Pan, X., Wurgler, J., 2012. The Effect of Reference Point Prices on Mergers and Acquisitions,
Journal of Financial Economics, 106, 49-71
6. Beatty, A., & Weber, J. (2006). Accounting discretion in fair value estimates: An examination of SFAS
142 goodwill impairments, Journal of Accounting Research, 44(2), 257-288.
7. Beatty, Anne, and Joseph Weber, 2006. Accounting Discretion in Fair Value Estimates: An Examination
of SFAS 142 Goodwill Impairments, Journal of Accounting Research 44(2), 257 – 288.
8. Bebchuk, L., Cremers, M., Peyer, U., 2011. The CEO pay slice, Journal of Financial Economics 102,199-
221
9. Bens, Daniel, Wendy Heltzer, and Benjamin Segal, 2011. The information content of goodwill
impairments and SFAS 142, Journal of Accounting, Auditing, and Finance.
10. Bhagat, S., Dong, M., Hirshleifer, D., Noah, R., 2005. Do tender offers create value? new methods and
evidence, Journal of Financial Economics, 76, 3-60
11. Betton, S., Eckbo, B.E., Thorburn, K., 2008. Corporate takeovers In Handbook of Corporate Finance:
Empirical Corporate Finance, 2, Eckbo, B. E., ed. Amsterdam: Elsevier/North-Holland
12. Betton, S., Eckbo, B.E., Thorburn, K., 2009, Merger negotiations and the toehold puzzle, Journal of
Financial Economics, 91, 158-178
27
13. Betton, S., Eckbo, B. E., Thompson, R., &Thorburn, K. S. (2014). Merger negotiations with stock market
feedback, The Journal of Finance, 69(4), 1705-1745.
14. Boone, A., Mulherin, J., 2007, How are firms sold? Journal of Finance, 62, 847-875.32
15. Boone, A., Mulherin, H., 2008. Do auctions induce a winner’s curse? New evidence from the corporate
takeover market, Journal of Financial Economics, 89, 1–19.
16. Bugeja, M., & Loyeung, A. (2015). What drives the allocation of the purchase price to goodwill? Journal
of Contemporary Accounting & Economics, 11(3), 245-261.
17. Chatterjee, A., Hambrick, D., 2011. Executive personality, capability cues, and risk taking: how
narcissistic CEOs react to their successes and stumbles, Administrative Science Quarterly, 56,202–237
18. De Bodt, E., Cousin, J. G., & Roll, R. (2016). Empirical evidence of overbidding in M&A contests.
Available at SSRN 2463865.
19. Gu, F., & Lev, B. (2011). Overpriced shares, ill-advised acquisitions, and goodwill impairment. The
Accounting Review, 86(6), 1995-2022.
20. Hayward, M., Hambrick, D., 1997. Explaining the premiums paid for large acquisitions: Evidence of
CEO Hubris, Administrative Science Quarterly, 42, 103–127
21. Hayn, C., & Hughes, P. J. (2006). Leading indicators of goodwill impairment. Journal of Accounting,
Auditing & Finance, 21(3), 223-265.
22. Jensen, M., (1986). Agency costs of free cash flow, corporate finance and takeovers, American Economic
Review, Vol. 76, No. 2 (May), pp. 323-329.
23. Krishna, V., 2010, Auction theory, Academic Press, Elsevier, 2d ed.
24. Leftwich, R. "Accounting Information in Private Markets: Evidence from Private Lending Agreements."
Accounting Review 58 (1983): 23–42.
25. Lys, T. Z., Vincent, L., & Yehuda, N. (2012). The nature and implications of acquisition goodwill.
26. Malmendier, U., Tate, G., 2008. Who makes acquisitions? CEO overconfidence and the market's reaction,
Journal of Financial Economics, 89, 20–43
27. Malmendier, U., Lee, Y.H., 2011. The bidder’s curse, The American Economic Review, 101, 749-787.

28
28. Mather, P. and G. Peirson (2006), “Financial Covenants in the Markets for Public and Private
Debt”, Accounting & Finance, Vol. 46, No. 2, pp.285-307.
29. Moeller, S..,Schlingemann, F., Stulz, R., 2004. Firm size and the gains from acquisitions, Journal of
Financial Economics, 73, 201-228.
30. Rau, P., Vermaelen, Th., 1998. Glamour, value and the post-acquisition performance of acquiring firms,
Journal of Financial Economics, 49, 223-253
31. Roll, R., 1984. A simple implicit measure of the effective bid-ask spread in an efficient market, Journal of
Finance, 39, 1127-1139.
32. Roll, R., 1986. The hubris hypothesis of corporate takeovers, Journal of Business, 59, 197–216
33. Roll, R., 1988.R², Journal of Finance, 43, 541-566.
34. Roychowdhury, S., Watts, R., 2007. Asymmetric timeliness of earnings, market-to-book and
conservatism in financial reporting. Journal of Accounting and Economics 44, 2–31.
35. Schlingemann, F., Stulz, R., Walkling, R.A., 2002. Divestitures and the liquidity of the market
forcorporate assets, Journal of Financial Economics 64, 117–144.
36. Shalev, Ron, 2009. The information content of business combination disclosure level. Accounting Review
84(1), 239‐270.
37. Shalev, R., Zhang, I. X., & Zhang, Y. (2013). CEO compensation and fair value accounting: Evidence
from purchase price allocation. Journal of Accounting Research, 51(4), 819-854.
38. Singh, R. (1998). Takeover bidding with toeholds: The case of the owner's curse. Review of Financial
Studies, 11(4), 679-704.
39. Zhang, I. X., & Zhang, Y. (2015). Accounting discretion and purchase price allocation after acquisitions.
Journal of Accounting, Auditing & Finance, 0148558X15598693.

29
Table 1: Sample Selection and Description
Table 1 describes the sample selection procedures and how each sample is used for estimation.
Step Sample Description N Description Source
1
Acquiror Public Status: P
Target Public Status: P
Transaction Value > $1 Mil
Percent of Shares Held by Acquiror 6
Months Prior to
Announcement <=50%"
Percent of Shares Owned after
Transaction >=50%
Acquirer and Target Relevant Financials
Available
3,736 Completed Transactions SDC
2
Acquiror Public Status: P
Target Public Status: P
Transaction Value > $1 Mil
Percent of Shares Held by Acquiror 6
Months Prior to
Announcement <=50%"
Percent of Shares Seeking to Own>=50%
Acquirer and Target Relevant Financials
Available
1,142 Withdrawn Transactions SDC
4,878 Pr (Succ) Estimation
3
Acquirer and Target Relevant Financials
Available 2,975
Completed Transactions
Deal FOC Estimation
4 Acquirer and Target Relevant Financials
Available 2,336 Overbidding Estimation
5 Goodwill Information Available 1,151 10-K Filings
6
Sales Method Information Available
Acquirer and Target Relevant Financials
Available
Goodwill Information Available
1,027 Deal FOC Estimation CCM, SDC
7
Sales Method Information Available
Goodwill Information Available
Acquirer and Target Relevant Financials
Available
1,014 Goodwill Estimation 10-K Filings, CCM, SDC

30
Table 2: Summary Statistics for Estimation of Probability of Success
Table 2 reports descriptive statistics for variables the probit model used to estimate the probability of acquisition
attempt success, as well as a standard test of difference of means between withdrawn and completed transactions.
The M&A sample comprises of 4,878 transactions from 1992-2014 and the selection criteria is described in Table
1. Variables are defined in Appendix A. Mean is for arithmetic average, Median for sample median, Stdev for
standard deviations, t-stat for the Student statistic of the difference of means test and p-val, the corresponding
probability under the null hypothesis of no difference.
All transactions Withdrawn Completed
Variables Mean Median Stdev Mean Mean t-stat p-val
Transaction Success 0.735 1.000 0.441 n.a. n.a. n.a. n.a.
Target Size 11.987 11.844 1.874 11.843 12.039 -3.364 0.001
Nyse Amex 0.350 0.000 0.477 0.420 0.325 6.410 0.000
Turnover 6.034 3.725 7.667 6.356 5.920 1.813 0.070
Poison Pill 0.015 0.000 0.120 0.043 0.004 10.677 0.000
52-Week High 0.726 0.792 0.236 0.689 0.739 -6.840 0.000
Toehold 0.082 0.000 0.274 0.162 0.053 13.040 0.000
Listed Bidder 0.740 1.000 0.439 0.550 0.808 -19.547 0.000
Horizontal 0.573 1.000 0.495 0.468 0.611 -9.420 0.000
8-Week Premium 0.442 0.347 1.048 0.385 0.460 -2.131 0.033
Tender Offer 0.136 0.000 0.343 0.088 0.154 -6.156 0.000
All Cash 0.381 0.000 0.486 0.435 0.361 4.900 0.000
All Stock 0.294 0.000 0.456 0.184 0.334 -10.693 0.000
Hostile 0.037 0.000 0.188 0.109 0.011 17.222 0.000
Year 1990's 0.467 0.000 0.499 0.496 0.457 2.546 0.011

31
Table 3: Probability of Success
Table 3 reports the results from the probit model used to estimate the probability of acquisition attempt success.
Variables are defined in Appendix A. The dependent variable is equal to 1 if the transaction is completed and 0
otherwise. T statistics are in parentheses. ***, **, and * indicate significance at 1%, 5%, and 10% levels,
respectively. Variable definitions are included in Appendix A.
Variables (1)
Target Size 0.045***
(2.99)
Nyse Amex -0.264***
(-5.22)
Turnover -0.007**
(-2.37)
Poison Pill -1.078***
(-5.73)
Listed Bidder 0.638***
(11.39)
52-Week High 0.622***
(6.01)
Toehold -0.459***
(-6.32)
Horizontal 0.327***
(2.69)
8-week Premium 0.194***
(4.10)
Tender 0.685***
(9.37)
Cash -0.065
(-1.13)
Stock 0.112*
(1.89)
Hostile -1.590***
(-13.60)
1990s -0.104**
(-2.24)
Intercept -0.570***
(-3.19)
N 4878
Psuedo R2 0.1547

32
Table 4: Summary Statistics for Estimation of Overbidding
Table 4 reports the summary statistics of the M&A sample (N=2,975) used to estimate Equations (3) and (4) with
a seemingly unrelated regression (SUR) estimator. Variable definitions are in Appendix A. The first three rows
illustrate our three main variables in Eq(3) and Eq(4). Bidder Scaled CAR, proxies for Bidder’s Profit and is
measured as bidder CAR divided by the estimated ex-ante probability of transaction completion (Probability of
Success). 8-week premium, our proxy for Bid, is acquirer’s offer price relative to target stock price 8 weeks prior
to the transaction announcement. Probability of Success is the average estimated ex-ante probability of transaction
completion.
Variables Mean Median Stdev p-val t-stat
Bidder Scaled CAR -0.013 -0.009 0.099 0.000 -4.454
Probability of Success 0.864 0.872 0.075
8-week Premium 0.443 0.345 0.628
Bidder CAR -0.011 -0.008 0.08 0.000 -4.441
Target CAR 0.261 0.204 0.291 0.000 30.188
Transaction CAR 0.025 0.013 0.079 0.000 10.508
Transaction Scaled CAR 0.028 -0.015 0.028 0.000 9.578
Target Run-up 0.087 0.049 0.399
Bidder Size 14.704 14.582 2.02
Target Size 12.442 12.339 1.792
Liquidity Index 0.078 0.058 0.096
Relative Size -2.319 -2.102 1.572
Horizontal 0.693 1 0.461
All Cash 0.351 0 0.478
All Stock 0.252 0 0.435
Toehold 0.019 0 0.135
Hostile 0.005 0 0.073
Bidder Private R2 1.146 1.005 0.662
Bidder Private Amihud 2.564 1.295 24.04
Multiple Bidder 0.041 0 0.197

33
Table 5: SUR Estimation
Table 5 summarizes estimation results of Equations (3) and (4). Estimations are obtained using the seemingly
unrelated regression (SUR) estimator. In Column (1), the dependent variable is the Bidder Scaled CAR; in
Column (2), it is Probability of Success. T statistics are in parentheses. ***, **, and * indicate significance at 1%,
5%, and 10% levels, respectively. Variable definitions are included in Appendix A.
Variables (1) (2)
Toehold 0.001 -0.119***
(0.16) (-19.22)
Horizontal 0.006 0.052
(0.99) (8.31)
8-week Premium -0.038*** 0.031***
(-12.77) (10.31)
Stock -0.011*** -0.002
(-4.81) (-0.84)
Target Run-up 0.050*** -0.001
(10.86) (-0.16)
Hostile -0.110*** -0.484***
(-9.78) (-42.08)
Transaction Scaled
CAR 0.306 -0.026***
(36.6) (-3.05)
Bidder Size -0.003*** 0.005***
(-5.08) (3.07)
Relative Size -0.010*** 0.003***
(-12.28) (3.03)
Bidder Private Amihud -0.000*** 0.000
(-3.37) (0.86)
Bidder Private R2 0.001 0.005***
(0.59) (2.62)
Liquidity Index -0.005 -0.018***
(-1.01) (-3.27)
Intercept 0.024*** 0.771***
(2.47) (78.41)
N 2975 2975
Psuedo R2 /R2 0.3479 0.4986

34
Table 6: Pooling versus Purchase Method for all Acquisitions
Table 6 reports the decompositions of acquisitions based on the accounting method. Panel A reports number of
acquisitions by year and the accounting method (purchase v.s. pooling). Panel B reports total number of
acquisitions by the accounting method (purchase v.s. “as if” pooling). “As if” pooling acquisitions are ones that
would have qualified for the use of the pooling methods prior to SFAS 142 was eliminated.
Panel A: Number of Acquisitions by year and accounting method
Method of accounting
Year Purchase Pooling Total
1992 17 32 49
1993 57 51 108
1994 68 88 156
1995 77 121 198
1996 95 111 206
1997 123 160 283
1998 129 172 301
1999 146 128 274
2000 109 97 206
2001 102 83 185
2002 103 0 103
2003 129 0 129
2004 130 0 130
2005 105 0 105
2006 107 0 107
2007 118 0 118
2008 76 0 76
2009 71 0 71
2010 77 0 77
2011 47 0 47
2012 72 0 72
2013 73 0 73
2014 83 0 83
Total 2114 1043 3157
Panel B: Total Acquisitions by accounting method
Purchase "As if" Pooling Total
Pre-SFAS 142 923 1043 1966
Post-SFAS 142 881 310 1191
35
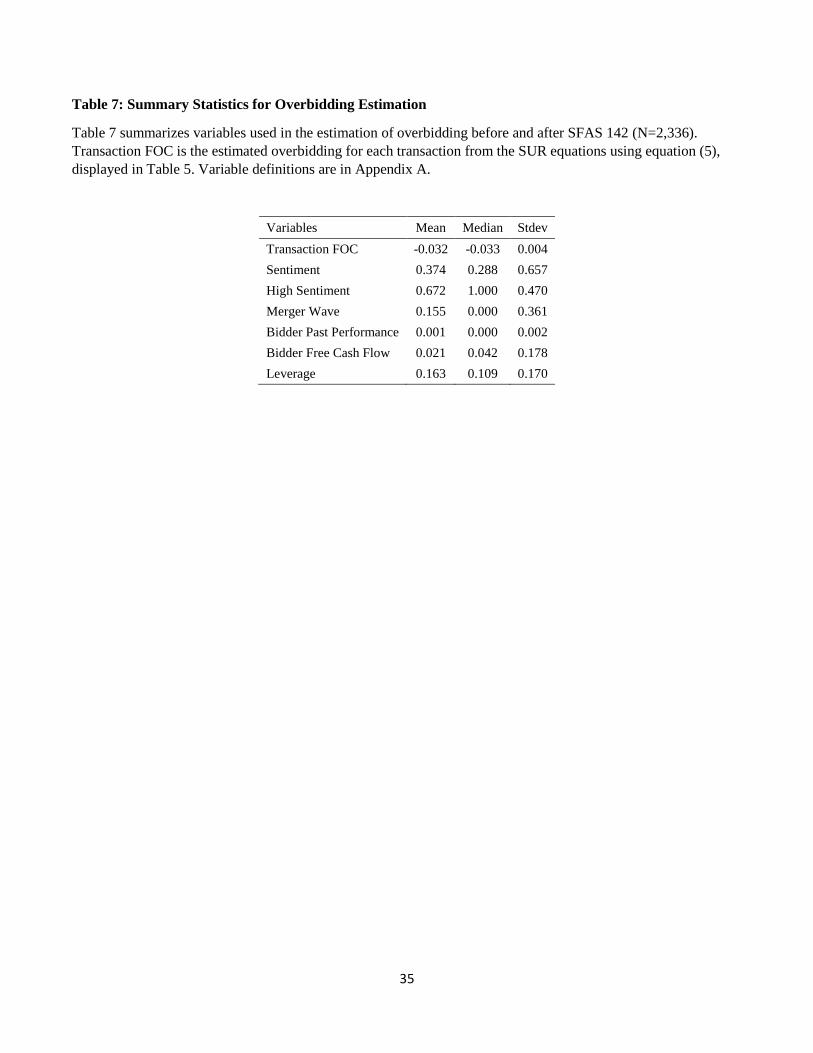
Table 7: Summary Statistics for Overbidding Estimation
Table 7 summarizes variables used in the estimation of overbidding before and after SFAS 142 (N=2,336).
Transaction FOC is the estimated overbidding for each transaction from the SUR equations using equation (5),
displayed in Table 5. Variable definitions are in Appendix A.
Variables Mean Median Stdev
Transaction FOC -0.032 -0.033 0.004
Sentiment 0.374 0.288 0.657
High Sentiment 0.672 1.000 0.470
Merger Wave 0.155 0.000 0.361
Bidder Past Performance 0.001 0.000 0.002
Bidder Free Cash Flow 0.021 0.042 0.178
Leverage 0.163 0.109 0.170

36
Table 8: Overbidding and SFAS 142
Table 8 reports estimation of overbidding before and after SFAS 142. The dependent variable in all models is
Transaction FOC. Column (1) reports overbidding estimation before SFAS 142 (N=1,331). Column (2) reports
the analysis on the full sample of transactions (N=2,336). Column (3) reports the analyses of a sample of purchase
transactions before and after SFAS 142 (financed with pure cash or the percent of stock is less than 90%,
N=1,478). Column (4) reports the analysis on a sample of pure cash transactions before and after SFAS 142
(N=690). Column (5) reports the analysis on a sample of pooling transactions before and after SFAS 142 (N=858).
All models control for industry and year fixed effects. T statistics are in parentheses. ***, **, and * indicate
significance at 1%, 5%, and 10% levels, respectively. Variable definitions are in Appendix A.

37
Variables (1) (2) (3) (4) (5)
Pooling Method -0.001***
(-5.40)
Post SFAS 142
-0.002*** -0.002*** -0.003** -0.001
(-3.06) (-3.43) (-2.26) (-1.53)
Cash
0.001*** 0.001*** 0.000 0.000
(5.32) (4.74) (.) (.)
Stock
-0.001*** 0.000 0.000 -0.002**
(-5.15) (.) (.) (-2.66)
Synergy 0.008*** 0.010*** 0.008*** 0.011*** 0.017***
(3.87) (4.45) (4.53) (3.66) (4.69)
Horizontal -0.000* -0.000 -0.000* -0.000 -0.000
(-1.73) (-0.93) (-1.76) (-1.55) (-0.18)
Hostile 0.017*** 0.016*** 0.017*** 0.018*** 0.017***
(12.92) (18.14) (19.65) (7.76) (9.47)
Bidder Past Performance -0.342*** -0.291*** -0.255*** -0.161 -0.294***
(-7.09) (-6.95) (-4.27) (-1.56) (-4.45)
Bidder Free Cash Flow -0.003*** -0.002*** -0.000 -0.000 -0.003***
(-6.83) (-5.07) (-0.28) (-0.07) (-3.27)
Bidder Leverage -0.000 0.000 0.000 0.000 0.000
(-0.53) (0.97) (0.57) (0.25) (0.50)
Bidder Market-to-Book 0.000 0.000 0.000 -0.000 0.000*
(0.75) (0.54) (0.10) (-0.02) (1.76)
Bidder Size -0.000*** -0.000* -0.000** -0.000 -0.000**
(-3.94) (-1.97) (-2.20) (-0.36) (-2.17)
Relative Size -0.000*** -0.000*** -0.000*** -0.000 -0.000***
(-4.02) (-2.93) (-2.84) (-0.01) (-3.37)
Tender -0.004*** -0.004*** -0.004*** -0.004*** -0.004***
(-16.48) (-20.49) (-22.55) (-19.37) (-5.24)
Intercept -0.026*** -0.026*** -0.026*** -0.030*** -0.028***
(-24.51) (-27.61) (-18.65) (-13.12) (-19.09)
N 1331 2336 1478 690 858
Adjusted R2 0.592 0.540 0.645 0.684 0.420

38
Table 9: Overbidding and SFAS 142: Cross-sectional Analyses
Table 9 reports cross-sectional analyses of overbidding pre- and post-SFAS 142. The dependent variable in all
models is Transaction FOC. Column (1) reports overbidding estimation controlling for the merger wave periods.
Merger wave periods are estimated following Harford (2005). Column (2) adds the interaction term Post SFAS
142×Merger Wave. Column (3) reports overbidding estimation controlling for the market sentiment per Baker
and Wurgler (2006). Column (4) adds the interaction term Post SFAS 142×High Sentiment. Column (5) reports
overbidding estimation with the interaction variable Post SFAS 142×Leverage. Column (6) reports overbidding
estimation with the interaction variable Post SFAS 142×Horizontal. All models control for industry and year
fixed effects. T statistics are in parentheses. ***, **, and * indicate significance at 1%, 5%, and 10%, respectively.
Variable definitions are in Appendix A.

39
Variables (1) (2) (3) (4) (5) (6)
Post SFAS 142 -0.002*** -0.002*** -0.001** -0.002** -0.002*** -0.002***
(-3.12) (-3.12) (-2.47) (-2.02) (-3.61) (-3.49)
Merger Wave 0.000* 0.000
(1.71) (0.88)
Post SFAS 142 * Merger Wave 0.000
(0.63)
High Sentiment 0.000 -0.000
(0.38) (-0.01)
Post SFAS 142 * High Sentiment 0.000
(0.28)
Bidder Leverage 0.000 0.000 0.000 0.000 -0.000 0.000
(0.98) (0.97) (0.98) (1.00) (-0.53) (0.96)
Post SFAS 142 * Bidder Leverage 0.002*
(1.76)
Horizontal -0.000 -0.000 -0.000 -0.000 -0.000 -0.000*
(-0.77) (-0.77) (-0.80) (-0.80) (-0.76) (-1.78)
Post SFAS 142 * Horizontal 0.001**
(2.00)
Cash 0.001*** 0.001*** 0.001*** 0.001*** 0.001*** 0.001***
(5.17) (5.11) (5.16) (5.26) (5.13) (5.19)
Stock -0.001*** -0.001*** -0.001*** -0.001*** -0.001*** -0.001***
(-5.07) (-5.05) (-5.21) (-5.21) (-5.32) (-5.23)
Synergy 0.010*** 0.010*** 0.010*** 0.010*** 0.010*** 0.010***
(4.45) (4.46) (4.45) (4.45) (4.50) (4.45)
Hostile 0.016*** 0.016*** 0.016*** 0.016*** 0.016*** 0.016***
(18.21) (18.33) (18.18) (18.42) (18.27) (18.34)
Bidder Past Performance -0.286*** -0.288*** -0.295*** -0.294*** -0.290*** -0.296***
(-6.60) (-6.67) (-7.16) (-7.16) (-6.97) (-7.11)
Bidder Free Cash Flow -0.002*** -0.002*** -0.002*** -0.002*** -0.002*** -0.002***
(-4.01) (-3.97) (-4.07) (-4.07) (-3.92) (-4.05)
Bidder Market-to-Book 0.000 0.000 0.000 0.000 0.000 0.000
(0.36) (0.35) (0.41) (0.42) (0.20) (0.38)
Bidder Size -0.000* -0.000* -0.000* -0.000* -0.000** -0.000*
(-1.87) (-1.88) (-1.96) (-1.96) (-2.07) (-1.92)
Relative Size -0.000*** -0.000*** -0.000*** -0.000*** -0.000*** -0.000***
(-2.91) (-2.91) (-2.93) (-2.90) (-3.00) (-2.97)
Tender -0.004*** -0.004*** -0.004*** -0.004*** -0.004*** -0.004***
(-20.13) (-20.16) (-20.38) (-20.45) (-20.46) (-20.07)
Intercept -0.025*** -0.025*** -0.026*** -0.026*** -0.025*** -0.025***
(-26.61) (-26.46) (-27.67) (-25.38) (-26.61) (-26.73)
N 2336 2336 2336 2336 2336 2336
Adjusted R2 0.542 0.542 0.541 0.541 0.542 0.542

40
Table 10: SUR Estimations with Sales Method Information
Table 10 summarizes estimation results of Equations (3) and (4), including Auction and Target that reflect the
sales method information in the private takeover process, and hence on the subsample of transactions with
goodwill information (N=1,027). Estimations are obtained using the seemingly unrelated regression (SUR)
estimator. In Column (1), the dependent variable is the Bidder Scaled CAR; in Column (2), it is Probability of
Success. T statistics are in parentheses. ***, **, and * indicate significance at 1%, 5%, and 10% levels,
respectively. Variable definitions are included in Appendix A.
Variables (1) (2)
Target Run-up 0.093*** -0.003
(13.40) (-0.27)
Transaction Scaled CAR 0.664*** 0.076***
(44.53) (3.58)
8-week Premium -0.065*** 0.022***
(-14.89) (3.58)
Bidder Size -0.001 0.003**
(-1.63) (2.04)
Relative Size -0.014*** -0.002
(-12.55) (-1.02)
Bidder Private Amihud -0.000*** 0.000
(-5.03) (0.55)
Bidder Private R2 0.000 0.004
(0.03) (1.14)
Related -0.003 0.045***
(-0.31) (3.82)
Stock -0.003 0.004
(-0.92) (0.74)
Toehold 0.007 -0.114***
(0.67) (-7.97)
Hostile -0.015 -0.463***
(-0.82) (-17.74)
Target Liquidity Index -0.005 -0.030
(-0.34) (-1.39)
Target 0.001 -0.005
(0.30) (-1.15)
Auction -0.001 -0.017***
(-0.32) (-4.19)
Intercept -0.018 0.821***
(-1.39) (45.56)
R2 0.681 0.317
N 1,027 1,027

41
Table 11: Summary Statistics of Goodwill Estimations
Table 11 reports the summary statistics for variables used in goodwill estimations (N=1,014). Transaction FOC is
estimated by SUR equations in Table 5, on the subsample of transactions with goodwill information. Goodwill is
collected from the 10-K filings of the acquirer at the fiscal year that the transaction is completed.
Variables Mean Median St.dev p-val Chi2
Transaction FOC -0.057 -0.058 0.006 0.000 -510
Goodwill 0.828 0.535 9.736
52-week High 0.743 0.827 0.245
Bidder Leverage 0.166 0.12 0.171
Transaction Size -9.715 -8.515 1.53
Bidder Size 14.704 14.582 2.02
Relative Size -2.244 -2.07 1.572
Related 0.693 1 0.461
Tender 0.148 0 0.355
Hostile 0.005 0 0.073
Toehold 0.019 0 0.135
Cash 0.351 0 0.477
Bidder Market-to-Book 1.821 1.365 1.327
Target Leverage 0.155 0.078 0.197
Target Market-to-Book 1.682 1.274 1.308
Target 0.43 0 0.495
Auction 0.439 0 0.496

42
Table 12: Goodwill Estimations
Table 12 reports goodwill estimation results. In all models, the dependent variable is Goodwill, measured as
goodwill divided by the transaction value. Transaction FOC is estimated by SUR equations in Table 5, on a
sample of transactions where goodwill is available. In all models, we control for industry, year and firm fixed
effects. Standard errors are clustered at the industry. T statistics are in parentheses. ***, **, and * indicate
significance at 1%, 5%, and 10% levels, respectively. Variable definitions are included in Appendix A.
(1) (2) (3) (4)
Transaction FOC
-13.424*** -14.678*** -14.681***
(-3.19) (-3.06) (-2.99)
Transaction Scaled CAR 0.131
-0.035
(0.44)
(-0.16)
52-week High -0.170 -0.300** -0.284 -0.285
(-0.98) (-2.36) (-1.57) (-1.58)
Transaction Size -0.068 -0.109 -0.134 -0.134
(-0.83) (-1.59) (-1.67) (-1.67)
Bidder Size 0.061 0.058 0.062 0.062
(1.19) (1.07) (1.23) (1.23)
Relative Size 0.081 0.123** 0.145** 0.146**
(1.06) (2.24) (2.17) (2.17)
Related 0.013 0.041 0.049 0.048
(0.22) (0.81) (0.87) (0.86)
Cash 0.052 0.008 0.022 0.023
(1.52) (0.14) (0.35) (0.36)
Toehold 0.090 0.190 0.205 0.205
(0.49) (0.93) (1.14) (1.15)
Hostile 0.282 0.850*** 0.846*** 0.843***
(0.66) (2.89) (3.61) (3.70)
Multiple Bidder -0.153 -0.120 -0.210 -0.209
(-1.07) (-0.88) (-1.33) (-1.31)
Target Leverage 0.353
0.326 0.326
(1.42)
(1.54) (1.53)
Target Market-to-Book 0.024
0.027* 0.027*
(1.55)
(1.81) (1.78)
Bidder Leverage 0.150
0.178 0.177
(0.37)
(0.42) (0.42)
Bidder Market-to-Book 0.000
0.001 0.001
(0.01)
(0.02) (0.02)
Intercept -1.118 -1.559** -1.229 -1.242
(-0.94) (-2.08) (-1.04) (-1.05)
N 1062 1027 1014 1014
Adjusted R2 0.642 0.648 0.709 0.708

43
Table 13: Goodwill Model Robustness Check
Table 13 reports results from robustness checks for our goodwill estimations. In Column (1), we use the alternative
definition of target 52-week High. In Column (2), we estimate Transaction FOC using 4-week premium for the
estimation of Probability of Success and SUR. In Column (3), we use the non-linear SUR specification in the bid
premium. In Column (4), we use the asymmetric SUR specification where only significant variables in SUR equations
in Table 4 are retained. In all models, we control for industry, year and firm fixed effects. Standard errors are clustered
at the industry level. T statistics are in parentheses. ***, **, and * indicate significance at 1%, 5%, and 10% levels,
respectively. Variable definitions are included in Appendix A.
Variables (1) (2) (3) (4)
Transaction FOC -13.920*** -14.678*** -11.006*** -18.226***
(-2.73) (-3.06) (-2.78) (-2.99)
52-week High
-0.284 -0.271 -0.283
(-1.57) (-1.54) (-1.57)
52-week High (30 days) -0.241
(-1.36)
Transaction Size -0.116 -0.134 -0.132 -0.134*
(-1.44) (-1.67) (-1.65) (-1.67)
Bidder Size 0.061 0.196* 0.064 0.197*
(1.21) (1.95) (1.25) (1.96)
Relative Size 0.129* 0.145** 0.141** 0.145**
(1.86) (2.17) (2.13) (2.17)
Target Leverage 0.320 0.326 0.327 0.327
(1.54) (1.54) (1.52) (1.54)
Target Market-to-Book 0.028* 0.027* 0.028* 0.027*
(1.87) (1.81) (1.81) (1.81)
Bidder Leverage 0.184 0.178 0.183 0.180
(0.45) (0.42) (0.42) (0.42)
Bidder Market-to-Book 0.001 0.001 0.001 0.001
(0.03) (0.02) (0.03) (0.02)
Horizontal 0.049 0.049 0.047 0.048
(0.88) (0.87) (0.84) (0.87)
Cash 0.019 0.022 0.026 0.024
(0.29) (0.35) (0.41) (0.37)
Toehold 0.200 0.205 0.193 0.203
(1.18) (1.14) (1.10) (1.14)
Hostile 0.838*** 0.846*** 0.789*** 0.838***
(3.65) (3.61) (3.09) (3.50)
Multiple Bidder -0.214 -0.210 -0.201 -0.208
(-1.39) (-1.33) (-1.21) (-1.30)
Intercept -0.932 -0.986 -1.270 -1.015
(-0.74) (-0.82) (-1.05) (-0.85)
N 1014 1014 1014 1014
Adjusted R2 0.705 0.709 0.709 0.709

44
Table 14: Goodwill Sample Robustness Check
Table 14 reports results from sample robustness checks for our goodwill estimations. In Column (1), compared to our
baseline methodology, we use the post-2001 sample to estimate Probability of Success and hence Transaction FOC. In
Column (2), we use the entire 1992-2014 sample to estimate SUR equations and hence Transaction FOC. In all
models, we control for industry, year and firm fixed effects. Standard errors are clustered at the industry level. T
statistics are in parentheses. ***, **, and * indicate significance at 1%, 5%, and 10% levels, respectively. Variable
definitions are included in Appendix A.
Variables (1) (2)
Transaction FOC -13.667** -18.811**
(-2.49) (-2.38)
52-week High -0.271 -0.307
(-1.44) (-1.47)
Transaction Size -0.131 -0.124
(-1.54) (-1.64)
Bidder Size 0.065 0.065
(1.26) (1.42)
Relative Size 0.148** 0.131*
(2.02) (1.92)
Target Leverage 0.318 0.396
(1.50) (1.55)
Target Market-to-Book 0.026* 0.024
(1.85) (1.35)
Bidder Leverage 0.170 0.147
(0.40) (0.32)
Bidder Market-to-Book -0.000 -0.000
(-0.01) (-0.02)
Horizontal 0.049 0.038
(0.82) (0.67)
Cash 0.020 0.060*
(0.32) (1.70)
Toehold 0.237 0.163
(1.33) (0.90)
Hostile 0.899*** 0.671**
(3.53) (2.17)
Multiple Bidder -0.202 -0.162
(-1.27) (-1.05)
Intercept -1.168 -1.018
(-0.98) (-0.83)
N 1014 1062
Adjusted R2 0.705 0.658

45
Table 15: Post-announcement Returns
Table 15 reports results from post-announcement returns estimations. In all models, only transaction characteristics
and bidder and target size are included as controls. In Panel A/B, from Column (1) / (6) to (7) / (12), the dependent
variable is the post-announcement returns from day 1 to day 120+30*x, where x is the number of the Column. In all
models, we control for industry and year fixed effects. Standard errors are clustered at the industry level. T statistics
are in parentheses. ***, **, and * indicate significance at 1%, 5%, and 10% levels, respectively. Variable definitions
are included in Appendix A.
Panel A: Post-announcement Returns and Goodwill
Variables (1) (2) (3) (4) (5) (6)
Goodwill -0.028 -0.051** -0.075*** -0.124*** -0.111*** -0.123***
(-1.48) (-2.55) (-2.78) (-3.75) (-3.45) (-3.44)
Bidder Size -0.014* -0.012 -0.016 -0.016 -0.018 -0.023
(-1.86) (-1.66) (-1.58) (-1.24) (-1.51) (-1.52)
Relative Size -0.005 -0.010 -0.016 -0.014 -0.016 -0.021
(-0.74) (-1.25) (-1.55) (-1.17) (-1.18) (-1.37)
Bidder Leverage 0.063 0.073 0.041 0.072 0.062 0.026
(0.88) (1.05) (0.58) (0.88) (0.65) (0.22)
Bidder Market-to-book -0.023*** -0.032*** -0.035*** -0.034*** -0.036*** -0.045***
(-4.01) (-4.72) (-3.80) (-3.27) (-4.44) (-4.70)
Horizontal 0.002 0.029 0.037 0.037 0.050 0.040
(0.10) (1.33) (1.54) (1.27) (1.66) (1.16)
Cash 0.024 0.033 0.016 0.027 0.026 0.050
(1.47) (1.55) (0.67) (0.90) (0.79) (1.41)
Tender -0.050** -0.053** -0.073* -0.094* -0.114* -0.112*
(-2.43) (-2.22) (-1.96) (-1.77) (-1.88) (-1.90)
Toehold 0.063 0.064 0.069 0.088 0.100 0.080
(1.00) (0.91) (0.83) (1.14) (1.45) (1.44)
Hostile -0.026 0.024 0.102 0.014 0.007 -0.011
(-0.20) (0.15) (0.61) (0.07) (0.04) (-0.06)
Multiple Bidder 0.082** 0.106** 0.149** 0.132** 0.150** 0.117
(2.25) (2.33) (2.57) (2.05) (2.28) (1.67)
Intercept -0.045 -0.070 0.059 0.150 0.217 0.238
(-0.28) (-0.30) (0.23) (0.53) (0.73) (0.65)
N 1151 1151 1151 1151 1151 1151
Adjusted R2 0.035 0.031 0.035 0.035 0.030 0.031

46
Panel B: Post-announcement Returns and Overbidding
Variables (7) (8) (9) (10) (11) (12)
Deal FOC 10.212*** 13.245** 11.460 15.499* 20.372** 22.753**
(3.08) (2.50) (1.59) (1.86) (2.31) (2.29)
Bidder Size -0.015** -0.014** -0.020** -0.020** -0.022** -0.026**
(-2.20) (-2.06) (-2.37) (-2.04) (-2.33) (-2.25)
Relative Size -0.006 -0.011 -0.018 -0.016 -0.019 -0.024
(-0.84) (-1.30) (-1.57) (-1.28) (-1.33) (-1.50)
Bidder Leverage 0.014 0.024 0.002 0.025 0.006 -0.023
(0.20) (0.34) (0.03) (0.29) (0.06) (-0.20)
Bidder Market-to-book -0.022*** -0.032*** -0.035*** -0.035*** -0.033*** -0.044***
(-3.59) (-5.87) (-4.81) (-3.77) (-4.25) (-4.67)
Horizontal 0.016 0.043** 0.052** 0.056** 0.062** 0.053*
(0.76) (2.23) (2.28) (2.13) (2.33) (1.75)
Cash 0.012 0.019 0.003 0.010 -0.002 0.019
(0.76) (1.08) (0.13) (0.38) (-0.06) (0.60)
Tender -0.017 -0.009 -0.035 -0.044 -0.043 -0.031
(-0.89) (-0.31) (-0.98) (-1.08) (-0.87) (-0.66)
Toehold -0.000 -0.012 -0.000 -0.007 -0.019 -0.048
(-0.00) (-0.16) (-0.00) (-0.08) (-0.23) (-0.59)
Hostile -0.200 -0.202 -0.089 -0.244 -0.342 -0.406
(-1.20) (-0.86) (-0.35) (-0.82) (-1.09) (-1.21)
Multiple Bidder 0.078** 0.107** 0.154** 0.147** 0.159** 0.134
(2.10) (2.22) (2.44) (2.11) (2.14) (1.63)
Intercept 0.828*** 0.953*** 0.894** 1.244*** 1.249*** 1.499***
(3.90) (3.34) (2.51) (2.88) (2.80) (2.96)
N 1085 1085 1085 1085 1085 1085
Adjusted R2 0.053 0.048 0.042 0.045 0.045 0.045

47
Appendix A: Variable Definitions
Variable Definitions Note
Goodwill Goodwill/transaction value 10-k,sdc
Post SFAS 142
Dummy=1 if the transaction closes in the fiscal year that starts after June 30,
2001
sdc
52-week High
target stock price on day minus 42 before the announcement over the
maximum target stock price observed during the 52 weeks before day minus
42
crsp
52-week High (30)
target stock price on day minus 30 before the announcement over the
maximum target stock price observed during the 52 weeks before day minus
30
crsp
Cash Dummy variable =1 if the consideration is cash only and 0 otherwise sdc
Stock Dummy variable =1 if the consideration is stock only and 0 otherwise sdc
Bidder CAR
Bidder CAR over the three days event windows centered on the announcement
date, estimated with a market model and with an estimation windows day
minus 250 to day minus 10. CRSP value weighted index is used as proxy of
the market index
sdc
Bidder Free Cash
Flow
Income before extraordinary items (compustat item IBC) divided by total
assets (compustat item AT)
compustat
Bidder Leverage
Long term debt (compustat item DLTT) divided by total assets (compustat
item AT)
compustat
Bidder Market-to-
Book
Total assets minus common equity (compustat item CEQ) plus the market
value of equity (compustat items CSHO*PRCC_F) divided by total assets
(compustat item AT)
compustat
Bidder Private
Amihud
relative variation of the bidder Amihud(2002) illiquidity ratio between the pre
(day minus 61 to day minus 42) and the post announcement period (day plus
42 to day plus 61)
crsp,sdc

48
Bidder Private R2
relative variation of the value of 1-R², obtained from the estimation of the
market model, between the pre (day minus 61 to day minus 42) and the post
announcement period (day plus 42 to day plus 61)
crsp,sdc
Bidder Size
market value of bidder in USD million 42 days before announcement
(logarithm is used in the regression)
crsp,sdc
Bidder Free Cash
Flow
Income before extraordinary items (compustat item IBC) divided by total
assets (compustat item AT)
compustat
Bidder CEO Pay
Slice
Percentage of the bidder CEO's total pay (item TDC1) among the top five
executives as in Bebchuck et al. (2011)
execucomp
Bidder CEO tenure
Bidder CEO's tenure: difference between the year of the transaction and the
year in which the CEO is appointed. Logarithm is used in the regression
execucomp
Bidder CEO age Bidder CEO's age in year. Logarithm is used in the regression execucomp
Bidder CEO Variable
Compensation
Variable component of the bidder CEO's compensation : (item TDC1-item
SALARY)/item TDC1
execucomp
Bidder Past
Performance
Abnormal return (alpha) obtained from the estimation of the market model
estimated during the period day minus 250 to day minus 20
execucomp
4-week Premium
offer price divided by market price of the target 4 weeks before the
announcement (computed by sdc)
sdc
8-week Premium
offer price divided by market price of the target 8 weeks before the
announcement (computed by sdc)
sdc
Transaction Success Dummy variable =1 if transaction is completed and 0 otherwise sdc
Transaction CAR
weighted average of Bidder CAR and Target CAR by market value computed
in day minus 42
crsp,sdc
Transaction Scaled
CAR
Transaction CAR divided by Pr(Success) crsp,sdc
Transaction FOC
Overbidding measure estimated using Eq(5) and coefficients from SUR
estimations

49
Related
dummy variable = 1 if Bidder and target have the same sic code 4 digit, 0
otherwise
sdc
Hostile dummy variable = 1 if the transaction is classified hostile by sdc, 0 otherwise sdc
Listed Bidder Dummy variable =1 if the bidder is a public firm, 0 otherwise sdc
Liquidity Index
Schlingeman (2002) liquidity index. Ratio of the value of M&A transactions in
a year to the total asset (item compustat AT) of firms in the bidder two digit
SIC code for that year.
compustat,
sdc
Multiple Bidder
Dummy variable=1 if the number of bidders reported in the SDC is greater
than one, 0 otherwise
sdc
Nyse Amex
Dummy variable =1 if the bidder is quoted in Nyse or Amex stock exchange, 0
otherwise
crsp
Poison Pill Dummy variable = 1 if target has a poison pill (from sdc), 0 otherwise sdc
Relative Size
ratio of target market value computed on day minus 42 on bidder market value
computed in day minus 42
crsp,sdc
Target CAR
target CAR over the three days event windows centered on the announcement
date, estimated with a market model and with an estimation windows day
minus 250 to day minus 10
crsp,sdc
Target Market-to-
Book
Total assets minus common equity (item compustat CEQ) plus the market
value of equity (item compustat CSHO*PRCC_F) divided by total assets (item
compustat AT)
compustat
Target Run-up
target stock performance during the period between day minus 42 and day
minus 6
crsp, sdc
Target Size
target market value in USD million 42 days before announcement (logarithm is
used in regression)
crsp, sdc
Tender Offer
Dummy variable = 1 if the transaction is classified as a tender offer by sdc, 0
otherwise
sdc
Toehold Dummy variable = 1 if the bidder holds a non-zero percentage target's share sdc

50
before the announcement, 0 otherwise
Turnover
target average daily ratio of trading volume to total shares outstanding over the
52 weeks before the announcement
crsp, sdc
Target Dummy variable = 1 if the transaction is initiated by the target firm SEC Edgar
Auction Dummy variable = 1 if the transaction is an auction transaction SEC Edgar
Number Confidential Number of Bidders that Sign the Confidentiality Agreements SEC Edgar

51

52

53

54

55

56

57

58

59

60

61


![Sfas dts help final[1]](https://static.fdocuments.us/doc/165x107/55858fb0d8b42aca7b8b46d5/sfas-dts-help-final1.jpg)